plastic recycling iswa 2014
TRANSCRIPT

8/15/2019 Plastic Recycling ISWA 2014
http://slidepdf.com/reader/full/plastic-recycling-iswa-2014 1/66
A story for one player – China

8/15/2019 Plastic Recycling ISWA 2014
http://slidepdf.com/reader/full/plastic-recycling-iswa-2014 2/66
Prepared by: FUELogy on behalf of ISWA
Final formatting and typesetting:
Date: September 2014
Author: Dr Costas Velis – contact: [email protected]
Cite as: Velis C.A. (2014). Global recycling markets - plastic waste: A story for one player – China. Report prepared by
FUELogy and formatted by D-waste on behalf of International Solid Waste Association - Globalisation and Waste Manage-
ment Task Force. ISWA, Vienna, September 2014.
Acknowledgements
We would like to thank Ms Sihui Zhou for relevant research conducted at Imperial College London as part of their MSc The-
sis and Prof David Wilson and Prof Chris Cheeseman for co-supervising. We are grateful to CIWM and Defra UK for partly
funding Ms Sihui Zhou under their Masters Support Programme, and for access to information. The ISWA Globalisationand Waste Management Task Force, ISWA STC and Board members and ISWA individual members and organisations who
provided valuable feedback and proofread various earlier versions of this document. Ms Sophie Richard of WRAP, and staff
at Valpak and Closed Loop Recycling who gave much valued support. Our appreciation also goes to Mr Ed Kosior, Honorary
Prof at Brunel University and Mr Mike Jefferson of Verde Recycling Solutions of who took time out of their busy schedules
to share their valuable experience and opinions. We are grateful to British Plastics Federation (BPF) for providing the op-
portunity to present an early version during REPLAST 2013. Our thanks to Ms Jiao Tang and Ms Rachael Williams of ISWA
for their secretarial support. This report would not have been published if the D-Waste graphic designer, Mr Theodore
Andreadakis, did not go the extra mile. The opinions expressed here are the author’s alone.
®
f UE Logy

8/15/2019 Plastic Recycling ISWA 2014
http://slidepdf.com/reader/full/plastic-recycling-iswa-2014 3/66
The International Solid Waste Association (ISWA) is a global, independent and non-profit making association,working in the public interest to promote and develop sustainable waste management. ISWA has membersin more than 60 countries and is the only worldwide association promoting sustainable, comprehensive and
professional waste management.
ISWA’s objective is the worldwide exchange of information and experience on all aspects of waste management. The
association promotes the adoption of acceptable systems of professional waste management through technological
development and improvement of practices for the protection of human life, health and the environment as well as the
conservation of materials and energy resources.
ISWA’s vision is an Earth where no waste exists. Waste should be reused and reduced to a minimum, then collected,
recycled and treated properly. Residual matter should be disposed of in a safely engineered way, ensuring a clean and
healthy environment. All people on Earth should have the right to enjoy an environment with clean air, earth, seas and soils.
To be able to achieve this, we need to work together.
For information about ISWA, visit our homepage at www.iswa.org

8/15/2019 Plastic Recycling ISWA 2014
http://slidepdf.com/reader/full/plastic-recycling-iswa-2014 4/66
4 Global recycling markets - plastic waste: A story for one player – China
Executive Summary
The issuePlastics are emblematic materials,transforming our everyday life forover 60 years, delivering unprece-dented functionality. Plastics globalproduction, mainly from fossil rawmaterials, has skyrocketed: from 1.5million tonnes (Mt) in 1950 to 288Mt in 2012. Sustainable consump-
tion and production, and the circu-lar economy, require minimising useof virgin materials and greenhousegasses emissions, while deliveringclean material cycles. To this end,globalised trade in waste plastics isa major option.
Production shift towards Asia Recycling operations depend pro-foundly on production and consump-tion. A shift in plastics productionfrom the West to Asia has occurred:40% by weight of world productionis now in Asia, with 20% each in Eu-rope and North America - China is thelargest individual country at 24%.The drivers were increasing localdemand and lower costs - mainly la-bour, but also lower environmentaland health and safety costs, due tothe initial absence of regulations and/or their implementation in both man-ufacturing and reprocessing. This re-gional shift also drives the demand
for used plastics.
Global recycling tradeThe annual volume of globally trad-ed waste plastics is around 15 Mt,less than 5% wt. of the new plasticsproduction in 2012. Such a small per-centage suggests that to-date inter-national trade is a minor means toextract their resource value. Europecollectively is the major exporter, withthe world’s top 5 country exporters
being Hong Kong SAR (re-exporting
imported material to China), USA,Japan, Germany and the UK. The topworld importers are: China at $6.1Band its SAR Hong Kong at $1.65B, fol-lowed by the USA, the Netherlands
and Belgium. Plastic scrap flows
from Western countries with estab-lished collection systems mainly toChina, which dominates the interna-tional market, receiving around 56%
wt. of global imports. Europe (EU-27)collectively exports almost half ofthe plastics collected for recycling(3.4 Mt, worth of €1.7B), correspond-ing to 12% of the entire post-con-
sumer plastic waste arisings. Europedepends entirely on China to absorbits exports (at least 87% of Europe-an exports end up in China). ASEANcountries (e.g. Vietnam, Malaysia and
Indonesia) re-export reprocessed
imports and domestically collectedplastic scrap to China.Plastics recycling in ChinaBetween 2006 and 2012, plastic
scrap imports in China increasedfrom 5.9 Mt to 8.9 Mt., whereas lo-cally sourced plastics currently re-covered (recycling and energy recov-ery) is almost double that amount.
Executive Summary
China receives 56% (by weight) of
the global imports of waste plastics
56%
Most of plastic waste exports (by
weight) from the EU-27 go to China
and Hong Kong SAR
87%

8/15/2019 Plastic Recycling ISWA 2014
http://slidepdf.com/reader/full/plastic-recycling-iswa-2014 5/66
Global recycling markets - plastic waste: A story for one player – China
Executive Summary
There is no conclusive evidence onthe fate of imported material whenit reaches China. Indirect wider evi-
dence suggests that recent invest-ments in modern centralized manu-facturing and reprocessing facilitiesare still outweighed by thousands ofsmall manufacturers/reprocessors
using low-tech equipment and pollu-tion practices, often family-run, with-out any environmental protectioncontrols. The domestic recyclatesare perceived as of poor quality;hence good quality imported mate-rial is necessary for capital-intensive,better quality plastics manufactur-ing, while the inferior imports anddomestic recycled plastics end upat the low-tech, uncontrolled plantsand maybe also Energy from Waste(EfW) plants. The Chinese Govern-ment has been working to increasethe quality of imported plastics andreduce the numbers of unregulated
facilities: evidence can be seen in therecent Green Fence Operation (GFO)forcing a ‘step change’ in the qualityof imported plastics by adopting a‘zero tolerance’ approach to contam-ination level of imports and closingdown unlicensed operators.Market complexity and vulnerability As with any globalised market, global
plastic scrap has an inevitably com-plex market, vulnerable to disruption,as seen when prices crashed forsecondary raw materials during the2008-9 financial crisis and the 2013GFO. Key factors are: Oligopsony, es-pecially for Europe, with China themain global importer; prohibitionsrelating to export / import of waste;susceptibility to virgin raw materialsand fuel cost fluctuations; ‘reversehaulage’ logistics; high search andtransaction costs; inconsistency ofcontainer loads sought by shippinglines; difficulty to quality control theexports; material quality information
asymmetry between buyers andsellers – lack of transparency at theend of supply chain.
Does it matter that Western plastics recycling is so dependent on a single export market?
FREQUENT
QUESTIONS
INSIGTHS
How much of theplastics collectedfor recyclingin Europe areexported?
46% wt. of the overall quantity collected for recycling, which is 12% wt. of the entire plastic wastearisings in Europe. In contrast, Europe-27 exports only 1.2% of its primary plastics products toChina.
How dependent
is Europe on theChinese market?
87% wt. of exports go to China directly or via the Hong Kong SAR. Overall dependency is evenhigher, if the exports to intermediate reprocessors (e.g. ASEAN countries) are added. Such a de-pendency may not be sustainable in the long-term.
Is the exportmarket stable?
The global market experienced two recent ‘shocks: the 2008-09 global financial crisis; and whenthe Chinese Green Fence Operation started in 2012. However, in both cases the market recovered/ adapted relatively quickly.
Why does Chinaimport secondaryplastics when italready generates
its own domesticrecyclates?
China needs affordable secondary plastics to meet the increased demand for plastic products.Part is supplied from the international market, and part from local recycling. But, the poor qualityof much of the plastic products being manufactured in China means that the local recycled plas-tics is also of poor quality, and not suitable for use in the larger, modern factories manufacturinggoods for export.
+66%
5

8/15/2019 Plastic Recycling ISWA 2014
http://slidepdf.com/reader/full/plastic-recycling-iswa-2014 6/66
6 Global recycling markets - plastic waste: A story for one player – China
Executive Summary
Will China con-tinue to importplastics?
Recent projections (Pöyry) forecast an increased global demand for plastic (85 Mt by 2020) with
subsequent increase of globally traded secondary plastics, fuelled by China’s expected demand
growth (predicted at 49 Mt in 2015). So quality secondary raw material imports will be needed, at
least until the Chinese manufacturing base for the domestic market is upgraded, thus increasing
the quality of domestic recyclates.
What about thequality of plasticsfor export toChina?
The Chinese Government is working to clamp down on poor quality imports (lower contamination,
increasing preference of single (or sorted) polymers) and eliminate unregulated facilities – so
export of mixed plastics is likely to become more difficult.
Do the anticipatedenvironmental
benefits fromrecyclingmaterialise in aglobalised trade,dominated byimports in China?
The shift of the manufacturing base to Asia was driven by lower costs, which initially included
lower costs due to an absence of environmental and health and safety controls. Plastics product
manufacture and reprocessing in China was originally dominated by a large number of small,unregistered facilities with no rules for operation, no quality standards and no inspection. In-
vestment is occurring in larger manufacturing plants which are subject to increasing quality and
environmental controls; and the Government is working to eliminate unlicensed factories. But this
change will take time, and currently, unless the exporter undertakes their own audit trail, the level
of environmental control over imported plastics will remain uncertain.
Is dependence ona single importingcountry a risk?
Yes, for two reasons. First, China may in the medium- or long-term become self-sufficient in
high-quality secondary plastics. Second, advanced recycling collection schemes in Europe/ N
America etc. were created aspiring to achieve sustainable resource recovery. However, this is
questionable when almost half of the collected plastics are exported to countries with lowerenvironmental standards. Global plastic recycling markets in themselves may not lead to the re-
quired balance between environmental protection, clean material cycles and resource utilisation.
Should exportingcountries beinvesting in localre-processingcapacity forrecycled plastics?
Yes, over-dependence on a single exporting country is risky. However, a balance is required. Qual-
ity, segregated polymers, e.g. clean PET from bottles, are increasingly sought-after commodities
on the global market, with manufacturers in the US, Europe and China competing for a limited
supply. So some export is normal - provided a ‘level playing field’ in terms of environmental
standards can be assured.
What thenshould be donewith mixed /unrecycalbleplastics?
Segregate further and near the source to prepare a higher quality feedstock for recycling. Or
develop innovative processes and invest in local capacity for mixed plastics recycling. Or consider
waste to energy - high efficiency combined heat and power (CHP) plants cab be a sustainable
solution for the non-recyclable plastics (e.g. thermosets), particularly in countries that have high
dependence on landfill disposal.

8/15/2019 Plastic Recycling ISWA 2014
http://slidepdf.com/reader/full/plastic-recycling-iswa-2014 7/66
Global recycling markets - plastic waste: A story for one player – China
Sources of waste plasticsimported in China in 2010
7

8/15/2019 Plastic Recycling ISWA 2014
http://slidepdf.com/reader/full/plastic-recycling-iswa-2014 8/66
8 Global recycling markets - plastic waste: A story for one player – China
Tableof contentsExecutive Summary...................................................................................................................................................................................................... ...............4
1. Background: Globalisation and waste management..............................................................................................................................................14
2. Introduction, aim and scope..............................................................................................................................................................................................15
3. Plastic waste trade and flows: key facts and factors of a global market ................................................................................................17
3.1 Recycling and recovery of waste plastics: comparative EU data........................................................................................................17
3.2 A specific example: the UK case.........................................................................................................................................................................18
3.3 The globalised plastic waste trade...................................................................................................................................................................20
3.4 Key market factors...................................................................................................................................................................................................21
3. 5 Waste plastics markets vulnerability and volatility................................................................................................................................22
4. Main trans-boundary flows of plastic waste (imports–exports)...................................................................................................................24
4.1 The big picture..............................................................................................................................................................................................................24
4.2 China.................................................................................................................................................................................................................................25
4.3 Europe (EU-27)...........................................................................................................................................................................................................27
4.4 Hong Kong: China Special Administrative Area (SAR)..............................................................................................................................28
4.5 Japan................................................................................................................................................................................................................................29
4.6 USA...................................................................................................................................................................................................................................30
4.7 South-East Asia (ASEAN).......................................................................................................................................................................................31
5. Exports of different polymer types to China and Hong Kong. ........................................................................................................................32
5.1 UK.......................................................................................................................................................................................................................................32
5.2 Japan................................................................................................................................................................................................................................33

8/15/2019 Plastic Recycling ISWA 2014
http://slidepdf.com/reader/full/plastic-recycling-iswa-2014 9/66
Global recycling markets - plastic waste: A story for one player – China 9
5.3 USA...................................................................................................................................................................................................................................34
6. What happens within China?............................................................................................................................................................................................35
6.1 China: Production and demand for plastics...................................................................................................................................................35
6.2 Domestic generation of waste plastics..........................................................................................................................................................38
6.3 Imports of plastic waste........................................................................................................................................................................................39
6.4. Estimated Use of Waste Plastics within China...........................................................................................................................................40
7. Crisis time: the Chinese Green Fence Operation.....................................................................................................................................................45
7.1 Chinese administration imposes stricter enforcement of waste imports rules.........................................................................45
7.2 Green Fence Operation impacts on the global waste plastics recycling market......................................................................47
7.3 Possible long-term responses to the Green Fence Operation crisis?........................................................................................... ..49
8.Environmental and health considerations..................................................................................................................................................................50
8.1 General concerns for plastics recycling under poor environmental control capacity and law enforcement...... ...... .50
8.2 A path of least resistance?...................................................................................................................................................................................51
9. Challenges for trans-boundary trade................................................................................................................................................. ........................55
10. Future outlook - trends - questions...........................................................................................................................................................................56
11. Key facts summary.............................................................................................................................................................................................................59
References.....................................................................................................................................................................................................................................61

8/15/2019 Plastic Recycling ISWA 2014
http://slidepdf.com/reader/full/plastic-recycling-iswa-2014 10/66
10 Global recycling markets - plastic waste: A story for one player – China
List of TablesTable 1. World value of waste plastics trading (exports – imports) according to the UN Comtrade data
for 2012........................................................................................................................................................................................... 24
Table 2. Financial value and weight of EU-27 waste plastics trading (exports – imports) according to theUN Comtrade data for 2012 ................................................................................................................................................ 27
Table 3. Chinese plastics production and types of plastic products.................................................................................... 36
Table 4. Sources of waste plastics imported to China in 2010 ............................................................................................ 39
Table 5. Major applications of recycled plastics in China........................................................................................................... 43
List of Figures
Figure 1. Recovery rate of post-consumer plastic waste by country 2012................................................................. 17
Figure 2. Material flow diagram for processing of plastics in the UK, 2009; quantities in million tonnes (Mt)...... 18
Figure 3. Global map of export transactions in waste plastic in 2011............................................................................. 20
Figure 4. Production index of primary plastics........................................................................................................................... 22
Figure 5. US waste plastics exports: The abrupt drop in 2008 coincides with the financial crisis and the
drop in the production and prices of the primary plastics................................................................................ 23
Figure 6. Prices of reprocessed waste plastics in the UK market, for various grades: the collapse inprices corresponds to the financial crisis which has resulted in fall in the production index of
primary plastics..................................................................................................................................................................... 23
Figure 7. Top importers and exporters of plastic waste worldwide, based on financial transactions........... 24
Figure 8. Global map of import transactions in waste plastic in 2011............................................................................. 25
Figure 9. Top importers of plastic waste to China, based on financial transactions................................................ 26
Figure 10. World exports of recovered plastics to China including HK in 2011.............................................................. 26
8/15/2019 Plastic Recycling ISWA 2014
http://slidepdf.com/reader/full/plastic-recycling-iswa-2014 11/66
Global recycling markets - plastic waste: A story for one player – China 11
Figure 11. UK Exports of waste plastics to China and Hong Kong SAR............................................................................. 28
Figure 12. Japanese exports of waste plastics by destination country............................................................................ 29
Figure 13. USA exports of waste plastics by destination country...................................................................................... 30
Figure 14. ASEAN net flows (exports-imports) of plastics scrap....................................................................................... 31
Figure 15. Relative amounts of exports of waste plastics from ASEAN countries................................................... 31
Figure 16. Composition of UK Exports of Waste Plastics to China including Hong Kong SAR.............................. 32
Figure 17. Improvement in quality of plastic waste bales in Japan, as a result of legislative initiatives
Japan Containers and Packaging recycling Association (JCPRA)................................................................... 33
Figure 18. Improvement in quality of plastic waste bales in Japan, as a result of legislative initiatives
Japan Containers and Packaging recycling Association (JCPRA)................................................................... 33
Figure 19. Composition of USA exports of waste plastics to China including Hong Kong SAR............................ 34
Figure 20. Demand for primary plastics in China........................................................................................................................ 37
Figure 21. Chinese waste plastics imports...................................................................................................................................... 39
Figure 22. Estimated use of recycled plastics in China............................................................................................................. 40
Figure 23. Total plastics recovery in China...................................................................................................................................... 40
Figure 24. Photos from the Moore Recycling site visits in China in 2008-9.................................................................. 42
Figure 25. Waste plastics stockpiled................................................................................................................................................. 45
Figure 26. New PE reprocessing capacity built the last decade around the world. After Resource Recycling, as
cited by Gwynn48......................................................................................................................................................................................... 47
Figure 27. Recovering plastics from a dump, Kathmandu, Nepal, 2013. Photo - De Visu / Shutterstock.com ................ 52
Figure 28. A Chinese woman holds her baby as she strips labels from plastic soda bottles so they can
be recycled. If she works hard, she can earn about $15 a day. Copyright: Peter Ford/The
Christian Science Monitor.................................................................................................................................................. 53

8/15/2019 Plastic Recycling ISWA 2014
http://slidepdf.com/reader/full/plastic-recycling-iswa-2014 12/66
12 Global recycling markets - plastic waste: A story for one player – China
List of abbreviations
ABS Acrylonitrile butadiene styrene
ASEAN Association of South-East Asia Nations
BIR Bureau of International Recycling
BPA Bispehnol-A
CCS China Customs Statistics
CEIN China Economic Information Network
CLII China Light Industry Information
EfW Energy from waste
HDPE High density polyethylene
HIPS High impact polystyrene
ISR Informal sector recycling
ISRI Institute of Scrap Recycling Industries
ISWA International Solid Waste Association
PE Polyethylene
PET Polyethylene terephthalate
PDBEs Polybrominated diphenyl ethers
PEMRG PlasticsEurope Market Research Group
PERNs Packaging export recovery notes (UK)
POPs Persistent organic pollutants
PS Polystyrene
PVC Polyvinylchloride
GFO Green Fence Operation
GHG Greenhouse gas
GWM Globalisation and Waste management
LCA life-cycle assessment
MFA Material flow analysis
MRFs Materials recycling facilities
NAFTA North American Free Trade Agreement
RDF Refuse-derived fuel

8/15/2019 Plastic Recycling ISWA 2014
http://slidepdf.com/reader/full/plastic-recycling-iswa-2014 13/66
Global recycling markets - plastic waste: A story for one player – China 13
rPE where ‘r’ stands for recycled, i.e. used polymer: used polyethylene, similarly for
rHDPE, etc.
SAR Special Administrative Area
SRF Solid recovered fuel
STC Scientific and Technical Chair
TF Task Force
TFGWM Task Force on Globalisation and Waste management
UN United Nations
WDF EC Waste Framework Directive
WEEE Waste electrical and electronic equipment

8/15/2019 Plastic Recycling ISWA 2014
http://slidepdf.com/reader/full/plastic-recycling-iswa-2014 14/66
14 Global recycling markets - plastic waste: A story for one player – China
1. Background: Globalisationand waste managementThe report is part of ISWA’s Globalization and Waste Management project, which is the first worldwide project dedicated
to studying the linkages between Globalization and Solid Waste Management.
Globalization is one of the major challenges for the long-term sustainability of waste management and vice-versa. Appro-
priate waste management is one of the key conditions for sustainable globalization. There is an increasing need to focus
on the linkages between globalization and waste management and to understand their nature.
Recognizing that globalization creates substantial changes and puts new and unprecedented challenges for waste man-
agement, ISWA established a Task Force (TFGWM) to study the linkages between Globalization and Solid Waste Manage-
ment in September 2010. This report is part of the third work strand within the GWM scope, addressing challenges around
Global Recycling Markets, Material Flows and Trafficking.
Previous research results, documents and summary reports are available on line through ISWA’s Knowledge Base. The
final overarching results of the GWMTF work are presented in a report, where the current document is placed in context:
Final report of the ISWA Task Force on Globalisation and Waste Management , September 2014, ISWA . The overarching
report, this report and ohter main outputs can be downloaded from the Globalisation and Waste Management ISWA web-
page.
TFGWM Members:
Project Coordinator: Antonis Mavropoulos, ISWA STC Chair, CEO D-Waste
Scientific Coordinator: Prof David Wilson, Visiting Professor at Imperial College London, and Independent Consultant
Editor: Björn Appelqvist, ISWA WGRWM Chair, Copenhagen Municipality
Jeff Cooper, Independent Consultant, Former ISWA President and Editor-in-Chief Waste and Resource Management
Dr Costas Velis, University of Leeds, Associate Editor Waste Management & Research
TFGWM Secretarial support:
Ms Jiao Tang

8/15/2019 Plastic Recycling ISWA 2014
http://slidepdf.com/reader/full/plastic-recycling-iswa-2014 15/66
Global recycling markets - plastic waste: A story for one player – China 15
2. Introduction, aim and scope
Plastics are emblematic materials, transforming our everyday life for over 60 years, delivering unprecedented function-
ality. Plastics global production, mainly from fossil raw materials, has skyrocketed. At the same time a world-wide trade
of used plastics has been established, in line with other major materials such as used metals and paper. Research1 has
explained how major economic trends such as relocation of manufacturing to poorer countries and global long-distance
supply chains have recently led to very important financial transactions and physical flows of waste-derived secondary
raw materials: “… in 2008, waste and scrap in general (North American Industrial Category 9100) exceeded semiconduc- tors and components to be the most valuable export category from the USA to China, [using data from] US internationalTrade Commission DataWeb.”
This study aims to map the current status of global trade in plastic waste (plastic scrap, used plastic) and to identify the
major existing and emerging challenges for the plastic waste trade stemming from globalisation. China, having being iden-
tified as the major international player (importer), is of key focus.
Often, specific examples using the case study of UK as a source (export) country and China as a destination (import) coun-
try are used, further detailed elsewhere2.

8/15/2019 Plastic Recycling ISWA 2014
http://slidepdf.com/reader/full/plastic-recycling-iswa-2014 16/66
16 Global recycling markets - plastic waste: A story for one player – China
Global plastic production has risen rap-
idly in recent decades. The amount of
plastics produced in the past 10 years
equals to all of the plastics produced
during the previous 30 years (from 1.5million metric tonnes (Mt) in 1950 to
288Mt in 2012). The average annual
growth was 4-5% during the past 5
years3. According to PlasticsEurope3
using PEMRG / Consultic data, most
plastics in 2012 was produced in Asia
(around 39.7% wt.), of which 23.9%
wt. in China, followed by Europe (EU-
27) (20.4% wt.) and the Americas
(NAFTA: USA, Canada and Mexico with
19.9% wt.). This constitutes a shiftof production from the West to Asia.
PlasticsEurope opines that this pro-
duction shift coincided with a stricter
European regulatory regime.
Regarding waste plastics, the annual
global trade of used plastics (domes-
tic and exported) was 15Mt in 2007
and it was recently predicted by Pöyry
to reach 45Mt by 20154. A worldwide
demand for 85Mt recovered plastics
is estimated for 2020.
BIR on their web-site estimate the
worldwide trade of waste plastics
per year (also referred to as ‘plastic
scrap’) at a total of 12Mt, valued at $5
Billion (Bil) 5. Cumulative UN Comtrade
data 6 officially reported larger
values: the overall world exports
were $6.6 Bil, and overall imports
9.5 Bil, (corresponding to ca. 14.4Mt
of material exported and 15.8Mt of
material imported). The difference
in values is explained by the exports
being accounted for on the basis of
FOB (free on board) and the imports
on the basis of CIF (carriage insurance
and freight) (See Section 4.1 - Table 1
for details). To put these numbers in
perspective, this 15.8Mt of imports is
around 5.5% wt. of the annual new
plastic production (288Mt - 2012
PlasticsEurope values). Some of the
non-packaging plastics produced
remain in use for a period of years;
or when they become waste, they are
either stocked as scrap by merchants/
intermediaries, used within countries,
disposed of in landfills, recovered
for energy production, or dumped
without controls, with some ending up
in undesirable places, such as beach
litter and marine debris. Despite that,
this comparison does not take into
account any stocks or the relatively
small percentage of plastic scrap
traded compared to new plastics
which suggests that as a whole we are
still far from extracting sufficient value
(recycling and energy production) via
international trade. A country-specific
example2 (UK) is examined in Section
3.2 - Figure 2, where the exportedquantity for 2009 (0.7Mt) was 14.8%
of the manufacturing of new plastics
(4.8Mt), almost three times the
global average, possibly due to high
export rates for waste plastic in the
UK in comparison to other European
countries.
3. Plastic waste trade andflows: key facts and factorsof a global market
KEY FACT 1Waste plastics traded
internationally are a
small fraction of an-
nual new plastic pro-
duction (<5% wt.).

8/15/2019 Plastic Recycling ISWA 2014
http://slidepdf.com/reader/full/plastic-recycling-iswa-2014 17/66
Global recycling markets - plastic waste: A story for one player – China
Plastic waste trade and flows: key facts and factors of a global market
17
Figure 1 shows the overall recovery rate of post-consumerplastic waste across Europe for 2012. The overall recoveryis split between collection for recycling (noted as ‘recycling’)and energy recovery. With regard to energy recovery, nodifferentiation is made between material recovered in EfWplants, which meet the R1 criterion for conversion efficiencyand are legally a ‘recovery’ operation, and those plants notmeeting the R1 criterion which are legally a ‘disposal’ operation
according to the revised EC Waste Framework Directive(WFD), nor between those plants for solid recovered fuel(SRF) thermal recovery. Recycling rates varied from 12% wt.to ca 38% wt. for Norway, and energy recovery rates from
0% wt. to over 75% wt. for Switzerland. The nine leadingcountries which achieved recovery rates over 90% wt.
(Figure 1) implement strict restrictions on landfill disposal 3.Between 2006 and 2011, there was an overall improvementin the overall recovery rate (4-5%), but this global figureconceals very different rates and direction of change: thebiggest improvement were for Estonia (45%) and Finland(about 30%). However, countries that already had highlevels of overall recovery, such as Denmark, Sweden andSwitzerland, achieved improvement <5%, but shifted towards
lower energy recovery and greater collection for recycling.The highest shift from energy recovery to recycling, from2006 to 2012, was for Denmark, with an increase of around11-12 percent.
3.1 Recycling and recovery of waste plastics:
comparative EU data
Figure 1. Recovery rate of post-consumer plastic waste by country 2012. Adopted from: Consultic, as cited by
PlasticsEurope3

8/15/2019 Plastic Recycling ISWA 2014
http://slidepdf.com/reader/full/plastic-recycling-iswa-2014 18/66
18 Global recycling markets - plastic waste: A story for one player – China
Plastic waste trade and flows: key facts and factors of a global market
3.2 A specific example: the UK case
A detailed case study for recent plasticsproduction, waste arisings, collectionand recovery and export is available forthe UK (Figure 2) 2. However, conclusionsshould not be generalised to the wholeof Western Europe, as shown in Figure 1.In 2009, the UK converted 2.5Mt of rawmaterials into plastic polymers and pro-cessed 4.8Mt of polymers into plasticproducts. Assuming negligible exportsand adding 0.8Kt of imported plasticproducts, it follows that 5.6Mt of plastic
products were put on the market.
Plastics consumption can be brokendown into packaging, construction, elec-trical and electronic equipment, auto-motive and other types of plastic items.In the same year post-consumer plasticwaste was 3.9Mt, of which 73.7% wt.
was disposed of in landfills, 7.4% wt.was recovered via energy from waste(EfW), and 18.9% wt. was collectedfor recycling. Pre-consumer plasticswaste ranged from 250-300Kt annual-ly (Ktpa), and is largely recycled (> 90%wt.). The material flow diagram shownin Figure 2 summarises these findings,ignoring any stocks that arise from non-short life products.
Given the very high percentage disposed
of to landfill, there is great potential torecover value from waste plastics inthe UK, both in the form of recyclingand via energy from waste (EfW) forthe non-recyclable part. As it is evidentfrom Figure 1, the ratio of waste plasticcollected for recycling over the EfWis much higher than the central and
northern European countries (e.g.Germany, Denmark), where the recoveryvia EfW is much higher. Hence, routes tooptimal value recovery will be differentbased on the needs and baseline realitiesof each country. Of used plastics inthe UK that were made available forrecycling (pre- and post-consumer),around 70% wt. was exported, includingboth post- and pre-consumer quantities.Some of the material collected formechanical reprocessing into materials
recycling facilities (MRFs) will becontamination or unrecyclable and itwill end up in landfill / EfW or as refuse-derived fuel (RDF). Indicative reject ratesof older technology plants (i.e. withoutadvanced sensor-based sorting) in theUK have been provided by WRAP in2006. Residue rates were reported at
Figure 2. Material flow diagram for processing of plastics in the UK, 2009; quantities in million tonnes (Mt).
According to the diagram, almost all post-consumer plastics collected for recycling were exported. Flows cover all
consecutive stages of the life-cycle of plastics, involving production of plastic polymers (P1), production of plastic
products (P2), consumption of plastics (P3-P7), waste generation (P12 and P8), waste management involving
disposal (P9), energy recovery (P10) and recycling (P11), and trade (export, E). Stocks are not taken into account.Details of calculation and assumptions are available elsewhere2.

8/15/2019 Plastic Recycling ISWA 2014
http://slidepdf.com/reader/full/plastic-recycling-iswa-2014 19/66
Global recycling markets - plastic waste: A story for one player – China
Plastic waste trade and flows: key facts and factors of a global market
19
12-15% of total input waste, with mosteffective at 2-5% wt.; but, this may notinclude all fractions disposed of 7.
There are considerable contrasts in thefate of pre- and post-consumer mate-rial. According to the Zhou 2 data andcalculations, almost all of pre-consum-er waste was recycled within the UK,while almost all of the post-consumerwaste plastics collected for recyclingwas exported, the vast majority to Chi-na. Regarding plastic bottles only, of therespondents to a RECOUP survey, spe-cifically to the question on where theirplastics material was sold 8, 53% iden-
tified a UK market, 9% an export market(7% non-EU and 2% EU) and 38% werenot aware of or willing to disclose theend market. To put things in perspective,ignoring stocks, the amount exported asa percentage of the plastics productssold (produced or imported) in the UKis therefore estimated at 12.7% wt. Adetailed description of the supply chainor plastic recycling in the UK is availableby Wong9.
The UK exported 711Kt of recycled plas-tics to other countries (Figure 2), whichslightly increased to 736Kt in 2010,representing a considerable growthin comparison to 2007 (548Kt). Thiscan be attributed to increased demandfrom the Chinese market. The econom-ic downturn initially had a dramatic im-pact, with prices collapsing for a shortperiod, but overall the quantities havecontinued to increase, albeit at a slowerrate, although the value has decreasedsignificantly due to the fall in prices.The UK used Hong Kong SAR as a keydestination, because mainland China didnot accept shipments of mixed PE, PVC,PS and PET with other polymers in thesame container. However, UK exportsto Hong Kong SAR declined significantlyto 53% wt. in 2011, after China imposedstricter quality standards and law en-forcement on materials for recycledmaterials shipped via Hong Kong SAR.The major competition facing the UK is
recycling from Chinese domestic wasteand other major exporting countries.The UK exports to China are of relatively
low quality compared with waste
plastics sold to UK reprocessors, butthey are of good quality compared withChinese domestic recycled waste due tothe high quantities of polluting additives/surfactants in the latter. Regardinginternational competition, the USA isthe largest source country to China,and it is generally regarded as providingthe best quality of waste plastics.Recent data suggest that the USA isincreasingly reprocessing more wasteplastics domestically, markets beingreadily available because it is the secondlargest plastics consumer in the world.However, regarding the USA, there issome contradictory evidence presented
in Figure 26, showing lack of investmentin reprocessing facilities in the decadeup to 2010. For the same reasons the
ample availability of used plastics in
Europe and Japan in principle enablesfurther development in their localreprocessing capacity. However it maynecessitate greater economies of scale– a striking difference from the currentsmall-scale reprocessing operationsin China. The latter may change as theChinese government invests in largerscale facilities and attempts to eliminatethe illegal, but very small scale, part ofthe sector (see Chapters 6 and 7). Japanis becoming an increasingly favouredimport source for China, reflecting thelower currency and logistic costs, andhigher actual or perceived quality.
KEY FACT 2Pre-consumer (industrial) plastic scrap, a
by-product of industrial activities, is recycled as
feedstock to a very high extent already (e.g. see
the UK case study). The big challenges are with
the post-consumer plastics, and especially tho-se arising from mixed (‘co-mingled’ (UK)/ ‘single
stream’ (USA)) collection, sent for mechanical
recycling. Plastic waste present in residual was-
te (ideally limited to the non-sustainably recy-
clable part of waste) in most of the cases can
potentially be directed to energy recovery via
production of quality assured solid recoveredfuel (SRF) or via energy from waste combustion
plants (EfW) producing combined heat and pow-
er (CHP).
8/15/2019 Plastic Recycling ISWA 2014
http://slidepdf.com/reader/full/plastic-recycling-iswa-2014 20/66
20 Global recycling markets - plastic waste: A story for one player – China
Plastic waste trade and flows: key facts and factors of a global market
3.3 The globalised plastic waste trade
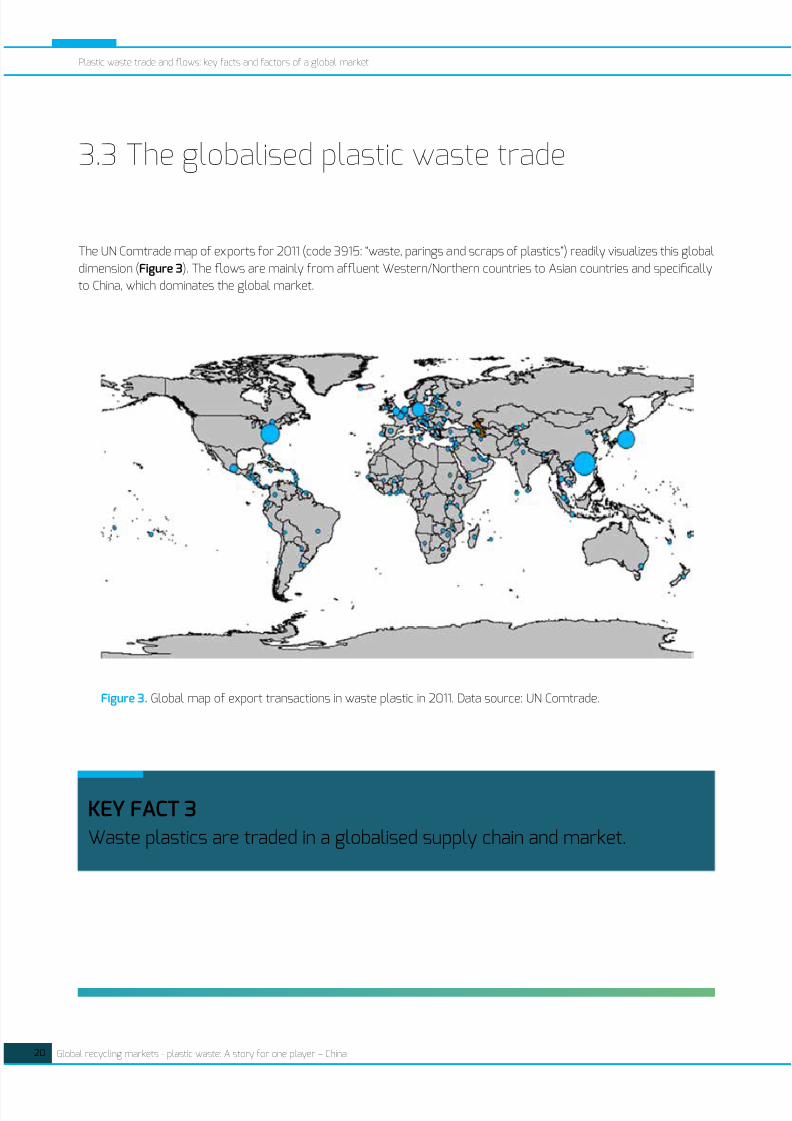
The UN Comtrade map of exports for 2011 (code 3915: “waste, parings and scraps of plastics”) readily visualizes this global
dimension (Figure 3). The flows are mainly from affluent Western/Northern countries to Asian countries and specifically
to China, which dominates the global market.
Figure 3. Global map of export transactions in waste plastic in 2011. Data source: UN Comtrade.
KEY FACT 3Waste plastics are traded in a globalised supply chain and market.
8/15/2019 Plastic Recycling ISWA 2014
http://slidepdf.com/reader/full/plastic-recycling-iswa-2014 21/66
Global recycling markets - plastic waste: A story for one player – China
Plastic waste trade and flows: key facts and factors of a global market
21
3.4 Key market factors
International recycling markets for plastics scrap depend on a complex interplay of:
1. National (domestic) solid waste collection capabilities (formal and informal), reprocessing capabilities and needs, and
export / transport laws and controls.
2. Market demand and import controls at the major destination countries (e.g. China) and investment in raw material pro-
duction elsewhere (e.g. Chinese investments in Africa).
3. Global supply chain networks: transport logistics and costs (westbound freight rates, number of empty containers re-
turning to Asia (“reverse haulage”), customs).
4. Cost of primary resins, dependent on oil and natural gas prices (prime determinant of the price of recycled plastics)
5. Technological innovation: (new resins, composites, oxo-degradable and compostable plastics, sensor-based sorting,
chemical recycling).
KEY FACT 4Many industrial sectors are involved: traditional waste management,
informal sector collectors, reprocessors, transporters/forwarders, local
and multi-national manufacturers.
KEY FACT 5The current mode of operation balances the trade deficit of the Northern/
Western countries, utilises the otherwise empty containers (reverse haulage)
and supplies Chinese manufacturing industry with necessary affordable
secondary raw materials.

8/15/2019 Plastic Recycling ISWA 2014
http://slidepdf.com/reader/full/plastic-recycling-iswa-2014 22/66
22 Global recycling markets - plastic waste: A story for one player – China
Plastic waste trade and flows: key facts and factors of a global market
3. 5 Waste plastics markets vulnerability and volatility
The market (amounts traded) forwaste plastics has been continuously
increasing over the last decade but
with a disruption during the 2008-9 fi-
nancial crisis, which coincided with the
collapse of primary plastic production.
According to Zhou2, in 2008, China, as
a key destination of waste material in
global market, reduced purchasing of
recovered paper and plastics as a re-
sult of the fall in demand from Chinese
packaging firms. It has been estimated
by Moore10 that, as a result of the glob-
al financial crisis, around 38% of plas-
tic recycling firms in China stopped
operating by the end of 2008 . Ex-
porters to China had to stockpile large
quantities of recyclable waste and suf-
fered losses. According to Letsrecycle.
com11, the price of waste plastics in
the UK fell abruptly: used plastic film
(ex-works, usually baled) was trad-ed at £20-£50 per tonne in Decem-
ber 2008, down from £130-£170 per
tonne earlier that year; and the price
of waste ‘natural’ grade rHDPE bot-
tles (the type and quality of waste
plastic traded at the highest prices)
fell from £260-330 in November to
130-150 in December. In response, Eu-ropean recycling market tried to limit
the supply to China in order to prevent
or reduce a loss. Thus many projects
were brought to a halt and production
was substantially reduced. Steady
economic growth during the summer
of 2009, made the Chinese market
KEY FACT 6
A steady market increase is in direct relationshipwith primary plastics production.
Decreases in the prices of primary plastics
directly affect the prices and trade volume of
secondary plastics.
Figure 4. Production index of primary plastics. After PlasticsEurope3, using EUROSTAT data.

8/15/2019 Plastic Recycling ISWA 2014
http://slidepdf.com/reader/full/plastic-recycling-iswa-2014 23/66
Global recycling markets - plastic waste: A story for one player – China
Plastic waste trade and flows: key facts and factors of a global market
23
for imported waste plastics available
again. By May 2009 the high price of
used plastics had been restored.
Figures 4, 5 and 6 demonstrate the
interrelationships between the inter-
national financial climate, primary
plastics production, plastic waste pric-
es and the financial value of exports.
The 2008 financial crisis impacted on
all these variables. The crisis also had
implications on the main plastic scrap
importer: in China a considerable pro-portion of the small-scale Chinese
reprocessors were forced out of busi-
ness (38% of plastic recycling firms
closed10 at the end of 2008).
Another big effect of global market
disruption was due to the implemen-
tation of stricter custom controls by
the Chinese government known asthe ‘Green Fence Operation’ which is
detailed in Chapter 7. However, prices
were not been affected to the same
extent.
Figure 5. US waste plastics exports: The abrupt drop in 2008 coincides with the financial crisis and the drop in the
production and prices of the primary plastics (Figure 4). After Resource Recycling12.
Figure 6. Prices of reprocessed waste plastics in the UK market, for various grades: the collapse in prices corre-
sponds to the financial crisis which has resulted in fall in the production index of primary plastics3. Adopted from
WRAP13.

8/15/2019 Plastic Recycling ISWA 2014
http://slidepdf.com/reader/full/plastic-recycling-iswa-2014 24/66
24 Global recycling markets - plastic waste: A story for one player – China
4. Main trans-boundary flows ofplastic waste (imports–exports)4.1 The big pictureThe aggregate world value of waste plastics according to
the UN Comtrade data for 20126, (3915 data code, financial
values in $) are shown in Table 1, The overall exports was
at $6.6 Bil, corresponding to ca. 14.4Mt of material traded;
the imports at ca 9.5 Bil, corresponding to 15.8Mt. The top
world importers were: No1: China at 73.1% at $6.1 Bil, No2:
Hong Kong SAR 19.7% at $1.65 Bil. The top 5 importers
were (Figure 7): China > Hong Kong SAR > USA > Nether-
lands > Belgium.
Table 1. World value of waste plastics trading (exports – imports) according to the UN Comtrade data for 20126, (3915
data code, financial values in $).
Trade Flow Trade Value NetWeight (kg) Trade Quantity
Export $6,606,944,815 14,428,897,482 14,428,897,482
Import $9,459,409,205 15,853,971,409 15,853,971,409
Re-Export $972,369,133 2,972,712,246 2,972,712,246
Re-Import $1,038,381 1,352,208 1,352,208
Figure 7. Top importers and exporters of plastic waste worldwide, based on financial transactions. Source: UN
Comtrade - data for 2012.
China
China, Hong Kong SAR
China, Hong Kong SAR
USA
USA
Japan
Germany
United Kingdom
Netherlands
Belgium
Total Import: $8,359,094,112
Total Export: $4,104,994,801
Top 5 exporters
Top 5 importers2,1%
2,4%2,6%
19,7%
73,1%
17,0%
7,4%
26,9%
25,6%
23,0%
8/15/2019 Plastic Recycling ISWA 2014
http://slidepdf.com/reader/full/plastic-recycling-iswa-2014 25/66
Global recycling markets - plastic waste: A story for one player – China
Main trans-boundary flows of plastic waste (imports–exports)
25
4.2 China
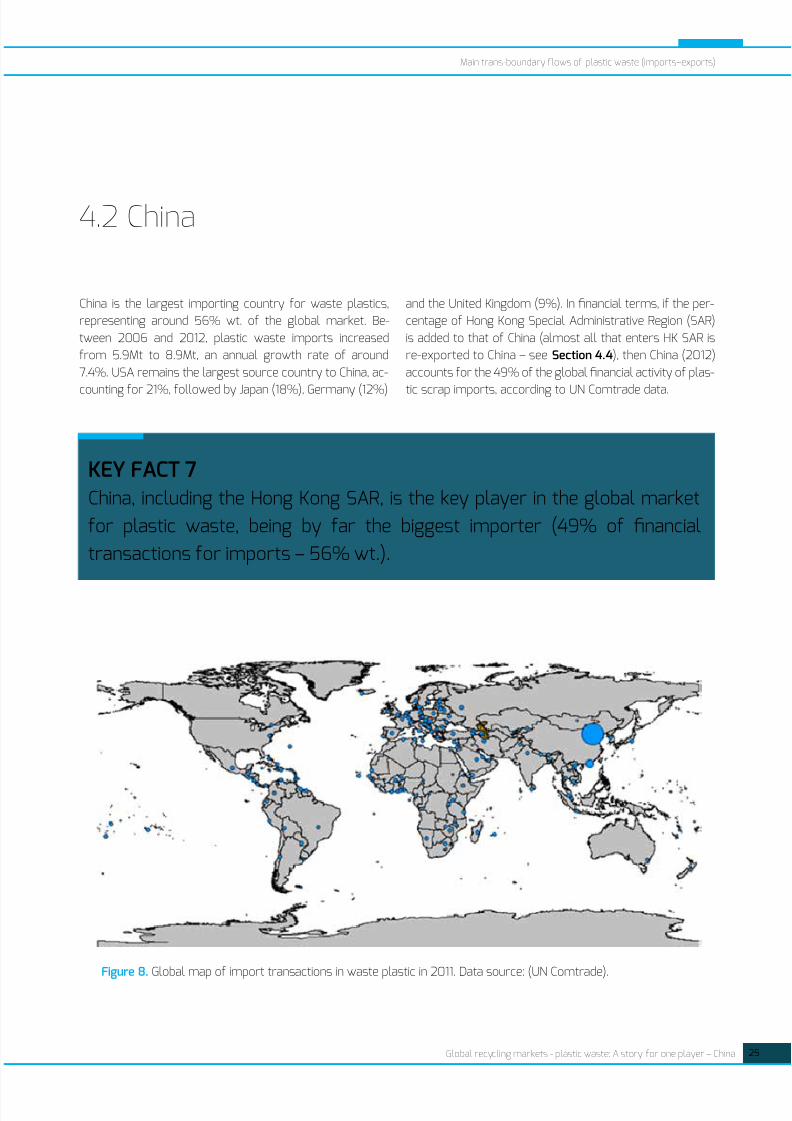
China is the largest importing country for waste plastics,
representing around 56% wt. of the global market. Be-
tween 2006 and 2012, plastic waste imports increased
from 5.9Mt to 8.9Mt, an annual growth rate of around
7.4%. USA remains the largest source country to China, ac-
counting for 21%, followed by Japan (18%), Germany (12%)
and the United Kingdom (9%). In financial terms, if the per-
centage of Hong Kong Special Administrative Region (SAR)
is added to that of China (almost all that enters HK SAR is
re-exported to China – see Section 4.4), then China (2012)
accounts for the 49% of the global financial activity of plas-
tic scrap imports, according to UN Comtrade data.
KEY FACT 7China, including the Hong Kong SAR, is the key player in the global market
for plastic waste, being by far the biggest importer (49% of financial
transactions for imports – 56% wt.).
Figure 8. Global map of import transactions in waste plastic in 2011. Data source: (UN Comtrade).

8/15/2019 Plastic Recycling ISWA 2014
http://slidepdf.com/reader/full/plastic-recycling-iswa-2014 26/66
26 Global recycling markets - plastic waste: A story for one player – China
Main trans-boundary flows of plastic waste (imports–exports)
Figure 9. Top importers of plastic waste to China, based on financial transactions. Source: UN Comtrade - data for
2011.
The top five exporters in the world were: Hong Kong SAR > USA > Japan > Germany > UK. Europe collectively is the major
exporter. An overview of the most important exporters to China is provided in Figures 9 and 10. Some of these exporting
countries/areas are considered in more detail below.
Figure 10. World exports of recovered plastics to China including HK in 2011. After Zhou 2 (Data Source from UN
Comtrade).
China, Hong Kong SAR
Japan
Germany
USA
Thailand
Top 5 import partners for China
13.2%
15.1%
17.0%18.8%
36.0%

8/15/2019 Plastic Recycling ISWA 2014
http://slidepdf.com/reader/full/plastic-recycling-iswa-2014 27/66
Global recycling markets - plastic waste: A story for one player – China
Main trans-boundary flows of plastic waste (imports–exports)
27
4.3 Europe (EU-27)
According to PlasticsEurope data for20123, the EU-27 generated 25.2Mtof post-consumer waste plastics,quantities remaining almost stablesince 2011. Of these, ca 6.5Mt (26%wt.) was collected for mechanicalrecycling, 0.3% for direct feedstockrecycling, and 35.6% (ca 8.9Mt), wassent for energy recovery, with theremaining being landfilled. According toBIR 2011 data, from the 6.4Mt collected
for recycling, 3Mt was handled withinEurope, and 3.4Mt exported outsideEurope. Therefore more than half ofthe plastic waste collected for recyclingin Europe is directed to internationalmarkets. According to EUROSTAT 2012the EU-27 data (EUWID web; 15-04-13,
EUROSTAT 2012 data, 27 countries),Europe exported 3.36Mt (Waste,parings and plastics scrap), worth€1.7 Bil (Extra-EU trade). The trend isrelatively stable: 2010: 3.373Mt; 2011:3.365Mt; 2012: 3.358Mt. According toUN Comtrade data6 EU-27 exportedmainly to Asian countries, with China1.9Mt and to Hong Kong SAR 1.04Mt –altogether 2.9Mt (Table 2), comprising87% wt. of the exports. This amount
constitutes 46% of the overall quantitycollected for recycling; 12% of theentire post-consumer plastic wastearisings in the EU-27; and only a mere3.4% of the 85Mt predicted by a Pöyryreport as the worldwide demand forused plastics by 2020 – inevitably
with high uncertainty4; and only 6.4%of the demand for the Chinese marketby 2015 as predicted by CBI China 4.There is a rising trend of direct exportsto China, and also to India. Given thatthe exports from Europe to South-East Asian countries to a great extentfinally find their way to China, theoverall dependence on Chinese marketdemand is even greater. In contrast tothe 87% wt. of waste plastics, Europe
exports only 1.2% wt. of its primaryplastics products to China3.The EU-27 imports were just 0.4Mt,with outside Europe countries making anegligible contribution, and Norway andSwitzerland being most important EU-27 suppliers.
KEY FACT 8Europe, the biggest exporter worldwide of waste plastic intended for recycling,depends largely on China: 87% wt. is exported to China either directly or viathe Hong Kong SAR. The exported quantity is 46% of the overall quantitycollected for recycling, and 12% of the entire plastic waste arisings in Europe.In contrast, Europe exports only 1.2% of its primary plastics products to China.
High dependencies on exports to China also hold for Japan and the USA.
Trade Flow Reporter Partner Trade Value NetWeight (kg) Trade Quantity
Export EU-27 World $1,372,115,961 3,357,671,864 3,357,671,864
Export EU-27 China $767,228,422 1,886,100,100 1,886,100,100
Export EU-27China, Hong Kong
SAR$398,812,843 1,037,642,200 1,037,642,200
Import EU-27 World $96,825,536 398,968,092 398,968,092
Import EU-27 China $2,183,884 2,017,904 2,017,904
Import EU-27
China, Hong Kong
SAR $340,347 455,350 455,350
Table2. Financial value and weight of EU-27 waste plastics trading (exports – imports) according to the UN Comtrade data
for 20126, (3915 data code, financial values in $).

8/15/2019 Plastic Recycling ISWA 2014
http://slidepdf.com/reader/full/plastic-recycling-iswa-2014 28/66
28 Global recycling markets - plastic waste: A story for one player – China
Main trans-boundary flows of plastic waste (imports–exports)
4.4 Hong Kong: China Special Administrative Area (SAR)
The Hong Kong SAR has no internalmarket for plastic waste. It is export-ing most of the domestically collect-ed plastic waste arisings. Accordingto the Waste Reduction and Recovery
Factsheet No4., in 2011 0.84Mt werecollected by co-mingled separation
programmes, which were exportedmainly to China (99.5% wt.), with minorquantities directed to Vietnam (1.9%wt.) and Taiwan (0.1% wt.). The exportshave two processing routes. Most of itis baled by local commercial recyclersfor direct export. At Plastic ResourcesRecycling Centre EcoPark Tuen Mun,the remainder is reprocessed: cleaned,crushed, dried and the shredded flakesare pelletised.
According to UN Comtrade6, most of
the 2012 imports to Hong Kong SAR
(3.20Mt), was re-exported to the World(2.93Mt), essentially China (2.86Mt).This is done after preliminary cleaningand sorting. Total exports from HongKong SAR to China were at 3.16Mt (a bit
less than the addition of the re-export-ed 2.86 plus the domestically collect-
ed and exported 0.83 which equals to3.69Mt) – and to the world 3.24Mt. Itis speculated that Hong Kong SAR waspreferred over direct export to Chinabecause of more lax import rules andenforcement. However, this may not bethe case currently, as the case of theUK indicates (See Section 3.2).
A special case is the UK, which is theonly major plastic exporter countrythat tranships more recycled plasticto HK than directly to mainland China.
According to Zhou2, China including
Hong Kong SAR is a key destination ofUK waste plastics exports, accountingfor around 88% in 2010, whichreflected UK dependency on Chinesemarket 15. The UK used to choose Hong
Kong SAR as a key destination, becauseit allowed imports of mixtures, while
mainland China only allowed mixturesof waste plastics that included PE, PVC,PS and PET. Figure 11 shows that 78%of UK plastic exports to China wereshipped to Hong Kong SAR in 2008,but the relative proportion declinedsignificantly to 53% in 2011. There isanecdotal evidence that plastics fromimported WEEE were separated frommetal scrap in HK and then transhippedto China2. Stricter administrationeffectively prevented unqualified wasteplastics from entering mainland China.
KEY FACT 9The Hong Kong SAR serves almost exclusively as an alternative entry point forthe Chinese market – it used to be considered a more lax entry point.
Figure 11. World exports of recovered plastics to China including HK in 2011. After Zhou2 (Data Source from UN
Comtrade).

8/15/2019 Plastic Recycling ISWA 2014
http://slidepdf.com/reader/full/plastic-recycling-iswa-2014 29/66
Global recycling markets - plastic waste: A story for one player – China
Main trans-boundary flows of plastic waste (imports–exports)
29
Figure 12. Japanese exports of waste plastics by destination country. After Zhou2 (Data Source from UN Comtrade,
2012)
4.5 Japan
Based on UN Comtrade6 data, Japanese exports of waste
plastics have shown small fluctuations of between 1450-
1650Kt in the past five years, with the majority transported
to Hong Kong SAR and China (Figure 12). Before 2009, Japan
used to ship more waste plastics to Hong Kong SAR than
directly to mainland China, which was reversed from 2009
onwards. From 2011 to 2012 total exports were constant,
and the shift towards more direct exports to China i.e., less
via Hong Kong SAR was ever stronger: 2011: China 0.90Mt,
HK: 0.59Mt, Total: 1.49Mt; 2012: China 1.05Mt, HK: 0.46Mt,
Total: 1.51Mt).
853 779641 722
587
531574
714769
890
133 160 133
148 155
0
200
400
600
800
1000
1200
1400
1600
1800
2007 2008 2009 2010 2011
T h o u s a n d
T o n n e s
Others
China
Hong Kong

8/15/2019 Plastic Recycling ISWA 2014
http://slidepdf.com/reader/full/plastic-recycling-iswa-2014 30/66
30 Global recycling markets - plastic waste: A story for one player – China
Main trans-boundary flows of plastic waste (imports–exports)
The USA is the second largest con-
sumer of plastics in the world and
depends mainly to China and HK for
absorbing its waste plastics. Neigh-
bouring countries such as Canada and
Mexico are also a small market outlet.
According to the Institute of Scrap
Recycling Industries (ISRI)16 reporting
data from the U.S. Census Bureau, the
USA exported 2.1Mt of plastic waste,
worth $1.05 billion. Most of the value
of the transactions was with China and
the Hong Kong SAR ($547 million and
$240 million respectively).
From a Chinese perspective the USA is
its largest supplier of waste plastics.
Out of 2.15Mt exports in 2012, China
absorbed 1.20Mt and HK 0.49Mt – in
total 1.69Mt, accounting for 0.79% wt.
A slight decrease was noted in com-
parison to 2011 (out of 2.14Mt: China
1.18Mt, HK: 0.60Mt, Total: 1.78Mt =
0.83% wt.). Overall exports increased
by 54% between 2007 and 2011 (Fig-
ure 13), largely reflecting the doubling
of the quantities exported to China.
China’s market share increased from
39.2% in 2007 to 54.8% in 2011, grad-
ually dominating the USA exports.
In comparison, exports of waste plas-
tics to the Hong Kong SAR were com-
parable with exports to China during
2007-2009, declining substantially
afterwards.
This fact could indicate quality im-
provements of exported waste plas-
tics, as the Hong Kong SAR has a rel-
atively low import threshold for waste
plastics. Despite these exports, do-
mestic USA reprocessors import large
quantities of waste plastics every year
to meet their demand.
2.1Mt worth of$1.05 Billion
USA is the largest
waste plastics supplier
to China
Figure 13. USA exports of waste plastics by destination country. After Zhou2 (Data Source from UN Comtrade,
2012)
4.6 USA
524 489
809 731609
545 540
908942 1176175 166
121 139146
147 295
201 246215
0
500
1000
1500
2000
2500
2007 2008 2009 2010 2011
T
h o u s a n d T
o n n e s
Others
Canada
China
Hong Kong
8/15/2019 Plastic Recycling ISWA 2014
http://slidepdf.com/reader/full/plastic-recycling-iswa-2014 31/66
Global recycling markets - plastic waste: A story for one player – China
Main trans-boundary flows of plastic waste (imports–exports)
31
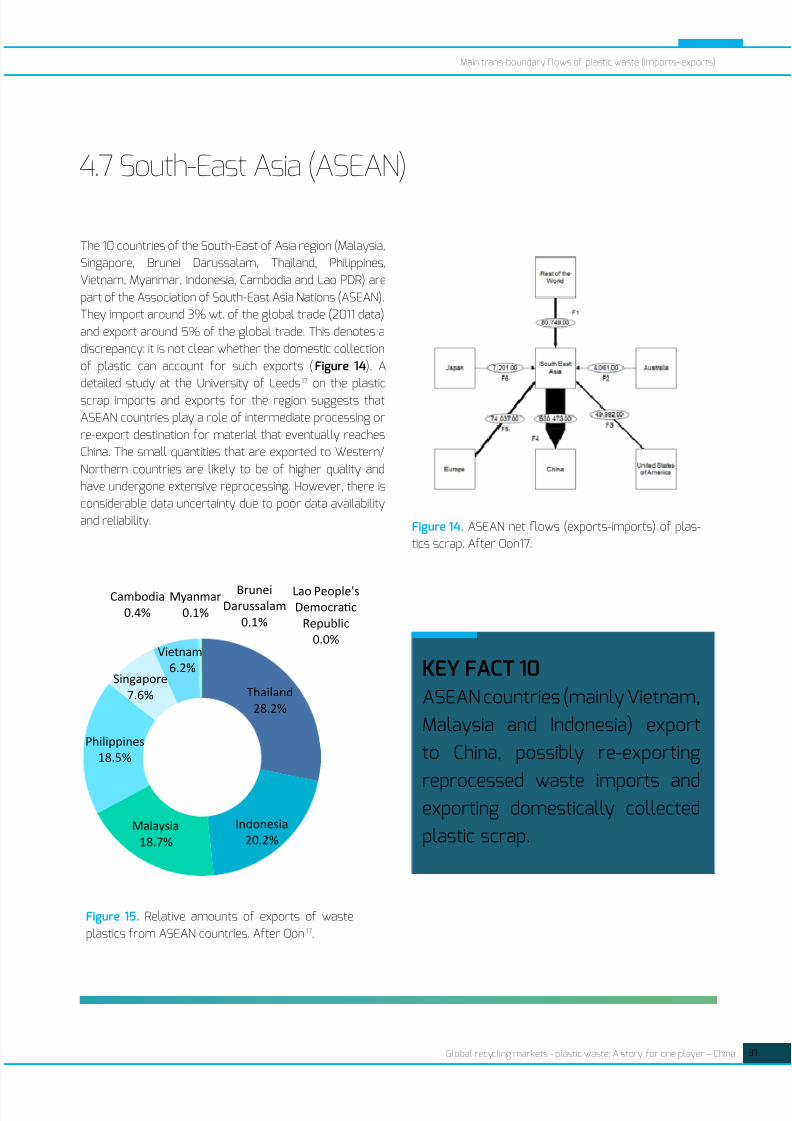
The 10 countries of the South-East of Asia region (Malaysia,
Singapore, Brunei Darussalam, Thailand, Philippines,
Vietnam, Myanmar, Indonesia, Cambodia and Lao PDR) are
part of the Association of South-East Asia Nations (ASEAN).
They import around 3% wt. of the global trade (2011 data)
and export around 5% of the global trade. This denotes a
discrepancy: it is not clear whether the domestic collection
of plastic can account for such exports (Figure 14). A
detailed study at the University of Leeds17 on the plastic
scrap imports and exports for the region suggests that
ASEAN countries play a role of intermediate processing or
re-export destination for material that eventually reaches
China. The small quantities that are exported to Western/
Northern countries are likely to be of higher quality and
have undergone extensive reprocessing. However, there is
considerable data uncertainty due to poor data availability
and reliability.
Figure 15. Relative amounts of exports of waste
plastics from ASEAN countries. After Oon17.
Figure 14. ASEAN net flows (exports-imports) of plas-
tics scrap. After Oon17.
4.7 South-East Asia (ASEAN)
Thailand
28.2%
Indonesia
20.2%Malaysia
18.7%
Philippines
18.5%
Singapore
7.6%
Vietnam
6.2%
Cambodia
0.4%
Myanmar
0.1%
BruneiDarussalam
0.1%
Lao People'sDemocratc
Republic
0.0%
KEY FACT 10ASEAN countries (mainly Vietnam,
Malaysia and Indonesia) export
to China, possibly re-exporting
reprocessed waste imports andexporting domestically collected
plastic scrap.
8/15/2019 Plastic Recycling ISWA 2014
http://slidepdf.com/reader/full/plastic-recycling-iswa-2014 32/66
32 Global recycling markets - plastic waste: A story for one player – China
5. Exports of different polymertypes to China and Hong Kong.
5.1 UK
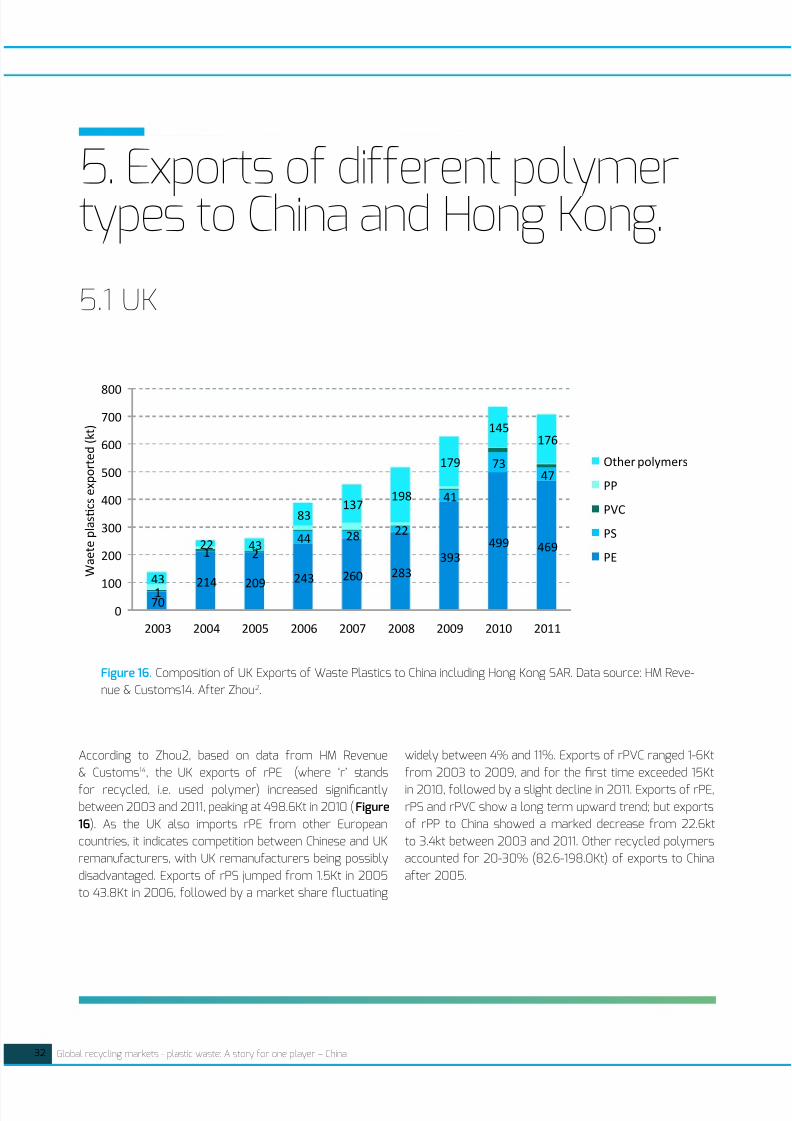
According to Zhou2, based on data from HM Revenue
& Customs14, the UK exports of rPE (where ‘r’ stands
for recycled, i.e. used polymer) increased significantlybetween 2003 and 2011, peaking at 498.6Kt in 2010 (Figure
16). As the UK also imports rPE from other European
countries, it indicates competition between Chinese and UK
remanufacturers, with UK remanufacturers being possibly
disadvantaged. Exports of rPS jumped from 1.5Kt in 2005
to 43.8Kt in 2006, followed by a market share fluctuating
widely between 4% and 11%. Exports of rPVC ranged 1-6Kt
from 2003 to 2009, and for the first time exceeded 15Kt
in 2010, followed by a slight decline in 2011. Exports of rPE,rPS and rPVC show a long term upward trend; but exports
of rPP to China showed a marked decrease from 22.6kt
to 3.4kt between 2003 and 2011. Other recycled polymers
accounted for 20-30% (82.6-198.0Kt) of exports to China
after 2005.
70
214209
243 260 283
393
499 469
1
1 2
44 28 22
41
7347
43
22 43
83137
198
179
145176
0
100
200
300
400
500
600
700
800
2003 2004 2005 2006 2007 2008 2009 2010 2011
W a e t e p l a s t c s e x p o r t e d ( k t )
Other polymers
PP
PVC
PS
PE
Figure 16. Composition of UK Exports of Waste Plastics to China including Hong Kong SAR. Data source: HM Reve-
nue & Customs14. After Zhou2.

8/15/2019 Plastic Recycling ISWA 2014
http://slidepdf.com/reader/full/plastic-recycling-iswa-2014 33/66
Global recycling markets - plastic waste: A story for one player – China
Exports of different polymer types to China and Hong Kong.
33
According to Zhou2, Japan is the secondsignificant source of waste plastics toChina (Hong Kong SAR included) afterthe US. Most of waste plastics shippedfrom Japan to China are described as‘other waste plastics’ of which PET isa significant fraction. The share of PE(21%-22%), PVC (1%-2%) and PS (14%-16%) have remained stable in recentyears. Japan imposes strict limitationsto landfill disposal which enables
considerable secondary plastics to beavailable for reprocessing and export.Japan has a very high collection ratefor PET bottles, achieving 72.1% in2010, facilitated by legal measuressuch as ‘The Containers and PackagingRecycling Law’ (1995), ‘Chemical Bottleto Bottle (BtoB) Recycling’ (2004) and
‘The 2nd Voluntary Action Plan for 3RPromotion’ (2011). These measurespromote the quality of recycled PETbottles, with liquor, soy sauce and softdrinks bottles designated specificallyfor recycling. The Containers andPackaging Recycling Law requiresreprocessing PET bottles into pellets,flakes or polyester raw material forrecycling. The voluntary plan proposes
to increase the recycling rate of PETbottles to more than 85% and toreduce their weight by more than10%, according to The Council for PETBottle Reycling18.As a result Japan isthe largest supplier of recycled PETto China, accounting for 23% wt. ofChina’s imports of rPET in 2009. In2010 Japan collected 628kt of PET forrecycling and 52.5% were exported,mainly to China. However, high-quality
recycled PET is also in demand in Japanas it is used for closed-loop recyclingin bottles (11%), sheets (49%), fibres(34%) and other products (6%) 18. In2010 Japan exported 40% of its wasteplastic bottles overseas, 90% of whichwere sold to China due to higher pricespaid by the Chinese manufacturers(World Recovered Plastics, 2012). Ithas been suggested that Japan shouldrestrict exports of waste plasticbottles to China to prevent the loss of
precious and finite domestic recyclableresources.
Data from the Japan Containers andPackaging recycling Association(JCPRA), as reported by The Council forPET Bottle Reycling (CBPR)19, show thatthe legislative and voluntary agreementefforts have resulted in a constantimprovement of the baled rPET qualityover the last 15 years (Figure 17), withthe best quality (‘rank A’) accounting formore than 85% in 2011, also resulting
in higher bale bid prices as evidencedby the rise of the post-consumer PETvalues.
5.2 Japan
Figure 17. Composition of Japan’s Exports of Waste Plastics to China
including Hong Kong SAR. After Zhou2 (Data Source from UN Comtrade,
2012).
Figure 18. Improvement in quality of plastic waste bales in Japan, as
a result of legislative initiatives Japan Containers and Packaging recy-
cling Association (JCPRA), as reported by The Council for PET Bottle
Reycling (CBPR)19
315 300 290 328 333
221 207 202244 237
826 820 836
887 875
0
200
400
600
800
1000
1200
1400
1600
T h o u s a n d T
o n n e s
Others
PVC
PS
PE
8/15/2019 Plastic Recycling ISWA 2014
http://slidepdf.com/reader/full/plastic-recycling-iswa-2014 34/66
34 Global recycling markets - plastic waste: A story for one player – China
Exports of different polymer types to China and Hong Kong.
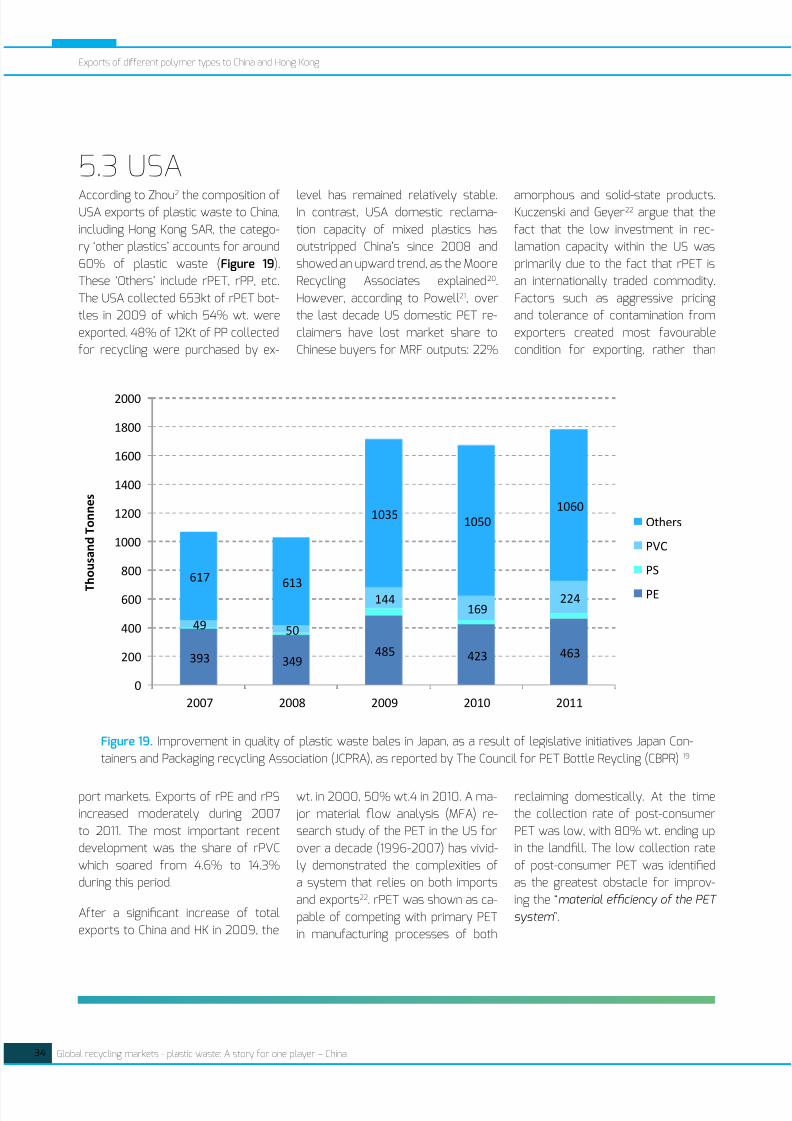
According to Zhou2 the composition ofUSA exports of plastic waste to China,
including Hong Kong SAR, the catego-
ry ‘other plastics’ accounts for around
60% of plastic waste (Figure 19).
These ‘Others’ include rPET, rPP, etc.
The USA collected 653kt of rPET bot-
tles in 2009 of which 54% wt. were
exported. 48% of 12Kt of PP collected
for recycling were purchased by ex-
port markets. Exports of rPE and rPS
increased moderately during 2007
to 2011. The most important recent
development was the share of rPVC
which soared from 4.6% to 14.3%
during this period.
After a significant increase of total
exports to China and HK in 2009, the
level has remained relatively stable.In contrast, USA domestic reclama-
tion capacity of mixed plastics has
outstripped China’s since 2008 and
showed an upward trend, as the Moore
Recycling Associates explained20.
However, according to Powell21, over
the last decade US domestic PET re-
claimers have lost market share to
Chinese buyers for MRF outputs: 22%
wt. in 2000, 50% wt.4 in 2010. A ma-
jor material flow analysis (MFA) re-
search study of the PET in the US for
over a decade (1996-2007) has vivid-
ly demonstrated the complexities of
a system that relies on both imports
and exports22. rPET was shown as ca-
pable of competing with primary PET
in manufacturing processes of both
amorphous and solid-state products.Kuczenski and Geyer22 argue that the
fact that the low investment in rec-
lamation capacity within the US was
primarily due to the fact that rPET is
an internationally traded commodity.
Factors such as aggressive pricing
and tolerance of contamination from
exporters created most favourable
condition for exporting, rather than
reclaiming domestically. At the time
the collection rate of post-consumer
PET was low, with 80% wt. ending up
in the landfill. The low collection rate
of post-consumer PET was identified
as the greatest obstacle for improv-
ing the “material efficiency of the PET
system ”.
5.3 USA
Figure 19. Improvement in quality of plastic waste bales in Japan, as a result of legislative initiatives Japan Con-
tainers and Packaging recycling Association (JCPRA), as reported by The Council for PET Bottle Reycling (CBPR) 19
393 349485 423 463
4950
144169
224
617613
10351050
1060
0
200
400
600
800
1000
1200
1400
1600
1800
2000
2007 2008 2009 2010 2011
T
h o u s a n d T
o n n e s
Others
PVC
PS
PE

8/15/2019 Plastic Recycling ISWA 2014
http://slidepdf.com/reader/full/plastic-recycling-iswa-2014 35/66
Global recycling markets - plastic waste: A story for one player – China 35
6. What happens within China?KEY FACT 12There is insufficient understanding of the fate of plastic scrap after enteringChina and consequently its implications for local and global health and theenvironment. The ‘Green Fence Operation’ has rapidly changed the import andutilisation situation.
Given the major dependence of the rest of the world onChina’s importing of plastic scrap (56% wt. of worldwideimports), the fate of this secondary resource within Chi-na is of great importance. Plastics manufacturing hasemerged as a key priority for today’s China23.
Despite this there is insufficient understanding of the exactrecovery conditions that prevail within China; with the lan-guage barrier also contributing to this limitation. There areconcerns (see Section 8.1) that the material could be usedfor the production of lower quality plastics in violation of
specifications; that the reprocessing and manufacturingtechniques and conditions could potentially endanger thehealth of workers (occupational health) and increase riskto the public heath via improper disposal in China and po-tentially worldwide via reprocessed exports.
There are also concerns that material of lower quality isnot used, but is disposed of, or used for energy recov-ery in plants that do not have air pollution control (APC)systems in place of standards equivalent to the EU plantsand for which use is contrary to the export laws of manycountries, including the EU and even Chinese import laws.However, there is no definitive evidence to confirm or re-ject these concerns thus far.
The main findings from a research study by Zhou2 attemptto cast light on the trade of waste plastics between theUK and China. Information and data were obtained onthe Chinese market for waste plastics, and includedreviews of data available only in Chinese. The literature
sources mainly comprised expert opinions obtained viaquestionnaires and reports. The most useful data sourceswere obtained from official organisations, such as theChina Customs Statistics (CCS),
China Economic Information Network (CEIN), ChinaStatistical Database and the organisation representing ChinaLight Industry Information (CLII). Relevant stakeholdersincluding selected EU recyclers, re-processors, exporters,Chinese importers and recyclers were interviewed. Havingcritically evaluated data on material flows and recovery
activities, an analysis of the current and future demandof China for waste plastics was completed to assess theimpacts on UK competitiveness in the global market.
Plasic figures of Chinese people on a market stand
for sale
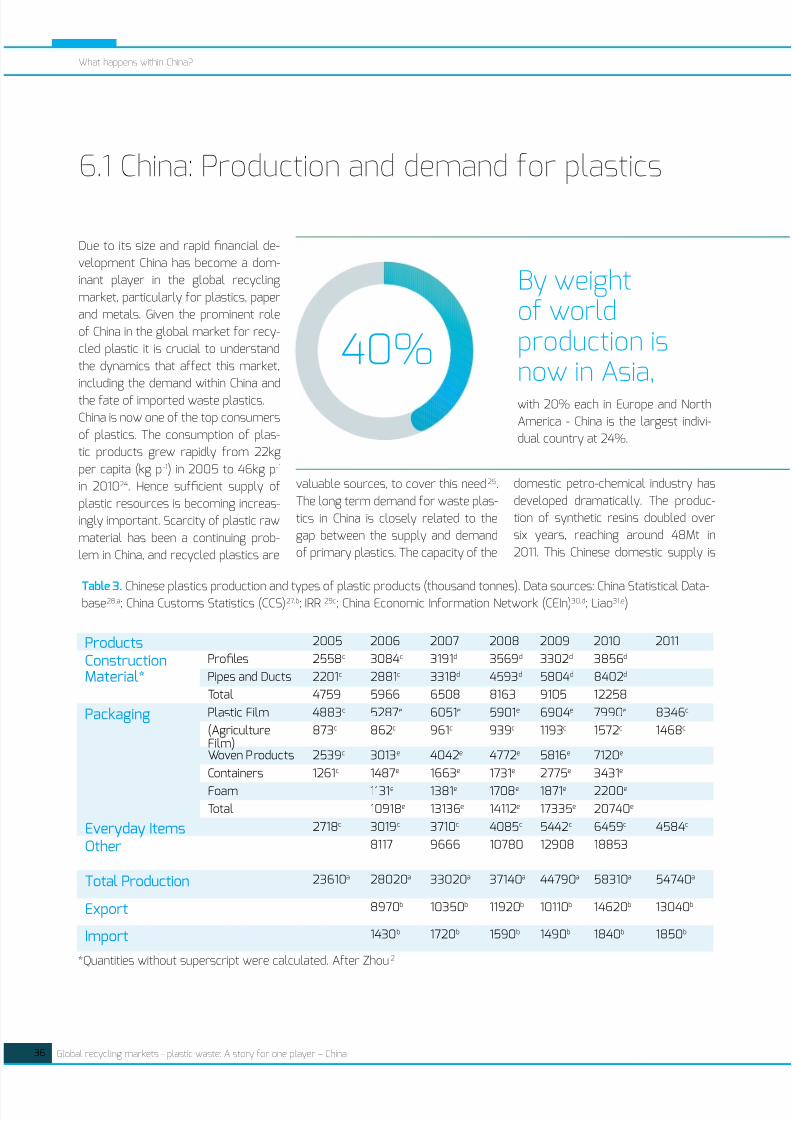
8/15/2019 Plastic Recycling ISWA 2014
http://slidepdf.com/reader/full/plastic-recycling-iswa-2014 36/66
36 Global recycling markets - plastic waste: A story for one player – China
What happens within China?
6.1 China: Production and demand for plastics
Due to its size and rapid financial de-
velopment China has become a dom-
inant player in the global recycling
market, particularly for plastics, paper
and metals. Given the prominent role
of China in the global market for recy-
cled plastic it is crucial to understand
the dynamics that affect this market,
including the demand within China and
the fate of imported waste plastics.
China is now one of the top consumers
of plastics. The consumption of plas-
tic products grew rapidly from 22kg
per capita (kg p-1) in 2005 to 46kg p-1
in 201024. Hence sufficient supply of
plastic resources is becoming increas-
ingly important. Scarcity of plastic raw
material has been a continuing prob-
lem in China, and recycled plastics are
valuable sources, to cover this need25.
The long term demand for waste plas-
tics in China is closely related to the
gap between the supply and demand
of primary plastics. The capacity of the
domestic petro-chemical industry has
developed dramatically. The produc-
tion of synthetic resins doubled over
six years, reaching around 48Mt in
2011. This Chinese domestic supply is
Products 2005 2006 2007 2008 2009 2010 2011
ConstructionMaterial*
Profiles 2558c 3084c 3191d 3569d 3302d 3856d
Pipes and Ducts 2201c 2881c 3318d 4593d 5804d 8402d
Total 4759 5966 6508 8163 9105 12258
Packaging Plastic Film 4883c 5287e 6051e 5901e 6904e 7990e 8346c
(AgricultureFilm)
873c 862c 961c 939c 1193c 1572c 1468c
Woven Products 2539c 3013e 4042e 4772e 5816e 7120e
Containers 1261c 1487e 1663e 1731e 2775e 3431e
Foam 1131e 1381e 1708e 1871e 2200e
Total 10918e 13136e 14112e 17335e 20740e
Everyday Items 2718c 3019c 3710c 4085c 5442c 6459c 4584c
Other 8117 9666 10780 12908 18853
Total Production 23610a 28020a 33020a 37140a 44790a 58310a 54740a
Export 8970b 10350b 11920b 10110b 14620b 13040b
Import 1430b 1720b 1590b 1490b 1840b 1850b
*Quantities without superscript were calculated. After Zhou2
Table 3. Chinese plastics production and types of plastic products (thousand tonnes). Data sources: China Statistical Data-base28,a; China Customs Statistics (CCS)27,b; IRR 29c; China Economic Information Network (CEIn)30,d; Liao31,e)
By weightof worldproduction isnow in Asia,with 20% each in Europe and North
America - China is the largest indivi-
dual country at 24%.
40%

8/15/2019 Plastic Recycling ISWA 2014
http://slidepdf.com/reader/full/plastic-recycling-iswa-2014 37/66
Global recycling markets - plastic waste: A story for one player – China
What happens within China?
37
inadequate to meet the demand. As a
result, almost half of the primary ma-
terial is imported. The total yearly im-
ports of primary plastics in 2011 were23Mt, amounting to just less than
50% of total demand. Given the Chi-
nese Government’s objective to keep
the dependency on imports of any one
commodity below 50%, the utilisa-
tion of recycled plastics can help re-
duce Chinese dependency on imports
of primary plastics. The consultancy
Pöyry, using data based on CBI China
projections, predicts that the Chinese
(including Hong Kong SAR) demand for
recovered plastics could reach 29Mtby 20154. There is detailed informa-
tion available for PVC material flows
in China26.
Table 3 provides an overview of ma-
jor applications of plastics in China. In
2009 strong domestic demand led to
the rise in production of plastic prod-
ucts despite declining exports caused
by the world financial crisis. The peak
of production in 2010 can be explainedby the rebound and recovery of mar-
ket recession and macroeconomic
control by the Chinese Government.
In 2011 plastic production slightly de-
clined from the 2010 level, resulting
from excessive growth in 2010. Pro-
duction in the first quarter of 2012
showed a rising trend and indicated
that the 2012 production would exceed
the 2010 level, thereby maintaining
this steady growth27.
The data were obtained from a varie-
ty of data sources for cross-validationpurposes. China’s Statistical Database
and China’s Customs Statistics (CCS)
are perceived as the most reliable
amongst them. Trade in plastic pro-
files provided by IRR is the same as
that from CCS and total production of
plastic products provided by IRR is also
the same as that from China’s Statis-
tical Database. Plastic construction
materials are underestimated because
they only include profiles, pipes and
ducts. This means that other types
of plastic construction materials are
subsumed under ‘other’ due to theabsence of official sub-categories for
plastic construction materials.
Figure 20. Demand for primary plastics in China. Data source: China Statistical Database28. After Zhou2
10.912.9
14.616.5
23.7 23.126.0
31.8 31.3
36.3
44.3
48.0
0
10
20
30
40
50
60
2000 2001 2002 2003 2004 2005 2006 2007 2008 2009 2010 2011
Q u a n t y ( M
t )
Industrial plastic granules

8/15/2019 Plastic Recycling ISWA 2014
http://slidepdf.com/reader/full/plastic-recycling-iswa-2014 38/66
38 Global recycling markets - plastic waste: A story for one player – China
What happens within China?
6.2 Domestic generation of waste plastics
Plastic recycling in China is broken
into three categories: industrial recy-
cling, agricultural recycling and mu-
nicipal (household) recycling. Industri-
al waste is characterised by relatively
clean sources and consistent quality,
recycled by producers themselves or
by recovering companies. Agricultural
waste achieves the lowest recyclingrate, relying on manual recycling. Mu-
nicipal plastics are mainly sorted by
householders and sold to private col-
lectors. In most cases, plastic waste
entering the municipal waste stream
is disposed of in landfill due to the
lack of higher level technologies,
sorting facilities and cheap disposal
costs. However, waste PET and ABS
have specific reclamation chains and
relatively well developed infrastruc-ture. Informal sector recycling (ISR)
is also a wide-spread reality in China:
typically, financially or otherwise so-
cially disadvantaged people make a
living by picking up recyclable wastes
from local litter bins. There are recy-
cling stores run by private operators,
which sell recyclable waste to repro-
cessing companies including the so-
called ‘three non-enterprises’ (stand-
ing for: no rules for operation, no
quality standards and no inspection,
as translated from Chinese).Domes-
tic waste plastics generation, includ-
ing both industrial and post-consumer
waste, increased rapidly, and in 2011 is
almost twice that of imports. Waste
plastics collected for recycling in Chi-na (domestically recovered plastics)
can be either recycled or recovered
as energy. Estimated quantities are
shown in Figure 23 below. The quan-
tities for 2006-2009 were calculated
at an annual growth rate of 12.5%. In
addition, the value of 15Mt in 2011 is
an estimated figure (Ministry of Com-
merce in ‘ChinaReplas 2012’ confer-
ence).
Chinese local authorities have just
started to transform the tradition-
al collection system by introducing
a chain of neighbourhood collection
points. A number of recycling net-
works were built during the ‘eleventh
five-year plan’, including 41,309 col-
lection points, 226 sorting plants, 37
distribution markets and 91 regional
large-scale recovery bases.
Pronounced efforts were made in
some pilot cities obtaining a 30%
increase in recycling rates (from 40%
to 70%). The Chinese Government
published the notification of the
establishment of a complete and
advanced recycling system of wastecommodities on 31 October 201132.
In addition the Chinese reprocessing
industry is shifting towards greater
clustering and intensification. These
developments signify the potential
availability of considerably higher
amounts of domestic plastic waste.
However, such availability could only
threaten the demand for imports
when their technical recyclability is
improved, for which there is not yetsufficient evidence.
KEY FACT 12There is insufficient understanding of the fate of plastic scrap after enteringChina and consequently its implications for local and global health and theenvironment. The ‘Green Fence Operation’ has rapidly changed the import andutilization situation.

8/15/2019 Plastic Recycling ISWA 2014
http://slidepdf.com/reader/full/plastic-recycling-iswa-2014 39/66
Global recycling markets - plastic waste: A story for one player – China
What happens within China?
39
6.3 Imports of plastic waste
The import of recyclable plastics is
essential for supporting the Chinese
manufacturing industry. Although the
economic crisis disrupted the market
in 2008 and 2009, it recovered rap-
idly in 2010. Between 2006 and 2011
plastic waste imports went up sharply
from 5.86Mt to 8.38Mt respectively,
an annual growth rate of 7.4%. How-
ever, the rate of increase in China’s
imports of waste plastics is slowing,
from 21% annual growth rate in 2005
to 3.5% in 200927. Figure 21 shows the
value and amount of Chinese waste
plastics imports. Although imports of
waste plastics increased in amount
during the economic downturn, albeit
at a slower rate, the value of imports
decreased significantly resulting from
the collapse in raw material prices.
Lower prices enabled a rise of 46.5%
in imports of primary plastics and
demand for waste plastics dropped.
Consequently import values of waste
plastics rebounded rapidly in 2010.
Prices of waste plastics also picked
up after the downturn and fluctuated
moderately, except for clear PET bot-
tles. Average prices of waste plastics
imports have continued to increase
from $649 a tonne in January 2012 to
$731 a tonne in March 201233.
World exports of waste plastics to Chi-na, including the Hong Kong SAR, were
around 8400kt in 2011. The USA, Ja-
pan, Germany and UK represent more
than half world exports of waste plas-
tics to China and the Hong Kong SAR.
The USA is the largest source country,
accounting for 21% wt., followed by Ja-
pan (18% wt.), Germany (12% wt.) and
the UK (9% wt.).
Table 4 compares data published bythe UN Comtrade with those of Chi-
nese Customs. Although data for
Japan and Germany are similar, the
USA’s direct exports of waste plastics
to mainland China were much low-
er according to the Chinese Customs
register; a similar discrepancy applies
to the Hong Kong SAR. However, the
total volume of waste plastics was
similar. It is likely that waste was tran-
shipped, both via the Hong Kong SAR
and other countries, such as Thailand
and the Philippines, which appear as
significant suppliers of plastic waste
to mainland China, according to the
Chinese Customs. As the UK appears
under ‘Others’ in Table 4 the extent of
transhipment via the Hong Kong SAR
makes direct comparison of the two
data sources difficult.
Figure 21. Chinese waste plastics imports, including the Hong Kong SAR. AfterZhou2. Data source: China Customs Statistics27
6.00
6.50
7.00
7.50
8.00
8.50
1000
2000
3000
4000
5000
6000
7000
2008 2009 2010 2011
Value Million Dollars-Lef
Volume Million Tonnes-Right
Country Data Source: ChineseCustoms
Data Source: UN Com-trade
Weight (kt) % wt. Weight (kt) % wt.
Hong Kong SAR 1984 24.7 4069 50.8Japan 737 9.2 769 9.6
Thailand 802 10.0 126 1.6
Germany 669 8.3 658 8.2
The Philippines 455 5.7 90 1.1
USA 426 5.3 942 11.8
Others 2972 36.9 1356 16.9
Total 8042 100 8010 100
Table 4. Sources of waste plastics imported to China in 2010. After Zhou2.
Data source: China Customs Statistics (CCS)27
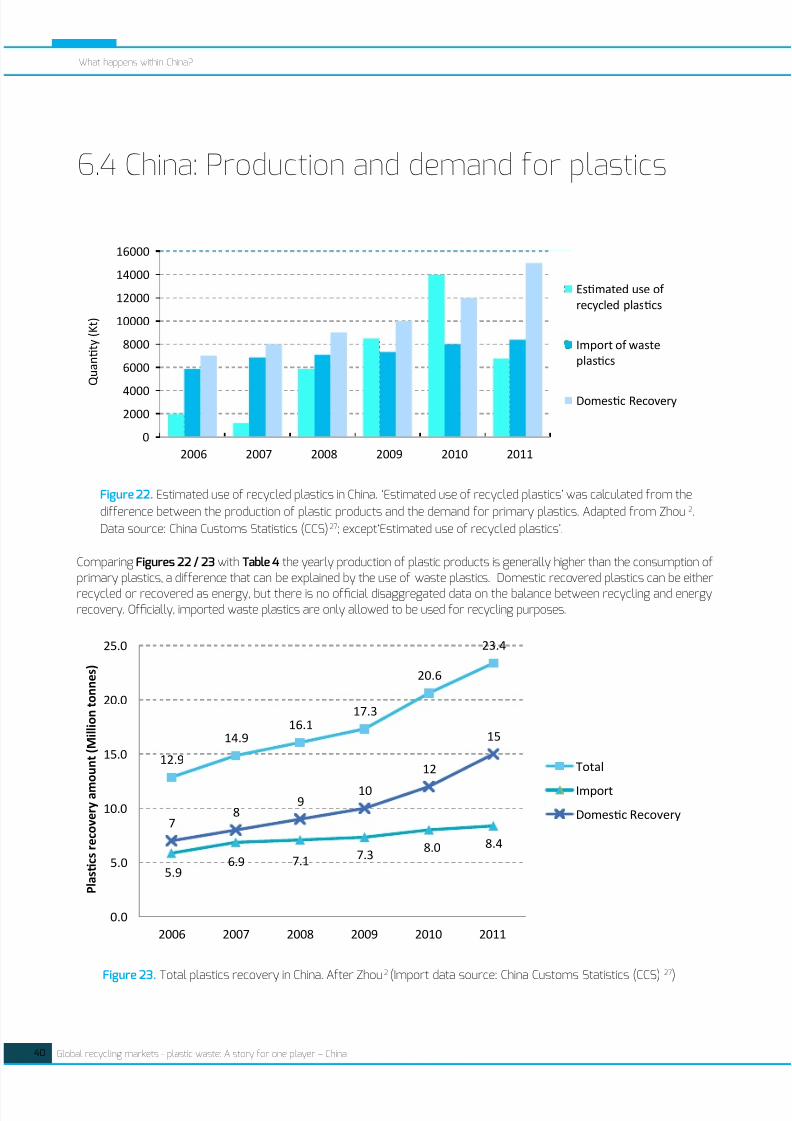
8/15/2019 Plastic Recycling ISWA 2014
http://slidepdf.com/reader/full/plastic-recycling-iswa-2014 40/66
40 Global recycling markets - plastic waste: A story for one player – China
What happens within China?
Comparing Figures 22 / 23 with Table 4 the yearly production of plastic products is generally higher than the consumption ofprimary plastics, a difference that can be explained by the use of waste plastics. Domestic recovered plastics can be either
recycled or recovered as energy, but there is no official disaggregated data on the balance between recycling and energyrecovery. Officially, imported waste plastics are only allowed to be used for recycling purposes.
6.4 China: Production and demand for plastics
Figure 22. Estimated use of recycled plastics in China. ‘Estimated use of recycled plastics’ was calculated from the
difference between the production of plastic products and the demand for primary plastics. Adapted from Zhou 2.
Data source: China Customs Statistics (CCS)27; except‘Estimated use of recycled plastics’.
0
2000
4000
6000
8000
10000
12000
14000
16000
2006 2007 2008 2009 2010 2011
Q u a n t t y ( K t )
Estmated use of
recycled plastcs
Import of waste
plastcs
Domestc Recovery
12.9
14.916.1
17.3
20.6
23.4
5.96.9 7.1
7.38.0 8.4
78
910
12
15
0.0
5.0
10.0
15.0
20.0
25.0
2006 2007 2008 2009 2010 2011
P l a s t c s r e c o v e r y a m
o u n t ( M i l l i o n t o n n e s )
Total
Import
Domestc Recovery
Figure 23. Total plastics recovery in China. After Zhou2 (Import data source: China Customs Statistics (CCS) 27)

8/15/2019 Plastic Recycling ISWA 2014
http://slidepdf.com/reader/full/plastic-recycling-iswa-2014 41/66
Global recycling markets - plastic waste: A story for one player – China
What happens within China?
41
The amount of recycled plastics used in China is as shownin Figures 22 / 23. This amount was calculated from thedifference between the production of plastic products and
the demand for primary plastics. It implies that data-setsfor the use of recycled plastics and total recovered plasticsare not mutually consistent. In 2006 and 2007 the useof recycled plastics was considerably lower (around 3-5times) than imports of waste plastics which can be partlyattributed to poor management within the waste plasticsindustry. In addition, Chinese importers tend to maintainsome stock which enables them to negotiate to purchasewaste plastics at lower market prices. This is reflected in the2010 data. Imported waste plastics are not all incorporatedinto products due to impurities, water content and a rangeof other factors. The data in Figure 22 also indicate thatrecycling of domestic waste plastics is very low, although
domestic recovered plastics were almost twice the level ofimports in 2011. Recycling of waste accounts for less than50% wt. of total recovered plastics in China. It can be inferredthat large quantities of domestic waste plastics are used forenergy production EfW rather than recycled, although datato confirm this are not available.
The 2009 report from WRAP was the most recentsystematic effort to understand the Chinese recyclingmarket. Some empirical and anecdotal information is alsoavailable from site visits to reprocessing facilities in China,such as from Moore Recycling (2008-9)10, 20, and fromVerde Recycling Solutions expertise34. Valuable insights areavailable from web seminars organised by the Associationof Postconsumer Plastic Recyclers ( http://plasticsrecycling.org/market-development/plastics-recycling-in-china-).Overall the evidence suggests that there are thousands ofreprocessors in China. The job remains low-tech and entryrequirements are very low: “Most recyclers [are] small laborintensive entrepreneurial operations using domesticallyfabricated equipment ”20. ( Furthermore as a result of thecrisis, “39% of plastic recycling businesses went out ofbusiness in China at the end of 2008 ” )10.
Most local ‘recycling stores ’ handling materials from collectionfor recycling within China are run by private operators who
buy recyclable waste and sell it on to reprocessing companies,
including the ‘three non-enterprises’. There is no guaranteeof the quality of the products made from recycled materialsby these companies. They produce large quantities of plastic
products that do not have to meet quality specifications, suchas plastic bags, disposable dishware and stationery items thatare subsequently sold to retailers at low prices. During thisperiod over 50% disposable and plastic bags in the Chinesemarket were unqualified products. It is commonly believedthat after the manufacturing of waste plastics into finishedproducts they are shipped back to Europe and the NorthAmerican Free Trade Agreement (NAFTA) region. However,this is not the case. According to the seminar hosted by theAssociation of Postconsumer Plastic Recyclers most of thefinished products containing imported plastic waste areconsumed in China, as they are of lower cost and are mainlyproduced to meet domestic demand35.
Zhou2 conducted interviews with Chinese reprocessorsto enquire whether they would source domestic wasteplastics instead of imports. They responded that there wasa “huge gap between domestic sources and foreign sourcesregarding quality ” and therefore most of them would not
consider sourcing waste plastics domestically. The prevailingperception of domestic waste plastics (those manufacturedwithin China) is that the local manufacturers tend to addconsiderably higher amounts of additives, such as cheapfluorine surfactants, thus reducing their recyclability. Eventhough indisputable evidence on this important issue is notavailable, this view is consistent with older (1999) accounts of
the situation in China. Therefore there is a clear differentiationbetween reprocessing operations based on their useor otherwise of imported waste plastics: “Two types ofrecyclers are distinguished: the ones using domestic wasteplastics and the ones using imported waste plastics. The twotypes have different characteristics. Labour productivity ofthe importing recycler is higher due to better quality inputs,scale of operation as well as the higher capital intensity ofproduction ”36. In addition many importers also re-sell wasteplastics illegally to the ‘3-non-enterprises’. With improvedmarket regulation in 2009, resale of imported waste plasticshas been effectively reduced.
KEY FACT 13Recycling of domestic waste plastics is still very low, although domesticrecovered plastics were almost twice the imports in 2011. Indirect evidence
suggests that the quality of some of the imported plastics scrap is higher thanthat obtained from domestic recycling collection schemes.

8/15/2019 Plastic Recycling ISWA 2014
http://slidepdf.com/reader/full/plastic-recycling-iswa-2014 42/66
42 Global recycling markets - plastic waste: A story for one player – China
What happens within China?
However, according to Verde Recycling Solutions, over the lastdecade, the size of many facilities has increased. Whereasmost facilities use relatively more basic processing
equipment than their equivalents in the West / North,technology levels are improving with increased use of e.g.optical sorters, bottle and flake, at several facilities in recentyears. At such facilities, it would be unusual to operateuntreated wastewater discharges or residues disposal byuncontrolled burning.
The Chinese central Government has introduced severalnew pieces of legislation in recent years related to plasticsrecycling, including regulations related to the operation ofplastics recycling facilities and the import of plastic. Thelatter sets requirements for those wishing to import plasticwaste (factory size, activities, etc.). For example, Import and
environmental regulations that pertain to plastics recyclingin China are:
• [1996]: Prohibit the importation of unprocessedscrap
• [2007]: Technical Specifications for PollutionControl during Collection and Recycle of WastePlastics
• [2009]: AQSIQ regulation No. 119• [2014]: the Green Fence Operation (GFO - see
Chapter 7) includes governmental efforts toeliminate the illegal reprocessing sector withinChina by, for example, controlling the trade ofimport licences between licensed and unlicensedfacilities37.
As Verde Recycling Solutions has experienced on theground by often site visits, over the last few years, in partlinked to such legislation, the Chinese Government has been
closing smaller factories and not renewing SEPA wasteimport licenses where there was evidence that they do notoperate to the required standard. The GFO (see Section 7)
in particular focused also on clamping down on the tradingof material between sites licensed to import plastic and thirdparty recyclers. Such an ongoing effort and in particulareffective local enforcement will be central to furtherimprovements.
Plastic products made for the domestic market from virginmaterials tend to be of low quality because manufacturersadd many cheap fluorine surfactants and additives. Wasteplastics from domestic collection are consequently oflower quality in comparison to imports, which reduces theirvalue for recycling. It can be observed from Figure 22 thatuse of recycled plastics exceeded imports in 2009 and
2010. The decline in 2011 is apparently due to the markedhigher production in 2010. Despite the current seeminglag in technological capabilities in plastics manufacturing incomparison to the best world standards, the Chinese plasticsmanufacturing sector is anticipated to capitalise to assimilatethe technological expertise created by the last two decadesby foreign direct investment in the plastics manufacturingsector 38.
There are three key points to note here:
1. Recycling of domestic waste plastics is very low al-
though domestic recovered plastics were almost twice
the level of imports in 2011. Recycling of waste plasticsonly accounts for less than 50% of total recovered
plastics in China. It can be inferred that large quantities
of waste plastics recovered in China are recovered as
energy rather than recycled although actual data are
unavailable. These waste plastics are of lower value to
Figure 24. Photos from the Moore Recycling site visits in China in 2008-9. After Moore 10

8/15/2019 Plastic Recycling ISWA 2014
http://slidepdf.com/reader/full/plastic-recycling-iswa-2014 43/66
Global recycling markets - plastic waste: A story for one player – China
What happens within China?
43
be recycled since producers tend to add many cheap flu-
orine surfactants or additives to plastic products, thus
reducing their value for recycling.
2. Chinese importers are cautious of market fluctuations
and tend to maintain some stock, which enables them to
negotiate lower market prices while purchasing. This is
also reflected in 2010 when domestic demand exceeded
their expectations.
3. Imported waste plastics are not all incorporated into
products due to impurities, water content etc.
According to a WRAP39 survey of about 100 Chinese plasticsreprocessors sourcing material from the UK, 80% of them
manufacture the waste plastics into re-compounded pellets:‘15% produced plastic fibre, 9% produced plastic film, 5%produced clean flake and 3% produced a product otherthan plastic film or fibre .’ The intermediate products arethen applied in non-food packaging (31%), agriculture (13%),textile (13%), construction (10%), automotive (1%) and others(21%), 11% of their end applications are unknown. However,end applications can only be analysed in a qualitative way asthere are no reliable official data on applications of recycledplastics.
Recycled plastics have a wide range of applications in China,and packaging and construction are the largest markets.Table 5 shows main applications of recycled plastics inChina based on data obtained from Zhou’s interviews2
and other reports40
. rPE and rPP are the major polymers
used in the packaging sector although other polymers areused to a small extent. There is a wide variety of recycledpolymers used in construction market but rPVC accountsfor the largest proportion. Others include vehicles, electricalappliances, everyday items etc. but it is difficult to identifythe polymers used in these applications due to the diversityof products.
Imported waste PE comes mainly from packaging waste, andrHDPE and rLDPE account for the majority. rHDPE is appliedin buckets, recycling bins, bottles, pipes etc., and rLDPE ismainly applied in films. In the north of China, rLDPE is oftenused in agricultural film, and in the south it may be used invarious applications such as packaging and shoes. Recycling
facilities of waste PE have an extensive distribution acrossthe south, north and east China40.
Imported waste PS comes mainly from toys, plastic cutlery,packaging, tapes etc., and most of rPS is applied in housewaressuch as hangers and coasters and construction materialssuch as flooring, insulation board and frames, or modifiedHIPS. Recycling facilities for waste PS are concentrated insouthern China40. Imported waste PVC mainly comes fromcontainers, electrical and electronic appliances, pipes and
construction materials. Rigid PVC is in high demand for theconstruction market. Recycled plastics are used for 60%-70% of drainage pipes and 100% of sewage pipes 15. FlexiblePVC may be used in shoes etc. Most of the recycling facilities
are located in southern China.
Table 5. Chinese plastics production and types of plastic products (thousand tonnes). Data sources: China Statistical
Database28,a; China Customs Statistics (CCS)27,b; IRR 29c; China Economic Information Network (CEIn)30,d; Liao31,e)
Applications Recycled Polymer Typical Products
Packaging PE Bottles, buckets, bins, salvers, films
PP Bags, trays, recycling bins
Construction PVC Floors, pipes, panels, tubes, cables, window and door profiles, warninglabels, binders
PE Fences, pipes
PS Flooring, insulation boards and frames
PP Pipes
Others PET Clothes, bedding, blanketsPS Hangers, pencil boxes
PP Automotive battery cases
SAN, ABS, PC & etc. Car parts, wood-plastic composites

8/15/2019 Plastic Recycling ISWA 2014
http://slidepdf.com/reader/full/plastic-recycling-iswa-2014 44/66
44 Global recycling markets - plastic waste: A story for one player – China
What happens within China?
Imported waste PET comes mainly from the USA, Germany,Japan, Thailand, Mexico, Korea and Taiwan, and recyclingfacilities are concentrated in eastern China, especially
Zhejiang and Jiangsu (Zhang, 2012). Remanufacturing ofrPET has a vibrant and well-developed end market in Chinasince PET bottles have been collected for recycling in Chinafor decades. “Most of recycled PET bottles are convertedinto fibre, primarily spun yarn. Some are used for non- woven fibres, filament fibres and fibrefill. A number ofthe amber and green bottles are converted back into non- food bottles, and some non-bottle PET is used in paintsand wood varnishes ”41. rPET converted to fibre are mainly
manufactured into bedding, clothes, blankets etc.40. Importedwaste PP mainly comes from the mixed plastics streamand is remanufactured into hangers, pipes, trays, battery
cases for cars etc.
40
. Recycling of mixed plastics is muchmore complicated than for single variety products. PP, asthe predominant polymer in mixed plastic waste is handseparated from other materials, mechanically recycled(ground, shredded, washed and melted) into pellets or flake.The remaining mixed plastics are often baled and sent to asecondary buyer and are subjected to a similar secondaryseparation by polymer and colour, ending up in productssuch as “floor tiles, shoe soles, vinyl fabric, flower pots ” etc.41.

8/15/2019 Plastic Recycling ISWA 2014
http://slidepdf.com/reader/full/plastic-recycling-iswa-2014 45/66
Global recycling markets - plastic waste: A story for one player – China 45
7.1 Chinese administration imposes stricterenforcement of waste imports rules
7. Crisis time: the ChineseGreen Fence Operation
KEY FACT 14Quality controls implemented by China’s customs upset the entire globalmarket having direct and rapidly felt upstream implications for the domesticreprocessing and waste management industries of the Western/Northernexporting countries. This demonstrates the fragility of the current globalrecycling system which operates in the absence of sufficient domestic demand,lack of advanced reprocessing capacity and absence of low contamination singlepolymer collection schemes. And the determination of the Chinese authorities
to improve the overall sustainability of their use of secondary resources.
Figure 25. Waste plastic bales stockpiled
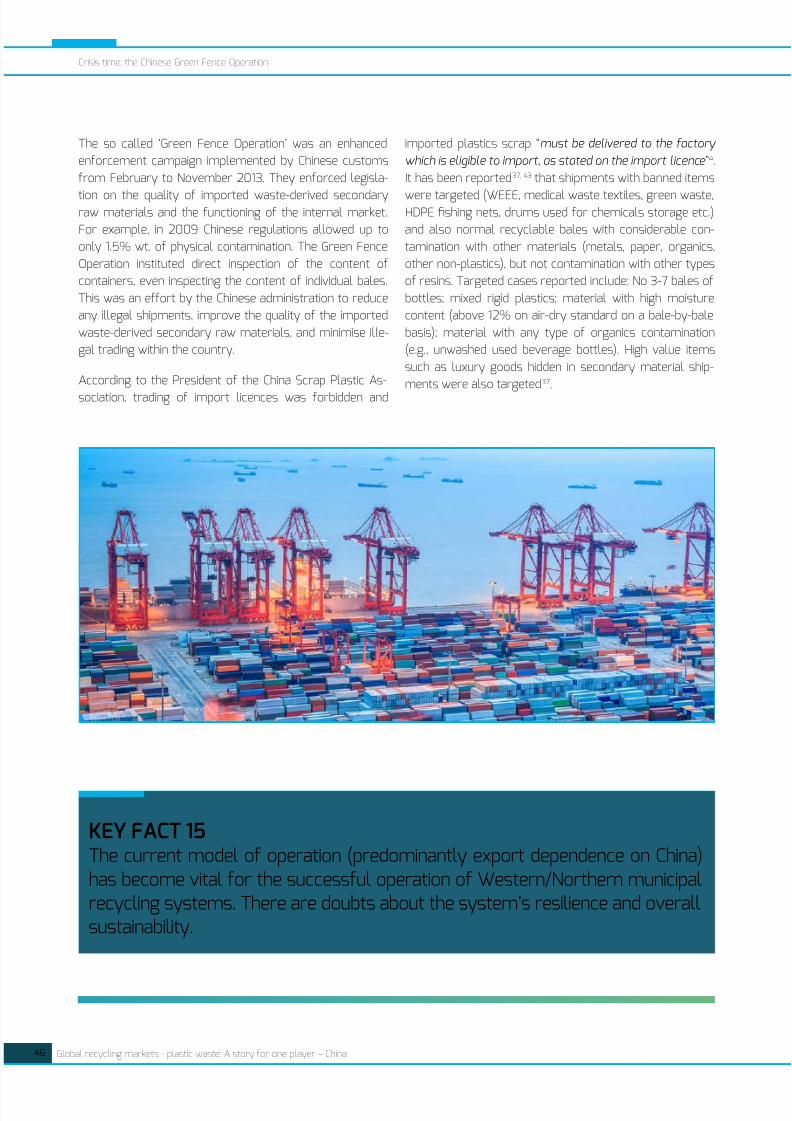
8/15/2019 Plastic Recycling ISWA 2014
http://slidepdf.com/reader/full/plastic-recycling-iswa-2014 46/66
46 Global recycling markets - plastic waste: A story for one player – China
Crisis time: the Chinese Green Fence Operation
The so called ‘Green Fence Operation’ was an enhanced
enforcement campaign implemented by Chinese customs
from February to November 2013. They enforced legisla-
tion on the quality of imported waste-derived secondaryraw materials and the functioning of the internal market.
For example, in 2009 Chinese regulations allowed up to
only 1.5% wt. of physical contamination. The Green Fence
Operation instituted direct inspection of the content of
containers, even inspecting the content of individual bales.
This was an effort by the Chinese administration to reduce
any illegal shipments, improve the quality of the imported
waste-derived secondary raw materials, and minimise ille-
gal trading within the country.
According to the President of the China Scrap Plastic As-
sociation, trading of import licences was forbidden and
imported plastics scrap “must be delivered to the factory
which is eligible to import, as stated on the import licence ”4.
It has been reported37, 43 that shipments with banned items
were targeted (WEEE, medical waste textiles, green waste,HDPE fishing nets, drums used for chemicals storage etc.)
and also normal recyclable bales with considerable con-
tamination with other materials (metals, paper, organics,
other non-plastics), but not contamination with other types
of resins. Targeted cases reported include: No 3-7 bales of
bottles; mixed rigid plastics; material with high moisture
content (above 12% on air-dry standard on a bale-by-bale
basis); material with any type of organics contamination
(e.g., unwashed used beverage bottles). High value items
such as luxury goods hidden in secondary material ship-
ments were also targeted37.
KEY FACT 15The current model of operation (predominantly export dependence on China)has become vital for the successful operation of Western/Northern municipalrecycling systems. There are doubts about the system’s resilience and overallsustainability.

8/15/2019 Plastic Recycling ISWA 2014
http://slidepdf.com/reader/full/plastic-recycling-iswa-2014 47/66
Global recycling markets - plastic waste: A story for one player – China
Crisis time: the Chinese Green Fence Operation
47
7.2 Green Fence Operation impacts on the global
waste plastics recycling market
Figure 26. New PE reprocessing capacity built the last decade around the world. After Resource
Recycling, as cited by Gwynn48
There is evidence from all around that the world thatthe Green Fence Operation has affected export marketsand impacted immediately upon the entire value chainof waste plastics. The effect on the exporting countriesand businesses has been direct as reported in ResourceRecycling43: “Inspections slow down port operations,shippers are now seeing rising demurrage costs as theypay ports to hold containers until they are inspected ”.Apparently many thousands of tonnes of all types of waste
have been blocked. For example, more than 0.8Mt of illegalwaste shipments have been intercepted, according to thecustoms agency, as reported in June 201345. Containers havebeen returned at a high cost (e.g. $2,000 to the US). Largeexporters in the USA started implementing more rigorousinspections in the countries of origin “before the containersare delivered to the port for shipping ”. Reprocessors startedrejecting bales with material that was acceptable before theonset of the crisis. Local recyclers in the USA and Canadahad material pilling up, with mixed plastic bales “ just notmoving ”. This resulted in extra costs and efforts for therecycling companies who had to hire more personnel andeverything slowed down.
According to representatives of various related companiesand associations, German and Dutch have experiencedreductions in export volumes; French companies, haddifficulties in timely payments; and oversupply of plasticsscrap was evident in the US4. Disruption of exports
impacted on the collection for recycling systems. Thereare indications that tipping fees for these materials havebeen increased in Canada, and in the US prices for somerecovered materials declined by mid-April, which may havebeen a side-effect of the crisis: a price reduction of up 15%was reported4. In the UK, the Green Fence Operation wasdeemed as responsible for the shortfall in the availability ofpackaging export recovery notes (PERNs) which are part ofthe UK’s waste packaging regulations. As a result, regulatory
compliance for waste plastic producers has become muchmore expensive. It is currently debated “whether therehas been too much of a reliance in the overseas recyclingof plastics ”46. The plastic scrap exported to China fromthe UK experienced a drop from around 27Kt per monthbefore the Green Fence Operation to an average of 17Kt permonth during its 10 month operation37, and experienced anabrupt fall in May to June 2013, but recovered from Juneto November 2013.
The potential negative effects on the domestic reprocessingcapacity in the UK resulting from the overdependence on
exports to China to meet recycling targets had also beencriticised at the time of a previous financial crisis47. Atthat time (2007) the absolute amounts exported whereconsiderably lower (See Figure 11).

8/15/2019 Plastic Recycling ISWA 2014
http://slidepdf.com/reader/full/plastic-recycling-iswa-2014 48/66
48 Global recycling markets - plastic waste: A story for one player – China
Crisis time: the Chinese Green Fence Operation
Currently, it appears that domestic markets are not preparedto absorb the increased supply as they have become increas-ingly dependent on the Chinese market as their key outlet.
There is not enough reprocessing capacity (indicatively, verylimited new reprocessing PE capacity has been built in NorthAmerica since 200148 – see Figure 27) and despite the factthat that some MRFs operate well below their capacity theymay not be equipped to produce materials suitable for thespecifications required. Some argue that the problematiclevels of contamination are a direct outcome of the co-min-gled (UK) or singed stream (USA) collection of dry recycla-bles and of underinvestment in advanced sensor-based sort-ing (such as NIR; X-ray fluorescence; infrared spectroscopy;electrostatics) in MRFs. It could be argued that the depend-ence on exporting to China has hindered the development ofdomestic reprocessing and manufacturing in the Western/
Northern countries and that it determined the mode of MSWcollection (co-mingled) which results in streams of recycla-bles more difficult to process to high quality secondary rawmaterials.
There have been cases of traders which responded to theGreen Fence Operation by increasingly selling their plasticscrap to countries that could accommodate for additionalsorting and cleaning, serving as an intermediate processingstep to meet the standards before selling to China45. Coun-tries mentioned are part of the ASEAN: Vietnam, Indonesia,and Malaysia. There is evidence that ASEAN countries had
even before the current crisis been serving as a processingstop for plastics on route to the final destination of China(See Section 4.6). However, possibly the current processingcapacity of ASEAN countries is too small to absorb all there-directed flows, and strict import prohibitions often al-ready exist for mixed recyclates (e.g. Malaysia). There is no
evidence that ASEAN countries are prepared in the long termto accept material of inferior quality that would have beenrejected by China.
In a move that coincided with China’s Green Fence Opera-tion, the UK Government proposed increasing controls onexport of waste from the UK (Transfrontier Shipment ofWaste (Amendment) regulations 2013)49. These overall EUand specific UK tighter controls are due to be implementedlater in 2014. This development enjoys the support of the re-processing sector as there are fears that shipments of poorquality of plastics and paper have been exported as ‘greenlist’ waste in an effort to avoid paying the considerable land-fill tax that applies in the UK (currently at £80 per tonne ofMSW). The increased enforcement cost is anticipated to re-sult in increased export and import fees, but is thought nec-
essary due to the considerable growth in waste exports vol-ume in the recent years (see Section 3.2 – and Figure 11). Atthe same time, according to Bradney37 the UK exporters payincreased attention to the fate of the material after enteringChina, in an effort to ensure that “recycling process is viable,safe and there is a low risk of pollution to the environment ”.
There may be additional reasons other than lack of repro-cessing capacity that limit the development of domesticmarkets. For example, in the UK, a complex system of ad-ministrative certification is operated (Packaging RecoveryNote - PRN obligation) which has been criticised as encour-
aging exports. A recent study revealed that of the 38% ofthe reprocessors that are not using waste plastics50 for 37%it is due to reliability of supply; for 32% it is due to clientspecification; for 15% it is due to cost and for 15% it is due todifficulty in processing.
Hongkong - China border in Shenzhen city : Custom’s office .
Photo BartlomiejMagierowski / Shutterstock.com

8/15/2019 Plastic Recycling ISWA 2014
http://slidepdf.com/reader/full/plastic-recycling-iswa-2014 49/66
Global recycling markets - plastic waste: A story for one player – China
Crisis time: the Chinese Green Fence Operation
49
7.3 Possible long-term responses to the Green
Fence Operation crisis?The 2013 crisis generated considerable debate in the main
exporting countries. Although the official enforcement of
the Green Fence Operation had been completed in November
2013 there was the expectation that the new enforcement
standards achieved might be maintained in the longer term.
Many mid-term scenarios / solutions have been proposed
by Plumer42 as possible responses to this new situation.
These are summarised and further commented on below:
• Quality vs. Quantity: Chinese manufacturers relyon the imported plastic scrap, hence the restric-
tions will have to be relaxed after some months.
There have been indications of a conflict of inter-
est within the Chinese economy over the impact
of the Green Fence initiative on business. The
President of the China Scrap Plastic Association
recently explained that the internal impact was
that manufacturing companies relying on scrap
or reclaimed plastics were often forced to replace
them with more expensive raw materials, result-
ing in less price competitive products4
.
• Other import destinations could compensate for
China. Another proposed solution is to ship to in-
termediate countries e.g. ASEAN and have the ma-
terial (manually) sorted and upgraded there. But
these solutions seem highly speculative as there
are no market needs or there are prohibitions in
place (see Section 6).
• Export countries will be able to produce less con-
taminated secondary materials (for export or
not). Assuming all was indeed exported for recy-cling and not illegal disposal, there may be ways to
improve this. But current collection systems and
reprocessing capacities within the export coun-
tries may not necessarily be capable of achieving
this quality target in the short term. Notwithstand-
ing this, the UK for example has recently devel-
oped significant capacity for plastics closed-loop
recycling (4 plants). A specific plant in Dagenham,
London, capable of processing up to 35Ktpa of
waste plastic bottles discarded PET soft drinks
and water bottles and HDPE milk bottles are re-
processed back into food-grade plastic51. The
investment on local / regional collection and re-
processing of high added value clean material ca-
pable of multiple material life-cycles may be the
most effective way forward.
• Export countries will recycle less resorting to
more energy recovery (direct or via SRF) or sim-
ply dispose of in landfills. However certain coun-
tries, for example many European Union Member
States, impose a total ban or severe restrictions
on landfill disposal along with strong relevant fi-
nancial disincentives, some having already almost
phased out landfill disposal of used plastics (See
Figure 1).

8/15/2019 Plastic Recycling ISWA 2014
http://slidepdf.com/reader/full/plastic-recycling-iswa-2014 50/66
50 Global recycling markets - plastic waste: A story for one player – China
8.1 General concerns for plastics recycling underpoor environmental control capacity and lawenforcement
8. Environmental and healthconsiderations
The academic and technical solid waste management com-munity has expressed concerns about the implication of
global shipments of waste materials because sometimes
the boundary line between export of recyclables and waste
trafficking becomes unclear. As Kamuk and Hansen52 put it
“Global recycling – waste trafficking in disguise? ” Indeed, ac-
cording to Bilitewski, the circular economy is not free from
environmental and public health risks53; and the globalised
trade part of it means that that by transporting materials
we are also transferring risks for their correct manage-
ment, Velis and Brunner remind us54. However, these risks
do not only apply to wastes or secondary raw materials
but also to all materials traded worldwide and to the in-ter-related off-shoring of production lines.
The local reprocessing / manufacturing enterprises have
been criticised by the China Scrap Plastics Association for
not adhering to environmental protection standards “Thewaste water, waste gas, and rubbish at processing centres
have created a serious environmental problem due to theinsufficient implementation of environmental policy.”55.
Examples of such situations on the ground were recently
described in a documentary of the German televising ZDF,
focusing in the over 5000 recycling facilities in the provinceof Shandong 56.
There is a long list of potential environmental and health57
concerns in relation to plastics manufacturing, use and im-proper disposal; these may be also poorly handled during
the globalised flows of plastic scrap. The principal concerns
are:
• Potential excessive and uncontrolled use of
additives during manufacturing: often employed
to compensate for the low quality grades used as
raw materials: Indicatively, use of toxic plasticisers
e.g. DEHP in PVC flooring58; and59 phthalates and
adipates; polycarbonates components: bishpenol
A (BPA)60; poly-brominated flame retardants61, 62,
such as PDBA; heavy metals, fluorine surfactants;transition metals for oxo-degradable plastics)
leading to human exposure and environmental
dispersion. For example, in India, the non-
mandatory guidelines (‘BIS’) regarding the use of
phthalates has been criticised for not introducing
limits for phthalates in products that may come in
contact with children (toys and childcare goods)63.
The miscibility of plastics during recycling is
a limiting factor – for example, on casings
of LCD screens64, often resulting in need for
compatibilisers.
• Health and safety risk for workers reprocessing
plastic scrap, which can be exacerbated if the
KEY FACT 16The important concerns expressed in relation to environment and healthaspects of the international plastic scrap trade have not been systematicallyexplored sufficiently to be verified or dismissed.

8/15/2019 Plastic Recycling ISWA 2014
http://slidepdf.com/reader/full/plastic-recycling-iswa-2014 51/66
Global recycling markets - plastic waste: A story for one player – China
Environmental and health considerations
51
appropriate preventive procedures are not inplace. Indicatively during re-melting for plastics
manufacturing volatile organic compounds (VOCs)
are emitted65, from “… compounds originating
from polymer degradation, the compoundsoriginating from the plastic additives … and likely
originating from contaminant inseparate polyvinylchloride (PVC), food residues, cleaning agents,degreasers, and so on were detected from the
waste plastic. Thus, melting waste plastics, as isconducted in recycling facilities, might generate
larger amounts of potentially toxic compoundsthan producing virgin plastics.” In the case of burnt
plastics the fumes contain hydrogen cyanide,
hydrogen chloride and isocyanate; and where BFRs
are used the environmental risk is greater due to
the burning of the retardant66. Because “During
the plastic manufacturing, toxic products can
enter the working environment due to the plastic
heating” screening procedures that perform
environmental analysis and risk assessment
are necessary to “define if workers’ risk level isacceptable or not” 67 . Exposure of workers to
styrene during plastics manufacturing68 revealed
“statistically significant difference between theexposed and the control groups as regard the
blood styrene level, urinary mandelic acid level,β2 microgloblin in urine, and chromosomal study.
The study also showed a statistically significant
correlation between the duration of styreneexposure and ventilatory function parameters,
also between the duration of styrene exposureand some detectable chromosomal aberrations.”
• Local / regional environmental degradation by
reprocessing under poor emission control, and
unsound disposal of rejects / residues.
• Health and safety of informal sector recyclers,
salvaging secondary plastic.
• Uncontrolled or unsuitable disposal of theplastic scrap in the destination countries (landfill
disposal, dumping, burning, energy recovery under
lower environmental standards, littering), which is
prohibited by many export / import national laws.
• Global environmental implications (e.g. CO2 and
other emissions) of using highly non-biogenic non-
renewable energy sources; and trans-boundary
container shipment: which may be beneficial by
utilising the free container vessel capacity when
returning to countries of manufacturing, such as
China.
• Impeding the development of domestic resource
efficient solutions, by dependence on export,
which could maximise resource recovery under
environmentally sound conditions.
KEY FACT 17The global trade of recyclables is fuelling real local industrial demand.But, at best it also transports potentially polluting compounds and therisk and liability to manage these reliably. Waste trafficking is the oth-er end of the spectrum of waste trans-boundary movement.
International collaboration and checks at both export and import pointsare necessary to guarantee free trade of valuable waste-derived com-modities, without endangering public and occupational health. Weak
links in this chain should be identified and eliminated.
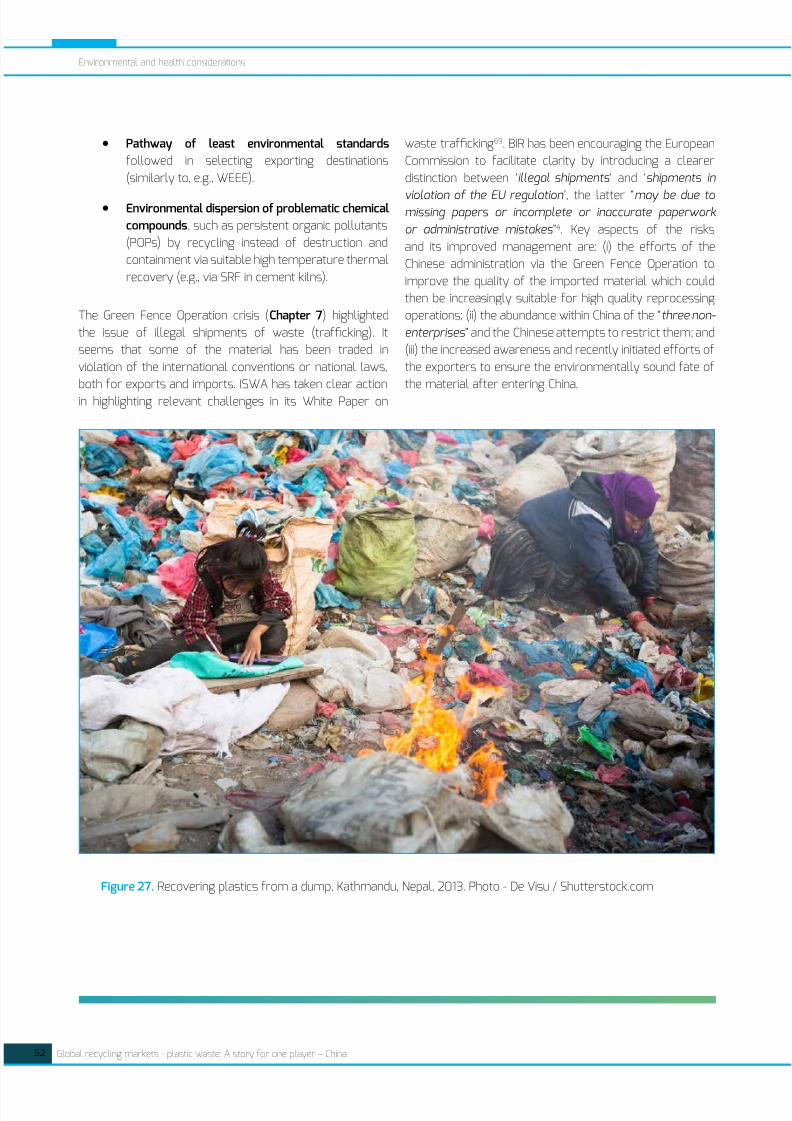
8/15/2019 Plastic Recycling ISWA 2014
http://slidepdf.com/reader/full/plastic-recycling-iswa-2014 52/66
52 Global recycling markets - plastic waste: A story for one player – China
Environmental and health considerations
• Pathway of least environmental standards
followed in selecting exporting destinations
(similarly to, e.g., WEEE).
• Environmental dispersion of problematic chemical
compounds, such as persistent organic pollutants
(POPs) by recycling instead of destruction and
containment via suitable high temperature thermal
recovery (e.g., via SRF in cement kilns).
The Green Fence Operation crisis (Chapter 7) highlighted
the issue of illegal shipments of waste (trafficking). It
seems that some of the material has been traded in
violation of the international conventions or national laws,
both for exports and imports. ISWA has taken clear action
in highlighting relevant challenges in its White Paper on
waste trafficking69. BIR has been encouraging the European
Commission to facilitate clarity by introducing a clearer
distinction between ‘illegal shipments ’ and ‘shipments in
violation of the EU regulation ’, the latter “may be due tomissing papers or incomplete or inaccurate paperwork
or administrative mistakes ”4. Key aspects of the risks
and its improved management are: (i) the efforts of the
Chinese administration via the Green Fence Operation to
improve the quality of the imported material which could
then be increasingly suitable for high quality reprocessing
operations; (ii) the abundance within China of the “three non-
enterprises ” and the Chinese attempts to restrict them; and
(iii) the increased awareness and recently initiated efforts of
the exporters to ensure the environmentally sound fate of
the material after entering China.
Figure 27. Recovering plastics from a dump, Kathmandu, Nepal, 2013. Photo - De Visu / Shutterstock.com
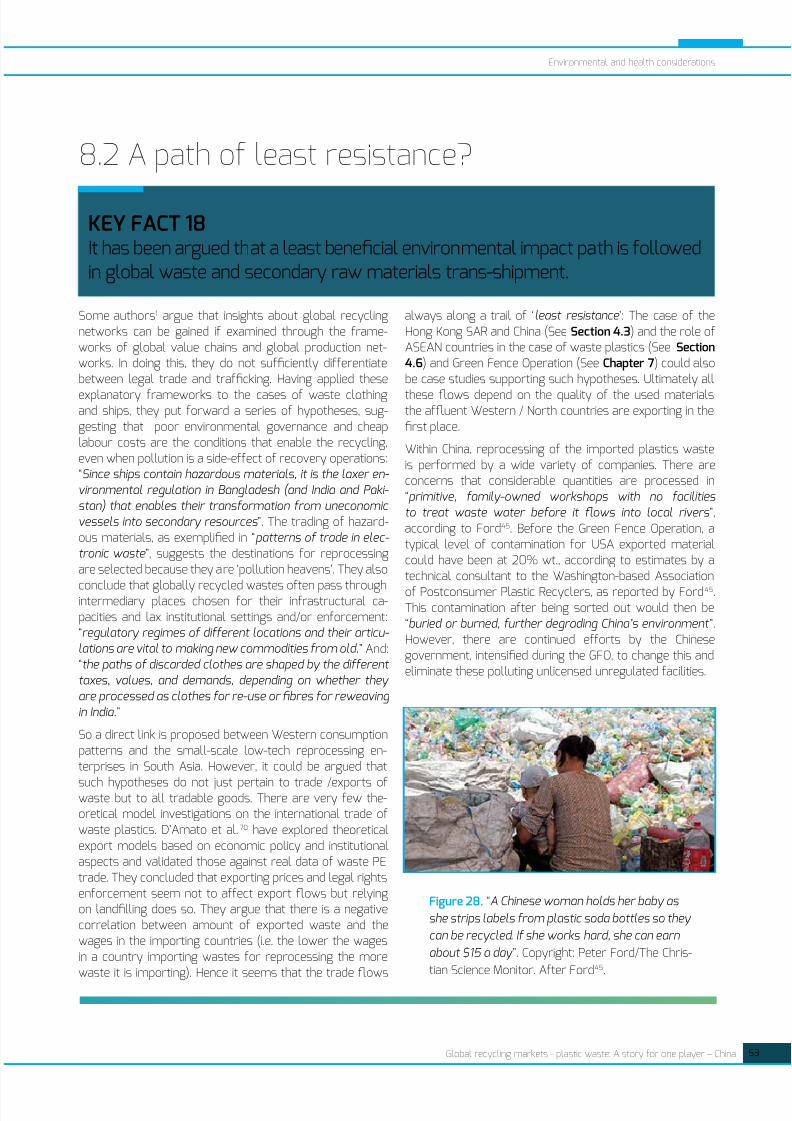
8/15/2019 Plastic Recycling ISWA 2014
http://slidepdf.com/reader/full/plastic-recycling-iswa-2014 53/66
Global recycling markets - plastic waste: A story for one player – China
Environmental and health considerations
53
8.2 A path of least resistance?
KEY FACT 18It has been argued that a least beneficial environmental impact path is followedin global waste and secondary raw materials trans-shipment.
Some authors1 argue that insights about global recyclingnetworks can be gained if examined through the frame-works of global value chains and global production net-works. In doing this, they do not sufficiently differentiatebetween legal trade and trafficking. Having applied these
explanatory frameworks to the cases of waste clothingand ships, they put forward a series of hypotheses, sug-gesting that poor environmental governance and cheaplabour costs are the conditions that enable the recycling,even when pollution is a side-effect of recovery operations:“Since ships contain hazardous materials, it is the laxer en- vironmental regulation in Bangladesh (and India and Paki- stan) that enables their transformation from uneconomicvessels into secondary resources ”. The trading of hazard-ous materials, as exemplified in “patterns of trade in elec- tronic waste ”, suggests the destinations for reprocessingare selected because they are ‘pollution heavens’. They also
conclude that globally recycled wastes often pass throughintermediary places chosen for their infrastructural ca-pacities and lax institutional settings and/or enforcement:“regulatory regimes of different locations and their articu- lations are vital to making new commodities from old.” And:“the paths of discarded clothes are shaped by the differenttaxes, values, and demands, depending on whether theyare processed as clothes for re-use or fibres for reweavingin India.”
So a direct link is proposed between Western consumptionpatterns and the small-scale low-tech reprocessing en-terprises in South Asia. However, it could be argued that
such hypotheses do not just pertain to trade /exports ofwaste but to all tradable goods. There are very few the-oretical model investigations on the international trade ofwaste plastics. D’Amato et al.70 have explored theoreticalexport models based on economic policy and institutionalaspects and validated those against real data of waste PEtrade. They concluded that exporting prices and legal rightsenforcement seem not to affect export flows but relyingon landfilling does so. They argue that there is a negativecorrelation between amount of exported waste and thewages in the importing countries (i.e. the lower the wagesin a country importing wastes for reprocessing the morewaste it is importing). Hence it seems that the trade flows
always along a trail of ‘least resistance ’: The case of theHong Kong SAR and China (See Section 4.3) and the role ofASEAN countries in the case of waste plastics (See Section4.6) and Green Fence Operation (See Chapter 7) could alsobe case studies supporting such hypotheses. Ultimately all
these flows depend on the quality of the used materialsthe affluent Western / North countries are exporting in thefirst place.
Within China, reprocessing of the imported plastics wasteis performed by a wide variety of companies. There areconcerns that considerable quantities are processed in“primitive, family-owned workshops with no facilitiesto treat waste water before it flows into local rivers ”,according to Ford45. Before the Green Fence Operation, atypical level of contamination for USA exported materialcould have been at 20% wt., according to estimates by atechnical consultant to the Washington-based Association
of Postconsumer Plastic Recyclers, as reported by Ford45.This contamination after being sorted out would then be“buried or burned, further degrading China’s environment ”.However, there are continued efforts by the Chinesegovernment, intensified during the GFO, to change this andeliminate these polluting unlicensed unregulated facilities.
Figure 28. “A Chinese woman holds her baby as
she strips labels from plastic soda bottles so theycan be recycled. If she works hard, she can earn
about $15 a day ”. Copyright: Peter Ford/The Chris-
tian Science Monitor. After Ford45.
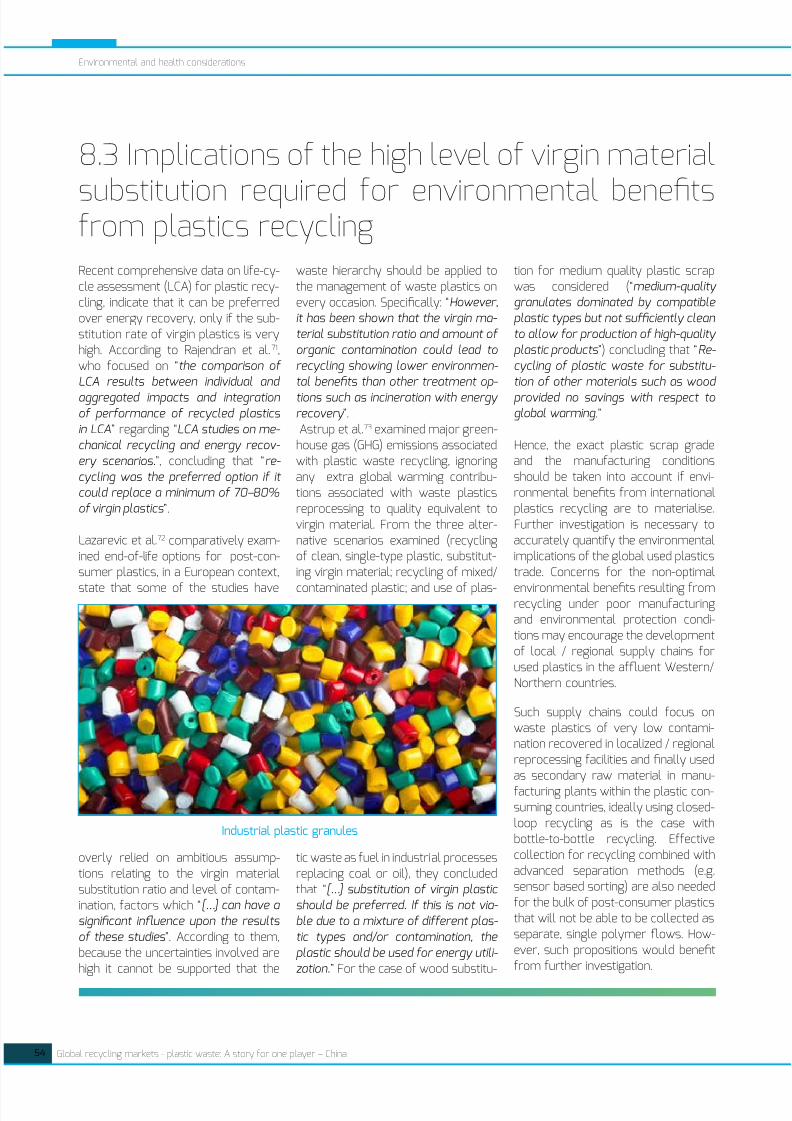
8/15/2019 Plastic Recycling ISWA 2014
http://slidepdf.com/reader/full/plastic-recycling-iswa-2014 54/66
54 Global recycling markets - plastic waste: A story for one player – China
Environmental and health considerations
8.3 Implications of the high level of virgin material
substitution required for environmental benefitsfrom plastics recyclingRecent comprehensive data on life-cy-cle assessment (LCA) for plastic recy-cling, indicate that it can be preferredover energy recovery, only if the sub-stitution rate of virgin plastics is veryhigh. According to Rajendran et al.71,who focused on “the comparison ofLCA results between individual and
aggregated impacts and integrationof performance of recycled plasticsin LCA” regarding “LCA studies on me- chanical recycling and energy recov- ery scenarios.”, concluding that “re- cycling was the preferred option if itcould replace a minimum of 70–80%of virgin plastics ”.
Lazarevic et al.72 comparatively exam-ined end-of-life options for post-con-sumer plastics, in a European context,
state that some of the studies have
overly relied on ambitious assump-tions relating to the virgin materialsubstitution ratio and level of contam-ination, factors which “[…] can have asignificant influence upon the resultsof these studies ”. According to them,because the uncertainties involved arehigh it cannot be supported that the
waste hierarchy should be applied tothe management of waste plastics onevery occasion. Specifically: “However,it has been shown that the virgin ma- terial substitution ratio and amount oforganic contamination could lead torecycling showing lower environmen- tal benefits than other treatment op-
tions such as incineration with energyrecovery ”. Astrup et al.73 examined major green-house gas (GHG) emissions associatedwith plastic waste recycling, ignoringany extra global warming contribu-tions associated with waste plasticsreprocessing to quality equivalent tovirgin material. From the three alter-native scenarios examined (recyclingof clean, single-type plastic, substitut-ing virgin material; recycling of mixed/
contaminated plastic; and use of plas-
tic waste as fuel in industrial processesreplacing coal or oil), they concludedthat “[…] substitution of virgin plasticshould be preferred. If this is not via- ble due to a mixture of different plas- tic types and/or contamination, theplastic should be used for energy utili- zation.” For the case of wood substitu-
tion for medium quality plastic scrapwas considered (“medium-qualitygranulates dominated by compatibleplastic types but not sufficiently cleanto allow for production of high-qualityplastic products ”) concluding that “Re- cycling of plastic waste for substitu- tion of other materials such as wood
provided no savings with respect toglobal warming .”
Hence, the exact plastic scrap gradeand the manufacturing conditionsshould be taken into account if envi-ronmental benefits from internationalplastics recycling are to materialise.Further investigation is necessary toaccurately quantify the environmentalimplications of the global used plasticstrade. Concerns for the non-optimal
environmental benefits resulting fromrecycling under poor manufacturingand environmental protection condi-tions may encourage the developmentof local / regional supply chains forused plastics in the affluent Western/Northern countries.
Such supply chains could focus onwaste plastics of very low contami-nation recovered in localized / regionalreprocessing facilities and finally usedas secondary raw material in manu-facturing plants within the plastic con-suming countries, ideally using closed-loop recycling as is the case withbottle-to-bottle recycling. Effectivecollection for recycling combined withadvanced separation methods (e.g.sensor based sorting) are also neededfor the bulk of post-consumer plasticsthat will not be able to be collected asseparate, single polymer flows. How-ever, such propositions would benefitfrom further investigation.
Industrial plastic granules
8/15/2019 Plastic Recycling ISWA 2014
http://slidepdf.com/reader/full/plastic-recycling-iswa-2014 55/66
Global recycling markets - plastic waste: A story for one player – China 55
KEY FACT 19The market can be easily disrupted because it depends on many industrialsectors, the heavily regulated waste sector and the oligopsony of China.
9. Challenges fortrans-boundary trade
The international trade in used plastic is a complex oper-
ation (see Key market factors - Section 3.4) which can be
threatened by many factors. These include:
• Prohibitions relating to export, transfer, and import of
waste / secondary raw materials. For example, EU legis-
lation prohibits the export for disposal. Certain countries
(Malaysia, India, Middle East, China for mixed plastics)
have recently introduced laws banning the imports of
certain loads of plastic scrap, based on its mixed or con-
taminated nature.• Oligopsony conditions (China main global importer) cre-
ate conditions for easy market disruption, as occurred
during the price fall for secondary raw materials during
the 2008-9 financial crisis (Quarter 4 of 2008) and the
2013 Green Fence Operation (see Chapter 8).
• Complex logistics, often based on ‘reverse haulage’, re-
quiring specialised services of forwarders (stuffing, dis-
tribution, customs clearance).
• Inconsistency of plastic container loads sought by shipping
lines resulting in budgeting difficulties and uncertainty.
• Susceptibility to virgin raw materials and fuel cost fluc-
tuations.
• Competition for quality secondary raw materials (e.g.
clean single resins, such as food-contact suitable PET
which is also locally increasingly recovered in Northern/
Western countries bottle to bottle schemes).
• Difficulty to guarantee quality of waste-derived materials
shipped from the export countries.
• Material quality information asymmetry between buyers
and sellers – lack of transparency at various points of
supply chain (e.g. info on reprocessing facilities licencing,
auditing etc.).

8/15/2019 Plastic Recycling ISWA 2014
http://slidepdf.com/reader/full/plastic-recycling-iswa-2014 56/66
56 Global recycling markets - plastic waste: A story for one player – China
10.1 China is changing
10. Future outlook - trends -questions
As the biggest importer worldwide, China is of obvious im-
portance. Experts such as Verde Recycling Solutions, Moore
Recycling, and Resource Recycling have speculated based
on existing trends:
• Manufacturing is likely to remain strong in China,but may change as result of the growing domestic
demand and improved GDP.
• China will focus more on importing quality sec-
ondary materials and manufacturing products of
higher added value, eliminating unlicensed repro-
cessing facilities, meeting environmental specifi-
cations, and occupational health and safety con-
ditions.
• Self-sufficiency form domestic recycling schemes
will increase.
• But investment by China in raw material produc-
tion elsewhere, such as in Asia and Africa, and an
increase of westbound freight rates may change
the scene. Similarly, some of the manufacturing
may be returned to the Western/ Northern coun-
tries – as was the case of a plastic toy assembly
line moving from China to the USA74.
• The US National Association of manufacturers
believes that the challenge posed to the US has
peaked and the China’s competitive advantage is
in decline.
• But local demand may be high enough so that
strong need for import persists.
• Governmental support to imports is likely to con-
tinue due to direct and indirect benefits (employ-
ment, preserving raw material reserves, tax rev-
enues).
• Nearby recycling markets may emerge: India, Ma-
laysia, Indonesia and Vietnam.
Modern drinks production plant in China
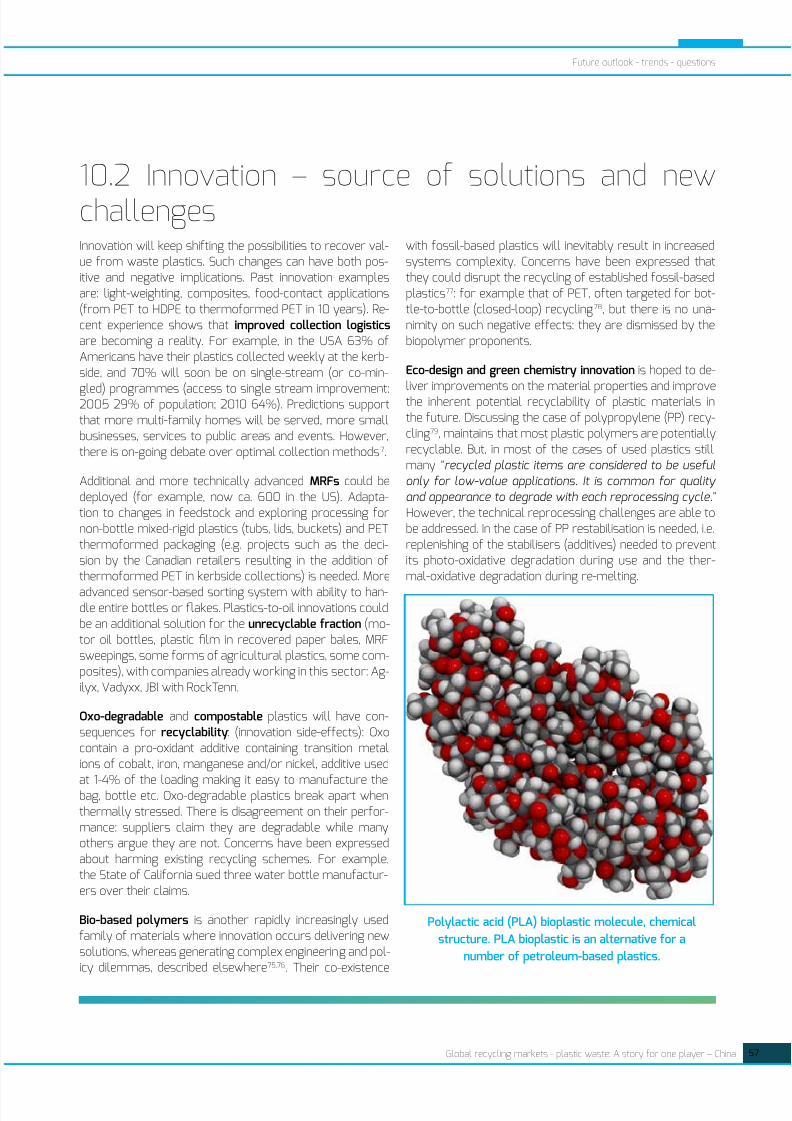
8/15/2019 Plastic Recycling ISWA 2014
http://slidepdf.com/reader/full/plastic-recycling-iswa-2014 57/66
Global recycling markets - plastic waste: A story for one player – China
Future outlook - trends - questions
57
10.2 Innovation – source of solutions and newchallengesInnovation will keep shifting the possibilities to recover val-ue from waste plastics. Such changes can have both pos-itive and negative implications. Past innovation examplesare: light-weighting, composites, food-contact applications(from PET to HDPE to thermoformed PET in 10 years). Re-cent experience shows that improved collection logisticsare becoming a reality. For example, in the USA 63% ofAmericans have their plastics collected weekly at the kerb-side, and 70% will soon be on single-stream (or co-min-
gled) programmes (access to single stream improvement:2005 29% of population; 2010 64%). Predictions supportthat more multi-family homes will be served, more smallbusinesses, services to public areas and events. However,there is on-going debate over optimal collection methods7.
Additional and more technically advanced MRFs could bedeployed (for example, now ca. 600 in the US). Adapta-tion to changes in feedstock and exploring processing fornon-bottle mixed-rigid plastics (tubs, lids, buckets) and PETthermoformed packaging (e.g. projects such as the deci-sion by the Canadian retailers resulting in the addition ofthermoformed PET in kerbside collections) is needed. More
advanced sensor-based sorting system with ability to han-dle entire bottles or flakes. Plastics-to-oil innovations couldbe an additional solution for the unrecyclable fraction (mo-tor oil bottles, plastic film in recovered paper bales, MRFsweepings, some forms of agricultural plastics, some com-posites), with companies already working in this sector: Ag-ilyx, Vadyxx, JBI with RockTenn.
Oxo-degradable and compostable plastics will have con-sequences for recyclability: (innovation side-effects): Oxocontain a pro-oxidant additive containing transition metalions of cobalt, iron, manganese and/or nickel, additive used
at 1-4% of the loading making it easy to manufacture thebag, bottle etc. Oxo-degradable plastics break apart whenthermally stressed. There is disagreement on their perfor-mance: suppliers claim they are degradable while manyothers argue they are not. Concerns have been expressedabout harming existing recycling schemes. For example,the State of California sued three water bottle manufactur-ers over their claims.
Bio-based polymers is another rapidly increasingly usedfamily of materials where innovation occurs delivering newsolutions, whereas generating complex engineering and pol-icy dilemmas, described elsewhere75,76. Their co-existence
with fossil-based plastics will inevitably result in increasedsystems complexity. Concerns have been expressed thatthey could disrupt the recycling of established fossil-basedplastics77: for example that of PET, often targeted for bot-tle-to-bottle (closed-loop) recycling78, but there is no una-nimity on such negative effects: they are dismissed by thebiopolymer proponents.
Eco-design and green chemistry innovation is hoped to de-
liver improvements on the material properties and improvethe inherent potential recyclability of plastic materials inthe future. Discussing the case of polypropylene (PP) recy-cling79, maintains that most plastic polymers are potentiallyrecyclable. But, in most of the cases of used plastics stillmany “recycled plastic items are considered to be usefulonly for low-value applications. It is common for qualityand appearance to degrade with each reprocessing cycle.”However, the technical reprocessing challenges are able tobe addressed. In the case of PP restabilisation is needed, i.e.replenishing of the stabilisers (additives) needed to preventits photo-oxidative degradation during use and the ther-mal-oxidative degradation during re-melting.
Polylactic acid (PLA) bioplastic molecule, chemical
structure. PLA bioplastic is an alternative for a
number of petroleum-based plastics.
8/15/2019 Plastic Recycling ISWA 2014
http://slidepdf.com/reader/full/plastic-recycling-iswa-2014 58/66
58 Global recycling markets - plastic waste: A story for one player – China
Future outlook - trends - questions
10.3 Evolving policies
Policies regarding plastic use will also evolve, with direct im-
pacts on the globalised market. Existing examples of recent
changes and trends are: ban on retailer plastic bags (many
USA localities, state-wide or local communities, enacted
policies on this - however the plastics industry disputes the
necessity, effectiveness and warns for unintended conse-
quences for targeting plastics bags); ban on Bisphenol A
(BPA)-containing packaging. In September 2010 Canada de-
clared BPA as a toxic substance. BPA use in baby bottles hasbeen banned in the EU, Canada, and USA. The same applies
to certain PDBAs. The scientific community has been argu-
ing persistently for an increased focus on environmental,
public health and occupational health and safety aspects of
plastics recycling, similar to the focus on WEEE handling.
There is an inevitable trade-off between quality and quan-
tity, with current trends putting higher emphasis on initial
collection rather than actual value recovery. Higher targets
for collection for recycling may mean that higher amounts
will be available to extract value from, both locally and glob-
ally, creating additional pressure (innovation and regional
capacity) for recovery solutions. Strong emphasis should
be given on the responsibility of the exporting countries to
effective management of exports and subsequent supplychain, including understanding the controls (or lack thereof)
at the destination country, checking facility licenses to en-
sure the factory holds the correct permissions and ideally
having them been audited. Efforts focused on the quality
and maximising the sustainability impact of the recycling
process should eventually emerge54.

8/15/2019 Plastic Recycling ISWA 2014
http://slidepdf.com/reader/full/plastic-recycling-iswa-2014 59/66
Global recycling markets - plastic waste: A story for one player – China 59
11. Key facts summary
No. Key fact
1 Waste plastics traded internationally are a small fraction of annual new plastic production (<5% wt.).
2 Pre-consumer (industrial) plastic scrap, a by-product of industrial activities, is recycled as feedstock toa very high extent already (e.g. see the UK case study). The big challenges are with the post-consumerplastics, and especially those arising from mixed (‘co-mingled’ (UK)/ ‘single stream’ (USA)) collection,sent for mechanical recycling. Plastic waste present in residual waste (ideally limited to the non-sustain-
ably recyclable part of waste) in most of the cases can potentially be directed to energy recovery viaproduction of quality assured solid recovered fuel (SRF) or via energy from waste combustion plants(EfW) producing combined heat and power (CHP).
3 Waste plastics are traded in a globalised supply chain and market.
4 Many industrial sectors are involved: traditional waste management, informal sector collectors, repro-cessors, transporters/forwarders, local and multi-national manufacturers.
5 The current mode of operation balances the trade deficit of the Northern/Western countries, utilisesthe otherwise empty containers (reverse haulage) and supplies Chinese manufacturing industry withnecessary affordable secondary raw materials.
6 A steady market increase is in direct relationship with primary plastics production. Decreases in theprices of primary plastics directly affect the prices and trade volume of secondary plastics.
7 China including the Hong Kong SAR is the key player in the global market for plastic waste, being by farthe biggest importer (49% of financial transactions for imports – 56% wt.).
8 Europe, the biggest exporter worldwide of waste plastic intended for recycling, depends largely onChina: 87% wt. is exported to China either directly or via the Hong Kong SAR. The exported quantity is46% of the overall quantity collected for recycling, and 12% of the entire plastic waste arisings in Euro-pe. In contrast, Europe exports only 1.2% of its primary plastics products to China. High dependencieson exports to China also hold for Japan and the USA.
9 The Hong Kong SAR serves almost exclusively as an alternative entry point for the Chinese market – itused to be considered a more lax entry point.
10 ASEAN countries (mainly Vietnam, Malaysia and Indonesia) export to China, possibly re-exporting repro-cessed imports and exporting domestically collected plastic scrap.
11 There is insufficient understanding of the fate of the plastic scrap after entering China and consequent-ly implications for local and global health and environment. The ‘Green Fence Operation’ has rapidlychanged the import and utilization situation.
12 Despite regulatory and enforcement efforts in China there is still considerable reprocessing and tradethat is not sufficiently managed (‘three non-enterprises’, implying: (i) no rules for operation (ii) no qualitystandards and (iii) no inspection).

8/15/2019 Plastic Recycling ISWA 2014
http://slidepdf.com/reader/full/plastic-recycling-iswa-2014 60/66
60 Global recycling markets - plastic waste: A story for one player – China
Key facts summary
13 Recycling of domestic waste plastics is still very low, although domestic recovered plastics were almosttwice the imports in 2011. Indirect evidence suggests that the quality of some of the imported plasticsscrap is higher than that obtained from domestic recycling collection schemes.
14 Quality controls implemented by China’s customs upset the entire global market having direct and ra-pidly felt upstream implications for the domestic reprocessing and waste management industries of theWestern/Northern exporting countries. This demonstrates the fragility of the current global recyclingsystem which operates in the absence of sufficient domestic demand, lack of advanced reprocessingcapacity and absence of low contamination single polymer collection schemes. And the determinationof the Chinese authorities to improve the overall sustainability of their use of secondary resources.
15 The current model of operation (predominantly export dependence on China) has become vital for the
successful operation of Western/Northern municipal recycling systems. There are doubts about thesystem’s resilience and overall sustainability.
16 The important concerns expressed in relation to environment and health aspects of international plasticscrap trade have not been systematically explored sufficiently to be verified or dismissed.
17 The global trade of recyclables is fuelling real local industrial demand. But, at best it also transportspotentially polluting compounds and the risk and liability to manage these reliably. Waste traffickingis the other end of the spectrum of waste trans-boundary movement. International collaboration andchecks at both export and import points are necessary to guarantee free trade of valuable waste-deri-ved commodities, without endangering public and occupational health. Weak links in this chain should beidentified and eliminated.
18 It has been argued that a least beneficial environmental impact path is followed in global waste andsecondary raw materials trans-shipment.
19 The market can be easily disrupted because it depends on many industrial sectors, the heavily regulatedwaste sector and the oligopsony of China.
8/15/2019 Plastic Recycling ISWA 2014
http://slidepdf.com/reader/full/plastic-recycling-iswa-2014 61/66
Global recycling markets - plastic waste: A story for one player – China 61
References1. Crang, M.; Hughes, A.; Gregson, N.; Norris, L.; Ahamed, F. (2013). Rethinking governance and value in commodity
chains through global recycling networks. Transactions of the Institute of British Geographers 38 , (1), 12-24.
2. Zhou, S. (2012). UK to China Flows of Waste Plastics: a Critical Evaluation. MSc, Imeprial College London, London.
3. Plastics Europe, (2013). Plastics - the facts 2013. Analysis of European plastics production, demand and wastedata for 2012 ; p37.
4. Bureau of International Recycling (BIR), (2013). “Incredible” consumption outlook for recovered plastics ; 05 June2013 p2. See: http://www.bir.org/news-press/latest-news/bir-shanghai-plastics-incredible-consumption-out-look-for-recovered-plastics/
5. Bureau of International Recycling (BIR), 2013; The Industry - Plastics - Recycling facts ; 05 June 2013 p2See: http://www.bir.org/industry/plastics/
6. UN Comtrade, (2013). United Nations Commodity Trade Statistics Database. Uninted Nations.
7. WRAP (2009) Choosing the right recycling collection system ; June 2009, p 8 See: http://www.wrap.org.uk/sites/files/wrap/Choosing%20the%20right%20recycling%20collection%20system.pdf
8. Morgan, S. (2012). UK household plastics collection survey 2012 ; RECOUP: Peterborough, UK, 2012, p 40.
9. Wong, C. (2010). A study of plastic recycling supply chain University of Hull, Business Scholl and Logistics Insti-tute: Hull, UK, October 2010, p68.
10. Moore, P. (2011). Plastics recycling in China: the truth behind the myths ; Washington, See: http://www.plasticsre-cycling.org/market-development/plastics-recycling-in-china- Accessed on: 10 July 2012.
11. Letsrecycle.com, (2012). Plastics Prices Archive. See: http://www.letsrecycle.com/prices/plastics/plastics-pric-es-archive Accessed on: 6 August 2012
12. Resource Recycling, (2013). Exports edge up in February. See: http://resource-recycling.com/node/3744 Ac-cessed on: 15 May 2013
13. WRAP, (2012). Material Pricing Report ; See: http://www2.wrap.org.uk/recycling_industry/market_information/materials_pricing_reports/index.html Accessed on: 8 June 2012
14. HM Revenue & Customs, (2012). Statistics.
15. WRAP, (2011). The Chinese markets for recovered paper and plastics – an update ; See: http://www2.wrap.org.uk/
document.rm?id=10601 Accessed on: 7 June 2012
16. Institute of Scrap Recycling Industries (ISRI), (2012). The ISRI scrap yearbook 2012 ; ISRI: Washington, DC, USA,p49. See: http://www.isri.org/CMDownload.aspx?ContentKey=41c2f107-0576-4a61-a0aa-078cab920e84&Con-tentItemKey=f08c8afb-2927-4820-84bd-19eeada22839 Accessed on: 15 June 2014
17. Oon, A. C. L. (Unpublished). Global waste plastics recycling markets: A South East Asia outlook ; University ofLeeds - School of Civile Engineering: May 2013, p27.
18. The Council for PET Bottle Reycling (CBPR), (2012). PET bottle recycling in Japan ; See: http://www.petbottle-rec.gr.jp/english/reports.html Accessed on: 18 June 2012
19. The Council for PET Bottle Reycling (CBPR), (2013). Case study for multi-stakeholder partnerships. From wastesto valauble resources: PET bottle recycling in Japan.; Japan, 19 March 2013, p12. See: http://www.petbottle-rec.
gr.jp/topics/pdf/20130318_Presentation.pdf Accessed on: 30 May 2013
8/15/2019 Plastic Recycling ISWA 2014
http://slidepdf.com/reader/full/plastic-recycling-iswa-2014 62/66
62 Global recycling markets - plastic waste: A story for one player – China
References
20. Moore Recycling Associates, (2012). 2010 National post-consumer non-bottle rigid plastic recycling report ; Amer-ican Chemistry Council: January 2012, p14. See: http://plastics.americanchemistry.com/Education-Resources/Publications/2010-National-Report-on-Post-Consumer-Non-Bottle-Rigid-Plastic-Recycling.pdf Accessed on: 10August 2012
21. Powell, J. (Undated). Plastics: the big picture ; Resource Recycling: Portland, Oregon, Canada, See: www.re-source-recycling.com
22. Kuczenski, B.; Geyer, R. (2010). Material flow analysis of polyethylene terephthalate in the US, 1996-2007. Re- sources, Conservation and Recycling 54 , (12), 1161-1169.
23. Jiang, Y. X.; Jiang, M. (2013). Plastics: The discovery in the world and development in china. In Vol. 750-752, pp811-815.
24. Liao, Z. P. (2011). China’s plastics industry (In Chinese). China Plastics 25 , (5), 1-10.
25. Liao, Z. P. (2010). Analysis of supply and demand, and development potential ofwaste plastics (In Chinese). Re- source Recycling , (01), 10-13.
26. Zhou, Y.; Yang, N.; Hu, S. (2013). Industrial metabolism of PVC in China: A dynamic material flow analysis.Resourc- es, Conservation and Recycling 73 , 33-40.
27. China Customs Statistics (CCS), (2012). Customs Statistics.
28. China Statistical Database, (2012). Statistics Data. [Online]
29. IRR, (2012). Petrochemicals (In Chinese) See: http://jinchukou.chyxx.com/shiyouhuagong Accessed on: 13 June2012.
30. China Economic Information Network (CEIn), (2012). China Economic Information Network (In Chinese).
31. Liao, Z. P. (2010). China’s plastics industry (2009) (In Chinese). World Plastics 28 (4), 16-35.
32. Wang, X. B. (2012). The collection system: construction of renewable resources in China in recent years (In Chi-nese). China Scrap Plastics , (05), 12-14.
33. Lv, X. S. (2012). Comprehensive account of Chinese scrap plastics importation from January to March (In Chinese).China Scrap Plastics , (06), 9-11.
34. Jefferson, M. (2010). Recycling in China ; Verde Recycling Solutions Sprl: See: http://www.grontpunkt.no/files/dmfile/China-GreenDotNorway1.pdf Accessed on: 10 May 2013.
35. Nina, Y. (2011). Myth or fact: waste export to China. Plastic News , (1st February 2011).
36. van Beukering, P. (1999). Plastics Recycling in China an international life cycle approach (Summary Translatedfrom Chineese) ; IVM Report number W99/05; Institute for Environmental Studies (IVM); Chinese Academy ofInternational Trade and Economic Co-operation (CAITEC); Policy Research Centre for Environment and Economy
(PRCEE): May 1999, See: https://www.elaw.org/system/files/Plastics.Recycling.in.China.pdf 37. Bradney, L. (2014). The Green Fence. CIWM - The journal fpr waste & resource management professionals , (April
2014), 52-53.
38. Toensmeier, P. (2012). China’s plastics industry: A world of potential. Plast. Eng. 68 , (9), 20-25.
39. WRAP, (2010). China market sentiment survey ; See: http://www.wrap.org.uk/content/report-china-market-sen-timent-survey Accessed on: 29 June 2012.
40. Zhang, B., (2012). A Research on Recycled Plastics’ Environmental Economy Value. In ChinaReplas 2012 (Spring) :Shanghai.
8/15/2019 Plastic Recycling ISWA 2014
http://slidepdf.com/reader/full/plastic-recycling-iswa-2014 63/66
Global recycling markets - plastic waste: A story for one player – China
References
63
41. Moore, P. (2012). Film, PET and mixed plastic recycling in China ; See: http://www.moorerecycling.com/ChinaRe-port_Final.pdf Accessed on: 11 July 2012
42. Plumer, B. (2013). China doesn’t even want to buy our garbage anymore. See: http://www.washingtonpost.com/
blogs/wonkblog/wp/2013/05/09/chinas-crackdown-on-trash-could-make-it-harder-for-u-s-cities-to-recycle/ Accessed on: 10 May 2013
43. Resource Recycling, (2013). Operation Green Fence is deeply affecting export markets. See: http://resource-re-cycling.com/node/3679 Accessed on: 15 June 2014
44. Messenger, B. (2013). Recycled plastics market set to triple, but China’s ‘green fence’ hampering exports. See:http://www.waste-management-world.com/articles/2013/06/new-sita-recycling-plant-in-birmingham-produc-ing--srf---rdf.html Accessed on: 20 July 2013
45. Ford, P. (2013). China puts up a green wall to US trash. See: http://www.csmonitor.com/World/Asia-Pacif-ic/2013/0619/China-puts-up-a-green-wall-to-US-trash Accessed on: 20 June 2013
46. Complydirect (2013). Demand for recycled plastics to triple by 2020. See: http://www.complydirect.com/latest/
news/?id=255 Accessed on: 15 June 201347. Goldstein, S. (2008). Waste trade imperils UK reprocessing goals. Packaging News , (APR.), 41.
48. Guilford, G. (2013). China doesn’t want your trash anymore - and that could spell big trouble for American cities.See: http://qz.com/82640/china-doesnt-want-your-trash-anymore-and-that-could-spell-big-trouble-for-ameri-can-cities/ Accessed on: 10 June 2014
49. Smulian, M. (2013). Industry welcomes tougher rules on exports. See: http://www.mrw.co.uk/news/indus-try-welcomes-tougher-rules-on-exports/8647827.article Accessed on: 14 May 2013
50. British Plastics Federation (BFP), (2013). Business conditions survey for the UK plastics industry ; British PlasticsFederation: London, UK, January 2013, p8. See: http://www.google.co.uk/url?sa=t&rct=j&q=&esrc=s&frm=1&-source=web&cd=2&ved=0CDcQFjAB&url=http%3A%2F%2Fwww.bpf.co.uk%2FDocument%2FDefault.aspx-%3FDocumentUid%3D4f2786d7-5b4f-4413-9188-70c971487e77&ei=LkvkUZ2CPMbI0QX6wYHQBg&usg=AFQ-
jCNFU5gxlUXVG8iwTknQFNfNoA4CQJg&sig2=ujgYuSXD5bmfCItH38u-Mg Accessed on: 10 June 2014
51. Closed Loop Recycling, (2012). Welcome to Closed Loop Recycling. See: http://www.closedlooprecycling.co.uk/ Accessed on: 15 May 2013
52. Kamuk, B.; Hansen, A. J. (2007). Global recycling – waste trafficking in disguise? Waste Management & Research25 , (6), 487-488.
53. Bilitewski, B. (2012). The Circular Economy and its Risks. Waste Manage. 32 , (1), 1-2.
54. Velis, C. A.; Brunner, P. H. (2013). Recycling and resource efficiency: It is time for a change from quantity to quality.Waste Management & Research 31 , (6), 539-540.
55. Wang, J. (2013). The top ten issues facing China’s plastics recycling industry. Plast. Eng. 69 , (8), 42-49.
56. Albrecht, N.; Wang, J. (2014). Die-Doku: Tödlicher Müll in China [in German: “Deadly waste in China”]. See: http://www.zdf.de/ZDFmediathek#/beitrag/video/1993090/Die-Doku:-Tödlicher-Müll-in-China Accessed on: 20 May2014
57. Halden, R. U. (2010). Plastics and health risks. In Vol. 31, pp 179-194.
58. Clausen, P. A.; Liu, Z.; Kofoed-Sørensen, V.; Little, J.; Wolkoff, P. (2012). Influence of temperature on the emissionof Di-(2-ethylhexyl)phthalate (DEHP) from PVC flooring in the emission cell FLEC. Environ. Sci. Technol. 46 , (2),909-915.
59. Zeng, L. S.; Zhou, Z. F.; Shi, Y. X. (2013). Effects of phthalic acid esters on the ecological environment and humanhealth. In Guangzhou, Vol. 295-298, pp 640-643.

8/15/2019 Plastic Recycling ISWA 2014
http://slidepdf.com/reader/full/plastic-recycling-iswa-2014 64/66
64 Global recycling markets - plastic waste: A story for one player – China
References
60. Huang, Y. Q.; Wong, C. K. C.; Zheng, J. S.; Bouwman, H.; Barra, R.; Wahlström, B.; Neretin, L.; Wong, M. H. (2012).Bisphenol A (BPA) in China: A review of sources, environmental levels, and potential human health impacts. Envi- ronment International 42 , (1), 91-99.
61. Zeng, N.; Yao, J.; Tang, Z. W.; Huang, Q. F.; Jin, L.; He, J. (2013). Pollution characteristics of polybrominated diphenylethers in soils from waste plastic recycling region in China. Research of Environmental Sciences 26 , (4), 432-438.
62. Deng, C.; Li, Y.; Li, J. H.; Li, H. F. (2014). A mini-review on disposal of WEEE plastics containing PBDES with a specialfocus on china. In Vol. 878, pp 600-608.
63. Rustagi, N.;Pradhan, S. K.;Singh, R., 2011, Public health impact of plastics: An overview. Indian Journal of Occupa- tional and Environmental Medicine 15 , (3), 100-103.
64. Peeters, J. R.; Vanegas, P.; Tange, L.; Van Houwelingen, J.; Duflou, J. R. (2014). Closed loop recycling of plasticscontaining Flame Retardants. Resources, Conservation and Recycling 84 , 35-43.
65. Yamashita, K.; Yamamoto, N.; Mizukoshi, A.; Noguchi, M.; Ni, Y.; Yanagisawa, Y. (2009). Compositions of volatileorganic compounds emitted from melted virgin and waste plastic pellets. J. Air Waste Manage. Assoc. 59 , (3),
273-278.66. Townsend, D. (2007). Plastic problems. Fire Prevention and Fire Engineers Journals , (APR.).
67. Derudi, M.; Nano, G.; Gelosa, S.; Sliepcevich, A.; Santantonio, P.; Perfetto, A.; Rot, R. (2012). In Emissions of hazard- ous compounds during PVC manufacturing processes , Helsinki, 2012; Helsinki, pp 1313-1319.
68. Helal, S. F. ;Elshafy, W. S. (2013). Health hazards among workers in plastic industry. Toxicology and IndustrialHealth 29 , (9), 812-819.
69. Appelquist, B. (2011). ISWA Position Paper on Waste Trafficking, ISWA
70. D’Amato, A.; Iozzi, A.; Trovato, G. (2012). The trade of polyethylene waste: Prices or policies? Environmental Eco- nomics and Policy Studies 14 , (4), 341-356.
71. Rajendran, S.; Hodzic, A.; Scelsi, L.; Hayes, S.; Soutis, C.; AlMa’adeed, M.; Kahraman, R. (2013). Plastics recycling:Insights into life cycle impact assessment methods. Plastics, Rubber and Composites 42 , (1), 1-10.
72. Lazarevic, D.; Aoustin, E.; Buclet, N.; Brandt, N. (2010). Plastic waste management in the context of a Europeanrecycling society: Comparing results and uncertainties in a life cycle perspective. Resources, Conservation andRecycling 55 , (2), 246-259.
73. Astrup, T.; Fruergaard, T.; Christensen, T. H. (2009). Recycling of plastic: Accounting of greenhouse gases andglobal warming contributions. Waste Manage. Res. 27 , (8), 763-772.
74. Weber, A. (2013). Toy assembly isn’t child’s play. Assembly 56 , (12).
75. Tolinski, M. (2011). Plastics and Sustainability: Towards a peaceful coexistence between bio-based and fossil fu- el-based plastics . John Wiley & Sons.
76. Philp, J. C.; Bartsev, A.; Ritchie, R. J.; Baucher, M. A.; Guy, K. (2013). Bioplastics science from a policy vantage point.New Biotechnology 30 , (6), 635-646.
77. Soroudi, A.; Jakubowicz, I. (2013). Recycling of bioplastics, their blends and biocomposites: A review. Eur. Polym.J. 49 , (10), 2839-2858.
78. Cornell, D. D. (2007). Biopolymers in the existing postconsumer plastics recycling stream. J. Polym. Environ. 15 ,(4), 295-299.
79. Xanthos, M. (2012). Recycling of the #5 Polymer. Science 337 , (6095), 700-702.

8/15/2019 Plastic Recycling ISWA 2014
http://slidepdf.com/reader/full/plastic-recycling-iswa-2014 65/66
Global recycling markets - plastic waste: A story for one player – China
The International Solid Waste Association (ISWA) is a global, independent and non-profit making association,working in the public interest to promote and develop sustainable waste management. ISWA has members
in more than 60 countries and is the only worldwide association promoting sustainable, comprehensive andprofessional waste management.
ISWA’s objective is the worldwide exchange of information and experience on all aspects of waste management. The
association promotes the adoption of acceptable systems of professional waste management through technological
development and improvement of practices for the protection of human life, health and the environment as well as the
conservation of materials and energy resources.
ISWA’s vision is an Earth where no waste exists. Waste should be reused and reduced to a minimum, then collected,
recycled and treated properly. Residual matter should be disposed of in a safely engineered way, ensuring a clean and
healthy environment. All people on Earth should have the right to enjoy an environment with clean air, earth, seas and soils.
To be able to achieve this, we need to work together.
For information about ISWA, visit our homepage at www.iswa.org
65

8/15/2019 Plastic Recycling ISWA 2014
http://slidepdf.com/reader/full/plastic-recycling-iswa-2014 66/66
Members of the ISWA TASK Force onGlobalisation and Waste Management
Antonis Mavropoulos
Chair
D-Waste, Greece
David C Wilson
Scientific Co-ordinator
Imperial College London, UK
Björn AppelqvistEditor
City of Copenhagen, Denmark
Costas Velis
University of Leeds, UK
Jeff Cooper
Independent Consultant, UK
Auerspergstrasse 15, Top 41
1080 Vienna
Austria
Telephone: +43 (1) 253 6001
Telefax: +43 (1) 253 6001 99
Email: [email protected]