w hy does technology fail to benefit the poorest farmers
TRANSCRIPT

Why does technology fail tobenefit the poorest farmers? Asociotechnical approach to thestudy of innovation and poverty
The Harvard community has made thisarticle openly available. Please share howthis access benefits you. Your story matters
Citable link http://nrs.harvard.edu/urn-3:HUL.InstRepos:40050010
Terms of Use This article was downloaded from Harvard University’s DASHrepository, and is made available under the terms and conditionsapplicable to Other Posted Material, as set forth at http://nrs.harvard.edu/urn-3:HUL.InstRepos:dash.current.terms-of-use#LAA

Why does technology fail to benefit the poorest farmers? A sociotechnical approach to the study of innovation and poverty
A dissertation presented
by
Alicia G. Harley
to
The Committee on Higher Degrees in Public Policy
in partial fulfillment of the requirements
for the degree of Doctor of Philosophy
in the subject of Public Policy
Harvard University Cambridge, Massachusetts
May 2018

© [2018] [Alicia G. Harley]
All rights reserved.
iii
Professor William C. Clark Alicia G. Harley
Why does technology fail to benefit the poorest farmers? A sociotechnical approach to the study of innovation and poverty
Abstract
This dissertation seeks to understand the barriers preventing the poorest farmers from realizing
greater benefits from technology innovation. The goal of the dissertation is to derive policy relevant insights
for reorienting the institutions structuring agriculture innovation systems to ensure the poorest farmers reap
greater benefits from agricultural technology. The research for the three papers was conducted in India and
pairs qualitative interviews of farmers and other actors in the agricultural innovation system, including
members of the private sector, government, NGOs, international donor agencies, and researchers, with
analysis of survey data collected by the author, and secondary sources, including government documents,
NGO and donor reports, newspaper articles, books, and journal articles.
The results demonstrate that the benefits of agricultural technology are frequently skewed toward
wealthier farmers. This continues to be the case, even when policy makers and technologists are explicitly
concerned with the needs of the poorest. Ensuring benefits of technology are realized by the poorest farmers,
requires context specific fit between physical and institutional dimensions of technology that explicitly
takes into account the opportunities and barriers facing the poorest farmers. Reorienting agricultural
innovation systems to meet the needs of the poorest requires more than just technologies with the
appropriate physical dimensions. It also requires efforts across stages of the innovation system to align the
physical and the institutional dimensions of technology with local conditions, in ways that meet the needs
of the poorest.

iv
Table of Contents
Acknowledgements ...................................................................................................................................... ix
Dedication ................................................................................................................................................... xii Acronyms & Abbreviations ....................................................................................................................... xiii CHAPTER 1. Why does technology fail to benefit the poorest farmers? A sociotechnical approach to the study of innovation and poverty.................................................................................................................... 1
1.1 Introduction ......................................................................................................................................... 1
1.2 Theory ................................................................................................................................................. 3
1.2.1 Theory: Sociotechnical Approach ................................................................................................ 3
1.2.2 Theory: Innovation Systems ......................................................................................................... 6
1.2.3 Theory: Sociotechnical Regimes and the Multi-Level Perspective (MLP) ................................. 8
1.3 Literature ........................................................................................................................................... 11
1.3.1 Literature: Situating the Research in the Broader Discourse on Poverty and Inequality ............ 11
1.3.2 Literature: Innovation and Poverty in the Literature .................................................................. 17
1.4 Fieldwork Setting .............................................................................................................................. 27
1.5 Challenges of Measuring Poverty ..................................................................................................... 31
1.6 Chapter Overview ............................................................................................................................. 34
1.7 Overall Findings: Relevance for Policy and Scholarship ................................................................. 37
CHAPTER 2: What keeps the poorest farmers from benefiting from technology? A study of agricultural technology and poverty in Bihar, India ....................................................................................................... 43
2.0 Abstract ............................................................................................................................................. 43
2.1 Introduction: Rural Poverty and Agricultural Technology Innovation ............................................. 44
2.2 Theory: A Sociotechnical Approach ................................................................................................. 48
2.2.1 The Sociotechnical Nature of Technology Innovation ............................................................... 48
2.2.2 Sociotechnical Causal Mechanisms (STCMs) ............................................................................ 51
2.3 Methods: Revealed Preference Approach ......................................................................................... 57
2.3.1 Estimating the Benefits of New Technology .............................................................................. 59
2.3.1.1 Through Measuring Yield Improvements .............................................................................. 59
2.3.1.2 Through Revealed Preferences .............................................................................................. 62
2.3.2 Limitations of Revealed Preference Approach ........................................................................... 63
2.3.2.1 Estimation of Size of Positive Benefits ................................................................................. 63
2.3.2.2 Non-use of a technology ........................................................................................................ 64
2.3.2.3 Technologies with negative benefits? .................................................................................... 66
2.3.2.4 Use of second-best technologies ............................................................................................ 67
2.4 Background: Bihar’s Economic Miracle in an Agrarian Context ..................................................... 69
2.4.1 Landscape Level Context ............................................................................................................ 75
2.5 Data: Triangulating Using Ethnography and Survey Data ............................................................... 84
2.5.1 Technology Adoption and Changes in the Sociotechnical Regime ............................................ 91
2.5.2 Bathani: Primary Field Site ......................................................................................................... 94
2.5.3 Ethnography of Three Households ........................................................................................... 106
2.5.3.1: Family A ............................................................................................................................. 108
2.5.3.2: Family B ............................................................................................................................. 112
2.5.3.3: Family C ............................................................................................................................. 115
2.5.3.4: Cross-Family Synthesis ...................................................................................................... 117
2.6 Analysis: Understanding Variance in Benefits of Technology to Farmers ..................................... 121

v
2.6.1 Solar Irrigation Pumps (SIPs) ................................................................................................... 133
2.6.1.1: Sociotechnical Analysis of SIPs in Bihar ........................................................................... 135
2.6.1.2: STCMS as Barriers for the Poorest: SIPs ........................................................................... 149
2.6.2 System of Rice Intensification (SRI) ........................................................................................ 152
2.6.2.1: Sociotechnical Analysis of SRI in Bihar ............................................................................ 159
2.6.2.2: STCMS as Barriers for the Poorest: SRI ............................................................................ 166
2.6.3 Drip Irrigation (MIS) ................................................................................................................ 170
2.6.3.1: Sociotechnical Analysis of MIS in Bihar ........................................................................... 171
2.6.3.2: STCMS as Barriers for the Poorest: MIS ........................................................................... 179
2.6.4 Electric Motor Pumps (EMPs) .................................................................................................. 182
2.6.4.1: Sociotechnical Analysis of EMPs in Bihar ......................................................................... 187
2.6.4.2: STCMS as Barriers for the Poorest: EMPs ......................................................................... 191
2.6.5 Rubber-Walla Pipes (RWPs) .................................................................................................... 192
2.6.5.1: Sociotechnical Analysis of RWPs ...................................................................................... 193
2.6.5.2: STCMS as Barriers for the Poorest: RWPs ........................................................................ 196
2.6.6 Improved Seed Varieties (ISVs) ............................................................................................... 197
2.6.6.1: Sociotechnical Analysis of Improved Seed Varieties in Bihar (ISVs) ............................... 199
2.6.6.2: STCMs as Barriers for the Poorest: ISVs ........................................................................... 207
2.7 Findings .......................................................................................................................................... 209
2.7.1 STCM 1: Lack of Financial Assets (Score 1) ........................................................................... 215
2.7.2 STCM 2: Inappropriate Technology Design (Score 0.8) .......................................................... 217
2.7.3 STCM 3: Missing Market Linkages (Score 0.2) ....................................................................... 218
2.7.4 STCM 4: Lack of Access to Credit (Score 1) ........................................................................... 219
2.7.5 STCM 5: Missing Infrastructure (Score 2.3) ............................................................................ 221
2.7.6 STCM 6: Ineffective Extension Services (Score 1) .................................................................. 222
2.7.7 STCM 7: Lack of Individual Farmer Capacity (Score 0.7) ...................................................... 224
2.7.8 SCTM 8: Weak Capacity for Collective Action (Score 0.7) .................................................... 226
2.7.9 STCM 9: Structure of Land Tenure Regimes (Score 1.1) ........................................................ 227
2.7.10 STCM 10: Misaligned Incentives (Score 2.1) ........................................................................ 229
2.7.11 STCM 11: Corruption and Security (Score 0.8) ..................................................................... 230
2.7.12 Summary: Policy Implications of STCM Approach ............................................................... 231
2.8 Discussion ....................................................................................................................................... 233
CHAPTER 3. The System of Rice Intensification: The challenges of technology selection for meeting the needs of the poorest farmers ..................................................................................................................... 240
3.0 Abstract ........................................................................................................................................... 240
3.1 Introduction ..................................................................................................................................... 241
3.2 Theory and Data .............................................................................................................................. 245
3.2.1 Theory: Using Innovation Systems as an Inductive Approach ................................................. 245
3.2.2 Data: A Mixed Methods Approach .......................................................................................... 249
3.3 Selection of SRI at the Transnational Scale .................................................................................... 253
3.3.1 The Emergence and Spread of SRI as a “Pro-Poor” Technology ............................................. 253
3.3.2 SRI Selected by Transnational Actors ...................................................................................... 258
3.3.2 The Rice-Wars .......................................................................................................................... 261
3.3.3 SRI’s Network Grows ............................................................................................................... 265
3.3.4 The Causes of the Controversy: Three Hypotheses .................................................................. 270
3.3.5 Attempts at Closure: Finding Common Ground? ..................................................................... 276
3.3.6 Transnational Summary: Three Points of Lingering Controversy ............................................ 280
3.4 Selection of SRI at the Local Scale ................................................................................................. 288
vi
3.4.1 Initial Selection of SRI in Bihar................................................................................................ 290
3.4.2 SRI as a Political Agenda: Government Support for SRI in Bihar ........................................... 291
3.4.2.1 SRI as a “Pro-Poor” Electoral Strategy ............................................................................... 293
3.4.2.2 SRI as a Geopolitical Strategy ............................................................................................. 294
3.4.5 Selection Controversies at the State Level ................................................................................ 295
3.5 Evaluating Success of SRI as “Pro-Poor” Technology in Bihar ..................................................... 299
3.5.1 Limited Overall Adoption, But Adopters Report Positive Benefits ......................................... 302
3.5.2 Benefits of SRI Skewed Towards Wealthier Farmers .............................................................. 305
3.5.3 Water Biggest Barrier to Adoption of SRI ............................................................................... 306
3.5.4 Limited Access to Extension Services for Poorest Farmers ..................................................... 311
3.5.5 Limited Access to Subsidy Package for Poorest Farmers......................................................... 313
3.5.6 SRI as a Cultural Movement ..................................................................................................... 315
3.5.7 Changing Agronomic Practices Across Bihar .......................................................................... 317
3.6 Discussion ....................................................................................................................................... 319
CHAPTER 4. Subsidies for whom? Comparative evaluation of India’s Drip Irrigation Subsidy Program .................................................................................................................................................................. 329
4.1 Introduction ..................................................................................................................................... 329
4.2 Theoretical Approach and Data Collection ..................................................................................... 332
4.2.1 Theory: Sociotechnical Approach to Innovation Studies ......................................................... 332
4.2.2 Data: A Comparative Qualitative Analysis ............................................................................... 334
4.3 Drip Irrigation: Background and Selection in India........................................................................ 340
4.3.1 Drip Irrigation: General Physical and Institutional Dimensions ............................................... 340
4.3.2 Drip Irrigation Innovation History ............................................................................................ 342
4.3.3 Initial Adoption of Drip Irrigation in India ............................................................................... 346
4.3.3 Selection of Drip on a National Scale: The National Mission on Micro Irrigation (NMMI) ... 349
4.3.4 Implementation of NMMI at the State Level ............................................................................ 352
4.4 Analysis: Implementation of NMMI in Four States ....................................................................... 356
4.4.1 Andhra Pradesh ......................................................................................................................... 356
4.4.2 Bihar ......................................................................................................................................... 359
4.4.3 Gujarat ...................................................................................................................................... 361
4.4.4 Kerala ........................................................................................................................................ 364
4.4.4 Comparing NMMI Across Four States ..................................................................................... 366
4.5 Findings: NMMI Delivers Mixed Results ...................................................................................... 370
4.5.1 NMMI at the National Level .................................................................................................... 370
4.5.2 Success of NMMI: Public Incentives for Private Extensions ................................................... 371
4.5.3 Subsidies for Whom? Failure of the NMMI Program to Benefit the Poorest Farmers ............. 372
4.6 Discussion: Public Led Market-Creation for Public Benefit? ........................................................ 373
Appendices ........................................................................................................................................... 375
Appendix 1. A note on caste categories, monetary conversions, and translations. ............................ 376
Appendix 2. Additional figures and tables for Chapter 2 .................................................................. 378
Appendix 3. Annotated bibliography of supporting literature for STCMs ........................................ 387
Appendix 4. World Bank SRI toolkit: Transcription of interviews ................................................... 400
Appendix 5. SRI songs from Bihar .................................................................................................... 411
References ................................................................................................................................................. 414

vii
FIGURES Figure 1.1: Simplified heuristic model of an innovation system. ................................................................. 7
Figure 1.2: Stylized conceptualization of the impact of technology on poverty and inequality. ................ 13
Figure 2.1: Map of Bihar ............................................................................................................................ 46
Figure 2.2: Relationship between causal mechanisms, technology use, and farmer well-being. ............... 56
Figure 2.3: Stylized conceptualization of the impact of technology on poverty and inequality. ................ 58
Figure 2.4: Phipps Laboratory at the Imperial Agriculture Research Institute (IARI). .............................. 76
Figure 2.5: Concrete electricity polls turned into improvised speed bumps in Gaya district, Bihar. ......... 80
Figure 2.6: 2012-2017 Agricultural Road Map........................................................................................... 82
Figure 2.7: Technology adoption in Bihar since 1990. ............................................................................... 92
Figure 2.8: Map of Bathani village in Gaya district.................................................................................... 97
Figure 2.9: Benefits of technology realized across socioeconomic groups. ............................................. 126
Figure 2.10: Photos of each of the six technology case studies. (Photo Credits: Author) ........................ 128
Figure 3.1: Simplified heuristic model of an innovation system. ............................................................. 246
Figure 3.2: Map of three districts in Bihar where survey was conducted. ................................................ 251
Figure 3.3: “Policy perspectives for upscaling SRI” PowerPoint presentation. ....................................... 260
Figure 3.4: Global SRI Adoption as taken from the CIFFAD website. .................................................... 266
Figure 3.5: Number of journal articles about SRI per year through 2015. ............................................... 267
Figure 3.6: “SRI” branded rice. ................................................................................................................ 270
Figure 3.7: Farmers promoting SRI in Gaya district Bihar in a fair to celebrate Republic Day ............... 316
Figure 4.1: Map of India. .......................................................................................................................... 335
Figure 4.2: Drip Irrigation coverage by country. ...................................................................................... 346
Figure 4.3: Percent subsidy for drip irrigation and percent potential area adopted by state in 2010 ........ 354
Figure 4.4: Percent small and marginal farmers among drip irrigation adopters by state in 2010. .......... 355

viii
TABLES
Table 2.1: Definitions of STCMs and selected supporting literature. ......................................................... 52
Table 2.2: Selected social, economic and agricultural indicators for Bihar and India as a whole. ............. 71
Table 2.3: Percentage of the population below poverty line. ...................................................................... 73
Table 2.4: Share of selected sectors in Bihar’s Net Domestic Product ....................................................... 74
Table 2.5: List of interviews and participant observation conducted in Bihar as part of fieldwork. .......... 87
Table 2.6: Bathani Village descriptive data by tola. ................................................................................... 99
Table 2.7: Cropping intensity in Bathani by tola and caste. ..................................................................... 105
Table 2.8: Land, water and well-being of three families in Bathani Village. ........................................... 107
Table 2.9: Perceived changes in well-being in Bathani. ........................................................................... 119
Table 2.10: Factor by which poorest farmers are less likely to use a technology than wealthier farmers.123
Table 2.11: SIP field survey conducted in Nalanda district in November 2015 and December 2016. ..... 138
Table 2.12: SRI as portion of total budget in 2012-2017 Agriculture Road Map. .................................... 156
Table 2.13: Summary MIS fieldwork interviews ...................................................................................... 173
Table 2.14: Water purchasing by caste and tola in Bathani. ..................................................................... 188
Table 2.15: Importance of each STCM across cases. ............................................................................... 210
Table 2.16: Ranked order of STCMs by importance. ............................................................................... 212
Table 3.1: Comparison of rice management practices. ............................................................................. 254
Table 3.2: SRI as portion of total budget for 2012-2017 Agriculture Road Map. .................................... 291
Table 3.3: Evaluation of SRI by adopters from 11-village survey............................................................ 303
Table 4.1: Overview of fieldwork including interviews conducted and dates. ......................................... 337
Table 4.2: Drip adoption by country ......................................................................................................... 345
Table 4.3: Comparison of performance of NMMI across four states. ...................................................... 369
ix
Acknowledgements
It is a pleasure to acknowledge the many debts that I incurred over the course of writing this dissertation. First and foremost, I would like to thank my primary supervisor and mentor, William Clark (Harvey Brooks Professor of International Science, Public Policy and Human Development at Harvard Kennedy School). Without his guidance and steadfast support, the dissertation would never have been completed. I am forever indebted to him.
I am also extremely grateful to a number of individuals for their contributions to the birth of the ideas in this dissertation. This includes the sage council and deep insights into the dynamics of global food systems of Ray Goldberg (George M. Moffett Professor of Agriculture and Business, Emeritus); the keen understanding of the relationship between science, knowledge, and power that I gained through the mentorship of Sheila Jasanoff (Pforzheimer Professor of Science and Technology Studies at Harvard Kennedy School); the structured approach to understanding and analyzing institutions and their role in every aspect of our lives from Ryan Sheely (Associate Professor of Public Policy at Harvard Kennedy School); insights into the role of actors across scales and stratagies for capacity building from Matt Andrews (Edward S. Mason Senior Lecturer in International Development at Harvard Kennedy School) and finally, the understanding of the power of well-designed qualitative analysis as a methodology for elucidating complex problems, that I learned from Robin J. Ely (Diane Doerge Wilson Professor of Business Administration at Harvard Business School). Robert Paarlberg (Adjunct Professor of Public Policy at Harvard Kennedy School) also helped me to better understand the nuances of the political economy of agriculture, both in the United States and abroad. Posthumously, I am grateful to the insights of Calestous Juma (Professor of the Practice of International Development at Harvard Kennedy School) and John Briscoe (Gordon McKay Professor of the Practice of Environmental Engineering at Harvard University), both of whom provided helpful guidance in the early stages of this project.
I am also extremely indebted to my colleagues on the Project on Innovation and Access to Technologies for Sustainable Development at the Harvard Kennedy School, including Laura Diaz Anadon, Suerie Moon, Kira Matus, Gabriel Chan, Sharmila Murthy, and Vanessa Timmer. The many hours spent together, discussing the challenges and opportunities in reorienting global innovation systems to meet sustainable development goals, helped structure my thinking throughout this dissertation.
Many faculty members at Harvard, whose work is indirectly related to my field of study, nevertheless, managed to make important contributions to my intellectual journey at Harvard. Erez Manela (Professor of History at Harvard University), who led the Weatherhead Center for International Affairs’ Graduate Student Associate Program, was an invaluable source of support and energy throughout the process. Also at the Weatherhead Center, Director Michèle Lamont’s (Robert I. Goldman Professor of European Studies, Professor of Sociology and African and African American Studies at Harvard) support and mentorship helped me to hone my thinking around issues of equity and inequality. On a personal level, she also taught me how to better understand and adapt to the challenges facing women in academia. Co-convening a conference on agriculture technology for vulnerable farmers with Noel Michele Holbrook (Charles Bullard Professor of Forestry Professor of Biology) was an invaluable opportunity to learn more about the physical dimensions of many of the technologies I study in this dissertation and getting to know Professor Holbrook, on a personal level, was also incredibly rewarding. In addition, the wise counsel and friendship of James McCarthy (Alexander Agassiz Professor of Biological Oceanography) will never be forgotten.
In addition, this dissertation would not have been possible without the support and friendship of Nicole Tateosian (Director of Doctoral Programs at Harvard Kennedy School), Lorraine Maffeo (Coordinator for the undergraduate concentration Environmental Science and Public Policy Concentration

x
at Harvard College), Nancy Dickson (former Co-director of the Sustainability Science Program), Nora O’Neil (Associate Director of the Sustainability Science Program), Clare Putnam (Coordinator of Student Programs and Fellowships at the Weatherhead Center for International Affairs), and Lauren Bloomberg (former Assistant to Professor William Clark and current graduate student at Tufts Friedman School of Nutrition).
To my colleagues and friends in South Asia, I also owe a number of debts and thanks. My greatest debt is to Anil Verma, Executive Director of the NGO PRAN, Gaya and all of the staff at PRAN. Anil and his staff were an invaluable support in the field and provided friendship and family, far from home. I am also grateful to Anil’s wife, Archana Verma, for her frequent nourishing home cooked meals and concern for my well-being. In addition to Anil, I am grateful to the support of my dearest friend and colleague, Dr. Aditi Mukherji (Theme Leader, Water and Air at The International Centre for Integrated Mountain Development in Nepal). Aditi is like a sister to me and her insight into the research process, and her emotional support, have been invaluable over the course of this project. Beyond Aditi’s mentorship and support for my research, I am incredibly grateful to have become the godmother to her twin daughters, Maya and Saira, who were born in 2015 while I was in India. I love them more than words can say.
I also spent an intellectually engaging summer at the STEPS Centre at the University of Sussex in the UK towards the beginning of my PhD program. This experience was a critical cornerstone to the theoretical and empirical route I took in this dissertation. Thank you to John Thompson and Erik Millstone for taking the time to advise me over the course of the summer and allowing me to participate in the STEPs Centre’s own process of organizational reflection which was very valuable as an ethnographic experience of the process of organizational reflexivity well-administered.
I am also grateful for the support and friendship of Heather Henriksen (Director of Harvard’s Office for Sustainability) and her daughter Liv, who in addition to giving me a frequent place to stay in Cambridge when I was traveling back and forth between Bihar and Boston, welcomed me into her family in every way imaginable.
My best friend, Larissa de Lima, who joined me at Harvard Kennedy School during her master’s degree, made sure that life as a graduate student included more than just research and teaching. More importantly, she was the person I could talk to when things were difficult.
In addition, I owe a debt of gratitude to the staff and students in Mather House, where I served as a resident tutor for three years during my graduate studies. The Mather House community infused graduate student life with a greater sense of community and a shared common purpose. In particular, our House Masters, Christie McDonald and Michael Rosengarten, our fearless Resident Dean, Luke Leafgren, and my roommate and dear friend since freshman year of college, Scot Miller, an expert in modeling greenhouse gas emissions in the atmosphere, as well as in making the perfect 10 PM cocktail.
The many graduate students and post-doctoral fellows in the Sustainability Science Program, the Weatherhead Center for International Affairs and other parts of the greater Harvard community, who became my friends and family over the course of my time at Harvard, also offered both critical feedback and emotional support during the dissertation process. In particular, I would like to thank Gabriel Chan (whom I already thanked earlier, but who deserves it twice), Elizabeth Linos, Joey Yusuf Neggers, Tara Grillos, Simon Winter, Yeling Tan, Trisha Shrum, Soledad Prillaman, Rohit Chandra, Jason Warner, Nadav Orian Peer, Nilesh Asanga Fernando, Tannis Thorlakson, Jon Hellin, Asad Asad, Sa’ed Adel Atshan, Oyebola Okunogbe, Leah Stokes, Samuel Stolper, Janhavi Nilekani, Bernard Truffer, Christian Binz, Ahmed Abdel-Latif, Laura Pereira, Seth Avakian, Judson Valentim, Ram Fishman, Brian Dillon, Christina Ingersoll, Rachael Garrett, Meredith Niles, Lee Jared Vinsel, John-Arne Røttingen, Tone Enden, and Steven Hoffman for their friendship and support throughout the dissertation process.
I am also grateful for the support of my loving mother, Kay Linda Grace, and brother, Benjamin Harley, not only for cheering for me during graduate school, but for laying the many years of groundwork

xi
that got me here. Last but not least, I am eternally grateful to my fiancé, Sahil Gulati, who accompanied me on countless field visits and often acted as both driver and translator. It is hard to say whether I am more grateful to Sahil for helping me complete the dissertation, or more grateful to the dissertation for introducing me to Sahil (we met in Gujarat during the early stages of my fieldwork for the drip irrigation chapter). Whatever the answer, the pages of this dissertation benefited immeasurably from his tireless support.
I also gratefully acknowledge multiple generous sources of financial support that got me through this process. Foremost, I recognize the Sustainability Science Program at Harvard Kennedy School and Italy’s Ministry for Environment, Land, and Sea. I am also extremely grateful for the funding for the initial research travel expenses to conceptualize this project, which was provided by the Vicki Norberg-Bohm Fellowship, administered through the Sustainability Science Program. Funding to support the main portion of the research was generously provided by the Frederick Sheldon Traveling Fellowship. I also gratefully acknowledge additional funding from the Weatherhead Center for International Affairs Dissertation Completion Fellowship, the Switzer Environmental Fellowship, and the Ray Goldberg Fellowship for Research in Global Food Systems. I will always be proud to have been the inaugural recipient of the Ray Goldberg Fellowship, named in honor of my mentor and friend.
While perhaps less frequently acknowledged than mentorship, friendship, and funding, I am also indebted to the Sustainability Science Program, the Weatherhead Center for International Affairs, and the Harvard University Center for the Environment for providing me with wonderful desk space and free coffee during my graduate studies—a place to work, and coffee to fuel that work, are both essential to success as a graduate student.
Finally, I am sure there are a number of people that I have failed to acknowledge. Suffice it to say that any omissions were accidental and the product of a frantic graduate student trying desperately to finish the last pages of her dissertation.
xii
Dedication
The dissertation is dedicated to the many farmers who contributed to my research in India. I am deeply grateful for their time and patience in helping me understand their choices about their agricultural technology investments and practices, as well as the opportunities and constraints they face in accessing technology. I hope that this dissertation will, in some small way, make their lives better. And if (as is decidedly more likely) the results of this research do not in fact make a tangible difference in their lives, that at least they got a good laugh, watching me stumble clumsily through the paddy fields they navigate daily with grace.

xiii
Acronyms & Abbreviations
APMIP Andhra Pradesh Micro Irrigation Project BMPs Best Management Practices BISA The Borlaug Institute for South Asia BPCM Biophysical Causal Mechanism BREDA Bihar Rural Energy Development Agency CGIAR The Consultative Group on International Agricultural Research CIIFAD Cornell International Institute for Food, Agriculture and Development CIMMYT The International Maize and Wheat Improvement Center CIP The International Potato Center DSR Direct Seeded Rice EMP Electric Motor Pump GoB Government of Bihar GMO Genetically Modified Organism GTZ Deutsche Gesellschaft für Internationale Zusammenarbeit GGRC Gujarat Green Revolution Council HYV High Yielding Seed Varieties (typically associated with the Green Revolution) ICIMOD International Center for Integrated Mountain Development IWMI International Water Management Institute ISV Improved Seed Varieties (describes all seed varieties improved by modern science
including both older high yielding varieties, more recent hybrid seeds and even GM seed where available)
IFAD International Fund for Agricultural Development IRRI The International Rice Research Institute JEEViKA Bihar Rural Livelihoods Project (an autonomous body under Dept. Rural
Development GoB; jointly funded by World Bank) LCDI Low Cost Drip Irrigation MDGs Millennium Development Goals MIS Micro Irrigation Systems (includes drip and sprinkler irrigation systems) MLP Multi-Level Perspective NABARD National Bank for Agriculture and Rural Development NARS National Agricultural Research Systems NCPAH National Committee on Plasticulture Applications in Horticulture NREGA Mahatma Gandhi National Rural Employment Guarantee Act NMMI National Mission on Micro Irrigation NGO Non-Governmental Organization OBC Other Backward Caste groups Pradan Professional Assistance for Development Action (India-wide rural livelihoods NGO) PRAN Preservation and Proliferation of Rural Resources and Nature (NGO in South Bihar) R&D Research and Development SC/ST Scheduled Caste and Tribal Caste groups

xiv
SDGs Sustainable Development Goals SIP Solar Irrigation Pump SRI System of Rice Intensification STCM Sociotechnical Causal Mechanism RAU Rajendra Agricultural University in Bihar RWP Large diameter rubber pipe used for transporting water across fields in Bihar UC Upper Caste groups UN United Nations US Unites States of America USAID United States Agency for International Development USD United States Dollar (conversion rate used between USD and Indian rupees is 1:65) USDA United States Department of Agriculture WUE Water use efficiency
1
CHAPTER 1. Why does technology fail to benefit the poorest farmers? A sociotechnical approach to the study of innovation and poverty
1.1 Introduction
This dissertation seeks to derive policy relevant insights for reorienting the institutions
undergirding agricultural innovation systems to ensure the poorest farmers realize greater benefits from
agricultural technology. This dissertation is reported in four chapters. My empirical work is covered in
chapters two, three and four. This chapter provides an overview of my theoretical approach, situates my
research in the literature, and previews the main findings of the three empirical chapters. The three
empirical chapters focus on agricultural technology in India, and the reasons why agricultural
technologies contribute (or fail to contribute) to improved well-being for the poorest farmers. The
common thread among the three empirical chapters in the dissertation is a focus on understanding the
barriers that prevent the poorest farmers from realizing greater benefits from agricultural technology
innovation.
Understanding the barriers that prevent the poorest farmers from benefiting from the fruits of
technology innovation is important for two reasons. First, agrarian households account for 80% of the
world’s extreme poor (income of less than 1.90 USD per person per day). These households
simultaneously produce food and suffer from food insecurity (Kharas et al., 1994; Castañeda et al., 2016).
These households are also the targets of many of the UN’s Sustainable Development Goals (SDGs)
including Goal 1 “No Poverty”, and Goal 2 “Zero Hunger” (United Nations, 2015). Improving the ability
of the poorest farmers to benefit from agriculture technology will increase their food security and
contribute to achieving at least two of the UN’s 17 SDGs. Second, the world’s 475 million smallholder
farmers are a cornerstone of the global food system, producing up to 80% of the food supply in some

2
regions, including South Asia (Kanayo, 2011).1 By overcoming barriers to technology access for small
and marginal farmers, national and local governments and the development community can boost overall
food production in these regions.
It has long been understood that technological innovation is a cornerstone of continued agricultural
productivity growth, as well as important for creating solutions to the negative impacts of agricultural
production on the environment (Sundig and Zilberman, 1999; Ruttan, 2000; Sayer and Cassman, 2013).
Yet, scholars looking at the role of innovation in the pursuit of sustainable development – including
myself – have argued that "impoverished, marginalized, and future populations that are a central concern
of efforts to improve inclusive well-being too often lack the economic and political power to shape
innovation systems to meet their needs" (Anadon et al., 2016, p. 9682). While this is broadly true, why
some technologies are more successful than others at benefiting the poorest farmers is not well
understood. In this dissertation, I demonstrate that the benefits of agricultural technologies are often
skewed towards wealthier farmers. In the three empirical chapters, I analyze the barriers preventing the
poorest farmers from realizing greater benefits from technology. My hope is that this project will both
contribute policy relevant insights that improve the well-being of the poorest farmers, and sharpen the
focus of innovation studies more broadly on the relationship between technological innovation and
poverty.
1 Internationally, smallholder farmers are defined as having less than two hectares of land (Zimmerer, Lambin and Vanek, 2018). Many farmers in India (and in Bihar in particular) have significantly less land than this. Indeed, two hectares would be considered relatively large in the context of the field settings in this dissertation.

3
1.2 Theory
This dissertation draws on multiple schools of thought in innovation and technology studies but
relies primarily on three theoretical foundations: sociotechnical approaches in science and technology
studies; institutional approaches to the study of innovation systems; and multi-level approaches to the
study of technological transitions.
1.2.1 Theory: Sociotechnical Approach
The dissertation treats technology not as individual widgets, but as assemblages of artifacts and
practices, which are inextricably linked to the institutions and actors that undergird the complex processes
tying invention to widespread use. Borrowing from Harvey Brooks who, writing in Daedalus in 1980,
critiqued the most common contemporary definition of technology, “novel physical objects created by
man to fulfill certain human purposes” (Brooks, 1980, p.65 ). Rather, he argued that technology is better
understood by its function than its physical embodiment in artifacts. He defined technology as the
“expansion of the realm of human possibility” (Hannay and McGinn, 1980, p. 35). The critical theoretical
distinction Brooks made, was that by defining technology functionally, it was necessary to conceptualize
technology differently:
Technology must be sociotechnical rather than technical, and a technology must include the managerial and social supporting systems necessary to apply it on significant scale. (Brooks, 1980, p. 65)
His point was that to move from initial invention of a new technology to widespread use, required
both effective artifacts and practices, as well as effective social systems. This sociotechnical approach to
the study of technology coincided with a wealth of empirical research in science and technology studies,
looking at the co-evolution of technological and social systems (Bijker et al., 1987; Callon, 1990; Gieryn,
1995; Jasanoff, 2010). The sociotechnical approach captures the idea that processes and patterns of
technology adoption and scale, cannot be understood by looking solely at the physical attributes of

4
technology. Rather, the institutional structures, such as public policies, market logics, culture and beliefs
are critical to understanding why some technologies are adopted and others are not (Jasanoff and Kim,
2009).
A sociotechnical approach widens the lens of technology adoption research to include the
managerial and social supporting systems fundamental to widespread technology adoption. This allows
for identification of barriers to technology adoption that go beyond the attributes of the technologies
themselves, to the roles of actors and institutions in both creating and overcoming barriers (Anadon et al.,
2016). By using a sociotechnical approach to conceptualizing technology, the papers in this dissertation
are better positioned to elucidate the intertwined physical and institutional reasons why some technologies
benefit the poorest farmers more than others.
In the dissertation, I use the sociotechnical approach to technology studies to look at the factors
that influence the benefits the poorest farmers realize from technology. In order to use this approach,
precise language to differentiate between the physical and institutional aspects of technology is needed.
To refer to the aspects of technology imbedded in the physical artifacts or practices, I use the term
“physical dimensions” of technology or sometimes simply “the physical technology.” The physical
dimensions of technology may include technical aspects of design, such as the specifications of an electric
pump or irrigation system. Physical dimensions of a technology also include the agronomic practices
associated with the System of Rice Intensification (SRI).
To refer to the social and managerial aspects of technology, I use the term “institutional
dimensions” of technology. Institutions are the rules and norms, as well as culture and beliefs that
together make up the “social supporting systems necessary” (Brooks, 1980) to apply the physical
dimensions of technology at scale (North, 1990; March and Olsen, 2009). Institutional dimensions
include things like government subsidy programs, that might change the price a farmer pays for a physical
technology. However, a given subsidy institution may have specific rules that dictate who is eligible for

5
the subsidy, including requirements like socioeconomic status, the availability of land-title documents, or
other requirements that limit the benefits of the technology to certain groups of farmers. There may also
be norms associated with the subsidy institution. For example, extension officers responsible for the
program may expect farmers to approach them in their offices to receive the subsidy with some kind of
bribe or kick-back. In contrast, an alternate set of norms may send extension officers to villages to
advertise the availability of the subsidy program and target their outreach at the poorest communities. The
institutional dimensions of technology also include cultural norms, such as the relationships between
different social castes in a village, that mediate how information about physical technologies flows
between farmers, or how and when farmers engage in collective action behavior to demand better access
to a physical technology.
Of course, the physical and institutional dimensions of technology interact in complex ways. Two
physical technologies that achieve similar goals (e.g. irrigation for a crop) may use different quantities of
water (e.g. drip irrigation vs. flood irrigation). In this context, the institutions effecting the market price of
water will impact the benefits farmers realize from using each of the two physical technologies and may
influence their ultimate choice about technology adoption and use. If an institutional change, such as
electricity subsidies, impacts the price of the water that farmers face, the institutional dimensions of both
drip and flood irrigation will change. Likewise, the interaction between the institutional and physical
dimensions of each technology will also change the relative benefits a farmer realizes from each
technology.
From a policy perspective, it is possible for actors to intervene and change both the physical and
institutional dimensions of a technology. For example, by recruiting an engineer or an agronomist to
improve specific physical design elements of an existing technology or to design an entirely new physical
technology. Alternatively, actors can change the institutional dimensions necessary for technology
innovation and widespread use. Government actors, for example, can channel more funding into R&D,

6
NGOs can change the methods through which they support farmers in adopting technology in the field,
private sector companies can change the processes by which they select technology, or identify new
business opportunities that engage different groups of farmers.
In this dissertation, I evaluate both the physical and institutional dimensions of technology to
understand the barriers preventing the poorest farmers from realizing greater benefits from agricultural
technology. Using this logic, a technology may not benefit the poorest farmers because the design of the
physical dimensions of the technology does not meet their needs. This could be because the technology is
not useable on smaller landholdings. Alternatively, a technology may not benefit the poorest farmers
because the institutional dimensions of the technology skew benefits to wealthier farmers and away from
the poorest. This could be because the technology requires complex knowledge inputs that the poorest
farmers are more likely to have difficulty mastering, given their limited educational access. Or because
the initial capital investment is too high for the poorest farmers, and credit is unavailable for farmers
without sufficient collateral.
1.2.2 Theory: Innovation Systems
The sociotechnical approach to the study of technology is closely linked to a related approach
focused on innovation systems. In the same essay where Brooks laid out the sociotechnical nature of
technology, he defined innovation as the “process by which technology is conceived, developed, codified
and deployed” (Brooks, 1980, p. 67). Scholars have further articulated this approach, demonstrating that
innovation takes place within a complex “innovation system,” which includes the actors and institutions
that shape innovation processes across different sectors and scales (Lundvall, 1992; Nelson, 1993). The
dissertation situates the study of agricultural technology within the literature on the innovation systems
responsible for their production and scale. Specifically, the dissertation treats technological innovation as
a complex system with overlaps and feedback loops between different stages of the system, including
7
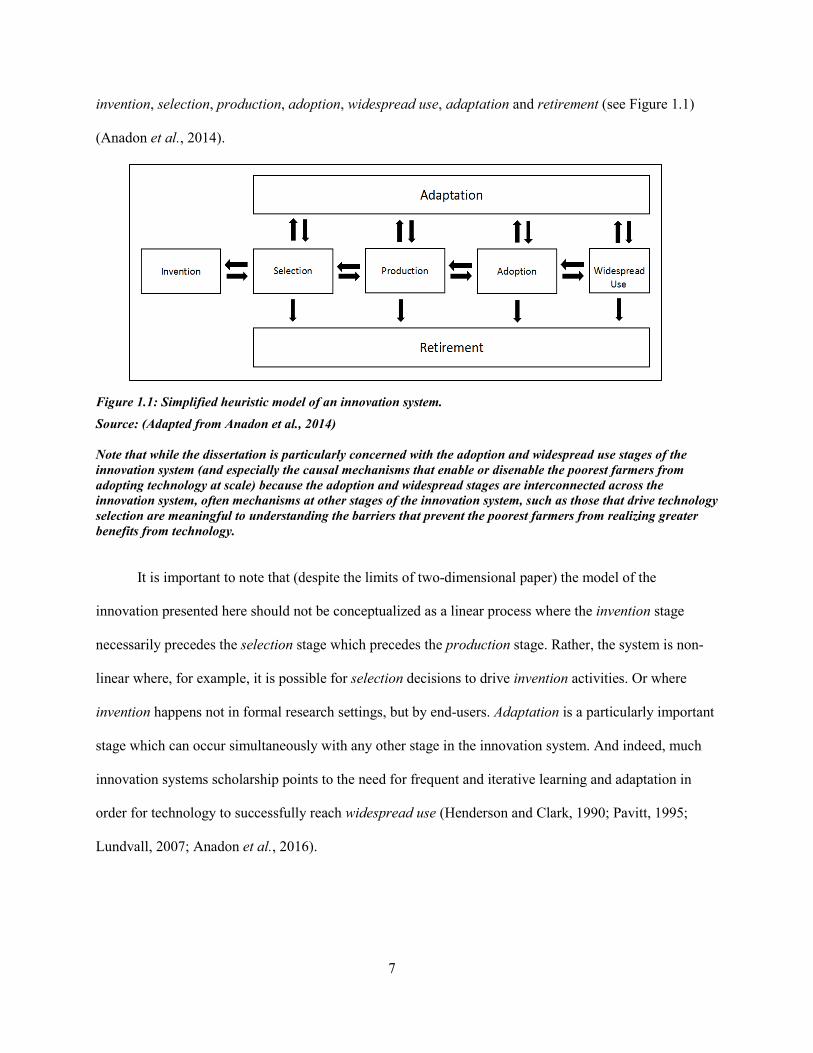
invention, selection, production, adoption, widespread use, adaptation and retirement (see Figure 1.1)
(Anadon et al., 2014).
Figure 1.1: Simplified heuristic model of an innovation system. Source: (Adapted from Anadon et al., 2014) Note that while the dissertation is particularly concerned with the adoption and widespread use stages of the innovation system (and especially the causal mechanisms that enable or disenable the poorest farmers from adopting technology at scale) because the adoption and widespread stages are interconnected across the innovation system, often mechanisms at other stages of the innovation system, such as those that drive technology selection are meaningful to understanding the barriers that prevent the poorest farmers from realizing greater benefits from technology.
It is important to note that (despite the limits of two-dimensional paper) the model of the
innovation presented here should not be conceptualized as a linear process where the invention stage
necessarily precedes the selection stage which precedes the production stage. Rather, the system is non-
linear where, for example, it is possible for selection decisions to drive invention activities. Or where
invention happens not in formal research settings, but by end-users. Adaptation is a particularly important
stage which can occur simultaneously with any other stage in the innovation system. And indeed, much
innovation systems scholarship points to the need for frequent and iterative learning and adaptation in
order for technology to successfully reach widespread use (Henderson and Clark, 1990; Pavitt, 1995;
Lundvall, 2007; Anadon et al., 2016).

8
While the three papers in this dissertation are not concerned with detailing each stage of the
innovation system for every technology (and in particular, the dissertation does not focus on incentives
for invention), diagnosing barriers to technology adoption by end-users requires a broader systems
perspective of innovation, including feedback loops between stages (e.g. weak demand in the adoption of
a technology sends engineers back to the drawing board to redesign the physical attributes of the
technology in the invention stage, or forces policy makers to re-think the institutional structures
supporting technology adoption through the design of extension services, subsidy programs, or risk
mitigation programs). By incorporating innovation systems thinking, the papers are better positioned to
understand the causal mechanisms determining the degree to which the poorest farmers benefit (or fail to
benefit) from technology, whether those mechanisms are directly linked to the adoption and widespread
use stages of the innovation system, or have their roots in the invention, selection, production, adaptation,
or retirement stages.
1.2.3 Theory: Sociotechnical Regimes and the Multi-Level Perspective (MLP)
Finally, the dissertation borrows specific theoretical language from the multi-level perspective
(MLP) on innovation systems from the sociotechnical transitions literature (Geels, 2002, 2004). This
literature is concerned with long-term transformative change in industries and sectors. To explain the
stickiness, inertia, and path dependence of technological change, this literature has developed the concept
of the “sociotechnical regime” which “forms the ‘deep structure’ that accounts for the stability of an
existing socio-technical system” (Geels, 2011, p. 27). This deep structure is made up of the “semi-
coherent set of rules that guide, orient and coordinate the activities of the social groups that reproduce the
various elements of socio-technical systems” (Geels, 2011). This understanding of sociotechnical regimes
relies heavily on institutional theory and especially, on the deep concepts of structure articulated by
Giddens in his theory of structuration (Giddens, 1986). Building off Giddens’s concept of deep structure,

9
Fuenfschilling and Truffer usefully define sociotechnical regimes as “highly institutionalized, yet not
necessarily coherent formal and informal rules (e.g. shared beliefs and values, routines, regulation,
institutionalized practices, capabilities, etc.) that mutually construct and are constructed by actors in a
system” (Fuenfschilling and Truffer, 2014, p. 773).
The concept of the sociotechnical regime is a key piece in linking the sociotechnical nature of
technology (Brooks, 1980; Bijker et al., 1987) with the technological innovation systems literature
(Lundvall, 1992; Nelson, 1993). All stages of an innovation system, from invention through widespread
adoption and retirement, take place within sociotechnical regimes, which are made up of the institutions
(rules, norms, culture, and beliefs) that coordinate the behavior of actors in the regime. In other words,
institutional structures shape innovation pathways and coordinate the activities of actors in a given
innovation system. While the MLP literature goes far deeper into the driving forces of innovation in the
regime, landscape (social trends and large special patterns such as wars, natural disasters, changes in
political coalitions) and local niche levels (alternate sociotechnical systems often pushed for by
alternative actor networks), their clarification of the sociotechnical regime that forms the institutional
‘grammar’ undergirding innovation offers an important theoretical grounding, that was absent from
Brooks’ work on the sociotechnical nature of technology and innovation. By exposing the institutional
backbone of innovation systems, the MLP literature underscores the importance of institutional theory in
the study of technology and innovation in social systems.
The contribution of the sociotechnical regime approach underscores the centrality of institutions in
stabilizing specific sociotechnical configurations and highlights an important dimension of the
dissertation. While I discussed the sociotechnical approach in Section 1.2.1, where both the physical and
institutional dimensions of technology are important factors in determining whether the poorest farmers
benefit from technology, the sociotechnical regime approach highlights the centrality of institutions in
structuring technological innovation systems. This insight is at the core of the approach behind the

10
researching and writing of this dissertation. In field settings, I looked at both physical and institutional
reasons why a particular technology benefited, or failed to benefit, the poorest farmers. But, my
conclusions have much more to say about institutional design than they do about the design of the
physical technologies themselves. This is largely a methodological preference (after all, I am not an
engineer), but I also argue that deep structural norms around technology invention and selection are
responsible for the types of physical technologies actors operating at the invention stage chose to invent,
and the kinds of physical technologies that actors operating at the selection stage chose to select for
production. Thus, if there is a chicken or egg debate around the primacy of technology or institutions in
undergirding change in innovation systems, unlike some coproductionist accounts, I come down at least
modestly on the side of institutions, which structure the behavior of actors across stages of the innovation
system.
Whether or not the institutions undergirding sociotechnical regimes incorporate the needs of the
poorest farmers systematically into the innovation process, is likely to have significant impact on the
benefits the poorest farmers realize from technology. Likewise, from a policy perspective, institutional
design can help reorient innovation systems across all stages (from invention to widespread use) towards
the needs of the poorest farmers. Reiterating the goal of this dissertation in the theoretical language
developed in this section: The three empirical chapters seek to understand both the physical and
institutional casual mechanism preventing the poorest farmers from realizing greater benefits from
technology, in order to derive policy relevant insights for reorienting the institutions structuring
agricultural innovation systems towards the needs of the poorest farmers.

11
1.3 Literature
1.3.1 Literature: Situating the Research in the Broader Discourse on Poverty and Inequality
During the (too) many years that went into the design, fieldwork, and writing of this dissertation,
concerns over rising global inequality grew in the popular consciousness and led a number of public
intellectuals to sound the alarm bells about the detrimental effects of inequality on our polity (Jensen,
1975; Piketty, 2015). As I struggled with synthesizing the findings from my research in January 2017,
Oxfam drew global headlines for their report that just eight men own the same amount of wealth as the
poorest half of the world’s population (Hardoon, 2017).
There are many ways to understand and measure inequality, including inequality in wages and
assets, inequality in access to resources, inequality in opportunities, and inequality in freedoms and
capabilities (Sen, 1999; Neckerman and Torche, 2007; Milanovic, 2013). The reasons to be concerned
about inequality are also multifaceted – scholars have identified multiple detrimental impacts of
inequality, both on the poorest people and on larger social systems, including impacts on health and
mortality, educational outcomes, crime, and political stability, among others (Neckerman and Torche,
2007).
In response to these concerns, the United Nation’s broadened their focus from poverty and hunger
in the Millennium Development Goals (MDGs), which launched in 2000, to include a specific focus on
inequality in the 2015 Sustainable Development Goals (SDGs). In including reduced inequality as goal 10
of the SDGs, the United Nations noted that “while income inequality between countries may have been
reduced, inequality within countries has risen” (Goesling, 2001; United Nations, 2016). This empirical
finding challenges theories of trickle-down economics. The UN argues that at the scale of the nation,
“economic growth is not sufficient to reduce inequality if it is not inclusive” and to be inclusive, policies
promoting economic growth must pay more “attention to the needs of disadvantaged and marginalized
populations” (United Nations, 2016).

12
This dissertation was written in the context of these larger concerns about trends in global poverty
and inequality, and is an attempt to place the lens of innovation and technology studies more squarely on
the challenges and opportunities facing the poorest. At the macro scale, research has uncovered links
between surges in technological innovation and increased inequality (Milanovic, 2016). Of course, this in
and of itself is not entirely concerning. Along the lines of Jagdish Bhagwati’s argument and empirical
findings that while economic growth benefits wealthier segments of society, it also tends to benefit the
poorest (Bhagwati, 1988), many technologies similarly may benefit the wealthy while also benefiting the
poor. My argument is not that all technologies should benefit all farmers equally. Rather, that embedded
in the SDGs there is a social goal of developing and deploying technologies that will help the poorest.
With this goal in mind, innovation scholars ought to worry about why so many efforts to mobilize
technology to help the poorest seem to fail. Yet we have a dearth of conceptual tools with which to
discuss the differentiated impact of technological innovation on poverty and inequality.
More generally, the literature on poverty and inequality lacks precision when it comes to the
distinction between interventions that target poverty (focus on the bottom quintile) and interventions that
target inequality (reduce differences between the poor and the wealthy). Conceptually, a technology can
be judged both on its potential to reduce poverty as well as its potential to reduce inequality. What is
important to understand is that these two metrics are not the same. Technologies that benefit the poor may
also benefit the rich, and perhaps benefit the rich relatively more than the poor, thereby increasing
inequality while still decreasing poverty. On the other hand, technologies may benefit the poor while
having no benefits for wealthier social groups. In this case, the technology would both reduce poverty and
inequality. It is possible to think about a two-by-two matrix of technology types with respect to their
benefits to the poorest farmers (see Figure 1.2).

13
Figure 1.2: Stylized conceptualization of the impact of technology on poverty and inequality.
1). “Pro-Poor” Technologies: Technologies that benefit the poorest in particular. These
technologies have low benefits or are otherwise unattractive to other social groups. These technologies
are similar to a consumer theory definition of inferior goods, in that they have high utility under low
levels of wealth, but as wealth rises, people will tend to switch away from these technologies. These
technologies could be said to be inequality reducing, in that the poor benefit from them relatively more
than wealthier groups. Examples of these technologies include some types of public transportation,
especially intra-city bus services in the US, which are significantly cheaper than rail and air transit
options, household fans and water coolers when air conditioning is unaffordable, and low cost water
filters, such as ceramic pots where the poor cannot afford access to higher quality water supplies (Murthy
et al., 2013).
2). Technologies that “raise all boats”: These technologies benefit all groups, though they may
benefit some groups more than others. If the wealthy benefit more from these technologies than the poor
then the technology would increase inequality, while at the same time reducing poverty. An example of

14
this type of technology includes much of modern medicine, such as x-rays and vaccines, which likely
benefit the wealthy more because of better access to healthcare, but certainly also benefit the poorest.
Other examples likely include paved roads and airplanes.
A salient example of technologies that “raise all boats” from the perspective of this dissertation,
which has recently been the subject of a great deal of empirical research and popular writing, is the role of
cellular phones in helping developing countries technologically leapfrog developed countries (James,
2009; Aker and Mbiti, 2010). Cellular technology has certainly benefited all social groups but perhaps
especially benefited the poorest communities in developing countries, by providing access to other
services, such as mobile banking. In Kenya, one channel through which mobile banking has benefited the
poorest farmers is through the ability of relatives and friends who have migrated to urban centers to easily
transfer cash back to rural areas. More generally, in cash-based economies where the percentage of the
population with access to traditional banking services is low and largely confined to the wealthy, mobile
banking specifically benefits poor farmers. This in turn has been found to improve resilience among small
farmers, decrease farmers’ perceived risk, and promote more investment in technological inputs
(Kikulwe, Fischer and Qaim, 2014).
A second example of a technological innovation system that “raised all boats” can be found in the
history of efforts to develop malaria treatments. Early efforts to development treatments for malaria were
driven by the desire of European colonial powers to protect their own militaries and economic interests in
their colonies (Keusch et al., 2010). These early efforts to create technologies “for the rich” later evolved
into a much more inclusive innovation system with significant benefits for the poorest communities, as
transnational actors, including the Bill & Melinda Gates foundation, build on earlier research in an effort
to eradicate malaria (Gates, 2007).
3). Technologies for the rich: These technologies benefit the wealthiest people or groups while
having limited to no benefits for the poor. These technologies increase inequality and have no impact on
15
poverty reduction. Examples of this technology include high end smart phones, expensive cars, expensive
cheeses and wines, and potentially even powerful personal computers, which are too expensive for the
poorest to buy. Going beyond this even if the poorest had access to these computers, they likely would
not have the necessary training or skills to make full use of the physical technology.
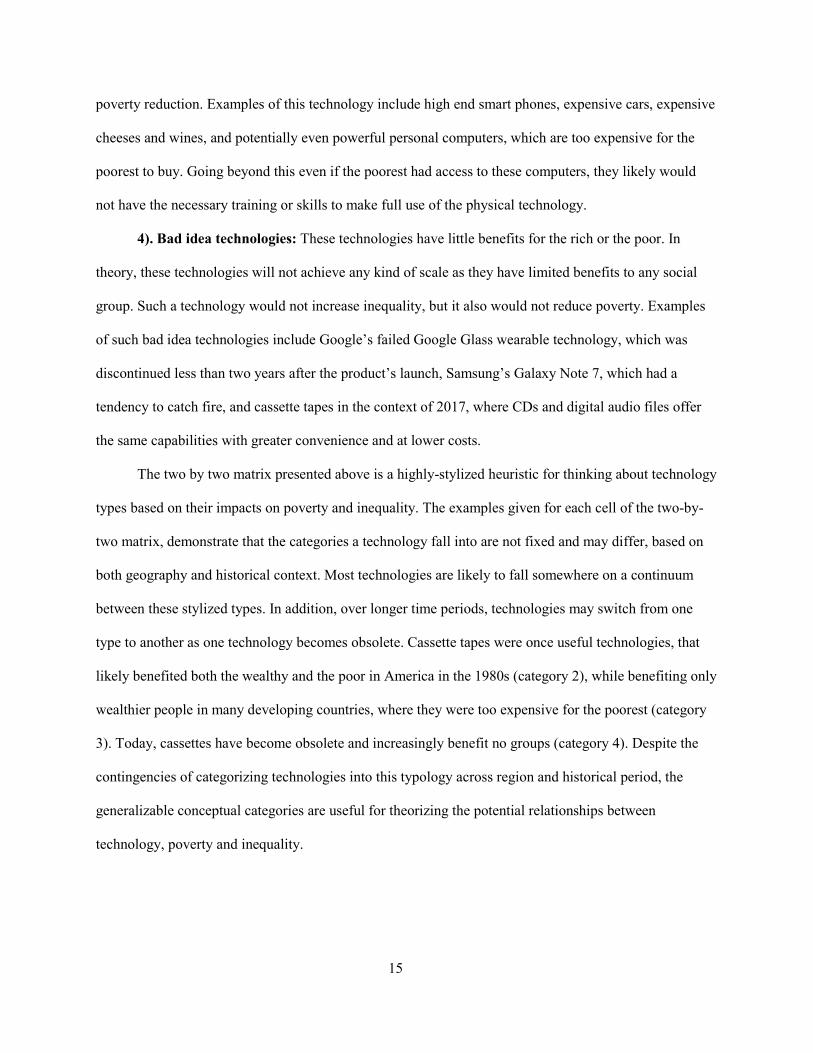
4). Bad idea technologies: These technologies have little benefits for the rich or the poor. In
theory, these technologies will not achieve any kind of scale as they have limited benefits to any social
group. Such a technology would not increase inequality, but it also would not reduce poverty. Examples
of such bad idea technologies include Google’s failed Google Glass wearable technology, which was
discontinued less than two years after the product’s launch, Samsung’s Galaxy Note 7, which had a
tendency to catch fire, and cassette tapes in the context of 2017, where CDs and digital audio files offer
the same capabilities with greater convenience and at lower costs.
The two by two matrix presented above is a highly-stylized heuristic for thinking about technology
types based on their impacts on poverty and inequality. The examples given for each cell of the two-by-
two matrix, demonstrate that the categories a technology fall into are not fixed and may differ, based on
both geography and historical context. Most technologies are likely to fall somewhere on a continuum
between these stylized types. In addition, over longer time periods, technologies may switch from one
type to another as one technology becomes obsolete. Cassette tapes were once useful technologies, that
likely benefited both the wealthy and the poor in America in the 1980s (category 2), while benefiting only
wealthier people in many developing countries, where they were too expensive for the poorest (category
3). Today, cassettes have become obsolete and increasingly benefit no groups (category 4). Despite the
contingencies of categorizing technologies into this typology across region and historical period, the
generalizable conceptual categories are useful for theorizing the potential relationships between
technology, poverty and inequality.
16
This dissertation is concerned with the impact of technology on poverty. This group has been
alternatively defined as the “bottom billion” (Collier, 2007) or more commonly, as the poorest quintile of
the population (Baulch and Hoddinott, 2000; Coady, Grosh and Hoddinott, 2004). Technologies that
benefit the bottom quintile can either be category 1 technologies (those that are specifically “pro-poor”)
or category 2 technologies (those that “raise all boats” by benefiting multiple socioeconomic groups
including the poorest).
The impact of technology on inequality, rather than poverty, is largely outside the scope of this
dissertation. However, the distinction is still conceptually important. Indeed, understanding which
technologies are specifically “pro-poor” versus technologies that “raise all boats,” has important
implications for political strategies across all stages of the innovation system. For example, “pro-poor"
technologies may require greater public sector and donor investments at the invention stage. In contrast,
technologies that “raise all boats” may have more private sector actors participating across stages of the
innovation system but may still require public sector intervention at the adoption and widespread use
stages, to ensure the poorest also benefit. Finally, it may be wise for governments to limit their investment
and support for technologies that would primarily benefit wealthier groups.
By conceptualizing the impact of technology on poverty (and inequality), the approach presented
in this section opens the door for researchers and policy makers to evaluate innovation systems, not only
for their contributions to efficiency and productivity in agricultural systems, nor for their ability to reduce
labor requirements, or even for their environmental externalities, but also for the way different
sociotechnical configurations impact fundamental social relationships in agriculture systems. While this
study focuses only on technologies that benefit the poorest (irrespective of their impact on inequality)

17
there is scope for further research that disentangles these relationships in order to marshal technology, not
only to reduce poverty, but also inequality.2
1.3.2 Literature: Innovation and Poverty in the Literature
While the development community switched their focus from economic growth to poverty
reduction in the late 1980s and 1990s (World Bank, 1990, 2001; IFAD, 2016), the literature on innovation
has been slow to engage with this challenge. At the same time, the SDGs include specific goals on both
poverty reduction (goal 1), and innovation (goal 9). Clearly, innovation has a role to play in meeting the
SDGs. However, there is a need in the innovation literature for greater focus on the issue of poverty, and
the ways in which the extensive literature on innovation can contribute to our understanding of how to
make technology work for sustainable development.
This section reviews several disparate literatures on innovation and poverty and situates this
dissertation within these literatures. What will be clear by the end of this brief literature review is that the
union of these two literatures is relatively sparse and undertheorized. This dissertation brings these two
literatures together to provide policy relevant guidance for reorienting innovation systems to better meet
the needs of the poor.
There is a rich and varied set of literatures addressing the complexities of technological
innovation. While interest in the dynamics of innovation date back to at least the nineteenth century and
the work of Karl Mark in Das Kapital (1867), modern innovation studies began with the work of Joseph
Schumpeter, in his explanation of business cycles as innovation-driven processes of change in which
2 This is not to say that reduced inequality is always the social or political goal that should be pursued. Indeed, some level of inequality is an emergent property of social environmental systems. At the same time, the evidence that the world today has become too unequal is mounting and the causal role of technology as a driver of increased inequality is frequently discussed in the issue rhetoric. A better analytic approach and more empirical data is needed to offer policy relevant advice for how technology can be marshalled for the dual goals of poverty reduction and inequality reduction. This conceptual framework is a first stab in this direction and should be developed further.

18
societies respond creatively to changes in the factors of production (Schumpeter, 1947, 1982). Later work
by Robert Solow demonstrated that increases in labor and capital alone are not sufficient to explain
economic growth. Instead, he argued that “technological change” is central to explaining economic
growth (Solow, 1957). By demonstrating the link between technological improvements and economic
growth, Solow showed the importance of investment in basic research and R&D – an insight which
spurred many countries, including the United States, to invest heavily in their national research capacity.
Since Solow’s seminal work, a large body of empirical literature has arisen which seeks to quantify the
value of investing in research and development (R&D) (e.g. Griliches, 1981; Jones & Williams, 1998).
Investments in R&D in the agricultural sector, for example, are estimated to yield a rate of return
somewhere between 40 and 60% (Alston et al., 2000).
Since the iconic studies of Schumpeter and Solow, a wide-ranging literature in economics, science
and technology studies, management studies, and other disciplines has expanded our understanding of the
relationship between innovation, economic growth, and development. Major contributions to the
economics of innovation were made by agricultural economists Yujiro Hayami and Vernon Ruttan, who
showed that the causes of agricultural productivity growth (or stagnation) required understanding not only
changes in factors of production (e.g. labor, inputs, water), but also the larger institutional conditions
under which agricultural growth takes place. They developed a model that included “technological and
institutional change as factors endogenous to the economic system” (Hayami and Ruttan, 1971, p. 1). The
importance of technological and institutional change in driving change in agricultural productivity meant
that a wide range of actors, including governments, researchers, and the private sector, all played
important roles in the functioning of agricultural systems. In their model of agricultural innovation, which
they called the “induced development model,” Hayami and Ruttan argue that processes of change in any
agricultural system are “induced by farmers, agribusiness and administrators” responding to changes in
factors of production and market prices by demanding new technologies that either save land or labor,

19
depending on their relative scarcity. Perhaps the most critical insight to come out of Hayami and Ruttan’s
work was that there is variation between different contexts, not only in terms of their relative allocations
of land and labor, but also in terms of their institutions. Their approach to understanding agricultural
systems was particularly nuanced in identifying the barriers to agricultural productivity across contexts
(e.g. the United States and Japan (Hayami and Ruttan, 1971), and India and East Asia (Hayami, 1981). In
addition, their identification of the “non-agricultural sector” as a vital source of knowledge and technical
input into agricultural systems, was a novel insight – without effective coordination between disparate
parts of the larger system in which agriculture operates, they argued, the necessary technological change
for agricultural development will not take place.
In summary, Hayami and Ruttan argued for a view of technology innovation that includes actors
and institutions, across a wide range of activities, relevant to agricultural production. They also argued
that effective alignment between these different parts of the system is critical to the performance of the
system as a whole. Despite their significant contributions to the field of innovation studies, their work
was not particularly concerned with the impacts of innovation across socioeconomic groups. This failure
to contemplate how the needs of the poorest farmers fit into induced innovation models was perhaps their
largest oversight, and would require more input from sociologists and organizational theorists to solve.
Their oversight was that in order for the induced innovation model to work, famers facing different
allocations of land and labor, as well as variated agroecological and sociotechnical constraints, would
need to be able to communicate their demands to other actors in the system – specifically, actors
operating in the invention and selection stages of the innovation system. There are multiple ways to view
these pathways of communication. Many economists assume they happen through price signals, where
private sector companies develop technologies for which they see a profitable market. In contrast, the
premise of the Land Grant University System in the United States is that that these universities conduct
research based on close collaboration with and understanding of farmers’ needs. This model relies on

20
social and organizational ties rather than economic incentives, to “induce” the right kinds of innovation
that farmers need. However, for the poorest farmers, the pathways by which they can communicate their
needs into the larger agricultural innovation system are not as clear. Like concerns over neglected
diseases (Trouiller et al., 2002; Moon, Bermudez and ’t Hoen, 2012) and orphan crops (Naylor et al.,
2004), in theory, it is quite easy to imagine that there are many neglected technological needs, where the
induced innovation model has failed because the poorest farmers lacked the purchasing power or voice to
communicate their needs into the agricultural innovation system.
In many ways, the work of Hayami and Ruttan presaged a particularly productive approach to
studying innovation that emerged in the 1980s – namely, the study of innovation as a complex adaptive
system. Innovation systems scholars focus on how societies generate, exchange and use knowledge and
technology, as well as the benefits (and costs) of these processes. Within this perspective, an innovation
system is broadly defined as the set of agents involved in the innovation process, their actions and
interactions, and the institutions (rules and norms) that guide and constrain the agents in the system
(Edquist, 1997). The systems approach to innovation was first explicitly introduced in the literature by
Freeman (1987), who like Hayami, drew a great deal of his empirical experience from Japan. In the
innovation systems literature, innovation emerges out of the interaction between organizations and
institutions. Much of this literature focuses on understanding the determinants of innovation, including
political and economic factors, and the impact of innovation processes, from invention through
widespread use, of new knowledge and technology. While there is now a wealth of literature on
innovation systems (e.g. Lundvall, 1992; Nelson and Nelson, 2002; Hekkert et al., 2007) little of this
literature focuses specifically on the links between technological innovation and its impacts on the poor,
and none of this literature (that I could find) looks at the relative impacts of technology across
socioeconomic groups.

21
A related literature discussed in Section 2.3 of this chapter, the multi-level perspective (MLP), is a
theoretically rich and empirically grounded analysis of the sociotechnical nature of innovation. It draws
on both the innovation systems literature, as well as literature in science and technology studies, to build a
historically embedded understanding of the intertwined processes of technological and social change. The
field originated with the study of the dynamics of technological change, focusing almost exclusively on
historical examples, including the transition from sailing ships to steamships, and from horse drawn
carriages to automobiles (Geels, 2005, 2002). In more recent years, the field has increasingly begun to
grapple with the nature of sociotechnical change in the context of sustainable development (Kemp and
Loorbach, 2007; Markard, Raven and Truffer, 2012), particularly transitions toward low-carbon
economies (Hake et al., 2015; Geels et al., 2016). However, the MLP field has largely failed to focus on
empirical cases that address the dynamics of innovation in developing countries, or to focus on the
specific challenges facing the poorest populations, whether in the developed or developing world
(Loorbach, Frantzeskaki and Avelino, 2017) – with a few exceptions, including an analysis of transition
dynamics in energy systems in Asia (Berkhout, Angel and Wieczorek, 2009) and a study of the
emergence of the Chinese solar PV sector (Binz and Anadon, 2016). Neither of these papers, however,
address the issue of differentiated impacts of technology across socioeconomic groups.
One of the few fields to directly address the relationship between innovation and poverty reduction
is business and management studies. In a 2012 special issue in the Journal of Management Studies, the
authors explored emerging research on “inclusive innovation.” In the introduction to the special issue
George et al. (2012) define inclusive innovation as “innovation that benefits the disenfranchised” and sees
inclusive growth as the “desired outcome of innovation initiatives that target individuals in
disenfranchised sectors of society, as well as, at the same time, a characteristic of the process by which
such innovative initiatives occur” (p. 661). This nascent literature is one of the few literatures to focus
explicitly on the potential link between innovation and its impacts on poverty.
22
Coming out of business and management literature, much of the inclusive innovation literature is
concerned with Bottom of the Pyramid (BoP) business models that see the poor as an untapped market for
growth and largely focuses on product and business model innovation that more effectively turns the poor
into consumers (Nestlé, 2011). Other authors in this literature offer a more critical lens, arguing that much
of what is published under the heading of inclusive innovation is less about improving the well-being of
the poorest than it is about market creation for private sector companies (Ansari, Munir and Gregg, 2012).
In a compelling moral argument, Ansari et al. call for future research in the field to measure inclusive
growth not only in terms of impact on market engagement, but in terms of impact on the capabilities of
the poorest. This call to reframe the goals of the BoP and inclusive growth literature is in line with
Amartya Sen’s capabilities approach to conceptualizing the ends of development (Sen, 1999). However,
despite Ansari et al.’s appeal to focus more explicitly on the well-being of the poorest, no subsequent
studies have clearly taken on this challenge.
Over optimistic assumptions about inclusive innovation have also been highlighted by the World
Bank in their 2016 report “Digital Dividends,” which argues that while digital technologies have
enormous potential to improve the lives of the poorest, to achieve these goals, greater digital adoption
must be combined with “analog complements,” including “strengthening regulations that ensure
competition among businesses, by adapting workers’ skills to the demands of the new economy” (World
Bank, 2016). Without changes in the institutional dimensions of new digital technologies, the World Bank
worries that the benefits of new technologies will be disproportionately accrued by wealthier and better
educated populations in developing countries.3
With its roots in Hayami and Ruttan’s work on the drivers of innovation in the agricultural sector
(Hayami and Ruttan, 1971, 1984), and drawing on later scholarship on innovation systems across sectors
3 This is one of the few studies I have come across that explicitly looks at the heterogeneous benefits of technology across socioeconomic groups.

23
(Lundvall, 1992; Edquist, 1997; Nelson and Nelson, 2002; Charles Edquist, 2005), a sub-literature on
agricultural innovation systems has emerged over the past thirty years. One of the earliest papers applying
innovation systems thinking to agriculture looked at the relationship between formal R&D and informal
or farmer-led R&D (Biggs and Clay, 1981). In their paper, Biggs and Clay argue that despite the
“comparative static analysis” of the impact of technologies, such as irrigation systems and high yielding
seed varieties (HYVs) on farmer well-being coming out of the agricultural economics literature, the
relationship between technology and socioeconomic outcomes has not been studied in the context of the
larger “innovation systems” which produces these technologies (p. 323). To better optimize the allocation
of research funding in the R&D system, the authors argue that it is necessary to understand the role of
both informal and formal R&D, within the context of the specific sociotechnological systems facing
farmers in developing countries. Their study, while not explicitly teasing out the sociotechnical
mechanisms undergirding variation in benefits of technology across socioeconomic groups, goes a long
way towards articulating the need for such an approach in the future.
Following on Biggs and Clay (1981), later work in agricultural innovation systems, while
contributing important insights to the drivers of innovation in the agriculture sector, lacked the focus on
the impact of technology across socioeconomic groups that Biggs and Clay called for in their article.
Moreover, too much of the agricultural innovation systems literature continues to focus on the developed
world (e.g. Klerkx and Leeuwis, 2009), and the research that does expand its focus to the developing
world largely overlooks differences between socioeconomic groups of farmers, unconsciously assuming
that technologies and changes in innovation systems will impact all farmers equally in a given context
(Clark, 2002; Kilelu, Klerkx and Leeuwis, 2013; Schut et al., 2015). For example, in an analysis of
agricultural innovation systems in India, the authors demonstrate the importance of “research
partnerships” between public agricultural research centers and the private sector for improving the overall
functioning of innovation systems (Hall et al., 2001). However, the authors do not address the issue of

24
heterogeneous impacts of technology across socioeconomic groups of farmers, despite the fact that Indian
farmers are highly diverse both across geographies and socioeconomic groups, and that agricultural
innovation policy has almost certainly already created winners and losers (Prahladachar, 1983; Prakash,
2005).
In a second example, Lamers et al. (2017) usefully apply the functions of the innovation systems
approach developed by Hekkert et al. (2007), to three countries in sub-Saharan Africa. They evaluate the
performance of innovation platforms, and make a useful contribution to the literature, by identifying
obstacles in transitioning innovation platforms set up with a research mission into innovation platforms
that can foster innovation through private sector channels with the potential to outlive the life of the
original research project. However, their analytical approach fails to differentiate farmers across
socioeconomic groups, rather assuming all farmers in their case studies have the same interests and face
the same opportunities and constraints. A review of the few other studies applying agricultural innovation
systems frameworks to the developing world, shows that the black-boxing of farmers into a single
homogenous interest group is endemic to this literature.
An exception to the absence of research into the relationship between technology innovation and
poverty is a working paper from 2002 by Berdegué and Escobar, which was, unfortunately, never
published as a more formal journal article. Their paper integrates extensive research by the authors on the
complex “multi-dimensional” nature of rural poverty with innovation studies to “argue for a differentiated
approach to targeting agricultural innovations, based on an analysis of rural assets” (2002, p. i). This
useful contribution points to the differential benefits that technology can have across different categories
of rural poor households. While their insight that technological innovation is likely to impact different
categories of rural households differently is novel, the working paper is largely a theoretical identification
of the problem, and does not offer an empirical investigation of the relationship between innovation and
poverty.
25
Like Berdegué and Escobar, Spielman et al. (2009) writes about the important role that innovation
studies can play in helping to better understand and intervene in agricultural systems in the developing
world. They also note the scarcity of studies in the innovation systems literature that “examine the
poverty-related effects of innovation processes” (p. 5). Moreover, they usefully note that “few studies
make the leap from descriptive ex post analysis of an innovation system to ex ante analysis of how an
innovation system promotes institutional and technological changes that are explicitly pro-poor” or that
focus on “sustainability and equity” (p. 5). While Spielman et al. (2009) do not include an empirical case
that addresses these issues, they do offer several methodological approaches, including social network
analysis, innovation histories, and comparisons across countries, which they think will help scholars
better investigate the links between agricultural innovation and poverty.
Berdegué and Escobar (2002) and Spielman et al. (2009) notwithstanding, this brief overview of
the agricultural innovation literature underscores the underdevelopment of this literature with respect to
the needs of the poorest.
A final strand of literature on innovation deals more directly with issues of poverty. This is the
grassroots innovation led by Anil Gupta (among others) at the Indian Institute of Management
Ahmedabad (IIMA) in the state of Gujarat. This literature grapples with the important point that the poor
often create novel solutions to their own problems, and looks at ways to scale these solutions so that
individual innovations that solve problems in one location are transportable to other locations (Gupta,
2016). Gupta and colleagues have built a community of scholars and activists, called the Honey Bee
Network, to catalog a database of local knowledge and innovations. The Honey Bee Network has thus far
cataloged over 100,000 “ideas, innovations and traditional knowledge practices” of the poor (Honey Bee
Network, no date). The poor, they assert, may not be monetarily wealthy, but they nonetheless have
enormous capabilities to frugally and creatively solve their own problems. By fostering local innovations,
the grassroots innovation community argues that they are both promoting appropriate innovation for the

26
realities of the rural poor, and empowering the creativity and valuable traditional knowledge of these
communities.
The grassroots innovation literature shares a great deal epistemologically with literature in science
and technology studies, which posits that technologies must be understood in relation to social systems
and that technological change and social change are firmly intertwined. As such, we cannot understand a
complete picture of either social or technological systems without reference to the other (Callon, 1998;
Jasanoff, 2010). Building on this understanding of technology as inextricably intertwined with social
systems, the grassroots innovation literature sees innovations systems as systems that can be studied and
judged, not only for their contributions to efficiency and productivity, or even for their ability to reduce
labor requirements or environmental externalities, but also for the way different technologies embody and
reproduce specific forms of power and authority within social systems (Winner, 1980). By promoting
local and frugal innovations, scholars of grassroots innovation argue that they are promoting technologies
that bring positive benefits to the poorest. At the same time, they are acknowledging and countering the
biases of so much technology and innovation research, which despite increased attention to the non-linear
nature of innovation, continues to ignore the contributions of the poorest to innovation processes.
Finally, my own work with colleagues has grappled with the issue of how to ensure innovation
systems meet the needs of vulnerable populations, now and in the future. In an invited Perspectives article
for the ‘Proceedings of the National Academies of Science’ (PNAS) we argue that “the current institutions
(rules, norms, and incentives) shaping technological innovation are often not aligned toward the goals of
sustainable development because impoverished, marginalized, and unborn populations too often lack the
economic and political power to shape innovation systems to meet their needs” (Anadon et al., 2016,
p. 9682). The paper concludes that measures to systematically take into account the interests of
underserved populations are urgently required in innovation and technology studies, and that institutions
need to be reoriented toward sustainable development across stages and scales. This dissertation takes up

27
this charge, looking specifically at how to make the institutions structuring agricultural innovation
systems work for the poorest.
1.4 Fieldwork Setting
An observation made in 1981 by renowned Japanese agricultural economist Yujiro Hayami,
highlights some of the reasons why India is a particularly rich field setting for a project focused on the
relationship between agricultural technology and poverty. On Hayami’s first visit to the subcontinent, he
made field visits over the course of three months to Haryana, Karnataka, Kerala, and Uttar Pradesh.
Despite the brevity of his visit, his comparative view of India’s agricultural system, with respect to that of
East and Southeast Asia, was insightful. He observed that the “basic root of poverty and inequality” was
the same in both India and East/Southeast Asia (Hayami, 1981, p. 708). Both regions, he argued, had low
rates of return on labor due to low levels of technology adoption, caused by limited endowments of land
and capital relative to labor. In addition, both regions faced extreme inequality in endowments of capital
assets across socioeconomic groups. However, Hayami thought India’s challenges were greater because
of sharp class conflicts between landowners and laborers. In East/Southeast Asia, a technocratic approach,
which focused on intensification of agriculture through investments in irrigation and land-saving and
labor-using technologies, had led to growth in employment and wage earnings. In contrast, in India he
worried that the same technocratic approach “may induce mechanization under the condition of high
labour transaction costs” thereby aggravating, rather than ameliorating, the challenges of poverty and
inequality in the country (p. 707). At the same time, a “reformist” approach aimed at redistributing land to
the poorest also seemed infeasible in India, because the majority of land was not in the hands of large
absentee landowners, but rather small and medium cultivators, making redistribution technically and
politically infeasible. Hayami concluded that India would have to carefully balance a technocratic and

28
reformist agricultural agenda if the country were to make progress in decreasing rural poverty and
inequality (Hayami, 1981).
Almost 40 years after Hayami made these observations and more than 75 years since the start of
the Green Revolution, India still struggles with the challenges of balancing technocratic and reformist
approaches to agricultural development (Witsoe, 2006). And in some places like Bihar, the challenge of
balancing technocratic and reformist approaches has proven especially difficult. Between the late 1960s
and early 1980s, the Green Revolution came to some parts of India, but the revolution was by no means a
nationwide phenomenon. In the years immediately after the start of the Green Revolution, the North-West
region of India, including Punjab and Haryana, saw an average annual compound growth rate of 3.39%.
In contrast, the eastern region of the country, including Bihar, Orissa, and West Bengal, lagged far behind
with an average annual compound growth rate of 1.3% between 1965 and 1983 (Singh, 2010). Research
into the causal mechanisms undergirding these stark differences in growth rates, identified strong inter-
regional variation in the adoption of modern seed varieties as the primary driver of the yield gap
(Prahladachar, 1983).
The inter-regional yield gaps caused increasing inter-regional income differences over this same
period, indicating that regions that benefited from the Green Revolution technologies saw corresponding
benefits to the well-being of their populations (measured in terms of income). What is perhaps even more
interesting is that while inter-regional differences in technology adoption were high, intra-regional
differences between small and large farmers were relatively low, indicating that farmers across
socioeconomic spectrums benefited from the introduction of improved seed varieties within a given
region (Prahladachar, 1983). The characteristics that distinguished the regions that benefited from the
Green Revolution from those that did not were differences in the development of infrastructure, as well as
differences in the extent of administrative and institutional support for the agricultural sector
29
(Prahladachar, 1983; Chopra, 1985). In other words, inter-regional variation in sociotechnical regimes
strongly impacted the benefits accrued by regions from the new Green Revolution technologies.
While the stark inter-regional differences in agricultural output and adoption of improved seed
varieties leveled off to some extent in the 1990s, there are still significant differences in the sociotechnical
regimes undergirding the agricultural systems across states in India. This variation in sociotechnical
regimes is one reason India is a particularly interesting field site for the study of agricultural technology. I
make use of this inter-regional variance in Chapter 4 of the dissertation.
The second and third chapters focus on a single state in India – Bihar. I selected Bihar because the
state underwent a profound shift in the governance regime in the early 2000s (Singh and Stern, 2013;
Witsoe, 2013)The shift in governance had implications for the agricultural sector, which I leverage in my
fieldwork in Chapter 2 to understand the sociotechnical causal mechanism (STCMs) undergirding the
distribution of benefits from agriculture technologies across socioeconomic groups.
Bihar is one of the poorest states in India, as well as one of the states with the lowest rates of
agricultural productivity. The poor performance of the agriculture sector in Bihar is not due to Bihar’s
lack of agricultural potential. Indeed, when the British first colonized India, they identified Bihar as
having exceedingly favorable conditions for agricultural production and built the first agricultural
research institute in the State. Despite this potential, agricultural productivity stagnated, and Bihar showed
the slowest rate of growth out of all of India’s states, over the past five decades (Kishore, Sharma and
Joshi, 2014).
While the reasons for Bihar’s agricultural stagnation are complex (and discussed in Chapter 2),
one important explanatory factor is a period of poor governance during the era of Chief Minister Lalu
Yadav, who was elected in 1990, and for all intents and purposes, served through 2005.4 Lalu’s era was
4 For some of this time, Lalu Prasad was in prison after being convicted on corruption charges, but continued to govern through his wife, Rabri Devi Yadav, who was appointed Chief Minister by the party.

30
characterized by caste-based politics, lower caste empowerment, and the deterioration of government
services (Witsoe, 2013). The abrupt shift in Bihar’s sociotechnical regime took place in 2005 when a new
Chief Minister, Nitish Kumar, came to power. Nitish Kumar was elected with a strong technocratic
mandate and the goal of revamping Bihar’s deteriorated bureaucracy including developing a new rural
development strategy. Bihar became the first state in India to develop an Agricultural Road Map in 2008,
and significant institutional support was directed to rural development and agricultural production in the
state (Government of Bihar, 2008).
It is this abrupt shift in the sociotechnical regime surrounding Bihar’s agricultural sector that made
the state an interesting field setting for this project, for a number of reasons. First, the abrupt change in
sociotechnical regimes between the old and new Chief Ministers was a particularly good inroad for
discussions with farmers, about the sociotechnical mechanisms related to different agricultural
technologies in the state. Asking about the changes before and after Nitish Kumar, led to more thoughtful
answers, that more deeply engaged with the institutional dimensions of the technology under discussion.
Second, my hypothesis, which was later confirmed by survey data, was that many technologies that had
reached widespread use in states like Gujarat and Haryana decades earlier, in the 1970s and 1980s, had
only reached widespread use in Bihar over the past 10 to 15 years. This more recent “Green Revolution”
offered a laboratory for observing, in real time, the differential benefits of newly introduced technologies
across socioeconomic groups of farmers. Finally, significant new resources had been directed to Bihar’s
agricultural economy since 2006. The degree of financial and institutional support is reminiscent of the
support received by other states during the Green Revolution, but rather than being a distant historical
memory, the changes are fresh in the minds of Bihari farmers. This provides a modern opportunity to
research the dynamics of a changing sociotechnical regime in the agricultural sector and in particular, the
impact of the changing regime on the poorest farmers.

31
1.5 Challenges of Measuring Poverty
A project that focuses on the poorest farmers must, of course, grapple with defining and measuring
the well-being of this group. There is tension between the use of absolute and relative measures of
wealth, with tradeoffs between the power of absolute measures for cross-national and global comparisons,
and the utility of relative measures, which are more sensitive to the particular dynamics of a community
and what constitutes poverty locally (Kates and Haarmann, 1992). In the context of this study, a relative
approach is more useful as it lends itself to qualitative approaches where poverty is seen within the
context of the local circumstances facing each farming household. In the three papers in this dissertation,
poverty is defined with respect to other households in each study and not with respect to national or
global poverty levels.5
Beyond the decision about whether to define poverty in absolute or relative terms, the issue of
measuring poverty can prove to be even more complex. In many countries, poverty thresholds are set
based on income, but in India, robust data on household income is often unavailable. Instead, most
scholars rely on measures of expenditure, which tend to provide inferior estimates of poverty (Sen and
Drèze, 2013). However, both income and expenditure data are at best an approximate measure of a
household’s overall well-being. Neither income nor expenditure data captures assets, such as
landholdings, health, education, or social networks, all of which contribute to a household’s overall well-
being, and circumscribe the set of capabilities and opportunities households face (Narayan, 1997; Sen,
1999; Dasgupta, 2000; Arrow et al., 2012). Still, obtaining the necessary data, let alone overcoming the
methodological challenges of creating equivalences across categories, makes using a single metric for
5 It is worth noting that in this dissertation, poverty is measured at the household level. This approach is appropriate for a study on agricultural systems, as the household is usually the unit of decision-making in smallholder agricultural systems. However, this approach to measuring poverty is certainly an incomplete picture of intra-household differences in access to resources which can be quite acute, especially in a South Asian context, where there is high intra-household inequality, especially for women and younger siblings (Jayachandran and Pande, 2015).

32
household well-being difficult. Instead, scholars are left to select appropriate proxies for household well-
being, for the context of their studies.
In this paper, I use proxies for farmer well-being, and generally define the poorest farmers as the
bottom quintile of the distribution in terms of the proxies I use. There are a number of proxies available
for categorizing households by well-being indicators. One of the most common approaches used in the
study of agriculture and technology is landholding size. A second and more comprehensive approach is to
calculate the value of all household assets, as well as on-farm income and income from other sources (e.g.
daily construction labor or remittances from household members who have migrated to other areas).
Finally, in India, a frequent method for categorizing people into socioeconomic groups is based on their
social caste.
While I attempted to measure all three proxy variables in the data collection process, I found that
the data quality when comparing the qualitative findings from the primary village where I worked, with
answers to survey questions collected by a survey team in the same village, was very poor. Respondents
often tried to minimize their assets in the more formal survey, perhaps believing that their answers to the
survey might give them access to government or NGO support if they appeared poor.6 I suspect that the
poor quality of responses to survey questions about assets and income plagued the entire data collection
process in the 11 additional villages.7 Ultimately, I decided that building a measure of well-being based
on the asset stocks would not have been productive, because the quality of the data was too poor. Instead,
I used both landholding and caste based proxies for classifying farmers by their relative wealth and
6 One of the members of my survey team in Bihar reported a humorous anecdote: He was sitting outside a farmer’s house while asking him about his household income and assets. As they talked, the farmer leaned on a tractor. When the surveyor came to the question of whether the farmer owned a tractor he replied that he did not. While the surveyor took the farmer at his word, after finishing the survey, he learned from multiple other households that the tractor indeed belonged to the farmer in question. Moreover, he earned substantial income by renting the tractor to other households. 7 My belief is that the challenge of measuring household assets plagues almost all datasets and one should be extremely careful using aggregate household assets collected through surveys.

33
poverty, for the very practical reason that I trust the data. But there are also sound theoretical reasons for
using caste and landholding size as proxies for well-being in this study.
In terms of landholding metrics, while farmers may possibly hide their landholdings, I found that
in general, responses to this question were relatively accurate. Moreover, the size of a farmer’s
landholding has important implications for their decisions about technology adoption, that may not be
captured by overall assets. For example, a household with relatively high assets but a small landholding
(e.g. primary income from non-agricultural sources) is unlikely to be particularly concerned with
maximizing the benefits from their agricultural production, and decisions about technology adoption may
not be particularly insightful with respect to the question of access and benefits. Within the landholding
approach, I am also able to include households that do not own their own land, but lease or sharecrop on
other farmer’s land. This can be particularly useful, especially for understanding the impacts of land
tenure regimes on technology benefits.
In terms of caste metrics, farmers are not likely to disguise their caste in surveys. Indeed, I have
never had an experience where a respondent was reticent to reveal their caste in rural India. Caste also
continues to be an extremely important social marker in modern India. As Jean Drèze and Amartya Sen
note, “India seems to be quite unique both in terms of the centrality of caste hierarchies and in terms of
their continuing hold on modern society.” Moreover, “caste stratification often reinforces class inequality,
giving it a resilience that is harder to conquer” (Sen and Drèze, 2013). In the context of Bihar, and the
lower caste mobilization of the 1990s under Lalu Prasad, caste turned out to be an even more salient
marker of identity. Furthermore, caste continues to be highly correlated with other metrics of poverty
(Borooah, 2005). More information on how I treat caste in this dissertation can be found in Appendix 1,
where I also discuss monetary conversions to US dollars and Hindi-English translations used in the
dissertation.

34
1.6 Chapter Overview
The three empirical studies included in this dissertation grapple with the overarching research
question – why does technology fail to benefit the poorest farmers – from three different angles. Chapter
2 compares multiple technologies within a single geography, focusing on the barriers preventing the
poorest farmers from realizing greater benefits from these technologies. Chapters 3 and 4 take deeper
dives into two specific technologies touched on in the first paper. The third chapter focuses on a
technology that has been labeled a priori a “pro-poor” technology – SRI. The fourth chapter looks at a
single technology, drip irrigation, comparatively, across four Indian states. In this section, I summarize
the questions asked, methods used and conclusions for each of the individual empirical chapters.
Chapter 2, ‘What keeps the poorest farmers from benefiting from technology? A study of
agricultural technology and poverty in Bihar, India,’ looks at the extent to which a range of technologies
benefits the poorest farmers in a single state – Bihar, India. The chapter engages with a broad range of
hypotheses explaining low agricultural productivity from a wide variety of literatures. The chapter
examines these hypotheses, or sociotechnical causal mechanisms (STCM), not for their value in
explaining low yields in general, but rather for their value in explaining barriers preventing the poorest
farmers from realizing greater benefits from technology. This empirical chapter is included first in the
dissertation because it most explicitly develops new methodological territory. Using both ethnographic
research and survey data, I analyze the extent to which 11 sociotechnical causal mechanisms function as
barriers causing the poorest farmers to (disproportionately) lose out on the benefits from technology. I
find that that missing infrastructure and misaligned incentives are the primary sociotechnical causal
mechanisms preventing the poorest farmers from realizing greater benefits from agricultural technology
in Bihar.
Chapter 3, ‘The System of Rice Intensification: The Challenges of Technology Selection for
Meeting the Needs of the Poorest Farmers,’ focuses on a single technology, the System of Rice

35
Intensification (SRI), that emerged onto the global stage in the early 2000s, and whose proponents hoped
would benefit poorest farmers in particular. The first part of the chapter looks at a dispute over the
benefits of SRI, between different actors at the selection stage of the innovation system. This section of
the paper demonstrates the challenges at the selection stage in prioritizing the needs of the poorest farmers
over sociotechnical path dependence. These challenges include 1) propensity for silver bullet thinking; 2)
failure to take into account variance and uncertainty in local conditions; 3) selection of technology based
on institutional incentives not aligned with the needs of the poorest farmers (e.g. political and professional
incentives). The second part of the chapter grounds the discussion of SRI in Bihar through ethnographic
fieldwork and survey data, in order to bring greater clarity and nuance to the debate around SRI, and most
importantly, to analyze if, how, and under what conditions SRI is a “pro-poor” technology, as many of its
proponents claim. The chapter finds, that while the physical dimensions of SRI have the potential to
benefit the poorest farmers, in the context of Bihar, relatively wealthier farmers are benefiting more from
SRI than their poorest neighbors. The benefits of SRI are failing to reach the poorest farmers because of
limited and expensive irrigation infrastructure, but also because the institutional design of the government
support policy is not targeted at the poorest farmers. These findings demonstrate that even when the
physical dimensions of technology are “pro-poor,” realizing these benefits still requires reorienting the
larger sociotechnical regime towards the needs of the poorest.
Chapter 4, ‘Subsidies for Whom? Comparative Evaluation of India’s Drip Irrigation Subsidy
Program,’ looks across four states in India at programs that promote widespread use of a single
technology: drip irrigation. These programs, together represent a modern and sustained effort by a wide
range of actors to bring a new technology into widespread use. The effort to scale drip irrigation in India
required the establishment of a broad institutional infrastructure, which included specific mechanisms to
target the poorest farmers. Both the size of India’s drip irrigation programs, as well as the explicit effort to
ensure benefits to the poorest farmers, make drip irrigation in India a good case study for evaluating goal-

36
oriented efforts to ensure the poorest farmers benefit from technology. The paper demonstrates that
India’s drip irrigation subsidy program was able to leverage both public and private sector strengths to
achieve widespread use of drip irrigation across multiple states in India. But, despite inbuilt institutional
mechanisms to target the poorest, the program largely failed to benefit this group. The failure of the drip
irrigation subsidy program to benefit the poorest farmers was due to both institutional and technical
dimensions of the technology. On the institutional side, the design of the subsidy program attempted to
generate demand from the poorest farmers by offering larger subsidies to this group, but the program
failed to offer the private sector equipment dealers, responsible for marketing and sales, their own
incentives to engage with the poorest farmers. Rather, the private sector dealers incurred greater overall
costs in terms of their time and earnings when working with the poorest farmers. As a result, the poorest
farmers failed to learn about the technology or the availability of a substantial subsidy to help them afford
it. On the technical side, the subsidy program excluded low-cost irrigation systems in the standards set by
the guidelines of the program. While low cost drip irrigation systems had gained traction in some parts of
the country prior to the introduction of the subsidy program, the subsidy program pushed these
technologies out of the available technology space, in favor of more expensive designs. The failure of the
subsidy program to include low-cost drip irrigation kits negatively impacted the poorest farmers, by
driving this type of technology out of the innovation system of the major drip irrigation companies. The
paper demonstrates the strengths of leveraging the private sector in last-mile technology delivery, but also
the difficulty of ensuring that the needs of the poorest farmers are met in public-private programs in the
agricultural sector. I ground the policy conclusions of this chapter in emerging innovation systems
literature on the role of government in market-creation, arguing that the government’s drip irrigation
subsidy program can be scrutinized as a large-scale effort to support the emergence of a new market and
industry. From a policy perspective, given the large publicly funded investment in market-creation, I
argue that the government should demand more from the private sector in return for its investment. In

37
particular, the subsidy program should be re-written so that the incentive structures created by the
program ensure that the poorest farmers realize greater benefits from the technology. The government can
do this by offering specific financial incentives to the private sector equipment dealers for working with
the poorest farmers, and by limiting the availability of the subsidy for medium and larger farmers.
1.7 Overall Findings: Relevance for Policy and Scholarship
All three chapters in this dissertation diagnose a common problem: The benefits of technology
under current sociotechnical regimes in Bihar (and in the case of drip in India more broadly) are often not
being realized by the poorest farmers. Failure of technology to benefit the poorest farmers is neither
exclusively a consequence of the physical nor the institutional dimensions of technology. Ensuring
technological innovation meets the needs of the poorest is not just about getting the physical dimensions
of technologies right, nor is it just about getting the institutional dimensions right. Rather, an alignment
between the physical and institutional dimensions of technology and local context is required—an
alignment that is goal-oriented towards the needs of the poorest.
I find that this kind of goal-oriented alignment, towards the needs of the poorest, is difficult to
achieve even when it is an explicit goal of powerful actors in the innovation system (which it often is not).
For example, in my drip irrigation study, despite the government’s concern for the poorest farmers, as
demonstrated by the higher subsidies for this group, the criteria embedded in the subsidy policy selected
for high cost drip irrigation technologies, at the expense of low-cost versions of the technology that were
more appropriate for the poorest farmers. In a second example, in my study of the System of Rice
Intensification in Bihar, the government selected the technology specifically because of its “pro-poor”
physical dimensions and put substantial financial and institutional resources behind promotion of the
technology. Yet, while the physical dimensions of the technology were aligned to benefit the poorest
farmers, the high cost of irrigation in Bihar, poorly run extension services, and the ineffective design of
38
the subsidy policy, led to the benefits of SRI being skewed towards wealthier farmers. Finally, in a third
example of solar irrigation pumps (SIP) (one of the technologies studied in detail in the Chapter 2), my
work shows that both the physical and institutional dimensions of the technology were not aligned to
benefit the poorest farmers. On the physical side, the design of the SIPs offered no flexibility for
switching to diesel power when solar radiation was limited (at night or during fog). On the institutional
side, multiple factors, including poor promotion of the subsidy scheme to the poorest farmers, combined
with bureaucratic corruption, restricted the benefits of the technology to wealthier farmers. This outcome
of the SIP case in Bihar was particularly unfortunate, because the physical dimensions of the technology
have the potential to bring relatively more benefits to the poorest farmers, who tend to live farthest from
electrical grids. In other words, SIP could be a specifically “pro-poor” technology, under the right
circumstances. In Bangladesh, for example, careful design of both the physical and institutional
dimensions of SIP led to substantial benefits for the poorest (ICIMOD, 2015).
The implications of my core finding – that to benefit the poorest farmers an alignment is required
between the sociotechnical dimensions of technology and the needs of the poorest farmers – is that the
vast majority of remedial measures that focus exclusively on one or the other dimension of technology are
unlikely to work. Thus, ensuring the poorest farmers benefit from agricultural technologies requires shifts
in the entire sociotechnical regime. My conclusion contradicts both the appropriate technology literature
and the institutional development literature in important ways. The appropriate technology literature
highlights the importance of the physical dimensions of technology for increasing benefits to the poorest
farmers (e.g. Timu et al., 2014; Chekene and Chancellor, 2015). The institutional development literature
focuses on removing barriers the poorest farmers face by improving market linkages, fixing land tenure
regimes, and improving access to rural credit (e.g. Place and Otsuka, 2002; Jayne, Mather and Mghenyi,
2010; Ololade and Olagunju, 2013). My findings do not reject the importance of the specific findings in
each of these literatures. Instead, I argue that the challenge is that under most circumstances focusing on

39
any one of these issues in isolation is not effective. Rather, I conclude that a systems approach that takes
into account a wide-range of sociotechnical dimensions of technology and their fit to local context, is
essential to ensuring that the poorest farmers benefit from technological innovation.8
My findings both confirm and extend previous work in sociotechnical transitions literature, as
discussed in Section 1.2.3 (Geels, 2002, 2004). The sociotechnical transitions literature argues that in
order for new technological innovations to achieve scale, they need to overcome barriers in path
dependency created by both incumbent physical technologies, and social and institutional systems that
have developed alongside them. Sociotechnical transitions are thus seen as systems innovations which
involve several different physical technologies, in conjunction with institutional change by a diversity of
actors (Steward, 2012). In other words, the sociotechnical transitions literature argues that for any new
technology to reach widespread use, an alignment between the physical dimensions and the institutional
dimensions of technology(ies) is required. Likewise, a “transition” toward innovation systems that
benefit the poorest requires changes in the evolutionary pathway of agricultural technologies, that ensure
both the physical and institutional dimensions of technologies are designed in ways that the poorest can
extract more well-being from their widespread use.
By identifying the importance of the alignment between physical and institutional dimensions of
technology and their fit to local context, my work confirms the findings of the sociotechnical transitions
literature. At the same time, my work extends the sociotechnical transitions literature in two ways. First, I
apply sociotechnical transitions concepts to cases in the developing world where empirical work in this
8 A question this finding raises is whether the need for “fit” between the sociotechnical dimensions of technology and local context is specific to the challenge of ensuring the poorest farmers benefit from technology, or rather generalizable as a criterion for success for widespread use of technology more broadly? My instinct is that the answer is both. While the broader MLP literature has already pointed to the importance of “fit” in innovation systems, there is likely an added challenge to this problem when addressing the needs of the poorest farmers who have fewer capabilities and resources to create this alignment for themselves.

40
literature is sparse. Second, I extend this literature to look at the impacts of technological innovation
across socioeconomic groups, something that to the best of my knowledge has not been done before.
Several more specific findings from this dissertation offer insights into particular strategies for
orienting agricultural innovation systems towards the needs of the poorest.
First, making improvements to current sociotechnical regimes that will more effectively benefit
the poorest requires context specific understanding of the sociotechnical and agroecological opportunities
and constraints facing this sub-group of farmers. Chapter 2 looks at the most important barriers
preventing the poorest farmers from realizing greater benefits from technology in Bihar. The study finds
that many institutional solutions to improving farmer well-being identified in the literature, fail to address
the biggest barriers preventing the poorest farmers from accruing greater benefits from technology in
Bihar. For example, in the context of Bathani village, market access was not a significant barrier
preventing the poorest farmers from benefiting from technology. For this reason, focusing on policies that
improve market access in Bihar may have the effect of incentivizing technology investments by wealthier
farmers, raising overall yields, but increasing intra-village or intra-regional inequality. To help the poorest
farmers in Bathani, government resources would be better spent improving access to infrastructure, such
as electricity and water for irrigation.9 This example demonstrates how making an effective improvement
to a sociotechnical regime that benefits the poorest, requires context-specific understanding of barriers
and opportunities the poorest farmers face. Generalized solutions (e.g. market access) that do not take
9 Infrastructure is usually considered a public good (one that is both non-excludable and non-rivalrous). In this sense, I argue that pro-poor investments by the government share much in common with investments in public goods. At the same time, my research problematizes the notion of public goods by demonstrating that not all goods are usually categorized as ‘public’ are truly public goods. For example, while roads in Bihar function as truly public goods that are both non-excludable and non-rivalrous, both electricity and irrigation infrastructure often do not live up to the definition of pure public goods. This raises a question for the public goods literature to look more carefully at the extent to which goods we assume are public goods actually exhibit the key characteristic of public goods, especially with respect to the needs of the poorest. There is a large literature that more critically reflects on the notion of public goods especially at the global scale (Kaul et al., 2003). The challenge of ensuring public goods benefit the poorest can be fruitfully put into conversation with this literature.

41
account of local conditions not only will not work, but may even create bigger gaps between the poorest
farmers and their wealthier neighbors.
Second, institutions structuring the incentives of actors in the innovation system need to be
designed to ensure the poorest farmers benefit from agriculture technology. For example, in my three case
studies, we see that government actors had limited success in last-mile technology delivery. Institutional
structures, which pair government support with private sector and NGO actors acting as “last mile”
intermediaries, were significantly more successful at connecting the farmers with physical technologies.
Whether or not these partnerships benefit the poorest farmers, depends on how the incentive structures for
the different actors in the innovation system are arranged. In the case of drip irrigation, the institutional
design of the subsidy program incentivized the private sector to take over the responsibilities for
technology promotion but offered little incentive for the private sector to promote the technology to the
poorest farmers. In contrast, NGOs, whose mission is explicitly targeted at the poorest farmers, have had
far greater success promoting SRI amongst the poorest farmers in Bihar.
Third, when powerful actors in the innovation system fail to specifically take the circumstances
and objective functions of the poorest farmers into account, the poorest farmers are almost always
excluded from the benefits of technological innovation. In the case of SRI, the failure of the transnational
innovation system to respond with more humility to a technology that claimed to benefit the poorest,
demonstrates the failure of the agricultural innovation system to systematically prioritize the needs of the
poorest farmers. Changes in the goals of agricultural research will require a systematic shift in the
institutional culture of many research organizations, to include a greater sensitivity towards the
distributional impacts of their research.
My findings demonstrate that there is significant scope to reorient innovation systems to bring
greater benefits to the poorest. Through the chapters in the dissertation I demonstrate the importance of
alignment between the institutional and physical dimensions of technology with local context, but also the
42
roles that actors in the innovation system play in either fostering or blocking such alignment. Mobilizing
technology to meet the SDGs and reducing global poverty, will require sustained efforts by actors in the
innovation system, to change the institutions structuring incentives across stages of the system. This will
require embedding distributional concerns as a topic for research and action across sectors and levels of
agricultural innovation systems.

43
CHAPTER 2: What keeps the poorest farmers from benefiting from technology? A study of agricultural technology and poverty in Bihar, India
2.0 Abstract
While poorest farmers almost certainly enjoy the fruits of the plough and the hoe, whether and
under what conditions modern agricultural technologies such as high yielding seed varieties, drip
irrigation, or new cultivation practices benefit the poorest farmers, is an important empirical question.
This chapter focuses on the barriers preventing the poorest farmers from realizing greater benefits from
agricultural technologies. Using a sociotechnical approach which conceptualizes technology as
inextricably linked to the institutional systems necessary for scale (Brooks, 1980), this chapter uses a mix
of ethnographic research and survey data to study the sociotechnical causal mechanisms (STCMs)
preventing the poorest farmers from realizing greater benefits from technology in Bihar, India. The
chapter finds that in the context of Bihar, the primary STCMs preventing the poorest farmers from
benefiting from agricultural technology are missing infrastructure and misaligned incentives. The STCMs
that play a lesser role in preventing the poorest farmers from benefiting from agricultural technology
include lack of individual farmer capacity, weak capacity for collective action, and missing market
linkages. While these findings are specific to the context of Bihar, the paper offers a novel framework for
studying the impact of technology on poverty that can be used across contexts. Methodological
approaches such as the one used in this paper are important for ensuring that the poorest and most
vulnerable groups are served by the global innovation systems across sectors from agriculture to energy to
healthcare.

44
2.1 Introduction: Rural Poverty and Agricultural Technology Innovation
The importance of technological innovation to agricultural productivity is well established
(Ruttan, 1977; Hamilton and Sunding, 1998; Sunding and Zilberman, 1999). Yet the poorest farmers,
especially in the developing world, often miss out on the benefits of technological innovation. Indeed,
concerns about the relationship between agricultural technology and poverty are not new. A study of the
introduction of groundwater irrigation during the Green Revolution in a village in Gujarat, India,
demonstrated that the new borewells benefited wealthier farmers, while failing to benefit the poorest.
Moreover, the introduction of borewells had multi-generational social and economic implications for both
the farmers who adopted borewells, and those who did not (Prakash, 2005).
More generally, new technologies that increase yields may benefit early adopters while leaving
late adopters and non-adopters facing lower market prices without the gains from increased yields
(Cochrane, 1993).10 In the case of borewells in Gujarat, the benefits to early adopters set the early
adopters on a fundamentally different economic course than their neighbors, with divergent
socioeconomic outcomes even for future generations (Prakash, 2005). Despite these concerns about the
impact of technology on the poorest, agricultural technology is a critical factor in improvements in
agricultural yields (Fischer, Byerlee and Edmeades, 2009), and multiple macroeconomic studies suggest
that growth in the agricultural sector is significantly more effective than other types of economic growth
at reducing poverty (Virmani, 2008; Raff and Wagner, 2013). The tension between the role of technology
in raising average incomes, and the role of technology increasing inequality raises an important empirical
10 Willard Cochrane in his 1993 book on the history of American agriculture, argued that the equilibrium gains of agricultural technology adoption accrue to the consumer and not the producer. While earlier adopters of new yield improving or cost lowering agricultural technologies can make a profit, as more farmers adopt the technology, free market commodity prices fall so the earlier adopters as well as the late adopters are no better off than they were before. The real losers Cochrane argues, are the laggards who never adopt the technology at all, yet suffer from lower commodity prices despite no improvements in their yields or reductions in their costs (Kislev and Shchori-Bachrach, 1973; Cochrane, 1993).

45
question: What are the barriers preventing the poorest farmers from realizing greater benefits from
agricultural technologies?
The answer to this question is important, not only to the poorest farmers themselves, but to
governments concerned with improving the well-being of their poorest citizens, and to members of the
development community concerned with reducing the extent of global poverty and improving household
food security. Agrarian households account for 80% of the world’s extreme poor (income of less than
1.90 USD per person per day). These households simultaneously produce food and suffer from food
insecurity (Kharas et al., 1994; Castañeda et al., 2016). By overcoming barriers to technology access for
the poorest farmers, national and local governments and the development community can reduce poverty
and improve food security.
This chapter looks at the barriers preventing the poorest farmers from realizing greater benefits
from agricultural technologies in Bihar, India (see map, Figure 2.1).

46
Figure 2.1: Map of Bihar
The map locates the State in the northeastern region of India with a northern land boarder to the plains of Nepal. Map highlights Gaya district in South Bihar where the primary field site is located. Note Bihar is landlocked, bordered by Nepal to the North, West Bengal to the East, Jharkhand to the South, and Uttar Pradesh to the West. A very think strip of West Bengal separates Bihar from Bangladesh.
I structure the rest of this chapter as follows:
• In Section 2.2, I discuss the sociotechnical approach I will use throughout the rest of the chapter.
The sociotechnical approach highlights the importance of both the physical and institutional
dimensions of the technology in understanding innovation systems. I also identify a set of
hypotheses or “sociotechnical causal mechanisms” (STCMs) from the literature, which I use to
elucidate the intertwined physical and institutional reasons why some technologies benefit the
poorest farmers more than others. I use this set of STCMs in Section 2.6 as a structured approach
for analyzing the underlying mechanisms preventing the poorest farmers from benefiting from
technology in each case study.
47
• In Section 2.3, I develop a methodological approach to the study of technology benefits in the
agricultural sector. I argue that a revealed preference approach is the best methodology for
measuring benefits of technology to farmers. The revealed preference approach, while imperfect,
is superior to more commonly used yield or profit metrics. While a full assessment of changes in
well-being is the holy grail for measuring benefits from technology, this remains
methodologically difficult and a revealed preference approach is the best methodologically
feasible approach.
• In Section 2.4, I discuss the historical, political, economic and agro-ecological forces in Bihar that
shape the context of the research.
• In Section 2.5, I describe the data and go into more nuanced ethnographic detail of the primary
field site in south Bihar.
• In Section 2.6, I use a purposeful selection methodology to select six technology case studies.
Section 2.6.1 through 2.6.6 details each of the six case studies using the sociotechnical approach
and STCMs.
• In Section 2.7, I discuss my findings focusing specifically on the extent to which each of the 11
SCTMs is a barrier across case studies in preventing the poorest farmers from realizing greater
benefits from agricultural technologies.
• In Section 2.8, I conclude with a discussion of the implications of my findings. I discuss the
methodological contribution of the chapter to the study of technology, as well the implications of
the findings for policy aimed at strengthening the contribution of technology to achieving the
Sustainable Development Goals (SDGs).

48
2.2 Theory: A Sociotechnical Approach
2.2.1 The Sociotechnical Nature of Technology Innovation
This chapter uses the sociotechnical approach discussed in Chapter 1 to investigate the underlying
causal mechanisms that prevent the poorest farmers from benefiting from agricultural technologies. For
purposes of clarity, I review the sociotechnical approach briefly here. I treat technology not as individual
widgets, but as assemblages of artifacts and practices which are inextricably linked to the institutions and
actors that undergird the complex processes linking invention with widespread use. Borrowing from
Harvey Brooks, I argue that technology is best understood by its function than its physical embodiment in
artifacts. Using a functional definition of technology means that it is necessary to conceptualize
technology differently and include not only the physical aspects of technology but also “social supporting
systems necessary to apply it [technology] on significant scale” (Brooks, 1980).
Thus, to move a technology (whether an artifact or a practice) through an innovation system from
invention to widespread use, requires effective social systems that support the innovation process. A
sociotechnical approach widens the lens of technology adoption research to include the social supporting
systems fundamental to widespread technology adoption and allows for identification of barriers to
technology adoption that go beyond the attributes of the technologies themselves to the roles of actors and
institutions in both creating and overcoming barriers (Anadon et al., 2016).
The chapter elucidates the intertwined physical and institutional reasons why some technologies
benefit the poorest farmers more than others. The research design for this chapter is perhaps the most
novel of the three empirical chapters in the dissertation. Rather than using the sociotechnical approach to
study a single technology across regional contexts, I focus on a single region and analyzes the barriers
preventing the poorest farmers from benefiting from a set of six technologies. By looking across a range
of technologies, I identify the most important sociotechnical barriers that prevent the poorest farmers
from realizing greater benefits from technology in Bihar.

49
In order to use the sociotechnical approach, precise language to differentiate between the physical
and institutional components of technology is required. To refer to the aspects of technology imbedded in
the physical artifacts or practices, I use the term “physical dimensions” of the technology or sometimes
simply “the physical technology.” The physical dimensions of technology may include technical aspects
of design, such as the specifications of an electric pump or irrigation system. Physical dimensions of a
technology also include the agronomic practices associated with the system of rice intensification (SRI).
To refer to the social aspects of technology, I use the term “institutional dimensions”. Institutions
are the rules and norms as well as culture and beliefs that together make up the social supporting systems
necessary to apply the physical dimensions of the technology at scale (North, 1990; March and Olsen,
2009). Institutional dimensions include for example, government subsidy programs which change the
price of a physical technology that farmers face. However, a given subsidy institution may have specific
rules that dictate who is eligible for the subsidy including requirements like socioeconomic status, the
availability of land-title documents or other requirements that limit the benefits of the technology to some
farmers over others. There may also be more informal norms associated with the subsidy program. For
example, extension officers responsible for the program may expect farmers to approach them in their
offices to receive the subsidy with some kind of bribe or kick-back. In contrast, an alternate set of norms
may send extension officers to the village to advertise the availability of the subsidy program and target
their outreach at the poorest communities. The institutional dimensions of technology also include
cultural norms, such as the relationships between different social castes in a village that mediate how
information about physical technology flows between farmers or how farmers engage in collective action
behavior around a specific physical technology.
Of course, the physical and institutional dimensions of technologies interact in complex ways.
Two physical technologies that achieve similar goals (e.g. irrigation for a crop) may use different
quantities of water (e.g. drip irrigation vs. flood irrigation). In this context, the institutional dimensions

50
which impact the local price of water may influence the benefits farmers realize from using each of the
two physical technologies, which in turn may influence their ultimate choice about technology adoption
and use. If an institutional change, such as a new electricity subsidy, changes the price of water, the
institutional dimensions of both drip and flood irrigation will change. It is this interaction between the
institutional and physical dimensions of each technology that will change the relative benefits of the two
technologies to farmers.
In this chapter, I evaluate both the physical and institutional dimensions of technology to
understand the degree to which different sociotechnical barriers prevent the poorest farmers from
accruing greater benefits from technology. Using this logic, a technology may not benefit the poorest
because the design of the physical dimensions does not meet the needs of the poorest farmers (perhaps
because the technology is not useable on smaller landholdings). A technology may also not benefit the
poorest, because the institutional dimensions of the technology skew benefits to wealthier farmers and
away from the poorest farmers. For example, a technology may require advanced skills that the poorest
farmers have a limited ability to acquire, due to poor educational systems in a given context.
Alternatively, the institutional dimensions influencing the price of the technology may make the initial
capital investment too high for the poorest farmers to afford.
Both the physical and institutional dimensions of technology interact and are influenced by the
particularities of a given context including the local social, political, economic, infrastructural and
agroecological conditions. Together, the particularities of a given context can be thought of as the
sociotechnical regime, which includes the local biophysical conditions (such as land quality, climate,
biodiversity) as well as the local sociotechnical conditions, comprised of institutions (including rules,
norms, culture, and beliefs) that structure and pattern the innovation system in a given context.
Sociotechnical regimes are usually stable and do not change easily because they are structured by “semi-

51
coherent” and often unnoticed “set of rules that guide, orient and coordinate the activities of the social
groups that reproduce the various elements of socio-technical systems” (Geels, 2011, p. 5).11
2.2.2 Sociotechnical Causal Mechanisms (STCMs)
There are both biophysical as well as sociotechnical reasons why a specific farmer on a specific
plot of agricultural land might realize fewer benefits than another farmer on the same plot of land or
another farmer on a different plot of land. On the biophysical side, agronomists have a relatively clear
understanding of the factors affecting yields including varietals of crops; planting and harvest dates; seed
density and spacing; water management; sunlight and temperature requirements; macro and micro
nutrients; soil conditions; weeds; diseases and pests; and atmospheric pollutants (Mueller and Binder,
2015). On the sociotechnical side, the causal mechanisms and the relationships between them are more
poorly understood. Agricultural economics and development studies are replete with studies that detail
particular causal mechanisms. These include inappropriate technology for smallholder farmers and
developing country contexts; market failure including poor market linkages between small farmers and
regional, national and global commodity markets; poor and missing infrastructure such as roads, irrigation
canals and electricity; poor state-led extension services and other knowledge support services; lack of
farmer capacity including poor education, health and nutrition; missing or weak farmer organizations or a
lack of capacity for collective action on the part of farmers; missing or ineffective land tenure regimes
that increase risk for small farmers; poor public policy design; and corruption. Please see Table 2.1 for
definitions of 11 STCMs taken from a wide range of literatures in addition to an annotated bibliography
of supporting literature for each STCM in Appendix 3.
11 Note that in the context of sociotechnical regimes shares much in common with the concept of social-environmental systems (SES) discussed in the Sustainability Science literature.

52
Table 2.1: Definitions of STCMs and selected supporting literature.
Sociotechnical Causal
Mechanisms (STCMs)
Definition Supporting Literature
1. Lack of financial assets
Lack of sufficient or capital or purchasing power to invest in agricultural technologies.
• Banerjee et al. 2014. "Understanding biophysical and socioeconomic determinants of maize (Zea mays L.) yield variability in eastern India."
• Dao et al. 2015. "Identifying farmers' preferences and constraints to maize production in two agro-ecological zones in Burkina Faso."
• Duflo et al. 2011. “Nudging Farmers to Use Fertilizer: Theory and Experimental Evidence from Kenya.”
• Kishore. 2004. “Understanding Agrarian Impasse in Bihar.” • Yengoh. 2012. "Determinants of yield differences in small-
scale food crop farming systems in Cameroon." 2. Inappropriate technology design
Lack of “fitness for purpose” of available technologies. The appropriateness of technology design will likely vary by region and perhaps by other farmer level characteristics such as landholding size, access to water and electricity
• Chekene & Chancellor. 2015. “Factors affecting the adoption of improved rice varieties in Borno State, Nigeria.”
• Timu et al. 2014. “The role of varietal attributes on adoption of improved seed varieties: The case of sorghum in Kenya.”
3. Missing market linkages
Poor market linkages can limit the price farmers receive for their crops, limiting their willingness to invest their capital in technology to raise yields
• Jagwe, Machethe, & Ouma. 2010. “Transaction costs and smallholder farmers’ participation in banana markets in the Great Lakes Region of Burundi, Rwanda, and the Democratic Republic of Congo.”
• Jayne, Mather, & Mghenyi. 2010. “Principal challenges confronting smallholder agriculture in Sub-Saharan Africa.”
• Markelova et al. 2009. "Collective action for smallholder market access."
• Pradhan et al. 2015. “Closing yield gaps: How sustainable can we be?”

53
Table 2.2 (Continued)
Sociotechnical Causal
Mechanisms (STCMs)
Definition Supporting Literature
4. Lack of access to credit
Limited availability of credit to farmers or insufficient provisions in credit programs to help the poorest farmers with limited collateral access credit.
• Olagunju & Ajiboye. 2010. "Agricultural lending decision: A tobit regression analysis."
• Ololade & Olagunju. 2013. "Determinants of access to credit among rural farmers in Oyo State, Nigeria."
• Phillip et al. 2009. “Constraints to increasing agricultural productivity in Nigeria: A review. (No. 6).”
• Kochar. 1997. “Does Lack of Access to Formal Credit Constrain Agricultural Production? Evidence from the Land Tenancy Market in Rural India.”
5. Missing Infrastructure
Limited road and other transportation networks; limited or missing electricity supply; limited surface irrigation.
• Gajigo & Lukoma. 2011. “Infrastructure and agricultural productivity in Africa.”
• Inoni & Omotor. 2009. “Effect of road infrastructure on agricultural output and income of rural households in Delta State, Nigeria.”
• Narayanamoorthy & Hanjra. 2006. "Rural infrastructure and agricultural output linkages: A study of 256 Indian districts."
• Tunde & Adeniyi. 2012. “Impact of road transport on agricultural development: A Nigerian example.”
6. Ineffective extension services
Under provision of state led extension services and other knowledge support services either due to insufficient numbers of extension agents or ineffective organizational design and implementation of extension programs
• Baloch & Thapa. 2016. “The effect of agricultural extension services: Date farmers’ case in Balochistan, Pakistan.”
• Davis et al. 2010. “Impact of farmer field schools on agricultural productivity and poverty in East Africa.”
• Zhang et al. 2016. “Closing yield gaps in China by empowering smallholder farmers.”
7. Lack of individual farmer capacity
Limited access to education and poor quality of education, poor health care facilities, hunger and even poverty can decrease the individual capacity of farmers
• Alene & Manyong. 2007. "The effects of education on agricultural productivity under traditional and improved technology in northern Nigeria: An endogenous switching regression analysis."
• Croppenstedt & Muller. 2000. “The impact of farmer’s health and nutritional status on their productivity and efficiency.”
• Mani et al. 2013. “Poverty impedes cognitive function”. • Narayanamoorthy & Hanjra. 2006. "Rural infrastructure and
agricultural output linkages: A study of 256 Indian districts." • Yengoh. 2012. "Determinants of yield differences in small-
scale food crop farming systems in Cameroon."

54
Table 2.3 (Continued)
Sociotechnical Causal
Mechanisms (STCMs)
Definition Supporting Literature
8. Weak capacity for collective action
Weak capacity for collective action impacts the ability of communities either to work together to maintain shared resources such as irrigation systems or to establish collective bargaining power with other actors such as government policy makers. The capacity for collective action in farmer communities is often channeled through farmer organizations such as cooperatives and self-help groups and when these organizations are missing, farmers are forced to bargain individually significantly diminishing their power.
• Jagwe, Machethe, & Ouma. 2010. “Transaction costs and smallholder farmers’ participation in banana markets in the Great Lakes Region of Burundi, Rwanda, and the Democratic Republic of Congo.”
• Markelova et al. 2009. “Collective action for smallholder market access”.
• Otieno. 2012. “Impact of farmer groups on crop enterprise productivity and economic welfare of smallholder farmers in South Kivu territories, Democratic Republic of Congo.”
• Thorp et al. 2005. “When and How Far is Group Formation a Route Out of Chronic Poverty?”
9. Structure of land tenure regimes
Lack of formal land tenure regimes as well as poorly informed land tenure laws create uncertainty on the part of farmers and limit investments in agriculture.
• Banerjee et al. 2014. "Understanding biophysical and socioeconomic determinants of maize (Zea mays L.) yield variability in eastern India."
• Donkor & Owusu. 2014. “Effects of land tenure systems on resource-use productivity and efficiency in Ghana's rice industry.”
• Henao & Baanante. 2006. "Agricultural production and soil mining in Africa: Implications for resource conservation and policy development."
• Phillip et al. 2009. “Constraints to increasing agricultural productivity in Nigeria: A review. (No. 6).”
• Place & Otsuka. 2002. "Land tenure systems and their impacts on agricultural investments and productivity in Uganda.

55
Table 2.4 (Continued)
Sociotechnical Causal
Mechanisms (STCMs)
Definition Supporting Literature
10. Misaligned incentives
Institutional structures embedded in government, NGO and private sector led programs whether intentionally or unintentionally fail to provide the right incentives for farmers (or subgroups of farmers) to invest in agricultural technology. (*Note that this dissertation finds this STCM to be very important in explaining differential benefits across socioeconomic groups of farmers. However, there is minimal additional research looking at this specific causal mechanism. Perhaps because it requires a multi-level perspective rather than only a field based perspective)
• McCullough & Matson. 2012. “Linking knowledge with action for sustainable development: A case study of change and effectiveness.”
• Mukherji, Aditi. 2006. “Political ecology of groundwater: the contrasting case of water-abundant West Bengal and water-scarce Gujarat, India.”
• Songco. 2002. “Do rural infrastructure investments benefit the poor? Evaluating linkages: A global view, a focus on Vietnam.”
• Phillip et al. 2009. “Constraints to increasing agricultural productivity in Nigeria: A review. (No. 6).”
11. Corruption and Security
Corruption and violence increase uncertainty and risks and transaction costs for farmers and other actors in the agriculture system. This hampers investment in technology and decreases yields.
• Anik et al. 2011. “The impact of corruption on farmers' efficiency in rice production: A natural experiment from Bangladesh.”
• Bromley & Foltz. 2011. “Sustainability under siege: Transport costs and corruption on West Africa’s trade corridors.”
• Fulginiti et al. 2004. Institutions and agricultural productivity in Sub-Saharan Africa.
• Mandemaker et al. 2011. “The Role of Governance in Agricultural Expansion and Intensification: A Global Study of Arable Agriculture.”
• Ministry of Agriculture. 2006. “Agriculture governance in Bangladesh: A survey of six thanas.” Agriculture Sector Review, Ministry of Agriculture, Government of Bangladesh, Dhaka.

56
Figure 2.2 shows the relationship between the biophysical causal mechanisms (BPCM),
sociotechnical causal mechanisms (STCM), and variance in the benefits the poorest farmers realize from
technology. The figure shows that both sociotechnical and biophysical mechanisms can directly impact
the amount of “well-being” farmers realize from their agriculture.12 Nevertheless many of the impacts of
both BCPM and STCM are mediated through farmers’ technology use. For example, insufficient water
(BPCM 3) can in many cases by ameliorated through the use of a technology such as drip irrigation which
increases water use efficiency (WUE), thereby making more efficient use of limited water resources.
Figure 2.2: Relationship between causal mechanisms, technology use, and farmer well-being.
12 Note, here I use well-being as the most accurate conceptual definition of what I am interested in measuring as “benefits”. The concept of well-being has broad support in the sustainability science literature (e.g Stiglitz, Sen and Fitoussi, 2009; Arrow et al., 2012; Matson, Clark and Andersson, 2016). In Section 2.3, I will clarify my empirical approach to measuring benefits – the revealed preference approach.

57
These sociotechnical causal mechanisms (STCM) are interwoven and create complex feedback
loops both between themselves and with biophysical causal mechanisms (BPCM). For example, missing
and ineffective land tenure regimes (STCM 9) increase risk for farmers. This can cause them to invest
fewer resources into high yielding seed varieties or fertilizer (BPCM 1 and BPCM 5) thereby reducing
yields. Reduced yields lead to food insecurity and reduced profits which hamper investments in
education, health and nutrition (STCM 7), which can further deepen the cycles of poverty and low yields.
As seen in the previous example, an intermediate variable connecting each causal mechanism with
low yields is technology. Lack of access to credit (STCM 3) prevents farmers from investing in yield
improving technology, thereby keeping yields lower than they would have been if credit were more
widely available. Reversing the direction of causality, poverty and food insecurity caused by low yields
and crop failure, has been shown to decrease farmer cognitive capacity (STCM 7) and diminish farmer
ability to adopt new technologies and practices (Mani et al., 2013).
This chapter focuses on one part of this complex relationship – the relationship between the
sociotechnical causal mechanism, technology use, and farmer well-being. The chapter is particularly
concerned with sociotechnical barriers preventing the poorest farmers from realizing benefits to their
well-being from technology use.
2.3 Methods: Revealed Preference Approach
This section argues that for the purposes of the research question, the best way to estimate the
benefits that farmers realize from specific technologies is through their own revealed preferences rather
than through empirical calculations based on the contribution of specific technologies to yield increases or
profit margins. In Section 2.6 I demonstrate significant variance in use of technology across
socioeconomic groups of farmers. In almost every case, the poorest farmers are less likely to use a
technology than their wealthier peers, but the factor by which the poorest farmers are less likely to use a

58
technology differs significantly between cases. In this section, I argue that treating sustained use of
technology as a measure of benefits is the best approach to the study of technology and poverty.
As discussed in Chapter 1, the population of interest in this chapter are the poorest farmers
measured in terms of both landholding and caste. This means that technologies are evaluated for their
benefits to the poorest farmers, irrespective of their impacts on inequality. The two categories of
technologies that meet these criteria are “pro-poor technologies” that benefit the poorest more than other
groups as well as technologies that “raise all boats” but may still increase inequality by benefiting
wealthier farmers relatively more than the poorest. The other two categories of technologies discussed in
Chapter 1 are “technologies for the rich” which have few if any benefits for the poorest and “bad idea”
technologies which at least in a specific context (geography or historical time period) offer limited to no
benefits across socioeconomic groups. (See Figure 2.3 for the two by two matrix; see Chapter 1, Section
1.3.1 for detailed discussion of the four conceptual categories.)
Figure 2.3: Stylized conceptualization of the impact of technology on poverty and inequality.
59
From a theoretical standpoint, the benefits farmers realize from using a specific technology should
be measured in terms of increases in the well-being of a farmer or household. However, in practice,
benefits are difficult to measure empirically due to extensive data requirements; the added uncertainty and
error associated with on-farm rather than field station research settings; and even methodological
challenges in defining what farmer’s themselves consider improvements to their well-being. (Stiglitz, Sen
and Fitoussi, 2009; Arrow et al., 2012)13 Below I first discuss issues related to the quantity and quality
of data required to calculate well-being improvements empirically in terms of either yield or income
improvements and then look at the larger theoretical challenges in constructing a standard definition of
what constitutes well-being improvements.
2.3.1 Estimating the Benefits of New Technology
2.3.1.1 Through Measuring Yield Improvements In practice, the simplest approach to estimating the benefits of the introduction of a new
technology is to measure any yield improvements that result from the introduction of the technology.14
While this is regularly done in controlled field trials on agricultural research stations, understanding the
contribution of an individual technology to improved yields in farmer’s fields, is much more difficult and
requires extensive crop economics surveys (usually conducted on a biweekly basis). Above and beyond
the research cost of surveying hundreds of farmers across socioeconomic groups on a bi-weekly basis,
there is significant uncertainty about farmers recall ability estimating both input quantities and schedules
13 For a more detailed discussion of the concept and use of well-being as a measurement tool for conceptualizing sustainable development, please see Chapter 1, Section 1.6. Also see (Stiglitz, Sen and Fitoussi, 2009; Arrow et al., 2012). 14 Yield improvements are typically measured in terms of production per unit area (e.g. wheat yield per acre). One area of potential confusion in this measurement is what qualifies as yield. Those interested specifically in the part of the wheat plant that is marketable for sale, may for example only be interested in the yield of the grains, whereas farmers may also be interested in the quantity and quality of fodder produced in their wheat crop as well. What yield does not include is any calculation of input costs or not profit from a given plot of land.
60
(water, fertilizer etc.) and yield output. This is especially so when output is used for multiple purposes
(home consumption, sale to the market), or when crops are harvested multiple times over a growing
season as is the case with most vegetable crops. These challenges become vastly more complex when
measuring the benefits of multiple technologies.
Moreover, even if sufficient quantity and quality survey data were available to understand the
individual contribution of multiple technologies to yield improvements in farmer’s fields, this would not
fully solve the challenge of linking the use of technology by an individual farmer to improvements in
well-being. The theoretical challenges can be best articulated through an example: If a farmer’s
introduction of technology T, leads to increased yields (yt) over average yields prior to the introduction of
the technology (ya), then the technology would be said to benefit farmers in terms of increased yields in
the amount of yt-ya = yb. Nonetheless increases in average yields do not account for the new costs
associated with the technology that can come either in terms of upfront capital investments, changes in
the labor requirements associated with using the technology, or complementary technologies required to
make the initial technology investment worthwhile. A more nuanced approach measures benefits in terms
of increased profits. If a new technology leads to increased yields (yb), increased profits are measured by
subtracting any increased costs associated with the use of the technology from the yb and finding an
equivalency between the costs and yield increases. This is done by estimating the market price at which
the goods are sold at market or if consumed at home estimating their value. Using profits instead of yield
increases as a proxy for benefits is thus vastly more complex.
Overcoming all of these barriers is possible when studying the yield benefits of a single
technology across a limited number of villages. A good example of this methodology can be found in
Burney et al. (2010), a study of a drip irrigation system powered by solar energy in West Africa which
found improvements both in household income and nutrition in a matched-pair comparison of four
villages over the course of a year. Disentangling the impacts of multiple technologies on yields or income

61
would require an enormous data set that would also have to distinguish between the effects of the
technology and exogenous factors such as variation in land quality, weather, pest outbreaks, and farmer
ability among other variables. Alone, the quantity of data required combined with uncertainty about
farmer recall ability, makes this approach technically difficult. For the purposes of a study designed to
look at the sociotechnical mechanisms undergirding the variance of benefits where qualitative data can
complement the quantitative measurements of benefits, the costs likely outweigh the benefits.
More problematic than addressing the challenges measuring profits as a proxy for benefits, is the
fact that the measure of profits in any given year or range of years does not account for the risks farmers
face that impact expected benefits from the use of technology. If technology T, brings yc benefits after
accounting for increased costs and market prices under normal conditions, farmers must also consider the
chance that some type of stochastic event such as severe weather or a disease outbreak will negate all or
part of their investment. This in turn makes the key variable of interest from a farmer’s perspective the
expected benefits of technology, taking into account the likelihood of whole or partial crop failure, as well
as other variables which impact the benefits farmers realize from increased yields. These could include
the cost of all input technologies used, variable market prices, risk of post-harvest losses, alternative uses
for various parts of the crop such as fodder for livestock15 and even personal preferences around changes
in the quality or type16 of their produce when using technology T.17 Due to the complex factors that go
15 Early crop improvement programs focused mainly on yield improvements of grains or pest and water stress tolerance. It was only in the 1990s that scientists recognized the importance of the dual purpose of most rice, wheat sorghum, millet and groundnut for both grain and fodder for livestock in many agricultural systems especially in the developing world. Research found that farmers perceive a range of traits associated with the quantity and quality of fodder from different crop varieties and that breeders that focus only on grain yield overlook important attributes of the crop that influence the total benefits farmer’s realize from the technology (Parthasarathy Rao and Hall, 2003). 16 For example, I found in Bihar that it was relatively common for farmers who had enough land to plant two varieties of rice – a higher yielding variety for sale to the market, and a second often lower yielding variety which is of preferred taste and quality for home consumption. 17 The challenge of measuring benefits or utility across individuals has long been identified in the welfare economics literature where marginal utility is generally assumed to be decreasing, but the shape of individual utility functions is usually unknown, making it difficult to infer the which individuals get more or less utility from an added unit of a given good or service. Moreover,

62
into the expected benefits farmers realize from technology including farmer specific preferences that may
not remain stable across individual farmers in an village, deriving an empirical estimate of the benefits in
terms of well-being is at an estimate with significant uncertainty.
2.3.1.2 Through Revealed Preferences A second approach to measuring benefits is through an approach similar to revealed preference
theory in the economics of consumer behavior. This strand of economics pioneered by Paul Samuelson
assumes that consumers reveal their true preferences through their purchasing decision (Samuelson,
1954). Using a revealed preferences approach to estimating benefits farmers derive from technology
means that a researcher can interpret a farmer’s decision to use a technology over multiple seasons or
years as a signal that the farmer derives positive benefits from the technology. This assumption is
supported by an extensive literature going back to the Nobel Prize winning economist Theodore Schultz
who developed the theory of the “poor but efficient” farmer. Schultz argued that even for poor farmers,
decisions about technology investments were the result of rational decision makers who were both risk
averse and cash constrained due to their poverty, yet still operated at their personal efficiency frontier
given the constraints of poverty (Schultz, 1966, 1980). This argument ran contrary to contemporary
perceptions which often assumed that small farmers especially in the developing world behaved
according to tradition rather than in response to economic incentives which characterized the modern
world. In contrast, Schultz assumed that farmers – like all humans – behaved rationally with respect to
their own preferences but faced constraints that other groups who had greater access to capital and faced
fewer stochastic risks in their businesses might not face. Schultz believed that these constraints would
affect their decisions. Schultz’s finding, with the exception of some evidence of irrational behavior with
it seems likely that the shape of utility functions may be correlated at least in some ways with socioeconomic categories. So, failing into account for co-variance in the shape of utility functions and socioeconomic groups in a study of variance of benefits across this groups would lead to significant challenges of interpretation.
63
respect to investments in fertilizer in Sub-Saharan Africa (Duflo et al., 2011), have largely been
confirmed by the literature (Duflo, 2006; Mueller and Binder, 2015). Even in the case of the irrational
behavior observed in the fertilizer study, the irrational behavior was associated with non-use rather than
use of the technology (we will come back to the complexities of how to interpret non-use of technology
later in this section). The preponderance of evidence suggests that the repeated use of a technology by a
farmer can be interpreted as a revealed preference that implies positive benefits from the technology.
The revealed preference approach to estimating technology benefits has been used in a limited
number of other studies in agricultural economics. Lichtenberg (2004) developed a revealed preference
approach to study the demand for multiple conservation technologies using technology adoption data
from farmers in Maryland, USA. Lichtenberg argues that the revealed preference approach overcomes
the limitations of a stated preference approach used by previous scholars where farmers are less likely to
give their true preferences for technology when questions about technology benefits are merely
hypothetical and actual cash and time investments are not made. Lichtenberg also found that the revealed
preference approach created the opportunity to study patterns of complementarity and substitution
between conservation technologies when farmers chose to use multiple technologies at the same time. A
second study by Asrat et al. (2010) used revealed preferences to study the preferences of farmers in
Ethiopia for different crop variety traits by estimating the mean willingness to pay for each crop variety
attribute (e.g. high yielding, short duration, draught resistance).
2.3.2 Limitations of Revealed Preference Approach
2.3.2.1 Estimation of Size of Positive Benefits This chapter borrows from the revealed preference approach to technology adoption used by
Lichtenberg (2004) and Asrat (2010) by assuming that a farmer’s use of a technology over multiple years
or seasons implies that she derives net positive benefits from use of the technology. The revealed

64
preference approach is limited in that it cannot estimate the size of the positive benefits. Rather, the use of
a technology by an individual farmer means only that the benefits the farmer derives from the technology
are greater than the benefits she believes she would derive from using alternative technologies or no
technology at all.
While the revealed preference approach is limited because it does not quantify the extent of the
benefits a farmer realizes from a given technology, for the purposes of this chapter, which is concerned
with the relationship between benefits and socioeconomic class, a simple binary variable (either an
individual farmer benefits from technology T or he does not benefit from technology T) is sufficient for
gaining some empirical traction on the research question.
That said, to compensate for the limitations of the revealed preference approach, I also asked
farmers for their own opinions about the relative benefits they derive from each of the technologies they
use. I use the data on perceived size or extent of benefits from each technology in the next section, both in
order to construct a matrix for case study selection and qualitatively in the six case studies.
2.3.2.2 Non-use of a technology The state of non-use of a technology by a farmer is more difficult to interpret. In theory, non-use
could mean one of two things: either, the physical dimensions of the technology do not provide positive
benefits to the farmer at the field-level – in which case, the farmer would not use the technology in its
current form even if it were readily available at the field; or, the institutional dimensions of the
technology create barriers to use of the technology even if the farmer would benefit from the physical
dimensions of the technology. A final potential explanation for non-use of technology is that the “poor
but efficient” model of farmer behavior is not entirely accurate. With the growth of behavioral economics,
some scholars argue that above and beyond the constraints poverty places on farmer decision-making as a
result of larger institutional forces (lack of credit, social safety nets, secure land tenure) the state of

65
poverty may have specific behavioral implications that impact farmer decision-making (Duflo, 2006). The
idea that all humans are not entirely rational in a neo-classical sense, but rather “boundedly rational” is an
emerging field of research in behavioral economics (Thorgeirsson and Kawachi, 2013). That the poor
could have specific behavioral characteristics that are not entirely self-maximizing, which are a result of
the very fact of their poverty is entirely plausible. Duflo et al. (2011) found evidence of some boundedly
rational farmer behavior in Western Kenya. They found that Kenyan farmers were using significantly less
fertilizer than they would if they were behaving according to neo-classical models of human behavior
even after taking account the institutional dimensions of the fertilizer technology in the region. Because
fertilizer was widely available locally at low cost and in highly divisible units, institutional barriers such
as cost or access to credit did not easily account for the low rates of use of the physical technology.
Instead through controlled field experiments, they found evidence of bounded rationality in this case
bounded willpower or a bias towards present outcomes over future outcomes. Farmers procrastinated
going to purchase fertilizer either because they had other things to do or wanted to spend cash on hand on
other goods. Despite the challenges that bounded rationality presents for a revealed preference approach
to measuring benefits, most evidence of the impacts of bounded rationality on farmers’ production
decisions has been associated with non-use rather than use of technology. For this reason, despite the
evidence of bounded rationality which challenge the “poor but efficient” model of farmer behavior, the
chapter treats use of a technology as a revealed preference that the technology leads to positive benefits.
But on the flip side, the explanations for non-use of technology must now include not only barriers in the
physical and institutional dimensions of technology, but also barriers related to behavioral characteristics
of farmers that may be correlated with their specific socioeconomic group. Fortunately, behavioral
dimensions of farmer decision-making are easily included in an ethnographic approach to the research
question. Thus, in order to understand why a specific farmer or in this case a specific socioeconomic
group of farmers are or are not benefiting from a technology requires looking at the physical and

66
institutional components of the technology in question, as well as at the behavioral responses of specific
groups of farmers within the context of a given setting.
2.3.2.3 Technologies with negative benefits? Despite the extensive literature supporting the “poor but efficient” or at least the “boundedly
efficient” farmer hypothesis, there is some concern in the literature that under certain circumstances
farmers may use a technology with negative benefits. The most prominent (and controversial)
documentation of this comes from the case of Bt Cotton in India, which activists and some scholars have
blamed for farmer suicides in India (Shiva et al., 2000; Shiva and Jafri, 2004).18 A technology that leads
to farmer suicide should certainly not be interpreted as a technology that brings positive well-being
benefits to farmers. The link between Bt cotton adoption and farmer suicide is however controversial.
Research conducted by the Food Policy Research Institute (IFPRI) found no evidence of increased rates
of farmer suicides after the introduction of Bt cotton in India (Gruère and Sengupta, 2011). Moreover, the
IFPRI study found that Bt cotton had on average increased yield and incomes of farmers in India.
However, the authors could not rule out a link between individual suicides and Bt cotton. They found
that in specific districts and years, the use of Bt cotton combined with severe drought and crop failure
may have led to increased farmer indebtedness linked to reginal spikes in suicides in specific years. The
authors’ point out that it is unlikely that the physical dimensions of Bt cotton are to blame as much as
regionally specific institutional dimensions. These include lack of irrigation, poor extension services and
information dissemination on best practices for Bt cotton cultivation, predatory private sector actors
selling inferior seed varieties, and in some cases falling market prices for cotton. In an average year, for
most farmers, Bt cotton brings positive benefits, but stochastic risk coupled with the specific institutional
18 Bt cotton is a genetically modified cotton variety, which produces within the plant itself an insecticide to bollworm, a major cotton pest, thereby reducing the need for external spraying of pesticide on the crop.

67
dimensions of the technology which differ by region, and the high capital investment associated with the
use of Bt cotton – which is more than triple the price of conventional hybrid seeds – can lead to disastrous
outcomes for farmers (Qaim et al., 2006). This is particularly true in areas where farmers go into debt
either to formal credit institutions or informal money lenders to finance technology investments. While
concern over reports of technology leading to farmer suicide or farmer indebtedness more broadly casts a
shadow over the revealed preference approach to the study of benefits of agricultural technology, it is
worth remembering that farmers themselves are often aware of risks and the stochastic nature of their
livelihood. It is also why a revealed preference approach based on quantitative data alone is insufficient to
fully understand the sociotechnical relationship between technology use and benefits and further bolsters
a mixed methods approach to the research question.
2.3.2.4 Use of second-best technologies A final limitation on the revealed preference approach worth discussing is the use of second-best
technologies as coping mechanisms when first-best choices are not available. In a study of the response of
Indian farmers to the increased cost of diesel (which raises the cost of groundwater irrigation when
electricity is unavailable), Shah (2007) observes the myriad ways farmers cope when the shifting
sociotechnical landscape impacts their ability to use a first-best technology choice. He found that farmers
use a variety of coping mechanisms including switching to different technologies (such as using
subsidized cooking fuel instead of diesel to power their pumps) or switching to crops where are either
riskier or less remunerative. While Shah’s study is an empirical example of farmers using technologies
they would rather not use if they had access to their first choice, he does not demonstrate that farmers
derive negative benefits from these second-best technology choices they are forced to make. Rather their
benefits are less than they would be if they had access to a different technology set. This study explores

68
this nuance of the revealed preference approach in more detail in the case study on electric motor pumps
(EMPs) in Section 2.6.4.
In summary, there are a number of limitations to the revealed preference approach to measuring
technology benefits. The first discussed previously is that a farmer’s use of a technology over multiple
season implies that the farmer realizes positive benefits from the technology, but it does not rank this
benefit in any ordinal sense so that relative benefits of technologies can be compared. Of course, many
technologies are often inter-dependent (it would make little sense to use high yielding seed varieties
(HYV) if you do not have fertilizer) so having an ordinal ranking may prove less useful than one might
expect and a qualitative approach may better capture the contingencies across technologies. The second
limitation is that while use of technology can be interpreted as a revealed preference, non-use as discussed
in the previous paragraph is more complex to interpret and benefits from the use of a qualitative as well as
institutional approach to sociotechnical systems. The third limitation and the largest risk is that farmer’s
sometimes use technology from which they do not derive positive benefits. In fact, with the stochastic
nature of agricultural production, it is almost certain that in some year’s technology investments will be
wasted due to crop failures. The concern then is twofold: 1) Are farmers using a technology when not just
this year’s benefits, but the expected benefits (given appropriate risk assessments) are also negative? 2)
Are there trends across socioeconomic groups so that for some groups, expected benefits are more likely
to be negative and if so what causes these differences? 3) Even if expected benefits are greater than zero,
are the consequences of failure of a technology so great that one might still wish to choose a
precautionary approach to their use and promotion (e.g. when farmers go into enough debt that their long-
term financial security is threatened)? This study does its best to control in particular this third limitation
through qualitative fieldwork, but also acknowledges that this concern may not be fully dealt with by the
methodology.

69
While all three approaches to quantifying benefits including yields, profits and revealed
preferences, have drawbacks, the revealed preference approach has the advantage of both requiring a
practicable data collection process, which triangulates both quantitative and qualitative data. Moreover,
from a broader epistemic perspective, using revealed preferences combined with qualitative interviews
allows the farmers’ voices themselves to guide the research process and findings, helping to guard the
researcher against the problem of omitting or overlooking important variables in farmers’ objective
functions. Failure to understand the full scope of farmers’ objective functions has in the past led to failure
of the agriculture research community to properly understand the needs of the poorest farmers and the full
set of sociotechnical opportunities and constraints they face (Ashby, 1997). This approach also shares
much in common with the farmer first model of agricultural research and extension pioneered by Robert
Chambers and the Institute for Development Studies in 1989 (Chambers, Pacey and Thrupp, 1989;
Scoones and Thompson, 2009).
2.4 Background: Bihar’s Economic Miracle in an Agrarian Context
In July 2015, I attended a conference at the Maurya hotel, one of the more luxurious hotels in
Patna, the capital of Bihar. The conference was called “Resurgent Bihar: An impossible dream?”19 A
leading English language newspaper in Bihar, The Telegraph, organized the conference which was set up
as a panel debate asking the question whether the recent improvements in Bihar’s economy, infrastructure
and security would continue, or if in contrast “Resurgent Bihar” would turn out to be “an impossible
19 Indeed, if you read the article about the conference in The Telegraph, you will find a picture of me and my colleague Nooper Sen in the audience. The caption “women in audience use their laptops” attempts to capture the overall message of the conference – Bihar is now a state where women are empowered and where modern technologies are in widespread use. The message was perhaps undercut by the setting of the conference in one of the nicest hotels in the city, the red carpet-style entrance (complete with a photography wall or “logo board”), and the selection of two highly-educated women from outside Bihar both using expensive Apple laptops to demonstrate this point. Of course, the entire conference was also in English. https://www.telegraphindia.com/1150718/jsp/bihar/story_32218.jsp
70
dream.” Despite the sensationalized title of the debate, the stakes were very real and immediate. With
impending elections in Bihar, that were seen by many as a referendum on the technocratic governance
style and development agenda of the current Chief Minister, Nitish Kumar, public opinion on the matter
was critical.
Nitish’s tenure as Chief Minister, which began in 2005, had transformed Bihar’s economy. During
the 1990s, Bihar’s economic growth had stagnated and Bihar had fallen behind the rest of India on almost
every development indicator (Singh and Stern, 2013). The situation had become so bad, that many Indians
from outside the state were afraid to visit. After Nitish Kumar’s election in 2005, growth in real per capita
income increased dramatically, from 0.9% between 1991-2005 to 10.4% between 2006 and 2012. Studies
also showed real improvements on multiple development indicators including crime, health (particularly
infant mortality and vaccinations), and education (see Table 2.2 for descriptive data on Bihar).

71
Table 2.5: Selected social, economic and agricultural indicators for Bihar and India as a whole.
Selected Indicators Bihar India Sources
Population 2011 104 million 1.2 billion (UNDP, 2011)
Share of population to total country 8.6% NA (Sinha, Ahmad and Singh, 2016)
Share of land area of total India area 2.9% NA (Sinha, Ahmad and Singh, 2016)
Population growth rate (2001 - 2011) 2.3% 1.6% (Govt. of India, 2001)
Percent population rural (2011) 88% 69% (Govt. of India, 2001) Nominal NSDP (or NDP) per capita at factor cost (2013-14, base of 2004-05) USD 480.0 USD 1434.7 (Reserve Bank of India, 2015)
Nominal NSDP (or NDP) per capita - Agriculture at factor cost (2013-14, base of 2004-05)
USD 97.3 USD 203.3 (Reserve Bank of India, 2015)
Compound annual growth rates in per capita NDP and NSDP (1995-1999) 1.5% 5% (Mukherji and Mukherji, 2012)
Compound annual growth rates in per capita NDP and NSDP (2010-2012) 14% 7.5% (Mukherji and Mukherji, 2012)
Human development index 2005 0.449 0.575 (Mukherji and Mukherji, 2012) Poverty ratios: Tendulkar methodology (2009-10) 53.5 29.8 (Mukherji and Mukherji, 2012)
Percent population rural 88.7% 68.84% (Govt. of India, 2001)
Hunger index rank 15 out of 17 states NA (Menon, Deolalikar and Bhaskar,
2009) Percent underweight children under three years (2005-06) 58% 46% (Kumar, 2011)
Percent workforce dependent on agriculture 74% 53% (Planning Commission, 2011; Hoda, Rajkhowa and Gulati, 2017)
Average landholding 0.96 acre 2.8 acre (Government of India, 2012)
Literacy rate (2011) 63.8% 74.0% (Mukherji and Mukherji, 2012)
Percent villages with road connectivity (2009) 57% 62% (Kishore, Sharma and Joshi, 2014)
The stellar performance of Bihar’s economy between 2006 and 2012, led many Indian pundits to
declare the recent improvements in economic and social indicators a “miracle” (e.g. Panagariyal, 2012) –
albeit a miracle engineered by a man. Multiple books quickly followed that extoled Nitish’s successes
with titles like “Nitish Engineering: Reconstructing Bihar” (to which the Dali Lama himself wrote a
forward calling Nitish “not only a man of ideals, but someone who takes action and tries to put them into

72
practical effect” (Sinha, 2013, p. 5), and “Bihar Breakthrough: The Turnaround of a Beleaguered State”
(Chakrabarti, 2013). Many of these books were published by Nitish’s supporters with evidence sometimes
selectively chosen to support the narrative of Nitish Kumar as uniquely responsible for the drastic
turnaround in the state.
Other sources provided a more even-handed analysis of Bihar’s development trajectory. One such
edited volume, “The New Bihar: Rekindling Governance and Development” (Singh and Stern, 2013),
took a more modest view of Bihar’s successes, while also noting the tremendous hurdles that remain. The
book was edited by two prominent authors, Professor Nicholas Stern, Chair of the Centre for Climate
Change and Economics Policy at London School of Economics and President of the British Academy (the
UK’s national body for humanities and social sciences), and N.K. Singh, a member of Parliament in
India. The book includes essays by Amartya Sen, a Nobel Laureate in Economics, and by M.S.
Swaminathan, a man revered as the father of India’s Green Revolution. While the essays in the book are
more circumspect in their evaluations of Nitish’s achievements, the very fact that this level of star-power
came together to publish a book about a single state in India, underscores the degree to which the
development community sought to showcase Bihar’s success.
Yet despite impressive economic growth over the past 10 years, Bihar, with a population of more
than a million people, remains the poorest state in India (Acharya, 2013). Moreover, the percentage of the
rural population – 88% of the population – living below the poverty line declined only marginally during
the first five years of Nitish’s government (see Table 2.3).

73
Table 2.6: Percentage of the population below poverty line. Source: (As adopted from Acharya, 2013; Columns 1,4, and 7 from Report of the Expert Group to review the Methodology for Estimation of Poverty, Government of India, Planning Commission, November 2009; Columns 2, 3, 5, 6, 8, and 9 from Press Note on Poverty Estimates, 2009-10, Government of India, Planning Commission, March 2012)
States Rural Urban Total
1993-94 2004-05 2009-10 1993-94 2004-05 2009-10 1993-94 2004-05 2009-10 Andhra Pradesh 48% 32% 23% 35% 23% 18% 45% 30% 21% Bihar 62% 56% 55% 45% 44% 39% 61% 54% 54% Chhattisgarh 6% 55% 56% 28% 28% 24% 51% 49% 49% Gujarat 43% 39% 27% 28% 20% 18% 38% 32% 23% Jharkhand 66% 52% 42% 42% 24% 31% 61% 45% 39% Madhya Pradesh 49% 54% 42% 32% 35% 23% 45% 49% 37% Orissa 63% 61% 39% 35% 38% 26% 59% 57% 37% Rajasthan 41% 36% 26% 30% 30% 20% 38% 34% 25% Tamil Nadu 51% 38% 21% 34% 20% 13% 45% 29% 17% Uttar Pradesh 51% 43% 39% 38% 34% 32% 48% 41% 38% West Bengal 43% 38% 29% 31% 24% 22% 39% 34% 27% All-India 50% 42% 34% 32% 26% 21% 45% 37% 30%
Indeed, over the five years between 2005 and 2010, rural poverty dropped by only one percentage
point. Whereas during the oft critiqued government of Nitish’s predecessor, Chief Minister Lalu Yadav,
the rate of rural poverty dropped by six percentage points between 1994 and 2004 (or an average of three
points over five years, in contrast to Nitish’s one). The inability of Nitish Kumar’s economic miracle to
reach Bihar’s poorest citizens was at the heart of the discussion that night at the Maurya Hotel. The
question on everyone’s mind during the conference was how to make Bihar’s economic growth more
inclusive.
What went unsaid during the debate at the Maurya, but what is almost certainly true, is that for
growth to be inclusive in Bihar, growth must not only take place in the industrial and service sectors, but
in the agricultural sector. Despite the strong economic growth in Bihar between 2006 and 2012, the

74
growth was concentrated in the construction and services sectors (see Table 2.4).20 At the same time, the
share of agriculture in Bihar’s net domestic product had fallen dramatically from 47.9% in 1993-94 to
15.4% percent in 2011-12. The imbalanced growth across sectors in the first five years of Nitish’s
government is likely why despite the “economic miracle”, the percentage of the population living below
the poverty line, especially in rural areas, barley declined.
Table 2.7: Share of selected sectors in Bihar’s Net Domestic Product
(Percentage shares of NDP at constant prices. Adapted from Acharya, 2013, based on data from the Central Statistical Organization of India)
Year Range Agriculture Manufacturing Construction Trade, Hotels,
Restaurants 1993-94 47.9% 4.5% 3.6% 15.2% 2000-01 37.1% 5.4% 3.5% 16.0% 2004-05 26.5% 4.9% 7.0% 23.0% 2011-12 15.4% 4.3% 12.1% 35.0%
Growth in the agriculture sector is important for poverty reduction. A study comparing economic
growth, growth in the agricultural productivity and poverty reduction across multiple states in India,
found that while agricultural growth has a relatively minor impact on overall gross domestic product,
agricultural growth has significant impact on the incidence of rural poverty. Specifically, the study found
that every 1% increase in agricultural growth, results in 0.45% rate of poverty reduction (Virmani, 2008).
Similar results have been found in other empirical studies (Irz et al., 2001; de Janvry and Sadoulet, 2010).
20 As Singh and Stern (2013, p. xxviii) point out, “the share of construction in Bihar’s net domestic product increased from 3.6 to 12.1 percent between 1993-94 and 2011-12, while the share of trade, hotels and restaurants increased from 15.2 percent to 35 percent over the same period. In contrast, the share of manufacturing has been stagnant at 4.5%.” The concentration of growth in these sectors led me to joke with my colleagues in Bihar (only somewhat tongue-in-cheek) that the growth in Bihar’s economy had been spurred less by Nitish’s policies than by the arrival of so many development professionals who were using all of the new hotels, restaurants and roads.

75
Despite the importance of agricultural productivity growth in ensuring the inclusivity of economic
growth, an analysis done by the International Food Policy Research Institute (IFPRI) in India, found that
over the past five decades, Bihar has had the slowest agricultural productivity growth rate of any state in
India. More troubling for a state where 88% of the population is rural and at least 74% of the workforce is
dependent on agriculture for their livelihood, the per capita and per worker value of agriculture has
shrunk over the past four decades (Kishore, Joshi and Pandey, 2014).
Since the election of Nitish Kumar in 20005, there have been some success stories in the
agricultural sector (dairy is one example, winter maize is another). Nonetheless, productivity especially
among Bihar’s staple crops, rice and wheat, remains far behind other Indian states (Hoda, Rajkhowa and
Gulati, 2017).21 In many ways, the Green Revolution which contributed so much to poverty reduction
and economic growth in states like Punjab and Gujarat, never came to Bihar (Edwards, 1974; Parayil,
1992; Bhalla and Singh, 2001). In order to understand stagnation in Bihar’s agricultural sector, it is
necessary to briefly trace the arch of Bihar’s intertwined agricultural and political history.
2.4.1 Landscape Level Context
When the British arrived in India, the colonial government identified the region that now includes
Bihar, Jharkhand and West Bengal (formally known as the Bengal Presidency) as India’s breadbasket. To
capitalize on the agricultural potential in the region, the colonial government built India’s first agricultural
research and teaching institute in Samastipur, a district in modern North Bihar. While multiple locations
across the country were considered as potential sites for the research institute, Bihar eventually won out
(RAU, 2017). Construction began on the institute in 1905 and was largely complete by 1907 (see Figure
2.2).
21 Cereals, including rice, wheat and maize account for 79% of the cropped acreage in the state (Hoda, Rajkhowa and Gulati, 2017).

76
Figure 2.4: Phipps Laboratory at the Imperial Agriculture Research Institute (IARI). IARI was located in Samastipur Bihar prior to the earthquake of 1934 when the institute was moved to New Delhi. The institute is still in Delhi and still has the same acronym, though the I now stands for India rather than Imperial. There is still an agricultural research center in Bihar, called Rajendra Agriculture University (RAU) which has lesser status and funding than the original institute build in Samastipur (Source: RAU, 2017).
The center was at first named for its location in the town of Pusa, but by 1918, the research
institute was given “imperial status” and was renamed the Imperial Agriculture Research Institute (IARI).
IARI flourished during this era, developing improved plant varieties including wheat, rice, chilies,
tobacco, linseed, mustard, pulses and vegetables. Work was also done on pest and pathogen control as
well as animal husbandry and agronomy.
The glory of IARI in Bihar would be short lived. In 1934, a massive earthquake destroyed much of
the institute including the central Phipps Laboratory. Instead of rebuilding IARI in Bihar, the colonial
government saw the shifting trends not only in agricultural production in the country, but also in the seat
of political power, which was also shifting from nearby Kolkata to New Delhi (Guha, 2007).
Accordingly, the government rebuilt IARI not in Bihar, but in New Delhi where it remains to this day.
This move left the research center in Samastipur with significantly lower status and fewer resources.
77
The shift of IARI to New Delhi presaged a significant decline in the strength of Bihar’s
agricultural sector. There are multiple reasons for the decline in Bihar’s agricultural productivity relative
to the rest of the country. Almost certainly, the colonial land tenure system established in the Bengal
Presidency, known as the zamindari system had major implications for the growth of Bihar’s agricultural
sector (Banerjee and Iyer, 2005; Mukherji and Mukherji, 2012). Under this system, land rights were given
exclusively to large landlords known as zamindars who were responsible for collecting land revenues for
the colonial government from an entire village or group of villages. Landlords were free to set their own
terms with the peasant cultivators and could dispossess any peasant who did not meet these terms. The
zamindars were entitled to keep whatever revenue remained after paying the British revenue demand. In
this way, the zamindari system essentially gave all property rights to the large landholders, leaving them
with an extraordinary level of economic and social power over the villages they were liable for, and the
villagers within them.
Even after the end of colonialism and the official abolition of the zamindari system circa 1950,
institutional vestiges of the zamindari system continued to impact agricultural growth in the state.
Banerjee and Iyer for example found that regions of India where property rights were given to large
zamindars, had significantly lower agricultural investments and productivity in the post-independence
period, than regions where these rights were given to peasant cultivators. The authors use an institutional
explanation to explain this divergence – “differences in historical institutions lead to very different policy
choices” (Banerjee and Iyer, 2005, p. 1190).22
Despite the fact that Bihar was the first state to officially abolish the zamindari system in 1947, the
reform was never given any real teeth (Chintu and Kumar, 2017). Both land redistribution and reforms in
22 The zamindari system stands in sharp contrast to the ryotwari system, prevalent in other parts of colonial India, under which revenue was collected directly from peasants by the colonial government and linked to output, avoiding the perverse institutional incentives created by the zamindari system.
78
tenancy practices failed, due largely to the continued political and economic power of the large
landowners (whom many small farmers still refer to as zamindars).
While several new attempts at land reform in Bihar have been made since the 1950s, these reforms
have all suffered from implementation failures (Ministry of Rural Development, 2009; Rorabacher, 2008;
Wilson, 1999). Nitish Kumar attempted once again to address the issue of land reform when he was first
elected, forming a Land Reforms Commission in June 2006. The Commission purportedly authored a
final report in 2008, but the results were never made public. Since commissioning the report, the issue of
land reform has not been addressed by Nitish’s government due to the complex political realities of such
an effort (Bandyopadhyay, 2009; Banerjee, 2009; Chintu and Kumar, 2017).23
In addition to the structure of land tenure regimes in Bihar, other factors also played a role in the
failure of the Green Revolution in the 1970s to improve productivity in the state, including both severe
floods and droughts. Bihar suffers from frequent and often devastating floods. 73% of the state’s total
geographical area is designated as flood prone (Kishore, Sharma and Joshi, 2014). The floods wreak
havoc in terms of human lives lost, loss of livestock, loss of crops and devastation of infrastructure. Most
of Bihar’s flood prone districts are in North Bihar, but a failure to manage the complex river system that
brings both copious water and rich alluvial soil to the state on an annual basis, impacts farmers
throughout the state.
In the South (where the primary field site for this project is located), floods are less common, but
droughts frequently ravage farmer’s livelihoods. Large parts of Bihar experienced droughts in four out of
23 Indeed, Nitish Kumar came to power by bringing together a coalition that was made up of both the wealthiest and the poorest people in the state. While Lalu had controlled the state on the platform of lower caste empowerment, the benefits had largely accrued to OBC castes including his own Yadav caste. To beat Lalu in the 2004 election, Nitish brought together a coalition of UC and SC/ST castes who expected reforms in law and order, better economic growth and overall a more technocratic approach to development policy (Witsoe, 2013). However, Nitish’s reliance on the upper castes also likely influenced his decision to shelve the contested issue of land reform.

79
the five years between 2009 and 2014 (Kishore, Joshi and Pandey, 2015).24 The problem of droughts is
likely to become even greater in the future as the Indian Council of Agricultural Research (ICAR)
estimates that 24 out of the 38 districts in Bihar are extremely vulnerable to climate change (Sehgal et al.,
2013). While the droughts are less costly in terms of loss of human life, they increase risk aversion
among farmers and impact technology investment decisions. Even when droughts are not officially
declared, many farmers I interviewed believed that the monsoon had become increasingly erratic in the
past decades.
A final important piece of the puzzle explaining both Bihar’s poor economic growth prior to 2005,
as well as its stagnant agricultural productivity growth, is Bihar’s recent political history. Beginning in
1990, Lalu Prasad Yadav was elected chief minister of Bihar. Lalu rose to power on a social
empowerment platform, championing the plight of the backward and scheduled castes who had long
labored with few political or economic rights. Jeff Witsoe, in his book Democracy Against Development
explains that in order to realize his goal of lower caste empowerment, Lalu marginalized the professional
bureaucracy whose ranks were filled mostly with India’s upper castes (Witsoe, 2013). In order to avoid
filling open positions with upper caste administrators, Lalu instead chose to leave many critical
government positions unfilled. Perhaps as a result of his barebones government or as a rebuke to the
central government, he also failed to go through the necessary administrative hoops to receive funding
allocated from the central government for Bihar’s rural and economic development. While Lalu’s strategy
may have succeeded in excluding the upper castes from positions of power, it also left important
government functions such as agricultural extension and rural credit unions in a state of disrepair (Witsoe,
2013).
24 Kishore et al. (2015) note that: “The years 2009–2013 have been the driest 5 years in the last 113 years in Bihar. Of the 38 districts in the state, five experienced droughts in all five years between 2009 and 2013; 14 experienced droughts in four out of these five years; another 14 saw three years of drought; while the remaining five saw two years of drought.”

80
The state’s infrastructure also declined during the Lalu era with many villages that had once been
electrified losing their electricity supply (Mukherji, 2005). Once electrical current was no longer supplied
to the wires, the wires were stolen and repurposed or sold. Today, driving through rural Bihar, you see a
landscape dotted with concrete electricity polls without wires linking one to the next. Some concrete polls
have been knocked down and turned into improvised (and dangerously effective) speed bumps to slow
motorcyclists down as they go through villages. This visual of electricity polls converted into grassroots
speedbumps serves as a reminder of the state of disrepair of Bihar’s infrastructure Lalu left in his wake at
the end of his tenure as chief minister in 2005 (see Figure 2.5).
Figure 2.5: Concrete electricity polls turned into improvised speed bumps in Gaya district, Bihar.
(Photo Credit: author)
The decline of Bihar’s infrastructure also contributed to Bihar’s stagnant agricultural growth. This
was especially true for irrigation. While other states developed robust groundwater irrigation systems in
the 1970s and 1980s, limited electricity in Bihar made irrigation for Bihari farmers much more expensive.
This is because Bihari farmers were forced to continue to rely on diesel engines to pump groundwater
when farmers in other states were transitioning electric motor pumps, which provided water at a much
lower marginal cost (Kishore, 2004). Today, the vast majority of groundwater irrigation in Bihar is still

81
powered by diesel, forcing farmers to practice deficit irrigation and hampering yields (Kishore, Sharma
and Joshi, 2014).
In 2005, Nitish Kumar, a reformist minded politician ousted Lalu Prasad. Nitish was seen by the
political elite and the Indian bureaucracy as a technocratic ‘breath of fresh air’. From the perspective of
Indian policy makers and the international community of development organizations, Bihar once again
had the potential to flourish. Donor funding and international development practitioners and scholars
flooded into the state with the goal of reviving Bihar’s lagging economy and improving the well-being of
Bihar’s people.
The importance of the agricultural sector in addressing rural poverty did not escape Nitish Kumar
when he came into power. Improving the agricultural sector was not only key to his policy objectives, but
also to his electoral strategy. Bihar is one of the least urbanized states in India with 88% of its population
living in rural areas, most of whom depend on agriculture for at least part of their income and food
security. Finding policy solutions to jumpstart Bihar’s rural economy was essential to his continued
popularity among his electoral base. In 2008, Nitish launched the State’s first Agriculture Road Map and
followed that with a second road map released in 2012 (see Figure 2.6) (Government of Bihar, 2008,
2012).

82
Figure 2.6: 2012-2017 Agricultural Road Map25
Chief Minister Nitish Kumar (right) with the President of India, Pranab Mukherjee (left). President Mukherjee visited Bihar to participate in the official launch of the 2012 Agricultural Road Map (pictured). October 3, 2012. (Photo Credit: Aftab Alam Siddiqui)
The 2008 Road Map acknowledged Bihar’s potential and challenges: “Though endowed with good
soil, adequate rainfall and good ground water availability Bihar has not yet realized its full agricultural
potential. Its agricultural productivity is one of the lowest in the country, leading to rural poverty, low
nutrition and migration of labor” (Government of Bihar, 2008, p. 3). The document goes on to underscore
the critical nature of agriculture to the state’s development agenda. “With nine out of every ten persons
from Bihar living in villages, and with three out of every four in Bihar employed in agriculture, a road
25 See tables in Appendix 2 for budget breakdowns of both the 2008 and 2012 Agricultural Road Maps. This were compiled by the author from long reports. The Bihari government did not explicitly breakdown the budget into tables in either Road Map, but rather provided the data that comprises these tables throughout the chapters of each Road Map.

83
map for agriculture is not about farming alone, but it is about the lives of persons of the
State”(Government of Bihar, 2008, p. 4).
The Agriculture Road Map outlined five major goals including increased incomes for farmers,
food security, nutritional security, increased farming employment opportunities, and finally “agricultural
growth with justice” to focus specifically on poor and marginalized groups including women and
marginalized castes. The 2008 Roadmap allocated a total of 532 million dollars to Bihar’s Agricultural
sector under 11 separate schemes (Government of Bihar, 2008). These schemes included plans to improve
the quality and availability of seeds in the state, soil health management, crop protection, farm
mechanization, transfer of technology, improved extension services, improved online portals for the
agricultural sector, integrated farming demonstrations in specific “demonstration villages”, soil and water
conservation, micro irrigation, and agricultural marketing and development. Perhaps at odds with the
plan’s professed interest in ‘agricultural growth with justice’, by far the largest portion of funding (37%)
went to agricultural marketing and development, a line item which is almost certain to disproportionately
benefit wealthier farmers who are already producing significant surplus for sale and who can benefit from
improved access to better markets, prices and cold storage facilities. In contrast, improved funding for
extension services, at 3% of the 2008 Road Map budget, was unlikely to significantly change the
functioning of this critical service in ways that would benefit the poorest farmers.
In 2012, Nitish published a second Agriculture Road Map, this one significantly increased funding
to the agriculture sector to 1.8 billion dollars (Government of Bihar, 2012). This plan also significantly
raised the percentage of funds directed at agricultural extension services to 34.5% of the budget. It also
strongly backed one specific technology – the System of Rice Intensification (see Section 2.6.2) – which
was both seen by Nitish and perhaps more importantly sold to the public as a specifically “pro-poor”
technology investment. Over the five-year period between 2012 and 2017, the Road Map allocated 7.9%
of the total 1.8 billion to the System of Rice Intensification.

84
The reorientation of Bihar’s sociotechnical regime under Nitish Kumar was goal oriented –
improving law and order, spurring economic growth, reducing poverty (Basu, 2013; Singh and Stern,
2013). The 2008 and 2012 Agriculture Road Maps demonstrated that Nitish Kumar had a clear
understanding of the links between agriculture and inclusive economic growth.26 At the same time,
Bihar’s farmers are not homogenous and agricultural policies and programs as well as other changes in
Bihar’s sociotechnical regime likely impact farmers across socioeconomic spectrums differently. This
chapter is written in the context of the changing sociotechnical regime facing farmers in Bihar, and looks
at how the benefits of these changes have been distributed across socioeconomic groups of farmers.
2.5 Data: Triangulating Using Ethnography and Survey Data
My interest in Bihar began in 2011 when I first visited the state to learn about the adoption and
popularity of a new technology for rice cultivation – the System of Rice Intensification (SRI). During this
trip, it quickly became clear that the recent upheavals in Bihar’s political economy (discussed in Section
2.4) were fertile ground for a larger study on agricultural innovation systems and the ways in which the
structure of these systems impact the lives and livelihoods of farmers in different social and economic
groups. An abrupt discontinuity between the policies of the former chief minister Lalu Yadav (1990 to
200527), and the policies of the current chief minister, Nitish Kumar (2005-present28), reoriented the
26 Bihar’s Agriculture Road Map was the first Road Map specific to the agriculture sector published by any state in India. Moreover, the Bihari Government recently published a new 2018 Agriculture Road Map. Unfortunately, the 2018 Road Map was published too recently to be productively included in the analysis here. 27 In fact, Lalu Yadav was Chief Minister only from 1990 to 1997, when he was convicted of corruption. However, his wife, Rabri Devi, took over as Chief Minister after Lalu was imprisoned. Throughout his imprisonment, Lalu continued to wield power in the state using his wife as a proxy. For analytical purposes, the Lalu-Rabri era is treated as a single political era from 1990 to 2005. 28 Like Lalu, the era of Nitish Kumar is punctuated by a brief period during which another leader from his party assumed the mantle of Chief Minister after Nitish’s party was badly defeated in a mid-term election and Nitish stepped down as a result, appointing Jitan Ram Manjhi in his place. In the subsequent election in the fall of 2015 Nitish won re-election and was reinstated as the Chief Minister of Bihar. For analytical purposes, I treat the entire period from November 2005 to present as the Nitish era.

85
institutions and infrastructure in Bihar, transforming the sociotechnical regime facing the agricultural
sector.
I hypothesized that a change in the sociotechnical regime, would be methodologically useful.
Changes in the sociotechnical regime could open up an opportunity for discussion in qualitative
interviews, as well as a place to look at changes in patterns in quantitative data. The intuitive sense I had
on my first visit turned out to be correct. First, I found in the quantitative survey data an abrupt shift in
farmer agricultural technology adoption that began after the new Chief Minister, Nitish Kumar, was
elected in 2005, and peaked around 2010. Second, the discontinuity in the sociotechnical regime between
the Lalu and Nitish eras inspired passionate discussion across a state where almost everyone from auto-
rickshaw drivers, to farmers to businessmen have strong political views (which they rarely shy away from
expressing). By asking concretely about the links between broader changes in the political economy of
Bihar and changes in the farmers’ livelihoods and agricultural practices, I acquired rich and unexpected
data that was much more illuminating than the answers farmers shared when I asked about the past three
decades. While interviews with farmers often began with a question about changes in their agricultural
practices since 1990, the more interesting answers – the ones that linked to institutional structures and
underlying causal mechanisms – often came when I asked specifically about changes between the Lalu
and Nitish eras. For example, famers across Bihar ascribed the increased availability of improved seed
varieties to increased law and order in Bihar, which was one of the key changes in the sociotechnical
regime introduced by Nitish Kumar.
The empirical investigation for this chapter is based on fieldwork conducted between 2011 and
2016 in Bihar including multiple visits between 2011 and 2014 and more than a year of fieldwork

86
between September 2015 and January 2016.29 I conducted research in multiple settings including
individual villages, local markets and regional markets, and in the state capital, Patna. I interviewed
agricultural input dealers, agricultural commodity traders, local politicians, state, district and block level
bureaucrats, agriculture extension officers, local NGOs leaders, international donor agency staff,
international private sector company representatives in the state, agriculture researchers, local reporters
and university faculty. I visited research and development projects around Bihar and interviewed farmers
about their experiences, shadowed private sector input dealers as they traveled to local villages to
convince farmers to buy their seeds and equipment, and attended many agriculture fairs, government
organized farmer trainings and state level development conferences run by international NGOs and
international research organizations (see Table 2.5).
29 During this time, I was also traveling to other parts of India and Nepal for separate research projects on drip irrigation and solar powered irrigation pumps, however the bulk of my time was spent in Bihar.

87
Table 2.8: List of interviews and participant observation conducted in Bihar as part of fieldwork. Note that the list excludes ethnographic work in Bathani village which is difficult to quantify as much of the learning consisted of repeated interactions with the same individuals over long periods. That said, many of the other interviews in reality consisted of repeated interactions. In these cases, individuals are listed only once even when discussions with informants occurred at more than one sitting.
Interview / Participant Observation Type
Sample Size
Types of Data Gathered
State level public sector actors (e.g. Agriculture Production Commissioner)
15 Information on government priorities and programs for rural development.
District level public sector actors (e.g. District Agriculture Officer, Block Agriculture Officer).
12 Information on government program implementation and evaluation of technology in Gaya district. Note that many of these actors were interviewed multiple times over multiple years with ongoing relationships.
Private sector actors (e.g. MIS company representatives, local seed vendors, local diesel engine vendors, representatives multi-national seed companies).
32 Information on agriculture technology and agribusiness trends. Private sector observations of rural sector and government programs. Note that many of these actors were interviewed multiple times over multiple years with ongoing relationships.
NGO actors (Both leadership and staff of local and international NGOs).
23 Evaluation of technologies; technology policy, government programs and barriers facing poorest farmers. Note that many of these actors were interviewed multiple times over multiple years with ongoing relationships.
Bihar-based academics (including agronomists, soil scientists, economists, sociologists among others).
15 Overall impressions of development policy in Bihar under Chief Ministers Lalu Yadav and Nitish Kumar. Evaluation of barriers to inclusive rural development.
Journalists 5 Overall impressions of development policies in Bihar with specific focus on agricultural policy.
Political events attended 3 Observed government actors including Nitish Kumar engage with constituents around development agenda.
Development conferences observed / participated
8 Included a mix of highly international development conferences and conferences with a more domestic audience.
Farmer extension & training events observed
12 Attended government organized trainings focused on the system of rice intensification; use of pesticides and direct seeded rice-wheat cropping systems. Observed the interactions between trainers and farmers.
Farmer focus groups conducted 13 Focus groups conducted with groups of farmers usually around evaluations of specific technologies including system of rice intensification (SRI); drip irrigation (MIS) and solar irrigation pumps (SIP).
Farmer interviews (outside Bathani village)
40 This is an approximate amount for the number of farmers I interviewed outside Bathani village, excluding the survey. It is difficult to estimate the total number of farmers I interviewed individually especially when those interviews took place in informal settings such as markets or at other agriculture related events.

88
Perhaps most importantly, I immersed myself in a single village, Bathani30, to serve as a
cornerstone of my analysis. I spent several months traveling to Bathani on a daily basis, leaving my
rented room around 7am and returning at dusk. While I had originally hoped to live in the village, my
local contacts felt that there was too much risk involved for a foreign female to stay in a remote village
overnight. This is because there is an ongoing low-level Naxalite insurgency in much of rural Bihar. 31 In
fact, there are some parts of rural Bihar where power is firmly in the hands of the Naxalite insurgents and
where government officials largely avoid visiting day or night. While the part of Bihar where Bathani is
located is more firmly under the control of the state government, most of my colleagues felt that my
security could not be guaranteed at night, unless I chose a different village very close to a major city
which would undermine the research design. I eventually had to compromise, renting a room in a guest
house in a nearby smaller city and traveling to Bathani by motorcycle to spend the day immersed in the
village. The motorcycle trip took 30 to 45 minutes. I spent weeks at a time commuting to Bathani
interspersed with time in the district capital Gaya, the state capital Patna, and traveling throughout Bihar.
This helped me to understand my experience in Bathani in the context of the larger sociotechnical regime
facing the agricultural sector in Bihar. In total, I spent over 15 months in the field in 2014 and 2015, in
addition to several trips to Bihar prior to 2015. My fieldwork concluded in January 2016.
To prepare for this ethnographic approach, I learnt Hindi over the course of several trips to India
and developed strong comprehension skills (and much more modest speaking, reading and writing skills).
While fluent Hindi would have of course been ideal, as a foreign woman, traveling alone in Bihar was
never an option. I therefore hired a local translator, Pranav. Pranav’s usual day job was as a part-time
30 Bathani is a pseudonym I selected for my primary field site to maintain the anonymity and privacy of the village. The names of the hamlets or tolas in Bathani have also been given pseudonyms. Other villages in the data set are described as villages 2-12 (though I do include the actual districts where each of the villages is located). 31 The Naxalite insurgency is an ongoing conflict between some Maoist groups known as Naxalites and the Indian government. The Naxalites control territory in the Indian states of Bihar, Jharkhand and Andhra Pradesh.

89
employee for a local NGO working on female empowerment. While he was not trained as a translator, his
local knowledge and the fact that most of his family worked in agriculture in the Gaya district made him
an invaluable part of my research process. Pranav and I worked as a team in the field. He would usually
translate my questions into Hindi and other local dialects. However, Pranav only sometimes needed to
translate responses back into English when I felt I had not fully understood the nuances of a response. We
developed a specific set of hand signals so he would know whether I wanted responses translated back
into English or not. This greatly improved the ease and fluidity of conversations with farmers in Bathani.
My ability to understand spoken Hindi made it possible for me to capture nuances in conversations with
farmers that might be ‘lost in translation’ when communicated through a translator who may not have a
complete grasp of the goals of the research program or understand when new relevant themes emerged
(an important part of grounded research) (Glaser and Strauss, 1967; Charmaz, 2014).
I complemented my ethnographic research in Bathani with a survey conducted in January 2016 in
both my primary village and an additional 11 villages in both South Bihar (seven villages) and North
Bihar (four villages) for a total of 12 villages which I refer to throughout this paper as the 12-village
survey. I used the results of the 12-village survey to triangulate (Jick, 1979) my qualitative understanding
from Bathani and wider qualitative fieldwork across Bihar (see Appendix 2 for descriptive statistics of the
12 villages).32 The 12-village survey included both quantitative and numerous qualitative or open-ended
32 The 11 additional villages were selected semi-randomly from the 2011 census. Specifically, I purposely selected three districts: Gaya, Jehanabad and Madhubani for their varied characteristics including distance from Patna (Bihar’s capital city) and whether they were located in North or South Bihar. In each of these districts, I randomly selected four villages using the list of villages in the 2011 census, however I first constrained the set of villages from which I drew the random sample to villages with more than 100 households where at least 60% of adults gained their primary income from agriculture in order to ensure that the villages selected had a large enough agriculture sector that non-use of technology was not due to lack of interest in agriculture. Within each village, a stratified sampling approach was used. The survey team first recorded the general descriptive data on the village including the number of tolas and breakdown of castes by tola. They then randomly sampled households at the tola level to ensure that the sample was approximately representative of the caste composition of the village. The survey team limited respondents to households engaged in agriculture either on their own land, as a sharecropper, or tenant farmer before conducting the survey. This limited the sample to households that could speak with experience to the issue of agricultural technology adoption. Thus, if a household worked exclusively in brick kilns or as migrant labor in another state, they were not sampled. It is also worth noting that I made every effort to speak to the head of households for each survey. There are advantages and disadvantages to this as it certainly excludes the voices of women farmers. However, based on my fieldwork in Bathani, I felt that
90
responses. I travelled with my survey team to understand the context of each of the additional 11 villages
where the survey was conducted including the overall electricity situation in each of the villages, their
proximity to local and regional markets and input dealers and other factors that may influence the benefits
farmers derive from agricultural technology and the barriers farmers may encounter in the technology
adoption process.
Over the course of the fieldwork for this project, I became a careful observer of agricultural
technologies, asking farmers about the technologies they used, their benefits, drawbacks and tradeoffs. I
studied the decisions of farmers with respect to use of technology both in Bathani my primary field site,
but also on field visits to many other parts of Bihar as I traveled with private sector companies, extension
officers, NGOs and international aid organizations to the villages where they were working. Not only did
I want to understand how particular technologies came to be used by farmers in Bihar, I was also
interested in the technologies that were not there, but perhaps should have been. For example, the only
time I found a farmer using drip irrigation in the field was when I explicitly went to the field with a list of
farmers who had received a subsidy for the technology.33 The lack of drip irrigation technology was
particularly conspicuous due to a government program offering a 90% subsidy on drip irrigation, which
had been ongoing in Bihar since 2006 (see Section 2.6.3).
response quality around technology adoption was likely to be higher when speaking to the head of household. As the aim of this study was to understand the sociotechnical causes barriers to technology use at the household level, this seemed like the right tradeoff to make. A separate study of its own could be done looking at the inter-household impacts of technology use. (If I were going to begin such a study, I would start with the overwhelming number of households that still do their threshing of paddy by hand with female household labor rather than rent the relatively inexpensive threshers that are widely available on the market for low rent. This include threshers both powered with a human foot, but far less backbreaking than the manual method with no tools and even electric threshers which require only single-phase electricity. From everything I could tell in Bathani, the choice to not rent a thresher was simply a matter of sufficient female household labor and lack of concern for the drudgery of the work involved.) 33 I also found a farmer using drip irrigation in the 11-village survey. The farmer turned out to be one of the largest farmers in the data set from Bihar’s colonial landlord or zamindar caste, who used his drip irrigation which he purchased with a 90% subsidy on his profitable teak farm.

91
Overall, my fieldwork focused on understanding technology adoption in its sociotechnical context
including the actors and institutions that are inextricably linked with the availability of technology at the
local level. The chapter looks at the technologies in use in the 12-village dataset (as well as the
technologies in limited use) to understand the barriers preventing the poorest farmers from realizing
greater benefits from the available technologies in Bihar.34, 35
2.5.1 Technology Adoption and Changes in the Sociotechnical Regime
One insight from the 12-village survey – which reinforced my qualitative findings and original
intuition about Bihar as a field setting – was that Bihari farmers have indeed experienced significant
change over the past two decades with respect to the technologies they use. In the 12-village survey,
farmers were asked when they began using a technology (conditional on having answered that they use
the technology in the first place). The data in Figure 2.7 shows very low rates of use of all of the
technologies prior to 2000. Moreover, large spikes around 2005 and 2010 in most graphs underscores the
likely relationship between the changing sociotechnical regime in the state, the increased focus on
agricultural development embodied in the 2008 and 2012 Agriculture Road Maps, and increased
technology use by farmers.
34 Because of the focus on technologies in limited and widespread use, this chapter does not address the invention stage of the innovation system. One question that is left open at the end of the chapter is why there are no pro-poor technologies in Bihar. Whether this is because of missing incentives for invention, or because this category of technologies is intrinsically small, is left as an open question. 35 One significant drawback of the research design with respect to the issue of poverty is that it does not in general address benefits with respect to the needs of landless households who do not either take land on lease or sharecrop. While I did my best to understand the impact of technology on labor, the overall methodology which uses technology use as a proxy for benefits, does not leave room for easy inclusion of this marginalized group. It is a drawback of this methodology for studying the distributional impacts of technology.
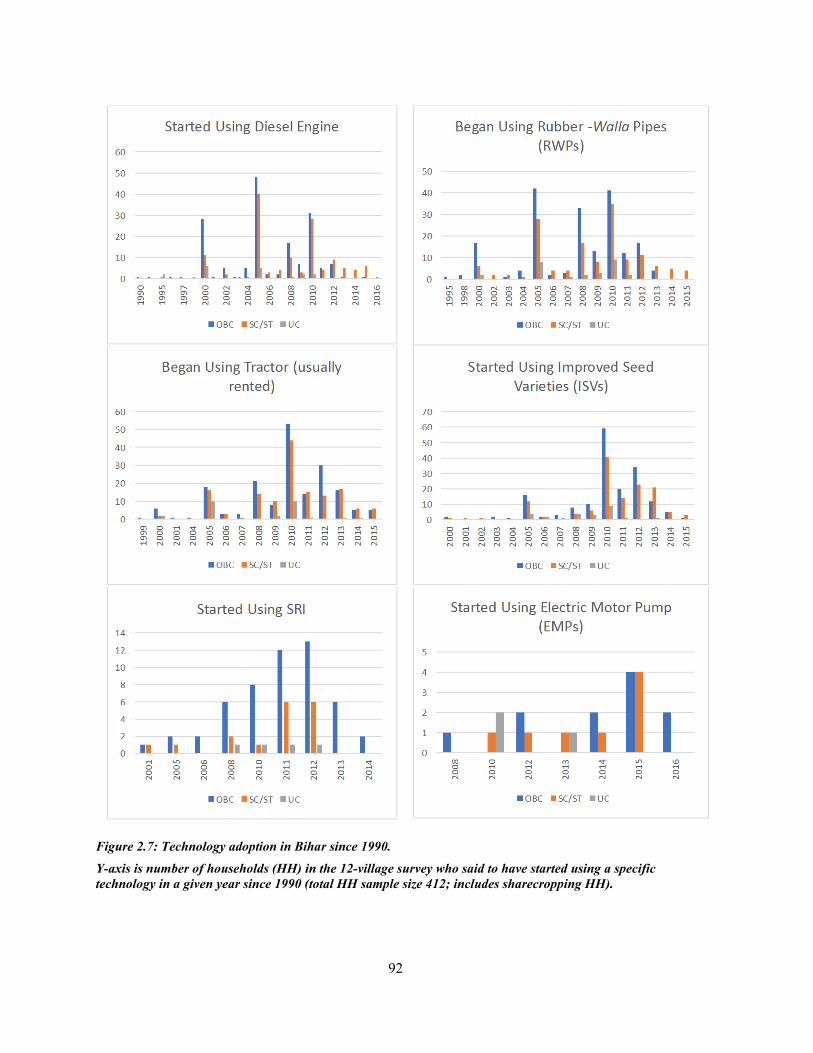
92
Figure 2.7: Technology adoption in Bihar since 1990.
Y-axis is number of households (HH) in the 12-village survey who said to have started using a specific technology in a given year since 1990 (total HH sample size 412; includes sharecropping HH).

93
Perhaps the most striking graph in Figure 2.7 is for improved seed varieties (ISV). ISVs were not
in common use until 2005. This is decades after the Green Revolution with its combination of improved
seeds, fertilizers and controlled irrigation that had transformed the agricultural systems of many other
parts of India (Parayil, 1992). Figure 2.7 should, of course, be viewed with some skepticism. Farmer
recall on the year of technology adoption is imperfect. The data tends to cluster around five and 10-year
intervals (e.g. 2000, 2005 and 2010). This is likely an artifact of farmers’ tendencies to give one of these
“multiple of five” years as an approximation for when they began using a technology. Nevertheless, based
on longer discussions with farmers, I am confident that the technology adoption timeframes should be
accurate within three to five years of the date given. This means, for example, that improved seed
varieties (ISVs) did not enter widespread use until after 2005 with a significant peak in 2010.
Understanding what drove the widespread adoption of ISVs in Bihar, so many years after other regions of
India, is one of the goals of the case study on ISVs in Section 2.6.6.
The fact that many agricultural technologies began to scale into widespread use in Bihar decades
after they had been adopted in other parts of India, means that it is possible to study the ways in which
actors and institutions influence technology adoption and in particular, which groups benefit and which
do not in real time. In many ways, this makes Bihar an excellent field setting for the empirical
investigation of the sociotechnical mechanisms undergirding the distribution of benefits of agricultural
technologies. This is because farmers are currently involved in the messy process of deciding whether or
not to adopt new technologies, and are available to talk about the reasons for their adoption or non-
adoption in real-time.
At the same time that Bihar is a good case study because of the immediacy of the change, it is
also in other ways a poor case study because the long-term dynamics of technology adoption and the
associated distribution of benefits remain unknown. This is in contrast to states such as Punjab or Gujarat
where Prakash’s 2005 study of groundwater extraction captured the socioeconomic implications of

94
technological change over multiple generations (Prakash, 2005). This chapter on Bihar is limited in its
historical scope. For example, as I discuss in Section 2.6, the transition from diesel engines to electric
motor pumps (EMPs) is so recent, it is impossible to say for sure how the distribution of benefits will
ultimately be allocated across socioeconomic groups. What is clear from other work looking at
groundwater markets in India, is that the way benefits are ultimately distributed will be highly dependent
on both infrastructure and institutions created by state and national level actors. In the case study on
EMPs (Section 6.4), I go into further detail about the different possible outcomes for the poorest farmers
in Bihar as electric motor pumps become more widely available. By drawing on scholars such as Prakash
(2005), Mukherji (2006) and Shah (2009) and their work on groundwater economies such as Gujarat and
West Bengal, it is possible to reflect on the possible futures for Bihar’s changing irrigation landscape.
The overall picture that emerges from the adoption data in the 12-village survey is that the shift
from the Lalu to Nitish period strongly coincided with a shift in rates of agricultural technology adoption.
This suggests that Nitish’s technocratic approach to development did lead to changes in the agriculture
sector. Assuming – as I have in the methods section of this chapter – that continued use of technology can
be interpreted as benefits of technology, the rest of this chapter seeks to understand the extent to which
different socioeconomic groups of farmers benefited from the changes in the agriculture sector led by the
changing sociotechnical regime under Nitish Kumar.
2.5.2 Bathani: Primary Field Site
Bathani, my primary field site is located in Gaya district in South Bihar bordering the State of
Jharkhand. Gaya is known for the city of Bodhgaya where the Buddha is said to have attained
enlightenment. Other than the district capital, also called Gaya, and nearby Bodhgaya, the district is
largely rural, agrarian and poor. The majority of farmers in the district are subsistence farmers with
landholdings of 0.2-0.3 ha and agriculture incomes averaging USD 250 per year (Govt. of India, 2001).

95
The farmers in Gaya district also suffer from droughts and water insecurity. Three out of five years
between 2010 and 2016 were officially designated as drought years by the government. Even in years
without droughts, with the exception of the monsoon season, farmers need access to irrigation to grow
crops. Unconstrained by water, farmers in Gaya district can grow three crops per year: summer (March-
June), monsoon (July-October) and winter (November-February).36 But in reality, many farmers are only
able to grow a single crop per year due to either lack of access to, or high costs of water.
Despite the drought conditions in the district, the water scarcity most farmers face is not physical.
Groundwater tables are relatively high (15-30 feet) and pumping groundwater requires relatively shallow
borewells (50-100 ft) compared to other states in India where borewells can be deeper than 1000 feet (e.g.
Gujarat and Karnataka). Moreover, significantly larger groundwater withdrawals (as compared to current
withdrawals) are sustainable due to the hydrology of the region which is frequently renewed through
rivers and runoff from the Himalayas (Central Ground Water Board, 2013).
Instead, the barriers to water access for farmers are financial. Underinvestment in surface irrigation
infrastructure by the State has left farmers with no other choice than to pump groundwater. Without
access to surface irrigation, farmer’s lift groundwater using either diesel engines or electrical motors. In
states like Gujrat and Punjab (major agriculture producers in India) almost all farmers have access to the
electric grid (though intermittency issues mean that farmers often rely on a combination of electric pumps
and diesel engines (Smith and Urpelainen, 2016)).
In contrast to the Western States, Bihar’s power situation is bleak (or at least was bleak at the time
of fieldwork). As of 2009, nearly 40% of villages in Bihar were not connected to the electricity grid (Oda
and Tsujita, 2011) and Bihar’s annual per capita energy consumption (122 kWh) was the lowest among
36 The major monsoon crop is paddy (rice). Winter crops when grown include wheat, pulses, mustard and maize. Summer crops which are rarely grown by most farmers worked with are usually robust cover crops and for farmers who have economical access to surface irrigation, vegetables and sugar cane (which takes 18 months to mature).

96
Indian states (Oda and Tsujita, 2011). 37 The high cost of diesel, especially in comparison to the highly-
subsidized electricity provided in Western India, translates to high and often unaffordable costs of
irrigation for Bihari farmers. Indeed, farmers in Bihar likely pay about twice as much for water as their
Gujarati peers (Kumar, Scott and Singh, 2013). The combination of limited surface irrigation, limited grid
connectivity and expensive diesel means that almost all irrigation pumps in Bihar operate on diesel and in
villages without electricity, farmers are forced to rely either on increasingly expensive diesel, or
increasingly erratic monsoon rains for their monsoon (paddy) crop. Farmers that rely on the monsoon for
paddy often simply forgo winter and summer crops or only grow crops on a portion of their landholding.
Bathani (see Figure 2.8) is a beautiful village with an undulating landscape. It is a mid-sized
village approximately 20 kilometers from the district headquarters with a population of just under 200
households. The village is located next to a winding tree-lined riverbed. Except during the monsoon
season (July – September) the river is dry, yet just below the sandy surface, water percolates ensuring that
the vegetation around the river remains lush even in the summer/dry season.
37 The focus of Nitish’s government on extending electricity access has almost certainly improved this figure.

97
Figure 2.8: Map of Bathani village in Gaya district.
Map highlights the three tolas or hamlets Surka, Rajapur and Erki. Blue dots show locations of wells and red bolts show locations of the newly introduced transformers. Note that not all wells in Bathani are created equal as some are able to provide water 24 hours a day, while others allow farmers to pump water for at most of few hours before running dry. The types of wells by tola are listed in Table 2.6.
Two and a half kilometers away from Bathani, a larger village, Roh, is a focal point for multiple
agricultural villages in the Area. Roh’s Friday market is a bustling place where many farmers from
Bathani go both to sell their agriculture produce, but also to buy inputs such as seeds, fertilizers and other
farm equipment and generally to interact with the larger community. Like any market town serving
multiple villages, it is a social space where farmers talk politics, meet with important local power brokers
whether official representatives of the State or wealthy businessmen and landholders. It is also a place to
learn about new agriculture technologies and practices. It is here that opinions about the value of different
technologies are often formed. Private seed, fertilizer and other input supply stores line the main market
street. Thus, while much of my ethnographic fieldwork took place in Bathani, I also spent a lot of time in

98
Roh learning from input dealers and market middle-men and farmers from other villages who often
approached me and wanted to talk.
I selected Bathani as the primary site for several reasons. First, it is distant enough from the district
headquarters that agriculture makes up a substantial portion of most household’s labor activity and
income. Second, Bathani is made up of three tolas or hamlets (Surka, Rajapur and Erki), which differ both
in the caste38 composition, socioeconomic status and access to natural resources.39 Third, three-phase
electricity40 was introduced to one of the tolas (Surka) shortly before my research began. Three-phase
electricity (rather than single-phase) is required to run motorized water pumps to lift groundwater. When I
began my fieldwork, it had just become available in one tola, but not the other two. The introduction of
three-phase electricity particularly motivated my selection choice because I wanted to observe in real-
time how the introduction of electricity shaped farmer decisions about technology adoption across
Bathani’s tolas and socioeconomic groups.
Surka tola (see Table 2.6) is the wealthiest of the three tolas measured in terms of landholdings as
well as caste composition. The 74 families in Surka, own a total of 58 acres. This works out to an average
of 0.79 acres per household. When only OBC households in Surka are considered the average goes up
38 I use the terminology in common use in Bihar to refer to different caste groupings and occasionally refer to specific castes (e.g. Yadavs) with reference to the larger category they are generally categorized in. The caste groupings include: 1. “upper castes” (UC). These castes have traditionally formed India’s elite. In Bihar, the major forward castes have traditionally controlled the vast majority of agriculture land. The lower castes are grouped into several categories. The first, known as “other backward castes” or OBCs are generally the most socially and economically empowered of the lower castes. Scheduled Castes and Scheduled Tribes (SCs and STs) are a level below OBCs in terms of the social and economic empowerment. It is also worth noting, that the most common way to refer to the three caste categories is to use acronyms to describe OBC and SC/ST castes but to use the full words when describing UC castes (upper castes). I find this discrepancy unfairly biased and use acronyms in most cases to describe all three groups. I sometimes continue to use the full spelled out version when the use of the caste category is meant as an adjective rather than a noun (e.g. upper caste hegemony; lower caste empowerment). 39 Generally, in Bihar, different tolas in a single village will have significantly different compositions of castes and sometimes religions. 40 Three-phase electricity as opposed to single-phase electricity is needed to run the size of electrical motors necessary for lifting water for agriculture purposes. Without three phase electricity, farmers must rely on diesel powered pumps to access groundwater for irrigation.

99
significantly to 1.15 acres. Surka is roughly evenly divided between OBC and SC/STs castes with slightly
more OBCs than SC/STs. The largest caste group in Surka are Yadavs who belong to the OBC caste
category. Moreover, two large Yadav families account for approximately 40% of the population in Surka.
This ensures the tola is extremely close-knit. Over the course of my fieldwork, I observed the Yadavs of
Surka working together to solve problems and invest as a group in new technology – unmistakably a
strong example of collective action supporting technology adoption. In addition to being locally powerful,
the Yadav caste also gained more state-wide power during the era of Chief Minister Lalu Yadav who
belongs to the same caste. Despite the transition from Lalu to Nitish, Yadavs maintain a significant hold
on local political institutions in the Gaya district.
Table 2.6: Bathani Village descriptive data by tola.
Functional wells are defined as wells where farmers can extract water from well using a diesel or electric pump set for at least 8 hours in a 24-hour period. Many of the other wells, particularly in Rajapur would give water for 1 to 3 hours a day, which is insufficient to guarantee water for irrigation for most purposes.
Tola Name and Caste (Number of
Households)
Average HH Members
Average Land Owned per HH
(Acres)
Total Wells Owned
Functioning Wells* [Non-functioning
wells]
Surka (74) 6.3 0.79 11 9 [2] OBC (39) 6.3 1.15 5 5 [0]
SC/ST (35) 6.2 0.39 6 4 [2]
Rajapur (17) 6.2 0.26 3 0 [3] OBC (2) 6.5 0.20 0 0 [0]
SC/ST (15) 6.2 0.27 3 0 [3] Erki (70) 5.8 0.42 8 6 [3]
OBC (22) 5.0 0.84 6 5 [1] SC/ST (48) 6.2 0.25 2 0 [2]
Rajapur tola is located across the road from Surka and up a small hill. Relative to Surka, Rajapur
is small both in terms of number of households and landholdings. There are 17 families in the tola who
own a total of 4.42 acres or an average of 0.26 acres per household. The tola is overwhelmingly made up
of families from SC/ST castes. Only two families in Rajapur belong to an OBC caste and these families

100
live close to the border between Rajapur and Surka and tend to associate more with residents of Surka
than Rajapur. Apart from the two OBC households in Rajapur, most residents of Rajapur are
excruciatingly poor. Residents of Rajapur regularly skip meals (an average of 1.8 times per week)
because of a lack of food availability. This is in stark contrast to Surka and Rajapur tolas where less than
10% of households report skipping any meals due to lack of food availability. The food scarcity in
Rajapur is especially acute in monsoon season when the paddy crop is in the field but before harvest.
Many households in Rajapur earn extra income by processing liquor from the fruits of local trees which
the men in Rajapur drink (often to excess) and sell to their neighbors in both Surka and Erki (though the
Yadavs from Surka would never admit to drinking).
Finally, Erki tola consists of a wider variety of castes than either Surka or Rajapur. The economy
of Erki is more diversified than Rajapur or Surka with several shop owners as well as residents who earn
their incomes outside of the village as drivers, construction workers in the district headquarters, and
migrant laborers to other states. There are 70 families in Erki who own 29 acres of land. This average
land holding is 0.42 acres per family. Overall interest in agriculture in Erki is lower than in Surka where
the Yadav families in particular have been investing heavily in improving the productivity of their land.
In many ways interest in agriculture in Erki is also lower than in Rajapur where agriculture, despite being
capital and land constrained, is essentially for food security and survival. The waning interest in
agriculture in Erki has made for an interesting dynamic – while some households in Erki have moved
away from agriculture by opening stores in Roh or working in Gaya for daily wage labor, others have
chosen to invest heavily in agriculture often renting land from their neighbors who want to exit
agriculture without selling their land.41 As more and more households move their household labor out of
41 In other cases, households in Erki give out their land on a sharecropping basis to neighboring households in Erki or to farmers from Surka or Rajapur tolas. While the residents of Rajapur are in the direst need of the extra income they could earn through sharecropping, residents of Erki expressed strong preferences to work with farmers from Surka who they viewed as more skilled and more socially acceptable than those from Rajapur.

101
agriculture, the families in Erki who have chosen to specialize in agriculture are increasingly investing in
technology. This includes borewells both as a source of irrigation water for their own land, but also as a
source of revenue generation by selling water to other farmers. In many ways, Erki is a potential model
for a sustainable future for Bihar’s small landholders, where some must inevitably go into other
industries. In turn this reduces land scarcity for those farmers who remain, allowing them to invest in
more productive agricultural systems.
Farmers across all three tolas in Bathani almost exclusively cite water availability as their primary
constraint to improved agricultural productivity and income. Out of 127 households in Bathani who
responded to a survey question about their biggest barrier to increased agricultural earnings, 121 named
access to or cost of water as the primary barrier. Only six households did not name access to or cost of
water as their primary barrier. Of those six, four named capital constraints more broadly, which in all
likelihood includes cash to purchase diesel or buy water from other farmers. The other two households
named a lack of human capital resulting from disability and ill health of a family member.
However, despite the uniform opinion in Bathani that water is the biggest barrier to agricultural
productivity, both economic and physical access to water varies dramatically between the three tolas.
The variation in access to water is due to the physical geography and hydrology of Bathani, but also to
capital investments in water extraction infrastructure including open wells and borewells and other
irrigation infrastructure by private farmers as well as government actors.
In addition to Surka’s significant advantages in terms of landholding per capita, Surka tola is also
endowed with a higher overall availability of groundwater as well as easier access to water in the sandy
riverbed. Surka relies heavily on borewells as well as open wells. Farmers in the tola own a total of 11
wells, nine of which provide water 24-hours a day. The two semi-functional wells belong to two SC/ST
families. Both of these wells are open wells with a depth of about 50 feet and run for approximately two
hours before needing to go through a process of recharge which takes four to five hours. In addition to

102
Surka’s wells, a government subsidized project in 2014 constructed a PVC pipe from the riverbed to the
center of Surka’s agricultural land. The PVC pipe from the riverbed significantly reduced the quantity of
diesel required to pump groundwater (because the necessary lift from the river bed is very limited) and
thereby the unit cost of water for the farmers in Surka. In order to receive the PVC pipe connection, the
farmers in Surka who belonged to the politically powerful Yadav caste, lobbied (and bribed) their
connections in the district headquarters to secure the subsidy. After the construction of the PVC pipe, the
village was able to expand both their winter and summer area crops and adopt higher value vegetable
cultivation in these seasons.
The introduction of the three-phase power transformer on the road through Surka in the spring of
2015 also significantly impacted the cost and accessibility of water to farmers in Surka. The transformer
was installed on the main road that passes through Surka hamlet. There were rumors in the other two tolas
that the Yadav families in Surka had used their political connections not only to ensure the three-phase
power came to Bathani, but to dictate the location of the transformer on the road closest to their land.
These rumors were however never corroborated by anyone in Surka (whereas the farmers in Surka freely
told me about their efforts to secure the PVC pipe).
All farmers in Surka knew that the high water-tables in their tola combined with newly affordable
energy for pumping groundwater could transform both their productivity and profits. Over the course of
my fieldwork, farmers in Surka began connecting their wells to the transformer at their own cost and
labor, and began to make additional investments in new borewells.42 These investments were all made
because the monthly flat-rate cost of electricity at 220 rupees (approximately 3.30 USD) was significantly
42 This includes what I assume to be the dangerous work of stringing their own electricity wires from the transformer to their borewell using for lack of a better word homemade electrical poles and without supervision by any kind of state electricity agency or licensed electrician. At first I thought farmers in Bathani were stealing electricity, but I was told by multiple sources that they would later register their homemade connections with the government or face fines. In this way, the cost of creating a within-village grid was entirely born by the households themselves.

103
lower than the cost of pumping water with diesel. In addition to major investments in technologies that
could be supported by access to electricity, farmers across Surka were also investing in almost all
technologies at higher rates than the farmers in the other two tolas.
Unlike Surka, Rajapur hamlet has little access to water for agriculture and even drinking water is
limited. The 17 families in Rajapur own a total of three wells (excluding two government-built hand-
pumps which are intended for drinking water but are often used as an extremely labor-intensive source of
water for small kitchen gardens). The three wells in Rajapur are all open wells with a maximum depth of
50 feet. Because the topography of Rajapur is uphill and farther from the river than either Surka or Erki,
the three open wells in Rajapur have extremely limited functionality. Two of the wells run for one to two
hours per day before they must be left to re-charge for several hours. The third well in Rajapur is
completely unusable except during monsoon when it is sometimes used to store residual water.
The water scarcity in Rajapur not only impacts the agriculture decisions farmers make, but also
permeates every aspect of the daily rituals in the tola. In the mornings and evenings, a line often forms
around the two government-built hand-pumps which are used for everything from drinking water to
washing laundry. Despite their limited utility, the two functioning open wells are used by the farmers in
Rajapur to their maximum capacity. Because of the limited availability of water in Rajapur, most farmers
do not own their own diesel pump, but rather rent them from farmers in Surka for the hour or two that the
well is functional. This rental relationship adds an added dimension of uncertainty to their lives because
their neighbors in Surka only rent out their diesel pumps when they are not otherwise in use and often do
not clearly communicate availability with their renters.
In terms of water availability, Erki like Rajapur has no access to the river, but its land resources are
low-lying compared to Rajapur so that a much higher fraction (50%) of Erki’s wells are functional. There
are eight wells in Erki, five of which function for 24-hours a day and three of which have limited
functionality of around three to four hours a day. Like in Surka, the SC/ST castes are more likely to own
104
the semi-functioning wells in Erki and the OBC castes are more likely to own fully functioning wells.
Farmers in Erki wish that the government had also built a PVC pipe for them when they did the one in
Surka, but their wish did not materialize.
The socioeconomic transition in Erki from an economy based on agriculture to one based on
increasingly diversified wage-labor has also allowed individual farmers to specialize in agriculture. One
OBC household in Erki (whom I will discuss in greater detail in Section 5.2) owns two of the most
powerful wells in Erki which currently run off of powerful diesel engines. Moreover, towards the end of
my fieldwork, when farmers in Erki received the good news that a three-phase transformer would be
installed on the road belonging to a neighboring village but on the outskirts of Erki’s agricultural land,
this same farmer began immediately to allocate money toward the construction of a new borewell on his
cousin’s property nearest the new transformer. It is likely that by the time I go back to Bathani, not only
will this household be the main provider of irrigation for the entire tola, but it will also be operating much
of the agricultural land through leasing and sharecropping arrangements with neighbors. This
consolidation dynamic is only possible however because of the access to water (and now electricity) in
Erki. Similar dynamics would be unlikely to emerge in Rajapur where the inferior topography limits the
potential value of land and thus the desire of farmers with more capital to use the land on a sharecropping
or leasing basis.
The variation in both physical and economic access to water across the three tolas in Bathani
significantly impacts the benefits farmers derive from their land. Farmers in Surka have almost unfettered
physical access to water and their economic costs for extracting water are also the lowest across the three
tolas. Even before the transformer was installed on the road in Surka, the PVC pipe connected to the
riverbed reduced the cost of lifting groundwater by about 20-30%. In Rajapur, irrigation water is both
physically and economically inaccessible for many families. Finally, in Erki, physical water access is
significantly better than in Rajapur, but limited compared to Surka. Costs in Erki are also higher (though
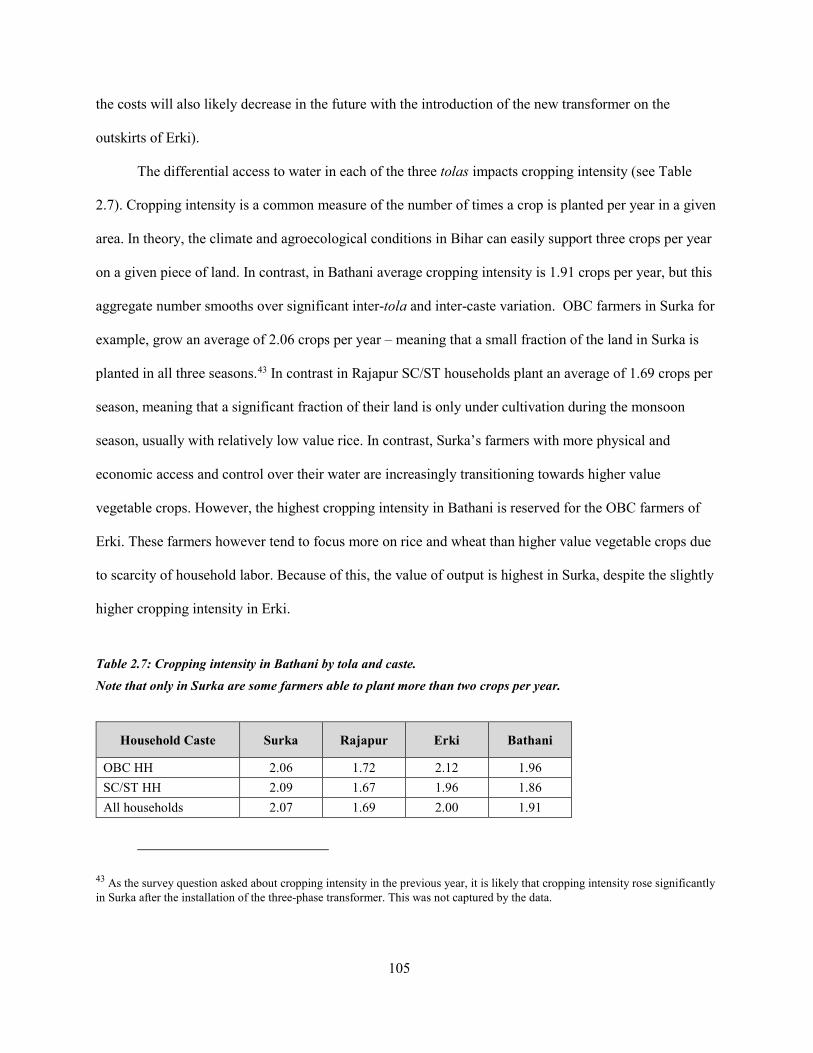
105
the costs will also likely decrease in the future with the introduction of the new transformer on the
outskirts of Erki).
The differential access to water in each of the three tolas impacts cropping intensity (see Table
2.7). Cropping intensity is a common measure of the number of times a crop is planted per year in a given
area. In theory, the climate and agroecological conditions in Bihar can easily support three crops per year
on a given piece of land. In contrast, in Bathani average cropping intensity is 1.91 crops per year, but this
aggregate number smooths over significant inter-tola and inter-caste variation. OBC farmers in Surka for
example, grow an average of 2.06 crops per year – meaning that a small fraction of the land in Surka is
planted in all three seasons.43 In contrast in Rajapur SC/ST households plant an average of 1.69 crops per
season, meaning that a significant fraction of their land is only under cultivation during the monsoon
season, usually with relatively low value rice. In contrast, Surka’s farmers with more physical and
economic access and control over their water are increasingly transitioning towards higher value
vegetable crops. However, the highest cropping intensity in Bathani is reserved for the OBC farmers of
Erki. These farmers however tend to focus more on rice and wheat than higher value vegetable crops due
to scarcity of household labor. Because of this, the value of output is highest in Surka, despite the slightly
higher cropping intensity in Erki.
Table 2.7: Cropping intensity in Bathani by tola and caste. Note that only in Surka are some farmers able to plant more than two crops per year.
Household Caste Surka Rajapur Erki Bathani
OBC HH 2.06 1.72 2.12 1.96 SC/ST HH 2.09 1.67 1.96 1.86 All households 2.07 1.69 2.00 1.91
43 As the survey question asked about cropping intensity in the previous year, it is likely that cropping intensity rose significantly in Surka after the installation of the three-phase transformer. This was not captured by the data.

106
The easy accessibility of water for irrigation in Surka, has not only given the farmers in the tola
the opportunity to increase their cropping intensity and specialize in high value crops, they have also
benefited from more help from district level extension agents and even from NGOs. Whenever outside
technical support comes to Bathani it tends to naturally concentrate in Surka tola. This is not because the
NGOs or extension agents are necessarily overtly discriminatory against Rajapur or Erki, rather it appears
that outside actors rightly identify that their jobs will be much easier of they work with farmers who can
benefit from their help because of the very fact that they have sufficient access to water for irrigation. The
outside actors hope that if they can “plant the seed” of new technology in Surka, that it will spread to the
other tolas. Despite this hope, the extent to which cross-tola knowledge and technology transfer in
Bathani actually happens is very limited, due in part to limited information flows between OBC and
SC/ST castes, but mostly due to the differential availability of water for irrigation which in almost every
case lubricated (pun intended) the technology adoption process.
2.5.3 Ethnography of Three Households
The relationship between ownership and access to land and other capital assets, historical caste
dynamics and the ability to invest in agricultural technologies can be illuminated through thick
descriptions of three families in Bathani. I chose these three families as particularly illustrative examples
of the important sociotechnical dynamics impacting the degree to which different socioeconomics groups
of farmers in Bathani benefit from technology. In this section I describe the opportunities and constraints
these three families (A, B and C) face with respect to their agricultural technology adoption decisions and
how these decisions are mediated by the intertwined forces of social caste, historical land rights and
resource endowments. In Section 2.6, I draw on the experiences of these families to add thick
descriptions to the case studies.
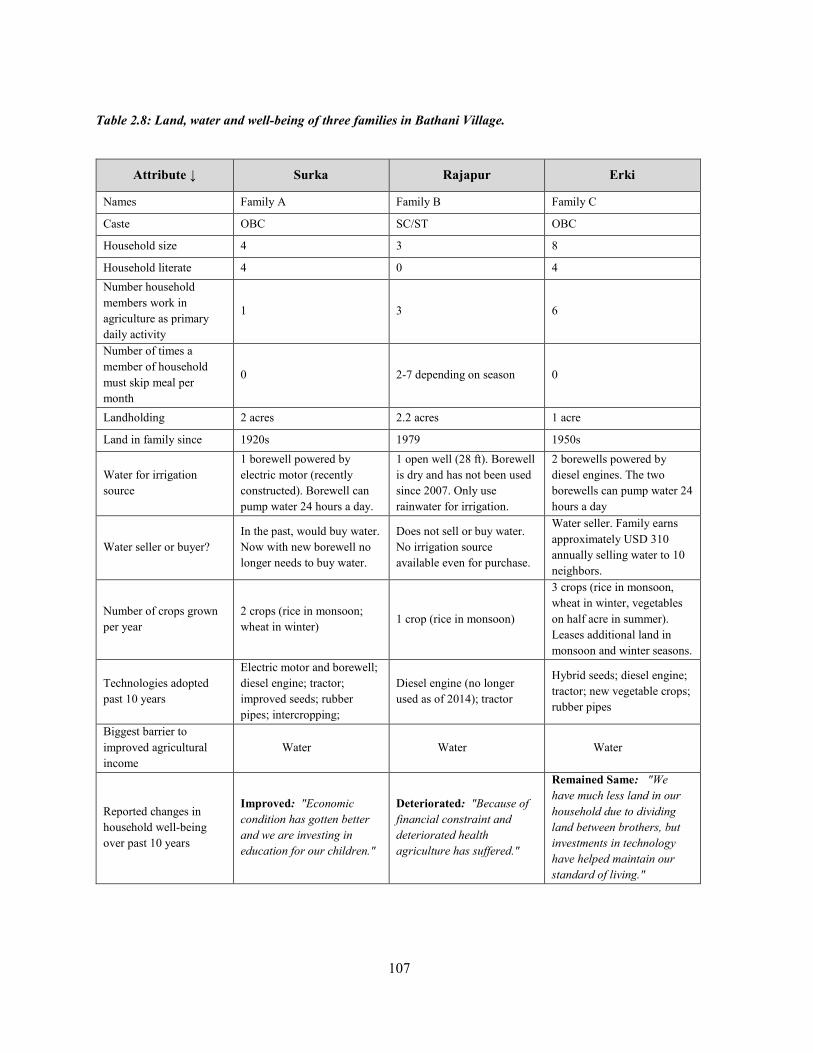
107
Table 2.8: Land, water and well-being of three families in Bathani Village.
Attribute ↓ Surka Rajapur Erki
Names Family A Family B Family C
Caste OBC SC/ST OBC
Household size 4 3 8
Household literate 4 0 4 Number household members work in agriculture as primary daily activity
1 3 6
Number of times a member of household must skip meal per month
0 2-7 depending on season 0
Landholding 2 acres 2.2 acres 1 acre
Land in family since 1920s 1979 1950s
Water for irrigation source
1 borewell powered by electric motor (recently constructed). Borewell can pump water 24 hours a day.
1 open well (28 ft). Borewell is dry and has not been used since 2007. Only use rainwater for irrigation.
2 borewells powered by diesel engines. The two borewells can pump water 24 hours a day
Water seller or buyer? In the past, would buy water. Now with new borewell no longer needs to buy water.
Does not sell or buy water. No irrigation source available even for purchase.
Water seller. Family earns approximately USD 310 annually selling water to 10 neighbors.
Number of crops grown per year
2 crops (rice in monsoon; wheat in winter) 1 crop (rice in monsoon)
3 crops (rice in monsoon, wheat in winter, vegetables on half acre in summer). Leases additional land in monsoon and winter seasons.
Technologies adopted past 10 years
Electric motor and borewell; diesel engine; tractor; improved seeds; rubber pipes; intercropping;
Diesel engine (no longer used as of 2014); tractor
Hybrid seeds; diesel engine; tractor; new vegetable crops; rubber pipes
Biggest barrier to improved agricultural income
Water Water Water
Reported changes in household well-being over past 10 years
Improved: "Economic condition has gotten better and we are investing in education for our children."
Deteriorated: "Because of financial constraint and deteriorated health agriculture has suffered."
Remained Same: "We have much less land in our household due to dividing land between brothers, but investments in technology have helped maintain our standard of living."

108
2.5.3.1: Family A Family A is from the majority Yadav caste in Surka and owns two acres of land. The husband and
wife are both in their early 40s and have two children, one son (14 years old) and one daughter (16 years
old), making their landholding per household member amongst the largest for the residents of Surka.
They have no plans to have additional children, so it is likely that the son will inherit the entire property
without the need to subdivide the land into increasingly fragmented parcels.
Family A’s primary residence is in the center of the residential part of Surka tola amongst multiple
Yadav homes. Their home is one of the nicer homes in the tola made from both brick and mud (rather
than just mud). They have a bed for every member of the household which is rare for households in
Bathani. They are also among four households in Bathani that have both an electric fan and a kerosene
stove, which allows the wife and daughter to cook without breathing in the smoke of the more traditional
biomass burning stoves found in most homes in Bathani.
However, despite the comforts of their home, it is almost impossible to find any member of the
family at home day or night. Instead, the entire family relocated to a tent closer to their agricultural land
which is across the road from the residential part of Surka. They did this because they were the first
family in Bathani to take advantage of the new transformer and invest in a new borewell. In addition to
the borewell, they invested in an electric pump and 200 yards of electric wiring to bring electricity from
the transformer on the main road in Surka to their plot which is located north of Surka closer to Rajapur
tola. The total cost of the entire investment was 59,000 rupees (approximately 900 USD). To protect their
investment, they sleep, cook, eat and work in a small tent they built next to their borewell and electric
pump.
Their investment was not without risk. A nearby borewell built in a neighboring village never
reached the water table and at a construction cost of about 39,000 rupees (approximately 600 USD or
about 30% more than average annual household income in Bathani) was essentially sunk. At first, Family
109
A used their borewell cautiously, fearing that running the borewell 24 hours a day would over-tax the
water supply and leave them with nothing in return for their massive investment. Slowly, they became
more confident that unlike their neighbor, their investment decision was going to yield positive returns
and they began to pump more and more water every day.
In addition to the borewell and electric pump set which they began using in the fall of 2015,
Family A has adopted multiple technologies in the past 20 years. They began using diesel engines off-
and-on in the late 1990s, but the location of their land and lack of nearby well (until the construction of
their new borewell) made frequent irrigation difficult. The family therefore mostly relied on rainfall, with
occasional supplementary irrigation which meant dire circumstances for their paddy crop (they left their
land fallow in the winter and summer seasons).
Using supplementary irrigation became significantly easier in 2008 when many farmers in Bathani
started using rubber pipes to transport water between wells and their fields. The rubber pipes replaced dug
channels as a means of transporting water from wells to fields, significantly reducing labor requirements.
For Family A, the rubber pipes were especially beneficial because they allowed them to transfer water
over a road from an adjacent village at a higher elevation than their land. They paid their neighbor a total
of 87 rupees (approximately 1.3 USD) per hour of irrigation (62 rupees for field, and 25 rupees for the
pump rental).
In 2010, Family A began using high yielding paddy after seeing the success other farmers in Surka
had had with a shorter duration paddy variety. The short duration variety benefited their family for two
reasons. First, the faster growing variety meant fewer necessary irrigations in the event of drought,
decreasing the likely cost of cultivation. Second and perhaps more importantly, the shorter duration seeds
meant that their paddy could be harvested sooner, allowing for a winter wheat crop to be planted on time.
Indeed, before 2010 the family did not bother to grow a winter crop both because of the difficulty of
irrigation before the introduction of rubber pipes, and because the paddy crop was usually not harvested

110
in time to ensure a good yield on their wheat crop before the summer heat. Now, with the addition of
shorter duration paddy seeds to their technology portfolio combined with the availability of irrigation due
to the introduction of rubber pipes, they were able to prepare their field in time to plant winter wheat.
They also began renting a tractor in 2011 to prepare the field more quickly between paddy and wheat
crops. They were able to prepare their two acres in one afternoon hour at a cost of around 2,700 rupees
(approximately 42 USD).
In 2015, Family A adopted the practice of intercropping wheat and mustard. They did this because
they observed that their neighbors growing wheat were able to harvest an additional small mustard crop
for home-use without impacting the wheat yield, so they began this practice as well. This was something
they had not thought about before, mostly because they were not thinking about winter crops at all.
Family A both understand the future value of their recent agricultural investment in a borewell,
electric pump, and electrical wiring to connect to the transformer, and the husband and wife have
sacrificed to be able to improve the productivity of their landholding. Before the construction of the
borewell, the husband spent the winter and summer seasons outside Bihar, working as a clerk for a
storeowner in the city of Kolkata (the capital of nearby West Bengal and formerly known as Calcutta). He
would return to Bathani to help his family with the monsoon paddy crop. This sacrifice allowed Family A
to earn enough money to pay the capital investment to build the borewell and connect electricity wires to
the new transformer. While the husband is in Kolkata, the wife and her son are responsible for most of the
agricultural labor on their land and for making decisions about which technologies to use, how, when and
what to plant. Despite the scarcity of household labor, they still manage to ensure both their children
continue their education and they want both of their children to attend post-secondary school. Because the
husband is often away, labor saving technology such as tractors are necessary so that the wife and
children can manage the two acres without him. They know that some of their decisions do not maximize
their yields. For example, they helped to transplant paddy using System of Rice Intensification (SRI)
111
methods in another family’s fields in Surka and saw the yield benefits that SRI created. They still decided
not to use SRI on their own fields for the time being, both because of their limited access to water (prior
to the borewell), and because the increased labor investment required was not possible without more
family labor available.44 They also use the most time efficient method for planting wheat seeds in the
winter (broadcast seeding) even though they know their yields would be higher if they went through a
more laborious process of line seeding their fields. Even so, the family calculates that their reduced
incomes now, will be compensated for in the future because they can now afford bigger ticket items like
the borewell and the electric motor. They hope that one day the husband will no longer need to migrate to
Kolkata. Instead they want to practice higher value agriculture on the land they own. Family A sees the
investment in the borewell, electricity connection and electric motor as the first step towards realizing this
goal. However, for the time being, the husband still plans to return to Kolkata seasonally at least until
they see if their investment decisions yield positive returns.
Family A was always one of my favorite families to visit in Bathani. Not only were they always
welcoming, but they both had novel insights and perspectives on my questions every time I saw them.
They also had an advantage that many of their peers in the Bathani lacked – they had both completed
significant education. The husband had finished the 10th grade and the wife had completed school through
to the 6th grade. Both parents as well as their 16-year-old son and 18-year-old daughter can read and write.
The parents are also certain that both their son and daughter need to stay in school. They know that in the
long run their children’s ability to move out of agriculture will improve their family’s well-being more
than any investment in agriculture they would be able to make in the short term.
The family felt that their well-being had significantly improved over the past 20 years and
attributed the causal driver of all improvements to their education. Without their education, the husband
44 Note: There is a controversy about whether SRI takes more time or simply more skill (see Chapter 3). However, the perception of Family A was that SRI requires more labor. They gave two reasons for not adopting SRI – lack of water and lack of labor.

112
would not have his job in Kolkata, and the wife would not be able to make the complex tradeoff decisions
about which new technologies to invest in and which ones to pass up, while her husband earned money in
another state.45 Whenever I asked a question about agriculture, the husband uncharacteristically for most
male heads of households in Bathani deferred to his wife’s opinion, as he readily recognized that she was
the family member who was most familiar both with the technologies and economics of their business.
When I left Bathani for the last time, Family A were still getting used to owning an electric pump
and the deepest borewell in Bathani (at 110 feet). They pay 220 rupees per month for the electricity
connection to the borewell and they estimate they only need about 1/3 of the total operating time of the
pump to water their own land (though they were not even certain of this). They say they eventually plan
on selling water to other households, but, so far, they have only given water to other members of the
Yadav caste. They feel uncomfortable charging other Yadavs for water that they are able to pump at zero
marginal cost despite the significant upfront capital investment they made in their irrigation system. They
have also not considered selling (or giving) water to families in Rajapur village despite the fact that the
location of Family A’s borewell is ideally located to provide water to Rajapur tola.
2.5.3.2: Family B Not far from Family A’s borewell, towards the Southwest corner of Rajapur tola, lives Family B.
Their family is significantly poorer in terms of overall well-being than Family A. Family B live with their
one unmarried adult daughter. Their son has moved to Patna to work in construction and rarely visits. The
husband is 75 years old and his wife is 68. They both come from the Manjhi caste which is a scheduled
caste that has traditionally been heavily discriminated against in Bihar. Neither the husband nor the wife
can read or write. They live in a one room mud hut with 4.5 foot ceilings.
45 When I asked about trends in well-being, the husband pointed to the fact that he and his son both wear jeans every day, something he said his family would not have been able to afford just 10 years ago.

113
Family B has minimal assets including one diesel pump, one cow, two chickens and three pigs, but
they are raising the pigs on a “sharecropping basis”, so they will only get one third of the profit from the
pigs, despite doing all of the labor to raise the pigs. The sharecropping situation arose because Family B
did not have the money to buy the piglets when they were born. So instead, a neighbor from a nearby
village invested the capital to buy the piglets. In exchange for his investment, this neighbor will get two
thirds of the profits (likely in the form of meat after the pigs are butchered). Taking care of the pigs takes
approximately two hours of household labor daily. Their land is barren except in monsoon because it is
far away from the river and up a slight hill and they have little to no access to irrigation. Instead, they take
the pigs to the river to forage daily. The walk to the river with the pigs takes about 15 minutes and the
pigs need to forage for at least an hour and a half. Each pig will likely sell for 2500 rupees leaving Family
B with about 830 rupees (about 12.8 USD) per pig. Given that raising the pigs takes six to nine months
and approximately two hours of household labor per day, this works out to an hourly wage of around 4
rupees (approximately 0.06 USD). Nevertheless, since Family B is raising the meat not to sell, but to
consume and with very low household income and no alternative labor options at their advanced age, they
believe that the time investment is worthwhile.
Yet on paper compared to many other farmers in Bathani, Family B is comparatively well off. In
1979 when he was 39 years old, the husband received a plot of land from the government under a land
redistribution program. The size of the plot at 2.2 acres is substantial compared to average landholdings in
Bathani and especially in Rajapur where the average landholding per household is 0.26 acres. Moreover,
Family B has the land title documents in their name, giving them a deeper sense of security than many
other households in Rajapur have. The land even came with a shallow dug well (28 feet) that was there
before they received the land from the government, but unfortunately the well has gone completely dry.
Because the well is now dry, they no longer have any use for their diesel engine.

114
Family B’s land is also uphill from most other nearby wells (with the exception of the new
borewell Family A recently constructed), making it difficult for Family B to buy water from another
farmer, even if the cost of water were not a constraint. Because of the physical scarcity of water, Family
B’s field remains empty in the winter and summer. They are able to plant most of their land in the
monsoon season with rice, but even this crop often struggles if the monsoon comes too late or not at all.
Usually however, they manage to produce enough rice during the monsoon to feed their family for four
months of the year, the other eight months of the year they buy rice and wheat from the ration shop, from
the local market or from neighbors. On average, they do not have food to eat for two meals per week, and
the scarcity is particularly acute during the monsoon while their rice crop is in the field. The only way the
family survives is through remittances their son sends home from the money he makes working in
construction in the state capital, Patna. Annually, he is able to give his family 10,000 rupees
(approximately 150 USD), which keeps the family from starvation.
The lack of water for irrigation, as well as their own declining health, prevent the family from
extracting value from their relatively large landholding. No other farmers want to take their land on a
sharecropping basis in the summer or winter seasons because of its poor access to irrigation. They have
only adopted two new technologies over the course of the past 20 years. In 2005, they purchased a used
diesel engine, but by 2014, they were forced to stop using the diesel engine and rely on the rains because
their well was too dry to make the diesel engine useful. They also started using a tractor in 2012. The
husband’s health was declining and ploughing their field with a bull was increasingly difficult. Ploughing
their land annually costs 2,970 rupees (approximately 46 USD) for which they do not see a yield increase,
only time saved, an asset they actually have plenty of if their health were better. Overall, between their
declining health and the failed well, family B feels that their family’s well-being has greatly deteriorated
over the past 10 years.

115
2.5.3.3: Family C In contrast, Family C, an OBC household from Erki tola have one acre of land and two borewells
which function 24 hours a day throughout the year. Both of Family C’s borewells use powerful diesel
engines to pump groundwater. As of the end of my fieldwork, Family C was in the process of investing in
an additional borewell that could be connected to a new transformer which was being installed on the
border of Erki. Family C was paying a cousin to install the well on their property, which happened to be
by the road near the new transformer. Family C planned to invest in an electric motor to pump
groundwater from this borewell as soon as it was finished. My fieldwork ended before the borewell was
complete and I was unable to observe the long-term outcomes of this investment.
Over the past 20 years, Family C has adopted several new technologies. They built their first
borewell and bought their first diesel pump in 2005 after the death of the husband’s father when the
husband and his brothers divided their landholdings. After 2005, Family C only had one borewell and
used it mostly to irrigate their own acre of land, though they did sell a small amount to a neighbor.
However, after 2010, when rubber pipes became widely available, Family C realized that the physical
characteristics of rubber pipes made the business of selling water more lucrative because it became easier
to sell more water more quickly to more farmers. They also knew that their land, situated in a depression,
had a very high water table that could likely sustain a second borewell. So, in 2011, they invested in an
additional borewell and diesel engine and began to focus more on the business of selling water.
By 2015, family C’s two borewells provided plentiful water. This access to water ensures that
Family C can generate significantly more value from their one acre of land than Family B can from their
2.2 acres. In addition to their own acre of land, Family C leases an additional half acre of land in the
winter and monsoon seasons. With two borewells that run for 24 hours a day, Family C has more water
than they can use on their own land. They sell surplus water to their neighbors making a net profit of
approximately 20,000 rupees annually (about $310 USD). This profit has allowed them to invest in other
116
technologies. In 2012, they began investing in the most expensive paddy seed variety available – hybrid
seeds – which had recently become available. They found that with hybrid paddy their yields more than
doubled. With increased water availability, they also began growing vegetables in the summer season
(increasing their cropping intensity to three crops per year). Finally, because they had the cash flow, they
started using a tractor to plough their field in 2012 to save time and backbreaking labor.
In the final days of my fieldwork, Family C was investing in a third borewell (discussed above) on
a far corner of Erki which they will be able to connect to the new three-phase transformer. They also hope
to be able to extend wiring from the transformer in Bathani to their existing two borewells, but they are
uncertain if the distance (approximately 550 meters) is too great and wanted to get more experience with
the first electric pump before they did this. They also hope that in the meantime another transformer will
eventually be installed by the government somewhere on the main road through Erki.
Despite the fact that Family C’s costs will drop significantly when they begin to use electric
motors for pumping groundwater, they have no plans to decrease the price they charge for water and are
looking forward to the increased profit margins. Family C recognizes that if additional farmers invest in
electric motors and begin to sell water, the market price for water will decrease. However, for the time
being, they feel that most of their neighbors do not have the capital to invest in electric motors, wiring and
even new wells required to make use of the transformers. They plan to use this to their advantage to reap
large profit margins from selling water and reinvest the money elsewhere.
Family C is even contemplating buying more land in Erki if other farmers are willing to sell.
They think that with the introduction of three-phase electricity, the potential value they can get out of the
land in Erki is high, if only they had more land to cultivate. With two daughters and four sons, they have
plenty of household labor and they hope to buy more land to improve the well-being of their family.
Family C knows that many of the households in Erki are more focused on other forms of wage labor and
practice agriculture as a secondary income and food security strategy. However, they also know that

117
Bihari people rarely sell their land unless they are forced to, so in the meantime they are hoping to take
more land from their neighbors on lease.
2.5.3.4: Cross-Family Synthesis The differential access that each of these three families has to water in Bathani is not accidental.
Rather, it is rooted in historical contingencies which were strongly influenced by the opportunities
available to their respective castes in colonial and post-colonial Bihar, as well as by local inheritance
practices.
Family A’s land has been in their family for several generations, at least since the 1920s. The
paternal grandfather of Family A had just over six acres of land which was distributed between three sons.
In the case of Family A, the father was the youngest of the three sons and because of this, while he
inherited an equal share of land, he was allocated the lowest quality land after his elder brothers chose
higher quality plots closer to the river. Indeed, Family A’s land is up a hill from the main part of Surka
tola and far from the river. It was not until the introduction of three-phase electricity that Family A saw
the potential for real profit margins from their land.
Family C’s paternal grandfather purchased their land shortly after the end of British colonialism.
The land had once belonged to a zamidar. After the colonial government left, Family C’s ancestors along
with other Yadav families put social and political pressure on the new government and the landowner to
sell off his land to local peasants. While no official government intervention took place, the zamindar was
eventually induced to sell his through a combination of local popular pressure and fear of future land
reforms. The four acres Family C’s paternal ancestors bought from the zamindar were slowly subdivided
as sons inherited portions of their father’s lands. Each son continued to cultivate land with significant
water resources and Family C ultimately invested in not one but two borewells so that they could earn
more money selling water.

118
In contrast, in the 1950s Family B’s caste was socially and economically marginalized and had no
connections that could help their family buy land. Family B only received land in 1985 under a program
to redistribute government wasteland to SC/ST farmers. Not only does Family B’s land lack access to
water, it is also positioned on a hill which retains very little residual moisture after the monsoon season.
The topography of Family B’s land makes it impossible for them to grow anything in the winter or
summer seasons.
Each of the three families discussed in this brief ethnography have different historical experiences
of access to both land and water – experiences that were shaped by their social caste, colonial and post-
colonial histories, and the interaction of these institutional factors with the physical factors of geography
and climate. These historical experiences created and still create distinct sets of opportunities and
constraints for the ways in which they can benefit from agricultural technologies with implications for
their overall well-being.
When asked to rate changes in their family’s well-being over the past 10 years, Family A said their
lives had improved, Family B said their well-being had deteriorated, and Family C said their well-being
had remained the same. The experience of these three families are representative of the broader trends in
the three tolas in which they live. In Surka, 40% of households felt their well-being had improved over
the past 10 years (see Table 2.9).
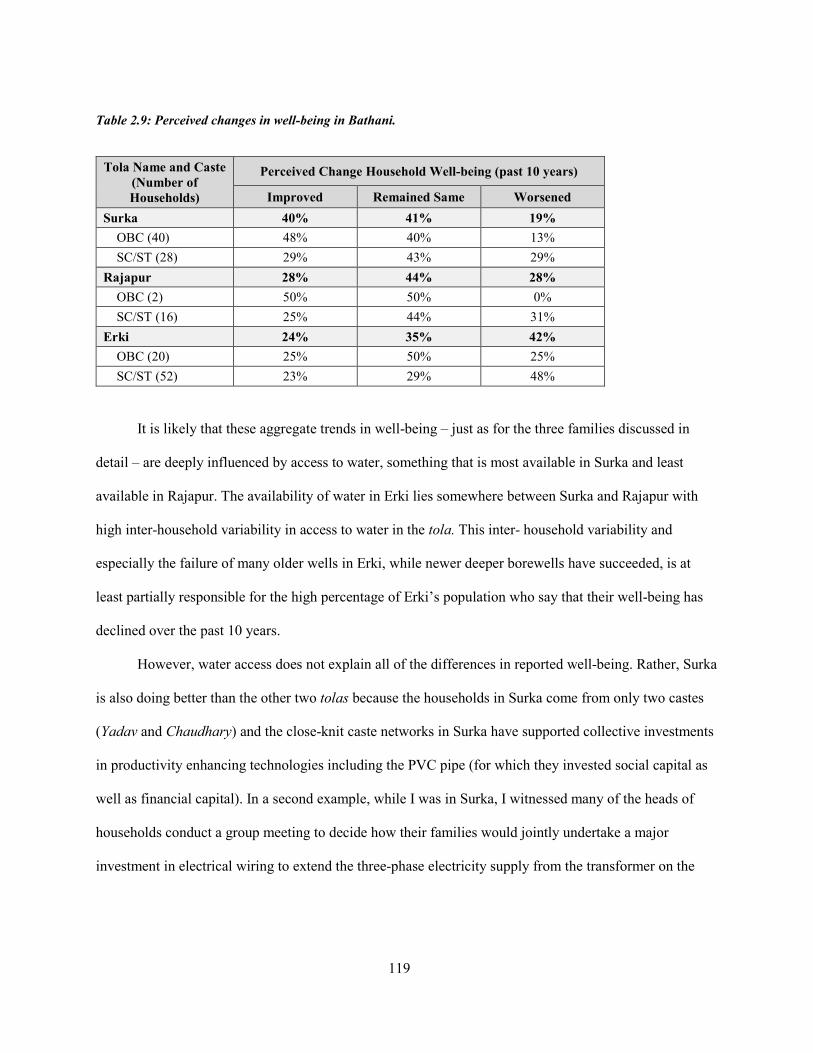
119
Table 2.9: Perceived changes in well-being in Bathani.
Tola Name and Caste (Number of Households)
Perceived Change Household Well-being (past 10 years)
Improved Remained Same Worsened Surka 40% 41% 19% OBC (40) 48% 40% 13% SC/ST (28) 29% 43% 29% Rajapur 28% 44% 28% OBC (2) 50% 50% 0% SC/ST (16) 25% 44% 31% Erki 24% 35% 42% OBC (20) 25% 50% 25% SC/ST (52) 23% 29% 48%
It is likely that these aggregate trends in well-being – just as for the three families discussed in
detail – are deeply influenced by access to water, something that is most available in Surka and least
available in Rajapur. The availability of water in Erki lies somewhere between Surka and Rajapur with
high inter-household variability in access to water in the tola. This inter- household variability and
especially the failure of many older wells in Erki, while newer deeper borewells have succeeded, is at
least partially responsible for the high percentage of Erki’s population who say that their well-being has
declined over the past 10 years.
However, water access does not explain all of the differences in reported well-being. Rather, Surka
is also doing better than the other two tolas because the households in Surka come from only two castes
(Yadav and Chaudhary) and the close-knit caste networks in Surka have supported collective investments
in productivity enhancing technologies including the PVC pipe (for which they invested social capital as
well as financial capital). In a second example, while I was in Surka, I witnessed many of the heads of
households conduct a group meeting to decide how their families would jointly undertake a major
investment in electrical wiring to extend the three-phase electricity supply from the transformer on the

120
main road into the heart of Surka’s agricultural land. It was hard to imagine a similar collective meeting
taking place in Erki, let alone Rajapur.
The contrast between the well-being of families A, B and C is also instructive because it
demonstrates the complexities of assessing poverty and wealth from either landholding or caste
perspective. Without the benefit of ethnography, Family B would appear to be twice as wealthy as Family
C, and about equally wealthy to A if wealth is measured in terms of landholdings. In contrast, Family C
comes from a traditionally “higher” caste than Family B, so if caste as a metric is used, a researcher might
surmise that Family C is likely to be wealthier than Family B and equally wealthy to Family A. In reality,
the proximate driver of the differences in the well-being of these three families is access to water. For
example, despite the fact that Family C owns only one acre, significantly less than Family B, they are able
to reap much more income from their land and invest in additional technology. The difference is driven
not by the size of their respective landholdings, but rather by the quality of their landholdings with respect
to water access. At the same time, Family A’s landholding is larger than Family C’s, but their water
access (at least until recently) was not as good as Family C’s. The introduction of three-phase electricity
may change the calculus between the relative agricultural incomes of Family A and Family C, giving the
family with the larger landholding advantages over the family with higher water tables, but this remains
to be seen.
At the same time, this exploration also indicates that in many ways caste may be a better single
metric for overall socioeconomic well-being than landholding. This is because caste is a strong
determining factor not only in quantity of land ownership but also in quality. This qualitative assessment
is supported by econometric analysis of the impact of caste on income inequality in India, which found
that at least one-third of the average income/probability differences between UC/OBC and SC/ST
households is due to “unequal treatment” or discrimination against SC/ST castes rather than specific
attribute of their household income generating profile (Borooah, 2005). For this reason, in Section 2.6
121
while I use both caste and landholding as measures of socioeconomic inequality, I tend in the qualitative
discussions to focus more on caste than landholding.
2.6 Analysis: Understanding Variance in Benefits of Technology to Farmers
In this section I study six technology case studies in order to understand the causal mechanisms
that prevent the poorest farmers from benefiting from agricultural technology in Bihar. I analyze each
case study using the sociotechnical approach discussed in the theory section. Section six is organized as
follows:
• First, I identify 11 technologies potentially available to farmers in the region on the basis
of the 12-village survey. These 11 technologies are not the entire set of technologies in use
in Bihar, but rather the set of technologies that farmers identified as having adopted since
1990.46
• I then analyze the factors by which the poorest farmers are less likely to use each of these
technologies compared to wealthier farmers in the data set.
• Finally, I purposely select six technologies from the list of 11 for case studies. I then
analyze these cases using the sociotechnical approach and sociotechnical causal
mechanisms (STCMs) discussed in Section 2.2.
Respondents in the 12-village survey identified 10 technologies which they had started using since
1990. These technologies included diesel engines, tractors, improved seed varieties, large diameter rubber
pipes, vermi-compost, electric motor pumps, intercropping, new crops, the System of Rice Intensification
and drip irrigation. To this list, I added an 11th technology that was not identified in the 12-village survey
46 This for example excludes the traditional bullock and plough. Bihar’s farmers have been using this technology for far longer than two decades.

122
– solar irrigation pumps. I added this technology because while no farmer sampled in the 12-village
survey had adopted the technology, the technology is available in Bihar through a generous subsidy
program and has been identified by both international actors and the Indian central government as a “pro-
poor” technology. I added this technology to the list because I wanted to study a case of ‘missing’ “pro-
poor” technologies.
For each of these 11 technologies, I measured use rates for households across caste and
landholding categories (the two proxies I use for well-being). Use rates were calculated based on
households who said they currently use a technology, have used it for at least a year, and plan to use it in
the future.47 Based on the use rates, I calculated the factors by which the poorest farmers are less (or
more) likely to use a specific technology compared to wealthier farmers in the dataset. Table 2.10 shows
the factors by which the poorest farmers are less likely to use each of the 11 technologies (see Appendix 2
for the underlying data used to create this table).48
47 Recall that, using the revealed preference methodology discussed in Section 2.3, I measure benefits in terms of use. Under this approach, a farmers’ continued use of a technology is a “revealed preference” indicating that they derive benefits greater than zero from the technology. 48 The survey excluded households who practice agriculture only as laborers for a daily wage (often paid in rice and wheat). Rather, the survey focused on farmers who either own their own land or produce crops on land they lease or sharecrop. While landless households who earn income through daily wage labor are often the poorest of the poor, decisions about technology use are not their own, nor in general do they capture the benefits that accrue from the use of technology.

123
Table 2.10: Factor by which poorest farmers are less likely to use a technology than wealthier farmers. This table is based on data from the 12-village survey.
Number of Farmers in Category Æ
Caste Category Upper Caste (OBC and UC) - 248;
Lower Caste (SC/ST) - 250
Landholding Size* Marginal (<2.5 acres) - 283;
Non-Marginal (>2.5 acres) – 55
Technology
Factor by which a lower caste farmer is less likely to use a
technology compared to an upper caste farmer
Factor by which a marginal farmer is less likely to use a technology than
a non-marginal farmer
Diesel engine 1.01 1.16 Tractor 0.98 0.95 Improved seeds 0.93 0.92 Rubber pipes 0.89 0.93
Vermi-compost 0.69 0.31 Electrical motor pump 0.63^ 1.23^ Intercropping 0.58 0.67 Introduced new crop 0.52 0.93 System of Rice Intensification 0.34 0.34
Drip Irrigation NA NA Solar Irrigation Pumps NA NA NA: The study also includes technologies that are available in Bihar, but are not in widespread use. These include drip irrigation and solar irrigation pumps. Both drip irrigation and solar irrigation pumps are in limited use in Bihar, but there was insufficient data captured by the survey to calculate these factors. The 12-village survey captured only one UC farmer using drip irrigation; the 12-village survey captured no farmers using solar irrigation pumps. The reason that these ‘missing’ technologies or technologies in limited use are included is precisely to understand the barriers to widespread use of these technologies and especially the barriers to use by the poorest farmers.
* In India, standard classifications run from marginal to large. In Bihar, the majority of farmers fall in the marginal category of <0 to 2.5 acres. Small farmers have 2.5 to 5 acres. Semi-medium farmers have 5 to 10 acres. Medium farmers have 10-25 acres. Large farmers have 25 acres or more. Here I compare likelihood of adoption between marginal farmers (n=283) and all other landholding categories (n= 55).
^There is an interesting discrepancy in the factors by which the poorest farmers are likely to use electric motor pumps between the likelihood measures by caste and by landholding size. This is driven by two factors. First, total adoption of electric motor pumps in Bihar is still very low. There are a total of 21 electric motor pump users out of 412 household in the 12-village survey. The other reason that the likelihood factor is so different between caste-based and landholding-based metrics is that farmers from OBC who fall into the higher-end of the marginal landholding category owning approximately 2-2.5 acres are often the first to adopt electric pumps because they need these pumps to earn sufficient profits from their small landholding to provide for their family. This is the case for example with Family A in Bathani. Family A (also from an OBC caste) made the rational calculation that with diesel engines, the income from 2 acres was not sufficient for their four-member family. In contrast, by investing in a borewell and electric motor pump, family A would be able to earn sufficient income from their 2 acres that the husband would no longer have to travel seasonally to Kolkata for wage-labor.

124
What is immediately clear from Table 2.10 is that the poorest farmers are less likely to use almost
all of the 11 technologies than their wealthier peers. However, the factor by which a poor farmer is less
likely to use a technology than a wealthier farmer differs significantly across technologies. The poorest
farmers are equally likely if not slightly more likely to use diesel engines. In contrast, the likelihood that
an SC/ST farmer will use the System of Rice Intensification is only 0.34 compared to OBC and UC
farmers.
Returning to the two-by-two matrix of technology types discussed in Chapter 1 and again in
Section 2.3, the fact that the likelihood factor for almost all technologies falls below 1 and none fall
significantly above 1, means that in the context of Bihar, there are no technologies that are specifically
“pro-poor”. In other words, no technology benefits the poorest farmers more than other socioeconomic
groups. Rather, some technologies in this data set do a better job of benefiting both wealthier and poorer
farmers (technologies that “raise all boats”), while other technologies benefit the wealthiest farmers to a
far greater extent than the poorest farmers (“technologies for the rich”). Diesel engines – as discussed in
section 2.5.2 – are quickly becoming “bad idea” technologies, but farmers are only able to stop using
these technologies if they have access to electricity to run electric motor pumps.
I selected the six case studies using purposive selection methodology common in qualitative
research and focused on diverse cases (Seawright and Gerring, 2008).49 I chose to focus on diverse cases,
in order to understand the range of barriers preventing the poorest farmers from realizing greater benefits
from technology.
49 Seawright et al. (2008) review a number of case selection methods for qualitative research. In qualitative research, they argue, cases can be selected purposively. Selection methods include typical, diverse, extreme, deviant, influential, most similar, and most different. For this study, I used a diverse case study selection method which is useful for two or more cases that exemplify diverse values for pre-selected criteria. Seawright et al. argue that “diverse cases are likely to be representative in the minimal sense of representing the full variation of the population” (p. 297).

125
Drawing from the 11 technologies identified by farmers in the 12-village survey, I selected six
case studies for diverse values along two dimensions:
1. Variation in benefits from each technology across socioeconomic groups. Using the results
presented in Table 2.10, I selected case studies for variance in the factor by which the poorest
farmers are less likely to adopt a given technology compared to wealthier farmers.
2. Variation in benefits users realize from each technology. This measurement excludes assessment
of farmers who do not use a technology and captures only the actual benefits realized by users.50
50 As discussed in Section 2.3, the revealed preference approach to benefits does not quantify the extent of benefits a technology provides, it only signifies that the benefits are positive. Whether or not the poorest farmers benefit from technologies that offer large, average or small benefits is also an interesting dimension of variance.

126
Figure 2.9: Benefits of technology realized across socioeconomic groups.
Three by three matrix compares benefits to technology users (columns) and variance in benefits across socioeconomic groups (rows). The technologies in bold are the technologies I selected for the case study. I selected a case study from each cell except diesel engines because electric motor pumps and diesel engines are so closely interlinked, that I cover the interesting sociotechnical dynamics of diesel engines in the electric motor pump case study. I also selected drip irrigation as a case of a “missing technology” that is very beneficial to users, but almost solely adopted by wealthier farmers in Bihar. The figure is color coded where the red cell shows a technology that is both not accessible to the poorest, nor are users realizing benefits from it. The empty blue cell, would be a technology that is both “pro-poor” and delivers high benefits to users. Such a technology does not appear to exist in Bihar. It is an empirical question as to whether such a technology exists in other places or in other sectors.
I categorized technologies into a three-by-three matrix (see Figure 2.9). The y-axis captures
variance in benefits across socioeconomic groups. The x-axis captures the benefits that technology users
realize from the technology. 51 For example, a relatively small number of farmers in Bihar have adopted
51 Data on relative benefits is based on several sources of data including a survey item asking farmers to list their most important technology investments, a survey item asking farmers what technology they would invest in if they had a certain amount of capital and my own qualitative assessment based on extensive discussions with technology users (for example, users of MIS generally report high satisfaction due to increased yields, higher quality yields and less labor) but most farmers are unaware of the benefits of MIS, so few farmers stated that they would invest in MIS if they were given the capital. Evaluating the different sources of data, I ranked benefits to farmers that actually use a technology without taking into account whether the technology

127
drip irrigation (MIS) or solar irrigation pumps (SIP), however, the farmers who have adopted MIS
reported significant benefits from the technology during field visits. In contrast, SIPs are only available to
wealthier farmers, and the benefits to adopters are also small.
I selected one case study from each of the populated cells in the three-by-three matrix. Where
more than one technology fits within an individual cell, I selected the case study pragmatically based on
which technology offered particularly nuanced and varied insights. The six case studies included solar
irrigation pumps (SIP), the system of rice intensification (SRI), drip irrigation (MIS), electric motor
pumps (EMP), rubber water delivery pipes (RWP), and improved seed varieties (ISV) (see Figure 2.10 for
photographs of each of the technologies selected for case studies).
I ordered the six case studies from bottom left to top right in the three-by-three matrix. This means
that the first case study I analyzed, solar irrigation pumps, was the worst performing of the six case
studies in that it had the lowest benefits to technology users, as well as the least benefits realized by the
poorest farmers out of the six case studies. The last case study I analyzed, improved seed varieties, was
the best performing technology in that it had the highest benefits to users, as well as the greatest benefits
realized by the poorest farmers of the six case studies. (The only logic to this ordering of case studies was
an effort to start with the bad news and end with the good).
would be appropriate for non-users. I did this in order to have a qualitative assessment of the extent to which users were benefiting from the technologies they had access to for the x-axis.

128
Solar Powered Irrigation Pumps System of Rice Intensification
Drip Irrigation Electric Motor Pumps
Rubber Pipes Improved Seed Varieties
Figure 2.10: Photos of each of the six technology case studies. (Photo Credits: Author)
129
Because two of the technologies selected (solar irrigation pumps and drip irrigation) are not in
widespread use, in addition to asking about these technologies in the 12-village survey and in Bathani, I
also obtained lists of subsidy recipients from the government. I then visited a random sample of farmers
from each list to learn more about the farmers’ experience with these two technologies. The reason that I
included these two technologies in the study is that they are technologies that are ‘potentially available’ to
farmers in Bihar but are not in widespread use. Moreover, both of these technologies are heavily
subsidized by the state and central governments and are thus of interest due to the amount of financial and
institutional support behind these technologies in the innovation system. Finally, while the results of my
analysis demonstrated that wealthier farmers accrued greater benefits from drip irrigation and solar
irrigation pumps, at least in the case of solar irrigation pumps there is a strong case to be made that the
physical dimensions of the technology itself has the potential to benefit the poorest farmers. By looking at
the case of solar irrigation pumps, I can analyze why a technology with potential to be “pro-poor”, is
performing like a “bad idea technology”.
The first case study, solar irrigation pumps (SIP), has low benefits to technology users, with the
majority of any benefits accruing exclusively to the richest farmers. As I discuss in more detail in the case
study, the poor performance of the technology on both criteria is not intrinsic to the physical dimensions
of the technology. Rather, a sociotechnical analysis will demonstrate that the interplay between physical
and institutional dimensions of SIP resulted in these outcomes in Bihar.
The second case study on the system of rice intensification (SRI) has moderate benefits to users.
The case is surprising because SRI is a technology that has been widely promoted as “pro-poor”, but the
factor by which the poorest farmers are less likely to adopt SRI, is the biggest (measured both by caste
and landholding) out of all 11 technologies analyzed in Table 2.10. In other words, in Bihar, the poorest
farmers are the least likely to use SRI compared to their wealthier peers, compared to any of the other
technologies studied.

130
The third case study on drip irrigation (otherwise known as micro irrigation systems or MIS) has
been adopted by very few farmers across Bihar. Adopters tend to be some of the wealthiest farmers in
Bihar. For the farmers who do use MIS, reported benefits of the technology are very high as the
technology both raises yields and decreases labor costs.
The fourth case study on electric motor pumps (EMP) is difficult to categorize because adoption
rates are still low due to the scarcity of three-phase electric power lines in Bihar. What is clear is that
benefits to these adopters are very high. What is harder to determine is how the benefits of the technology
will be distributed across socioeconomic groups as the technology becomes more widely adopted (a
process which is currently underway with the continued expansion of the three-phase power grid). For
this reason, the variance in benefits of EMP will be discussed using both available data today, as well as
potential pathways given research on the impact of institutional variation in the experience in other states
in India. Despite the challenges of pinning down EMPs on the criteria of interest, I felt that including
them in the discussion was important as they are likely to play an increasingly large role in Bihar’s
agricultural landscape and under the right circumstances will have the potential to significantly benefit
Bihar’s poorest farmers. Moreover, the case of EMPs is in many ways also a case of diesel engines (a
technology with low benefits to adopters but where the benefits of the technology are evenly distributed
across socioeconomic groups) as EMPs cannot be understood without reference to diesel engines.
The fifth case study is on large diameter rubber pipes, which are known locally in Bihar as rubber-
walla pipes (RWP). Adoption of the RWP is widespread and benefits of adoption are distributed
relatively evenly across socioeconomic groups. This technology is not one that the agricultural technology
research community tends to focus on. Yet, the increased adoption and widespread use of the technology
in Bihar in the early 2000s, brought specific benefits to the poorest farmers by improving the functioning
of water markets, decreasing friction between farmers in the water transportation process, and reducing
labor requirements.

131
Finally, the sixth case study on improved seeds varieties (ISV) has high average benefits to
adopters and benefits are distributed relatively evenly across socioeconomic groups. The performance of
ISV on the two criteria of interest is perhaps not surprising – the agricultural research and development
community has long praised the performance of improved seed varieties as a “scale neutral” technology
with the potential to equally benefit small and larger farmers (W. Ruttan, 1977; Feder et al., 1985). What
is unique about this case is that unlike in western India (the heart of the Green Revolution) where high
yielding rice and wheat varieties were widely adopted by farmers in the 1970s, most farmers in Bihar
began using improved seed varieties only relatively recently. This case explores the reasons this
technology achieved scale so much later in Bihar than in other states in India (Section 2.6.1 through
2.6.6). Each of the case studies is organized as follows:
1. Description of technology, situating it in the context of India and Bihar.
2. Overview of findings from the 12-village survey paired with a thick description of the
sociotechnical drivers underpinning variance in benefits across socioeconomic groups. The thick
description relies on fieldwork in Bathani village as well interviews with other stakeholders
outlined in Section 2.5. Where possible, I do my best to highlight examples from Families A, B
and C discussed in the ethnography in Section 2.5.3 in order to provide tangible examples of
general findings.
3. Analysis of the role of each of the STCMs identified in the theory section (2.2.2) in preventing
the poorest farmers from realizing benefits from the technology. I group the STCMS for each
technology into three categories: a) High means that the SCTM is a large barrier limiting the
poorest farmers from realizing benefits from the technology; b) Medium means that the STCM
plays a moderate role in preventing the poorest farmers from benefiting from the technology; and
c) Low means that the STCM plays little to no role in preventing the poorest farmers from

132
benefiting from the technology means that the STCM plays little to no role in preventing the
poorest farmers from benefiting from the technology.
Before delving into the six case studies, it is worth reviewing a few important concepts developed
up until this point in the chapter. The sociotechnical causal mechanisms (STCMS) discussed in Section
2.2.2, were adapted from several literatures as explanations for low agricultural yields or incomes of
farmers. It may be helpful to refer to the table summarizing each of the 11 STCMs, their definitions and
supporting literature in Section 2.2.2 before reading the six case studies. In each of the case studies, I
evaluate the extent to which each STCM is a barrier preventing the poorest farmers from benefiting from
the technology in the context of Bihar. Readers can also find a matrix summarizing the findings from the
STCM analysis across the six case studies at the beginning of Section 2.7. It may be helpful to refer to
this matrix as readers go through the case studies. Finally, as a lot of my data is presented in terms of
caste based socioeconomic categories, it’s worth reminding readers that UC castes (also known as upper
castes or general castes) are the most economically and socially well off castes in Bihar. OBC castes (or
other backward castes) fall below UC castes in their socioeconomic status, but come above ST/ST castes
(or scheduled castes and scheduled tribes), the two groups that are the most marginalized in the Indian
caste system. Using caste as a proxy for wealth (and well-being), I assume that in general UC castes have
greater wealth than OBC castes who have greater wealth than SC/ST castes. While this is certainly an
assumption on the individual level, in Bihar where caste based identities are deeply entrenched, in
general, caste and wealth are correlated (see for example the discussion of the demographics of Bathani in
section 2.5.2).

133
2.6.1 Solar Irrigation Pumps (SIPs)
A solar irrigation pump (SIP) is a technology for lifting water for the purposes of irrigation.
While SIPs usually lift groundwater, they can also be used to lift water from ponds, canals, rivers and
other water bodies. In Bihar, SIPs are thought of by many actors as a promising technology because they
allow farmers to pump groundwater without diesel engines in areas that are not connected to the electric
grid. Several studies have demonstrated that in spite of the high upfront capital costs, the lifecycle costs of
using solar for pumping groundwater are lower than diesel based pumping systems (Odeh, Yohanis and
Norton, 2006; Kelley et al., 2010). SIPs also reduce greenhouse gas emissions, black carbon and short-
lived climate pollutants such as NOx, which are all emitted by diesel engines. The dual benefits of
reducing costs for farmers and reducing emissions of greenhouse gases and other pollutants have made
SIPs a technology of interest within the international development community, as well as to Indian policy
makers (Burney et al., 2010; World Bank, 2013; Kishore, Shah and Tewari, 2014; Maithani and Gupta,
2015). SIPs are particularly attractive to international donors, who see the technology as a chance to
leapfrog agricultural systems in India over fossil fuel intensive production systems (found in the United
States and other parts of the developed world) to renewable agricultural arrangements (Bengtsson and
Nilsson, 2015).
From the perspective of farmers, SIPs require a high upfront capital investment. While prices are
declining due to the decreasing cost of solar panels, a good estimate for the price of a 2hp system (the
most common system in Bihar) is 2,500-3,500 USD (though private companies have set significantly
higher prices particularly through government procurement processes). Even at a cost of around 3,000
USD, the price is far more than most Bihari farmers can afford. Yet, a 2hp system can pay for itself in less
than five years provided water from the system is used at close to maximum capacity.52 This payback
52 In Pakistan, where farmers are investing in larger pump sets, with payback periods of a single year, I found payback periods of less than a year. Maithani and Gupta (2015) calculate for India in general that the internal rate of return (IRR) on SIPs under

134
period assumes that the alternative option to SIP for pumping groundwater is a diesel engine with a high
marginal cost. If SIP units are instead installed in fields that are also served by agricultural electricity
connections (or will soon be served by these connections), with cheap flat-rate monthly tariffs, SIPs will
have a much longer payback period. In summary, for famers who can afford the upfront capital cost of the
SIP unit and who do not have access to the electric grid, SIPs have the potential to mitigate the high
marginal cost of diesel.
The multiple benefits of SIPs spurred many states across India to establish a subsidy program to
promote the technology and help farmers overcome the high upfront costs of the systems (e.g. Kishore,
Shah and Tewari, 2014; Durga et al., 2016). As of the 2015-2016 fiscal year, there were approximately
13,000 SIPs installed in India, but government officials envision an ambitious target – 1 million SIPs by
2021 most of which will be heavily subsidized by the central and state governments.
At the time of fieldwork for this project there were multiple efforts to catalyze SIP technology in
Bihar including:
• A government run pilot program in Nalanda district, which started in 2012 with 34
cooperatively managed 7.5hp SIP units;
• A subsidy scheme across all districts of Bihar, which was implemented by the Bihar
Rural Energy Development Agency (BREDA) that subsidized the SIP system at 90% of
cost for a 2hp system;
• Multiple NGO pilot projects including projects by Green Peace and GIZ (a German
development agency similar to USAID in the US);
current economics is 10% for replacement of diesel pumps with solar pumps. They also say that if solar pumps lead to yield benefits that the IRR would likely be higher. However, upfront costs of an SIP is about 10 times the cost of conventional diesel pumps. The large upfront cost of SIPs is the argument the government has used to subsidize the technology.
135
• A second subsidy scheme in the planning phases run by the National Bank for
Agriculture and Rural Development (NABARD) which was scheduled to be rolled out
across India in 2015-2016 and subsidize 40% of the cost of the SIP unit, with 40%
covered by a bank loan and 20% paid for up front by recipients.
The biggest SIP program at the time of the fieldwork for this project was the BREDA subsidy
scheme which was called the Bihar Surya Sinchai Kranti Yojna (Bihar Solar Irrigation Revolution
Scheme). BREDA deployed 1,560 SIPs across Bihar between 2013 and 2016. Under the BREDA
subsidy scheme, due to the high subsidy and fiscal burden on the government, the overall number of
subsidized units available per district was capped. This created high demand for the subsidy program as it
was both highly lucrative for those who received it (90% of cost) and also scarce. In contrast, NABARD
subsidy scheme was designed to overcome the capacity constraint and allow as many applicants as
qualified to apply for the system. The NABARD scheme would also allow applicants to choose a higher
capacity system between 2 and 10hp instead of being limited to the 2hp systems under the BREDA
scheme. At the time of the fieldwork for this project, only the BREDA program had been implemented in
the field. Therefore, the fieldwork focused on institutional dimensions of the BREDA scheme, although I
also met with officials and bankers involved in the NABARD scheme, as well as the other actors in Bihar
involved in SIP innovation systems.
2.6.1.1: Sociotechnical Analysis of SIPs in Bihar In the 12-village survey, no household had adopted SIPs.53 Despite the absence of this technology
from the data set, it is an interesting case to discuss because of the level of government support behind the
53 Despite the lack of SIP adopters in the data set, SIPs were not entirely missing from the survey. In the open-ended responses on technology needs, three farmers in the same village mentioned wanting an SIP unit after they had seen one in a neighboring
136
technology, both from the Government of Bihar and the central government in New Delhi, as well as
general interest from NGOs and international donors. Due to the absence of data on SIP adoption from the
12-village survey, I conducted an additional set of seven field visits and farmer focus groups with a
randomly selected set of households from a list of 42 BREDA subsidy recipients in Nalanda district (see
Table 2.11).54 Much of the data for this case study comes from these interviews. Additionally, I visited
three 7.5 hp community managed SIP units in Nalanda district and interviewed the farmer groups who use
them, and three NGO-led projects (two in Gaya district and one in Vaishali district). I also interviewed
private sector actors and government actors who promote SIPs in Bihar and across India and South Asia
(ICIMOD, 2015).55
Overall, the results of my fieldwork showed that SIPs are the worst performing technology of the
six case studies, both in terms of access to the technology by the poorest farmers and in terms of benefits
to current adopters. However, the poor performance of the SIP systems in Bihar on the two criteria of
interest is not intrinsic to the general inappropriateness of the technology in the context of Bihar. Rather,
both the formal rules and the informal norms of the BREDA subsidy scheme limit the benefits the poorest
farmers realize from SIPs. At the same time as the subsidy program excludes the poorest farmers, it also
puts the highly-subsidized SIP units in the hands of farmers who will get the least benefit from them
(namely those who have or are likely to soon have access to cheap flat rate electricity). There are clear
implications from this case study for how the institutions structuring SIP access in Bihar, can be changed
village. They were impressed with the technology, and felt that it could help them overcome the high cost of water which limited their agricultural productivity and cropping intensity. 54 Nalanda district is in south Bihar and is the district directly bordering Bihar to the northeast. Nalanda district is the home district of the Chief Minister Nitish Kumar and has relatively high grid penetration. This probably affected my findings. 55 I have also visited SIP projects in multiple other states in India and in Nepal. I have also worked with a private sector company, JAIN Irrigation Systems Ltd. and PRAN, on a joint project to develop a community model to support SIPs in Bihar.

137
to overcome the sociotechnical barriers limiting the benefits the poorest farmers realize from this
technology.

138
Table 2.11: SIP field survey conducted in Nalanda district in November 2015 and December 2016.
Ca-ste
Land hold-ing
(Ac)
Subs-idy
(Y/N)
Electr-icity
(Y/N)
SIP in
Use? (Y/N)
Description of Benefits from SIP to Farmer
Approximate Payback Period
Farmer Invest-ment
Full System
Cost
UC 10 Yes No No
The SIP was used for one year before it was abandoned because the well where it was built failed. No attempt was made to fix well or move the unit to a new location. The farmer now uses diesel pump for irrigation.
Never Never
UC 16 Yes Yes (22
hr/day) No
The SIP unit is not in use and stands next to a working borewell that is connected to the electric grid. After the farmer received the SIP unit, he was dissatisfied with the quantity of water pumped and limited hours. As he already had a flat rate electricity connection, he discontinued use of the SIP unit. He does not intend to sell the SIP unit to another farmer.
Never Never
UC NA Yes Yes (22
hr/day) Yes
The owner of the SIP unit is a local elected official. He does not use the unit on his fields but has gifted it to his constituents to use for free. While there is an electricity nearby, the command area where the unit is installed is small and the SIP provides sufficient water for one ha. With the SIP unit, the community no longer has to pay the monthly flat rate fee for an electricity connection. But given the availability of electricity next to the field, any calculation of payback period must be done using the cost of electricity rather than diesel.
135 years
For practical purposes
never
OBC 6 Yes No Yes
This SIP unit has brought significant benefits to the farmer and will have a payback period for the farmer of three to four years. Before he used diesel to irrigate in winter (wheat) and when needed in monsoon (rice). The SIP system allowed him to grow three crops per year: rice in the monsoon and vegetables in the winter and summer. The farmer pointed out that the irrigation schedule of vegetables matches well with the output of the SIP.
3-4 years 30-40 years

139
Table 2.11 (Continued)
Ca-ste
Land hold-ing
(Ac)
Subs-idy
(Y/N)
Electr-icity
(Y/N)
SIP in
Use? (Y/N)
Description of Benefits from SIP to Farmer
Approximate Payback Period
Farmer Invest-ment
Full System
Cost
OBC 5 Yes
Yes (10
hr/day) domes-tic use only
Yes
The farmer saw the SIP subsidy program advertised in the newspaper and indicated that he paid some bribe to be put on the list of subsidy recipients. While the system had only been installed a few months at time of field visit, the farmer calculated that the payback period for his portion of the cost would be about six years. If the electricity connection in the village is upgraded to three-phase however he would switch to an electric pump.
6 years 60+ years
UC 7.4 Yes Yes
(18hr/ day)
Yes and No
This farmer received two subsidized SIP units (one in his own name and one in his father's name). He is using one and has stored the other in a barn. He has purchased a CCTV camera to guard the SIP unit and other equipment on his farm. He is also a dealer of multiple agri-input companies and uses both drip and sprinkler irrigation on his crops. He has an agriculture electricity connection, so it is unclear why he is using SIP as well.
Unit 1: 135 years Unit 2: Not known
Unit 1: For practical purposes never Unit 2: Not known
OBC 16 Yes
Yes (10
hr/day) domes-tic use only
Yes
This farmer said he had paid a bribe to be put on a list for the SIP unit. At time of field visit, this farmer had only recently received the SIP unit, so calculating payback periods was difficult. A rough estimate based on the farmers intended use of the SIP unit is six years.
6 years 60+ years

140
Out of the seven households I interviewed, four were UC and three OBC castes. No farmer came
from a SC/ST caste. All of the farmers had landholdings between 5 and 16 acres, putting them in the
semi-medium and medium landholding categories (this puts them in the top 5% of landholdings in
Bihar).56 One UC household with 7.4 acres of land actually was the recipient of not one, but two SIP units
through the BREDA scheme. The household applied for and was awarded the two units in the name of
two adult male members of the household. They were able to do this because their fragmented
landholdings were titled under different names and while the local agricultural officers knew that the two
men operated one farm, it was easy to disguise this fact in the official subsidy application paperwork.
A great deal of the variance in who benefits from SIPs in Bihar can be explained by the incentive
structures created by the institutional design of the BREDA subsidy scheme. In order to receive a
BREDA subsidy, farmers are required to apply through their local agriculture officers which are
coordinated at the district level. To qualify for the subsidy, they must have more than one acre of land
(including official land title documentation), a functional borewell on which the SIP unit will be installed
and need to contribute 10% of the total cost of the SIP system (around $450 USD). In order to target the
BREDA subsidy at small and marginal farmers, the official terms of the subsidy policy state that eligible
farmers may not have more than 5 acres of land.57 It was clear from the limited sample that this rule is not
followed: the average landholding of the seven households was approximately 10 acres. Moreover, only
one of the seven households interviewed would have qualified under the 5-acre maximum rule. When I
asked a BREDA official in Patna about the discrepancy, he insisted that all applicants had less than five
56 A similar survey in three districts in North Bihar of 31 SIP subsidy recipients under the BREDA program found that average landholding for recipients was 5.48 acres. This project did not differentiate by caste (Durga et al., 2016). 57 In India, the larger category of “small and marginal farmers” are those farmers with less than five acres of land. Marginal farmers have up to 2.5 acres and small farmers have between 2.5 and 5 acres. The classification system, which encompasses all of India is somewhat inaccurate for a state like Bihar where relatively speaking five acres is a lot of land. Only about 10% of farmers in Bihar have more than 2.5 acres of land.

141
acres of land. But at the local level, with fragmented landholdings which are often in the names of
different household members, the rule is easily overlooked.
The benefits from the BREDA subsidy program are further skewed towards the wealthiest
farmers by the limited number of units available per district. This encourages corruption because
wealthier farmers interested in the novelty of the technology and the social status of owning a
conspicuous piece of equipment, bribe government officials to receive SIPs under the subsidy programs.58
Two out of the seven farmers interviewed said that they had paid a bribe to local officials to ensure they
received the subsidy through the BREDA scheme.59 Nevertheless, these same farmers who have the
capacity to influence agriculture officers, are also more likely to have access to Bihar’s expanding
electricity supply. They quickly learn that despite the free energy from the solar panels (as opposed to the
flat rate electricity from the grid), the quantity of water the systems can pump simply cannot compete
with their electric motors. In response, they to discontinue the use of their SIP units.
Even without bribes, the design of the subsidy program favors wealthier farmers who read the
newspaper and regularly engage with district level officials. The main channel of information about the
subsidy program was an advertisement in the local newspaper, and while literacy rates in Bihar are on the
rise, SC/ST farmers have the lowest literacy rates (while the average literacy rate in Bihar is 63%, literacy
rate for SC/ST farmers in the 12-village survey was 49%).
A second reason why the poorest farmers are less likely to apply for the BREDA subsidy program
is that even if the poorest farmers learn about the program in the newspaper or via word of mouth, to get
58 While a similar study by Durga et al. did not necessarily speak to evidence of out-right bribery in the BREDA scheme, it did find that the “higher subsidy component limits the total number of pumps available which often means that they end up with influential village elite” (Durga et al., 2016, p. 2). 59 Interestingly, the two farmers who paid bribes are using their SIP units more effectively (leading to a faster return on investment) than the farmers who did not say that they paid a bribe, but were probably pushed to the front of the line simply by their local elite status. This indicates that willingness to pay a bribe for technology may at least mean that the technology will be well-used.

142
on the list of potential recipients, farmers must first apply at the district agriculture office. Based on my
interviews and ethnographic work, for SC/ST farmers, even approaching the district level agriculture
officers can present challenges of discrimination, not to mention the transaction costs of travel and time.
Finally, to apply for the subsidy program farmers must also have their land titles, one acre of
land, and own their own borewell, all of which the poorest farmers are least likely to have. While the
differences between wealthy and poor farmers in terms of possession of land title documents is relatively
small, 96%, 93% and 83% for UC, OBC and SC/ST respectively, well ownership is distinctly more
biased towards wealthier households. Whereas 24% of UC households have their own well, only 5% of
OBC and 4% of SC/ST farmers own wells.
While the poorest farmers have very limited access to the BREDA subsidy program, the benefits
of SIPs accrued by recipients of subsidized SIP units were also in most cases very low. In fact, three of
the eight SIP units included in the survey (recall that one household had two units) were not operational
and were left standing unused in the field after only a few months to a year of use. The reasons the three
households were not using this expensive piece of equipment were varied, but all demonstrated the
inappropriateness of the technology in the context where it was deployed.
In one household, the SIP unit was installed on an open well that had failed and the farmer had
gone back to using diesel.60 Despite the failure of the well, the low cost paid by the farmer for the SIP unit
gave him little incentive to fix the well or move the unit to a new location. He also said that the unit had
not been as effective as he had anticipated – the discharge of the SIP system was lower than what would
have been provided by a diesel motor and the intermittency of the system on cloudy or fogging days also
60 The fact that the SIP unit was installed on an open well shows that the formal rules for the subsidy program were often ignored in order to give local elites access to the subsidy. According to BREDA, the SIP unit should have been installed on a borewell. This is likely the case because shallow open wells are significantly more likely to fail, destroying the value of the SIP unit unless it is moved to another location. The design of the SIP units in Nalanda district do not lend themselves to be easily transported to a new location.
143
limited its utility. When I suggested the farmer call the company for after-sales service which they were in
theory required to supply, it was clear he felt the transaction costs were not worth it because the SIP
technology had not met his needs.
This farmer’s problems with the SIP unit were illustrative of the complaints of many farmers.
Because the SIP unit provided through the BREDA scheme was limited to 2hp, the capacity of the system
was far less than the diesel engines Bihari farmers are familiar with. This, combined with the fact that the
SIP units do not work at night or in foggy conditions greatly decreased their utility by increasing
transaction costs and decreasing the control farmers had over their irrigation schedules. This problem is
caused by the design of the SIP units under the BREDA scheme, which are installed on borewells in a
way that it is not possible to use a diesel engine with the same borewell. This is a problem because the
SIPs do not work at night or when there is cloud cover and farmers often need to use their borewells at
night. However, this design decision is not intrinsic to SIP technology. In Nepal, a project I work with
designed a system that allows farmers to switch from SIP to diesel in less than 10 minutes. This gives
farmers more flexibility to use solar energy when available, while also ensuring they can water their crops
in a timely manner when solar radiation is not available, without having to construct an additional
borewell. Because the poorest farmers are unlikely to have one borewell, let alone two, they are less likely
to be willing to devote their only borewell to an SIP system.61
The second SIP unit that was not in use had been installed in the field of a wealthy and politically
connected UC farmer. Indeed, this farmer’s standing in Bihar was such that when his father passed away,
the chief minister, Nitish Kumar, came to sit with the family. The farmer’s SIP unit was installed in a
field where there was already a three-phase agricultural electricity connection and he quickly learned that
61 I encountered this problem first hand when working with the NGO PRAN to pilot a SIP scheme in a remote village, Badilbigha. Despite initial enthusiasm for the SIP units, farmers became reluctant to use their own wells for the project once they learnt about the limitations of the technology and we decided we would need additional funding to not only install three SIP units but also build the borewells to go with them.
144
the functionality of a SIP unit was inferior to his electric motor pump (EMP). The SIP unit stood in his
field next to a borewell with an electricity connection for a flat rate of 220 rupees per month (a little over
three dollars) and was now equipped with a wooden bed under the solar panels and used exclusively as an
umbrella to protect farmers against rain and sun. At a cost of over 4,000 USD to Bihar’s government, this
is an expensive umbrella.
The final SIP unit that was not in use belonged to a family that had received two SIP units, one
under the son’s name and another under the father’s name. The household only installed one SIP unit and
saved the other for future use. When my translator, who could no longer help himself, tried to convince
this farmer that the SIP equipment would depreciate over time in the barn and that he should sell it if he
did not want to use it, it became clear that the prestige-value of having the SIP unit sitting in the barn
outweighed the financial benefits of selling it for his household.
Out of the seven households surveyed, there was one example of a more positive outcome in terms
of the criteria of interest – benefits to the poorest and benefits to adopters. One of the poorest farmers in
the sample, an OBC farmer who owned only three acres of land and leased an additional three acres,
improved his well-being substantially when he received a SIP unit through the BREDA scheme.62 The
farmer reported that the SIP unit had improved both his income and his family’s diet. With the SIP unit,
he had transitioned from a rice-wheat rotation in two seasons, to a rice-vegetable-vegetable rotation where
he grew vegetables in both the winter and summer seasons. He estimated that he would recoup his
investment of 450USD in three to four years if not sooner. When I asked him how he had heard about the
subsidy program, he was one of the few farmers who had read about it in the newspaper and then went to
sign up with his local block level agriculture officer who helped him apply. He said he did not pay a bribe
62 While 6 acres is small compared to the other SIPs recipients, it is still a significant landholding in the context of Bihar. That said, half of the farmers’ 6 acres were leased from another farmer. Using his own landholdings, he would be classified as a small farmer and indeed actually eligible for the BREDA subsidy scheme.

145
and while he was not politically connected per se, he had worked for the railway for 35 years before
retiring and he knew many other government employees through his time in public service.
Despite the value this farmer realized from the SIP unit, he was not using it at full capacity. He
estimated that he could probably sell water at least five days per month and still have sufficient water for
his own crops. But he said that selling water would take a lot of his time and effort and the transaction
costs for him to sell water only a few days per month were not worth his effort.
Out of the eight SIP units, only three were likely to have payback periods to the farmer of less
than 20 years (SIP units have a lifespan of approximately 20 years). But the payback period to the farmer
is calculated on only 10% of the full cost of the system. Payback periods for the full system cost were
likely to be closer to 30 years on the low end. For systems not in use, the calculation of payback period is
not even possible. In addition, many wealthy farmers will not benefit from an SIP unit because they also
have access to three-phase electricity. With the BREDA subsidy, farmers pay a small portion of the cost
of the SIP unit. Therefore, they have little incentive to maximize the value of the asset by ensuring that it
is used at maximum capacity. I saw this even in the case of the OBC farmer with only 3 acres of his own
land who calculated that he would recoup a return on his own investment in three to four years. This
farmer was satisfied with the three to four-year timeframe and happy that he could expand his cropping
calendar and switch to more vegetable crops. He saw no reason to expend additional effort as a water
seller in order to recoup his investment more quickly.
In the final analysis of the data, the poorest farmers do not have access to SIPs in Bihar, and the
farmers that have adopted SIP receive few if any benefits from the technology. Despite the very poor
performance of the BREDA SIP scheme in terms of its benefits to the poorest farmers (as well as benefits
to users), other SIPs have performed better both in terms of the benefits realized by adopters and to some
extent in terms of benefits realized by the poorest farmers in small-scale pilot programs in Bihar. For
example, in a study of the community managed pilot program in Nalanda district, Kishore et al. (2017)

146
found that the pilot program had resulted in a 9-10% increase in productivity in rice and wheat. More
importantly, it allowed farmers in the SIP command area to continue to grow paddy during a drought
when almost half of other land in the area was left fallow. The analysis of this pilot demonstrates that SIP
can have positive benefits in Bihar by increasing crop productivity and lowering the cost of irrigation.
There are a number of institutional experiments currently underway in the state and elsewhere, to
see if the SIP innovation system can be reoriented to ensure the poorest farmers capture more of the
benefits from this technology.
For example, GIZ has a project in the Vaishali district in north Bihar which is a community based
pay per-use model. The GIZ demonstration consists of two 2hp pumps that service a total of 147 farmers
on 60 acres of land (which means the average farmer served by the project has 0.4 acres – placing them
amongst the poorest by landholding classification). Farmers pay between 50 and 60 rupees per hour of
irrigation. In addition, while there is limited data available on cost recovery for the project, the goal of the
GIZ project was never about cost recovery as much as demonstration that the poorest farmers in Bihar can
benefit from SIP technology. The project is also focused on efforts to promote SIP in Bihar more broadly.
GIZ regularly bring in farmers from across north Bihar to visit the SIP units and engage in capacity
building activities. They also build awareness about SIP technology for loan officers at banks and other
actors in Bihar’s agricultural system who will be needed in the future to support widespread use of SIP
technology (ICIMOD, 2015).
In addition to the GIZ pilot in Vaishali district, the NGO I work with in Gaya district, PRAN,
developed a model for SIPs where marginal farmers pay a fixed seasonal cost for the SIP system. While
the model does not cover the initial capital cost of the system, the fixed cost is collected in a bank account
that will cover the cost of a replacement unit in 10 years, making the project potentially sustainable after
the initial up-front investment by donors or the government. Under this program design, the NGO selects
farmers they have already been working with, with landholdings in very remote areas where government

147
officials rarely visit. These farmers are unlikely to receive grid connections for some time, and the SIP
system for them is a significantly better option than diesel pumps. In theory, the community model
creates an incentive structure that encourages farmers to use their SIP system at full capacity. This
incentive structure is critical to ensuring a decent return on investment. In practice, the NGO reports that
significant work is required during the first year or more of the project to build collective norms around
the use of the SIP system to both ensure that all farmers have paid for the use of the system and that all
farmers who have paid the seasonal fixed cost, receive timely access to water.63
While NGOs strongly support the community managed approach, many scholars are concerned
about the drawbacks of community ownership. Community ownership often decreases incentives for
long-term maintenance, as well as incentives to maximize the value of the asset through full utilization. A
different institutional approach that relies more heavily on private ownership and entrepreneurship has
been proposed by scholars from IWMI-Tata Water Policy Program in a working paper published in 2016.
In this paper, Durga et al. propose an alternative institutional design for the SIP subsidy scheme in Bihar,
which they argue would improve the performance of SIPs on both criteria of interest: higher benefits to
users and more benefits for the poorest farmers. Their scheme is based on the idea that SIP owners could
transform their main business from agriculture to water provision by becoming “irrigation service
providers” or “ISPs” (Durga et al., 2016). In the ISP model, the SIP owner would receive the SIP for a
40% subsidy, 20% down payment and 40% loan on an 8hp SIP unit capable of irrigating 1 acre per day
(provided there is sufficient solar radiation). The loan repayment cost would then act as a flat-rate tariff
which would incentivize the SIP owners to maximize the quantity of water they sold in a year as profit. If
several SIP owners are clustered in a given area creating market competition, they calculate that this
63 The first experiment in this project began in 2012 with funding from JAIN irrigation. While it was an initial success, a three-phase transformer was installed in the village the next year, making the expensive SIP unit redundant. A second larger experiment is currently underway in a much more remote village with three SIP units of 2.5hp each.
148
model would halve the cost of irrigation for all farmers within the command area of the SIP unit (when
compared to the costs of diesel irrigation).
The IWMI-Tata model estimates that a single 8hp SIP unit could serve between 60-70 farmers.
Statistically speaking, many of these farmers are likely to be marginal farmers in terms of landholding
(simply because the vast majority of Bihar’s landowners fall into the marginal category). Even if the ISP
owner is not amongst the poorest farmers, this institutional design would help the poorest farmers realize
benefits from ISP by significantly decreasing the price of water they incur and by allowing them to
increase their cropping intensity.
While the IWMI-Tata institutional design remains on paper, it is a clear example of the type of
thinking needed to reorient the SIP innovations system to better serve the needs of the poorest farmers in
Bihar. It is also not unlike the proposed NABARD subsidy model, yet the IWMI-Tata model would be
more likely to benefit the poorest farmers because of the clustered-nature of the program design where
private competition would reduce the cost of irrigation water facing water buyers.
Lessons for orienting the SIP innovation system to meet the needs of the poorest farmers can also
be taken from outside Bihar. For example, one of the failures of Bihar’s SIP program is when units are
installed where there is already or likely to be three-phase electricity in the near future. To address this
challenge, a successful SIP program in Bangladesh worked with the government to identify those areas
least likely to be served by the grid and targeted those regions for SIP programs (ICIMOD, 2015).
Targeting SIPs for remote areas would mean that agricultural officers and the private sector companies
that install SIPs will have to travel to Bihar’s hinterlands. Often these areas are challenging for
government officers to visit due to an ongoing Naxalite movement in Bihar. Partnering with NGOs who
have pre-existing relationships in remote communities could help overcome this challenge.
In summary, while SIPs in the BREDA scheme currently perform poorly on both criteria of
interest: benefits to the poorest farmers and benefits to adopters, both of these failures could be overcome

149
through changes to the institutional design of the subsidy program. Whether SIPs in Bihar will live up to
their potential is a question of overcoming barriers in both the institutional and physical dimensions of the
technology in Bihar. While both the institutional design of the subsidy program, as well as the physical
design of the SIP units currently in use limits the benefits the poorest farmers realize from the technology,
there are examples from both inside and outside Bihar of ways in which the sociotechnical barriers
preventing the poorest farmers from benefiting from SIPs can be reoriented. The next sub-section looks
systematically at which STCMs are the most important drivers of variance in the benefits the poorest
farmers realize from SIP technology as it currently exists at scale in Bihar under the BREDA scheme.
2.6.1.2: STCMS as Barriers for the Poorest: SIPs The STCMs that played the largest role preventing the poorest farmers from benefiting from SIP
were lack of financial assets (STCM 1), lack of access to credit (STCM 4), misaligned incentive
structures (STCM 10) and corruption (STCM 11).
Under the BREDA subsidy scheme, farmers must pay approximately 450 USD (10% of the cost).
This sum is far outside the scope of what the poorest farmers can afford, in a state where marginal farmers
earn on average 250 USD annually (STCM 1). The barriers created by lack of financial assets are
exacerbated by lack of access to credit for poor farmers (STCM 4). Interviews with credit union lenders
and private sector banks showed that taking out a loan for a SIP is difficult no matter the size of the
farmer’s land, as most bank loan officers are unfamiliar with the technology and reticent to make a loan.
It is even more challenging for the poorest farmers who are unlikely to have a relationship with a banker,
a strong credit history or even sufficient collateral to apply for the loan.
The incentive structure embedded in the BREDA subsidy program (STCM 10) also skews benefits
towards the largest farmers in the data set. This is partly due to the requirement to own one acre of land,
which would immediately disqualify more than half of the farmers in the 12-village survey. While this

150
requirement may seem logical in order that the SIP units will be used, marginal farmers with less than an
acre of land, could easily become SIP-entrepreneurs (akin to the IWMI-Tata ISP model, albeit at a smaller
scale) selling more water than they personally consume. From a technical perspective, what matters is the
total area that the SIP unit can irrigate. If the command area around an SIP unit is large enough, then even
a farmer with a fraction of an acre who uses his entire landholding to install the SIP unit, could become a
water-entrepreneur selling water to neighbors in the command area. This argument has been made by
multiple groundwater experts, who argue that the high upfront capital cost combined with low marginal
cost of SIP systems, can mimic the high flat-rate electricity regimes that have catalyzed groundwater
markets in other states in India (Mukherji, 2007; Raitha, Verma and Durga, 2014; Durga et al., 2016).64
A second way in which misaligned incentives (STCM 10) drive variance in the extent to which the
poorest farmers benefit from the BREDA subsidy program, is the way in which the subsidy program is
advertised to farmers in newspapers, which means that wealthier farmers are significantly more likely to
know about it in the first place.
Finally, corruption (STCM 11) plays an important role in preventing the poorest farmers from
benefiting from the subsidy program. This is because the government actors responsible for deciding who
should get the subsidy program have responded to both overt corruption in the form of bribes and more
latent corruption in the form of simply making sure the most influential elites get the BREDA subsidy,
irrespective of their eligibility (i.e. landholding of more than five acres).
Other STCM that prevent the poorest farmers in the sample from benefiting from SIPs include
inappropriate technology design (STCM 2), missing infrastructure (STCM 5), ineffective extension
services (STCM 6), lack of individual farmer capacity (STCM 7), weak capacity for collective action
(STCM 8), and structure of land tenure regimes (STCM 9).
64 Groundwater markets are discussed at greater length in the EMP case study in Section 6.4.

151
The design of the SIP units in use, restricts farmers from using a diesel engine in conjunction with
the SIP on a single borewell (STCM 2). This is problematic when farmers need access to more water than
the SIP can provide either due to atmospheric conditions, nightfall or the constraints of a 2hp SIP which is
not as powerful as the diesel engines in use in Bihar. This STCM is a bigger barrier for the poorest
farmers who are the least likely to own one let alone two borewells. The current design physical
dimensions of SIPs in Bihar that limit the ability of farmers to easily switch between SIP and diesel
engines, is not integral to the design of the technology. Alternative designs exist that would allow farmers
more flexibility to switch between SIP units and diesel engines.
Missing infrastructure (STCM 5) also creates a barrier for the poorest farmers who are least likely
to own their own borewell – an eligibility requirement of the BREDA program. For a SIP subsidy
program to better target the poorest farmers, including the cost of borewell construction within the
subsidy package, would help ensure the poorest farmers benefit.
With respect to ineffective extension services (STCM 6), it is difficult to disentangle the difference
between this STCM and corruption (STCM 11). The very fact that despite the efforts of the BREDA
subsidy scheme to target small and marginal farmers with less than five acres of land, the actual recipients
of the scheme appear to be almost exclusively larger landholders from UC and OBC castes. This indicates
that the institutional norms in Bihar’s extension services are not oriented towards the needs of the poorest
farmers.
Multiple NGOs (including Green Peace, GIZ and PRAN) that are working to design more
effective financial mechanisms for providing access to SIPs on the part of farmers, report that building the
capacity for collective action (STCM 8) is essential to project success. Many of the failures in a Green
Peace solar village were due to intra-tola tensions. In Gaya district, a novel pilot program run by PRAN to
recoup the maintenance and replacement cost of the SIP system, required extensive handholding by
PRAN staff to ensure the community purpose of the project was met.

152
Finally, the poorest farmers are less likely to have a title for their land (STCM 9), a requirement of
the SIP subsidy program. In the 12-village survey, while 96% and 93% of UC and OBC farmers have
land titles respectively, only 83% of SC/ST farmers have land titles.65 This discrepancy in land titles
between the poorest farmers and their wealthier neighbors however is not excessively large. In reality, it
drives very little of the actual variance in benefits. So many other STCMs get in the way of the poorest
farmers benefiting before STCM 9 becomes a factor, that the 11% of SC/ST households without
documentation of their land title would likely never have had access anyway.
Only one STCM plays absolutely no role in preventing the poorest farmers from realizing greater
benefits from SIP: missing market linkages (STCM 3). There is some concern that if this technology
scales in certain pockets of Bihar (especially if the IWMI-Tata scheme is implemented) there will be gluts
in vegetable production which would require greater cold storage capacity. For the time being though, this
is not a factor and is not a driving variance in the benefits the poorest farmers realize from the current
incarnation of SIP in Bihar.
2.6.2 System of Rice Intensification (SRI)
The System of Rice Intensification (SRI) is a practice-based technology for improving rice yields
and decreasing seed and water inputs. SRI consists of a set of practices including earlier transplanting
from nursery to field, line sowing, using fewer individual plants per mound when transplanting from
nursery to the main field, increased spacing between plants, soil aeration often with mechanical weeders,
and, perhaps most striking to the outside observer, keeping the rice field moist but not flooded throughout
the season (Uphoff, 2003; H. De Laulanié, 2011).66 The technology has an unconventional “bottom-up”
65 This excludes landless households. 66 SRI methods are often described by as a “package of practices” from which farmers in different biophysical and sociotechnical situations can choose depending on the opportunities and constraints they face. Professor Uphoff maintains a website out of Cornell University which summarizes the principles of SRI in detail: http://sri.cals.cornell.edu/aboutsri/methods/index.html

153
history. It was developed in Madagascar in the 1980s by a French Jesuit priest working in close
collaboration with local NGOs and farmers (De Laulanié, 1993; H. De Laulanié, 2011). The technology
spread from Madagascar to other countries via multiple pathways but most notably through the work of
Norman Uphoff, a tenured political scientist at Cornell University who traveled to Madagascar in the mid-
1990s for research and while there heard about SRI. After participating in three years of on-farm
evaluations, Uphoff began to promote SRI as a promising technology for improving rice yields for small
farmers (Uphoff, 1999; Dominic Glover, 2011).
Initially, SRI met with significant pushback from the established rice research community, who
called the practice “agronomic UFOs,” or “unconfirmed field observations” amongst other more nuanced
critiques (Dobermann, 2004; Sheehy et al., 2004; Sinclair, 2004; Sheehy, Sinclair and Cassman, 2005). In
spite of these critiques, SRI eventually gained support from many prominent organizations including the
World Bank, The International Fund for Agriculture Development (IFAD), a specialized agency under the
United Nations, and Oxfam – a major international NGO focused on poverty alleviation.67 In addition to
the interest of these global actors and organizations in SRI, Professor Uphoff fostered a global network of
academics and civil-society partners who promote the technology (Dominic Glover, 2011). Because SRI
is viewed as a technology that both increases yields while decreasing input costs, actors looking for “pro-
poor” agricultural technologies identified SRI as a particularly promising approach to benefit resource
poor farmers (Stoop, Uphoff and Kassam, 2002; Africare, Oxfam America and WWF-ICRISAT, 2010).
In India, SRI first took hold in the state of Tamil Nadu at the turn of the century (Prasad, 2006). By
2009, the technology had garnered attention and praise across India and Robert Zoellick, then president of
the World Bank, published an article in a leading Indian newspaper, The Hindustan Times, citing the
67 In 2017, SRI was featured in an editorial in Nature Plants as a strategy for meeting the United Nation’s Sustainable Development goals (Nature Plants, 2017).

154
experience with SRI in Tamil Nadu, in which he championed the potential of SRI to increase rice yields
30% to 80% while decreasing water use (Zoellick, 2009).
SRI was first introduced in Bihar in 2007, when Anil Verma, an agronomist who worked for a
national rural livelihoods NGO, Pradan, moved back to Bihar to open a satellite Pradan office in Gaya
district. Mr. Verma introduced SRI in a single village in 2007 (Verma, 2013).68 After observing the
results in the initial year, Mr. Verma was so convinced by the potential of SRI to transform livelihoods
for poor farmers in Gaya district that he later split off from Pradan, which focused on supporting self-help
groups more broadly, in order to focus exclusively on the promotion of SRI through a new NGO that he
called PRAN (Preservation and Proliferation of Rural Resources and Nature).69 By 2009, Anil Verma’s
work with SRI had caught the attention of local policy makers who he invited to meet with farmers and
observe their yield cuttings in the villages where Anil was working. Having heard about SRI from his
deputies, Nitish Kumar, the Chief Minister of Bihar, hoped that there was promise in the technology and
had rice planted using SRI methods on his own land in 2010.
By 2011, SRI had captured so much enthusiasm that Nitish Kumar declared 2011 an official year
for SRI in the state. Launching an “SRI Kranti” or “SRI Revolution”, Kumar declared his intention to
promote SRI in order to make Bihar a “rice basket” for India and he allocated substantial funding to the
promotion of SRI in 2011-2012. By the end of 2012, the Bihari government estimated that SRI had been
68 I have also seen references to field experiments with SRI on agricultural field stations in Bihar dating back to 2002, but I have not been able to find original documentation nor any evidence of the field trials beyond their citation in other journals. At any rate, Anil’s work was likely the first time that SRI was taught to Bihari farmers. See (Thiyagarajan and Gujja, 2012). 69 Over the course of my fieldwork, I became close to Anil Verma and the staff of PRAN. Eventually I was invited to join PRAN’s board as a special invitee board member (special invitee because only Indian citizens can be legally responsible for domestic NGOs). While I attended multiple board meetings for PRAN and engaged with both the organizations staff and board, I do not think this impacted my ability to evaluate the benefits of SRI in a useful and critical way. While I care deeply about the future of PRAN, the opportunity to see the inside functioning of an Indian NGO at such proximity also gave me useful ethnographic material to work with. I also don’t believe that PRAN’s success is nearly as much about the physical technology of SRI itself as it is about their dedicated efforts to work with poor farmers. Nonetheless, even PRAN (as will be discussed further in this case study) often falls short of their aspirations to work with the poorest farmers.

155
adopted on almost three hundred and fifty thousand hectares of land in Bihar (Verma, 2013). In this same
year, a small farmer in Nalanda district, Sumant Kumar, reportedly harvested 22.4 metric tons of paddy
from a single hectare of land, breaking a world yield record held by a farmer in China (Ahmad, 2013).70
Fueled by competitive geopolitics, Sumant’s agricultural achievements garnered domestic and
international attention. His yield record was reinterpreted as a triumph for Bihar’s chief minister and for
the country as a whole (Krishnan, 2013; The Times of India, 2013; Vidal, 2013; Times of India, 2014).
For his achievements Sumant was awarded a prize in New Delhi by the Union Minister of Agriculture
(Nadimi, 2012).
Following on these successes, the government emphasized SRI in its second Agriculture Road
Map (Government of Bihar, 2012). The 2012-2017 Agriculture Road Map allocated substantial funding to
promote SRI amongst Bihar’s farmers. The extent of the funding was surprising for a technology that
remained both relatively under-studied and controversial among many agriculture scientists both in India
and internationally. The total budget for SRI promotion was 144 million dollars, which was
approximately 8% of the total budget allocation in the 2012-2017 Agriculture Road Map of 1.8 billion
dollars (see Table 2.12).
70 It’s worth noting that China disputes Sumant Kumar’s yield record. Yuan Longping, known as the father of hybrid rice in China has claimed that the yield record in Bihar is “120 percent fake” (Krishnan, 2013). Nonetheless, Sumant has been inundated with domestic and international visitors (including delegations from China) to learn more about how a poor Bihar farmer achieved such high yields.

156
Table 2.12: SRI as portion of total budget in 2012-2017 Agriculture Road Map. In total, 144 million dollars or 7.9% of the 1.8-billion-dollar budget is allocated for SRI related activities over the five-year plan.
Spending Category 2012 - 13 2013 - 14 2014 - 15 2015 - 16 2016 - 17 2012-2017
System of Rice Intensification subsidies and extension 9.6% 8.9% 7.9% 6.9% 6.3% 7.6%
Conoweeder or weeder technology 0.5% 0.3% 0.2% 0.2% 0.1% 0.2%
Budgetary spending on System of Rice Intensification as a proportion of total agricultural budget
10.1% 9.2% 8.1% 7.1% 6.4% 7.9%
Since establishing SRI as a cornerstone of Bihar’s agriculture strategy, the government has
claimed substantial success, linking the adoption of SRI in Bihar directly to overall increases in paddy
yield in the state (Times of India 2013). In 2013, Bihar’s agriculture production commissioner, Alok
Kumar Sinha, said that SRI “requires less water and gives 2-3 times the yield compared to traditional
cultivation of rice” and “is set to change the face of paddy cultivation in the state as thousands of farmers
have been adopting it following encouraging results” (Business Standard, 2013). A report published by
the Government of Bihar’s Finance Department in 2015, directly credited the adoption and widespread
use of SRI as the causal driver behind increased paddy yields since 2011. It stated that “because of the use
of new ‘SRI’ technique and new agricultural implements, there was an enormous rise in rice production”
(Government of Bihar, 2015, p.xxv).
According to the Government of Bihar, in addition to SRI’s benefits in terms of increased yields,
the technology also has a second important physical dimension in the drought-prone state – it requires
less water. According to the government not only does SRI save water in general, but it can also help
farmers withstand drought. During a year where droughts affected many of Bihar’s districts, the Principal

157
Secretary of Agriculture for Bihar, A. K. Sinha credited SRI with helping farmers overcome the drought,
saying in the Times of India that farmers planting with SRI methods would not be affected by the drought
because SRI requires less water for irrigation (Dayal, 2011).
Yet despite the claims about SRI’s success in the state, high quality adoption data is limited.71 It is
likely however that the government’s data on adoption is problematic. While my questions about the
government’s SRI adoption figures were never convincingly answered by officials in the state, the
indication I got from the lower-level department of agriculture employees was that the government used
the quantity of subsidy packages allocated as a proxy for adoption of SRI. If this is true, then Bihar’s
adoption figures are only as good as the agricultural extension system linking farmers with the subsidy
program. It is however unlikely that the entire allocation of funding reaches farmers. Leakage of funds
due to corruption is almost inevitable. Supporting my own suspicion about the quality of SRI adoption
figures, some agricultural scientists in the Bihar also question the government’s adoption data. A group of
agronomists at RAU told me that they believe the SRI adoption figures published by the government are
exaggerated by as much as 75%.
There is substantial incentive for Nitish’s government to tout (and even exaggerate) the benefits of
SRI. In a capital-constrained state with many competing demands on available finances, the 144 million
dollars allocated to the technology is substantial. Nitish Kumar invested in SRI despite concerns on the
part of many agronomists and agricultural scientists in and outside Bihar about its efficacy. But for
Nitish, the “pro-poor” narrative behind SRI and specifically the idea that it can increase the yields of the
poorest farmers without requiring them to invest in expensive inputs meant that the technology could also
71 Jamal Latif Poverty Action Lab (JPAL) was in the midst of a study evaluating some aspects of SRI when I was in Bihar, but despite repeated requests, I have not been able to see preliminary results of their evaluations and to date nothing has been published. Moreover, the evaluation was not of SRI per se, as much as a digital technology platform for promoting SRI run by the NGO Digital Green.

158
accomplish important political ends. Nitish tapped into the “pro-poor” narrative around SRI to show that
his agenda is focused on the needs of this large voter block.72
In addition to including SRI in the 2012 Road Map, Nitish further capitalized on the symbolism of
SRI by bringing onto his 2010 election ticket a female SC farmer who was an early adopter of SRI, Jyoti
Devi (Jha, 2011). Jyoti Devi came from a particularly disadvantaged scheduled caste known as the
Musahars who are infamous amongst Bihar’s higher castes for eating rats as part of their diet. In fact, an
article that ran in the times of India about Jyoti’s election was even titled “Beyond the Rat Race” (Times
of India, 2010).73 Jyoti Devi won her seat in the 2010 election and remains a member of Bihar’s
Legislative Assembly (MLA) in the lower house. For Nitish, his support of Jyoti Devi served as a
reminder of his commitment to female empowerment and the needs of the rural poor. It also highlighted
the fact that so much of the funding in Bihar’s Agriculture Road Map was allocated for the “pro-poor”
technology she pioneered. Whatever the actual impact of SRI has been on Bihar’s poorest farmers, the
narrative has been carefully constructed. Not only has Nitish selected a technology that beat China’s yield
record in rice, but it's a technology that is specifically beneficial to poorest farmers like Joyti Devi.
Despite its “pro-poor” symbolism, the extent to which the evidence supports the rapid success of
SRI in increasing yields and helping the poorest farmers overcome drought is limited. This case study,
like the other five, focuses on the extent to which the poorest farmers realize benefits from a technology.
What is unique about this case is that unlike the other five cases, it is the only technology that was
specifically selected because of its “pro-poor” characteristics.
72 In Bihar, the majority of the population are poor rural farmers and as it turns out, this group votes at higher rates than people in Bihar’s urban centers. 73 This article is particularly revealing in the way it describes how Jyoti became part of Nitish’s election ticket in 2010. From Jyoti’s description, she was essentially plucked out of thin air to be on the ticket, making it clear that Nitish had sought out her candidacy for the things she symbolized – lower caste empowerment, female empowerment and the potential of SRI to transform the well-being of the poorest farmers (Times of India, 2010).
159
2.6.2.1: Sociotechnical Analysis of SRI in Bihar My 12-village survey found that 88% of respondents had heard of SRI and that 18% of households
had adopted SRI. On the surface, these are quite extraordinary statistics for a technology that is complex
to adopt and was only introduced at scale in Bihar in 2011. In contrast, only 15% of farmers have heard of
MIS (drip irrigation) and less than 1% of the farmers in the 12-village survey had adopted the technology,
despite the fact that the technology has been highly subsidized since 2006 (see section 2.6.3)
Despite perceptions of SRI’s widespread success in Bihar fueled both by the media and the
government, a more detailed analysis of the data is less supportive of the government’s narrative of SRI
as a “pro-poor” technology. The results of the 12-village survey show that the majority of adopters of
SRI are from OBC castes (14% of UC farmers, 24% of OBC farmers, and 8% of SC/ST farmers had
adopted SRI). The factor by which an SC/ST farmer in Bihar is less likely to adopt SRI than a UC/OBC
farmer is 0.34. This is the lowest likelihood factor of any of the technologies for which I was able to
calculate this factor. Moreover, out of the 55 farmers with more than a hectare of land (2.5 acres), 42%
practiced SRI. In contrast, out of the 283 farmers surveyed with less than one hectare of land only 13%
practiced SRI.
Ethnographic findings from Bathani village mirror the results of the larger survey and shed some
light on the reasons for the adoption trends seen in the survey. In Bathani village, the benefits of SRI
accrued exclusively to farmers in Surka tola.74 Farmers in the other two tolas while aware that farmers in
Surka were using SRI, were generally unenthusiastic about their own prospects for benefiting from the
74 Though one household in Erki reported that they had been paid 25% more as hired labor to plant using SRI methods on a farmer’s land in Surka, thereby indicating that there may be some positive spillover effects on wages from SRI. Though pursing this line of inquiry led me to little additional evidence of this trend.

160
technology. In Surka, farmers had been practicing SRI since 2014 and now cultivate not only rice, but
wheat and multiple vegetable crops using SRI-like methodologies.75
Amongst the three families in the ethnographic account, no family has adopted SRI, but for very
different reasons. Family A helped another household in Surka plant their paddy field using SRI methods
and observed the benefits the SRI brought in the 2015 monsoon season to many households in Surka.
However, Family A has not been able to use SRI yet because their land, unlike the land of most
households in Surka, did not have assured irrigation until recently when they invested in a new borewell
and electric motor pump. They hope to use SRI in the future as they have seen the success of their
neighbors with the technology, but do not plan to do it in the upcoming monsoon season because the
husband will likely be away in Kolkata and they worry it will require more labor. In contrast, Family B in
Rajapur had never heard of SRI and did not know that the farmers in Surka had been planting with SRI
for two monsoon seasons. Finally, Family C in Erki knew about SRI from farmers in Surka and had seen
their fields, but no one has approached this family to offer training. Moreover, they have heard mixed
reviews of the technology from other farmers in Roh and so they were ambivalent about trying it
themselves. Mostly, Family C simply had not had the time to investigate the technology and without the
support of an NGO or government extension officers, they were unlikely to pursue the SRI on their own.
The reason for the heterogeneity in adoption of SRI between tolas in Bathani has both institutional
and physical dimensions. By far the biggest reason is that the NGO PRAN began working with some of
the female farmers in Surka tola to promote SRI at the start of 2014, but not in the other two tolas. When
I asked the staff member, Sanjay, responsible for promoting SRI in the region of Gaya where Bathani is
75 SRI methods have expanded in Bihar to encompass a wide number of crops including wheat and multiple vegetable crops. SRI advocates have re-branded the technology alternatively as “system of root intensification” or “SCI” “system of crop intensification”. The expansion of management practices under the SRI umbrella could offer the empirical case work for an entire dissertation in science and technology studies. Suffice it to say here, that while the Bihar government has officially supported the System of Wheat Intensification in addition to SRI, this chapter focuses primarily on the system of rice intensification as the first and most highly funded version of SRI.
161
located, why he had chosen to concentrate his efforts on Surka, his response was not that different from a
public-sector extension officer – the farmers in Surka are simply better prepared to successfully adopt SRI
for two reasons. First and foremost, the farmers in Surka have better access to water than farmers in Erki
or Rajapur, which he said would facilitate their ability to use SRI. Second, Surka’s farmers were already
more focused on agriculture than those in Erki, which he felt meant that they would be more amenable to
devote the time and effort required to adopt SRI. Rajapur tola, he said was out of the question as a place
to promote SRI. While he knew that Anil, the director of PRAN and his boss probably would have
wanted him to focus on Rajapur, low individual farmer capacity and water scarcity in Rajapur made
promotion of SRI a herculean task. He hoped that perhaps in a few years, success in Surka would induce
farmers in the other two tolas to practice SRI; but given the constraints on his time (he already worked
more than 12 hour days six days per week), choosing farmers who could more easily adopt SRI made his
job just a little bit easier. The end result of Sanjay’s decision was that despite the reported “pro-poor”
characteristics of SRI as a technology, and despite an NGO, focused specifically on helping the poorest,
promoting the technology in Bathani, the benefits of SRI were still concentrated amongst the wealthiest
farmers in Bathani.
Sanjay’s primary reason for working in Surka – that farmers need water to practice SRI – was
recurrent across the 12-village data set, as well as in every other interaction I had in Bihar with farmers
who had adopted, disadopted or heard about SRI and decided not to adopt the technology. They all agreed
that practicing SRI requires not only access to water but also control over access, including frequency of
irrigation. Farmers in the 12-village survey cited multiple barriers to the adoption of SRI, but the most
common barrier was lack of water availability and water control. In the 12-village survey, when farmers
who had heard of SRI but had decided not to adopt the technology were asked for their main reason for
not adopting it, 62% cited lack of water availability. Of the farmers who had adopted SRI but did not plan

162
to use SRI in the future, 46% cited water availability constraints as their primary reason for disadoption of
the technology.
That water is the biggest barrier to adoption of SRI in Bihar is on the surface a surprising finding.
For a technology that claims decreased water requirements for rice cultivation, it is counterintuitive that
farmers would raise concerns about water as a barrier to using SRI. Yet qualitative interviews with
farmers in multiple villages with varying experience with the technology, demonstrate a clear link
between assured water availability and their ability to adopt SRI. First, farmers who are dependent on
either monsoon rains or on purchasing water from other farmers, face uncertainty with respect to the
future availability of water. Under such circumstances, if they have access to water on one day, but are
uncertain when they will access water again (either due to lack of rain or the inability to negotiate a water
purchase from a borewell owner whose well and or pump may be in limited supply) the farmer will
choose to irrigate more today and flood their field instead of following SRI recommendations for
irrigation. Assured access to irrigation in Bihar’s drought-prone climate is limited, especially for the
poorest farmers who are much less likely to own their own well, and often face higher transaction costs
ensuring timely access to irrigation, in addition to the financial costs of purchasing irrigation.
Another physical dimension of SRI that is impacted by lack of assured irrigation, is the younger
age at which seedlings are transplanted from the nursery to the main fields under SRI methods. The
younger seedlings are more vulnerable to dry conditions and if water access is not guaranteed in the field,
farmers face the risk of losing their entire crop after the seedlings have been transplanted and before they
have a chance to grow deep enough roots to withstand drought. For this reason, if the monsoon is delayed,
farmers without assured irrigation access will delay transplanting their crop from the nursery to the field
beyond the recommended 10-12 days under SRI and wait up to 30 days or more using traditional

163
practices.76 These findings undercut the government’s narrative that SRI helps Bihari farmers because it
requires less water and helps farmers overcome drought conditions.
A second causal mechanism that limits benefits to the poorest farmers is the design and
implementation of the SRI subsidy program. Across the 12-village survey, only 8% of farmers reported
receiving the subsidy to practice SRI. Wealthier households received the SRI subsidy with 14% of UC
households, 12% of OBC and 3% of SC/ST households receiving the subsidy package. The subsidy
package for SRI provided by the government consists of 5kg of seeds, 3kg of fertilizer and in some cases
conoweeders, which are a large hand-held tool for weeding the paddy field between rows of plants. Under
the subsidy program, the rule for which farmers received a conoweeder was never entirely clear and while
the government claimed that all recipients of the subsidy received conoweeders, in fact many farmers who
got the subsidy claimed to have only gotten seeds and fertilizer.
The SRI subsidy program disproportionately helps wealthier farmers. In addition, in focus
groups with female farmers who have used SRI methods for more than three years and report high
satisfaction with SRI, many express consternation with the design of the government’s subsidy policy.
The main point these women farmers make is that for a technology that requires fewer seeds, it makes
little sense for the government to incentivize adoption of the technology by giving farmers seeds and
fertilizer. Instead, these farmers repeatedly suggested that the government could more effectively support
SRI adoption by improving access to irrigation for poor farmers and by hiring more and better extension
agents to teach SRI to farmers in their fields. The only inputs the government should subsidize according
to many SRI farmers are the conoweeders which are unique to the practice of SRI, but can be shared
within a village community so that only one weeder per 15-20 households is needed. Unfortunately, while
the 2012-2017 Agriculture Road Map earmarks 144 million dollars for SRI, only 0.2% if this budget is
76 The finding that water availability constrains SRI adoption is consistent with other emerging literature on the challenges facing resource poor farmers in adoption of SRI (Truong et al., 2017).

164
allocated to providing conoweeders to farmers. In addition, it remains difficult for farmers to purchase
conoweeders independently on the private market in Bihar. Farmers only access to the technology is
through the limited supply from NGOs and the government subsidy program.
Skepticism over the government’s SRI subsidy program was echoed by the staff of the NGO
PRAN. They told me that when they are trying to expand SRI into new villages, they look for villages
where government extension staff have not already promoted SRI. This is not in an effort to spread
resources, but because as Sanjay said “the farmers in villages where the government has already worked
expect the subsidy and often do not actually want to follow the practices of SRI.” Indeed, more than one
UC farmer I interviewed admitted that they had taken the SRI subsidy without following through and
adopting the SRI methods. After all, free seeds and fertilizer are always nice to have. In fact, even my
own translator’s family, a wealthier family that operates multiple small businesses on the outskirts of
Gaya, received the SRI subsidy. While they had used the seeds and fertilizer, they decided to plant their
fields with traditional methods. When asked why, they said they could not find hired labor willing to plant
their fields with SRI methods and they were unwilling to do the labor themselves. In a second example, a
UC farmer I had tea with in a village near Bathani, also admitted a similar story. When I asked if he had
practiced SRI, he said yes, but that he thought the technology had few advantages and did not increase
yields. When I asked him if he had received the SRI subsidy, he said he had received it twice. Later in the
conversation however it became clear that he had not actually used SRI methods beyond transplanting
fewer seeds per mound from the nursery to the main field.77 In order to cover his tracks that he had not
actually followed the SRI practices, but still received the SRI subsidy not once but twice, he dismissed
any benefits from SRI.
77 Indeed, many farmers in Bihar are transplanting fewer seedlings per mound from the paddy nursery to the field irrespective of whether they practice SRI or not. Many farmers attributed this change to higher quality seeds available on the market so that fewer seedlings were likely to fail.

165
My suspicion is that many respondents in the 12-village survey were not unlike these two
examples. They received the SRI subsidy, so when asked if they practice SRI they said yes, even if they
had only used the free seeds and fertilizer from the subsidy package with traditional management
practices. More frequently, these farmers would adopt one of two of the recommendations such as fewer
seeds transplanted per mound, and then claim to have both practiced SRI and seen little benefit from the
technology. If other farmers in the dataset who received the SRI subsidy are like these two families, it is
likely that the number of SRI adopters in the survey is higher than the real value. At the same time, if
non-adopting subsidy recipients are inclined to report minimal benefits from practicing SRI, then reported
benefits from adopters may be lower than the true value.
Interestingly, while survey results indicate that only 8% of farmers have received an SRI subsidy
package, 18% reported practicing SRI. On the surface, the data suggests that farmers are adopting SRI
without the support of the government. While this is likely true in some cases, in many cases the
discrepancy is largely driven by NGO support for SRI (NGOs promote SRI without the use of the subsidy
incentive). While overall adoption rates for SRI in the survey data were only 18%, in villages supported
by NGOs the adoption of SRI is higher at 35%.78 There are multiple reasons for this including the long-
term knowledge support provided by PRAN and their model for training and incentivizing local village
resource persons to help other farmers learn about SRI. They also facilitate community building around
SRI which enables farmers to mitigate risks with respect to timely water access.
Outside of the 12-village survey, I visited many villages with PRAN in the Gaya district where
every farmer in the village practices SRI: at the height of monsoons season, the straight rows of SRI-
78 Out of the 12-villages I surveyed, three had primary extension work done by NGOs. In the first village, Bathani, PRAN had worked with one of the three tolas, which only began a few months before my own fieldwork started. In one of the other villages in Gaya district, PRAN had worked in the village from 2010-2014, but had stopped their extension activities as part of a designed phase-out process. In the third village, in Madubhani district, JEEVika, an organization that functions like an NGO but is funded by the Bihari government, had done most of the extension work.

166
paddy are visually striking to observe. Long-term practitioners of SRI report very high benefits from SRI.
Focus groups with farmers who have practiced SRI for more than three years regularly highlight the
increased yields as well as the reduced input costs as the two main benefits of SRI, yet even these focus
groups bemoan the high cost of water as the biggest barrier to practicing SRI. Due to a delayed monsoon
onset in 2012, many farmers I interviewed who had been planning on using SRI management practices
were forced to switch to traditional management practices, after they were unable to transplant the
seedlings from the nursery to the main field until the seedlings were more than 25 days old.
As further evidence that some farmers in Bihar are excited about SRI, on more than one occasion,
I was approached by farmers in Bihar in a local market who wanted to tell me about SRI. I do not believe
these farmers knew I was specifically interested in SRI, rather they just wanted to share something they
were excited about. In fact, SRI for many farms has deep symbolism. The technology in Hindi is called
sri-vidhee which means respected method. And in many ways in Bihar, the farmers who adopt SRI treat
the practice as something between farming and religion.
In summary, SRI is a technology that has significant benefits for many adopters of the technology.
However, the poorest farmers in Bihar are not realizing benefits from SRI compared to their wealthier
peers. The ability of the poorest farmers to benefit from SRI is hampered by both physical and economic
water scarcity and by limited capacity of extension agents (whether employed by NGOs or the
government) to support the poorest farmers in adopting the technology. This finding stands in stark
contrast to the statements of government figures who say that SRI is not only “pro-poor” but helps
farmers successfully plant rice even under drought conditions.
2.6.2.2: STCMS as Barriers for the Poorest: SRI The STCMs that played the largest role preventing the poorest farmers from benefiting from SRI
were missing infrastructure (STCM 5), ineffective extension services (STCM 6) and misaligned incentives
(STCM 10).

167
Missing infrastructure (STCM 5) plays by far the biggest role in driving variance in benefits of
SRI of all of the STCMs. The uncertainty surrounding the onset of the monsoon, combined limited and
expensive access to groundwater, especially for the poorest farmers, has resulted in the benefits of SRI in
Bihar being largely captured by wealthier farmers (STCM 5).
In addition to missing infrastructure, ineffective extension services (STCM 6) play a major role in
the variance in benefits of SRI. Block level agriculture officers who are largely responsible for promoting
the governments SRI scheme at the village level, are far more likely to engage with wealthier farmers
than with the poorest farmers who are often hard to reach. The orientation of the extension services to
wealthier farmers is underscored by the 3% of SC/ST farmers who list their local agricultural officer as
their most trusted source of information, as compared to 11% of OBC farmers and 14% of UC farmers. A
bias towards wealthier farmers on the part of extension agents is almost universally acknowledged by
field level extension agents themselves. In discussions with extension agents they cite several reasons for
working with wealthier farmers including the belief that wealthier farmers can serve as “demonstration”
farmers in the trickle down of new technological advances. They also cite the challenge of working with
the poorest farmers who are often in more remote areas and require greater effort in terms of
demonstration and training (according to the extension officers) to master a new practiced based
approach. Extension agents are also significantly more likely to provide training to farmers who live
closer to larger roads. In the 12-village survey, five of the 12 villages were located within 20 minutes of
paved roads (by car or motorcycle). Farmers in the villages within 20 minutes of a paved road reported
having heard about SRI from block level extension officers at three times the rate that farmers in the other
six villages that were harder to access.
Finally, misaligned incentives (STCM 10) embedded in the subsidy program play an important
role in driving variance in benefits of the program. With SRI comprising a large part of the mandate of the
block level extension officers (over 15% of the total extension budget was earmarked for SRI between

168
2012 and 2017), extension officers are under intense pressure to meet SRI targets and ensure adoption.
This pressure combined with underwhelming overall extension performance means that many extension
officers take the path of least resistance and provide SRI assistance to farmers that approach them or
whom they already know well – these farmers tend to be larger farmers. In addition, some extension
officers themselves are poorly trained in SRI methodology and prefer to work with larger farmers who
require less hand-holding while mastering the technique. Nevertheless, these challenges also apply to
almost any agriculture technology adoption scenario where behavioral change on the part of the farmer is
required. The misaligned incentives in the SRI subsidy program extend beyond these challenges to the
terms of the subsidy arrangement which include free seeds, fertilizers and conoweeders for farmers who
receive the SRI subsidy. These are valuable inputs but many of them are valuable whether or not you
practice SRI and they offer no additional incentive to practice SRI. The design of the subsidy program
leads both to wealthier farmers capturing more of the benefits from the subsidy, as well as a false
reporting about SRI adoption. The terms of the subsidy program are even more obtuse when viewed
through the eyes of poor farmers in villages where SRI has taken off and where NGOs have supported
farmers in achieving substantial benefits from SRI without the subsidy program.
Other STCMs that prevent the poorest farmers in the sample from benefiting from SRI include
lack of individual farmer capacity (STCM 7), weak capacity for collective action (STCM 8) and structure
of land tenure regimes (STCM 9).
Limited educational attainment on the part of many poor farmers skews the benefits of SRI to
wealthier farmers (STCM 7). This is in part because SRI is a difficult technology to master and also
because the design of the SRI outreach programs that the government runs are not well-targeted at the
poorest farmers. For example, much of the SRI extension material from the government is distributed in
printed formats, which is unhelpful to the poorest farmers who are much more likely to be unable to read
the material. While almost all the farmers I interviewed, who have used SRI for more than two seasons,

169
reported either decreased or equal labor requirements to their former management practices, substantial
behavioral changes were required including mastery of new skills in transplanting and weeding.
Developing these skills takes time and often assistance. I saw no indication that the poorest farmers with
no formal education could not master the skills required for SRI, but substantial handholding is required
on the part of NGOs who work with the poorest farmers. Unfortunately, unlike the NGO programs, the far
larger government extension program is not well-targeted at the poorest farmers.
Weak capacity for collective action (STCM 8) limits the benefits of SRI for the poorest farmers.
This is because farmers practicing SRI can achieve substantial efficiencies through collective
management of nurseries and sharing conoweeders, which are necessary for weeding and aerating the
soil. In Bathani village, the close-knit Yadavs in Surka regularly supported each other with the more
complex tasks involved in SRI and worked out systems for sharing in both tasks and tools. In Rajapur and
Erki, farmers in contrast rarely supported agricultural activities outside their own nuclear family. In many
villages in Gaya district where SRI is practiced by almost all farmers in the village, caring for nurseries,
transplanting crops from nursery to field and sharing conoweeders is a village-wide endeavor.
Structure of land tenure regimes (STCM 9) also play some role in limiting the benefits of SRI to
the poorest households. The mechanisms through which this STCM operates are similar to almost any
technology investment (perhaps with the exception of rubber-walla pipes discussed in Section 6.5). The
frequent use of sharecropping arrangements means that the benefits from any investments in technology
are split between landowners and sharecroppers. While the extent to which SRI actually requires
increased labor is debated, the costs in the first year in terms of learning and skill development are
substantial. Moreover, the overall structure of the power arrangement also prevents sharecroppers from
feeling empowered to try a new approach to agriculture if they fear the landowner may be suspicious of
the technology (many farmers are initially skeptical of SRI because the visual impression of an SRI-

170
planted field in the first weeks is substantially less-dense that a field planted under conventional
management practices).
The STCMs that play no role in preventing the poorest farmers from realizing greater benefits
from SRI include lack of financial assets (STCM 1), inappropriate technology design (STCM 2), missing
market linkages (STCM 3), lack of access to credit (STCM 4), and corruption and security (STCM 11).
2.6.3 Drip Irrigation (MIS)
Drip irrigation, a subset of micro irrigation systems (MIS), distributes water through a network of
pipes, tubes and emitters directly to plants near their roots. MIS improves the water use efficiency of
many crops at the field level, though the extent of water savings especially when measured at basin rather
than field level, is still under debate (Ibragimov et al., 2007; Van der Kooij et al., 2013). What is less
uncertain is that MIS technology can benefit the farmers who adopt the technology. MIS can improve
yields and decrease labor requirements, raising incomes for farmers (Hussain and Hanjra, 2004). In
addition, for farmers who pay high marginal costs for water, MIS can result in substantial additional
savings. Many farmers in India, recover their investments in MIS through increased yields and decreased
labor costs in as little as two to three seasons. Well-maintained MIS technology can last for eight to 10
years (Liebrand, 2017).
India as a whole has achieved remarkable success in adoption and widespread use of MIS. In
January 2006, the Government of India launched the Centrally Sponsored Scheme on Micro Irrigation
(first introduced in 2006 and updated in 2010 and renamed the National Mission on Micro Irrigation or
NMMI) (Government of India, 2010). By 2010, India had the single largest area under MIS globally,
though the fraction of MIS compared to total irrigated area was still quite low at 3.12% of total irrigated
land (Palanisami et al., 2011; ICID, 2012). The rapid success of MIS in India has also been very
171
lucrative for India’s private sector MIS companies. JAIN Irrigation Systems Ltd is now one of the largest
MIS companies globally.
The Centrally Sponsored Scheme on Micro Irrigation introduced by the central government in
2006, provided a 40% subsidy for MIS technologies. Individual states were given the responsibility of
subsidy delivery, which led to variation in institutional policies as well as the percentage of subsidy
offered to farmers as many states chose to inject additional funds into the program. This resulted in
subsidies for micro irrigation ranging from 50% in some states to 90%. The subsidy program also offered
additional 10% subsidy for small and marginal farmers. In Bihar, for most of the period between 2006
and 2015, the MIS subsidy was 90% with 40% given by the central government and additional 50% by
the state. For SC/ST farmers, the subsidy was at times as much as 100% when additional subsidy
incentives to target vulnerable farmers were added to the scheme by Bihar’s government.
While the MIS subsidy program in India has led to rapid adoption of the technology in multiple
states, Bihar has in general seen far less success in terms of adoption and widespread use of the
technology. A 2011 study found that despite the 90% subsidy on MIS, only 0.02% of the potentially
irrigable agricultural land area in Bihar had been converted to MIS. This figure stood in stark contrast to
other states such as Andhra Pradesh, where 50% of the potential area is covered by MIS (Palanisami et
al., 2011).
2.6.3.1: Sociotechnical Analysis of MIS in Bihar The use of MIS in Bihar has not followed the same rapid uptake seen in other states in India. The
12-village survey conducted for this project found only one household that had adopted MIS. The lone
farmer who adopted MIS in the 12-village survey, is a UC landowner in Jehanabad district with 14 acres
of land on which he grows multiple crops including high value timber, wheat and maize. He recently
developed a fish-farming business after the introduction of electricity to his village, which allows him to

172
pump groundwater to fill his ponds. He owns four separate wells and sells excess water to neighbors in
his village. In 2009, he received a 90% subsidy on two separate MIS systems – a drip system which he
uses to irrigate teak and mahogany trees, and a sprinkler system which he uses to irrigate winter wheat
and maize. He first heard of the subsidy program from his block agriculture officer who visited his home
to tell him about the opportunity. He had already seen JAIN Irrigation technology at an agricultural fair
and said he immediately jumped on the opportunity to purchase the technology with a substantial subsidy.
He was able to apply for two separate subsidy packages under his own name and the name of his father-
in-law. He said he was extremely pleased with the results of the MIS systems he received through the
subsidy program. For the mahogany trees, impacts on yield are hard to estimate, but he has achieved
substantial labor savings and a reduction in the cost of irrigation. In addition, the sprinkler system he uses
for winter maize and wheat has increased his yields and reduced labor, but because he irrigates these plots
with electricity rather than diesel, the savings on the cost of irrigation were minimal.
Due to the lack of MIS technology in the 12-village survey results, I followed a research protocol
similar to the protocol followed for SIP. I obtained a list of drip irrigation adopters from officials
responsible for administering the subsidy policy. I then conducted field visits to a randomly selected
group of six MIS adopters in Vaishali district to understand more about the dynamics of who was
benefiting from drip irrigation in Bihar (see Table 2.13). In addition to the six farmers surveyed in the
Vaishali district, two additional farmers are included in Table 2.9 – the first is the farmer who was
sampled in the 12-village survey and the second is a farmer who was interviewed because he had received
a subsidy for SIP in the Nalanda district (see section 2.6.1.1) and also happened to have a subsidized MIS
system as well. To better understand the sociotechnical mechanisms structuring access to MIS across
socioeconomic groups, I also interviewed government officials responsible for implementing the MIS
subsidy, private sector company officials, equipment dealers and professors at Bihar’s Rajendra
Agriculture University (RAU) responsible for extension and outreach for MIS.
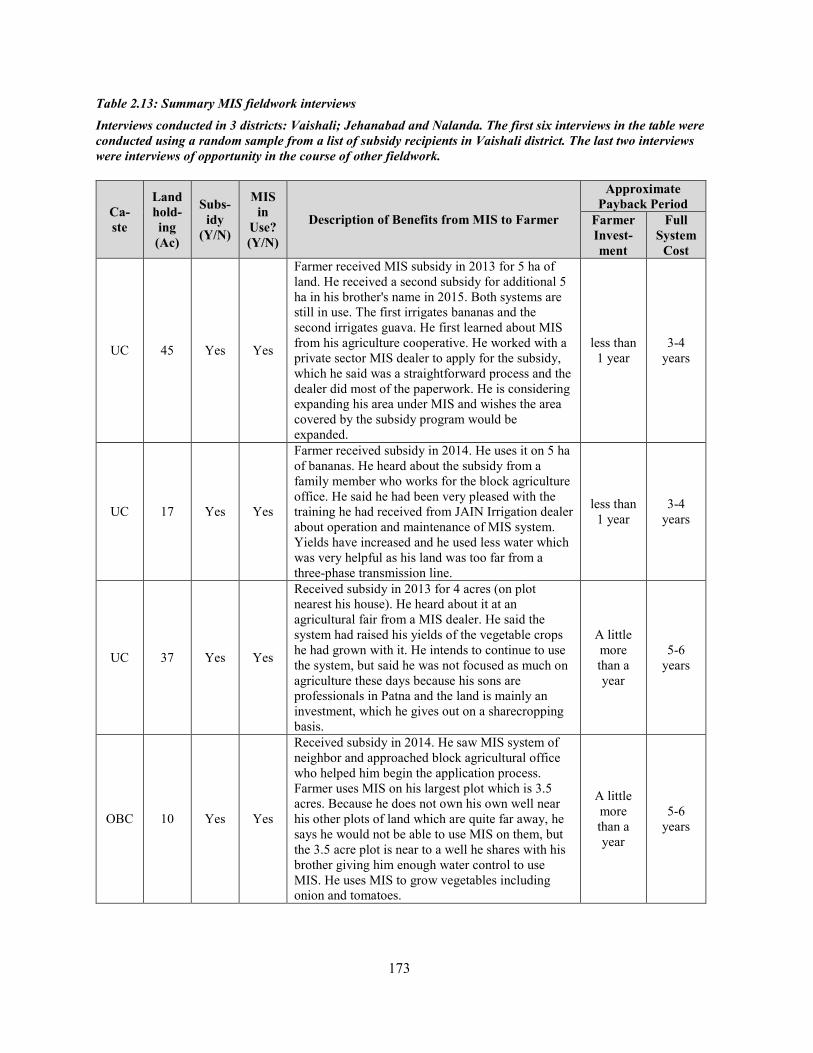
173
Table 2.13: Summary MIS fieldwork interviews Interviews conducted in 3 districts: Vaishali; Jehanabad and Nalanda. The first six interviews in the table were conducted using a random sample from a list of subsidy recipients in Vaishali district. The last two interviews were interviews of opportunity in the course of other fieldwork.
Ca-ste
Land hold-ing
(Ac)
Subs-idy
(Y/N)
MIS in
Use? (Y/N)
Description of Benefits from MIS to Farmer
Approximate Payback Period
Farmer Invest-ment
Full System
Cost
UC 45 Yes Yes
Farmer received MIS subsidy in 2013 for 5 ha of land. He received a second subsidy for additional 5 ha in his brother's name in 2015. Both systems are still in use. The first irrigates bananas and the second irrigates guava. He first learned about MIS from his agriculture cooperative. He worked with a private sector MIS dealer to apply for the subsidy, which he said was a straightforward process and the dealer did most of the paperwork. He is considering expanding his area under MIS and wishes the area covered by the subsidy program would be expanded.
less than 1 year
3-4 years
UC 17 Yes Yes
Farmer received subsidy in 2014. He uses it on 5 ha of bananas. He heard about the subsidy from a family member who works for the block agriculture office. He said he had been very pleased with the training he had received from JAIN Irrigation dealer about operation and maintenance of MIS system. Yields have increased and he used less water which was very helpful as his land was too far from a three-phase transmission line.
less than 1 year
3-4 years
UC 37 Yes Yes
Received subsidy in 2013 for 4 acres (on plot nearest his house). He heard about it at an agricultural fair from a MIS dealer. He said the system had raised his yields of the vegetable crops he had grown with it. He intends to continue to use the system, but said he was not focused as much on agriculture these days because his sons are professionals in Patna and the land is mainly an investment, which he gives out on a sharecropping basis.
A little more than a year
5-6 years
OBC 10 Yes Yes
Received subsidy in 2014. He saw MIS system of neighbor and approached block agricultural office who helped him begin the application process. Farmer uses MIS on his largest plot which is 3.5 acres. Because he does not own his own well near his other plots of land which are quite far away, he says he would not be able to use MIS on them, but the 3.5 acre plot is near to a well he shares with his brother giving him enough water control to use MIS. He uses MIS to grow vegetables including onion and tomatoes.
A little more than a year
5-6 years

174
Table 2.13 (Continued)
Ca-ste
Land hold-ing
(Ac)
Subs-idy
(Y/N)
MIS in
Use? (Y/N)
Description of Benefits from MIS to Farmer
Approximate Payback Period
Farmer Invest-ment
Full System
Cost
UC 8.5 Yes No MIS system was purchased with subsidy in 2013. Due to illness in family, unable to properly use MIS system after first season.
NA NA
UC 43 Yes Yes
Farmer very focused on growing his business. He grows mainly bananas and guavas. He first heard of MIS at a famer training run by the Agriculture University (RAU) in 2011. He purchased his first MIS system in 2011 through the subsidy program and was so impressed with the benefits that in 2012 he had his brother (who lives and works in Patna) apply for the subsidy in his name. His nephew also received a subsidy in 2013. He now has MIS on 15 ha of his banana plantation.
One to two
seasons
less than 3 years
UC 14 Yes Yes
This farmer was surveyed as part of the 12-vilage survey. He has had MIS since 2009. The survey enumerator noted that not only did the farmer know that his MIS system was made by JAIN Irrigation Ltd, he also knew they were based out of Maharashtra and concluded that they "make high quality machines". He compared his own MIS system to a neighbors' made by a different company which he said had many failures. He uses a drip system on teak and mahogany trees. And sprinkler system on winter maize and wheat. He received a subsidy for both drip and sprinkler systems.
A little more than a year
3-4 years
UC 7.4 Yes Yes
This farmer was interviewed as part of the interviews for SIP project, but he happened to also have MIS on 1.5 ha of land. He is also a dealer for JAIN Irrigation Systems Ltd. He received 90% subsidy on his drip system and used it in a large enclosed area on multiple vegetable crops including eggplant, peppers and potatoes.
Less than 1 year.
3-4 years

175
The MIS fieldwork covered eight MIS adopters. Except for two of the informants, all were
randomly selected from a list of farmers who had received the subsidy provided by the horticulture
department79 for Vaishali district. The two additional MIS adopters were also subsidy recipients.
Interviews with private sector officials indicated that the vast majority of drip irrigation purchases in
Bihar are through the state sponsored subsidy program, so methodologically the subsidy recipient list is
representative of all drip irrigation users in the state. Two separate private sector companies estimated that
the “cash and carry” portion of their business (where subsidies are not involved) accounted in one case for
less than 10% of their MIS sales in Bihar. A third company said they had no cash and carry business and
all of their sales were under the subsidy program. The few MIS sales outside the subsidy system were to
institutional clients such as university research programs, large businesses in and around Patna who use
MIS for landscaping and local NGOs ineligible for the subsidy.
The results of the survey of MIS adopters demonstrated the overwhelming degree to which the
benefits of the technology are skewed toward wealthier farmers. Of the eight farmers surveyed, three
were semi-medium farmers, two were medium farmers, and three were large farmers. In addition, all but
one farmer who adopted MIS came from a UC background. The MIS adopters mostly grew high-value
crops including high-value timber products, bananas and vegetables. Almost all respondents (seven of
eight) reported high benefits from their investment. Respondents also said they were able to recoup their
investment in drip irrigation (10% of the cost of the system) in as little as a single season and at most
three seasons.
As further evidence of the degree to which the benefits of the MIS subsidy program are skewed
towards wealthier farmers, three of the households interviewed received the subsidy package in the name
of more than one family member. The subsidy package was intended to cover only five hectares of land
79 The horticulture department is the responsible implementing agency for the MIS subsidy scheme in Bihar.

176
under the terms of the subsidy scheme (12.4 acres), yet these households were able to cover significantly
more area at a 90% subsidy. One household had three members of the household apply for and receive the
subsidy, which now covers 37 acres of their banana and guava plantation. The head of this household
estimated that he recouped his private investment in the MIS systems in one to two seasons. He is
considering covering more of his land with MIS, but hopes to find a way to get this technology at a
subsidized rate.
Many of the households that received the subsidized MIS heard about the availability of the
subsidy program directly from block or district agriculture officers with whom they were in regular
contact. One of the MIS adopters reported visiting his district agriculture officer for tea on a regular basis
to discuss local trends and new government initiatives. This stood in stark contrast to the responses I
received when I asked about MIS in Bathani village where not a single farmer had heard of MIS
technology. In one particularly revealing moment, I had the chance to speak with one of the MIS adopters
I interviewed in Vaishali district months earlier a second time, when we were both staying at the same
guest house and invited to attend an important annual research conference at RAU. This farmer had been
asked by the head of the University to speak at the annual meeting of all faculty and research staff, where
research programs shared their results across departments in an effort break down disciplinary silos. The
farmer I had already met in Vaishali was given the third speaking position on the opening agenda (a place
of high honor directly after the two most senior officials in the room). The speech by this farmer was
meant to underscore to all in attendance the importance of listening to the needs of farmers in designing
research programs at RAU. In some ways, the moment was gratifying – the effects of the farmers’ first
movement (Chambers, Pacey and Thrupp, 1989) had impacted the design of agricultural research
programs even at a government run facility in one of India’s poorest states. Yet at the same time, this
farmer’s central place on the day’s agenda begged the question: Which farmers and whose needs were
being listened to by the RAU’s research community?

177
Overall, the findings from my fieldwork demonstrated that MIS is a technology with clear and
unambiguous benefits to users, but the benefits in Bihar are concentrated among the elite farmers of the
state. The findings from my field interviews were confirmed by interviews with MIS equipment dealers.
One dealer told me that over 85-90% of the MIS technology he sold under the government subsidy
program was to large farmers with over 25 acres of land (a massive landholding by Bihar’s standards).
He said that except for a few programs run by NGOs, he was unaware of any marginal farmers (less than
one hectare or 2.5 acres) who had received MIS through the subsidy program. In perhaps his frankest
remarks, he made it clear that his company had little incentive to market to small and marginal farmers.
He stated that the small profits received per farmer were not worth the time investment on the part of his
employees to go through the steps necessary to design and install an MIS system, as well as conduct the
necessary training to ensure small farmers were able to properly use and care for the drip irrigation
technology over multiple seasons. In fact, he said that it would take his employees more time to sell MIS
to a small farmer than a large farmer, because the time investment required to first convince a farmer to
buy the system and then to train a farmer on how to use and maintain it (even though it is largely fixed
irrespective of the size of the land area covered), was likely higher for poorer farmers who lacked the
education to read instructions.
Another barrier to adoption by the poorest farmers is that the cost per unit area of MIS does not
scale linearly with size. Instead, there are fixed costs which decrease as a percentage of the overall price
as plot size expands. This physical dimension of the MIS technology means that both small farmers, as
well as farmers with fragmented landholdings will pay more per square foot than larger farmers for the
same MIS system. My own calculations based on cost data provided by JAIN Irrigation Systems Ltd in
Gujarat indicates that marginal farmers with plot sizes less than 2.5 acres will pay approximately 20%
more per unit area than larger farmers. However, the increased costs to poor farmers while significant, do
not appear to be the primary barrier to adoption in Bihar. Rather, despite a robust subsidy program, the
178
technology is rarely advertised to small farmers by the private sector companies and equipment dealers
who have largely taken on the responsibility for farmer outreach and promotion of MIS technology in
India (see Chapter 4).
An interview with a government employee involved with the administration of the subsidy
program at the district level in Gaya also demonstrated why the program had seen little success across his
district. He explained that the design of the drip irrigation technology available through the subsidy
program is not well-suited for small farmers who would benefit most from smaller “low-tech” drip
irrigation systems specifically designed for kitchen gardens to increase vegetable production at the
household level. Moreover, he pointed out that because the subsidy program did not include these low-
cost, low-tech systems, the private sector largely failed to market these systems in Bihar. Rather he
believed that for low-cost drip irrigation to be successful, the government would need to re-design the
MIS subsidy program and probably work not only through private sector companies, but also include the
input of NGOs in their strategy for engaging with small farmers.
What this district agriculture official may or may not have known is that the central government
under the subsidy guidelines specifies technology standards for design specifications eligible under the
subsidy program. These guidelines were originally intended to ensure product quality, as well as prevent
private sector companies from over-charging for the equipment. However, these standards exclude low
cost MIS systems from the subsidy program. By excluding low cost MIS from the subsidy program, the
guidelines have essentially removed low cost MIS products from the market as the private sector has
concentrated most of their resources on the lucrative subsidy market.80
80 This may be changing as JAIN Irrigation Systems Ltd. recently purchased one of the leading low-cost MIS companies, DripTech. Moreover, the barriers to low-cost MIS technology erected by the design of the subsidy program were raised by researchers including myself in India, and several high-level reports have recommended changes to MIS subsidy policy to include technology better suited to the needs of the poorest farmers (GGGI, 2015).

179
In summary, there are two primary mechanisms preventing the poorest farmers from benefiting
from MIS both of which are rooted in the design of the national subsidy program. First, the institutional
dimensions of the subsidy scheme leave the private sector actors who are most responsible for
implementing the scheme with little incentive to work with the poorest farmers. Second, the physical
dimensions of the technology selected by the Centrally Sponsored Scheme on Micro Irrigation are not
well-suited to the needs and purchasing power of the poorest farmers.
2.6.3.2: STCMS as Barriers for the Poorest: MIS The STCMs that played the largest role in preventing the poorest farmers from benefiting from
MIS were inappropriate technology design (STCM 2), missing infrastructure (STCM 5) and misaligned
incentives (STCM 10).
Out of these three STCMS, inappropriate technology design and misaligned incentives both result
from the design of the centrally sponsored subsidy program. While there are specific provisions in the
design of the subsidy program to support access by the poorest farmers, these provisions have proven
ineffective in Bihar in aligning incentives to meet the needs of the poorest farmers. Instead, the poorest
farmers are specifically excluded from MIS because the main actors responsible for implementing the
policy have little incentive to work with the poorest farmers. At the same time, the standards set by the
subsidy program select for a technology design that is inappropriate to the needs of the poorest farmers.
While low-cost MIS systems exist that are appropriate for poor farmers, (particularly those designed to
support small-scale kitchen gardens and increased vegetable consumption) these technologies are not
included in the technology standards outlined. Without a subsidy incentive, private sector companies and
dealers have shown little interest in marketing these products. The end result is that the combination of
SCTM 2 (inappropriate technology design) and SCTM 10 (misaligned incentives) prevent the poorest
farmers in Bihar from benefiting from MIS, despite the high priority given to the subsidy program by the
central and state governments.

180
In addition to misaligned incentives and inappropriate technology design, missing infrastructure
(STCM 5) also creates disproportionate barriers for the poorest farmers. However, this barrier is latent in
Bihar due to the strength of STCM 2 and STCM 10, which limits observable instances of poorest farmers
using or even attempting to use drip irrigation in the first place. However, like with SRI, MIS cannot be
used unless farmers can control their access to irrigation.81 The need for assured irrigation with MIS like
in the SRI case, is counter-intuitive because MIS decreases the amount of water used for irrigation
overall. However, just as with SRI, all precision irrigation technologies require increased control over
irrigation schedules. This is because if farmers choose only to provide a small amount of water one day,
they need to be certain water will be available in a few days’ time when they need to irrigate again to
prevent their crops from drying. Thus, farmers will only choose to irrigate less today if they can be
reasonably assured that they will have access to water when their crops need water again. If the timing of
water access is uncertain, farmers will decrease their risk by giving excess water to the crop when they
have access to water, so that they have more flexibility in timing the next irrigation as crops can survive
off the residual moisture in the field. Thus, water scarcity caused by missing infrastructure in Bihar makes
effective use of MIS difficult for many of the poorest farmers.
Projects run by NGOs that support small and marginal farmer adoption of MIS, pair the MIS
system with interventions to assure access to irrigation such as solar pumps or large reservoirs. As
demonstrated in Bathani village and in the larger 12-village survey, water is almost always distributed
inequitably between farmers. This means that the poorest farmers are at a disadvantage not only because
they have to pay other farmers to use their wells and pumping equipment, but also because water-buyers
often have considerable uncertainty as to when they will be given the opportunity to draw water from
another farmers’ well. Under these conditions, even if the subsidy scheme were better targeted at the
81 Additional fieldwork on MIS I conducted in Gujarat also showed that for farmers who buy water and therefore lack control over their irrigation schedules face substantial barriers in adopting MIS technology.
181
poorest farmers, MIS technology systems would likely remain inappropriate for the poorest farmers due
to missing infrastructure in the form of assured irrigation access.
Other STCMs that prevent the poorest farmers in the sample from benefiting from MIS include
lack of financial assets (STCM 1), missing market linkages (STCM 3), lack of access to credit (STCM 4);
ineffective extension services (STCM 6), lack of individual farmer capacity (STCM 7) and structure of
land tenure regimes (STCM 9). Uncertainty of MIS dealers over whether farmers will have available
financial assets or access to credit (STCMS 1 and 4), make them less likely to even approach the poorest
farmers with information about MIS technology. Even extension programs run by government extension
agents or agronomists at the RAU focus their efforts on wealthier farmers when promoting MIS because
of a belief that it is a technology that is beyond the capacity of the poorest farmers to effectively use
(STCM 6 and 7). Their assumption is not unfounded. The design of MIS technology currently funded by
the subsidy program is more expensive per unit area for smaller fields and requires extensive
maintenance. This includes cleaning routines that require flushing the system with water – an additional
expense and challenge under conditions of severe water scarcity and where farmers have minimal
education to understand complex maintenance operations and maintenance instructions for a new
technology. MIS is also a technology best suited for high-value and vegetable crops. To the extent that
market linkages (STCM 3) are weaker for the poorest farmers who often accept a smaller price for crops
in order to reduce transaction costs by selling their crops at a smaller (but usually closer) market, return
on investment in MIS technology per unit crop produced will also decline, further decreasing the benefits
the poorest farmers might realize from investments in MIS. The structure of land tenure regimes also
plays a role in limiting access of the poorest farmers to MIS (STCM 9). Because of the failure of land
redistribution in Bihar, the many farmers who lease or sharecrop land are ineligible for the MIS subsidy
program.

182
The STCMs that play no role in preventing the poorest farmers from benefiting from MIS include
weak capacity for collective action (STCM8), and corruption (STCM 11).
2.6.4 Electric Motor Pumps (EMPs)
Electric motor pumps (EMPs) are tools for extracting groundwater for the purposes of irrigation.
EMPs can be used to lift ground water from ponds or rivers, but in South Asia they are most commonly
used to lift groundwater from wells including both open wells and deeper borewells. EMPs are not the
only tool for extracting ground water. Diesel engines are also extensively used throughout South Asia’s
groundwater economy. Both EMPs and diesel engine pumps serve the same purpose in the irrigation
sector – lifting water. The only difference between EMPs or diesel engines from the perspective of lifting
water for irrigation is the mode of energy generation. Nevertheless, from the perspective of farmers, there
are vast differences between the two technologies.
Diesel pumps are in almost every way an inferior alternative to EMPs. A new diesel pump set is
almost a third more expensive than a new EMP; the maintenance cost of a diesel pump is five times the
maintenance cost of an electric pump; and the efficiency of an electric pump is 30% higher (Purohit and
Michaelowa, 2008). However, all of this is not what makes diesel pumps a hugely inferior option for
farmers in most of India. Rather, the cost of irrigation with diesel is significantly higher than with
electricity. Rising diesel prices in India have led to what scholars have called an “energy squeeze” on
India’s smallholder farmers. During the period 1990 through 2007, farmers faced an eightfold increase in
the nominal price of diesel. At the same time, the nominal price of rice rose by less than 50% (Shah,
2007). In the end, the only reason that farmers choose diesel pumps over EMPs is when EMPs are not an
option because their water source is either not served by the electric grid or because of intermittency
issues that make assured and timely irrigation with EMPs impossible.

183
Since the 1990s, there has been a burgeoning literature on India’s groundwater economy. Much of
this research has been led by Tushaar Shah, a leading Indian economist and former director of the
Institute for Rural Management (IRMA) in Gujarat. Shah and his students have not only developed
extensive in-depth understanding of the impacts of the political-economy of groundwater across states,
but also influenced state policy. They have also focused specifically on the poverty and inequality
dimensions of different sociotechnical groundwater systems in India. So, unlike many of the other
technology case studies discussed in this chapter, the questions surrounding the impact of these
technologies on the poorest farmers is not new. That being said, because of the rapidly evolving
sociotechnical regime in Bihar’s groundwater sector, the question of how the poorest farmers will benefit
from EMPs is worth asking. This is not only because of the degree to which water is the number one
constraint almost all farmers in the survey cited to improving their agricultural productivity, but also
because improved water access and control is often also the key to adoption of additional technologies
such as MIS or SRI. Fortunately, while many questions remain about the implications for the poorest of
Bihar’s rapidly evolving groundwater regime, the extensive research by Shah and his co-authors allow for
highly informed speculation grounded in the developments in Bathani and the 12-village survey. This
case study thus draws extensively on their work and situates the quickly evolving role of EMPs in Bihar
today within this broader literature.
In the introduction to his book “Taming the Anarchy? Groundwater Governance in South Asia”
(Shah, 2009), Tushaar Shah explores the history of South Asia’s groundwater economy. Irrigation he
argues “has always been central to life and society in the plains of South Asia” (p. 5). In 1890, the region
had 12 million hectares of irrigated land compared with three million hectares in the United States, two
million hectares in Egypt. Since the 1970s, growth in irrigated area in India has expanded rapidly. The
explosive growth in irrigation was driven by a shift in the physical dimensions of irrigation technology.
Up until the late 1960s, irrigation was mainly supplied through extensive surface irrigation networks,

184
which fell under the jurisdiction of village communities or the state to build and maintain. Beginning in
the 1970s, India experienced a groundwater boom in the form of individually owned groundwater wells
which are powered either by EMPs or diesel pumps. (A small but growing number are also powered by
solar energy as discussed in Section 6.1).
One well-known challenge created by India’s rapid shift to groundwater is rapid depletion of
groundwater in the northern and western states of India including Punjab, Haryana, Gujarat, Karnataka
and Tamil Nadu (Rodell, Velicogna and Famiglietti, 2009). While this is a significant concern, it turns out
that in Bihar and other parts of eastern India including Orissa and West Bengal, groundwater depletion is
a minor concern. This is because the state sits on top of the Ganga-Meghna-Brahmaputra (GMB) aquifer
system that is abundantly recharged (Shah and Ballabh, 1997). According to a study published in Nature
in 2009, Bihar was only withdrawing 30-40% of annual groundwater recharge (Rodell, Velicogna and
Famiglietti, 2009). In other words, Bihar could increase the well-being of its people by using more
groundwater without negatively impacting its natural capital base.
Despite Bihar’s abundance of groundwater, farmers in the state face substantial water scarcity as
evidenced by the low cropping intensity and their own evaluations of the biggest barrier to improved
productivity. The water scarcity they face is economic rather than physical – the water is there, it is just
too expensive to access it. The energy squeeze, caused by the rising price of diesel, has impacted Bihari
farmers perhaps more than farmers in any other part of India. This is because at least until recently, Bihar
had one of the worst electrification rates in India and the lowest per capita consumption of electricity
(Oda and Tsujita, 2011). Based on data gathered in 2008-2009, Oda and Tsujita estimated that only 60%
of villages in Bihar were electrified. From the perspective of agriculture, the number of villages with
sufficient power capacity not only to bring electricity to fields and wells, but also to run the higher
capacity motors required for lifting groundwater, was significantly below 60%.

185
Bihar’s electricity situation in the 1990s and early 2000s actually got worse rather than better.
According to the Bihar State Electricity Board, 18,000 out of the 47,000 electrified villages in Bihar were
“de-electrified” (Kishore, 2014). My own experience confirms this figure. On a visit to a remote village
to see a newly installed solar powered irrigation pump, I learnt that while the village had not had
electricity for many years, back in 1979 the older villagers recall the day electricity was extended to their
village. Elders remember a five to ten-year period where the village received intermittent electricity, but
since the 1990s they have not had a day of electricity and the infrastructure has now decayed.
Due to the limited electricity infrastructure, almost all groundwater extraction mechanisms
(WEMs) run on diesel pumps rather than EMPs (Kishore, Sharma and Joshi, 2014). Despite the fact that
between 1977 and 1992 West Bengal and Bihar have witnessed the largest percentage increase in total
number of groundwater extraction mechanisms (including both diesel and electric pump sets) in the entire
country, Bihar actually experienced an absolute decline in the number of EMPs – a result no doubt of de-
electrification (Mukherji, 2005). In other words, adoption of groundwater irrigation technologies boomed
in Bihar in the 1970s and 1980s, but this boom was almost entirely a result of diesel pumps. When the
price of diesel in India rose, the costs hit Bihari farmers especially hard. Indeed, their cost of cultivation,
especially when compared to their peers in states like Punjab and Gujarat with free or nearly free flat-rate
electricity, became non-competitive for many crops.
A unique feature of South Asia’s groundwater boom is that it also produced indigenous
institutional dimensions to the technology – specifically groundwater markets, whereby owners of
borewells would sell water to their neighbors (Mukherji, 2005). The growth of water markets in India
developed at a rapid pace in conjunction with the growth in the groundwater sector. A study looking at
data between 1976-77 and 1997-98, shows that in 1976-77, only 4.9% of net area irrigated was irrigated
through water markets (where water buyers purchased water from another well owner) (Mukherji, 2005).
By 1997-98, that number had risen to 31%. In a 20-year period, India witnessed a 20-fold increase in the

186
size of its groundwater market. Mukherji (2005) calculated the value of agricultural output generated
through groundwater markets in the 1990s was almost 150 billion rupees (1990-93 constant prices).
Careful economic analysis of groundwater markets in India show that the institution can be “pro-poor” in
that the groundwater markets allow the poorest farmers to access water for irrigation they might not have
been able to, in the absence of these markets (Shah, 2007). However, the actual benefits realized by the
poorest farmers through groundwater markets depends on the local institutional dimensions of these
markets, which are strongly influenced by government policies (Shah and Ballabh, 1997; Kishore and
Mishra, 2005; Prakash, 2005; Mukherji, 2006; Kishore, 2014).
While early growth in groundwater markets in Bihar was high, later price hikes in diesel and the
absence of electricity hampered the continued growth of groundwater markets and made access to
irrigation exorbitantly expensive for farmers throughout Bihar (Shah and Ballabh, 1997).
When Nitish Kumar came to power in 2005, he emphasized the need to improve rural electricity
infrastructure in the state. And indeed, rural electrification has proceeded at a rapid rate, with Nitish
announcing in the final days of 2017 that all villages in Bihar were now connected to the grid. However,
this only means that at least one household in a village has electricity. As Nitish announced the 2017
accomplishment, he set another goal of having every household connected to the electric grid by the end
of 2018 (Pti, 2017). Whether or not this ambitious goal is accomplished, it may not solve the agricultural
problem because many of the connections are single phase rather than three-phase – insufficient capacity
to power EMPs – and getting electricity from transformers in the center of villages to the fields and wells
where they are needed is an additional challenge.
That said, increasing electrification is driving increasing adoption of EMPs in both Bathani and the
larger 12-village data set. The rest of this case study will reflect on this data in conversation with the
larger literature on groundwater economies in India. It looks at the ways in which the changing
sociotechnical regime impacts the realization of the benefits for the poorest farmers.

187
2.6.4.1: Sociotechnical Analysis of EMPs in Bihar Of the households surveyed for this project, only 4% have thus far adopted electric motors for
pumping groundwater. The first household to adopt electric motors was in 2008, and the peak year of
adoption was 2015, making electric motors a very new technology within the context of Bihar. Across the
entire dataset, 10% of UC farmers had adopted electric pump sets, whereas 4% of OBC and 3% SC/ST
farmers had adopted electric pumps. Even so, electric pump sets are seen both by the few farmers who
own them and the farmers who do not as one of, if not the most, desirable agricultural technologies in
Bihar. In the 12-village survey, when asked what technology households would invest in if they had
sufficient capital, borewells combined with EMPs were the clear favorite. 92% of households said they
would invest in some combination of borewell and EMP package (what they wanted depended of course
on whether they already had a borewell).
In Bathani, three phase electricity (single phase electricity was already available, but is insufficient
to power an electric motor) reached the village in the summer of 2015. The transformer was located on
the main road between the wealthier hamlet of Surka and poorer hamlet of Rajapur. By the winter of
2015, farmers began to switch to electric pump sets to power borewells, but switching costs were high so
only wealthier farmers could afford to make the switch. At the time of my fieldwork, two electric motors
had been installed in Bathani – one in Surka near to the river, and one on the agricultural land adjacent to
Rajapur, but on land owned by a very industrious household from Surka (discussed in Section 2.5.3 as
Family A). In addition, Family C was in the process of building a borewell on the outskirts of Erki which
they planned to power with an EMP from a newly installed transformer in an adjacent village. All
households who had invested in the electric pump sets came from the Yadav caste. The Yadav caste in
Surka, while traditionally known for livestock husbandry, also led the village in landholding size, well
ownership, and overall technology adoption.
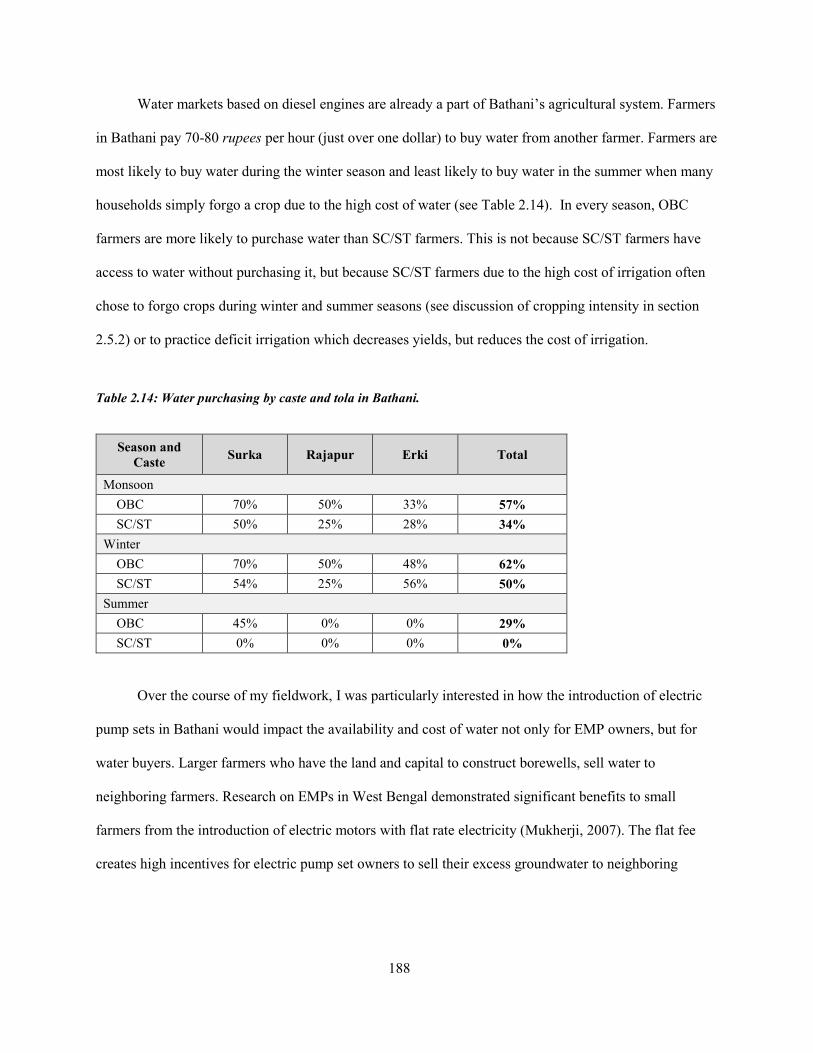
188
Water markets based on diesel engines are already a part of Bathani’s agricultural system. Farmers
in Bathani pay 70-80 rupees per hour (just over one dollar) to buy water from another farmer. Farmers are
most likely to buy water during the winter season and least likely to buy water in the summer when many
households simply forgo a crop due to the high cost of water (see Table 2.14). In every season, OBC
farmers are more likely to purchase water than SC/ST farmers. This is not because SC/ST farmers have
access to water without purchasing it, but because SC/ST farmers due to the high cost of irrigation often
chose to forgo crops during winter and summer seasons (see discussion of cropping intensity in section
2.5.2) or to practice deficit irrigation which decreases yields, but reduces the cost of irrigation.
Table 2.14: Water purchasing by caste and tola in Bathani.
Season and Caste Surka Rajapur Erki Total
Monsoon OBC 70% 50% 33% 57% SC/ST 50% 25% 28% 34%
Winter OBC 70% 50% 48% 62% SC/ST 54% 25% 56% 50%
Summer OBC 45% 0% 0% 29% SC/ST 0% 0% 0% 0%
Over the course of my fieldwork, I was particularly interested in how the introduction of electric
pump sets in Bathani would impact the availability and cost of water not only for EMP owners, but for
water buyers. Larger farmers who have the land and capital to construct borewells, sell water to
neighboring farmers. Research on EMPs in West Bengal demonstrated significant benefits to small
farmers from the introduction of electric motors with flat rate electricity (Mukherji, 2007). The flat fee
creates high incentives for electric pump set owners to sell their excess groundwater to neighboring

189
farmers. Competition between water sellers drives down the cost of water for other farmers, significantly
decreasing the cost of water access.
In Bathani, connections for electric motors cost a monthly flat rate fee of 220 rupees (roughly
3.40 USD). In Bathani, the price of purchasing water from another farmer using a diesel pump set ranged
from 70-80 rupees per hour (just over one dollar). Profit margins to borewell owners using diesel pump
sets were not large (perhaps 10-15% profit), but if after switching to electric motors the price per hour of
water on the water market remained the same, the electric pump set owners would essentially pocket the
entire hourly fee as pure-revenue after their fixed monthly electricity payment.
In discussions with new electric pump owners, it was clear that for the time being, the switch to
electric pump sets would not change the price they charged hourly for water. Of course, competition in
theory between electric pump set owners should drive down the cost. However, in Bathani, groundwater
tables are very variable (see discussion in Section 2.5.2). Building a new borewell is expensive. It is likely
that only wealthier farmers will construct new borewells and other households who adopt EMPs will
already own their own well or borewell. As discussed in Section 2.5.2, most well-owners in Bathani are in
Surka tola and come from OBC castes. This is particularly true for the higher quality open wells and all of
the borewells.
Because of inequality in well ownership in Bathani, the only way to bring benefits of electric
motors to the poorest farmers is to ensure that they have borewells with a high daily capacity. Until now,
no household in Rajapur has sufficient assets to invest in borewell construction, and based on my
observations of limited collective action activity between residents of Rajapur, the likelihood that
Rajapur’s farmers will pool their money to construct a borewell is low. In this context, government
intervention in this type of infrastructure would seem the only way to ensure that the poorest farmers in
Bathani have access both to borewells, but more importantly to the significant potential decrease in the
price per unit of water provided by the new availability of EMPs.

190
In Bathani, the monthly cost of an electric motor connection to the grid was not yet widely known,
but as this information becomes available, water buyers will likely balk at the exorbitant profit margins of
water sellers. In fact, in Surka hamlet, the close familial and caste-based connections caused Family A to
decide to give water away (at least for the time being) from their new borewell and EMP. In contrast,
Family C in Erki where family and caste-based networks are less important, planned to sell water from
their new EMP at the same rate as they currently sell water from their diesel powered borewells. The
husband from Family C said that “as long as I have invested in these borewells and the pumps, why
should I not charge as much as I can for the water?” Whether or not increasing adoption of EMPs in Erki
will induce market competition and force Family C to lower prices is an open question. However, for the
time being, families in Bathani who live closer to the newly installed transformers and who can afford to
invest in the electric wires, borewells and EMPs required to realize benefits from the newly installed
transformers, will reap the benefits from EMPs.
While electric motors are clearly a new technology in Bihar, the certainty that more equitable
water markets will develop as they have in West Bengal should be called into question, especially in
regions with complex hydrology and high failure rates for borewells. The inequity is exacerbated by the
fact that wealthier farmers tend to already own the highest quality land, close to rivers and in low lying
areas where borewell construction is less risky in the first place. While electric motors are an aspirational
goal for farmers across Bihar, the likelihood is that at least in the near future, they will continue to bring
greater benefits to wealthier farmers. Yet from a public policy perspective, this is not the only potential
outcome. Government programs focused on building borewells for the poorest farmers combined with the
growing availability of electricity across Bihar, could dramatically decrease the cost of cultivation for
small farmers. In addition, fairness norms could force electric pump set owners to decrease the price they
charge for water over time.

191
2.6.4.2: STCMS as Barriers for the Poorest: EMPs The STCM that played the largest role preventing the poorest farmers from benefiting from EMPs
in Bihar was missing infrastructure (STCM 5). The lack of three-phase electricity in Bihar is high, but
evidence from Bathani also shows that when three-phase electricity is installed, it often benefits relatively
wealthier farmers simply because of where the transformers are placed in the village (closest to the
wealthiest households). A second major challenge preventing the poorest farmers from benefiting from
EMPs even when three-phase transformers are installed, is that the government leaves the infrastructure
investments necessary to transmit electricity from the village transformer to farmer’s fields to the farmers
themselves. While wealthier farmers can afford to invest in the wires and electrical poles to do this, the
poorest farmers often cannot.
Other STCMs that prevent the poorest farmers in the sample from benefiting from EMPs include
lack of financial assets (STCM 1), lack of access to credit (STCM 4), weak capacity for collective action
(STCM 8), structure of land tenure regimes (STCM 9), misaligned incentives (STCM 10), and corruption
(STCM 11).
Lack of financial assets (STCM 1), is probably the next greatest barrier after missing infrastructure
preventing the poorest farmers from benefiting from EMPs. This is not due to the price of EMPs
themselves, but due to the cost of investing in borewells and electricity wiring required as co-investments
with EMPs. Similarly, the fact that the poorest farmers in Bihar both cannot access credit (STCM 4) and
often say they would not want it even if it were available, hampers the poorest from making investments
in EMPs, borewells and wiring through loans.
The structure of land tenure regimes also plays some role in preventing the poorest farmers from
benefiting from EMPs. Failure of land reforms in Bihar has led not only to unequal distribution of land,
but unequal distribution in quality of land, particularly with respect to water access. In Bathani, the

192
wealthier farmers own land with high groundwater tables whereas the poorest farmers who received
government wasteland (like Family B), have land with poor water access.
Misaligned incentives (STCM 10) and corruption (STCM 11) both probably also play some role in
preventing the poorest farmers from benefiting from EMPs. This is because transformers are so often
installed next to the home of the wealthiest households in the wealthiest tola. Whether this happens due to
overt corruption or simply because the engineers responsible for constructing the transformers have not
been given instructions to install transformers close to the poorer corners of the village, is a question I
was unable to answer. Still, if the Bihari government wants their infrastructure investments to be “pro-
poor”, they should ensure that transformers are installed closest to the land of the poorest farmers.
The STCMs that play no role in preventing the poorest farmers from benefiting from EMPs
include inappropriate technology design (SCTM 2); missing market linkages (STCM 3); ineffective
extension services (STCM 6) and lack of individual farmer capacity (STCM 7).
2.6.5 Rubber-Walla Pipes (RWPs)
Rubber-Walla Pipes are actually plastic pipes made from a transparent plastic that are about 10-
inches in diameter and semi-flexible. The pipes are known locally in Bihar as rubber-walla pipes (RWPs).
The first mention of RWPs that I can find in academic scholarship on Bihar is in a 1997 article by the
groundwater economist Tushaar Shah who recommended that subsidizing RWPs would make local
groundwater markets more competitive (Shah and Ballabh, 1997). Apart from this article, there is very
little published literature on the use of RWPs in agriculture in Bihar or elsewhere in India.
Judging by the paucity of research on RWPS, they are not traditionally thought of as an interesting
agricultural technology. However, in the context of Bihar, from the perspective of farmers this could not
be farther from the case. The value of RWPs is that it transports water from water sources to farmers’

193
fields with substantially less labor than the earthen channels that farmers constructed and maintained prior
to the introduction of RWPs.
While there is little information on the origin of the RWP, the private sector in India has been
promoting the value of increased plastics use in agriculture since the 1980s, when the National Committee
on Plasticulture Applications in Horticulture (NCPAH) began to promote the use of plastics in agriculture
around the country. NCPAH has close ties with the private sector who are the primary suppliers of all
plastics in agriculture. NCPAH focuses their efforts on funding research and promotion of plastics in
agriculture and more recently on subsiding drip irrigation (see Section 2.6.3). Whatever role NCPAH
played in promotion of RWPs, nowhere on their website or promotional material do they mention the
technology.
RWPs appear to have become available on the market in Bihar the early to mid-1990s and by the
early 2000s the technology had come into widespread use (see Section 2.5.1). Based on information I
gathered in interviews with store owners and extension officials, I do not think RWPs have ever been
subsidized by the government, but the relatively low cost of RWPs, the ease of use and the fact that it
helps farmers decrease backbreaking labor investments, has led to rapid uptake of the technology.
2.6.5.1: Sociotechnical Analysis of RWPs Despite the relative scarcity of information on RWPs in the literature or in government documents,
across the entire data set RWPs are the most used technology by all socioeconomic groups of farmers,
with 87% of all farmers using this technology. The factor by which lower caste farmers are less likely to
use RWPs is also relatively high at 0.89, meaning that under the revealed preference assumption that use
equates to benefits, RWP is a technology that both the poorest and wealthier farmers both benefit from – a
“raise all boats” technology. Actual benefits to the poorest farmers are likely higher than the likelihood

194
factor suggests because the poorest farmers benefit from RWPs in ways that wealthier farmers may not,
which I will discuss below.
In Bathani, the use of RWPs is also high, but differentiated by tola. While in Surka, 92% of
households use RWPs, in Rajapur the number of households who use RWPs is far lower at 27%. In Erki,
80% of farmers use RWPs. The low level of RWP use in Rajapur is directly related to water access.
Farmers like Family B whose land is too far from a groundwater source to reliably transport water even
with an RWP, do not use the technology. Family B, despite its large landholding, is uphill from almost
every water source making use of RWPs impractical and limiting Family B to a rainfed production
system.82
Farmers in Bathani reported that RWPs, depending on care and use, need to be replaced every
three to five years. I was curious about the purchasing habits across the dataset about RWPs. Across the
12-village dataset, 29% of households bought RWPs in the last year (some for the first time, but mostly as
replacements for RWPs that had been damaged). Across castes, 45% of UC farmers, 39% of OBC
farmers and 18% of SC/ST farmers purchased RWPs in the past year. But this data does not show the full
extent to which the poorest farmers benefit from RWPs.
In Bathani, water buyers said that the introduction of RWPs had enabled them to begin to purchase
water from farmers who were reluctant to sell them water before the introduction of the technology.
Farmers across the data set began using RWPs when they came on the market in the 1990s. By 2000,
there was a substantial spike in adoption of RWPs. The spike was led by OBC farmers but quickly
82 Note: I am very curious to return to Bathani and see how the growth in the water market may have impacted farmers like the Family B. My suspicion is that Family A’s borewell could easily service family B’s land. But for the time that I was in Bathani, Family A was just getting used to their borewell and had not really developed a water selling strategy. The farmers Family A did give water to, were members of their own extended family. The social distance between Family A and Family B meant that neither farmer even considered an economic relationship between the two households despite the fact that Family A’s land well was ideally located to service Family B’s large landholding with the help of RWP. As water markets grow in Bathani with the expansion of the electrical grid, I am curious about the inter-caste dynamics.

195
followed by other socioeconomic groups. RWPs solved a substantial problem for water buyers: it allowed
them to transport water across other farmer’s fields without building labor intensive water channels for
the water to flow through. This not only decreased labor, but also decreased farmer conflict as the RWP
was a temporary structure that did not take up space or require water buyers to spend substantial time on
other farmer’s fields. The SC/ST farmers in Surka said that RWPs had been particularly helpful for them.
Before the introduction of RWPs, the close-knit Yadavs in Surka would support each other in the
constructing of irrigation channels and generally coordinated irrigation schedules. SC/ST farmers were
often left out of the process of deciding where and when the earthen channels would be built, substantially
decreasing their certainty over if and when they would even be allowed to purchase water from well
owners. With the introduction of the RWP, the transaction costs for selling water decreased substantially
and SC/ST farmers felt that they were more easily able to purchase water from their well-owning
neighbors.
RWP is often included in the overall cost of water buying. While water sellers usually claimed
that they provided use of RWPs free of cost, water buyers said that they pay approximately 10 rupees an
hour on top of the other costs to use the water-sellers’ RWPs. Water buyers in Bathani also felt that it was
prudent to own some of their own RWPs, to ensure that lack of RWPs was not a barrier for timely access
to irrigation when they needed it. Whatever the truth (and there is almost always a gap in the data between
water buyers and water sellers in their assessments of costs) all farmers in Bathani agreed that RWPs had
lubricated the water market in ways that were beneficial across socioeconomic groups.
Overall, farmers felt that RWPs were a very important technology in their ‘technology portfolio’.
However, for wealthier famers, they considered RWPs to be an improved substitute for the old-fashioned
earthen channels which were more labor intensive but served the same purpose. For this reason, wealthier
farmers and well-owners tended to rank RWPs as nice to have, but non-essential technology. At the same
time, the poorest farmers ranked RWPs very highly in terms of importance (just behind borewells and
196
EMPs and even ahead of improved seed varieties discussed in the next section). This is because RWPs
benefited many of the poorest farmers more than any other group because whether or not they personally
owned RWP, it often substantially improved their access to irrigation water.
In many ways, RWP shares physical dimensions similar to drip irrigation (MIS). It is made from
flexible plastic, it transports water, decreasing labor costs and increasing yields. But unlike MIS which
has not caught on in Bihar despite substantial subsidies, RWPs have reached widespread use in the
innovation system without support by the government. Instead, the physical dimensions of the technology
met specific needs that all farmers in Bihar had and the cost was low enough that it allowed the poorest
farmers to also invest in the technology. Moreover, the social dimensions of the technology lubricated the
groundwater market, which brought the poorest farmers relatively more benefits.
2.6.5.2: STCMS as Barriers for the Poorest: RWPs While wealthier farmers use RWPs at slightly higher rates than the poorest farmers, the benefits
accrued from RWPs may actually skew towards the poorest farmers. This is due to RWPs easing the
constraints of the transaction costs in water markets. There are therefore few barriers preventing the
poorest farmers from realizing greater benefits from RWPs.
The only SCTM that created a moderate barrier for the poorest farmers was missing infrastructure
(STCM 5). For example, in Bathani, farmers in Rajapur tola had little incentive to invest in RWPs
because for many of them, like Family B, even the flexibility afforded by RWPs did not put the family
close enough to irrigation infrastructure to make RWPs useful.

197
2.6.6 Improved Seed Varieties (ISVs)
High yielding seed varieties or (HYVs) first came to India during the late 1960s and early 1970s,
heralding what William S. Gaud, the administrator for USAID, coined a “Green Revolution.” These seeds
came from Mexico (wheat) and the Philippines (rice), developed by Rockefeller Foundation funded
scientists with a mission to improve global agricultural yields and forestall a Malthusian famine
(Stakman, Bradfield and Mangelsdorf, 1967). After the introduction of the high yielding varieties (HYVs)
in India, wheat production skyrocketed from 11 million tons in 1961 to 23.2 million tons in 1971 and 46
million tons in 1984 (Chopra, 1985). While contested interpretations of the legacy of the Green
Revolution abound, the packages of seeds and fertilizer in conjunction with government interventions to
stabilize market prices and ensure access to irrigation, undoubtedly had significant impact on both yields
and economic growth in the states where the technology took off (Edwards, 1974; Parayil, 1992; Pingali,
2012).
The benefits of the Green Revolution were not distributed evenly across the country. The
concentration of Green Revolution technology adoption in the west and northwest and especially in
Punjab, helped Punjab become one of the most developed states in India. Punjab maintained the highest
per capita GDP of any state in India through the mid-1990s when it was overtaken by the IT boom
concentrated in the south (Abbi and Singh, 1997). In contrast, many of the eastern states including Bihar,
failed to benefit from the Green Revolution technologies at least until the late 1980s and early 1990s
(Bhalla and Singh, 2001; Singh, 2010).
The success of the Green Revolution in Punjab and other western states was the product of both
very effective new technology (the physical dimensions of the HYVs) combined with institutional
interventions on the part of government actors. These actors developed supportive economic incentives
hand-in-hand with the necessary infrastructure to support widespread adoption of the high yielding seed
varieties (Chopra, 1985; Pingali, 2012). In contrast, in Bihar and other eastern states, the Green

198
Revolution failed to have a significant impact on agricultural systems. There are many reasons for
Bihar’s failure to benefit from the Green Revolution, but perhaps the most important reason at least under
the leadership of Lalu Prasad, was a lack of availability of improved seeds in the state.
After his election in 2005, Nitish asked the Ministry of Agriculture to identify barriers to
improved agricultural productivity in the state. The minister identified low adoption and use of improved
seed varieties in Bihar as one of the key problems facing the agricultural sector. By 2005, several
different types of seed technologies were available in India, including both the high yielding varieties
(HYVs) of the Green Revolution and more recent hybrid seed varieties. Hybrid varieties rely on a
different biological mechanism than the Green Revolution’s HYVs which are inbred rather than hybrid.
Hybrid rice was introduced in Bihar in the early 2000s and was unavailable before that. One key
difference with hybrid rice is that its quality degrades much more quickly between generations so that
farmers ideally must buy new seeds each year when using hybrids. The tradeoff is that yields are higher.
Note that hybrid technology is separate from GMO technology which is not permitted in India except in
the case of cotton (a non-food crop). Because both high yielding and hybrid crops are relatively new to
Bihar and farmers often do not differentiate between the two, the research focused on sociotechnical
causal mechanisms affecting adoption of both high yielding varieties and hybrids, which I collectively
call improved seed varieties (ISV).
The Ministry of Agriculture focused on improving Bihar’s low seed replacement rate. The seed
replacement rate is the most common metric used to evaluate the performance of a seed system. The seed
replacement rate is defined as the measure of an overall cropped area that is planted with ISVs or certified
seeds as opposed to farmer-saved seeds. Generally, a seed replacement rate of 100% is not the target,
rather targets are set specific to the biology of the crop. A report commission by the Ministry of
Agriculture, found that the seed replacement rate for paddy increased from 6.8% in 2003-04 to 10% in
2004-05, but this was still well below the target of 30-35% for a self-pollinating crop (BAMETI, 2007).

199
The Ministry further noted that the key barrier to improved seed replacement rates was overall
unavailability of ISVs in the state. The reasons for the unavailability of ISVs in Bihar included a depleted
seed production capacity in the public sector, failure of the state to participate in central government
schemes to strengthen seed infrastructure, and lack of private sector activity in the state (S. Maho,
Director of Agriculture Gaya District, personal interview, December 19, 2015).
The 2008 Agriculture Road Map allocated 44.1 million USD over five years (8.3% of the 532-
million-dollar budget) to a new seed plan program in order to increase seed replacement rates in the state.
While money was allocated for improved breeding programs, the majority of the budget allocation (58%)
went to the seed distribution program, which offered ISVs including wheat, paddy, hybrid paddy, pulses,
oilseeds and maize to farmers at significantly subsidized rates (Government of Bihar, 2008). The 2012
Road Map increased funding for the seed program to 137 million USD (7% of the 1.8 billion budget).83
The rest of this case study shows that the use of ISVs by farmers in Bihar has risen substantially
across socioeconomic groups. It also demonstrates that the story of increasing adoption of ISVs in Bihar
is not a story of direct government subsidy support for the technology leading to increased adoption
(despite the hundreds of millions of dollars allocated to the subsidy program). Rather, overall
improvements in governance and security (STCM 11) has led to increased private sector participation
from the multi-national to the village scale. This in turn has improved access to ISVs on the part of all
farmers in Bihar.
2.6.6.1: Sociotechnical Analysis of Improved Seed Varieties in Bihar (ISVs) In the 12-village survey, 82% of respondents said they used ISVs in the past 20 years. Moreover,
the gap between the poorest and wealthier farmers was also relatively small. While 86% of UC farmers
83 It is worth noting that this is less than the amount allocated in the 2012 Road Map for SRI, which was 144-million dollars.
200
use ISVs, 85% of OBC and 77% of SC/ST farmers use ISVs. The factor by which a lower caste farmer is
less likely to use ISVs is 0.93, making ISVs in Bihar a technology that “raises all boats.”
In Bathani, overall 65% of households use ISVs – significantly lower than the larger dataset. The
difference in use of ISVs was starkest by tola. In Surka tola, 78% of households used improved seeds
whereas in Rajapur only 18% of households used improved seeds. Across Bathani, all farmers with more
than 2 acres of land used ISVs. The foremost barrier to use of ISVs in Bathani is access to water. If
farmers cannot afford to water their crops or are concerned about timely access to water, they will not
invest in ISVs.
There is a sharp difference in use of ISVs in Bathani between those farmers who can purchase
water in the event of late onset of the monsoon and those who cannot. The barrier is not as much financial
as infrastructural. In Rajapur for example, farmers whose land was close enough to a well to purchase
limited water in the event of drought or late onset monsoon, would invest in paddy ISVs. But if farmers
felt that in the event of a drought, finding assured access to irrigation would not be possible, they chose to
forgo ISVs due to the potential risk of loss. This was the case for Family B where the male head of the
household refused to invest in ISV paddy despite his wife’s belief that their yields would be better. He
was too worried that the crop would fail and they would lose their investment. As a compromise, he
purchased seeds from a neighbor. These seeds were one third the cost of buying ISVs at the market, but
they would likely yield better than the seeds he had been saving at home for multiple seasons.
Family C who owns two wells and has assured irrigation access on all their land, use the most
expensive ISVs (hybrid paddy). Family C said that after they began using hybrid ISVs that their paddy
yields more than doubled. Moreover, because they own their own wells, there is very little risk of crop
failure.
Finally, Family A also invested in ISVs, but not the most expensive hybrid ISVs as at least until
this year, the potential for loss without their own irrigation source was too great. Instead, they used more

201
economical ISVs from West Bengal, which are cheaper than the ISVs from what they called the “big
companies” which in Bihar include Syngenta, Monsanto, and DuPont. However, they are considering
investing in higher quality ISVs in the future, now that their borewell assures timely access to irrigation.
Another farmer in Rajapur did not use ISVs on his own 0.3 acres of land because he feared that he
would not be able to secure timely irrigation for his crop in the event of a drought. However, he did use
ISVs on another 0.5 acres of land he sharecropped on the land of a farmer from Surka. The sharecropper
and landowner negotiated that they would split the cost of the short duration ISVs for paddy, as well as
the cost of irrigation which they would buy from a third household who owned a nearby well to the 0.5-
acre plot. They were confident that they would receive timely irrigation because the landowner was also
related to the well-owner. This was an arrangement that was mutually beneficial to both the sharecropper
and the landowner because in addition to the improved yields they observed with the ISVs, using a
shorter duration variety allowed them to plant their winter wheat crop sooner, which would improve their
wheat yield as well.84
This institutional arrangement between the sharecropper and the landowner was only possible
because of a longstanding relationship between the sharecropper and the landowner (at least 10 years).
Over many years, they had developed mutual trust which gave both parties a greater sense of confidence
to make a joint investment in ISVs. The sharecropper and the landowner went together to buy the ISVs in
Roh to ensure that they both knew the cost of the seeds. More importantly perhaps, because the
landowner still lived in Surka, he was able to observe the management practices of the sharecropper to
ensure his investment was well cared for. Had there not been a level of trust between the two parties, or
84 In Bihar, late planting of wheat is a major constraint on yields Singh et al 2001. The recommended sowing time for wheat in Bihar is November 19-25, when monsoon paddy is still in the field in much of the state because the paddy is often delayed as farmers wait for delayed monsoons and try to avoid paying for irrigation. The delayed planting of paddy, which in turn delays the planting of wheat has significant implications for the wheat yield. A one-month delay in sowing of wheat can reduce productivity by more than 50% (Hoda, Rajkhowa and Gulati, 2017).
202
had the landowner been an absentee landowner, they would not have been able to co-invest in expensive
inputs for the sharecropped land. They would also not have made this investment had the plot of land not
been near a borewell owned by a farmer that would assure timely irrigation access.
ISVs were one of the most important technologies from the farmers’ perspective. When asked to
rank technologies by their importance, ISVs consistently ranked directly behind water access technologies
(electric motor pumps and rubber-walla pipes) in their importance to farmers. Short-duration ISVs, or
seeds that have been bred to grow more quickly, are particularly useful in Bihar where water is expensive.
This is because the short-duration paddy ISV, shortens the length of time for the paddy crop to mature,
which decreases water requirements over the season, allowing the farmers to rely to a greater extent on
the monsoon rains with fewer purchased irrigation.
Clearly, IVS have benefited farmers across the socioeconomic spectrum in Bihar. While wealthier
farmers use ISVs at slightly higher rates, the poorest farmers are not far behind. Increased use of ISVs
coincided with the election of Nitish Kumar as Chief Minister and his emphasis on improving the seed
replacement rate in the 2008 Agriculture Road Map. For example, no farmer in the dataset said they had
begun using improved seeds prior to 2000.85 And while OBC farmers were the first farmers to report
adopting ISVs at scale around 2005, SC/ST farmers started using them soon after. The rate of ISV
adoption increased around 2005, with additional smaller spikes in 2008 and 2009 followed by a
substantial increase in 2010.
85 Other sources show that HYVs were in higher use in Bihar prior to 2000 than my data suggests. I am not sure what accounts for the discrepancy between my data and data from Indiastat.com as cited by Kishore et al. (2014) which shows that HYVs for rice covered 24.7 percent of all cropped area in 1981/1982 and 73.9% in 2001/2003. I suspect that the differences in the data have come from two sources. First, farmers who adopted HYVs sometime in the 1990s were likely to report the year 2000 in the 12-village survey. Second, the 12-village survey captures a realistic socioeconomic sample of households thereby including many marginal farmers who account for a small ratio of the overall landholdings. The data from Indiastat.com focused on percent of overall area where numbers are likely to be driven up by higher adoption amongst medium farmers. Finally, there is some chance that HYVs were in more widespread use prior to the Lalu era and then were disadopted due to both unavailability of HYVs caused by a breakdown in supply chains due to corruption and security (STCM 11) and higher costs of diesel making investments in agriculture less attractive for many farmers.

203
In order to understand which STCMs were preventing farmers from adopting ISVs in the 1990s
and early 2000s, and why ISVs were both quickly adopted between 2005 and 2015, with benefits
distributed relatively evenly across socioeconomic groups, I relied on qualitative data from my fieldwork
in Bathani as well as interviews with owners of seed stores in the nearby market town of Roh. What I
found was that while Nitish’s government should certainly be credited with the increased use of ISVs in
the state, the reasons for this success are less straightforward than simply effective implementation of the
2008 and 2012 Agriculture Road Maps. The seed program under both Road Maps was heavily biased
towards government subsidized seeds as a method for increasing the use of ISVs in Bihar. In contrast to
the emphasis placed on the subsidy program by the government, the vast majority of farmers surveyed
reported buying their seeds from private sector input dealers rather than government seed banks. Indeed
89% of farmers in the 12-village survey who reported using ISVs said they used private sector shops in
nearby villages, rather than government seed banks to purchase new seeds.
The extent to which the subsidy program benefited any farmers, was biased towards wealthier
farmers. While overall only 3.4% of farmers reported receiving a subsidy for ISVs, 4.1% of UC farmers,
3.4% of OBC farmers and 2.8% of SC/ST farmers reported receiving an ISV subsidy. In Bathani, I spent
a great deal of time trying to understand the reasons that more farmers did not take advantage of the ISV
subsidy program. The biggest reason was high transaction costs associated with the subsidy program.
While transaction costs were not onerous (indeed the government needs some kind of verification
program to administer a subsidy program) farmers nonetheless had to travel to the block headquarters
(20-30 minutes by bicycle) to get subsidized seeds rather than the local market town of Roh (10 minutes
by bicycle). Moreover, farmers make regular trips to Roh for everything from selling vegetables to buying
any type of household goods, so the time investment to purchase ISVs could easily be “co-invested” with
other necessary business. Apart from the time involved in going to the government seed bank, farmers
expressed skepticism about the quality of government subsidized seeds, believing that seeds from

204
government sources are more likely to be “fake ISVs” or seeds that had been swapped out by corrupt
government officials for an inferior product. In contrast, farmers tended to trust the seeds sold by private
sector seed stores. Indeed, they believed that the owners of seed stores lived in their communities and
would face greater social consequences for selling counterfeit product than the more distant government
officials. This preference for seeds from private sector suppliers is buttressed by results from the 12-
village survey that show that private sector seed dealers are (apart from other farmers) the most trusted
source of information for farmers across all caste categories, far outperforming government extension
officers and even NGOs (see Appendix 2).
Another problem with the government seed program was the fixed quantity available through the
subsidy program. While it was often difficult to get consistent numbers from either farmers or extension
officers, it seemed seed banks sold seed in quantities that far exceeded the needs of the poorest farmers.
For example, a 30kg bag of ISV paddy was available from the government at the block headquarters for
700 rupees. This worked out to about 23 rupees per kg (or 0.3 USD). In contrast, ISV from the local seed
store is around 200 rupees per kg (3 USD). However, many of the poorest farmers with only a small
fraction of an acre do not need more than a single kg of seeds to plant their field. Therefore, investing in a
30kg bag even at substantial savings, requires spending more than twice as much money up front and then
finding a way to sell the seeds to neighbors which can also be difficult especially if the bag has already
been opened. The large quantity of seeds sold through the government program combined with the
additional transaction costs of travel, has led to a situation where for most farmers, it is better just to buy
ISVs from trusted seed stores than to go to the government seed banks.
Finally, what seems to be either uneven implementation of subsidy program rules or confusion
over the rules themselves, has left farmers in Bathani under the impression that unless they have at least
one 2.5 acres (1 hectare) of land and their land title records, they were ineligible to receive the seed
subsidy. While district officials confirmed the land records requirement, they said there was no minimum

205
land requirement and that the smallest farmers were welcome to apply for subsidized seeds. Indeed, in a
speech organized by Oxfam in Patna focusing specifically on the poorest farmers, Vijoy Prakash, the
Principle Secretary in the Department of Rural Development, said that all government seed programs
were explicitly targeted at the poorest farmers, with a 2-acre ceiling on farmers eligible to apply for the
seed subsidy program (V. Prakash, public speech, June 25 2015, Patliputra Hotel, Patna). Whatever the
truth of the matter, from the perspective of benefits derived by farmers from the seed subsidy program (as
measured by access), benefits were limited across all socioeconomic groups, but particularly limited for
the poorest farmers.
If the government’s seed subsidy program did not catalyze the rapid uptake of ISVs in the state,
then what were the underlying causal mechanisms responsible for the rapid increase in adoption around
2010? In Bathani, farmers believed that increased use of ISVs was directly related to increased
availability of ISVs in the market. Like the rest of Bihar, Roh’s economy has also changed since the
election of Nitish Kumar. The number of seed stores operating in Roh rose from one before 2005 to five
in 2015. In addition, a sixth seed store opened in Erki tola in 2013, putting access to ISVs at Bathani
farmers’ doorsteps. With competition in input supply stores, farmers receive access to more varied
sources of information about seed varieties and benefit from price competition. Farmers in Bathani also
believe that the quality of seeds available from the private sector has improved and that market
competition and the ability of farmers to change which seed stores they patronize, ensures that the owners
of the seed stores will not sell them sub-par products.
Interviews with private seed sellers in Roh revealed that a major driver of improved access to ISVs
for all farmers was the improvement in law and order in the state that was a direct result of the election of
Nitish Kumar. Each of the seed vendors interviewed in Roh (n=4) confirmed that business conditions had
improved markedly since the election of Nitish Kumar, which gave them increased confidence to open a
business. In addition to the local seed vendors, larger private sector seed companies were increasingly

206
interested in working with distributors in Bihar. Interviews at higher levels in the seed supply chain
confirmed that just as international NGOs flocked back to Bihar after the election of Nitish Kumar, multi-
national companies also observed the improving governance in the state and began to see opportunities
for growth. Larger private sector companies also felt that the process for seed certification was now more
standardized, less corrupt and easier to get through, which also made them more confident to invest in
growth in Bihar (Aanand Shrikar, Monsanto India, personal interview, August 8, 2015). Even domestic
seed companies based out of neighboring West Bengal began targeting Bihar as a new opportunity for
growth and developing business relationships with local seed sellers. In open-ended questions about ISVs
in the 12-village survey, respondents repeatedly mentioned the improved access to seeds from West
Bengal (with similar agro-ecological conditions) as a major benefit of the improved seed system in Bihar.
These ISVs are often cheaper than those from major multi-national companies, but still improve yields
over traditional seed varieties.
In summary, the story of increasing adoption of ISVs in Bihar is not a story of direct government
subsidy support for the technology leading to increased adoption (despite the hundreds of millions of
dollars allocated to the subsidy program). Rather overall improvements in governance and security
(STCM 11) has led to increased private sector participation from the multi-national to the village scale.
This in turn has improved access to ISVs on the part of all farmers in Bihar.
This is not to say the government of Bihar has not played an important role in the rapid adoption of
ISVs, but their role as a “last mile” actor has not been successful. Instead, in addition to improvements in
law and order, the government has played two critical roles unlocking access to ISVs for Bihari farmers.
First, by improving the quality of breeding programs, they have worked hand-in-hand with private sector
companies and international organizations such as the International Rice Research Institute (IRRI) and the
International Maize and Wheat Improvement Center (CIMMYT) to increase the overall availability of
quality ISVs. Second, through improving the regulatory process for seed certification, as well as more

207
strictly enforcing punishments for selling counterfeit seeds, the business environment has also improved.
This has led to increased private sector participation, as well as increased farmer confidence in the seed
program. This does not mean that there are no longer fraudulent seeds in the state, but Nitish’s
government has pursued cases of fraudulent seed sales very publicly in an effort to signal both to farmers
and to seed sellers that the seed supply chain is well-regulated (e.g. Ahuja, 2017).
2.6.6.2: STCMs as Barriers for the Poorest: ISVs
Overall, the poorest farmers realize benefits from ISVs at roughly similar rates to their wealthier
peers. Therefore, for the ISV case study, I did not identify STCMs that strongly prevented the poorest
farmers from benefiting from this technology.
While benefits are distributed relatively evenly, wealthier farmers are still benefiting more than
the poorest. This was especially clear in Bathani, where adoption of ISVs in Rajapur tola was only 18%.
The differences in benefits realized by farmers in Rajapur compared to Surka is driven by the poor
physical access to water in the tola. This makes investments in ISVs in Rajapur particularly risky for
farmers, and demonstrates that ISVs require some minimum level of infrastructure (STCM 5). Because
the poorest farmers are the least likely to own their own well, and often face high transaction costs and
overt discrimination buying water from farmers in “higher” castes, the need for a minimum level of
infrastructure to realize benefits from ISVs limits the benefits the poorest farmers realize from this
technology.
In addition to missing infrastructure (STCM 5), the structure of land tenure regimes (STCM 9)
also played some role in explaining variance in benefits of ISVs. This is especially true for sharecroppers
who are the least likely to use ISVs (12%). Interviews in Bathani showed that in situations with long-term
relationships between sharecroppers and landlords, landlords are more likely to encourage investment in
ISVs and other inputs. This can happen where there is an element of trust between sharecroppers and
208
landowners. However, where the social distance between the sharecropper and the landlord is larger,
landlords are usually unwilling to invest financial capital in yield enhancing technologies. At the same
time sharecroppers, knowing they will give half their production to the landlord, lack substantial incentive
to invest in yield enhancing technologies on their own.
Finally, misaligned incentives (STCM 10) also seems to play some role in driving variance in the
benefits the poorest farmers realize from ISVs. The governments subsidy program is fairly ineffective
across the socioeconomic groups, but especially so for the poorest farmers because the design of the
subsidy program sells seeds in quantities that are much larger than the poorest farmers need.
The STCMs that played little to no role in explaining variance in benefits included lack of
financial assets (STCM 1); inappropriate technology design (STCM 2); missing market linkages (STCM
3); lack of access to credit (STCM 4); ineffective extension services (STCM 6); lack of individual farmer
capacity (STCM 7); weak capacity for collective action (STCM 8) and corruption and security (STCM
11).
While lack of financial assets (STCM 1) may have played some role in driving variance,
conversations with the poorest farmers in Bathani led me to believe that it was rarely the ISVs themselves
they could not afford. Rather, like the case with Family B discussed above, the concern was less about the
cost of the ISVs, but about the chance of losing their investment if they were unable to access or afford
the necessary irrigation to keep their crop alive. Family B, for example, felt that they were unable to
access or afford irrigation for their paddy crop, then if the drought came they risked also losing their
investment in ISVs which led them to forgo use of ISVs in the first place. For this reason, I do not include
STCM 1 as a driver of variance in benefits for ISVs as it appears that missing infrastructure and the high
cost of water are significantly more important barriers for the poorest farmers in Bihar.
Finally, one might expect that given the overall importance of improved corruption and security
(STCM 11) in improving the ISV innovation system in Bihar, that this STCM should be listed amongst

209
the drivers of variance in benefits realized from ISVs by the poorest farmers. However, the improvements
in this STCM in Bihar while critical to the overall adoption of ISVs, do not appear to drive variance in
benefits across socioeconomic groups. The improvements in corruption and security benefited farmers
across socioeconomic groups and gave them all access to ISVs. In fact, given the greater reliance of the
poorest farmers on advice from seed sellers, the increased number of seed sellers due (at least in part) to
improvements in corruption and security likely benefited the poorest farmers more than other groups (see
Appendix 2 for data on who farmers trust for agricultural information).
2.7 Findings
This section draws on the findings from the six case studies to examine the extent to which each
of the 11 STCMs prevent the poorest farmers from benefiting from agricultural technology in Bihar. In
this section, I first discuss some of the more surprising findings from the analysis, then move onto a
discussion of each individual STCM, drawing insights from across the six case studies as well as other
insights from my fieldwork in Bihar that are relevant to a particular STCM.
Table 2.11 is a color coded visual representation of the extent to which each of the 11 STCMs
prevent the poorest farmers from benefiting from technology across the six case studies. Recall that none
of the technologies are specifically “pro-poor”, in that no technology benefited the poorest farmers more
than wealthier farmers. Instead, all technologies evaluated in this study (based on the likelihood factor
that the poorest farmers will use a technology compared to wealthier farmers calculated in Section 2.6),
are either technologies that “raise all boats” or technologies “for the rich”. Because there are no
technologies that are “pro-poor” among the six technologies evaluated in the case studies, Table 2.11 was
constructed to show the extent to which different STCMs play a role in preventing the poorest farmers
from benefiting from each of the six technologies. In Table 2.15, I rank STCMs as high if they played a

210
large role in a specific case study in preventing the poorest farmers from benefiting from the technology;
medium if they played a moderate role; and low if they played little to no role.
Table 2.15: Importance of each STCM across cases.
This table summarizes the extent to which each of the 11 STCMs prevent the poorest farmers from benefiting from technology across the six case studies. High means that the SCTM is a large barrier limiting the poorest farmers from realizing benefits from the technology; Medium means that the STCM plays a moderate role in preventing the poorest farmers from benefiting from the technology; Low means that the STCM plays little to no role in preventing the poorest farmers from benefiting from the technology.
Recall that the six case studies were purposively selected along two dimensions of variance –
benefits to the poorest farmers (where sustained use is used as a proxy for benefits), and the amount of
benefits realized by technology users. The six case studies thus represent a wide-range of technologies
that vary in the extent to which they benefit the poorest farmers. The six case studies are also a sample of
technologies available to farmers in Bihar including technologies that are widely available to the poorest
Technology Sociotechnical Causal Mechanisms
Solar Irrigation
Pumps
System of Rice
Intensification
Drip Irrigation
Electric Motor Pumps
Rubber-Walla Pipes
Improved Seeds
Varieties
(STCM) (SIP) (SRI) (MIS) (EMP) (RWP) (ISV)
Lack of financial assets High Low Medium Medium Low Low
Inappropriate technology design Medium Low High Low Low Low
Missing market linkages Low Low Medium Low Low Low
Lack of access to credit High Low Medium Medium Low Low
Missing infrastructure Medium High High High Medium Medium
Ineffective extension services Medium High Medium Low Low Low
Lack of individual farmer capacity Medium Medium Medium Low Low Low
Weak capacity for collective action Medium Medium Low Medium Low Low
Structure of land tenure regimes Medium Medium Medium Medium Low Medium
Misaligned incentives High High High Medium Low Medium
Corruption and security High Low Low Medium Low Low
211
(e.g. rubber-walla pipes, improved seed varieties) and technologies that the poorest farmers appear all but
excluded from benefiting from (e.g. solar irrigation pumps and drip irrigation). The goal is that by
studying the barriers preventing the poorest farmers from benefiting from each of these technologies, the
average barriers when assessed across the six case studies is representative of the overall importance of
each of the 11 STCMs in preventing the poorest farmers from benefitting from technologies in general in
Bihar.
In this section I assume that the STCMs identified as high, medium and low barriers preventing the
poorest farmers from realizing greater benefits from technology in the six individual case studies, are
representative of the relationship between STCMs and barriers for the entire set of modern agricultural
technologies available in Bihar.86 Based on this assumption, I use the findings from the six case studies
(summarized in Table 2.11) to rank the STCMs by the extent to which each STCM matters in preventing
the poorest farmers from realizing benefits from technology in Bihar.
I assign five points to STCMs that play a high role in preventing the poorest farmers from realizing
benefits from technology in an individual case study, two points to STMCs that play a medium role in an
individual case study, and zero points to STCMs that play little or no role in an individual case. I chose
this weighting-scheme because in my analysis, the importance of “high” values in preventing the poorest
farmers from benefiting from technology is significantly greater than the “medium” values. I then
summed the score for each STCM, and divided each sum by the modal score of all STCMs to develop a
ranked order of STCMs in terms of their importance in preventing the poorest farmers from benefiting
from agricultural technologies. In the weighted score, STCMs with a score greater than one, play a greater
than average role in preventing the poorest farmers from realizing benefits from technology. Likewise,
86 This is of course an assumption and by including more technologies in the analysis (or performing the analysis again with a different set of technologies) one could confirm (or reject) the findings here. Nonetheless, by using a purposive selection method, I argue that six case studies are sufficient to accurately capture a representative sample of the barriers preventing the poorest farmers from benefiting from technology in Bihar.

212
STCMS with a score less than one, play a below average role in preventing the poorest farmers from
realizing benefits from technology. The results ranked from most important to least are summarized in
Table 2.16 below.
Table 2.16: Ranked order of STCMs by importance.
I calculated raw scores by summing points across the six case studies, assigning five points to STCMs when they played a high role in preventing the poorest farmers from benefiting from a specific technology; 2 points when the STCM played a medium role in preventing the poorest farmers from benefiting from a specific technology; and zero points when the STCM played little to no role. The weighted score was calculated by dividing each raw score by the modal raw score for all STCMs (in this case 9). The scale runs from 0.2 to 2.3.
STCM Raw Score Weighted Score
Missing infrastructure 21 2.3 Misaligned incentives 19 2.1 Structure of land tenure regimes 10 1.1 Lack of financial assets 9 1 Lack of access to credit 9 1 Ineffective extension services 9 1 Corruption and security 7 0.8 Inappropriate technology design 7 0.8 Lack of individual farmer capacity 6 0.7 Weak capacity for collective action 6 0.7 Missing market linkages 2 0.2
The extent to which each of the STCMs is a barrier preventing the poorest farmers realizing the
benefits of technology is the main analytic outcome from this chapter. It is worth reiterating here that the
analysis ranks the STCMs in terms of the extent to which they prevent the poorest farmers from realizing
benefits from technology in Bihar. The analysis does not evaluate the extent to which the STCMs are
responsible for low aggregate yields or low contribution of agriculture to GSDP. For example, it is highly
likely that improving market linkages by building cold storage capacity and processing facilities in Bihar
would raise agricultural GSDP (lychee farmers would certainly benefit). This however was not the point

213
of the analysis. Rather, the study is specifically focused on the STCMs that prevent the poorest farmers
from realizing the benefits of technology.
These results are based on the results of six purposely selected case studies. They are thus
compelling, but not necessarily conclusive. Adding more case studies to the analysis would add more
certainty to the findings. Nevertheless, based on the six case studies, some interesting and unexpected
findings and hypotheses can be articulated.
Missing infrastructure is the biggest barrier preventing the poorest farmers from realizing greater
benefits from technology. The fact that missing infrastructure is a problem in Bihar’s agricultural system
will not be surprising to those already familiar with agriculture in Bihar. For example, Avinash Kishore,
an agricultural economist with IFPRI, former HKS PhD student, and native of Bihar, has noted on
multiple occasions that improving infrastructure and in particular electricity access is vital to unlocking
Bihar’s agricultural potential (Kishore, 2014; Kishore, Joshi and Pandey, 2015). This analysis confirms
his findings, but also goes beyond his findings and demonstrates that not only is infrastructure important
for overall productivity growth in the state, but it is also important for “inclusive growth”. In other
words, missing infrastructure (STCM 5) is also the most important barrier to the poorest farmers
benefiting from agricultural technologies. From a policy perspective, this finding supports investments in
infrastructure not only as a tool for growth in the agricultural sector, but also as a tool for inclusive
growth.
Perhaps more surprising is the large role of misaligned incentives (STCM 10) in preventing the
poorest farmers from benefiting from technology across case studies. Misaligned incentives played a high
role in preventing the poorest farmers from benefiting from solar irrigation pumps (SIP), the system of
rice intensification (SRI) and drip irrigation (MIS). Misaligned incentives also played a medium role in
the electric motor pump (EMP) and improved seed variety (ISV) cases. The only case where misaligned
incentives was not a barrier for the poorest farmers was the case of rubber-walla pipes (RWP). In the SIP

214
case, this STCM played out through two separate institutional mechanisms. First, the BREDA scheme
was advertised to farmers through newspapers and interactions with extension officers who were more
likely to offer the limited number of subsidized SIP units to wealthier farmers. Second, the requirement
under the BREDA subsidy scheme that recipients own at least one acre of land, automatically excluded
the poorest farmers. Likewise, in the SRI case the design of the subsidy which incentivizes farmers to use
SRI by giving them seeds, even though the physical dimensions of the technology requires fewer seeds,
raised questions about the institutional structure of the subsidy program among the poorest farmers who
practice SRI without the benefits of the subsidy. Instead, these farmers argued that the subsidy should be
re-designed to offer more intensive extension support in the field and to ensure farmers had the physical
weeders which are the only expensive input in the practice of SRI. Even in the case of ISVs, the poorest
farmers were limited in their ability to benefit from the subsidy program because of the quantity of seeds
provided under the subsidy program. This could easily be re-designed so that the ISV subsidy targets
seeds in the quantities most appropriate to the poorest farmers (one to two kg).
The importance of misaligned incentives in the ranking of STCMs (see Table 2.12 above)
suggests that in Bihar, re-designing the institutional components of agricultural policies is one of the most
important interventions for ensuring that the poorest farmers realize greater benefits from technology. In
other words, after investments in infrastructure, the key strategy for ensuring the poorest farmers benefit
from agricultural technology, is improved institutional design. This should be done in order to re-structure
the incentives of actors across Bihar’s agricultural system to better meet the needs of the poorest farmers.
Misaligned incentives and the importance of institutional design is an STCM that to date has had
limited discussion in the agricultural systems and development literatures. For example, even the papers I
draw on in Section 2 in order to demonstrate the relevance of misaligned incentives (STCM 10), usually
do not explicitly identify the STCM by name, rather the misalignment of incentive structures is latent in
their findings and discussion. However, the findings from this chapter, as well as the other two chapters in

215
this dissertation, underscore the value of institutional design in improving the functioning of the
innovation system to meet the needs of the poorest farmers.
Improving institutional design to meet the needs of the poorest farmers will require taking into
account the complex sociotechnical circumstances facing the poorest. This is not an easy feat.
Nevertheless, in a state like Bihar it may in fact be a more manageable task for policy makers than fixing
the structure of land tenure regimes (STCM 9), another STCM which plays an important role preventing
the poorest farmers from realizing greater benefits from technology – but one that for political reasons
may not be easily soluble.87
Finally, the role of lack of capital assets as an important STCM is unsurprising given that it is
also the feature that defines the population of interest in the study: the poorest farmers. What is surprising
is that it is not the most important STCM and that investments in infrastructure (especially if there are
rules and safeguards in place to target this infrastructure at the poorest), as well as improved alignment of
incentives in the innovation system, can benefit the poorest even under highly capital constrained
conditions.
2.7.1 STCM 1: Lack of Financial Assets (Score 1)
Lack of financial assets, with a score of 1 (the modal score), played an average role in blocking
benefits to the poorest across the six case studies. STCM 1 was a high barrier in one case – SIP. In the
MIS and EMP cases, STCM 1 was a moderate barrier. However, in three of the six cases, lack of financial
assets was not a barrier.
87 Recall that after his election Nitish Kumar commissioned a report on land reform, but then essentially tabled it because it was not politically tenable (Bandyopadhyay, 2009). Even Lalu Yadav, the champion of lower caste empowerment was unable to enact real land reform in the State. This is not to say that land reform would not be highly beneficial to the poorest farmers, but as my former advisor John Briscoe always said: “Do not let the best become the enemy of the good.”

216
In the SIP, MIS and EMP cases, the mechanism through which this STCM operates is largely
straightforward – lack of capacity to afford the upfront cost of investment in the technology. In the EMP
case, the high capital costs also include the borewell and the electrical wiring which is usually required as
a co-investment with the EMP. While the EMP itself is not particularly expensive, the borewell and
wiring make the EMP outside the financial reach of the poorest farmers.
In contrast to the SIP, MIS and EMP cases, lack of financial assets operates different in the RWP
case. In the RWP case, the poorest farmers likely benefit more from RWP relative to their wealthier
neighbors even when they lack the financial assets to invest in the technology at the same rates as their
wealthier neighbors. This is due to the way in which RWP reduces transaction costs in groundwater
markets, making it easier for the poorest farmers to benefit from these markets. The physical dimensions
of the RWP technology actually help to overcome lack of financial assets (STCM 1).
In contrast, the physical dimensions of a technology like SIP will almost certainly be beyond the
financial capacity of the poorest farmers. However, institutional experiments including ones being
conducted in Bangladesh, show how the institutional dimensions of a capital intensive technology like
SIP, can be re-designed to benefit the poorest farmers (ICIMOD, 2015).
By definition, the poorest farmers lack financial assets to invest in agricultural production, and are
therefore likely to be more risk adverse (Yesuf and Bluffstone, 2009; Dercon and Christiaensen, 2011).
The important insight about STCM 1 from these case studies is that while lack of financial assets defines
the poorest farmers and certainly limits their ability to benefit from technology, there are both specific
physical characteristics of technology (e.g. rubber pipes) and specific institutional characteristics (e.g.
NGO led SIP program design) that overcome this STCM. Moreover, at least three other STCMS play an
even larger role in preventing the poorest farmers from benefiting from technology, offering some
insights into the multiple pathways available to increase the well-being of the poorest farmers in Bihar.

217
2.7.2 STCM 2: Inappropriate Technology Design (Score 0.8)
Inappropriate technology design, with a score of 0.8, played a below average (modal) role as a
barrier limiting benefits to the poorest farmers across the six case studies. The only case in which STCM
2 played a high role was the MIS case. In the SIP case, STCM 2 played an intermediate role. In all other
cases STCM 2 played no significant role.
In both the MIS and SIP cases, specific selection decisions about technology make the physical
dimensions of these two technologies as incarnated in Bihar, inappropriate for the poorest farmers. The
sociotechnical approach demonstrates that the technology design in each of these cases is not intrinsic to
the general concept of the technologies, but rather is a product of inappropriate design standards selected
by actors at the selection stage of the innovation process. Both SIP and MIS technology have the potential
to be re-designed so that their physical dimensions better meet the needs of the poorest farmers in Bihar.
The barrier to doing this is not in the physical attributes of the technology itself, but in the requirements
that farmers, government policy makers and other actors demand from the engineers and private sector
businesses who design the physical specifications of these two technologies.88
Overall, it is perhaps surprising that inappropriate technology design did not play a greater role in
limiting benefits to the poorest farmers across the six case studies. This finding calls into question some
of the key messages of the appropriate technology and even the local innovation literatures. Indeed,
effective technologies for wealthier farmers (at least in the context of Bihar) tend to be effective
technologies for the poorest farmers as well.
88 Note that a similar story could be told for the direct-wheat seeding machines currently subsidized by the Bihari government. The machines are far too large for the average landholding. Yet this is nothing more than a design choice. Models of similar machines exist that are more appropriate for the poorest farmers, but these are not the ones subsidized by the government.

218
2.7.3 STCM 3: Missing Market Linkages (Score 0.2)
Missing market linkages, with a score of 0.2, was the least important barrier preventing the poorest
farmers from realizing greater benefits from technology out of the 11 STCMs identified in this Chapter.
The only case study in which STCM 3 played an intermediate role was the case of MIS. In all other cases,
STCM 3 played no significant role.
In the MIS case, missing market linkages played an intermediate role in limiting benefits of this
technology to the poorest farmers. The reason that missing market linkages matter in the case of drip
irrigation is because for poor farmers, this technology is used with vegetable or horticultural crops. Both
of these crops are perishable and when grown at scale, require market linkages to sell the crops without
creating market gluts that decrease the price farmers receive for their crop on the market. However,
because there is limited observable instances of poor farmers using MIS in Bihar, evidence of this STCM
was limited to a few NGO pilot programs that supported farmers in adopting MIS. These NGO-led
programs found they needed to link poor farmers with markets to sell their crops in order for their drip
irrigation pilots to be successful. If only one farmer in a village has MIS, the impact of MIS on vegetable
yields would likely not be enough for this to matter, but in villages where the NGO has linked multiple
farmers with drip irrigation, access to markets become an issue.
Apart from the small role missing market linkages played in the MIS case, this STCM was not an
important barrier in limiting benefits to the poorest farmers. At the same time, missing market linkages
likely depresses overall yields and agricultural GSDP in Bihar. However, investments in market linkages
on the part of the government or other actors may actually result in negative consequences for the poorest
farmers. There are two reasons for this. First, the poorest farmers consume privately a significantly
higher proportion of their production. Therefore, only a fraction of their overall production enters the
supply chain and any public-sector investment in market linkages would bypass the poorest farmers.
Second, in Bihar where widespread caste and wealth based discrimination is still deeply entrenched,

219
wealthier farmers actively work to exclude the poorest farmers from the benefits of the government
procurement programs that do exist. Local elites responsible for administering government procurement
programs at the block level were transparent in interviews that they ensure their family and friends benefit
from limited procurement programs over and above other farmers in the region.
While investments in market linkages and government procurement may raise the overall
incentive of Bihar’s farmers to invest in yield improving technologies, the benefits would likely accrue
disproportionately to the wealthier farmers. While it may be an important investment strategy for the
state, it should not be confused with a strategy that will benefit the poorest farmers and indeed may drive
even greater wedges in intra-village and intra-regional inequality.
2.7.4 STCM 4: Lack of Access to Credit (Score 1)
Overall, lack of access to credit, with a score of 1, played an average (modal) role as a barrier
preventing the poorest farmers from realizing benefits from technology. STCM 4 played a high role in the
SIP case and a moderate role in the MIS and EMP cases.
In the SIP case, while there are multiple reasons that the poorest farmers are unable to benefit
from this technology in Bihar, one reason is certainly lack of access to credit. I saw direct evidence of this
while observing a workshop led by NABARD (National Bank for Agriculture and Rural Development)
officials who had flown in from Delhi and local bank lending officers. The NABARD staff came to Patna
to try to encourage local bank officials to extend loans to farmers for their new SIP scheme and were
holding the workshop to educate bankers about SIP systems to improve the likelihood that they would
provide loans for SIP investments. The NABARD officials described an elaborate program to ensure that
farmers with small landholdings could also benefit from the subsidy program (including waiving the need
for collateral when several small farmers formed a joint liability group). Despite NABARDS effort to
come up with an institutional design suitable to the needs of the poorest farmers, the bankers all expressed
220
reluctance to lend to poor farmers. Their reasons included not only the lack of credit history or collateral,
which were both significant factors, but also the logistical challenge of banks sending staff to visit poor
farmers in remote areas to verify details of the loan.
Similarly, in the MIS case, the MIS distributers cited concerns that poor farmers would not be
eligible for bank loans nor could they afford to pay for the technology in cash, as reasons for not
marketing their technology to the poorest farmers (recall in the case of MIS much of the outreach and
extension is done by the private sector equipment dealers). However, this is likely only a minor reason
why the poorest farmers are not adopting MIS in Bihar. Multiple other STCMs are a greater barrier.
Similar mechanisms played out in the EMP case, where the capital restrictive investment for the
poorest farmers was the borewell necessary to use their own EMP. What connects the three cases – SIP,
MIS and EMP – is of course high up-front investments that are beyond the capacity of the poorest farmers
to afford without financial support. However, I believe that despite the modal score of this STCM,
improving access to credit would not overcome as many barriers as fixing other STCMs that also scored 1
(e.g. ineffective extension services). This is because farmers in Bihar tend to be credit-adverse. I was
amazed by the number of times Bihari farmers told me cautionary tales from other states about the
dangers of farmer indebtedness. The concerns about farmer suicides in Maharashtra and other states that
permeate left-wing development organizations were mirrored in the concerns of Bihari farmers. A general
trend amongst Bihar’s farmers was an unwillingness to go into debt.
The general aversion to loans on the part of farmers in Bihar, suggests that improving access to
credit in Bihar would help wealthier farmers, but may do little for the poorest farmers. This is both
because lending officers are reluctant to lend money where collateral and credit history is unavailable, but
also because poor farmers are unlikely to seek out loans in the first place.

221
2.7.5 STCM 5: Missing Infrastructure (Score 2.3)
Missing infrastructure, with a score of 2.3, was the biggest barrier preventing Bihar’s poorest
farmers from benefiting from technology in Bihar. As discussed in the introduction to this section, for
observers of Bihar’s agricultural system, the fact that missing infrastructure is hampering agricultural
growth is not a new finding. What is new is that missing infrastructure is also the biggest driver of
variance in benefits realized from technology between wealthier and poorer farmers.
Missing infrastructure was a high barrier in three out of the six case studies and an intermediate
barrier in the other three. There was no case where missing infrastructure played no role. The primary
way in which missing infrastructure impacts the poorest farmers is through access to water which
mediates their ability to adopt multiple potentially beneficial technologies. This is because the poorest
farmers are least likely to own their own wells; are the least likely to own or sharecrop high quality land
near streams or canals; are the least likely to live near transformers that allow them to adopt relatively
low-cost electric motor pumps as opposed to irrigating with diesel engines; bear greater social transaction
costs when buying water from farmers of wealthier socioeconomic backgrounds/castes; and have the least
available financial capital to purchase water from their neighbors or buy diesel to run their own
groundwater pumps.
There are some technologies that can help the poorest farmers overcome missing infrastructure
such as the physical dimensions of SIP and RWP. SIPs provide access to groundwater irrigation without
the need for an electrical grid. RWPs help farmers transport water longer distances with less labor.
However, the details of both of these case studies demonstrate how the physical dimensions of the
technology must align with both the institutional dimensions of the technology and the physical
characteristics of the local landscape in order for these technologies to be beneficial to the poorest
farmers. Too often this is not the case. In the SIP case, the institutional dimensions of the subsidy
program are biased towards wealthier farmers who are more likely to have the ability to provide their own

222
borewell which they are willing to devote exclusively to a SIP unit. The poorest farmers are unlikely to
own their own borewell which is a prerequisite to qualify for the subsidy program. This means that the
benefits of the generous SIP subsidy program are further skewed toward wealthier farmers.
The RWP case study shows that despite the significant benefits the technology has brought to the
poorest farmers by lubricating groundwater markets, this technology only goes so far. When
infrastructure is completely lacking as it is in Rajapur tola, the technology alone cannot overcome missing
infrastructure challenges.
Missing infrastructure, as the biggest barrier preventing the poorest farmers from benefiting from
technology in Bihar, is the barrier that should be addressed first by policy makers and other actors
concerned with improving well-being of the poorest farmers in the state. However, this STCM must be
addressed in ways that actually benefit the poorest farmers. As shown in Bathani, simply building a
transformer in a village is not enough to ensure the poorest farmers in the village realize benefits from
technology. Rather, the government should ensure that the transformer is located closer to poorer
households, so it is the wealthier households who pay a higher cost to purchase sufficient electrical wiring
to connect their own wells to the transformer. Alternatively, when a new transformer is built, the
government could subsidize the necessary electrical wiring to connect the transformer to the wells of
farmers with less than 1 acre of land or who belong to SC/ST households.
2.7.6 STCM 6: Ineffective Extension Services (Score 1)
Ineffective extension services, with a score of 1, played an average role in blocking benefits to the
poorest across the six case studies. SCTM 6 played a high role in the SRI case, and an intermediate role in
the SIP and MIS cases. It played no role in the other three cases.
The main way that this STCM acts as a barrier preventing the poorest farmers from benefiting
from technology, is through a general bias towards wealthier farmers by the extension agents. This is both

223
because extension agents show a greater level of respect towards wealthier farmers and because extension
agents recognize that their jobs will be easier if they work with wealthier farmers. Their implicit hope is
that if wealthier farmers in a community demonstrate a new technology, that this will generate ‘trickle
down’ adoption. As we saw in Bathani, while technologies do trickle within castes or even between castes
within a single tola, they do not trickle to the poorest farmers in a village who often live in separate tolas
and belong to the lowest castes.
When asked about their experience with different sources of information, farmers across
socioeconomic groups ranked state extension services very low as a trusted source of information (see
Appendix 2). This was especially true for the poorest farmers. The limited relationship between the
poorest farmers and the extension services is an important barrier preventing the poorest farmers from
realizing greater benefits from technology in Bihar. This is especially true for programs that include
subsidy support (including SIP, SRI and MIS) as these programs are much more likely to be targeted at
wealthier farmers. In the other three cases (EMP, RWP and ISV), ineffective extension services were not
an important driver of variance, largely because the private sector and other farmers are the main actors
responsible for “last-mile” delivery of these technologies. The poorest farmers feel comfortable
approaching local input suppliers for information and are happy that the growing number of input supply
businesses in Bihar means that competition is increasing the quality of information and technology
available in the market.
For many technologies, the private sector is able to fill the void left by ineffective extension
services. In the SIP, SRI and MIS cases this is not the case, but for different reasons. In the SIP case,
extension services played an overtly biased role, using the SIP subsidy program as a way to generate rents
for local officials through bribes and the social connections that come with connecting local elite farmers
with a flashy piece of technology. In contrast, in the SRI case, the degree of overt corruption was less.
Rather, extension officers are under pressure to stimulate adoption of the technology given the high-

224
stakes of Bihar’s 144-million-dollar investment into SRI. At the same time, supporting farmers to adopt
the technology is time intensive. Extension agents thus rationally target their efforts at wealthier farmers
who they believe have the capacity, including access to water and education to adopt the new practices
more easily. For this reason, wealthier farmers are significantly more likely to receive both the subsidy,
as well as training visits from extension agents. In the MIS case, ineffective extension services played a
relatively minor role as most of the extension is done by the private sector. However, in Bihar (unlike in
other states with more robust drip irrigation subsidy programs (see Chapter 4)) some extension is still
done by state extension officers and programs run through RAU which are financed by the government.
Observing a MIS training visit by university agronomists from RAU in North Bihar, I watched as they
selected the wealthiest farmer in a village to host a demonstration plot (for which he received the MIS
equipment at no cost). Then the agronomists proceeded to discuss the design of the MIS system only
with other wealthy farmers in the village, as less wealthy farmers walked by on a nearby road without
being invited to the conversation.
2.7.7 STCM 7: Lack of Individual Farmer Capacity (Score 0.7)
Lack of individual farmer capacity, with a score of 0.7, played a below average role as a barrier
preventing the poorest farmers from realizing greater benefits from technology across the six case studies.
STCM 7 was a moderate barrier in the SIP, SRI and MIS cases. It was not a barrier in the EMP, RWP and
ISV cases.
Lack of individual farmer capacity (STCM 7) often plays out through unexpected mechanisms. In
the MIS case for example, the mechanism preventing the poorest farmers benefiting from the technology
was the lack of willingness of private sector dealers to engage with the poorest farmers. This is in part due
to the lack of individual capacity of the poorest farmers which results in increased time investment
required to train them to use complex MIS systems (regular maintenance of MIS equipment, especially

225
higher cost MIS equipment, is essential and leads to technology disadoption if farmers are not properly
trained, which often requires follow-up visits by dealers even for highly skilled and educated farmers).
However, this is a secondary concern for the dealers, whose primary aversion to working with the poorest
farmers is their smaller landholding size, which means their commission per unit and time investment in
selling the technology is significantly lower.
In the case of SIPs, it is not the lack of capacity on the part of poorest farmers to operate the
technology where this STCM plays a role (in fact this technology once installed is simple to operate for
all farmers). Rather, it is that the poorest farmers are significantly less likely to read the newspaper and
feel empowered to directly approach agricultural extension officers to apply for the subsidy.
In the case of SRI, the mechanism through which STCM 7 operates is more straightforward. SRI is
a complex set of practices to adopt and requires support from NGOs or state extension officers to help
farmers master the new practices. State-run extension programs have published most of the material that
promotes SRI in written documents, which are less helpful to the poorest farmers who also tend to lack
the capacity necessary to decipher the material. NGOs have been more successful teaching farmers SRI
through hands-on field training. Digital Green, a larger NGO based in New Delhi, has even developed
video-based training material available through smart phones, as well as small portable projectors that
extension agents can carry.
Overall, what is important about STCM 7, is that it does have a meaningful effect preventing the
poorest farmers from realizing benefits from technology, but the pathways through which it operates are
complex and often have interaction effects with other STCMs. Overall, the physical dimensions of most
technologies are not intrinsically too difficult for farmers with limited education to use effectively.
Instead, the institutional dimensions supporting widespread use of the technology exclude the farmers
with limited capacity.

226
2.7.8 SCTM 8: Weak Capacity for Collective Action (Score 0.7)
Overall, with a score of 0.7, weak capacity for collective action (STCM 8) played a below average
role as a barrier preventing the poorest farmers from realizing greater benefits from technology across the
six case studies. STCM 8 played a moderate role in SIP, SRI and EMP cases. It played no role in the MIS,
RWP and ISV cases.
The clearest example of lack of capacity for collective action as a barrier preventing the poorest
farmers from realizing greater benefits from technology comes from an EMP example in Surka tola. Soon
after the three-phase transformer was installed in Surka, many of the male heads of households in Surka
met to discuss how to jointly fund the necessary capital investment to bring electrical wiring from the
transformer to the center of Surka’s agricultural lands. This type of collective action would have been
unlikely to develop in Erki and next to unfathomable in Rajapur. It also meant that the benefits from the
electricity in the form of the ability to quickly adopt EMPs, were quickly concentrated in Surka tola and
not where the poorest farmers lived in Rajapur.
In the case of SRI, collective action is a barrier preventing the poorest farmers from benefiting
from the technology because inter-village coordination benefits all farmers practicing SRI. Under SRI
methods, sharing labor and equipment is important. Stronger capacity for collective action in a
community is helpful because it allows for coordination in sharing of conoweeders and organizing shared
labor. It is for this reason that PRAN, the NGO that has been so successful in promoting SRI in Gaya
district, emphasizes collective action in the design of its training and support programs. In Surka, farmers
practicing SRI were very involved with their neighbor’s agricultural processes and coordinated their
schedules around one another. Similar collective action dynamics would be much less likely to arise in
Rajapur and Erki where networks between households are loose.
Overall, weak capacity for collective action is not a higher order priority barrier to overcome in
order to support the poorest farmers in realizing greater benefits from technology. This is interesting

227
because it is a barrier that has received significant treatment in the agricultural systems literature after the
spotlight put on collective action for positive sustainable development outcomes, by the Nobel Prize
winning economist Elinor Ostrom (Ostrom, 1990; Schlager and Ostrom, 1992; Markelova et al., 2009;
Hellin, 2012). What this analysis shows is that at some point, investments in collective action programs
are likely to have positive impacts on the ability of the poorest farmers to benefit from technology, but
until the higher order barriers such as missing market infrastructure and misaligned incentives are
addressed, investments on the part of donors and NGOs in collective action are likely to result in limited
overall benefits.
2.7.9 STCM 9: Structure of Land Tenure Regimes (Score 1.1)
Structure of land tenure regimes, with a score of 1.1, played a slightly above average role in
preventing the poorest farmers from realizing greater benefits from technology. While this STCM did not
play a role in blocking the poorest farmers from realizing greater benefits from technology in any single
case, it played an intermediate role in driving variance in five out of the six cases. The sole exception was
the RWP case.
The mechanism through which STCM 9 operates in Bihar is limitations on access and incentives
to adopt technology for landless farmers who grow crops on a sharecropping basis (occasionally, farmers
also lease land but sharecropping is more common). Sharecroppers lack title over the land they cultivate
and are therefore ineligible for most government subsidy programs. This applies to the SIP, MIS, SRI and
ISV cases.
One example of creative policy design to realign incentives and mediate the impact of the current
structure of the land tenure regime on the poorest farmers’ ability to benefit from technology, came from
a government official in the Gaya district. In this example, the newly appointed District Agricultural
Officer, Mr. Mahatto, told me that instead of requiring formal proof of land tenure to receive a diesel

228
subsidy in drought years, the agricultural officer decided to offer the subsidy to sharecroppers and other
farmers without official land titles (S. Mahatto, Director of Agriculture Gaya District, personal interview,
December 23, 2013).89 To do this, he created his own set of rules for eligibility for the drought-induced
cash transfer including requiring that two neighbors, in addition to a local agricultural officer, sign their
name on the back of the diesel receipt, affirming that the diesel was used for irrigation. This is an example
of local institutional experimentation to better meet the needs of the poorest farmers. Unfortunately, it
was impossible for me to verify whether this extension official had made the story up for my benefit
(knowing my interest in poverty) or if this program had been effectively implemented. At any rate, it is an
example of the type of creativity that is required to design programs and policies that do not inadvertently
exclude the poorest farmers. This may be especially important for overcoming the barriers created by the
structure of the land tenure regime in a state where direct land redistribution is unlikely.
As discussed in the introduction to this section, the finding that the structure of Bihar’s land tenure
regimes prevents the poorest farmers from realizing greater benefits from technology is not surprising. A
large literature details the negative impacts on investments and conservation of poorly designed and
enforced land tenure regimes (Meinzen-Dick and Gregorio, 2004; Meinzen-Dick, 2011). What is perhaps
useful from this analysis is that while structure of land tenure regimes matters, it may not matter as much
for improving the benefits the poorest farmers realize from technology, as improving infrastructure and
re-designing policies to better target the poorest farmers. This is helpful in a state like Bihar, where land
reform is the third rail of politics and unlikely to proceed.
89 The official requirement in the state-wide diesel subsidy, designed to go into effect when drought was officially declared at the district level, required proof of land tenure (see discussion in Kishore et al., 2015 for more on the design of the conditional cash transfer program).

229
2.7.10 STCM 10: Misaligned Incentives (Score 2.1)
Misaligned incentives, with a score of 2.1, was the second most important barrier preventing the
poorest farmers from realizing greater benefits from technology in Bihar. STCM 10 played a high role in
the SIP, SRI, MIS cases, and an intermediate role in the EMP and ISV cases.
In the SIP case, this STCM played out through two separate institutional mechanisms. First, the
BREDA scheme was advertised to farmers through newspapers and interactions with extension officers
who were more likely to offer the limited number of subsidized SIP units to wealthier farmers. Second,
the requirement under the BREDA subsidy scheme that recipients own at least 1 acre of land,
automatically excludes the poorest farmers.
In the SRI case, the design of the subsidy program which is intended to incentive farmers to use
SRI, is flawed. This is because the physical dimensions of SRI require fewer seeds than traditional
management practices. This “institutional flaw” was raised by focus groups of SC/ST female farmers who
practice SRI without benefits of the subsidy. These farmers argued that the subsidy program should be re-
designed to offer more intensive hands-on training in the field specifically targeted at poor farmers, and to
ensure the poorest farmers had the physical weeders (conoweeders) which are the only expensive input in
the practice of SRI. As further evidence of misaligned incentives under this SRI subsidy program, only a
small fraction of the 144-million-dollar budget was devoted to conoweeders, whereas most of the budget
was earmarked for the ineffective subsidy packages comprised of seeds and fertilizer.
In the MIS case, the design of the subsidy program attempts to add greater incentives for the
poorest farmers by giving small and marginal farmers an additional 10% subsidy. However, the 10%
incentive is targeted at the poorest farmers rather than the equipment dealers who are responsible for “last
mile” technology delivery. Because equipment dealers prefer to work with wealthier farmers where their
profits are higher, the poorest farmers never learn about MIS in the first place. In order for the poorest
230
farmers to realize greater benefits from MIS, equipment dealers would need to be offered their own
incentives for working with the poorest farmers.
In the EMP case, the mechanism through which misaligned incentives manifests is somewhat
speculative on my part. In my travels through Bihar, there seemed to be a clear pattern of transformers
being built closest to the wealthiest neighborhoods in villages when the grid was extended. This increases
the costs for the poorest farmers in extending wires from the transformer to their land, which they must
pay for themselves. If the Bihari government were to direct engineers to install site transformers closest to
the poorest tola, it could significantly change the distribution of benefits from increased use of EMPs in
Bihar.
In the ISV case, the poorest farmers were limited in their ability to benefit from the subsidy
program because of the size of the bag of seeds provided under the program. This could easily be re-
designed so that the ISV subsidy targeted seeds in the quantities most appropriate to the poorest farmers
(one to two kg).
In summary, what I mean by misaligned incentives, are cases where the institutional rules or
norms undergirding institutional dimensions of a technology are biased towards wealthier farmers. In
these cases, slight changes in institutional design has the potential to realign incentives for different actors
in the sociotechnical regime, decreasing the barriers that prevent the poorest farmers from benefiting from
the technology.
2.7.11 STCM 11: Corruption and Security (Score 0.8)
Corruption and security, with a score of 0.8, played a below average role in preventing the
poorest farmers from realizing greater benefits from technology. STCM 11 played a high role in the SIP
case and an intermediate role in the EMP case.

231
In the two cases where corruption and security (STCM 11) prevents the poorest farmers from
benefiting from technology, the mechanism through which the STCM operates is low-level corruption on
the part of government staff. Despite substantial overall improvements in corruption and security in
Bihar since the election of Nitish Kumar, petty corruption remains widespread, especially at lower
bureaucratic and political levels. This corruption limits access for the poorest farmers to state provided
subsidies and other incentive schemes (e.g. SIPs). Similarly, as seen in the case of EMPs, the apparent
ability of wealthier farmers to influence the location of transformers within villages, also limits the
benefits of technology to the poorest farmers.
On the other hand, improvements in law and order in Bihar have improved the availability of
ISVs in the state, by encouraging private investment and competition. This has led to farmers across the
socioeconomic spectrum realizing increased benefits from ISVs. Improvements in law and order have
impacted wealthy and poor farmers’ access to ISVs in similar ways.
2.7.12 Summary: Policy Implications of STCM Approach
The analysis in Section 2.6 and 2.7 looked at a set of 11 STCMs as potential causal factors
preventing the poorest farmers from accruing greater benefits from agricultural technologies. By ranking
the STCMs in terms of their importance as barriers, the analysis identified both the higher and lower order
barriers that prevent the poorest farmers from benefiting more from agricultural technologies in Bihar.
The policy implication from this analysis, is that it makes little sense for policy makers and other
actors interested in improving the well-being of the poorest farmers to address lower order barriers such
as missing market linkages (score 0.2), before addressing higher order barriers such as missing
infrastructure (score 2.3) and misaligned incentives (score 2.1). In other words, as long as infrastructure is
a major barrier preventing the poorest farmers from realizing greater benefits from agricultural
technologies, improving the quality of state extension services or spending heavily on programs to
232
improve collective action capacity amongst the poorest farmers, will not have the intended outcome.
While such programs may result in some positive outcomes, they are not addressing the limiting barriers
preventing the poorest farmers from benefiting from agricultural technologies. Some seemingly useful
interventions such as investing in market improved market linkages may even have the unintended
consequence of benefiting those farmers who already have access to affordable irrigation, over those that
do not.
Once the biggest barriers have been addressed, many of the intermediate barriers including
structure of land tenure regime, lack of financial assets, lack of access to credit, and ineffective extension
services are closely clumped as barriers preventing the poorest farmers from benefiting from technology.
When STCMs are more closely clumped as barriers, there are several ways to think about strategically
managing these “clumped” barriers. First, it probably makes most sense to address barriers that are
clumped in terms of the cost or feasibility of addressing them. For example, in Bihar, despite many
attempts, reforming the land tenure system has proven politically impossible whether for populist leaders
like Lalu Prasad or technocratic leaders like Nitish Kumar. While structure or land tenure regimes, with a
score of 1.1, is the third most important STCM, it is also closely clumped with lack of financial assets,
lack of access to credit, and ineffective extension services, all of which scored 1 and all of which may be
easier to begin to address than the issue of land tenure in Bihar.
A second way to think about addressing closely clumped barriers is by looking for barriers that
are the most ubiquitous across cases. While the most ubiquitous barriers might not create the largest
overall barriers, they create some barriers across many cases and are therefore worth addressing. From a
feasibility standpoint unfortunately, after missing infrastructure, structure of land tenure regimes is the
most ubiquitous barrier, which I already discussed is one that has proven difficult to address. However, in
other contexts, it may be useful for policy analysist to think about the implications of not only addressing
the largest average barriers, but also the most ubiquitous.
233
The chapter concludes in Section 2.8 with a discussion of the contribution of this chapter to
innovation studies and the utility of the methodological approach used in this chapter to pursuit of the
Sustainable Development Goals.
2.8 Discussion
In this chapter, by developing a methodology for analyzing the barriers that prevent the poorest
farmers from realizing greater benefits from technology, I aimed to bring greater conceptual clarity to the
discussion of technology and poverty in the development literature. The global development agenda as
articulated by the UN Sustainable Development Goals (SDGs) encompasses 17 goals, almost all of which
will require the application of science and technology to achieve. While this dissertation focused
specifically on poverty rural agrarian settings, the methodology developed in this chapter is broadly
applicable to the challenge of making greater use of science and technology to analyze the distributional
outcomes of policies and programs aimed at meeting most, if not all of the SDGs. The methodology could
be used in other contexts such as reducing poverty in urban settings (the list of STCMs would of course
be different). It could also be used to look at the distributional implications of potential interventions in
other sectors, such as improving access to quality education (SDG 4).
Methods, like the one I developed in this chapter, for ensuring that scholarship and policy focus
specifically on the needs of the poorest in the context of the sustainable development goals are lacking.
As demonstrated in the literature review in Chapter 1, too frequently scholarship on technology and
innovation black boxes the issue of distributional impacts of both the physical dimensions of technology,
but especially the distributional impacts of the institutional dimensions of technology. I hope that the
approach presented in this chapter will spur scholars and policy makers to think more systematically
about the impact of technology policy, not only on aggregate benefits (measured in yield gains, income,
reduced drudgery of labor) but also on differential impact on the well-being of the poorest.

234
Substantively, this chapter identified the most important sociotechnical causal mechanisms
(STCMs) preventing the poorest farmers from realizing greater benefits from technology in Bihar. These
were discussed at length in Section 2.7. The ranking of STCMs in Bihar can be used by policy makers
and other actors interested in addressing rural poverty in Bihar. The methodological approach can also be
used in other contexts in order to study the distributional impacts of policies and interventions meant to
overcome barriers to technology adoption in the agricultural sector.
The sociotechnical approach introduced in this chapter combines a concern with who benefits
from technology, with a perspective on technology that includes both the physical and institutional
dimensions of technology “necessary to apply it on significant scale” (Brooks, 1980, p. 65). This
approach allows the explanations for the barriers preventing the poorest farmers from benefiting from
technology, to include a wide range of causal mechanisms that are more complex than many approaches
which either focus on physical (e.g. improved seed varieties, better tractors) or specific institutional
barriers (e.g. land tenure, market access).
By combining the analysis of STCMs with a sociotechnical approach that takes into account both
the institutional and physical dimensions of technology, the methodological approach used in this chapter
reveals the mechanisms behind the failure of the poorest to seize benefits latent in technology. What is
particularly interesting is that one of the two most important STCMS in the context of Bihar is misaligned
incentives (STCM 10). This STCM basically shows that many barriers facing the poorest farmers have to
do with the institutional design of incentives in a given innovation system. This STCM in many ways
encompasses the institutional dimensions of technology discussed in the sociotechnical approach and
shows the degree to which institutional concerns are a cornerstone enabling the poorest farmers to realize
greater benefits from technology. This may have implications for larger theory about technology adoption
and diffusion scholarship.

235
From a policy perspective, the STCM approach, by untangling the mechanisms behind the failure
of technology to benefit the poorest farmers, gives policy makers an opportunity to not only address the
most important barriers preventing the poorest farmers from realizing greater benefits from technology,
but also to intervene intelligently in a system where the mechanisms behind the specific barriers are also
more clearly understood.
In addition to the ranking of STCMs, there were two additional empirical findings from Bihar in
this chapter that are worth highlighting because they have broader relevance to the study of technology
and poverty.
First: In this study, I was unable to identify a technology that is explicitly “pro-poor” in that it
helps the poorest farmers more than other groups of farmers. There are several potential reasons why
these “pro-poor” technologies are missing in Bihar and potentially more broadly from the technology
space. The first and perhaps most obvious is that there is a demand-pull problem in the broader innovation
system: technologies that may be specifically “pro-poor” are simply not being invited and not being
selected. If this is the case, then designing demand generation mechanisms such as prize money to
incentivize actors at the invention and selection stages of agricultural innovation systems to focus on
explicitly “pro-poor” technologies, would be one policy solution. Another would be to prioritize the work
of actors like Anil Gupta and the Honey Bee Network (also discussed in Chapter 1) and search out local
innovations that the poor have created for themselves and help scale these technologies. In all likelihood,
both of these activities would increase the pool of “pro-poor” technologies available to farmers to some
degree. However, a second reason for the missing “pro-poor” technologies could be that the category of
“pro-poor” technologies is intrinsically empty. In other words, it may be that the poorest benefit most
from technologies that benefit all groups and that what is really required is not “pro-poor” technologies
per se, but rather institutional structures that help the poor access technologies which are generally
beneficial to all farmers. The case of SRI in Bihar helps illustrate this point. While SRI has the physical
236
characteristics of “pro-poor” technology, in the end, the institutional characteristics of the technology as it
interacts with local contexts leads to benefits accruing mostly to wealthier farmers in the system.
Second: In resource-poor contexts, the government – while playing a very important role in the
overall innovation system – often fails as a “last mile” actor to meet the needs of the poorest farmers. In
Bihar, government programs directly targeting the agricultural sector through “last mile” interventions
largely fail to help the poorest farmers, leading to increased rather than decreased inequality at the village
level. The relatively poor performance of the public sector in the “last mile” in Bihar, should not be taken
as an indication that the public sector has no role to play in reorienting agricultural innovation systems to
meet the needs of the poorest. Instead, what my analysis indicates is that the public sector is poorly suited
to act as a “last mile” actor connecting farmers to technology in the field. Instead, the strength of the
public sector in Bihar has undergirded improvements in the agricultural innovation system at other stages.
The public-sector expansion of the grid in Bathani and across Bihar has brought large benefits to all and
will likely unlock the potential of many technologies for the poorest. Improvements in law and order
which started at the highest levels of government, have led to the expansion of ISV availability in the
state which has benefited both wealthy and poor farmers alike. Yet, despite these findings, the bulk of
allocated spending in the 2008 and 2012 Agriculture Road Maps was for government programs that
focused on “last mile” activities and technology subsidy programs.90 This suggests that government
resources might be better allocated not only to different stages of the agricultural innovation system, but
even outside the agricultural sector where gains in security and energy access have greater secondary
benefits for the poorest farmers.
90 While the Agriculture Road Map budgets are not publicly broken down at a sufficiently granular level to calculate the exact percentage of spending on “last mile” activities, my best estimate based on publicly available data for the 2012 Agriculture Road Map was that at least two thirds of the budget was allocated to “last mile” activities.

237
This chapter also contributes directly to the innovation literature. In particular, it complements the
findings from the multi-level perspective (MLP) on innovation systems in the sociotechnical transitions
literature (Geels, 2002, 2004, as discussed in Chapter 1, Section 1.2.3). The sociotechnical transitions
literature argues that in order for new technological innovations to achieve scale, they need to overcome
barriers in path dependency created by both incumbent physical technologies, and social and institutional
systems that have developed alongside them. Sociotechnical transitions are thus seen as systems
innovations which involve several different physical technologies, in conjunction with institutional
change by a diversity of actors (Steward, 2012). In other words, the sociotechnical transitions literature
argues that for any new technology to reach widespread use, an alignment between the physical
dimensions and the institutional dimensions of technology(ies) is required.
In this chapter I demonstrated the applicability of a sociotechnical approach to the evaluation of
technology in the developing world. My findings across the six case studies showed that ensuring the
poorest farmers benefit from the fruits of technology innovation is not only about selecting the right
physical technology (getting the physical dimensions right) nor is it just about designing the right
incentive scheme (getting the institutions right). Rather, there is a need for a ‘fit’ between the physical
and the institutional dimensions of the technology, that align to meet the needs of the poorest.91 For
example, in the case of the System of Rice Intensification, while the physical dimensions of the
technology appear on the surface to meet the needs of the poorest farmers, the lack of infrastructure for
timely irrigation combined with the poorly designed subsidy program, concentrate the benefits of the
technology toward wealthier farmers. Likewise, in the drip irrigation case, while the physical dimensions
91 The idea of fit between institutional and physical dimensions while novel in the agricultural innovation systems literature is not novel to the literature in sustainability science more broadly. Oran Young’s insight that critical to global agreements to solve environmental challenges is a “fit” between the institutional dimensions of the global regime and the particularities of local context is similar in some ways to the need for fit between institutional and physical dimensions of technology. See for example Young’s 2002 book “The Institutional Dimensions of Environmental Change: Fit, Interplay, and Scale” (Young, 2002).

238
of the technology were not suitable for the needs of the poorest farmers, I discovered that the institutional
design of the subsidy program had explicitly selected higher cost drip irrigation systems at the expense of
lower cost drip systems that may have physical dimensions more appropriate for the poorest farmers.
The findings of this chapter not only confirm that the core findings of the sociotechnical
transitions literature are relevant to the developing world, they also extend the methodology used in this
literature by focusing on distributional outcomes borrowing tools from the methodological approach used
in this literature. I am unaware of any work in the sociotechnical transitions literature that explicitly
focuses on the distributional outcomes of technological change.
This chapter argues that a “transition” toward innovation systems that benefit the poorest requires
changes in the evolutionary pathways of agricultural technologies, that ensure both the physical and
institutional dimensions of technologies are designed in ways that the poorest can extract more well-being
from their widespread use. Focusing on an alignment between the institutional and physical dimensions
of technology allows an analyst to ask what needs to change in the innovation system to ensure that the
technology in question benefits the poorest. At times this may mean intervening at the invention or
adaptation stage of the innovation system, to tweak the physical dimensions of the technology or demand
entirely new technology. Or it may mean intervening in the broader sociotechnical regime to ensure better
access to infrastructure. Or it may mean intervening in the design of the institutional incentives to
promote technology adoption. Whatever the case, the sociotechnical perspective gives the analyst a much
wider lens with which to identify barriers and solutions to meet the needs of the poorest.
If technology is to achieve any human purpose, then from a sociotechnical perspective, there
needs to be a measure of fit between the institutional and physical dimensions of the technology. To
achieve the specific human purpose of helping the poorest, requires the alignment of physical and
institutional dimensions that gives the poor the ability to access and use these technologies in ways that
both reduce their risks and improve their well-being. Even though finding an alignment can be difficult, it

239
is also encouraging, as it means that most of the time, most technologies can benefit the poorest when the
physical and institutional dimensions are nudged in the right direction. For example, in the case of solar
irrigation pumps, while the technology is currently failing on both dimensions of variance discussed in
the introduction to Section 2.6 (benefits accrue to the wealthiest farmers and benefits to users are low),
the case study demonstrated that by slightly tweaking the physical and institutional dimensions of the
technology, the Government of Bihar could bring greater benefits to the poorest farmers. On the physical
side, the design of the solar irrigation pump system currently in use in Bihar should be modified to allow
quick conversion from SIP to a diesel engine (for use at night or under cloud cover). Also, on the
institutional side, by targeting the subsidy program at the poorest farmers (rather than allowing the
wealthiest farmers to capture all of the benefits), the thousands of SIP units that are already in Bihar could
be improving the well-being of the poorest, rather than languishing in the fields of the wealthy.

240
CHAPTER 3. The System of Rice Intensification: The challenges of technology selection for meeting the needs of the poorest farmers
3.0 Abstract
The System of Rice Intensification (SRI), is a technology for growing rice that emerged onto the
global stage in the early 2000s. SRI has an unconventional innovation history. It was invented by a
French Jesuit missionary working with local farmers in Madagascar in the 1980s. SRI consists of a set of
practices, including earlier transplanting and wider spacing of seedlings. In theory, SRI has the potential
to be a “pro-poor” technology because it increases yields while decreasing input costs, including for seeds
and irrigation. Many of the initial reports on SRI specifically argued that it was an appropriate technology
for “resource limited farmers” (Stoop, Uphoff and Kassam, 2002; Africare, Oxfam America and WWF-
ICRISAT, 2010).
However, almost as soon as SRI emerged on the global stage, the technology received virulent
pushback from the formal rice research community, including scientists at the International Rice Research
Institute (IRRI). The first part of this chapter analyzes the controversy surrounding SRI at the
transnational level. This section of the paper demonstrates several challenges at the selection stage of
innovation systems in prioritizing the needs of the poorest farmers and demonstrates how the established
rice research community engaged in boundary-work to protect their own epistemic authority (Gieryn,
1983). The second part of the paper grounds the discussion of SRI in a local context (Bihar, India) in
order to bring greater clarity and nuance to the debate around SRI and most importantly to understand if,
how, and under what conditions SRI is a “pro-poor” technology, as many of its proponents claim. The
paper finds, that while the physical dimensions of the technology have the potential to benefit the poorest
farmers, in Bihar, relatively wealthier farmers are benefiting more from SRI than their poorest neighbors.
The benefits of SRI are failing to reach the poorest farmers because of the limited and expensive access to
241
irrigation facing poor farmers in Bihar, but also because the institutional design of the government’s
support policy is not well-targeted at the poorest farmers. These findings demonstrate that even when the
physical dimensions of a technology are “pro-poor,” the ability of the poorest farmers to realize these
benefits requires reorienting the entire sociotechnical regime undergirding innovation systems towards the
needs of the poorest. The paper concludes that actors on both sides of the ‘rice wars’ fell victim to more
general challenges in the selection stage of agricultural innovation systems for meeting the needs of the
poorest farmers, including 1) propensity for silver bullet thinking; 2) failure to take into account variance
and uncertainty in local conditions, where all agricultural technologies are ultimately applied; 3) selection
of technology based on institutional incentives not aligned with the needs of the poorest farmers (e.g.
political and professional incentives). The paper offers some potential solutions drawn from science and
technology studies for overcoming the challenges of technology selection. These solutions include
institutionalizing greater reflexivity into innovation systems through greater focus on framing and
distribution (Jasanoff, 2003).
3.1 Introduction
On April 25th 2015, I sat in a conference center at in the Palaputra Hotel, one of the two more
upmarket hotels in Patna, the capital of India’s second largest (by population) and poorest (by absolute
poverty) state. The conference focused on rural development, a topic that had become a central concern
not only of the state itself but of outside actors, such as the World Bank and the Bill & Melinda Gates
Foundation, as well as researchers from Harvard and MIT, among other institutions. They had all flocked
to the state after the election of a new Chief Minister, Nitish Kumar, who promised a new era of
technocratic reform and the implementation of an evidenced based approach to development.
At 11:41 in the morning (Indian Standard Time), the conference center we were sitting in was
rocked by an earthquake with its epicenter in neighboring Nepal. Attendees quickly evacuated the

242
building without fuss and waited outside for under five minutes before returning to the conference. Our
experience of the earthquake had been relatively mild (we still had little knowledge of the devastation that
we would later hear about in Nepal) and it seemed best to proceed with the conference.
After such an experience, the group of conference attendees developed a greater level of
comradery and the tone of the conference became notably more informal. That is until a controversial
subject was raised in a question by one of the attendees. This subject, though not originally on the agenda,
sent the mood of the room downward into icy silence, pitting development expert against development
expert with unspoken disagreements. What controversial subject could have shifted the mood of a room
brought together by the mutual survival of an earthquake? The topic that so quickly transformed the
comradery in the room was one I was already familiar with – the Government of Bihar’s (GoB) strong
endorsement of and financial support for a controversial rice growing technology called the System of
Rice Intensification.
The System of Rice Intensification, also known as SRI, is a methods-based technology for
improving rice yields. Proponents of the technology claim that it increases rice yields, decreases input
costs, and saves water (Uphoff, Kassam and Harwood, 2011). Detractors worry that the substantial yield
improvements claimed by SRI proponents are unsubstantiated by rigorous field trials, and are concerned
that resources are being devoted to the technology at the expense of more time-tested methods,
specifically the development of improved seeds, such as high-yielding varieties (HYVs) and more
recently, genetic engineering approaches to improve seed varieties (Sheehy, Ferrer and Mitchell, 2008).
The question of how a technology that is primarily made up of a package of agronomic practices
without controversial genetic modifications or even chemical fertilizers could foster so much animosity in
an otherwise friendly environment, is one I will explore in depth in this chapter. It turns out that the
answer to this question illuminates several important and ongoing challenges for technology selection to
meet the needs of the poorest farmers.

243
There are three important findings that came out of this study. First, despite the fact that SRI has
been framed as a “pro-poor” technology, in Bihar, wealthier farmers realize significantly more benefits
from SRI than the poorest farmers. Second, the barriers preventing the poorest farmers from capturing
more benefits from SRI involve both physical and institutional dimensions of technology. And finally,
failure to understand interactions between the physical and the institutional dimensions of technology, and
the context specific opportunities and barriers facing the poorest farmers in Bihar, skews the benefits of
technology towards wealthier farmers.
I structure the chapter as fellows: In Section 3.2, I review the theoretical approach and data used in
the study. Analytically, I study SRI through the lens of innovation systems thinking, looking specifically
at the mechanisms and barriers that drive innovation for the poorest farmers across stages of the
innovation system, including invention, selection, initial adoption, adaptation, production, widespread
use, and in many cases retirement.
In Section 3.3, I analyze the history of SRI from its invention in Madagascar through its selection
by international civil society actors and adoption in over 50 rice growing countries worldwide.92 In
Section 3.3, I also discuss how the technology was promoted as a “pro-poor” technology by some actors,
while being ridiculed as “unconfirmed field observations” or “non-sense” by others (Stoop, Uphoff and
Kassam, 2002; Sinclair and Cassman, 2004; Sheehy, Sinclair and Cassman, 2005). My goal in Section 3.3
is to illustrate how the selection stage of agricultural innovation systems, primarily for technologies that
are “pro-poor,” is a particularly fraught stage of innovation systems in the transnational arena. To explain
92 Note that according to the SRI International Network and Resources Center based out of the Cornell International Institute for Food, Agriculture and Development, SRI has been demonstrated in over 50 countries. This does not mean that it is in widespread use in these countries. According to the SRI International Network and Resource Center, SRI has attained “notional policy support” and is “firmly established in multiple regions” in a number of countries including India, Cambodia and Vietnam. In addition, SRI has “broad institutional and government support; substantial farmer adoption in multiple regions” in an additional 10 countries in Sub-Saharan Africa and Asia. See SRI map here: http://sri.ciifad.cornell.edu/images/global/SRI_World_Map_2016.png

244
the challenge of technology selection, especially for the poorest, I draw on literature from science and
technology studies (STS), including literature on boundary-work and the demarcation of science from
non-science (e.g. Gieryn, 1983).
In Section 3.4, I shift my analytical lens from the transnational innovation system, to a specific
regional case study and discuss the selection of SRI in Bihar, one of India’s poorest states. This section
demonstrates that many of the controversies surrounding SRI in the transnational arena are mirrored at the
local level, with local political realities and incentives adding an additional dimension of conflict to the
conflicts over power and resources discussed at the transnational level.
In Section 3.5, I discuss my findings from a mixed methods study of the impact of SRI in Bihar.
The findings are based on my own survey data, focus group interviews, and ethnographic work in Bihar,
undertaken between 2011 and 2016. The findings from my research in Bihar further demonstrate the
challenge of technology selection for the poorest farmers, and show that even when a technology’s
physical dimensions are “pro-poor”, that without an alignment between the physical and institutional
dimensions of the technology and local context, that the “pro-poor” potential may not be met.
I conclude in Section 3.6 with a discussion of the challenges of technology selection for the
poorest farmers. In the case of SRI, actors for and against the technology fell victim to a number of what I
argue, are more general challenges in the selection stage of innovation systems, aimed at meeting the
needs of marginalized and impoverished communities including: 1. The tendency of actors to engage in
“silver bullet” or “panacea” thinking; 2. The failure to properly understand the relationship between
general principles and the complexities and uncertainties of local context; 3. The selection of technology
based on professional and political incentives not aligned with the needs of the poorest farmers. Finally,
drawing on literature in organizational studies and science and technology studies, I offer some
reflections on approaches for reorienting the institutions at the selection stage of the innovation system to
overcome the challenges identified in the chapter.
245
3.2 Theory and Data
3.2.1 Theory: Using Innovation Systems as an Inductive Approach
As discussed in Chapter 1, the overarching goal across the three empirical studies in this
dissertation is to understand the barriers preventing the poorest farmers from realizing greater benefits
from agricultural technology. The second chapter looked at this question across a wide-range of
technologies, focusing on the sociotechnical causal mechanisms (STCMs) preventing the poorest farmers
from accruing greater benefits from these technologies. This chapter takes a different approach. The
chapter is a deep dive into the innovation system of a single technology that has been promoted by many
NGOs, donors, academics, and governments as a technology that is a priori “pro-poor”. By studying the
innovation system of a “pro-poor” technology, the chapter identifies challenges in the innovation system
that may be specific to, or at least more likely to arise in, the context of this type of technology.
Methodologically, I use an innovation systems approach to analyze the case of SRI. The
innovation systems approach is an inductive method of analysis. As discussed in Chapter 1, innovation
takes place within a complex system, which includes the actors and institutions that shape innovation
processes across different sectors and scales (Lundvall, 1992; Nelson, 1993). Improving the well-being of
the poorest farmers almost certainly requires knowledge and technology appropriate to the conditions of
the poorest farmers.93 This knowledge and technology must be invented whether in laboratories or in
farmers’ fields; selected, whether by private companies, state extension services, or NGOs; produced,
whether by governments, private companies, or other actors and groups of actors; adopted, whether by
93 This is especially true if farmers are unable to expand their landholdings This idea is generally discussed as extensification vs. intensification. If farmers are able to expand their landholdings (extensification), then they can continue to produce more irrespective of improved knowledge and technology. But if farmers are limited to a specific piece of land, the only way to increase their production or income to keep pace with inflation, growing families, and more generally increasing global food demand is to adopt new knowledge and technology (intensification).

246
farmers themselves or, in the case of supporting infrastructure, by governments and other entities;
adapted, whether by farmers, other actors in the innovation system, or a partnership of both; and finally,
put into widespread use (Anadon et al., 2014; Harley, Holbrook and Clark, 2015).
Using this perspective, the chapter treats technological innovation as a complex system with
overlaps and feedback loops between different stages of the system, including invention, selection,
production, adoption, widespread use, adaptation and retirement (see Figure 3.1) (Anadon et al., 2014).
Figure 3.1: Simplified heuristic model of an innovation system.
Source: (Adapted from Anadon et al., 2014)
In the chapter, I use the innovation systems approach, developed by the Initiative on Innovation
and Access to Technologies for Sustainable Development94 at Harvard Kennedy School (of which I was
the agriculture sector lead), as a structured inductive approach for unpacking the SRI case study. Using
this inductive approach, I identify the selection stage in the SRI case as the most analytically interesting
because of the novel and under-studied barriers to innovation for the poorest farmers that the case
94 More information about the Project on Innovation and Access to Technologies for Sustainable Development can be found here: https://www.hks.harvard.edu/centers/mrcbg/programs/sustsci/activities/program-initiatives/innovation/projects/innovation-and-access-to-technologies-for-sustainable-development

247
highlights. This is not to say that other stages of the SRI’s innovation system are not interesting, and I
discuss many of them in detail, but the case focuses on the challenges of technology selection because this
focus offers the most analytically rich insights, with respect to the overarching research question of the
dissertation—understanding how and why the poorest farmers benefit (or fail to benefit) from agricultural
technology innovation.
Using the innovation systems framework to interrogate the SRI case, several important themes
emerge that link to larger literatures in science and technologies studies, sustainability science, and public
policy. First, the concept of boundary-work is analytically useful both for understanding the causes of the
controversy over SRI and for understanding the efforts to bring social-scientific closure to the virulent
debates surrounding the technology. Thomas Gieryn defined “boundary-work” in a 1983 paper in the
American Sociological Review as the “demarcation of science from other intellectual activities” and
identified boundary-work as a “practical problem for scientists” (Gieryn, 1983, p. 781). He argued that
scientists engage in boundary work in “pursuit of professional goals: acquisition of intellectual authority
and career opportunities; denial of these resources to “pseudoscientists”; and protection of autonomy of
scientific research from political interference” (pp. 781). In section 3.3.4, I demonstrate how Gieryn’s
idea of boundary-work is particularly useful for understanding the causes of the virulent debate
surounding SRI.
Related scholarship on boundary-work from the sustainability science literature is also useful for
understanding other aspects of the SRI case. This literature widens the definition of boundary-work
beyond the demarcation of science from non-science identied by Gieryn, and uses the concept as an
analytical lens through which to better understand the interface between science and policy (Jasanoff,
1991; Guston, 2001; Clark et al., 2016). Clark et al. (2016, p. 4615) show how since Gieryn, the
definition of boundary-work has been fruitfully expanded, arguing that “[t]he central idea of boundary
work is that tensions arise at the interface between communities with different views of what constitutes
248
reliable or useful knowledge…Active boundary work is therefore required to construct and manage
effectivly the interfaces among various stakholders engaged in harnessing knowledge to promote action.”
For clarity’s sake, I will call this second type of boundary work “mediating boundary-work.” In section
3.3.5, I show how the World Bank engages in mediating boundary-work in an effort to bring social-
scientfic closure to the debate over SRI.
In the discussion in section 3.6, I draw on the literature on reflexivity in public policy,
organizational studies, and science and technology studies, to discuss policy relevant insights for
overcoming some of the challenges of technology selection for the poorest farmers identified in this
chapter. I show how early work in organizational behavior by Chris Argyris (1976) identified some of the
organizational causes of the controversy that arose around SRI. Argyris’ work also began to hint at some
institutional solutions to the problems he identified, focusing on institutionalizing greater reflexivity or
“double loop learning” in organizations. Later work in public policy and development studies by Matt
Andrews, Lant Pritchett, and Michael Woolcock further articulates policy solutions that I argue could be
effective at overcoming some of the challenges of technology selection for the poorest farmers identified
in the SRI case (Andrews, Pritchett and Woolcock, 2017).
Finally, I conclude drawing on Sheila Jasanoff’s argument that “[t]he design of technology is
likewise seldom accidental; it reflects the imaginative faculties, cultural preferences and economic or
political resources of their makers and users” (Jasanoff, 2004, p. 16). The SRI case shows how actors in
the SRI innovation system attempt to define the boundaries of what constitutes appropriate knowledge
making in order to control the cultural imagination of what constitutes the future of rice research and
technology. This is an effort – previously identified in the science and technology studies literature – to
establish their own “right to interpret science,” often in ways that further their own professional interests
(Jasanoff, 1987, p. 195). This argument, of course, is similar to Gieryn’s idea of boundary-work, but
Jasanoff goes a step further to identify a set of tools or “technologies of humility,” that can help decision
249
makers involved in technology selection for the poorest overcome the challenges identified in the case
study (Jasanoff, 2003). These “technologies of humility” include institutionalizing a greater focus on both
framing and distribution in the sociotechnical regimes structuring innovation systems, particularly at the
technology selection stage.
3.2.2 Data: A Mixed Methods Approach
This chapter is a mixed-methods study that draws upon data from multiple sources (Jick, 1979).
Sections 3.3 and 3.4, which focus on the dynamics of technology selection of SRI at the transnational
level and at the local level in Bihar, rely on expert interviews, peer-reviewed literature, NGO reports, and
newspaper articles.
For Section 3.3, which focuses on the selection of SRI at the transnational scale, I immersed
myself in the literature on SRI. I also spoke to colleagues about their opinions on the technology at
multiple development conferences and in semi-structured interviews, conducted both on the edges of
conferences and in their offices. I interviewed experts who support SRI, both from academic and NGO
backgrounds. For example, I spent several days interviewing Professor Norman Uphoff at his home and
office in Ithaca, New York. I also interviewed scholars and development practitioners who are more
skeptical of SRI.
For Section 3.4, which focuses on the selection of SRI in Bihar, one of the poorest states in India, I
interviewed policy makers, bureaucrats, local academics, NGO officials, and journalists in order to
develop an understanding of the selection of SRI in Bihar. As part of this effort, I conducted multiple field
visits to Bihar between 2011 and 2016. In my first field visit (and thereafter) I relied heavily on the
support of an NGO, PRAN, whose mission is to promote SRI in Bihar. I became close to the director of
this NGO, Anil Verma, and over time joined the board of PRAN, which allowed me to interact with other
SRI practitioners from across India at the bi-annual board meetings. However, I was also careful to ensure

250
that my close collaboration with the NGO did not color my perception of the technology in Bihar. To do
this, I met frequently with actors in the state who were more skeptical about the benefits and potential of
SRI. I was also careful to interview farmers in villages outside of the regions where PRAN operates, both
in focus groups and one-on-one settings.
For Section 3.5, I gathered data not only on the selection of SRI in Bihar, but also on how the
technology is performing in the state, and whether it is living up to the expectations of the actors
responsible for technology selection in the state. To do this, I conducted a total of 23 focus groups about
SRI with farmers. These focus groups were divided into two categories. The first 15 focus groups were
with SRI farmers supported by two separate NGOs (PRAN and JeeVika). I conducted an additional eight
focus groups in randomly selected villages where neither NGO operates. The second set of eight focus
groups was designed as a counter-weight to the focus groups I conducted with NGO supported farmers,
where the opinions of farmers about SRI were overwhelmingly positive. To ensure that the additional
eight villages were more unvarnished accounts of SRI, I selected villages for focus groups from regions
of Bihar where neither PRAN nor JeeVika were active, and where SRI extension and training had
happened exclusively through state-led extension programs.
Finally, I conducted a field survey of 11 villages in Bihar across three districts (see map in Figure
3.2). The total sample size of the survey was 338 households from UC (n=29), OBC (n=155), and SC/ST
(n=152) castes (caste categories are discussed in Chapter 2). The survey captures both discrete responses
(e.g. have you used SRI; where did you first learn about SRI) and more qualitative open-ended questions,
which were coded to understand the multi-dimensional reasons why farmers adopted, failed to adopt, or
disadopted SRI.95
95 Note: this survey is smaller than the 12-village survey discussed in Chapter 2. This is because for strategic reasons I did not ask all of the SRI questions in Bathani village (my ethnographic site) that I asked in the other 11 villages. For some questions where I do have data on all 12 villages I include the larger sample in my analysis.
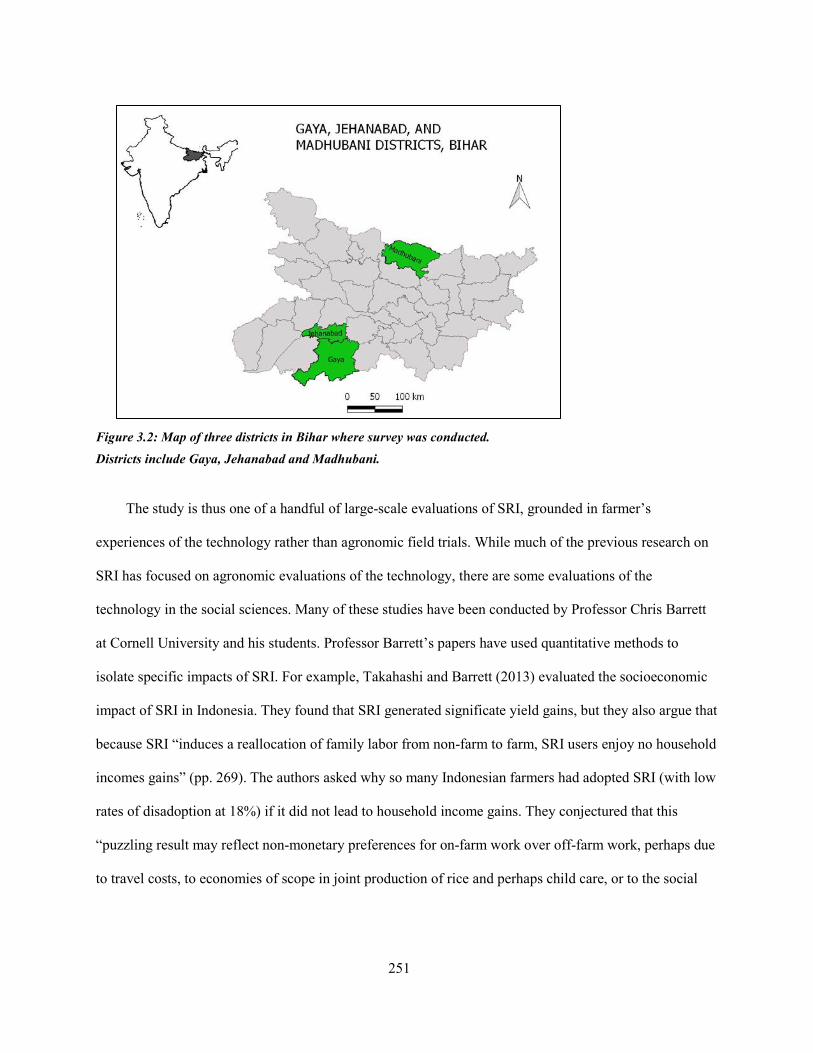
251
Figure 3.2: Map of three districts in Bihar where survey was conducted. Districts include Gaya, Jehanabad and Madhubani.
The study is thus one of a handful of large-scale evaluations of SRI, grounded in farmer’s
experiences of the technology rather than agronomic field trials. While much of the previous research on
SRI has focused on agronomic evaluations of the technology, there are some evaluations of the
technology in the social sciences. Many of these studies have been conducted by Professor Chris Barrett
at Cornell University and his students. Professor Barrett’s papers have used quantitative methods to
isolate specific impacts of SRI. For example, Takahashi and Barrett (2013) evaluated the socioeconomic
impact of SRI in Indonesia. They found that SRI generated significate yield gains, but they also argue that
because SRI “induces a reallocation of family labor from non-farm to farm, SRI users enjoy no household
incomes gains” (pp. 269). The authors asked why so many Indonesian farmers had adopted SRI (with low
rates of disadoption at 18%) if it did not lead to household income gains. They conjectured that this
“puzzling result may reflect non-monetary preferences for on-farm work over off-farm work, perhaps due
to travel costs, to economies of scope in joint production of rice and perhaps child care, or to the social
252
opprobrium associated with women working away from home in this heavily Muslim area” (pp. 285).
While this is a useful insight, the notion that farmers include non-monetary items in their utility functions
should not come as a surprise to those familiar with the larger literature on human well-being (Sen, 1999;
Stiglitz, Sen and Fitoussi, 2009)
Moreover, as I will discuss at greater length in section 3 of this chapter, many of SRI’s proponents
argue that negative evaluations of the technology are the result of research methodologies that are not
well-suited to capture the complex dynamics and “synergies” that emerge from the package of practices
that constitute SRI in farmers’ fields. Proponents argue that traditional agronomic trials on research
stations, which are usually designed to test individual variables in a highly-controlled setting, are
inadequate to capture the benefits of the multi-dimensional technology, because farmers are encouraged
to experiment with different permutations of the technology to identify the best combination of practices
for their individual circumstances (e.g. soil conditions and climate). Moreover, they argue that research
stations often treat the soils with chemicals to ensure standardization of the experiment, which destroys
the soil microbiome that is also essential to the superior results of SRI (Uphoff, 2003). Proponents of SRI
argue that more complex and multi-disciplinary approaches to the study of SRI are needed to fully
understand the benefits of the technology to small and marginal farmers in the field (Stoop, Adam and
Kassam, 2009; D. Glover, 2011).
Taking these arguments to heart, I designed the empirical evaluation of SRI in Bihar using a mixed
methods approach to agriculture technology adoption, including both qualitative field interviews and
survey data. Unlike econometric evaluations, I did not measure yields, but rather relied on farmers’
accounts of the ways in which SRI has contributed (or failed to contribute to) their household’s overall
well-being. I also relied on farmers’ perspectives on the opportunities and barriers to SRI adoption at the
household level. This approach places Bihari farmers’ perspectives on SRI front and center.

253
Instead of focusing narrowly on yields or income changes, the empirical fieldwork in Bihar looked
at broader concepts of well-being which included factors such as preferences for on-farm work. Because
farmers’ utility functions are complex and vary not only between villages but from farmer to farmer, well-
being improvements can only be crudely measured by yield or income gains. Instead, I relied on a
methodologically simple approach that overcame many of the challenges of external evaluators deciding
what criteria was relevant to farmer well-being — I simply asked farmers for their own multi-dimensional
evaluation of the technology as well as the barriers and opportunities for adoption.
3.3 Selection of SRI at the Transnational Scale
3.3.1 The Emergence and Spread of SRI as a “Pro-Poor” Technology
SRI is a practice-based technology for improving rice yields and reducing the costs facing
farmers(Uphoff, 1999, 2003; H. De Laulanié, 2011). The technology consists of a set of management
practices including earlier transplanting from nursery to field, line sowing, using fewer individual plants
per mound when transplanting from nursery to the main field, increased spacing between plants, soil
aeration often with mechanical weeders, and, perhaps most striking to the outside observer, keeping the
rice field moist but not flooded throughout the season. See Table 3.1 for comparison of SRI management
practices, “best management practices” as codified by IRRI, and management practices used by non-SRI
farmers in Bihar.

254
Table 3.1: Comparison of rice management practices. Source: The SRI management practices are adapted from Uphoff 2003. The “best management practices” are adapted from Sheehy et al. 2004, which links to a now defunct url in IRRI’s Knowledge Bank. The farmers’ practices in Bihar are taken from my own experience and specific questions in the 11-village survey.
Management Practices
System of Rice Intensification
Best Management Practices (BMPs)
Farmers Practices (as practiced in South Bihar)
Seedling age at transplanting
Younger seedlings: 8–12 days, generally not more than 15 days Fewer seedlings: 1; sometimes 2 if soil conditions less good.
Transplant seedlings within 15–30 days of germination, or direct-seed pre-soaked seed on the soil surface.
66% of farmers in the 11-village survey transplant from nursery to field between 26 and 30 days. 5% transplant at over 30 days and 27% at less than 25 days.
Plant spacing and density
Wider, sparser spacing: 25 25 cm to 35 35 cm, in square pattern, 16 to 9/m2; with best soil, up to 50 50 cm, may have only 4/m2.
Transplant two to three seedlings per hill in a square pattern of typically about 20 cm 20 cm (but only one seedling per hill in hybrid rice because seed is expensive).
51% of farmers transplant between 3 and 5 seedlings per hill. 38% transplant 1-2 seedlings per hill. 5% transplant 6 or more seedlings per hill. Seedlings are transplanted in lines but not in square pattern. Density is significantly higher closer to 15cm by 15cm.
Weed control Weeding with simple mechanical ‘rotating hoe,’ starting 10–12 DAT; recommend up to four times, done also for soil aeration.
Combination of pre-emergence herbicides and hand-weeding to control early weeds up to 21 days after transplanting; thereafter, weeds have little effect on yield. Early flooding is also a weed control measure.
Practices differ significantly based on access to water and financial capital. Where possible fields are kept flooded. Hand weeding is also practiced and where farmers can afford it field is treated with herbicides.
Water Management Keep soil from being continuously saturated during vegetative growth period; minimum water applications to maintain soil moisture, or alternating flooding-drying; shallow flooding (1–3 cm) during reproductive period.
Following transplanting, water levels in the field are maintained at approximately 5–10 cm. Fields are drained close to maturity. Mid-season drainage can occur for a short period. Intermittent drainage in later growth is practiced in Japan and Korea. In direct-seeded rice, soil is kept saturated during the first 2–3 weeks after seeding, followed by flooding.
When water is available farmers flood field. Farmers most often avoid paying for expensive diesel irrigation as much as possible, so when rains come standing water is left in field through system of earthen dams. When there is insufficient rain farmers will often irrigate 3-4 times in a paddy season. After each irrigation field is flooded, but often dries between.
Nutrient Management Application of compost recommended, not required; best put on preceding crop.
Provide nutrients to the crop in the amount and at the time required, mostly through mineral fertilizers. Where available at low cost, use organic amendments only as a complement to mineral fertilizers.
77% of farmers use macronutrient fertilizers (NPK). A smaller number, 26%, use micro-nutrients such as zinc. 17% use organic compost often in addition to mineral fertilizers.

255
SRI is considered a “bottom-up” technology, in that it was not invented in a conventional laboratory
or on a modern research station. Rather, SRI was invented in Madagascar in the 1980s, by a French Jesuit
priest, Father de Laulanié, working in close collaboration with local farmers (De Laulanié, 1993; Uphoff,
2003; H De Laulanié, 2011). Because the technology was not developed through more traditional R&D
channels, it can be thought of as a technology that was invented and at least locally selected by end-users.
This makes SRI a particularly interesting case study because much of the literature on agricultural
innovation systems suggest that involving end-users throughout the innovation process and specifically at
the invention stage, is important to ensure technologies are appropriate or well-aligned to the needs of
end-users (Biggs, 1990; Kristjanson et al., 2009; Kilelu, Klerkx and Leeuwis, 2013). Because SRI is a
technology that was invented and selected in close collaboration with end-users, it serves as a test case to
understand the degree to which a technology developed by and for resource poor farmers in one context,
can benefit the poorest farmers when transported to other contexts, where farmers face different
sociotechnical and agro-ecological opportunities and constraints.
SRI spread from Madagascar to other countries via multiple pathways but most notably through the
work of Norman Uphoff, a tenured political scientist at Cornell University, who traveled to Madagascar
in the mid-1990s in his role as the director of Cornell’s International Institute for Food Agriculture and
Development (CIIFAD) and while there heard about SRI. Members of a local NGO Father De Laulanié
founded, Tefy Saina, were so enthusiastic about the potential of SRI to raise farmers’ yields that Professor
Uphoff incorporated the technology into his own project. After three years of on-farm evaluations, Uphoff
was very impressed with the results and began championing SRI as a promising technology for improving
rice yields for small farmers outside Madagascar. Uphoff published his first journal article on SRI in 1999
in the Journal of Environment, Development and Sustainability (Uphoff, 1999). The article, was based
off of data collected by Tefy Saina staff and his own observations between 1995 and 1999. In it, he
reports that “[a] system of plant, soil, water and nutrient management for irrigated rice developed in
256
Madagascar has been yielding 5, 10 even 15 t ha-1 on farmers’ fields where previous yields averaged 2 t
ha-1” (pp. 297). In addition to the substantial yield increases, Uphoff reported that the system works
“using whatever variety of rice the farmer is already using and without having to utilize chemical
fertilizer or other purchased inputs” (p. 297). Finally, he posited a causal explanation for the performance
of this new technology that the SRI practices create “optimal growing conditions for plants,” which can
“bring out previously untapped genetic potential” (pp. 297).
The 1999 article was quickly followed by two more journal publications. In 2002, Uphoff and co-
authors published a paper in the journal of Agriculture Systems (Stoop, Uphoff and Kassam, 2002) and in
2003 Uphoff published a third paper in the International Journal of Agricultural Sustainability (Uphoff,
2003). In the 2003 article, Uphoff described SRI as a technology with enormous potential to contribute to
agricultural sustainability because of its ability to achieve higher yields with fewer external inputs. He
explained that:
The system of rice intensification (SRI) developed in Madagascar can raise irrigated rice yields to about double the present world average without relying on external inputs, also offering environmental and equity benefits. SRI methods change the way plants, soil, water and nutrients are managed – rather than utilising new-variety seeds, inorganic fertilisers or other agro-chemicals. SRI also reduces the need for irrigation water by about half and diminishes the requirements for capital and seed. SRI requires more knowledge and skill on the part of farmers and initially more labour per hectare. But greater labour intensity is compensated by farmers achieving higher returns for labour, and SRI can become labour-saving. SRI should make irrigated rice production more sustainable, as well as profitable. SRI experience may reveal other opportunities that can make agricultural systems more productive and beneficial for the long term (p. 38).
Uphoff characterizes SRI in these articles as a perfect “pro-poor” (see Chapter 1) – able to increase
yields while decreasing expensive input costs, and thus risk, facing the poorest farmers. In addition, he
contends that SRI has the added benefit of helping to improve the overall sustainability of rice cultivation
by reducing water consumption in rice by about half.

257
It was clear from his writings that Uphoff felt that SRI had the potential to transform rice
productivity for millions of rice farmers around the world and simultaneously protect the environment.
Since the late 1990s, Uphoff has devoted his career to promoting SRI and growing an international
network of NGOs and academics to support the technology. Uphoff had been director of Cornell’s
International Institute for Food, Agriculture and Development (CIIFAD) since 1990 and he was able to
use CIIFAD as an institutional home for promoting SRI. While Professor Uphoff ended his tenure as
director of CIIFAD in 2005, the CIFAAD website is still the most complete archive of SRI-related
material which Professor Uphoff meticulously maintains with a staff of seven people. The website is a
comprehensive archive with nearly everything that has ever been published about SRI, both in English
literature as well as foreign language journals (especially Chinese). The website also includes links to
instructional material, information about the history of SRI, and a huge archive of theses, conference
proceedings, and field reports, amongst other grey literature on SRI. The website is also searchable by
country with information about the networks of actors, activities, and publications of SRI practitioners
and farmers in 59 countries (CIIFAD, 2018). The website serves as a central repository of all SRI related
material, but also showcases the size of the global network that has grown to support what many SRI
proponents have called a “civil society” innovation (Prasad, Prajit and Andrew, 2005).
Professor Uphoff’s dedication to SRI’s potential, showcased in the meticulous archive maintained on
the CIIFAD website, is also evident in his daily communications. When I first expressed interest in
working on SRI, he not only emailed me more material than I could possibly wrap my head around, but
he graciously invited me to Ithaca to meet him, learn more about SRI, and stay in his lovely home with
his wife over a four-day period in March 2011.96 I have since learned that I am not a unique case. Almost
everyone who knowns Uphoff agrees that his desire to help others learn about SRI can often be
96 Indeed, the guest room I stayed in, overlooking a lake, led to some of the best sleep of my first year of graduate school.

258
overwhelming. And as I will demonstrate in the next sections (3.3.2- 3.3.5), Uphoff’s enthusiasm for SRI
has conflicted sharply with the reaction of the established rice research community, who have been far
less receptive both to the “bottom up” innovation and to Uphoff’s passionate promotion of the technology
around the world.
3.3.2 SRI Selected by Transnational Actors
The 2002 article by Stoop, Uphoff and Kassam, all respected development experts from prestigious
institutions, including the West African Rice Development Association (WARDA), Cornell International
Institute for Food, Agriculture and Development, and the Food and Agriculture Organization of the
United Nations (FAO) respectively, framed SRI specifically as a technology to help “resources limited
farmers” (Stoop, Uphoff and Kassam, 2002). They concluded that a “major implication of SRI is that
apparently there still exists substantial potential to raise rice yields through relatively simple but profound
adjustments in agronomic management practices” (Stoop, Uphoff and Kassam, 2002). The notion that the
poorest farmers could obtain increased yields not “through higher levels of external inputs, but rather
through more productive use of natural resources (land, water, seeds and plant nutrients) and of labour,
time and space,” (p. 270) appealed to many development professionals, who by the 21st century were
increasingly concerned with the negative consequences of the 20th century’s Green Revolution and
increasingly focusing on agro-ecological approaches to agriculture development, such as integrated pest
management (IPM).
Much of the early spread of SRI happened through informal and civil society networks, usually with
Professor Uphoff as the central node of these networks. The World Bank and other development
organizations also began to show strong interest in SRI by around 2005, and helped the technology spread
outside Madagascar through funding various pilot programs, often as part of larger development
initiatives. A 2010 Report by Africare, Oxfam America, and the World Wildlife Foundation, served as an

259
important transnational selection mechanism for SRI by three prominent funding and development
agencies. The 33-page report entitled “More Rice for People: More Water for the Planet” argued that
“[w]hen agencies as diverse as Oxfam, WWF and Africare, with missions focused respectively on social
justice, human harmony with nature, and sustainable development independently come to support the
same strategy to address critical global challenges, such a strategy merits wider attention and
examination” (Africare, Oxfam America and WWF-ICRISAT, 2010). This report, like the paper by
Stroop et al., argued that while SRI methods “work with any variety of rice and on any farm size, for
subsistence farms to larger scale operations,” because of the fact that SRI methods do not rely on many
external inputs the method is “particularly suited to the needs of resource-limited households, reliant on
small landholdings. Thus, SRI methods are fundamentally “pro-poor” (Africare, Oxfam America and
WWF-ICRISAT, 2010).
As the SRI movement gained momentum, many scholars and development professionals became
enormously passionate about SRI as a technology with the potential to raise yields for poor farmers while
decreasing input costs and strain on water resources. For example, Robert Zoellick in 2009, when he was
President of the World Bank Group, wrote about SRI in an op-ed in one of India’s leading newspapers,
The Hindustan Times, saying that “this emerging technology not only addresses food security but also the
water scarcity challenge that climate change is making all the more dangerous” (Zoellick, 2009). He
described the experience of Tamil Nadu with SRI, saying that the farmers in the state who had adopted
SRI increased their yields 30 to 80% while also reducing water use by 30%. Zoellick continued that the
experiences of India with SRI “are all lessons for our world.” Notably, Zoellick failed to mention any
continued controversy over the efficacy of SRI.
As positive reports about SRI became more frequent and more and more transnational actors
began to support the technology, some advocates of SRI developed a faith in the technology that seemed
to many observers to go beyond the empirical evidence and verged on the evangelical. These “SRI

260
enthusiasts” appeared to treat the technology as a “silver bullet,” with the potential to transform global
rice production for the benefit of both farmers and the environment. For example, a scholar and advocate
of SRI in India, Dr. B.C. Barah from the National Centre for Agricultural Economics and Policy
Research, attributes multiple benefits to SRI, without also reflecting on any drawbacks. The benefits of
SRI Dr. Barah cites in a paper and supporting PowerPoint presentation include: significant productivity
enhancements; the technology’s ability to save land, water, and time; its ability to enrich soil health and
microbial dynamics; its organic nature; its ability to minimize risks facing farmers; its ability to provide
employment opportunities; its potential to improve household food and nutrition security; and its higher
profits (Barah, 2009; see PowerPoint slide in Figure 3.3 below).
Figure 3.3: “Policy perspectives for upscaling SRI” PowerPoint presentation.
Source: (Dr. Barah, NABARD Chair Professor at IARI New Delhi)
For many, the benefits of SRI cited by SRI enthusiasts were simply too good to be true. Almost as
soon as SRI began to gain international attention, there was also a strong pushback against the technology
by the established rice research community.

261
3.3.2 The Rice-Wars
Since the Green Revolution of the 1960s and 1970s, a major international network of scientists
focused on improving rice yields has grown up around the world. The center of this network is located in
the Philippines at the headquarters of the International Rice Research Institute (IRRI), which is one
among 15 institutes that make up the Consultative Group on International Agriculture Research
(CGIARS), which are dedicated to agriculture and food systems research around the world. The CGIAR
and its research centers were established after the Green Revolution in response to the need to
institutionalize international agriculture research to ensure continued productivity grains (Sagasti and
Timmer, 2008).
IRRI is a global organization, headquartered in Los Baños, Philippines. It has offices in 17 rice-
growing countries in Asia and Africa and more than 1,000 staff. IRRI’s budget in 2015 was
approximately 92 million dollars. On their website, they claim to be “the world’s premier research
organization dedicated to reducing poverty and hunger through rice science; improving the health and
welfare of rice farmers and consumers, and protecting the rice-growing environment for future
generations” (IRRI, 2018). IRRI is at the center of a larger community of rice scientists around the world,
including within the United States Department of Agriculture and many of the United States’ land grant
universities.
Almost as soon as the 1999, 2002, and 2003 articles by Professor Uphoff were published,
scientists from the established rice research community mobilized to attack the technology in the
literature. The first article to attack SRI was submitted by Achim Doberman, an agronomist at IRRI, to
the journal of Agricultural Systems in 2002, but it was not published until 2004 (Dobermann, 2004). The
article, was titled “A Critical Assessment of the System of Rice Intensification (SRI)”. Dobermann’s
paper is interesting because at the same time that it mostly dismisses SRI by claiming “techniques such as
SRI are not necessary for growing rice near the yield potential,” he grants that “approaches such as SRI

262
may serve the important needs of resource-poor farmers in areas with poor soils, but are likely to have
little potential for improving rice production in insensitive irrigated systems on more favorable soils,
where high yields can be achieved through implementation of more cost-efficient management practices”
(pp. 262). What is interesting about this conclusion is that it acknowledges that SRI may be an important
“pro-poor” technology, at the same time as it largely dismisses the value of SRI outside these limited
circumstances.97 From the perspective of development practitioners specifically concerned with finding
technologies that would benefit the poorest farmers, the tenor of Dobermann’s conclusion must have
seemed very strange indeed. From their perspective, if a technology specifically benefited the poorest
farmers, what could be better? Indeed, so many technologies they feared brought disproportionate
benefits to wealthier farmers. Why would the research community shun a technology that was specifically
beneficial to the poor?
However, the real opening salvo in what Shambu Prasad, a scholar and proponent of SRI in India,
would later dub the “rice wars” (Shambu Prasad, 2009) was a widely read news feature in Nature written
by Christopher Surridge, their senior biology editor, entitled “Feast or Famine?” (Surridge, 2004). The
news feature on the most superficial level attempts to provide an even-handed report of the current debate
over SRI, but reading between the lines, it is clear that the subtext of the article is meant to make the
reader skeptical of SRI. For example, the caption on the main photo in the article, “Wonder rice? The
System of Rice Intensification involves more sparsely planted, drier fields than is normal. Its supporters
believe it gives more than double yields of conventional farming” (p. 360), almost immediately serves to
make a potentially neutral reader an SRI skeptic. The news feature continues, claiming that “many
imminent agronomists dismiss such achievements as the result of poor record keeping and unscientific
97 Indeed, critics of SRI used this article, which was based entirely off of a theoretical review of previously published rice science and no new experimental evidence from SRI trials, as a reason to dismiss the potential of SRI entirely.
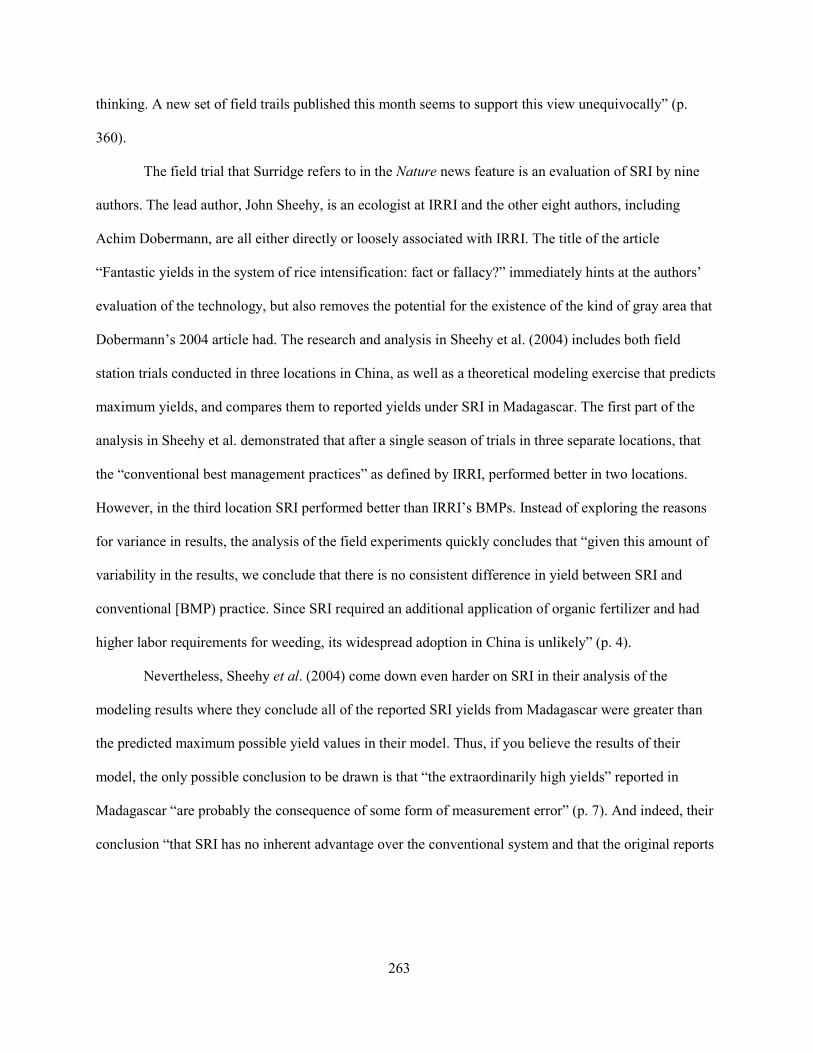
263
thinking. A new set of field trails published this month seems to support this view unequivocally” (p.
360).
The field trial that Surridge refers to in the Nature news feature is an evaluation of SRI by nine
authors. The lead author, John Sheehy, is an ecologist at IRRI and the other eight authors, including
Achim Dobermann, are all either directly or loosely associated with IRRI. The title of the article
“Fantastic yields in the system of rice intensification: fact or fallacy?” immediately hints at the authors’
evaluation of the technology, but also removes the potential for the existence of the kind of gray area that
Dobermann’s 2004 article had. The research and analysis in Sheehy et al. (2004) includes both field
station trials conducted in three locations in China, as well as a theoretical modeling exercise that predicts
maximum yields, and compares them to reported yields under SRI in Madagascar. The first part of the
analysis in Sheehy et al. demonstrated that after a single season of trials in three separate locations, that
the “conventional best management practices” as defined by IRRI, performed better in two locations.
However, in the third location SRI performed better than IRRI’s BMPs. Instead of exploring the reasons
for variance in results, the analysis of the field experiments quickly concludes that “given this amount of
variability in the results, we conclude that there is no consistent difference in yield between SRI and
conventional [BMP) practice. Since SRI required an additional application of organic fertilizer and had
higher labor requirements for weeding, its widespread adoption in China is unlikely” (p. 4).
Nevertheless, Sheehy et al. (2004) come down even harder on SRI in their analysis of the
modeling results where they conclude all of the reported SRI yields from Madagascar were greater than
the predicted maximum possible yield values in their model. Thus, if you believe the results of their
model, the only possible conclusion to be drawn is that “the extraordinarily high yields” reported in
Madagascar “are probably the consequence of some form of measurement error” (p. 7). And indeed, their
conclusion “that SRI has no inherent advantage over the conventional system and that the original reports

264
of extraordinary high yields are likely to be the consequence of error” (p. 1) dismisses SRI as complete
fallacy.
In what can only be seen as a coordinated effort, as the Sheehy et al. (2004) paper was in press,
two opinion pieces on SRI were also prepared by rice scientists who were not authors in either the
Dobermann (2004) or Sheehy et al. (2004) studies. The first, by Thomas Sinclair, USDA, and Kenneth
Cassman, University of Nebraska, was published as a discussion piece in a widely-read journal amongst
agricultural scientists – Field Crops Research. In the two-page paper titled “Agronomic UFOs” they share
their concern that “reports of unconfirmed field observations (UFOs) must not be accepted as bases for
agronomic understanding” (p. 9). Their discussion then reviews the findings from Sheehy et al. (2004)
that “the claimed SRI yields were approximately twice what was possible based on the energy available to
support crop growth” (p. 9). They end the opinion piece by cautioning their readers that “it is human
nature to hope for major advances that will improve the welfare of so many using technologies that are
easily accessible to resource-poor farmers, but this innate desire must be balanced in the scientific arena
with critical analysis and carefully designed experimental evaluation” (p. 10).
This last point is especially interesting given Dobermann (2004) finding that SRI, while not
necessarily beneficial to the average farmer, may indeed have specific benefits for resource-poor farmers.
Instead, they conclude simply that SRI is unlikely to benefit anyone and continuing to spend research
money on the topic would be a waste of scarce research funding. In addition to this opinion article, the
lead author, Thomas Sinclair, published a second opinion article in the magazine Rice Today, a periodical
with broader readership than most academic journal, which also argues SRI is an “Agronomic UFO”
which is a “waste of valuable scientific resources” (Sinclair, 2004). A final discussion article, also in
Field Corps Research, by John Sheehy, Thomas Sinclair, and Kenneth Cassman is perhaps the most
venomous attack on SRI and on the scientific credentials of its proponents (Sheehy, Sinclair and

265
Cassman, 2005). The discussion piece, titled “Curiosities, nonsense, non-science and SRI” accuses Stoop,
Uphoff and Cassman (2004) of being both “careless” and “indifferent to” the scientific method.
3.3.3 SRI’s Network Grows
Despite the controversy surrounding SRI, the network of actors who determined that SRI merited
further attention and investment continued to grow, and more and more journal articles and reports from
the field documented SRI results that supported the benefits of the technology. Based on the accumulating
evidence, a 2011 report commissioned by the Bill & Melinda Gates Foundation found that “it is fairly
well established that SRI cultivation methods cause changes in the physiology and morphology of rice
plants, which can lead to improved productivity and grain yield under favorable conditions” (Berkhout
and Glover, 2011). The report concludes by encouraging the Gates Foundation to continue funding
research and promotion of SRI, arguing that if progress can be made in answering a number of remaining
knowledge gaps, both pertaining to the biophysical mechanisms undergirding SRI, as well as the
sociotechnical dynamics of SRI adoption and use in farmers’ fields, “useful, practical progress can be
made in developing rice cultivation systems that answer the felt needs of the poor and marginal farmers”
(p. 141).
By 2017, SRI had been adopted in over 50 countries (CIIFAD, 2018). In many of the countries,
adoption was limited in geographic scope, and the actors involved with initial adoption were either
NGOs, civil society organizations, or individual farmers who heard about SRI often through forums on
organic or agro-ecological approaches to agriculture. Yet in at least 23 countries, SRI had achieved
broader adoption across multiple regions and with multiple organizations supporting the technology. In
three countries – Cambodia, India, and Vietnam – SRI was in widespread use in multiple regions and
supported by central and or state governmental initiatives (see map in Figure 3.4).

266
Figure 3.4: Global SRI Adoption as taken from the CIFFAD website.
Source: (http://sri.ciifad.cornell.edu/images/global/SRI_World_Map_2016.png)
In addition to the rapid growth in the number of countries where SRI has been demonstrated and
adopted into widespread use, the technology also amassed a large publication record. Beginning with
Father De Laulanié’s 1993 publication in the French journal Tropicultura, over 900 articles about various
aspects of SRI were published through the end of 2018 (see Figure 3.5).

267
Figure 3.5: Number of journal articles about SRI per year through 2015.
In total, by 2018, over 900 journal articles about SRI have been published according to data maintained by the SRI International Resources Network.
This impressive publication record is largely a result of Professor Uphoff’s dedication to fostering a
network of researchers around the world that both promote SRI and respond to the critiques leveled at
SRI by its skeptics. Indeed, Professor Uphoff and his staff maintain a database in Zotero citation software
of all available SRI publications, including journal articles, books, conference papers and theses and
dissertations.98 The articles in the database include publications that critique SRI (e.g. Dobermann, 2004;
Sheehy et al., 2004; Sinclair, 2004; Sinclair and Cassman, 2004; Surridge, 2004; Sheehy, Sinclair and
98 The SRI Zotero database maintained by Professor Uphoff can be found here: https://www.zotero.org/groups/344232/sri_-_system_of_rice_intensification_research_network/items/collectionKey/SEMP6Z3T/q/Uphoff
0
10
20
30
40
50
60
70
80
90
100
SRI Journal Publications by Year

268
Cassman, 2005). However, the vast majority of the articles in the database serve to support the claim that
SRI is a “beneficial” technology, at least to some farmers under some circumstances.
Uphoff played a central role in facilitating the transnational network of scholars who developed
this impressive publication record. Out of the 973 journal articles in the database, Professor Uphoff is an
author or co-author on 54 of them. It was especially important to Uphoff to encourage soil scientists to
study SRI, as he was convinced that many of the mechanisms that make SRI effective could be explained
by the interaction between SRI’s methods and the health of the microbes and biota living under the soil
(Uphoff, 2012). Uphoff was ultimately successful in drawing the attention of the soil science community
to SRI. A 2013 study by scientists in Thailand and the UK, found that SRI practices increased the
diversity of Arbuscular mycorrhizal fungi (AMF) in the soil. This finding served to validate Uphoff’s
hypothesis because in agricultural ecosystems, AMF are necessary for the proper management of
beneficial symbiosis in root systems (Watanarojanaporn et al., 2013). A second study by scientists in
India concluded that SRI practices “create more aerobic soil conditions under which beneficial microbes
and other soil organisms can prosper and improve the soil’s structure and fertility” (Mahender Kumar et
al., 2017, p. 394).
At his own university, Cornell’s agronomists were among the early SRI skeptics.99 A 2005 study
by three scholars from the department of earth and atmospheric sciences and from the department of crop
and soil sciences, evaluated yield differences between SRI and BMP based on data from trials in multiple
countries, including Madagascar, Nepal, China, Thailand, Laos, India, Sri Lanka, Indonesia, Bangladesh,
and the Philippines (Mcdonald, Hobbs and Riha, 2006). They concluded that “[a]side from one set of
experiments in Madagascar where SRI more than doubled rice productivity with respect to BMP, we
found no evidence of a systematic or even occasional yield advantage of this magnitude elsewhere.” In
99 A fact which deeply bothered Professor Uphoff when I interviewed him at Cornell in March 2011.

269
response to this article, Uphoff and colleagues countered in a 2008 article in the same journal (Uphoff,
Kassam and Stoop, 2008) that their conclusion was based on secondary data which was “assembled
selectively from diverse sources” and that their study left out extensive field trials in China, India, and
Indonesia which would have led to a more favorable analysis of SRI vis-à-vis BMPs.
Despite critiques from the agronomists at Cornell, scholars from both the economics department
and the soil sciences department were willing to take the technology more seriously and conduct their
own disciplinary evaluations. Christopher Barrett, Professor of Applied Economics and Management with
a focus on development economics and international agriculture development, co-authored four journal
articles on SRI between 2003 and 2013 (Moser and Barrett, 2003, 2006; Barrett et al., 2004; Takahashi
and Barrett, 2013). While Barrett’s early evaluations of SRI in Madagascar showed yield improvements,
they also showed that SRI was labor intensive, which they argued limited the widespread adoption of the
technology (Moser and Barrett, 2003). By 2013, Barret’s evaluation of SRI in Indonesia demonstrated
both significant yield gains and widespread farmer adoption (with low rates of disadoption), but the
authors still argued that the increased labor requirements likely negate the overall impact of the increased
yields on overall income (Takahashi and Barrett, 2013).
An evaluation of SRI out of Cornell’s soil science department also offers a more positive view of
the merits of SRI and supports Uphoff’s argument that the key to understanding the benefits of SRI is
developing a better understanding of the rice plant’s roots and their interaction with the soil. A 2010 study
by an international group of soil scientist, including Janice Thies, professor of soil biology at Cornell,
found significant differences in the soil microbial community between paddy plots managed with SRI as
opposed to BMPs (Sooksa-Nguan et al., 2010).
In addition to SRI’s increasing network amongst NGOs, donors, and scholars, SRI also began to
penetrate the private sector as part of the larger whole foods movement. In 2014, SRI became a marketing
strategy for a high-end organic rice company, Lotus Foods, who claim on their packaging that their rice is

270
grown using SRI methods, which “requires a lot less water and seeds to produce more crop per drop. …
We’re taking rice production beyond organic” (see Figure 3.6).
Figure 3.6: “SRI” branded rice.
Packaging for Lotus Foods Rice which highlight SRI as a technology for saving water and seeds (see right image bottom, right text)
3.3.4 The Causes of the Controversy: Three Hypotheses
There are multiple explanations for the causes of the virulent conflict over SRI. Many people I
spoke with at conferences and other professional forums, attribute the animosity surrounding SRI to the
passion with which Uphoff promotes SRI. Uphoff promotes SRI with a particular zeal that makes many
scientists nervous. Indeed, in my experience simply emailing Uphoff a short question can quickly lead to
a five-page return email with 10 attachments, including drafts of upcoming papers and reports that he
hopes will finally put the SRI debates to rest. Many scholars and some development experts automatically
discredit SRI simply because Uphoff’s demeanor and belief in SRI verges on the evangelical. They feel
this kind of passion has no place in rational scientific discourse. Others who have a higher opinion of the
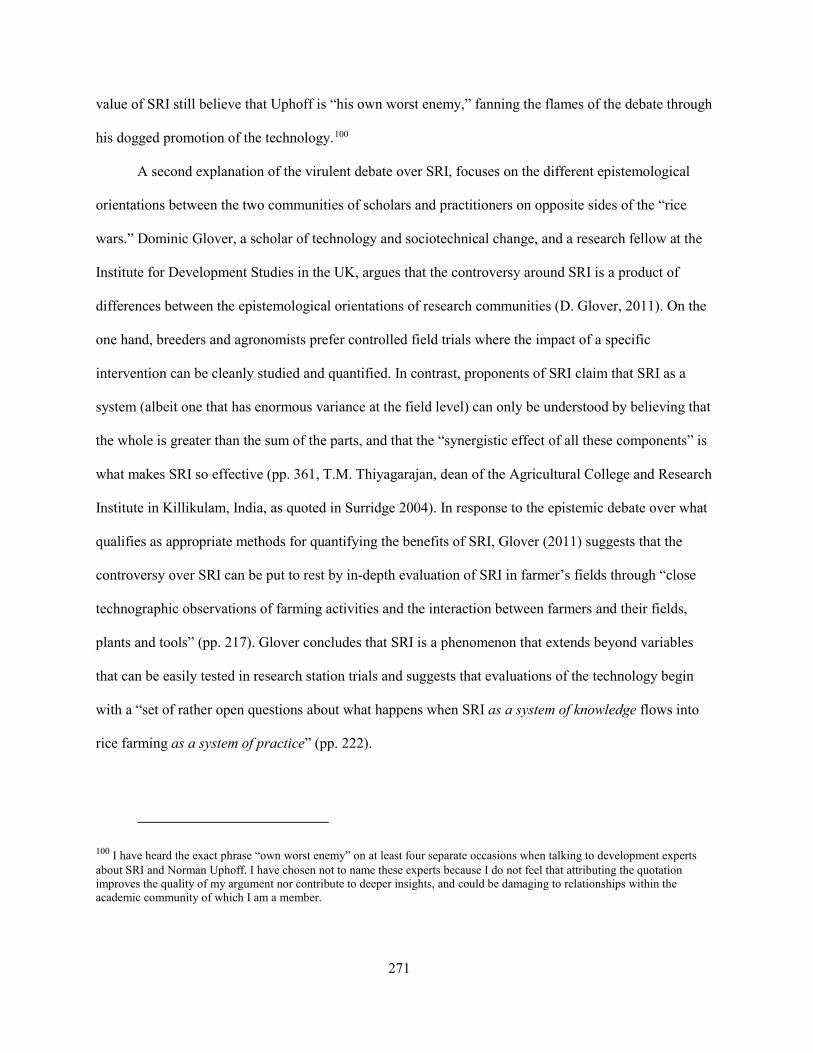
271
value of SRI still believe that Uphoff is “his own worst enemy,” fanning the flames of the debate through
his dogged promotion of the technology.100
A second explanation of the virulent debate over SRI, focuses on the different epistemological
orientations between the two communities of scholars and practitioners on opposite sides of the “rice
wars.” Dominic Glover, a scholar of technology and sociotechnical change, and a research fellow at the
Institute for Development Studies in the UK, argues that the controversy around SRI is a product of
differences between the epistemological orientations of research communities (D. Glover, 2011). On the
one hand, breeders and agronomists prefer controlled field trials where the impact of a specific
intervention can be cleanly studied and quantified. In contrast, proponents of SRI claim that SRI as a
system (albeit one that has enormous variance at the field level) can only be understood by believing that
the whole is greater than the sum of the parts, and that the “synergistic effect of all these components” is
what makes SRI so effective (pp. 361, T.M. Thiyagarajan, dean of the Agricultural College and Research
Institute in Killikulam, India, as quoted in Surridge 2004). In response to the epistemic debate over what
qualifies as appropriate methods for quantifying the benefits of SRI, Glover (2011) suggests that the
controversy over SRI can be put to rest by in-depth evaluation of SRI in farmer’s fields through “close
technographic observations of farming activities and the interaction between farmers and their fields,
plants and tools” (pp. 217). Glover concludes that SRI is a phenomenon that extends beyond variables
that can be easily tested in research station trials and suggests that evaluations of the technology begin
with a “set of rather open questions about what happens when SRI as a system of knowledge flows into
rice farming as a system of practice” (pp. 222).
100 I have heard the exact phrase “own worst enemy” on at least four separate occasions when talking to development experts about SRI and Norman Uphoff. I have chosen not to name these experts because I do not feel that attributing the quotation improves the quality of my argument nor contribute to deeper insights, and could be damaging to relationships within the academic community of which I am a member.
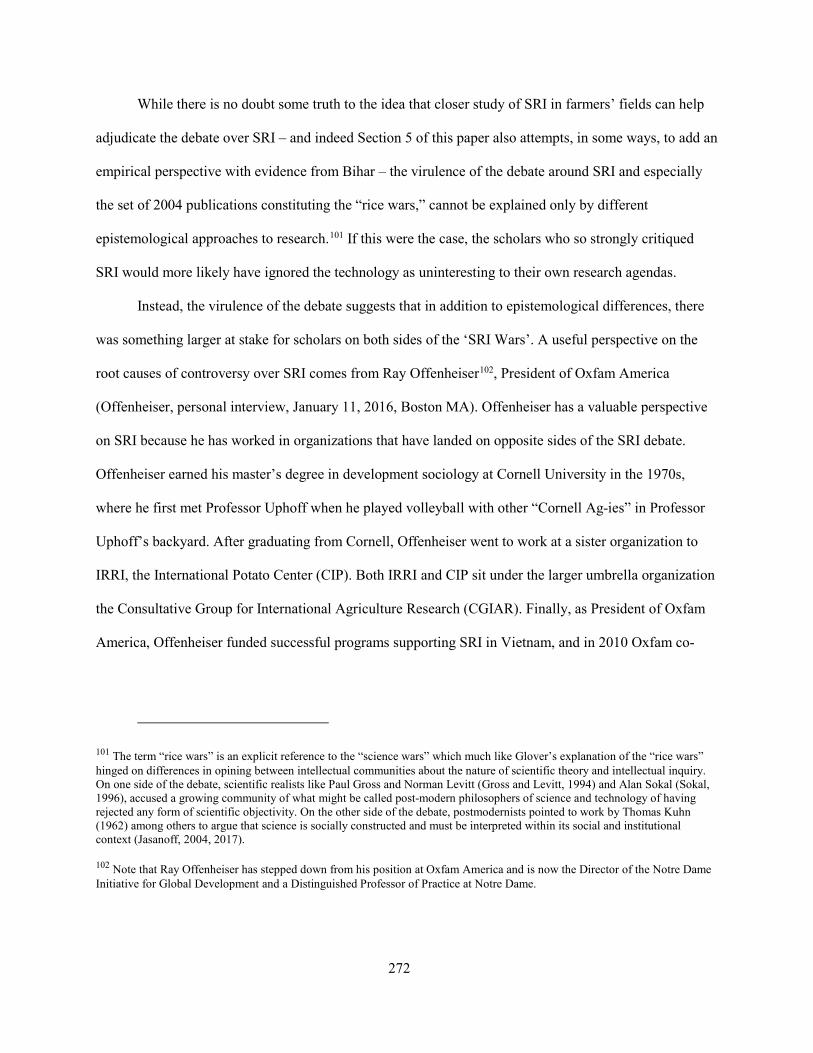
272
While there is no doubt some truth to the idea that closer study of SRI in farmers’ fields can help
adjudicate the debate over SRI – and indeed Section 5 of this paper also attempts, in some ways, to add an
empirical perspective with evidence from Bihar – the virulence of the debate around SRI and especially
the set of 2004 publications constituting the “rice wars,” cannot be explained only by different
epistemological approaches to research.101 If this were the case, the scholars who so strongly critiqued
SRI would more likely have ignored the technology as uninteresting to their own research agendas.
Instead, the virulence of the debate suggests that in addition to epistemological differences, there
was something larger at stake for scholars on both sides of the ‘SRI Wars’. A useful perspective on the
root causes of controversy over SRI comes from Ray Offenheiser102, President of Oxfam America
(Offenheiser, personal interview, January 11, 2016, Boston MA). Offenheiser has a valuable perspective
on SRI because he has worked in organizations that have landed on opposite sides of the SRI debate.
Offenheiser earned his master’s degree in development sociology at Cornell University in the 1970s,
where he first met Professor Uphoff when he played volleyball with other “Cornell Ag-ies” in Professor
Uphoff’s backyard. After graduating from Cornell, Offenheiser went to work at a sister organization to
IRRI, the International Potato Center (CIP). Both IRRI and CIP sit under the larger umbrella organization
the Consultative Group for International Agriculture Research (CGIAR). Finally, as President of Oxfam
America, Offenheiser funded successful programs supporting SRI in Vietnam, and in 2010 Oxfam co-
101 The term “rice wars” is an explicit reference to the “science wars” which much like Glover’s explanation of the “rice wars” hinged on differences in opining between intellectual communities about the nature of scientific theory and intellectual inquiry. On one side of the debate, scientific realists like Paul Gross and Norman Levitt (Gross and Levitt, 1994) and Alan Sokal (Sokal, 1996), accused a growing community of what might be called post-modern philosophers of science and technology of having rejected any form of scientific objectivity. On the other side of the debate, postmodernists pointed to work by Thomas Kuhn (1962) among others to argue that science is socially constructed and must be interpreted within its social and institutional context (Jasanoff, 2004, 2017). 102 Note that Ray Offenheiser has stepped down from his position at Oxfam America and is now the Director of the Notre Dame Initiative for Global Development and a Distinguished Professor of Practice at Notre Dame.

273
authored a report on the benefits of SRI (Africare, Oxfam America and WWF-ICRISAT, 2010).103
Offenheiser, with experience funding SRI and having been within organizations on both sides of the SRI
debate, is perhaps uniquely positioned to provide insight into the root causes of the debate over SRI.
During an interview I conducted with Offenheiser in his office in Boston, he placed the majority of
the blame for the intense animosity around SRI at the feet of IRRI saying “In some sense they [IRRI]
picked that fight” (Offenheiser, personal interview, Jan 11, 2016). He continued, that there was no real
reason for IRRI researchers to be so concerned about the spread of SRI. Almost all farmers using SRI
methods were also using high-yielding seed varieties, so there was no intrinsic tradeoff between SRI and
the work that most of the scientists at IRRI were doing, but nonetheless “the researchers were out of their
mind that they needed to kill this [SRI] thing. The virulence of the attack was shocking and somewhat
disgraceful.”
Offenheiser said that his own staff at Oxfam were taken off-guard by the strength of the debate
over what many of them saw as a seemingly innocuous approach to rice cultivation. Offenheiser relied on
his graduate training in development sociology and specifically what he referred to as his coursework in
the “sociology of knowledge,” to help his staff understand that “SRI was turning the job of improving
yields from the breeders to the social scientists and agriculture economists. This impinged on the turf of
the breeders, giving other disciplines more political space within the CGIAR.” Offenheiser concluded that
the fear of losing power and authority over the direction of research was the reason for the coordinated
attack against SRI in 2004. The breeders and other scientists at IRRI, as well as sister research institutes
around the world, feared that if they started to lose control of the message, there was no telling what the
ultimate implications might be for the direction of research, and in particular, the implications for
103 Oxfam American became involved with SRI in 2005 through a Cambodian agronomist working with Oxfam. Meanwhile other Oxfam offices like Australia were also experimenting with SRI. All of these trials developed through informal networks and were not coordinated.

274
research funding. In other words, Offenheiser concluded that the virulence of the “rice wars” was driven
by the professional incentives of the established rice research community to safeguard their power and
authority over the direction of rice research and development.
Corroborating Offenheiser’s viewpoint that the virulent debate over SRI is driven by competing
professional incentives is difficult. Indeed, both Uphoff and Glover point out in an exchange of comments
in the Wageningen Journal of Life Sciences that it is very hard to find decisive evidence to prove that
conflicts of interests are biasing scholarships (Glover, 2012; N Uphoff, 2012). And, while there is no
smoking gun, there are multiple indications that professional incentives have played a major role in
driving the debate over SRI.
Even before SRI emerged as a topic for debate in the transnational agriculture research
community, the same editor that wrote the opening salvo in the “rice wars” in Nature in 2004 (Surridge,
2004), wrote a similar news feature in Nature two years prior, looking at the potential of genetic
engineering to create a new type of rice plant that would significantly increase productivity (Surridge,
2002). This news feature had nothing to do with SRI, but it did frame what was at stake in terms of
professional incentives and prestige for rice scientists in improving rice yields. The news feature began
with these words: “feeding the world in the twenty-first century could require a second green revolution,
but that may involve the most audacious feat of genetic engineering yet attempted.” This phrase
immediately underscores two points. First, any success in genetic engineering that meets the world’s food
needs would be an “audacious feat” on the part of scientists, comparable to the achievements of Norman
Borlaug, who won a Nobel Peace Prize in 1970 as the father of the first Green Revolution. The news
feature continues, that rice is the world’s most important staple crop, but that yield growth is approaching
a “theoretical limit set by the crop’s efficiency in harvesting sunlight” (pp. 576). To overcome this
theoretical limit and ensure rice production keeps pace with global demand, the article quotes IRRI’s John
Sheehy (who would later author one of the key anti-SRI papers), “the only way to increase yields and
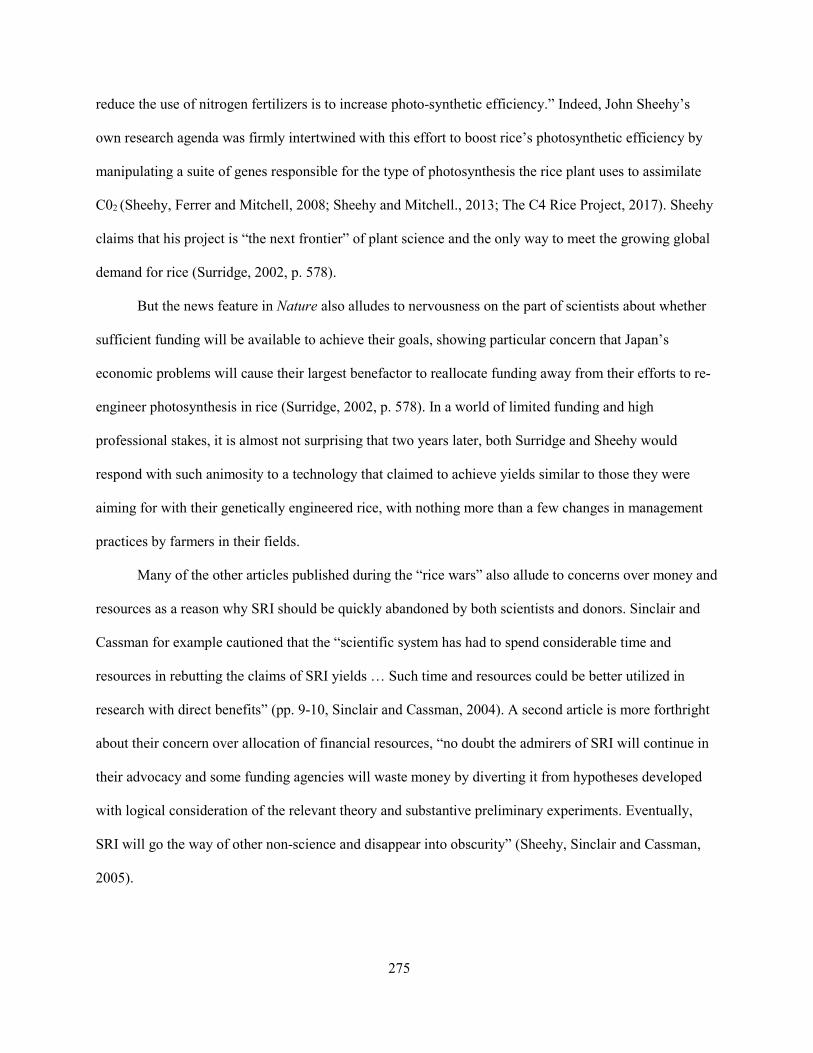
275
reduce the use of nitrogen fertilizers is to increase photo-synthetic efficiency.” Indeed, John Sheehy’s
own research agenda was firmly intertwined with this effort to boost rice’s photosynthetic efficiency by
manipulating a suite of genes responsible for the type of photosynthesis the rice plant uses to assimilate
C02 (Sheehy, Ferrer and Mitchell, 2008; Sheehy and Mitchell., 2013; The C4 Rice Project, 2017). Sheehy
claims that his project is “the next frontier” of plant science and the only way to meet the growing global
demand for rice (Surridge, 2002, p. 578).
But the news feature in Nature also alludes to nervousness on the part of scientists about whether
sufficient funding will be available to achieve their goals, showing particular concern that Japan’s
economic problems will cause their largest benefactor to reallocate funding away from their efforts to re-
engineer photosynthesis in rice (Surridge, 2002, p. 578). In a world of limited funding and high
professional stakes, it is almost not surprising that two years later, both Surridge and Sheehy would
respond with such animosity to a technology that claimed to achieve yields similar to those they were
aiming for with their genetically engineered rice, with nothing more than a few changes in management
practices by farmers in their fields.
Many of the other articles published during the “rice wars” also allude to concerns over money and
resources as a reason why SRI should be quickly abandoned by both scientists and donors. Sinclair and
Cassman for example cautioned that the “scientific system has had to spend considerable time and
resources in rebutting the claims of SRI yields … Such time and resources could be better utilized in
research with direct benefits” (pp. 9-10, Sinclair and Cassman, 2004). A second article is more forthright
about their concern over allocation of financial resources, “no doubt the admirers of SRI will continue in
their advocacy and some funding agencies will waste money by diverting it from hypotheses developed
with logical consideration of the relevant theory and substantive preliminary experiments. Eventually,
SRI will go the way of other non-science and disappear into obscurity” (Sheehy, Sinclair and Cassman,
2005).

276
In summary, all three hypotheses – individual credibility, different epistemological orientations,
and professional conflicts over power and authority – played some role in giving energy to the debates
surrounding SRI. But in many ways, it seems that the debates would never have gained the furor and
attention they did had there not been tensions grounded in real concerns about whose vision for rice
research the big donors would fund and who could claim the mantle of success in feeding the world in
2050. Gieryn’s notion of boundary-work is a useful theoretical lens through which to understand this
debate. The established rice research community used forums such as journals and opinion articles in
popular scientific press to demarcate what they saw as valid science, from what they saw as invalid. They
certainly employed the language of epistemic differences in their arguments, but in their arguments only
one epistemic approach was valid. However, what seems almost certain is that the virulence with which
the established rice research community attacked SRI demonstrates the ways in which SRI was perceived
as a threat to their professional goals and required swift action to deny “resources to ‘pseudoscientists’”
(Gieryn, 1983, p. 781).
3.3.5 Attempts at Closure: Finding Common Ground?
In response to the virulent controversy over SRI, the World Bank Institute developed a toolkit to
explain SRI titled “SRI Achieving more with Less: A New Way of Rice Cultivation.” Instead of avoiding
the controversies around the technology, the World Bank addressed them directly by interviewing
farmers, researchers, practitioners, and development agency staff about their views on SRI.104 The World
Bank’s Toolkit is an example of mediating boundary-work in an effort to help bring closure to a debate
104 While the website has unfortunately been taken down by the World Bank, I had the interviews transcribed before the website was taken down. I have included these interviews in Appendix 4. These interviews shed important light on the SRI debate and demonstrate the interesting role the World Bank took on as boundary spanning role in mediating the controversy over SRI technology.

277
over “what constitutes reliable or useful knowledge” (Clark et al., 2016, p. 4615). The need for boundary-
work between the communities on opposite sides of the “rice wars” by 2010 was clear. The extent to
which the World Bank’s project worked in finding common ground between the two communities is
debatable, as strong disagreements persist. However, what the toolkit did do was put IRRI on notice that
major players in international development (the World Bank happens to by a major funder of the CGIAR)
were eager to move beyond the “rice wars” and further evaluate the potential of SRI as one technology for
improving the livelihoods of resource poor farmers.
IRRI, to their credit, realized that their early reactions to SRI did not reflect well on their
credibility. Knee-jerk publications with titles like “Agronomic UFOs” and “Curiosities, nonsense, non-
science and SRI,” rather than putting the controversy to rest, fanned the partisan flames and legitimized
the fears of SRI proponents that IRRI was ignoring their contribution without doing its own due-
diligence. Indeed, discussions with Professor Uphoff and other proponents of SRI regularly descended to
the semi-conspiratorial, where funding opportunities were rumored to have been declined to SRI
researchers to prevent them from proving the value of SRI in a more scientifically rigorous manner. SRI
proponents even occasionally suggested that when SRI trials were conducted by IRRI researchers or by
researchers within National Agricultural Research Systems (NARs), that the outcomes were purposely
sabotaged to ensure that no positive data about SRI became mainstreamed. More problematically, the
virulent reaction of IRRI to SRI did little to assuage the concerns of outside observers that IRRI was
purposely sabotaging SRI. It also put SRI into the same narrative as genetically modified crops (GMOs),
with SRI standing in direct juxtaposition to GMOs, thereby gaining the sympathies of a wide variety of
organizations opposed to GMOs.
IRRI decided that it needed a more nuanced approach to SRI and in 2014 it developed a website
that addressed SRI without directly criticizing the technology (IRRI, 2014). IRRI’s website has five pages
devoted to their official interpretation of SRI. They say that SRI “is an evolving set of practices,
278
principles, and philosophies aimed at increasing the productivity of irrigated rice by changing the
management of plants, soil, water and nutrients”. And indeed, this definition of SRI would not be
controversial amongst proponents of SRI. A few sentences later, IRRI makes an interesting
epistemological move, essentially bringing SRI underneath the umbrella of BMPs already advocated by
IRRI:
Offering farmers a menu of practices that are science-based, have a solid track record of performance, and that can be tested, adapted, and integrated by farmers locally, is a powerful mechanism to bring improvements to their production systems. Such a menu of practices tallies well with IRRI’s approach of offering best management practices as listed in the Rice Knowledge Bank (IRRI, 2014).
By framing SRI as a menu of practices that are science-based, IRRI attempts to move past the
heated controversies where SRI was ridiculed as having “no inherent advantage over the conventional
system” (pp. 1, Sheehy et al., 2004). Instead, the debate has evolved to a point where IRRI recognizes
some of the management practices associated with SRI, but minimizes their novelty or uniqueness.
Essentially, the technology that came out of Madagascar according to IRRI was a combination of best
management practices that were then codified under the label of SRI.
What IRRI’s most recent explanation of SRI fails to grapple with is the fact that both farmers and
NGOs around the world have realized benefits from the package of practices associated with SRI that
they were not realizing before they learnt about SRI. Whether farmers and NGOs had not been exposed to
other improved agronomic practices (e.g. IRRI’s BMPs) before being introduced to SRI – either because
the BMPs had not been sufficiently promoted in their region, or because there is something specific about
SRI that is different than other BMPs – remains unaddressed in their official discussion of SRI.
Here it is important to return to Sheehy’s 2004 critique of SRI which concluded that “SRI had no
inherent advantage over the conventional system” (Sheehy et al., 2004). The question of course is what is
meant by the conventional system? By conventional, Sheehy et al. really meant IRRI’s BMPs which were

279
used in their field trials. But conventional is an ambiguous word that can easily refer to the methods
farmers in a given region use to cultivate rice. Most evaluations of SRI have been done against BMPs, but
at least in the case of Bihar, these practices are significantly different from what the average farmer is
doing in their own field. Their field trials were thus conducted comparing SRI with IRRI’s BMPs and
found no advantage of SRI over BMPs (which include expensive inputs such as herbicides and mineral
and organic fertilizers). Neither the Sheehy article from 2004, nor the current discussion of the merits of
SRI on IRRI’s website, addresses the key phenomenon of SRI – whether or not there is something
specific about the unique set of management practices in SRI, which themselves are adaptable to local
conditions, or whether the SRI movement has tapped an unmet need to improve agronomic practices
amongst small and marginal farmers, where traditional knowledge extension efforts have failed. This
paper was not designed to elucidate the relative merits of SRI vs. BMPs defined by IRRI, but it is clear
that there is something to the SRI movement that has jumpstarted a greater focus on agronomy and
management practices, which IRRI has often ignored. Instead, IRRI has been focusing most of their
resources on improving seed varieties that can be easily distributed through public and private sector
channels, without the need for wide-spread behavior change on the part of small and marginal farmers.
This approach serves two agenda’s. First, it is a way to improve yields irrespective of the robustness of
the local extension system and second, it ensures that crop scientists can continue to pursue high-end
laboratory science while satisfying themselves that they are contributing to long-term global food
security.
However, for many of the poorest farmers, SRI seems to offer an approach to growing rice that
according to many NGOs, researchers, and most importantly, small farmers around the world, improves
the well-being of farmers by decreasing input costs and improving yields. Whether this is an outcome of a
scientifically unique approach to rice cultivation, or a packaging of best management practices in a way
that has made them accessible, transportable, and useful to small farmers, is in many ways unimportant

280
from the perspective of mobilizing technology to meet the needs of the poorest farmers. The
unwillingness of IRRI to acknowledge the power of SRI at least as a powerful heuristic for improving
agronomic practices, demonstrates their continued need to secure their own knowledge domain, even
when their efforts are at best unhelpful to improving the ability of the poorest farmers to benefit from
agricultural technology.
3.3.6 Transnational Summary: Three Points of Lingering Controversy
Beginning with the publication of the World Bank’s toolkit, the virulent debate diminished, and by 2014,
when IRRI published its more even-handed description of SRI on its website, the debate was at a low
simmer. People on all sides of the “rice wars” developed more nuanced and specific theories about the
benefits of, and science behind, SRI. Scholars who were originally skeptical of SRI writ large, generally
began to acknowledge some yield advantages associated with SRI’s package of practices, while also
developing more nuanced critiques of specific aspects of SRI. One of the main points of continued
controversy was over the question of the labor requirements of SRI. Proponents of SRI believed that SRI
did not necessarily increase labor requirements, while critics continued to claim that it did. Analyzing the
interviews in the World Bank’s 2010 SRI toolkit provides a useful window into the evolving terms of the
lingering conflict. The themes that emerge from an analysis of these interviews are useful for two reasons.
First, they demonstrate the evolving processes of scientific closure as a negotiated sorting out and
reframing of arguments and claims on scientific certainty in the technology selection stage of an
innovation system. Second, they highlight remaining knowledge gaps, which I further investigate in the
empirical work conducted in Bihar in Section 3.5.
The interviews included in the toolkit begin with four farmers. From the start, it is clear that the
World Bank is largely sympathetic to SRI technology, as each of the four farmers exclusively discuss SRI
as a useful technology. The first farmer, cites both the reduced quantity of seeds as well as reduced labor

281
as the main benefits of SRI, saying “normally, I would need 30 kilos of seed to be used for one acre of
land, but with this new process I use 3 kilos of seed for one acre of land.” Additionally, “before, I used 20
laborers, now I use only 10.” The second farmer interviewed in the toolkit is excited by SRI because it
both increases yields and reduces labor costs, “with the old method the yield was 20-25 bags for one acre
and with the new method I get more like 30 bags.” In addition, “less labor is required because I am using
a weeder”. The third farmer interviewed claims that in addition to using less labor and less water, he has
improved his fields by about one third. The fourth farmer, claims that SRI requires less labor and
improves yields as well as overall plant health: “the new method results in 45-50 tillers per plant all
healthy and as a result the yield is increasing. In each of the tillers I used to get 130-150 grains, now I get
about 250-3000 grains per tiller. Wider spacing results in healthier plants.”
What is interesting about the text the World Bank chose to include from farmers is that not one
farmer discusses any barriers or drawbacks to SRI. Moreover, all four farmers discussed the issue of labor
and claimed that SRI methods required less labor. Because the labor demands of SRI had emerged as a
key issue in the controversy over the economics of SRI, by including four farmers, all claiming that SRI
requires less labor, the World Bank foregrounded this issue and highlighted the seemingly unimpeachable
voices of farmers claiming that, in fact, SRI did not require more labor.
The next three interviews in the World Bank Toolkit were from researchers on different sides of
the debate, including Dr. Norman Uphoff, discussed at length earlier in the chapter; Dr. Amir Kassam, a
Professor at the University of Reading in the School of Agriculture, Policy and Development, who had
published at least three journal articles in favor of SRI; and Dr. Achim Dobermann, the soil scientist and
agronomist at IRRI who published “A critical assessment of the system of rice intensification” in the
journal of Agricultural Systems in 2004 (Dobermann, 2004) and coauthored “Fantastic yields in the
system of rice intensification: fact or fallacy?” (Sheehy et al., 2004) which concluded that “SRI has no

282
inherent advantage over the convectional system and that the original reports of extraordinary high yields
are likely to be the consequence of error” (pp. 1).
The interview with Professor Uphoff addresses the controversy in the first question, with the
interviewer asking, “Why is there resistance to the acceptance of SRI?” Professor Uphoff responds that
“SRI is really a paradigm shift from an earlier understanding of how we can get the most out of rice
crops. … The Green Revolution was very successful and had a very simple paradigm which was you
improve the genetic potential of the crop and then you add extra inputs, more fertilizers, more water, more
agrichemicals and so forth. And it works.” The alternative paradigm of SRI is one where you change the
“soil, the water and the nutrients to get a better phenotype from any genotype. And so, it is a whole
different approach to the way in which we can nurture and benefit from crops.”
In framing the debate as a paradigm shift, Professor Uphoff essentially makes the claim that the
scientific principles that undergirded the Green Revolution, namely the improvement of crop genotypes
through breeding, may not be sufficient to understand the benefits of SRI. At the same time, he aligns SRI
with an entire worldview that is already amenable to low-input agriculture and especially those groups
that are weary of genetically modified crops. He also tunes into a much broader literature on scientific
revolutions that is likely to be familiar to many of his colleagues, who are sympathetic to critiques of
mainstream science. Thomas Kuhn’s 1962 “The Structure of Scientific Revolutions” (Kuhn, 1962), which
argued that normal scientific progress usually proceeds linearly through “development-by-accumulation”
but occasionally, the conceptual continuity of normal science is interrupted by periods of revolutionary
science in which fundamental “paradigms” change, forcing scientists to re-investigate old assumptions
and fundamentally re-directing the course of scientific research. Kuhn’s book is very famous. Currently in
its fourth addition, it has been cited more than ninety-eight-thousand times according to Google Scholar
and is especially well-known in Science & Technology Studies (STS), a field that is also well-integrated
into alternative development movements, like the Farmer First Movement (Chambers, Pacey and Thrupp,
283
1989; Scoones and Thompson, 2009). By framing SRI in these terms, Uphoff argues that this technology,
developed not by formally trained scientists but by farmers and civil society in Madagascar, has the
potential to revolutionize our approach to agricultural science, all while raising yields, reducing inputs,
and making agriculture more resilient in the face of climate change. Moreover, by employing Kuhn,
Uphoff is shielding himself and SRI against the claims of the established rice research community who
argue that his claims about SRI are impossible according to established rice science.
When Uphoff was asked about the question of labor intensity of SRI, he replied that “when we
first started working with SRI, we were working in Madagascar where farmers found the methods to be
fairly labor intensive requiring more work per hectare to get their result.” Uphoff continued that despite
the apparent labor intensity of SRI, that SRI’s benefits still outweighed the increased labor costs, saying
“we accepted that this is a labor-intensive technology but that is the price you pay to save water, to save
seeds, to have higher yields and so forth.” But as Uphoff and his colleagues gained more experience with
SRI with a wider variety of farmers, under a wider variety of conditions, he became convinced that SRI
was not necessarily more labor intensive. Some farmers in Madagascar, for example, started telling
Uphoff’s research team that “after the second or third season it started saving labor.” Based off of the
experience of GTZ (Deutsche Gesellschaft für Internationale Zusammenarbeit) in Cambodia in 2004,
Uphoff continues that “if you look at the SRI farmers, some are new farmers some are experienced
farmers. And the new farmers they take 10-20% more labor per hectare for their results. But once farmers
get used to the methods and technologies and acquire both skill and confidence, it’s less labor.”
A separate interview with Dr. Willem Janssen, Senior Agricultural Specialist at the World Bank,
who was involved with the Bank’s own SRI project, provides perhaps the most useful insight on the labor
question. He explains that there are big differences between SRI and farmers’ traditional practices in
terms of when in the cropping cycle labor demands peak. The implications of Janssen’s insight is that
changes in the temporal patterns of labor intensity of rice cultivation not only require individual behavior

284
change on the part of the landowner, but often require community wide behavior change as rice
cultivation is almost always done either with hired-labor for wealthier farmers, or with shared community
labor for the poorest farmers, who exchange labor between households.
Towards the end of the interview, when Uphoff is asked if there are any downsides to SRI, he
claims that there are none, “when we started we were sure that there had to be some downsides to this. I
mean I have worked in the development for 40 years and nothing is ultimately as good as it appears at
first. At first as I said we thought that labor intensive [of SRI] is going to be a sticking point but that has
not proved to be the case.” Uphoff continues, that the only potential downside is that increased yields
might reduce market prices, but of course this is a risk with any technology in the agricultural sector and
therefore cannot be viewed as a critique of SRI as much as evidence of its success. Uphoff continues, that
“I have been looking for the negatives, we are not afraid of them. First of all, we have got so many
positives that we can certainly absorb some negatives but I just haven’t seen them.” He concludes his
response to the question about drawbacks by listing even more positive attributes of SRI, “on top of our
paddy yields, we get 15% more milled rice because there are less breakage of grains and less chaff. That’s
the unfilled grains in the paddy. So, see that is really a nice bonus. We find that the crops mature one to
even three weeks sooner which means we use less water for irrigation and we also have land freed up for
vegetable and other crops.”
Professor Uphoff’s response to the question of downsides to SRI is exactly the type of response
that has driven many of his critics to openly disparage SRI. The idea that any technology could have no
drawbacks seemed to many agricultural scientists either naïve or willfully disingenuous. One mainstream
agronomist I interviewed in India, who asked to remain anonymous, told me they thought Professor
Uphoff wanted to save the world, and when he was unable to do this as a political scientist, he went out
and found a technology that he imagined could save the world, and he has been fighting to realize his
dream ever since, with no regard for the actual facts.

285
The World Bank’s Toolkit continues with an interview of Dr. Dobermann. When Dr. Dobermann
is asked about his reservations about SRI, he directly counters Professor Uphoff’s claims that SRI is a
paradigm-shifting technology. Instead, he says that “it is important to understand first what SRI means. It
is essentially a set of management practices, nothing else.” The interviewer follows-up, asking “are you
saying that SRI is simply a set of good management practices?” and Dr. Dobermann replies that “some of
them [SRI management practices] are the same we recommend, some of them I think are unnecessary or
are very difficult to implement by farmers. … We don’t call it SRI, we call it good management practices
or best management practices or recommended management practices”. Dobermann continued that “if
you compare SRI with what we would promote as a best management practice, there is no significant
difference.”
In so doing, Dobermann is making an argument that would later be made on IRRI’s website—
namely that there is nothing specifically unique about SRI—it’s just one set amongst many of good
management practices. This is an interesting rhetorical move because it moves IRRI away from the
controversy, while ensuring that SRI receives very little credit as a novel innovation worthy of funding.
At the same time, Dobermann dismisses SRI as simply “good management practices” he also
makes a second interesting point that “I have often seen in these [positive] reports on SRI, is SRI being
compared in farmers’ fields against something that is called conventional management. What is called
conventional management has nothing to do (or very little to do) with what we would consider being a
best management practice. What I am trying to say is that “yes,” if you implement these practices very
carefully you will get pretty good rice yield but we know we can achieve that.” This argument, that SRI is
not particularly interesting because its being used in farmers’ fields to get yields similar to what IRRI can
do with its BMPs, is also illuminating because while Dobermann is using the argument as a strike against
SRI, most development professionals would consider a technology that closes the yield gap between what

286
expert agronomists are achieving and what resource poor farmers are achieving, as a highly promising
technology, rather than something worthy of dismissal.
Finally, directly contradicting Uphoff, Dobermann argues that that the dynamics of labor in SRI
are complex and highly contingent on the expertise of the farmer practicing SRI. Instead, Dobermann
argues that “we have strong reservations in terms of the claims being made about the general applicability
of SRI. Because it is a very labor intensive practice, it is a very knowledge intensive practice.” He
continues, “[t]here are many rice cropping systems in the world where it will be next to impossible to
convince farmers to use management practices of the labor-intensive kind that the SRI represents.” He
concludes, almost as an afterthought, that for the poorest farmers “where plenty of labor is available” SRI
may have some value. In framing his argument around SRI and labor around the average socioeconomic
trends of rice farming towards mechanization and away from labor intensity, he almost completely
dismisses the potential value of the technology for one specific group of farmers – the poorest farmers –
whom IRRI, especially under the millennium development goals (MDGs), should be particularly
concerned with.
A third issue that is raised repeatedly throughout the interviews in the World Bank’s toolkit is that
of water. Uphoff addresses the dynamics between SRI practices and water in his comments. He explains
that with SRI “you have to ensure that the soil is not continuously flooded, not hypoxic, not suffocating
the plant roots and the soil organisms.” In order to do this, it is “very critical to get enough water but not
too much.” Janssen from the World Bank goes a step further and points out that irrigation infrastructure is
actually integral to the adoption of SRI, because “water must come at different moments and that might
be one of the more difficult things to manage [in SRI].” Janssen continues, that “many irrigation systems
in India work with quite big bulk delivery of water. So, at a certain moment the canal opens up, the water
starts coming out. Farmers have water for a day or two and then it stops again in the gravity systems. An
important aspect for SRI systems would be that the amount of water that arrives at the farm must be

287
smaller, but it should come more often.” These changes Janssen points out would be substantial changes
for many irrigation systems in India.
In summary, there are three main areas of continued controversy and knowledge gaps that come
out of a close reading of the World Bank’s toolkit. First, while SRI reduces overall water requirements for
rice cultivation, farmers practicing SRI still requires access to water and specifically, more flexible
control over when and how frequently they water their fields. While Dr. Janssen sees this as a major
concern for widespread adoption of SRI, Uphoff does not cite this amongst the drawbacks of SRI, which
he claims do not exits. But from a sociotechnical perspective on innovation, if the irrigation infrastructure
does not fit the requirements of the technology on the ground, then there will be major barriers to
widespread use of SRI. In Section 3.5, we will see that this issue plays a major role in limiting widespread
use of SRI in Bihar, and more importantly, that the relationship between access to irrigation and success
of SRI in Bihar is mostly overlooked by the government programs attempting to rapidly scale the
technology.
Second, the World Bank’s toolkit highlights the continued controversy over the labor dimensions
of SRI. While SRI’s proponents (and some more dispassionate observers) argue that although SRI
requires more labor in the initial years as farmers learn a new skill-set, after two to three years SRI is
either labor neutral with farmers’ pervious management practices, or even reduces labor requirements.
However, the labor debate, even in 2018, is still far from settled. This is at least in part because there are
so many variations in how, and by whom, the labor is performed. With the variations, including those by
country and region, it becomes almost impossible to have a definite and generalizable resolution to the
labor question. I will discuss these themes further in Section 3.4, as this issue emerges as a central point
of contention in controversy around SRI at the local level in Bihar.
Finally, and perhaps most existentially, the World Bank’s toolkit highlights continued controversy
over the degree to which SRI is a new technology with emergent prosperities, that make the specific set of

288
management practices embodied in SRI technology more than the sum of the parts. Or alternatively,
whether SRI is nothing more than a re-packaging of management practices that have all individually been
around for decades, if not centuries, and included in various BMPs or historical rice cultivation methods.
While this aspect of the continued controversy may seem almost irrelevant – after all, as long as SRI
methods benefit farmers does it matter exactly when they were invented – I will argue that the
controversy is demonstrative of a tendency on the part of the established rice research community to
overlook an important aspect of the SRI phenomenon. Namely, whether or not SRI is something entirely
novel or not, the SRI movement both in Bihar and other parts of India has catalyzed farmers to adopt
improved agronomic practices, both in rice cultivation as well as across a wide spectrum of crops. In this
sense, SRI has been a powerful sociotechnical phenomenon for changing farmers’ behavior in an aspect
of agriculture that is relatively knowledge intensive. That IRRI agronomists would choose to overlook the
importance of an approach to changing farmer behavior that has proven to be effective (irrespective of the
scientific underpinnings of the approach), is indicative of siloed and disciplinary thinking within the rice
research community, that is a barrier for reorienting agriculture innovation systems towards the needs of
the poorest farmers.
3.4 Selection of SRI at the Local Scale
While the transnational debate around SRI was taking place in research journals and conferences, a
similar debate was simultaneously occurring at the national and local levels, around the world. This
section specifically looks at the selection of SRI in Bihar, one of the poorest states in India. The section
focuses on the mechanisms that drove the selection of SRI in Bihar as well as the controversies
surrounding SRI in Bihar, which both mirror and shed light on the controversies at the transnational level.
Some of the same actors that appear in the transnational story also play an important role in Bihar.
Both Norman Uphoff and Achim Dobermann engage at times at the local level in Bihar and the

289
experience of SRI in Bihar is channeled back into the transnational discussion through features in
international newspapers like The Guardian (Vidal, 2013) and The New York Times (Kumar, 2013).
The history of SRI in India was meticulously documented through 2006 by Professor Shambu
Prasad at the Xavier Institute of Management in Orissa (Prasad, 2006).105 SRI was first introduced in
India around 1999 through multiple pathways that all had their roots in civil society and left-leaning
community organizations. It first attained more widespread use in southern India, including Tamil Nadu,
Andhra Pradesh, and Karnataka in the first decade of the 21st century. In 2010, the SRI-India network in
collaboration with WWF, surveyed members of the growing network of SRI practitioners in India and
estimated that the technology had been introduced in at least 30 of India’s 36 States and union territories.
By another metric, SRI had been introduced in 246 out of 564 rice-growing districts in India.
However, most adoption of SRI through 2010 had been facilitated by NGOs, international donors,
and academic research institutes with only minimal support from either state or central government. That
would change in 2011, when the state of Bihar in eastern India decided to incorporate SRI as a central
component of its agricultural strategy. The formal selection of SRI by the state government in Bihar led to
my decision to use the state for my case study. In this section, I focus on understanding selection
mechanisms for SRI at the state level, including ways in which conflicts over SRI at the state level
mirrored the transnational debate. In section 3.5, I evaluate the performance of SRI as a “pro-poor”
105 It is worth noting that the research for this report was funded by WWF which is listed before the Xavier Institute of Management in the publication details. When I visited Professor Prasad at his university in Orissa in the summer of 2011, I met a man deeply committed to SRI and who like Professor Uphoff had been deeply shocked by virulent debates around SRI in 2004. This project was a clear response to those debates and an effort to catalog every detail of this history of SRI in India to ensure that its successes and the people responsible for those successes were not forgotten in the debate. In many ways, Professor Prasad was not unlike Professor Uphoff – so convinced by the promise of SRI and so incensed by the reaction of the established rice research community to the technology that he devoted a considerable amount of time and effort to the documentation of every facet of the technology and its history in India and was willing to meet with anyone who he felt he could bring to his side.

290
technology in Bihar, focusing specifically on some of the lingering controversies identified in the analysis
of the World Bank’s Toolkit.106
3.4.1 Initial Selection of SRI in Bihar
While there are some reports of initial experiments with SRI at Bihar’s Rajendra Agricultural
University (RAU) as early as 2004, there is limited documentation or information about what was done.
The first documented promotion of SRI outside RAU was during the monsoon season of 2007. Anil
Verma, a rural livelihoods development professional with the NGO Pradan, opened a satellite Pradan
office in the city of Gaya that year and began teaching SRI practices in a single village. He was so
impressed with the performance of the technology and its potential to help the poorest farmers in Bihar
increase their yields without investing in expensive technologies, that he eventually started his own NGO
exclusively focused on the promotion of SRI, which he called PRAN (Preservation and Proliferation of
Rural Resources and Nature).
After the first year of success, Anil began to invite local political figures and agriculture specialists
to observe the high yields farmers were getting with SRI in the villages where he worked. The farmers he
worked with reported doubling their yields using SRI methods, while also saving money on input costs
because SRI required fewer seeds per acre. Though many of Anil’s initial visitors from the government
and Indian agriculture research centers were skeptical of SRI, conversations with the farmers practicing
SRI in these villages changed their perceptions.
106 Note that I discuss Bihar at length in Chapter 2. I will thus leave important background out of Chapter 3, assuming that readers can access this information in Chapter 2.

291
3.4.2 SRI as a Political Agenda: Government Support for SRI in Bihar
Interestingly, while the selection of SRI as a “pro-poor” technology at the transnational scale was
the product of a large network of actors across NGOs, donor agencies, and academic departments, the
selection of SRI at scale in Bihar was a highly centralized and top down affair. Except for the small group
of NGOs who promoted SRI between 2007 and 2010, the technology was not widely known in Bihar.
That all changed between 2010 and 2011, when Nitish Kumar, the technocratic Chief Minister of the
State, designated 2011 the official year of SRI in Bihar, launching a plan for a “SRI Kranti” or “SRI
Revolution.” Nitish declared that SRI would help make Bihar a “rice basket” for India. He followed up
his rhetoric with real funding. The 2012-2017 Agriculture Road Map allocated substantial financial
support to promote SRI amongst Bihar’s farmers. The total budget for SRI promotion was 144 million
dollars, which was approximately 8% of the total budget allocation in the 2012-2017 Agriculture Road
Map of 1.8 billion dollars (see Table 3.2).107
Table 3.2: SRI as portion of total budget for 2012-2017 Agriculture Road Map. In totality, SRI receives 7.9% of the 1.8-billion-dollar investment over the five-year plan - 144 million dollars.
Spending Category 2012 - 13 2013 - 14 2014 - 15 2015 - 16 2016 - 17 2012-2017
System of Rice Intensification subsidies and extension 9.6% 8.9% 7.9% 6.9% 6.3% 7.6%
Conoweeder or Weeder Technology 0.5% 0.3% 0.2% 0.2% 0.1% 0.2%
Budgetary spending on System of Rice Intensification as a proportion of total agricultural budget
10.1% 9.2% 8.1% 7.1% 6.4% 7.9%
107 As discussed in Chapter 1, the 2012-2017 Agricultural Roadmap outlined a broad and ambitious strategy for improving agriculture productivity and ameliorating rural poverty in the state. As a sign of the Chief Ministers technocratic ambition, Bihar’s roadmap was the first state-level agriculture sector road map in India.

292
The subsidy package for SRI provided by the government is not a monetary reward for following
SRI methodologies, but rather a subsidized kit of inputs, including of 2kg of seeds and 3kg of fertilizers
per subsidy recipient. This subsidized kit is designed to be sufficient to cover one acre of land using SRI
methods. In some cases, conoweeders are also provided through the subsidy program (though the rule for
which farmers receive a conoweeder was never entirely clear, and while the government claimed that all
recipients of the subsidy received conoweeders, in fact, many farmers who got the subsidy claimed to
have only gotten seeds and fertilizer). The number of subsidy kits available is also limited on a
geographical basis with approximately 1,000 kits available in each administrative block. There are a total
of 534 blocks in Bihar, with an average population of 350,000 households per block, meaning that the
SRI subsidy package is only available to a fraction of the households in any block.
In a resource-constrained state, with a minimal tax base which relies heavily on support from the
central government in New Delhi (Singh and Stern, 2013), 144-million dollars is a substantial amount of
money to earmark for a technology that in 2012 (and even today), remains controversial amongst many
experts both transnationally and within India. This raises the important question of why Nitish selected
SRI as such a central part of his Agricultural Road Map, when technologies with more proven track
records were widely available.
While many of Nitish’s advisors visited villages where SRI was practiced and were clearly
convinced that the technology had the potential to benefit Bihar’s farmers, there were also important
political considerations that led Nitish to select SRI so quickly and earmark so much financial support to
promote the technology. Unlike most of the other technologies in the Agriculture Road Map, SRI came
pre-packaged in a narrative that was extremely attractive to Nitish Kumar. This narrative included two
elements. First, SRI could be promoted as a specifically “pro-poor” technology and given that the vast
majority of Nitish’s voting base consisted of the rural poor, promoting such a technology had real
political advantages for his electoral strategy. Second, SRI was also a technology that could bring Nitish

293
the type of recognition he craved from the central government (in 2012, Nitish still had his eye on the
Prime Minister’s seat). I discuss both of these elements in more detail in Sections 3.4.2.1 and 3.4.2.2
below.
3.4.2.1 SRI as a “Pro-Poor” Electoral Strategy As Nitish approached his second election in 2010, there was a clear need to appeal to the rural
poor who made up the majority of Bihar’s electorate. SRI presented a powerful opportunity to showcase
Nitish’s commitment to this group because the technology already had symbolic value as a “pro-poor”
technology, both internationally and increasingly, amongst the poor farmers working with PRAN to adopt
the technology.
Nitish capitalized on the “pro-poor” symbolism of SRI by bringing onto his 2010 election ticket a
female SC farmer who was an early adopter of SRI, Jyoti Devi (Jha, 2011). Jyoti Devi came from a
particularly disadvantaged scheduled caste known as the Musahars, who are infamous amongst Bihar’s
higher castes for eating rats as part of their diet. In fact, an article that ran in the Times of India about
Jyoti’s election was even titled “Beyond the Rat Race” (Times of India, 2010). This article is particularly
revealing in the way it described how Jyoti became part of Nitish’s election ticket in 2010. From Jyoti’s
description, she was essentially plucked out of thin air to be on the ticket, making it clear that Nitish had
sought out her candidacy for the things she symbolized – lower caste empowerment, female
empowerment, and the potential of SRI to transform the well-being of the poorest farmers.
Jyoti embodied the power of SRI to transform the well-being of the poorest farmers in Bihar in her
election campaign (Devi, Jyoti, personal interview, August 2011). She won her seat in the 2010 election
and remains a member of Bihar’s Legislative Assembly (MLA) in the lower house. Since then, she has
continued to champion SRI amongst her constituents and she continues to work with PRAN. Indeed,
today when PRAN has a political problem, Jyoti Devi is often the first person that Anil reaches out to in
order to find a solution.
294
For Nitish, his support of Jyoti Devi served as a living symbol of his commitment to female
empowerment and the needs of the rural poor. Jyoti’s place in his political party after the election
continued to underline the fact that so much of the funding in Bihar’s Agriculture Road Map was
allocated for the “pro-poor” technology she pioneered.
3.4.2.2 SRI as a Geopolitical Strategy A second key factor motivating the significant political and financial resources allocated to SRI by
Nitish had less to do with local politics than with national, and even global, politics. In 2010, when Nitish
began the process of selecting SRI, the reported yield increases rivaled some of the highest rice yields
achieved anywhere in India. The ability of Bihari farmers to compete with the yields of India’s major rice
growing regions, including West Bengal and Punjab, showcased Nitish Kumar’s technocratic
bonafides.108
The value of SRI as a symbol of Nitish’s broader achievements in developing Bihar’s agriculture
potential came in 2012, when a small farmer in Nalanda district, Sumant Kumar, reportedly harvested
22.4 metric tons of paddy from a single hectare of land, breaking a world yield record held by a farmer in
China (Ahmad, 2013). Fueled by competitive geopolitics, Sumant’s agricultural achievements garnered
widespread domestic and international attention. His yield record was reinterpreted as a triumph for
Bihar’s chief minister and for the country as a whole (Krishnan, 2013; The Times of India, 2013; Vidal,
2013; Times of India, 2014). For his achievements, Sumant was awarded a prize in New Delhi by the
Union Minister of Agriculture (Nadimi, 2012).
108 Recall from Chapter 2 that when Nitish Kumar took over leadership of the state, it was seen by many as India’s most under-developed state. Moreover, over the past five decades, Bihar had witnessed the slowest agriculture growth rate of any state in India (Kishore, Sharma and Joshi, 2014)
295
The geopolitical importance of Sumant’s yield record is underscored by two facts. First, widely
read articles on Sumant’s yield record, and the transformation of Bihar’s rice production through SRI
were written in both The Guardian (Vidal, 2013) and in The New York Times (Kumar, 2013). This leant
both international credibility to Nitish Kumar’s efforts, and much needed visibility on the international
stage, for a politician with national political aspirations. Second, the yield record was swiftly contested by
the Chinese government, as well as the farmer who had previously held the global yield record, Yuan
Longping. Longping, known as the father of hybrid rice in China, had claimed the yield record prior to
Sumant’s claims, and he quickly responded that the yield record in Bihar is “120 percent fake,” despite
having published positively about the potential of SRI in the past (Krishnan, 2013). Nonetheless, Sumant
was inundated with domestic and international visitors (including delegations from China), hoping to
learn more about how a poor Bihari farmer achieved such high yields
In addition, Sumant’s reported yield record inserted Bihar into the transnational debate over SRI.
In response to the yield record, Achim Dobermann published a blog post on IRRI’s website titled
“Another new rice yield record? Let’s move beyond it” (Dobermann, 2013). Dobermann’s response was
critical of the widespread support for SRI in Bihar without the “scientific evidence” to back up claims of
SRI’s potential, “we need to concentrate our efforts on actionable solutions that are science-based and
tailored to the local situations and needs.”109
3.4.5 Selection Controversies at the State Level
Since the selection of SRI in 2011 as a major component of Bihar’s Agriculture Road Map, the
Government of Bihar has labelled the SRI program as an unqualified success. In public statements,
government officials have causally attributed overall increases in paddy yields in the state to the adoption
109 In highlighting the importance of tailoring solutions to the local situation, Dobermann in fact hits on one of the key challenges to the Bihari government’s massive SRI program, which as I will demonstrate in Section 3.5, largely fails to live up to its reputation and potential.

296
of SRI by farmers (Times of India 2013). In 2013, Bihar’s agriculture production commissioner, Alok
Kumar Sinha, said that “SRI requires less water and gives 2-3 times the yield compared to traditional
cultivation of rice” and “is set to change the face of paddy cultivation in the state as thousands of farmers
have been adopting it following encouraging results” (Business Standard, 2013). A report published by
the GoB’s Finance Department in 2015, directly credited the adoption and widespread use of SRI as the
causal driver behind increased paddy yields since 2011. It stated that “because of the use of new ‘SRI’
technique and new agricultural implements, there was an enormous rise in rice production” (Government
of Bihar, 2015).
According to the GoB, in addition to SRI’s benefits in terms of increased yields, the technology
also has a second important physical dimensions in the drought-prone state – SRI not only requires less
water in general, but it can also help farmers withstand drought. During a year where droughts affected
many of Bihar’s districts, the Principal Secretary of Agriculture for Bihar, A. K. Sinha, credited SRI with
helping farmers overcome the drought, saying in the Times of India that farmers planting with SRI
methods would not be affected by the drought because SRI requires less water for irrigation (Dayal,
2011).
However, not all experts in the state are as excited about SRI as the government. For example, in
conversation over tea during a conference at Rajendra Agricultural University (RAU), Bihar’s premier
agriculture research institute, a group of agronomists told me that they believed the government’s figures
for SRI adoption were inflated by as much as 75%. They believed that the data on increased paddy yields
statewide was likely true, but that the causality had been misattributed. While they were not sure all of the
reasons that yields had risen, they credited improved access to higher quality seeds, as well as favorable
monsoons, as two likely factors that led to improved paddy yields in 2011 and 2012.
These same agronomists argued that the Bihari government should shift some of the funding out of
SRI and towards a different approach to rice cultivation – direct seeded rice cultivation (DSR). Of course,

297
this recommendation also aligned with their own professional incentives, given that they were conducting
research on direct seeded rice. They had taken multiple meetings in Bihar’s capital, Patna, to convince the
government to shift funding out of SRI and towards DSR. And according to news reports, their advocacy
is being heard in Patna where in 2015, the government increased funding for DSR (Fernandes, 2015).110
The agronomists even showed me a summary of a study which they claimed “proves” that DSR is
superior to SRI. The study these agronomists showed me is worth discussing in some detail. While it had
not been formally published in a peer-reviewed journal, a summary of the study is available in a report
from the Borlaug Institute for South Asia (BISA), a research center near RAU, funded by the CGIAR
where many of the scientists have dual-appointments (Borlaug Institute for South Asia, 2015). The
summary is short and excludes many of the important details one would need to properly evaluate its
credibility, but a few things stood out that I discussed with my colleagues at RAU.
The BISA study found that while in upland conditions SRI led to the highest yields (as compared
to DSR and locally traditional techniques), the net return of SRI was lower than for either DSR or
traditional methods, and in lowland conditions they found that the net returns for SRI were negative
(Borlaug Institute for South Asia, 2015).
While the underlying data for the study has not been published, I asked the agronomists how they
came to these figures that have already begun to influence policy in Bihar. I found that their calculations
about net profits are driven by their assumptions about higher labor demands of SRI. The main issue is
quantifying the additional labor required under SRI. Many evaluations of SRI have found that SRI
methods require additional labor-hours (Moser and Barrett, 2003); however, as discussed in section 3.3,
proponents of SRI contend that after an initial period where new farmers adopting SRI must learn new
110 Incidentally, in January 2016, I observed local extension agents demonstrating DSR to farmers in Gaya district. While there is not space here to discuss DSR in detail, suffice it to say that this technology is not appropriate for the poorest farmers. It requires a fairly large tractor and upfront investments in herbicides.

298
skills, that the labor investments are similar or less than traditional management practices. Many farmers I
spoke with in Bihar, agree with this assessment.111 If this is true, then the study’s calculations for net
profit are fundamentally flawed. However, even assuming that SRI does require some additional labor to
traditional management practices or DSR, their calculations may still be wrong. This is because they used
a figure for the value of a day of labor far above the actual wage-rate most farmers receive in the state.
To estimate the daily agriculture labor wage, they used the wage-rate stipulated by the Mahatma
Gandhi National Rural Employment Guarantee Act (NREGA) which at the time in Bihar was
approximately USD 2.50 per day. However, many farmers, and especially female farmers, report not
having access to NREGA opportunities, and where NREGA work can be found, laborers often do not
receive the full daily wage due to corruption (Dutta et al., 2012; Liu and Barrett, 2012). Instead, based off
of data I collected in the 11-village survey, my estimate of the regularly available daily wage for
agricultural labor is approximately USD 1.00 per day – less than half of the wage rate used in the BISA
economic evaluation of SRI. Not only does the inflated wage rate used by the BISA report’s authors
undercut their empirical findings that SRI compares negatively with DSR and traditional practices in
terms of net profits, it also demonstrates that the authors are out of touch with the realities facing Bihar’s
farmers, where lucrative off-farm employment opportunities, especially for women, are limited.
111 While my own field survey did not focus on solving the question of labor requirements SRI, I did find that, in 15 focus groups with SRI practitioners supported by, when asked about the labor requirements of SRI, no focus group said that the labor involved in SRI was significantly more arduous or time consuming than their former management practices. Focus group respondents overwhelmingly said (all 15 focus groups) that in the first year of practicing SRI, the new skills required increased time and attention to detail, but after they had mastered the SRI skill set, the consensus was that the labor required to plant using SRI methods was either the same as their earlier management practices (eight focus groups) or that SRI actually decreased the labor intensity of rice cultivation (seven focus groups). However, in the additional eight focus groups I conducted with randomly selected SRI practitioners, I found a wider range of responses. In five of these focus groups, increased labor costs were raised as an impediment to SRI adoption. However, in most of these discussions it turned out the claims of higher labor costs were usually associated with the need on the part of larger farmers to hire labor for transplanting the paddy crop from the nursery into the main field. Some larger farmers (especially those farmers who had received a government subsidy for SRI) were unable to find labor willing to use SRI methods. Overall, it was not clear that any of the farmers actually felt that SRI increased overall labor as measured by man hours, but for many larger farmers the transaction costs of finding laborers willing to deviate from traditional transplanting practices is not worthwhile.

299
In summary, just as at the transnational level, actors at the local level in Bihar contested the
benefits of SRI. Both the proponents of SRI (especially the government) as well as the critics, were guilty
of selecting SRI (or critiquing SRI) based more on their own professional incentives than on the actual
merits of SRI as a strategy for helping the poorest farmers in Bihar. In fact, the actual performance of SRI
as a “pro-poor” technology (beyond the strong results demonstrated by farmers working directly with
NGOs) remained largely unknown and un-studied in Bihar, even in 2015 when the BISA report was
published.
3.5 Evaluating Success of SRI as “Pro-Poor” Technology in Bihar
SRI was selected by Bihar’s government as a “pro-poor” technology that could help Bihar’s
poorest farmers improve their yields and withstand drought. Since the official selection of SRI in 2011,
the government has declared SRI a success and a causal factor leading to Bihar’s yield improvements in
paddy. Bihar’s reported success with SRI has also been championed internationally in the Guardian and
the New York Times. The well-known NGO, Ileia, which aims to provide alternatives to Green Revolution
technology, highlighted Bihar’s success with SRI in 2013, in an article written by Anil Verma from
PRAN in their quarterly magazine, Farming Matters (Verma, 2013).
Surprisingly, for a government program with such a large budget targeted at promotion of a
controversial technology, and in a state where multiple development research organizations are actively
working (e.g. The Jameel Poverty Action Lab (JPAL), IDinsight), relatively little independent
information is available on the successes and failures of SRI in Bihar. While I was in Bihar, JPAL was in
the midst of conducting an evaluation of the effectiveness of training videos from the NGO Digital Green,
which taught farmers about the methods involved in SRI. However, the assessment was focused on the
value of videos as an extension methodology and not on evaluating SRI as a technology. Nonetheless, it

300
would have provided some useful insights on SRI in Bihar. Unfortunately, the project seems to have
languished and data collection was never completed.
Without better data, what is known about SRI comes from government figures which many experts
believe are exaggerated (recall the experts at RAU think they are inflated by as much as 75%). The lack
of better data leads to potentially spurious causal claims about the benefits of SRI. For example, in Anil’s
article on SRI for Ileia he said, “[d]uring the 2011-2012 season the state’s statistics showed 335,000
hectares of SRI rice, involving thousands of families. The total production of paddy in Bihar, 7.2 million
tons, broke the previous state record of 4.6 million tons. Much of this increase has come from SRI fields,
where the average yields are around seven tons/ha” (Verma, 2013, p. 44). Here, Verma makes a large
assumption when he claims that the adoption of SRI on 335,000 hectares is responsible for the overall
increase in paddy production in the state of more than 50%. Even if the 335,000 figure is credible (which
it may not be), this figure is only 10% of Bihar’s 3.2 million hectares under paddy cultivation. The idea
that changing cultivation practices in only 10% of the total paddy could raise overall paddy production by
more than 50% strains credibility. But more problematically, there is simply a lack of verifiable data,
either from 2011 or later years, substantiating the governments claims about SRI. When I asked a lower-
level staff member in the Department of Agriculture about the methodology behind the government’s
adoption data, they suggested that they used the quantity of subsidy provided as a proxy for overall
adoption. However, the likelihood that there was both “leakage” in funding for the SRI subsidy program
and that not all farmers who received the subsidy actually practiced SRI, is very high. This means that
GoB’s estimates of SRI adoption by farmers in Bihar are suspect.
Apart from the incomplete JPAL evaluation, two reports and one journal article looking at SRI in
Bihar have been published— all three since 2016 (Pandey, 2016; Sethy et al., 2016; Waris, 2017). These
three articles provide interesting and complementary insights to my own data collection and I include
their findings in addition to my own in this section, evaluating the performance of SRI in Bihar.

301
My own evaluation is based on the 11-village field surveys and the 23 farmer focus groups, in
addition to months of emersion in Bihar’s agriculture system. The evaluation sheds light on multiple
important sociotechnical dynamics that mediate the relationship between the physical and institutional
characteristics of SRI in general, and the benefits the poorest farmers in Bihar realize from SRI.
My overall findings (detailed below) are that SRI is providing important benefits to some farmers
in Bihar. However, adoption is likely not as widespread as government figures suggest. Moreover, the
benefits of SRI have largely accrued to wealthier farmers, undercutting the government’s “pro-poor”
claims about SRI. In addition, the government’s statements that SRI has helped Bihari farmers overcome
draught is also highly suspect, because the biggest reason farmers give for not adopting SRI is lack of
water. Finally, the state’s flagship SRI subsidy program is benefiting wealthier farmers at much higher
rates than the poorest farmers.
Despite my overall skeptical evaluation of the benefits of SRI in Bihar, there are several areas in
which some of the poorest farmers in Bihar have realized clear and unambiguous benefits. First, villages
where NGOs rather than the government are the main extension provider are more likely to have
proportions of the poorest farmers adopting the technology. Second, farmers who have been using SRI
methods for more than three seasons, overwhelmingly report positive benefits from the technology,
including higher yields, decreased input costs, and fewer labor-hours. Above and beyond the direct
benefits of SRI to adopters, SRI has also led to an interesting cultural shift in Bihar toward a greater focus
on the importance of improved agronomic management practices. Indeed, a kind of SRI-phenomenon has
encouraged farmers throughout Bihar to think more about the agronomic practices they follow rather than
just what inputs they use. This cultural shift, towards more thoughtful agronomy in Bihar, is perhaps the
most important impact SRI has had on farmers in the state.
This evaluation is not an econometric assessment of the yield or profit gains associated with SRI in
Bihar. Rather, it is a broader sociotechnical evaluation of the adoption mechanisms at work in Bihar, with

302
specific focus on the mechanisms impacting adoption by the poorest farmers. Because SRI benefits the
poorest farmers in Bihar only under a limited set of circumstances, the findings shed light on the limits of
a technology with explicitly “pro-poor” physical dimensions, when the technology meets the
sociotechnical and agroecological realities of local conditions. This finding is of interest, both for its own
sake, but also because it sheds light on the larger theme of the chapter – the challenge of technology
selection for the poorest farmers. The finding demonstrates how actors responsible for technology
selection in Bihar overlook the actual performance of SRI in order to frame a narrative that supports their
own political and professional incentives. Below I discuss seven specific findings from my evaluation of
the performance of SRI in Bihar.
3.5.1 Limited Overall Adoption, But Adopters Report Positive Benefits
The results of the 11-village survey were surprising in several ways. First, 88% of households had
heard of SRI. In many ways, this was an impressive performance for a technology that was only
introduced to farmers in the state in 2007 and has been marketed exclusively by the state and NGOs (as
opposed to through private sector channels). In some villages, knowledge of SRI in the sample was as
high as 100%.112 In contrast, only 15% of farmers had heard of drip irrigation and less than 1% of the
farmers in the 11-village survey had adopted the technology, despite the fact that the technology has been
highly subsidized since 2006 (see Chapter 2).
However, despite widespread knowledge about SRI, actual adoption of the technology is not
nearly as widespread and data failed to corroborate the government’s reports that SRI is transforming rice
production across Bihar. Of the 338 households surveyed, only 19% of households (62 households in
total) reported practicing SRI at least once. Of those 62 households, 38 households had only used SRI
112 Villages where knowledge of SRI was between 95 and 100% were either villages close to major roads (where government extension support is more intensive) or in one case in a village where the NGO PRAN operates.
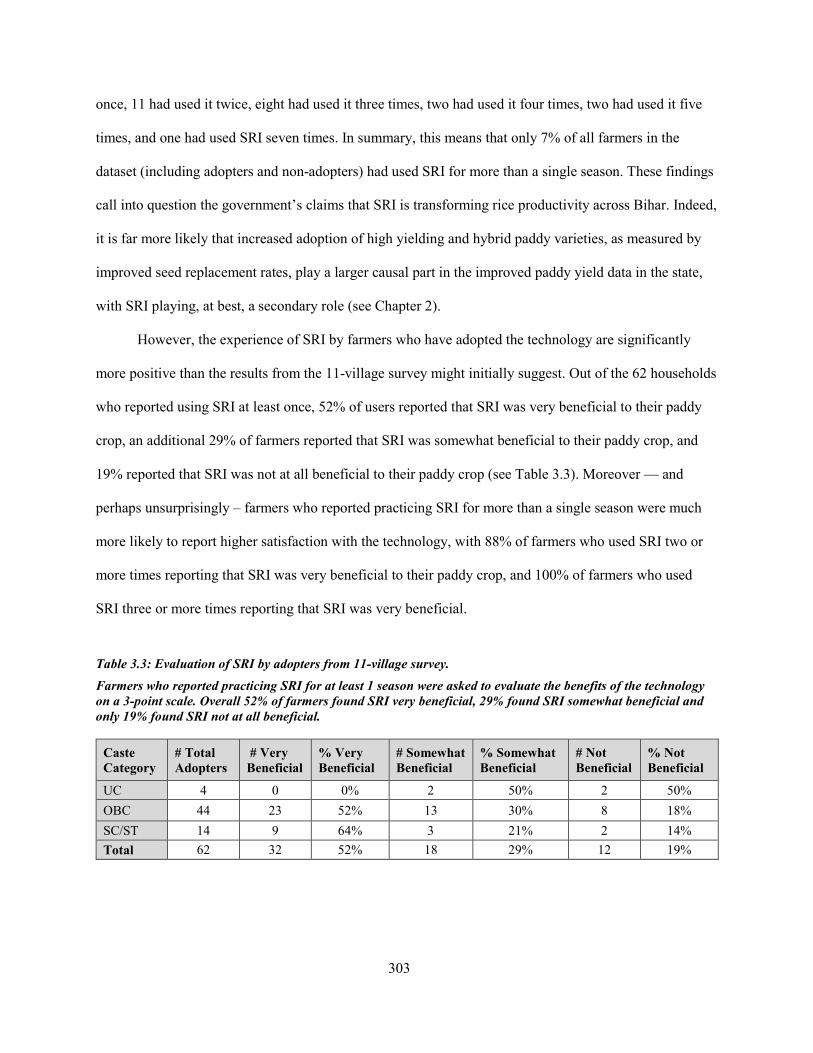
303
once, 11 had used it twice, eight had used it three times, two had used it four times, two had used it five
times, and one had used SRI seven times. In summary, this means that only 7% of all farmers in the
dataset (including adopters and non-adopters) had used SRI for more than a single season. These findings
call into question the government’s claims that SRI is transforming rice productivity across Bihar. Indeed,
it is far more likely that increased adoption of high yielding and hybrid paddy varieties, as measured by
improved seed replacement rates, play a larger causal part in the improved paddy yield data in the state,
with SRI playing, at best, a secondary role (see Chapter 2).
However, the experience of SRI by farmers who have adopted the technology are significantly
more positive than the results from the 11-village survey might initially suggest. Out of the 62 households
who reported using SRI at least once, 52% of users reported that SRI was very beneficial to their paddy
crop, an additional 29% of farmers reported that SRI was somewhat beneficial to their paddy crop, and
19% reported that SRI was not at all beneficial to their paddy crop (see Table 3.3). Moreover — and
perhaps unsurprisingly – farmers who reported practicing SRI for more than a single season were much
more likely to report higher satisfaction with the technology, with 88% of farmers who used SRI two or
more times reporting that SRI was very beneficial to their paddy crop, and 100% of farmers who used
SRI three or more times reporting that SRI was very beneficial.
Table 3.3: Evaluation of SRI by adopters from 11-village survey. Farmers who reported practicing SRI for at least 1 season were asked to evaluate the benefits of the technology on a 3-point scale. Overall 52% of farmers found SRI very beneficial, 29% found SRI somewhat beneficial and only 19% found SRI not at all beneficial.
Caste Category
# Total Adopters
# Very Beneficial
% Very Beneficial
# Somewhat Beneficial
% Somewhat Beneficial
# Not Beneficial
% Not Beneficial
UC 4 0 0% 2 50% 2 50% OBC 44 23 52% 13 30% 8 18% SC/ST 14 9 64% 3 21% 2 14% Total 62 32 52% 18 29% 12 19%

304
Of the 50 households that found SRI to be very beneficial or somewhat beneficial, most
households said that the main benefits of SRI came either in terms of increased yields (42 households) or
decreased input costs (32 households). Most households cited both of these factors. Out of the 50
households, a total of 13 households also mentioned increased crop robustness and/or pest resistance of
the paddy crop under SRI cultivation practices. Nine households cited reduced labor requirements as a
benefit of SRI, however an additional seven households, who claimed that SRI was either very or
somewhat beneficial, said that labor requirements were higher than with their previous management
practices. Only four households mentioned decreased water requirements as a benefit of SRI. However, in
each of these cases, these benefits were in addition to the improved yields or decreased input costs cited
by all households who reported that SRI was very beneficial or somewhat beneficial to their paddy crop
(note that these numbers were calculated from open-ended responses).
In addition, data from 15 focus groups conducted with SRI farmers supported by two separate
NGOs, reported overwhelmingly positive evaluations of SRI. Farmers in the 15 focus groups conducted
in communities supported by NGOs reported that SRI increases yields (often by more than 100%) and
decreases input costs. Farmers in all but one of the focus groups also reported that SRI yielded more
resilient crops that withstood storms and pest outbreaks better than their neighbors plots planted with
traditional methods. Perhaps most strikingly, SRI farmers reported improved community level
cooperation, though this is more likely due to the design of the extension interventions than to the
physical characteristics of SRI technology. Farmers in these 15 focus groups also reported some
drawbacks of SRI which I will discuss at greater length in the following sections (3.5.2).
Of the 40% of households in the 11-village survey (n=24) who were unsatisfied with SRI, many
reported that they had received insufficient training to properly practice SRI (n=11) and other households
reported that they did not see yield benefits (n=9). Many of the wealthier households reported that they

305
were unable to practice SRI because they could not hire labor willing to use SRI practices, but they were
also unwilling to pay a wage-premium to their labor for using SRI (n=6).
3.5.2 Benefits of SRI Skewed Towards Wealthier Farmers
Despite perceptions of SRI’s widespread success in Bihar, fueled both by the media and the
government, a more detailed analysis of the data from the 11-village survey is less supportive of the
government’s narrative of SRI as a “pro-poor” technology. The results of the 11-village survey showed
that the majority of farmers who had used SRI were wealthier farmers in terms of both landholding and
caste. Out of the 55 households in the survey with more than a hectare of land (2.5 acres), 42% had used
SRI at least once. In contrast, out of the 283 households with less than one hectare of land, only 13% had
used SRI. In terms of caste, 14% of UC farmers and 24% of OBC farmers had used SRI, whereas only
8% of SC/ST farmers had used SRI.113
The poorest farmers were also the least likely to have heard about SRI, with only 82% of SC/ST
farmers having heard of SRI, in contrast to 97% and 97% of UC and OBC farmers respectively. This
suggests that the poorest farmers were not being effectively reached by extension services. And indeed,
whereas the majority of UC and OBC farmers had heard about SRI through their block level extension
officers, the majority of SC/ST farmers who had heard of SRI, learnt about it from another farmer.
113 As discussed in Chapter 2, Section 5.2, caste is a useful measure of overall wealth in rural Bihar and has some advantages over landholding measurements. In order to discuss castes, I use the terminology in common use in Bihar to refer to different caste groupings. The caste groupings include: 1. “upper castes” (UC). These castes have traditionally formed India’s elite. In Bihar, the major forward castes have traditionally controlled the vast majority of agriculture land. The lower castes are grouped into several categories. The first, known as “other backward castes” or OBCs are generally the most socially and economically empowered of the lower castes. Scheduled Castes and Scheduled Tribes (SCs and STs) are a level below OBCs in terms of the social and economic empowerment. It is also worth noting, that the most common way to refer to the three caste categories is to use acronyms to describe OBC and SC/ST castes but to use the full words when describing UC castes (upper castes). I find this discrepancy unfairly biased and use acronyms in most cases to describe all three groups. I sometimes continue to use the full spelled out version when the use of the caste category is meant as a descriptive adjective rather than a noun (e.g. upper caste hegemony; lower caste empowerment).

306
However, for those farmers that actually adopted SRI, the poorest farmers were more likely to
report that SRI was “very beneficial”. For example, 64% of SC/ST adopters reported that SRI was very
beneficial. In contrast only 52% of OBC farmers and 0% of UC farmers reported that SRI was very
beneficial.
In summary, the results of the survey showed that the poorest farmers in Bihar are adopting SRI at
far lower rates than their wealthier neighbors. To the extent that adoption of SRI implies benefits,
wealthier farmers are realizing greater benefits from SRI and are certainly realizing greater benefits from
the government’s subsidy program. However, when the poorest farmers do have access to SRI, they
report greater satisfaction with the technology than their wealthier neighbors. The sociotechnical reasons
why the poorest farmers are adopting SRI at lower rates than their wealthier neighbors will be discussed
further below but include differentiated access to irrigation, differentiated access to extension services,
and differentiated access to the government’s subsidy program.
3.5.3 Water Biggest Barrier to Adoption of SRI
Water access and control is the biggest barrier to SRI adoption discussed by farmers in the 11-
village survey. Out of the 234 households who had heard of SRI but not adopted the technology, 83%
listed lack of access to or control over water among the primary reason that they had not adopted SRI
(other reasons included increased labor requirements, 44%, and lack of government support, 17%).114
The fact that access to water is the biggest barrier to adoption of SRI is surprising, both because
one of the key attributes of SRI is that it saves water and because the Bihari government has publically
claimed that the technology is helping farmers overcome drought conditions. However, what is often lost
114 Note: the fact that non-adopters list increased labor requirements as a reason for non-adoption of SRI should not be taken as robust evidence that SRI does increase labor. First, non-adopters would have little data to base this claim on, and second, non-adopters may have observed their neighbors putting in extra effort as the learnt the skills in the first year. Alternatively, non-adopters may simply not wish to learn the new skill. This is not to say that SRI requires less labor, but simply that data from non-adopters describes their perceptions which are critical in the technology adoption process, but not necessarily reality.

307
in the excitement over the fact that SRI uses less water, is that it requires more control over water
resources. This is because in order to practice any type of water-saving technology, farmers need a higher
level of control over their access to water. If for example, a farmer has access to water today, but is not
sure whether or not she will have access to water in the next week, she will choose to flood her field today
in order to mitigate the risk of crop damage should she face challenges accessing water over the course of
the next week. In contrast, a farmer who is confident that she will have access to water tomorrow, can
choose to irrigate less today with the knowledge that she can easily give her crop more water tomorrow.
The importance of water control for practicing SRI is particularly well illustrated by one anecdote
from Rajapur village, on the main highway leading from the district capital, Gaya.115 All households in
the village belong to SC/ST caste categories. The village itself was created from government wasteland
and given to landless families under the Government of Bihar Ceiling Act between 25 and 30 years ago.
The original land was largely barren and difficult to cultivate.
PRAN, the NGO lead by Anil Verma, began working with the village in 2008 and in many ways
the village became the NGO’s showcase village. Rajapur is a useful showcase village for two reasons.
First, the residents come from extremely marginalized castes, highlighting PRAN’s focus on the poorest
farmers. Second, the village is well-located for visiting politicians, development agency staff, and
academics, as it is only a 10 to 20-minute drive from the tourist destination of Bodhgaya (where the
Buddha attained enlightenment) as well as an airport which serves the flights from Bihar’s capital, New
Delhi (except during the summer’s low season), and many international charter flights from Japan,
Thailand, and other Buddhist countries. For this reason, the village receives more attention and resources
from PRAN than any other village, and I had gotten to know the residents very well since 2011. Not only
15 Villages where knowledge of SRI was between 95 and 100% were either villages close to major roads where government extension support is more intensive according to farmer responses about their source of information about SRI or in one case, in a village where the NGO PRAN operates.
308
have they received extensive training from PRAN on SRI, but PRAN has also funded the construction of
a water retention structure on their land, implemented a drip irrigation project, and built (in conjunction
with Jyoti Devi, the SRI MLA) a community meeting house in the village.
The benefits of PRAN’s intensive work in Rajapur village are evident on several dimensions. The
village, which consists of 49 households on 12 acres of land has transformed from barren wasteland to
extremely fertile and abundant farmland. In addition to very high paddy yields (averaging 9.2 tons per
hectare), they also grow vegetables in both the winter and summer seasons with drip irrigation. The
villagers also credit PRAN with giving them a voice to fight injustices. When a wealthy UC landowner in
a nearby village tried to take some of their land, the villagers marched directly to the District Collectors
office and demanded to speak with him. When men from outside the village tried to attack some of the
women who were in their fields at dusk, the villagers marched directly to the police station and demanded
justice. Both of these actions, they told me, they would never have had the courage to do before PRAN
began to teach them, not only about SRI, but also about their own value as human beings and the power
of community.
What makes this anecdote interesting with respect to the relationship between SRI and water is
that in three different focus groups with various families from this village, I asked them all which was the
most important intervention they had received from PRAN, or any other government or civil society
development agency, in terms of the impact of the intervention on their well-being. Despite the
introduction of SRI, the building of a community center, and lessons from PRAN about collective action
and empowerment, the most important intervention, according to all three groups, was the construction of
the water retention structure, which stored water from monsoons that could be used at little to no cost in
the winter and summer seasons. This water retention structure, they believed, unlocked the potential of all
of PRAN’s other interventions. Without the water retention structure, growing rice using SRI methods
would be risky because they would lack the necessary water control to ensure the survival of the young

309
seedlings after they were transplanted, as well as to maintain the right levels of moisture in the field,
which requires frequent, if limited, irrigation. And like SRI, the drip irrigation system PRAN and JAIN
Irrigation Systems Ltd donated to the village, would not be useful without the precise water control that
the water retention structure gives them. Even the empowerment training from PRAN, they argued, would
be useless “if they did not have food to eat.”
Lack of control over water resources is far more likely to impact the poorest farmers in Bihar than
the wealthiest. This is because while 24% of UC farmers and 5% of OBC farmers own their own wells,
only 4% of SC/ST farmers own their own wells. Farmers who do not own their own wells are forced to
buy water from neighbors and the poorest farmers are often discriminated against in water markets by UC
well-owners. Thus, the average SC/ST farmer will likely be able to buy water from a neighbor if they
have the required financial capital (which in and of itself is a big if) but the neighbor is likely to prioritize
other UC and OBC water buyers over the SC/ST farmers. This means that SC/ST farmers not only have
to pay high (often inflated) prices for water in Bihar, they are also never certain when the well-owner will
grant them access to their well and diesel pump. For many of the poorest farmers, the risk of planting
using SRI methods is thus, simply too high.
In qualitative interviews, more than one SC/ST household told me that they had tried SRI, but
because the monsoon arrived late and they could not afford to buy irrigation, they lost their crop after they
had transplanted the seedlings from the nursery to the main field. Had they chosen not to plant using SRI
methods and waited until the seedlings were older to transplant them from the nursery to the main field,
they would likely not have lost their crop (leaving the price they paid for their seeds and their own labor
efforts as sunk costs).
PRAN recognizes the increased risks associated with lack of water control for SRI farmers and
does their best to help mitigate these risks. They focus on building water storage facilities in the villages
where they work and they promise to help cover the costs of new seeds should the monsoon arrive late,

310
causing farmers to lose their first transplanted crop. However, PRANs impact is very limited in the
context of Bihar’s larger effort to promote SRI, and outside the villages where PRAN works, water
remains the biggest barrier to SRI adoption amongst both SC/ST and OBC farmers.
The need for water control is not a new finding in the literature on SRI. Even the 2002 article by
Stoop et al, mentions the importance of water control to the practice of SRI (Stoop, Uphoff and Kassam,
2002). A more recent study from Indonesia, explaining the slow diffusion of SRI despite its yield
advantages, also finds that access to water is a major barrier limiting the adoption and continued use of
SRI (Takahashi, 2013). What is novel about the empirical finding that water is the main barrier to the
adoption of SRI in Bihar, is the degree to which it has stymied Bihar’s 144-million-dollar investment in
SRI. While, the physical characteristics of SRI in isolation may have the potential to benefit the poorest
farmers, in the context of Bihar, there is a lack of fit between the physical characteristics of the
technology and the local context, where access to irrigation is limited by high costs and lack of electricity
infrastructure.116
The fact that government officials in Bihar championed SRI as a technology for helping the
poorest farmers overcome draught conditions, paired with the reality that the poorest farmers in Bihar are
unable to adopt SRI because of their limited access to water demonstrates one of the generalized
conclusions of the chapter—that technology selectors are often out of touch with the local realities facing
the poorest farmers. Specifically, the politicians and bureaucrats responsible for selecting SRI in Bihar
failed to understand the relationship between the general principles of SRI and the complexities and
uncertainties facing the poorest farmers in Bihar.
116 As discussed in Chapter 2, access to irrigation is especially limited for the poorest farmers who are least likely to own their own wells and face high rental costs and limited control over timing of irrigation access.

311
3.5.4 Limited Access to Extension Services for Poorest Farmers
Another barrier specifically affecting the access of the poorest farmers to SRI was the types of
programs promoting SRI in Bihar. Data from the 11-village survey showed that the most common source
of information about SRI was other farmers (50%) with the second most frequent source of information
being block level agriculture officers (30%). However, while UC and OBC farmers were almost equally
likely to learn about SRI from a neighbor as opposed to an agriculture official from the government, only
a tiny fraction of SC/ST farmers had heard about SRI from their block level agricultural official,
indicating a failure on the part of the state extension service to promote SRI amongst the poorest farmers.
Moreover, while a relatively small number of households in the sample had first heard about SRI from an
NGO, the poorest farmers were equally likely to have learned about SRI from an NGO than they were
from a block level agriculture officer.
Limited access to extension services is almost certainly lowering the benefits the poorest farmers
in Bihar are realizing from SRI. An interview I conducted with a block level extension officer in Gaya
district underscored this point – he said that while he did his best to reach out to small and marginal
farmers, he had a limited staff and a large mandate, and it was often easier to promote SRI amongst
wealthier farmers. His concern was mainly that wealthier farmers had all of the necessary tools to practice
SRI, including access to irrigation and also the education and literacy required to read the government’s
handouts on SRI. Helping the poorest farmers adopt SRI, in contrast, he said required significant hand-
holding by his field agents.
More generally, Bihar’s agriculture extension officers tend to have closer relationships with
wealthier farmers in the villages where they are assigned. There are a number of factors that go into the
social dynamics between extension agents and the village, but in almost every setting where I have
observed an agriculture officer enter a village he (I have never met a female extension officer in Bihar)
will go directly to the home of one of the wealthiest members of the village first. He does this both out of

312
respect, but also because if he wants to share something with the larger community he can rely on the
wealthier farmers to have the social capital to call a meeting that other farmers in the village will also
attend. However, this also means that the wealthiest farmers in a village, as well as their close relatives,
are the first to learn about new technologies or other opportunities from government extension staff. This
qualitative finding is supported by quantitative data from the 11-village survey. For many UC and OBC
farmers, agriculture extension agents are often the most trusted source of information (after seed sellers
and other farmers), but for the poorest (SC/ST) farmers, extension agents rank below almost every other
source of information.
Relatedly, farmers who had adopted SRI in the three villages surveyed where the main extension
provided was an NGO rather than a state extension agent, were more likely to report that they had found
SRI very beneficial (64% of farmers in NGO supported villages said that SRI was very beneficial versus
52% overall). What is more, out of the 9 total SC/ST farmers in the 11-village survey who had adopted
SRI, 5 of these farmers came from villages supported by NGOs, and 4 out of these five reported that SRI
was very beneficial. The fifth SC/ST farmer who had adopted SRI in an NGO-supported village reported
that the technology was not beneficial because he was unable to afford any water for irrigation. Overall,
the trend (albeit one based on a limited number of SC/ST SRI adopters in the overall dataset) indicates
that NGOs in Bihar are significantly more effective at supporting the poorest farmers in adopting SRI
than the public-sector extension agents. Moreover, in my work with PRAN, I have visited villages with
majority SC/ST populations where over 80% of all households are practicing SRI, demonstrating that
under the right circumstances and with both the necessary irrigation infrastructure and extension support,
the poorest farmers can realize significant benefits from SRI.117
117 To ensure that I was being in no-way “hoodwinked” by PRAN into believing that these villages had more widespread adoption than was actually the case, I sent my survey team without PRAN’s knowledge or my presence into two villages where PRAN had worked for over 4 years. It was clear when they reported out that almost the entire village in both of these cases was practicing SRI. However, PRAN has limited resources and these two villages had received intensive support from PRAN for four

313
3.5.5 Limited Access to Subsidy Package for Poorest Farmers
The SRI subsidy kit of 2kg seeds and 3kg fertilizers, intended to encourage farmers to adopt SRI,
is also skewed towards wealthier farmers. Across the 11-village survey, while only 8% of all households
received the subsidy kit, the poorest farmers in the survey were much less likely to receive the subsidy.
While 14% of UC households and 12% which were OBC received the subsidy kit, only 3% that were
SC/ST households received the subsidy kit. Looking only at the households who have adopted SRI, the
percent of subsidy recipients is, of course, much higher and also skews decidedly towards the wealthier
farmers. Out of the four UC adopters in the survey, three or 75% received the subsidy package. Whereas
52% of the 44 OBD adopters received the SRI subsidy package and 38% of the 14 SC/ST adopters
received the subsidy package.
Not only is the SRI subsidy program disproportionately helping wealthier farmers, but in focus
groups with female farmers who have used SRI methods for more than three years and report high
satisfaction with SRI, many express consternation with the design of the government’s SRI subsidy
program. The main point these women farmers make is that for a technology that requires fewer seeds, it
makes little sense for the government to incentivize adoption of the technology by giving farmers seeds
and fertilizer. Instead, these farmers repeatedly suggested that the government could more effectively
support SRI adoption by improving access to irrigation by poor farmers and by hiring more and better
extension agents to teach SRI to farmers in their fields. The only input the government should subsidize,
according to many SRI farmers, are the conoweeders which are unique to the practice of SRI but can be
shared within a village community so that only one weeder per 15-20 households is needed.
Unfortunately, while the 2012-2017 Agricultural Road Map earmarked 144 million dollars for SRI, only
years or more. Other villages supported by PRAN, such as my main field site Bathani, where the NGO had devoted more limited resources had SRI adoption figures more similar to the larger dataset. This demonstrates that SRI can be widely adopted with sufficient extension support, but without intensive handholding, diffusion of the technology in Bihar is likely far more limited than government reports suggest and is certainly not benefiting the poorest farmers most.

314
0.2% of this budget was allocated to providing conoweeders to farmers. In addition, it remains difficult
for farmers to purchase conoweeders independently on the private market in Bihar, so virtually, farmers
only access to the technology is through the limited supply from NGOs and the government subsidy
program.
On the other end, anecdotal data indicates that many of the larger farmers who receive the SRI
subsidy do not actually follow SRI practices. My own translator’s family received the subsidy, but was
unable to find labor willing to work in their fields using SRI methods. So, my translator’s family accepted
the seeds and fertilizer from the government (despite the fact that they were likely the wealthiest
household in their village), but then planted their fields with traditional methods.118 I heard a similar story
from at least one other UC farmer I interviewed. My guess is that failure to follow-through on SRI
practices, especially amongst wealthier farmers, is widespread, but farmers are reticent to admit to this in
a formal survey as opposed to an informal conversation over tea.
In summary, the government’s massive investment in SRI appears to not only be
disproportionately helping wealthier farmers, but it is also not well designed in terms of its overall
performance. Wealthier farmers are accepting the subsidy and not following through the practices in some
cases and the poorest farmers would benefit more from conoweeders and improved hands-on extension
training, rather than a package of seeds and fertilizers accompanied by an instructional booklet.
What is clear about the story of SRI in Bihar is that the technology will not fulfill its potential as a
“pro-poor” technology until the SRI is paired with both access to irrigation and improved extension
service provisions that places greater emphasis on working with the poorest farmers.
118 In all likelihood, the government recorded in the official record books that my translator’s family had practiced SRI –spuriously increasing the overall number of SRI adopters in the state.

315
3.5.6 SRI as a Cultural Movement
Perhaps the most important impact the SRI movement has had on agricultural in Bihar has less to
do with the adoption of specific SRI package of practices for growing rice, but rather a broader cultural
movement towards improved agronomic practices across crops and seasons.
In Bihar, SRI is referred to as “sri-vidhee.” In Hindi, “vidhee” is translated as “method.” Thus, a
direct translation of sri-vidhee might be SRI-Method. However, serendipitously, “sri” also has its own
meaning in Hindi – “respected.” So, when Bihari farmers talk about SRI, what they say and hear is a
“respected method” of rice cultivation. This translation is taken very seriously by the farmers who use
SRI, and who see the approach as a more respectful and thoughtful method for growing crops. Indeed,
songs promoted both by PRAN and the state-funded NGO JEEViKA draw on this dual meaning of
SRI.119 A verse from song 1 is reproduced here:
We will practice SRI method,
We will propagate it to every person,
Sisters, we will collectively develop the world,
SRI method is very great.
We will enhance our knowledge on PRAN (spirit of life),
We will keep going on the path of truth,
Sisters, God will be found in every people,
SRI method is very great.
The text from this verse builds an association between sri-vidhee and religious ideas. By linking the
practice of SRI directly to a “path of truth” that will “develop the world,” SRI takes on a meaning that is
much greater than the sum of its parts. The symbolism of SRI as something more than just a physical
technology capable of improving rice yields indicates that in Bihar the institutional dimensions of SRI
119 I had six of these songs translated from Hindi to English and they can be found in Appendix 5.

316
interacted with local culture in ways that endowed SRI with a unique place amongst other available
agricultural technologies which Bihari farmers have access to. In other words, while the vast majority of
farmers in Bihar know they can walk to their local seed seller and buy high yielding seed varieties, they
never associate these seeds with religious sentiment.
In Bihar, the link between SRI and spirituality is further emphasized by the NGOs promoting SRI
who encourage farmers practicing SRI to wear yellow saris to promote the technology. Saris are a
traditional attire worn by women in India, and while urban women are increasingly turning to other
wardrobes, most female farmers in Bihar wear sari on a daily basis. By wearing exclusively yellow saris,
a color with tremendous religious and devotional symbolism, SRI practitioners are visually linking SRI
with the devotional aspects of practitioners’ daily lives. SRI practitioners wear these highly visible yellow
saris whether they are attending weekly SRI meetings with other farmers in surrounding villages, going
to agricultural fairs or as pictured below (see Figure 3.7) at a Republic Day Celebration in the district
capital.
Figure 3.7: Farmers promoting SRI in Gaya district Bihar in a fair to celebrate Republic Day
Female farmers wear yellow saris which is both an auspicious color and a symbol of their belief in the benefits of SRI as an agronomic technology with significant benefits for Bihari farmers. Photo Credit Author, January 26 2015.

317
3.5.7 Changing Agronomic Practices Across Bihar
The adoption of SRI in Bihar should also be understood within the broader context of rapid
technological change in the state’s agriculture system. As discussed in Chapter 2, since the election of
Nitish Kumar as Chief Minister in 2005, the rate of technology adoption by Bihar’s farmers has risen
dramatically.
Data from the 11-village survey showed major changes in rice cultivation practices over the past
20 years, with 77% percent of households reporting significant changes in their technological approach to
paddy cultivation over this time period. These changes included switching to new irrigation systems, new
types of seeds, and new planting techniques.120 The vast majority of farmers said that the changes that
have been made in their use of technology in paddy cultivation have taken place since 2005, with a large
spike reported in 2010. Apart from the new irrigation methods, which included increased use of
groundwater (either extracted with diesel engines or electric motor pumps, rather than relying on
monsoon rainfall) and increased use of high yielding and hybrid seeds purchased at local seed stores,
farmers also reported shifts in the agronomic practices they use when planting paddy in the field. While
most farmers still transplant paddy from the nursery to the field between 26 and 30 days of age, many
farmers reporting transplanting seedlings significantly earlier, whether or not they report using SRI
methods. The number of seeds transplanted per unit area in the main field has also begun to decrease.
Farmers attribute this variously to SRI or to the increased availability of improved seed varieties, which
means that more of their seedlings will survive in the main field, allowing them to transplant fewer per
unit area.
120 Overall, 69% of UC farmers, 84% of OBC farmers and 72% of SC/ST farmers report significant changes in their use of technology in paddy cultivation over the past 20 years. It’s unsurprising that the percentage is lowest amongst UC farmers, many of whom practice agriculture more out of sentiment and tradition than financial need.

318
While these changes are consistent with SRI practices, many farmers pick and choose from the
SRI practices they observe in their neighbor’s fields while not adopting the entire suit of practices, and
report benefits, especially in terms of decreased input costs. Other farmers are often unable to say whether
their changing agronomic practices are part of the SRI package of practices or not. This is not to say that
many farmers have not explicitly adopted SRI, but that SRI methods may be influencing agronomic
methods, even when farmers have not explicitly adopted the technology.
Making matters even more confusing from the perspective of data collection and analysis, all
changes in agronomic practices in Bihar are increasingly difficult to disentangle from SRI. As the term
sri-vidhee has taken on its own meaning in Bihar, almost any effort on the part of farmers to modify their
cultivation practices to attain better results is now called sri-vidhee. This phenomenon has been
encouraged by the broadening of the SRI technology to include other crops, such as wheat, sugarcane and
vegetables, and the re-branding of the term SRI as the “system of root intensification” (Thiyagarajan and
Gujja, 2012) . One particularly humorous anecdote demonstrating the degree to which any new
agronomic practice in Bihar is now referred to as sri-vidhee, was when I was invited by a block-level
agriculture officer in Gaya district to observe his demonstration of a tractor designed to be used with the
DSR practice discussed in Section 4 of this chapter. Recall that agronomists at RAU promoting DSR have
specifically argued that DSR is a more profitable alternative to SRI. Ironically, given this background, the
farmers in the village seeing that the agriculture officer was teaching them a new agronomic approach
also called it sri-vidhee. For them, a renewed focus not only on inputs but on methods was what defined
the SRI phenomenon in Bihar and any improved method should be given a respectful honorific.
While the widespread adoption of the term sri-vidhee in Bihar makes SRI as a specific technology
more difficult to study, the fact that the sri-vidhee movement has placed greater emphasis on the value of
improving agronomic practices in Bihar should not be dismissed. Efforts to change the behavior of
farmers around their agronomic practices has always been considered an uphill battle in the agriculture
319
extension community, and is one reason why so many agriculture experts see seeds as a better solution to
increasing yields, because with seeds farmers don't have to substantially change their daily practices. The
fact that the sri-vidhee movement is helping farmers see value in changing agronomic practices is thus not
a trivial matter.
3.6 Discussion
Today, the role of SRI as one technological pathway to improved well-being for some farmers, is
widely accepted (Zoellick, 2009; Berkhout and Glover, 2011; Nature Plants, 2017). There are still
skeptics that argue that although SRI improves yields, other negative drawbacks, such as increased labor
requirements, limit the technology’s widespread use. However, the balance of evidence demonstrates that
SRI is capable of playing an important role in improving the well-being of farmers who have the access,
desire, and necessary capabilities and resources to adopt it.
At the same time, just as SRI has value as one technology amongst an arsenal of technologies
needed to meet the needs of farmers facing a variety of socioeconomic and agro-ecological conditions and
constraints, SRI is also not a panacea.121 In Bihar, the barriers preventing the poorest farmers from
capturing more benefits from SRI are both physical and institutional. We saw this both in terms of how
water access prevented the poorest farmers from benefiting from SRI, and how the implementation of the
subsidy program disadvantaged the poorest farmers.
121 It’s worth noting here one of the first articles published in the Sustainability Science Section of PNAS by Elinor Ostrom et al. (2007), “Going Beyond Panaceas” argues that in the context of governance of complex social-environmental systems, individual governance approaches are not likely to be effective across different contexts. While Ostrom et al. focused exclusively on institutional design, their theoretical argument extends equally well to technology innovation systems which include both physical and institutional dimensions. The findings in this study support Ostrom’s argument in that while SRI has proven to be affective for some farmers in some circumstances, it is also not a panacea and that a fit between the technology and local conditions is integral to the success of the technology. This argument also complements the approach of the STEPS Centre, a research organization within the Institute for Development Studies at the University of Sussex which argues for a pathways approach to pursuing sustainable development – one that acknowledges the need for multiplicity of policy and technology responses to sustainability challenges (Leach, Scoones and Stirling, 2007).
320
The disconnect between the government’s narrative that SRI helps the poorest farmers overcome
drought, and the reality that farmers need control over their irrigation sources to practice SRI,
demonstrates a failure on the part of the government to see SRI within the broader context of the
opportunities and constraints facing the poorest farmers. This failure led to a lack of fit between
sociotechnical characteristics of SRI and the local physical and institutional conditions facing farmers in
Bihar. This failure had the most negative consequences for the poorest farmers, because these famers are
the least likely to have access to and control over water resources, and are least likely to benefit from
government support programs in general.
Taken as a whole, this case study demonstrates that within the context of agricultural innovation
systems, the stage of technology selection for the poorest farmers is mired by challenges. Just as SRI was
unfairly maligned by the transnational rice research community, largely to protect their own power and
authority, SRI was selected in Bihar based off of considerations that had more to do with political
incentives than with the actual ability of SRI to benefit Bihar’s poorest farmers:
Transnational Level: At the transnational level, the case demonstrates that these challenges
include the professional incentives facing employees in agriculture research organizations, who are driven
by a wide range of goals that undoubtedly include increasing global yields and improving the well-being
of farmers, but who also have to ensure the longevity of their research program and funding for their
disciplines. Funding is, of course, largely linked to the perceived relationship between their research
programs and the potential for their programs to contribute to meeting global food demands, or other
goals articulated by donors (e.g. poverty alleviation, climate change mitigation and adaptation).
However, in efforts to serve goals as disparate as feeding the world, helping the poorest, and ensuring the
longevity of their research agendas and departments, actors in research and development organizations
suffer from competing incentives, which can lead to a failure to imagine alternative solutions to the
problems they are concerned with than the solutions that solve all of their goals at the same time.
321
Local Level: At the local level, selection challenges in many ways mirror the challenges in the
transnational arena. Despite the “pro-poor” narrative around SRI espoused by the Bihari government,
benefits of the technology are skewed towards wealthier farmers, and the government’s 144-million-
dollar support program for SRI seems to have been more of a political ploy than well-thought-out effort to
benefit the poorest farmers. While the physical characteristics of SRI have the potential to benefit the
poorest, unless they are paired with assured irrigation, no amount of funding for SRI will make the
technology a “pro-poor” success in Bihar. Failure of the government to recognize the inter-dependencies
between SRI and assured irrigation in Bihar, underscores the degree to which the technology was selected
based on the professional incentives of Bihar’s politicians and bureaucrats.
The pro and anti SRI voices at both transnational and local levels, demonstrate the complexities
and challenges of technology selection for the poorest farmers. The challenges of technology selection, as
demonstrated by the SRI case study, are likely to hold true in other innovation systems, especially for
“pro-poor” technologies. This is because traditional models of demand-pull technology selection are less
effective for the poorest communities, since these groups lack the ability to communicate their demands
through their purchasing power across stages of an innovation system.122 Instead, other actors in the
innovation system, such as international donors, academics, transnational and local NGOs, and national
and regional agriculture departments are often put in the position to select appropriate technology on
behalf of the poorest farmers. These actors are usually at significant social distance from the end-users
and can easily overlook their objective functions, as well as the specific opportunities and barriers they
face – especially when overlooking these issues aligns with their own professional or political incentives.
122 The challenges of traditional models of innovation that rely on the demands of end-users being effectively communicated to other actors in the innovation system were discussed in Chapter 1, Section 1.4. Note that this argument also applies to future generations who also lack the voice to demand technologies from innovation systems that meet their needs, such as technologies that reduce greenhouse gas emissions or limit nutrient runoff into coastal waters.

322
Actors responsible for technology selection in the SRI case, fell victim to a number of more
general challenges in the technology selection process, including: 1) silver bullet or panacea thinking; 2)
failure to fully understand local context facing the poorest farmers; and 3) selecting technologies based on
professional and political incentives rather than the needs of the poorest farmers. For technology
innovation systems to more effectively meet the needs of the poorest farmers, the community of experts
and policy makers concerned with the needs of the poorest must build strategies for avoiding these three
pitfalls of technology selection.
While this chapter focused on identifying the challenges of technology selection, the case of SRI
also showed efforts by stakeholders to find common ground. The World Bank’s SRI toolkit is an example
of the efforts to perform mediating boundary-work at the interface of science and policy in order to find
common ground and produce closure amongst competing communities of experts, over an issue with
profound importance to the future of rice research and the lives of millions of rice farmers (Clark et al.,
2016). In the toolkit, the World Bank attempted to move the debate away from absolutist claims about
“theoretical yield limits” above which extant rice plants could not produce (Surridge, 2002; Sheehy et al.,
2004), and refocus the debate on problem-driven solutions rather than scientific controversy. They were
only partially successful. While IRRI did develop more nuanced and specific critiques of SRI, real
common ground that allowed for the two communities to work together to ensure that farmers had the
opportunity to benefit from both SRI and improved seed varieties, did not emerge. In Bihar, even after the
government allocated substantial financial support to SRI, the efforts of rice scientists at the state’s
leading agricultural university, RAU, remained focused on undermining the credibility of SRI, rather than
finding ways to ensure the success of the SRI program.
The challenges of reaching social-scientific closure in the debates around SRI demonstrate the
need on the part of actors interested in technologies for the poorest, to mitigate scientific controversies

323
and move towards more fruitful problem-driven research agendas that overcome the three common
pitfalls encountered by experts on both sides of the SRI debates.
One approach to navigate social-scientific controversies in innovation systems is to institutionalize
greater reflexivity into agricultural research and development organizations. Literature from the late
1970s on knowledge management and organizational learning is a useful starting point (e.g. Argyris,
1976; Argyris and Schön, 1978). In a 1976 article in a top organizational studies journal, Chris Argyris
identified many of the underlying causes of the selection challenges seen in this chapter. He argued that
for organizations to more effectively manage knowledge, they needed to institutionalize processes that
increased effective learning. Effective of course being the operative word. To increase effective learning
Argyris argued that organizations needed to increase their “receptivity to corrective feedback” (Argyris,
1976, p. 365). Through his research, Argyris showed that individuals in organizations are encouraged to
learn “as long as the learning does not question the fundamental design, goals, and activities of their
organizations” and that “factors that inhibit valid feedback tend to become increasingly more operative as
the decisions become more important and as they become more threatening to participants in the decision-
making processes” (1976, pp. 366–367).
In many ways, Argyris identified the factors which led to the “rice wars” two decades before the
controversy began. To overcome this organizational tendency to avoid learning when new information is
threatening to the status quo, he argued that organizations needed to foster within their membership what
he called “double-loop learning,” or the ability to be more aware of “one’s present theory in use,” and
then reflexively question how one’s theory in use governs one’s actions, as well as the extent to which
there are alternative theories that may be equally valid (p. 370). Perhaps, had the researchers at IRRI been
more willing to explore ideas that appeared to question their “present theory in use” as they first learned
about SRI, the early debate around SRI would have been less virulent and more constructive.

324
A book applying the frameworks of policy analysis to the challenge of rural development by
Johnston and Clark (1982), which came out shortly after Argyris’ work on organizational learning, argued
that an important barrier to rural development was failure to learn from past experience. Johnston and
Clark reasoned that “development strategy should include an explicit emphasis on learning how to learn
from the actual experience of development, and thereby how to contribute more effectively to a
continuing process of adaptive implementation and policy redesign” (p. 4). This approach shares much in
common with Argyris’ emphasis on ensuring feedback within organizations. Unfortunately, like Argyris,
Johnston and Clark also fail to give concrete advise on how exactly to institutionalize opportunities for
learning and reflection in organizations central to the development process (e.g. IRRI). Instead, Johnston
and Clark conclude their study arguing that “[s]urely it is time for a perspective that stresses the necessity
of building cumulative development capabilities from a combination of trial-and-error experience, novel
ideas, increased organizational capacity, and enhanced individual talents” (p. 270). While Johnston and
Clark offer useful strategic and systems perspective on the complex processes of rural development and
useful inputs into decision analysis, what they do not do is offer concrete approaches for how to get
organizations to actually learn. Scholarship that evaluates the successes and failures of different
approaches to development is not enough if the organizations responsible for making development
happen are not receptive to multiple perspectives, reflection and change. IRRI’s virulent response to SRI
at the start of the 21st century underscores the point that several decades after the publication of Johnston
and Clark’s book, development organizations had not yet learned how to learn.
Despite Argyris’ call for increased reflexivity within organizations and Clark and Johnston’s call
for a greater focus on learning in development studies, both efforts fail to shed significant light on
effective strategies for building the capacity for reflexivity into innovation systems. Fortunately, later
work in both development policy and science and technology studies offers some useful strategies for
more effective learning by actors and organizations that may help overcome some of the challenges of
325
technology selection identified in the SRI case. The “problem-driven iterative adaptation” approach
developed by Andrews, Pritchett, and Woolcock focuses on building state capability (Andrews, Pritchett
and Woolcock, 2017). Their arguments also apply to effective capacity within organizations that play
important roles in innovation systems. They argue that problem-driven approaches are critical to success
in development projects: “we believe that problems force policy-makers and would-be reformers to ask
questions about the incumbent ways of doing things, and promote a search for alternatives that actually
offer a solution (rather than just providing new ways of doing things)” (p. 141). Moreover, problem
driven approaches, they argue, must be iterative in that “finding and fitting solutions to complex problems
requires first identifying multiple ideas and then trying these out, in an experimental manner, to allow the
emergence of hybrids” (p. 177).
The “problem-driven iterative adaptation” (PDIA) approach overcomes several of the challenges
of technology selection identified in the SRI case. At the transnational level, a greater focus on the
problem of improving the well-being of the poorest is what ultimately led to more attention being paid to
SRI by organizations like Oxfam and the World Bank. In Bihar, had the government been more focused
on not only identifying the problem of helping the poorest through their SRI policy, but of iteratively
adapting the solution to context, perhaps less of the money earmarked for SRI would have been wasted, if
earlier interventions were put in place to ensure that recipients of the subsidy program also had access to
water for irrigation.
However, the PDIA approach would likely not have been sufficient at the transnational level to
overcome all three of the challenges of technology selection identified by the SRI case. This is because
for the established rice research community, their problem was already well identified from the
perspective of the community’s members. They saw their mission as not only clear, but as critically
important to global food security and poverty reduction (Surridge, 2004). The selection problem was thus
not a failure to identify a problem-driven research agenda, but rather a failure to imagine alterative

326
solutions to the problem than their favored solution—namely efforts to boost rice’s photosynthetic
efficiency through genetic engineering—which they had devoted their careers and the considerable
resources of their organizations to.
Three generalized challenges for technology selection for the poorest were identified in the SRI
case including: 1) silver bullet or panacea thinking; 2) failure to fully understand local context facing the
poorest farmers; and 3) selecting technologies based on professional and political incentives rather than
the needs of the poorest farmers. The most wicked problem among the three, and the one that the
literature from organizational behavior as well as the PDIA approach does not yet have solutions to, is the
third challenge—namely the tendency of organizations identified by Argyris to ignore opportunities for
feedback and learning, when the learning threatens the identity of the organization. Fortunately, the field
of science and technology studies has perhaps the most to offer in terms of insights and tools for
overcoming the three selection challenges identified in the SRI case.
Sheila Jasanoff, in her research, shows how the technologies actors in positions of power chose to
invent, select, and produce tend to “reflect the imaginative faculties, cultural preferences and economic or
political resources of their makers and users” (Jasanoff, 2004, p. 16). In order to overcome these
tendencies in innovation systems and institutionalize technology selection mechanisms that meet the
needs of the poorest farmers, science and technology studies has several recommendations which could
prove useful for institutionalizing reflexivity (or the ability to question the constitutional assumptions of
our fields) into innovation systems. Jasanoff, in her 2003 essay “Technologies of Humility,” identifies
four strategies to achieve reflexivity in order to “make apparent the possibility of unforeseen
consequences; to make explicit the normative that lurks within the technical; and to acknowledge from
the start the need for plural viewpoints and collective learning” (Jasanoff, 2003, p. 240). Two of these
strategies are framing and distribution. I discuss these two strategies individually as tools for improving
institutional design within technology innovation systems, in order to meet the needs of the poorest.

327
Framing: Jasanoff argues that “when facts are uncertain, disagreements about the appropriate
frame are virtually unavailable and often remain intractable for long periods of time. Yet, few policy
cultures have adopted systematic methods for revising the initial framing of issues” (p. 241). In the case
of agricultural innovation systems, progress has long been framed as an effort to increase yields to avoid a
‘Malthusian Famine’ (Pingali, 2012). While actors and organizations within the global agricultural
innovation system have slowly broadened the set of appropriate goals beyond yield, to include things like
profits, income, and environmental protection, the tendency amongst the scientific community is still to
return to yield as the ultimate arbiter of success and failure in their work. Further work to re-frame the
goals of actors and organizations in the agricultural innovation system away from yields and towards the
needs of the poorest farmers may help improve the functioning at the selection stage of agricultural
innovation systems, to better meet the needs of the poorest farmers.
Distribution: Jasanoff argues that “[a]ttempts to engage systematically with distributive issues in
policy processes have not been altogether successful” (Jasanoff, 2003, p. 242). She points to two
examples from the developed world, where organizations tasked with evaluating the socioeconomic
impacts of technology have been overlooked or disbanded. Yet the case of SRI demonstrates the need for
stakeholders, who play active roles in agricultural innovation systems, and who are at least nominally
tasked with improving the well-being of the poorest (anyone working within the CGIAR system would
certainly fall into both of these categories), to ensure that their assessments of the benefits of technology
take into account distributional issues. As we saw in the literature review in Chapter 1, however, very
little of the innovation systems scholarship has grappled seriously with the issue of distribution. At the
same time, it seems that the knee-jerk reaction of the established rice research community to SRI also
ignored distributional issues. The idea that SRI could be a potentially useful technology for the poorest
farmers did not redeem (in the eyes of the established rice research community) the gravity of failures on
the part of the proponents of SRI in publishing “agronomic UFOs” in the academic literature. Efforts to

328
institutionalize evaluation of distributional impacts of technology, would help overcome technology
selection challenges associated with the failure to take seriously the needs of the poorest at this stage of
the agricultural innovation system.
In conclusion, this dissertation is broadly concerned with institutional design for reorienting
innovation systems to meet the needs of the poorest farmers. The case of SRI demonstrates several
challenges in the selection stage of innovation systems, that create barriers to the functioning of
innovation systems to meet the needs of the poorest. Institutionalizing greater reflexivity on the part of
actors operating within agricultural innovation systems, specifically with respect to issues of framing and
distribution, may help overcome some of the challenges of technology selection identified in this case.

329
CHAPTER 4. Subsidies for whom? Comparative evaluation of India’s Drip Irrigation Subsidy Program
4.1 Introduction
This chapter evaluates a large-scale subsidy program to promote widespread use of drip irrigation
in India.123 The subsidy program, known as the National Mission on Micro Irrigation (NMMI) is a
modern and sustained effort to bring a new technology into widespread use. The effort to scale drip
irrigation in India required the establishment of a broad institutional infrastructure by the national and
state governments. This institutional infrastructure included specific mechanisms to target the poorest
farmers. Both the size of India’s drip irrigation subsidy program (it has likely cost the central government
over one billion dollars between 2006 and 2014), as well as the explicit effort on the part of the
government to ensure benefits to the poorest farmers, make drip irrigation in India a good case study for
evaluating goal-oriented efforts to ensure the poorest farmers benefit from a new technology.
The chapter demonstrates that India’s drip irrigation subsidy program leveraged both public and
private sector strengths, to achieve widespread use of the technology across multiple states in India.
However, despite inbuilt institutional mechanisms in the subsidy program to target the poorest farmers,
the program largely failed to benefit this group. The failure of the drip subsidy program to benefit the
poorest farmers is due to both the institutional and physical dimensions of drip irrigation technology in
India, which are not well aligned to the needs of the poorest farmers.
123 Drip irrigation is one of several technologies that collectively are called micro irrigation systems. The other major micro irrigation technology is sprinkler irrigation. This chapter primarily focuses on drip irrigation for two reasons. First, drip irrigation has low-cost versions that have “pro-poor” physical dimensions. Second, drip irrigation is a more interesting technology from a sustainability perspective because it has greater water savings. For this reason, the government’s subsidy guidelines prioritize drip over sprinkler irrigation. The conditions under which the subsidy applies to sprinkler irrigation are when drip irrigation is inappropriate for the crop. If both drip and sprinkler irrigation are appropriate, the guidelines mandate drip irrigation is used because it has greater WUE. For these reasons and for bounding the scope of fieldwork, I focused on drip irrigation, though many conclusions apply equally well to all micro irrigation systems.

330
On the institutional side, the subsidy program attempts to create increased demand from the
poorest farmers by offering larger subsidies to small and marginal farmers.124 However, the subsidy
program fails to offer the private sector dealers responsible for “last mile” technology delivery, their own
incentives to work with the poorest farmers. Indeed, private sector dealers incur increased overall costs, in
terms of their time and earnings, when working with the poorest farmers. As a result, the poorest farmers
do not learn about the drip irrigation subsidy program.
On the physical side, the standards embedded in the subsidy program exclude low-cost drip
irrigation systems. While low cost drip irrigation systems had gained traction in some parts of the country
prior to the introduction of the subsidy program, the subsidy program pushed these technologies out of the
available technology space in favor of more expensive designs. The failure of the subsidy program to
include low-cost drip irrigation models under the umbrella of the program, negatively impacted the
poorest farmers by making it harder for drip irrigation companies focused on low-cost technology, to
compete.
The chapter demonstrates the difficulty of both leveraging private sector strengths in last-mile
technology delivery, while also ensuring the needs of the poorest farmers are met in public-private
partnerships in the agricultural sector. The chapter is organized as follows:
• In Section 4.2, I discuss the theoretical approach to the chapter, as well as the sources of data
I draw on.
• In Section 4.3, I discuss the background on drip irrigation, including the generalized physical
and institutional dimensions of the technology, its origins in Israel, and the initial adoption of
drip irrigation on a global scale. I then focus on India and the history of the technology in the
124 In India, small and marginal farmers are defined as farmers with less than two hectares (five acres) of land. While small and marginal farmers are often lumped into a single category for the purposes of policy making, marginal farmers are defined as farmers owning up to one hectare of land, and small farmers are defined as owning one to two hectares.
331
country. Finally, I describe India’s national level subsidy program to promote widespread
adoption of drip irrigation.
• In Section 4.4, I analyze data from the four regional case studies, as well as interviews
conducted with actors at the national level from government, the private sector, and
academia.
• In Section 4.5, I discuss the reasons for the two main empirical findings: First, variation in
success of the subsidy program is driven by the institutional differences in state level
implementation programs. Second, despite the success of the program in supporting
widespread use of drip irrigation (in some states), institutional incentives embedded in the
design of the subsidy program failed to ensure that the poorest farmers benefit from drip
irrigation technology.
• Finally, in Section 4.6, I discuss my findings within the context of emerging innovation
systems literature on the role of government in ‘market-creation’ (Mazzucato, 2016). I argue
that India’s drip irrigation subsidy program can be analyzed as a large-scale effort to support
the emergence of a new market and industry. From a policy perspective, given the large
publicly funded investment drip irrigation, I argue that the government should demand more
from the private sector in return for its investment. In particular, the subsidy program should
be re-written so that the incentive structures created by the program ensure that the private
sector provides last mile extension services and capacity building specifically to the poorest
farmers.

332
4.2 Theoretical Approach and Data Collection
4.2.1 Theory: Sociotechnical Approach to Innovation Studies
This chapter relies on the sociotechnical approach to the study of technology adoption outlined in
Chapter 1, Section 1.2.1. Recall that this approach, first articulated by Harvey Brooks, widens the lens of
technology research beyond the artifacts and practices associated with the physical dimensions of
technology, to include the social supporting systems that are required to achieve widespread use of
technology (Brooks, 1980).
As in the other three chapters, I use the language of physical and institutional dimensions of
technology. The physical dimensions of technology include technical aspects of design, as well as the
agronomic practices associated with using the technology in the field. The institutional dimensions of
technology include the rules, norms, culture, and beliefs that together make up the social supporting
systems necessary to apply the physical dimensions of the technology at scale.
I also use innovation systems theory and language to discuss the relationship between the physical
and institutional dimensions of technology and the process by which technology is invented, selected,
produced, adopted, adapted and sometimes retired (Anadon et al., 2014). An innovation systems
perspective is useful for identifying barriers to widespread use of a technology either in general or for
specific socioeconomic groups (e.g. small and marginal, or lower caste farmers).
Finally, I situate this chapter within an emerging literature in innovation systems scholarship on
government-led market creation. Mazzucato, in a 2016 paper on innovation policy argues that innovation
policies can play a role in solving “socioeconomic-technological challenges” (Mazzucato, 2016, p. 140).
In order for innovation policy to be challenge-driven, Mazzucato (2016) argues that “innovation policies
require the traditional market failure justifications for policy intervention, and even system failure
justifications, to be complemented with a more active market-creating framework” (p. 140). Based on

333
extensive research into the role of the public sector in innovation systems, Mazzucato calls for a “more
strategic and mission-oriented approach” on the part of public sector actors in market-creation
(Mazzucato, 2013, 2016, p. 140).125
India’s drip irrigation subsidy program can be understood as a strategic effort by the central
government in market-creation, rather than only as a policy to overcome the problem of high relative
costs to end users in the adoption of drip irrigation technology. Viewing India’s drip irrigation subsidy
program as a strategic effort in market-creation by the central government begs the question: What do the
private sector actors who benefit from the government’s investments in market-creation owe in return? In
particular, how should the risk and rewards of market-creating policies be shared across the public and
private sectors and how can the government re-design the institutions structuring incentives under the
subsidy policy to ensure the poorest farmers reap greater benefits from drip irrigation technology?
Mazzucato’s arguments on the role of government-led innovation policy in market-creation are
grounded in the work of Karl Polanyi. Polanyi, an economic historian and sociologist in the mid 20th
century, questioned the emerging view of the “free market” as a concept untethered to social and political
institutions (Polyani, 2001). In his seminal book, ‘The Great Transformation’ Polanyi shows that the free
market is not a natural artifact, but rather the product of institutional interventions by the state. His work
exposes the myth of state vs market distinctions and allows policy scholars to critically question market-
failure logics that undergird so much economic policy. An important modern policy implication of
Polanyi’s argument is that if markets are always shaped by state policies, then the state ought to play an
active role in determining who benefits from state investments in market-creation. In the context of this
125 Mazzucato’s 2013 book, ‘The Entrepreneurial State’ metiiculously documents the ways in which government investments in R&D have been essential to the success of many private sector companies. She uses the iPhone as an example and shows how much of the underlying technology was first developed through tax-payer funded research. She then shows how the important role of the government is later ignored in the founding stories of major private sector companies, who often pretend that their products are entirely developed by their company and ignore the contributions of public research. Mazzucato extends this emprical study to its implications for public policy: if publically funded research contributed so much to the development of Apple’s iPhone, why is apple avoiding the very taxes that fund important public sector research?
334
chapter, this means that the Indian government should consider who benefits from their drip irrigation
subsidy program. This chapter concludes with policy recoemndations for how the Indian government can
restructure the drip irrigation subsidy program to ensture the poorest farmers realize greater benefits from
the technology.
4.2.2 Data: A Comparative Qualitative Analysis
The data for this chapter was collected between July 2013 and April 2015. I gathered data through
qualitative interviews across four states, including Andhra Pradesh, Bihar, Gujarat, and Kerala (see map
in Figure 4.1), as well as with officials in the central government and other key experts from the research
community and the private sector. I also spent four days on the campus of Jain Irrigation Systems Ltd. in
the summer of 2013, learning about their company and cutting-edge R&D in the drip irrigation sector.126
126 I am indebted to JAIN Irrigation Systems Ltd. for inviting me to their headquarters and allowing me to learn from so many of their employees. I am particularly indebted to Dr. P. Soman, Senior Vice President of Projects at Jain Irrigation for helping me understand the technical details of drip irrigation as well as helping me navigate street protests and effigy burnings in rural Andhra Pradesh unscathed.

335
Figure 4.1: Map of India. The map highlights the four states where I conducted extensive primary fieldwork for this chapter, including Andhra Pradesh, Bihar, Gujarat, and Kerala.
To select case studies, I used a purposive selection methodology common in qualitative research
(Seawright and Gerring, 2008).127 I selected four states, including Andhra Pradesh, Bihar, Gujarat, and
Kerala. I purposively selected these four cases for diversity on the following three criteria:
• First, I only selected states where the potential area available for drip irrigation is relatively
high (over 40% of total cropped area). The potential area available for drip irrigation is
127 Seawright et al. (2008) review a number of case selection methods for qualitative research. In qualitative research, they argue, cases can be selected purposively. Selection methods include typical, diverse, extreme, deviant, influential, most similar, and most different. For this study, I used a diverse case study selection method which is useful for two or more cases that exemplify diverse values for pre-selected criteria. Seawright et al. argue that “diverse cases are likely to be representative in the minimal sense of representing the full variation of the population” (p. 297).
336
calculated by looking both at the types of crops grown, as well as the availability of irrigation
infrastructure, such as surface irrigation or borewells.128 I did not select for diversity on this
criterion. Rather, it was a minimum criterion for selection, to ensure that the physical
dimensions of drip irrigation are appropriate for enough farmers in the state to make drip
irrigation a relevant technology within the state’s agricultural innovation system.
• Second, I selected states that varied in terms of the extent of drip irrigation adoption. In 2011,
Andhra Pradesh had the highest overall area under drip irrigation of any state in India, but
Gujarat was quickly catching up. Kerala had a small but not insignificant area under drip
irrigation, and Bihar, despite a 90% subsidy for the technology, had almost no area under drip
irrigation.
• Third, I selected states for variation in the extent of adoption by the poorest farmers (as
measured by landholdings). Data collected in 2010, showed that in Kerala approximately
50% of drip irrigation adopters were small and marginal farmers (those with less than two
hectares of land). In Andhra Pradesh, small and marginal farmers accounted for
approximately 10% of adopters. In Gujarat, small and marginal farmers made up only 2% of
adopters. And in Bihar, small and marginal farmers made up less than 1% of adopters
(Palanisami and Raman, 2012).
In each of the four states I interviewed a wide variety of actors in the drip irrigation innovation
system, including government officials, private sector company representatives (including representatives
of Bhumi, JAIN Irrigation Systems, EPC Mahandra, and Netafim), drip irrigation equipment dealers, and
farmers (see Table 4.1).
128Horticulture crops, sugarcane, and cotton are among the more common crops in India grown with drip irrigation. This may change in the future, as drip irrigation companies are working to demonstrate the value of their technology for rice cultivation. If they succeed, the potential area for drip irrigation in India will expand considerably.

337
Table 4.1: Overview of fieldwork including interviews conducted and dates.
State
Selection Criteria
Interviews Conducted
Dates
Andhra Pradesh
1. 730k ha potential area. 2. Based on 2010 data, drip had
been installed on 50% of potential area.
3. Small and marginal farmers approximately 10% drip adopters.
• Government officials (n=2) • Private sector company staff (n=5) • Equipment dealers (n=3) • Drip adopters interviewed with
representatives of drip irrigation companies (n=4)
• Drip adopters interviewed independently (n=3)
• Non-adopters interviewed (n=3)
July 2013
& March 2015
Bihar 1. 142 thousand ha potential area. 2. Based on 2010 data, drip had
been installed on only 0.02% of potential area.
3. Small and marginal farmers approximately 0.5%* drip adopters.
• Government officials (n=3) • Private sector company staff (n=3) • Equipment dealers (n=2) • Drip adopters interviewed with
representatives of drip irrigation companies (n=3)
• Drip adopters interviewed (n=8)
January / February
2015
Gujarat 1. 1,599 k ha potential area. 2. Based on 2010 data, drip had
been installed on 10% of potential area. However, area under irrigation growing rapidly in Gujarat. 2015 data suggests drip irrigation on 26% of potential area in Gujarat.
3. Small and marginal farmers approximately 2% drip adopters.
• Government officials (n=2) • Private sector company staff (n=7) • Equipment dealers (n= 5) • Drip adopters interviewed with
representatives of drip irrigation companies (n=6)
• Drip adopters interviewed independently (n=7)
• Non-adopters interviewed (n=4)
December
2013 / January
2014
Kerala 1. 179k ha potential area for drip irrigation.
2. Based on 2010 data, drip had been installed on only 8% of potential area.
3. Small and marginal farmers approximately 50% drip adopters; 96% all farmers in state.
• Government officials (n=5) • Private sector company staff (n=2) • Equipment dealers (n=2) • Drip adopters visited with
companies (n=3) • Drip adopters interviewed with
government extension staff (n=5) • Drip adopters interviewed
independently (n=3) • Non-adopters interviewed (n=3)
March/April
2015
Other Fieldwork
� Spent four days in Maharashtra at Jain Irrigation Systems Ltd. headquarters.
� Interviewed government officials in Delhi responsible for subsidy program.
� Attended workshops. � Expert Interviews.
• Jain Irrigation Systems Ltd. campus visit (12 interviews with high-level staff, including joint managing director, Ajit B. Jain.
• Central government officials in New Delhi (n=2)
• Drip irrigation workshops attended (n=2)
• Expert interviews (n=4)
Total fieldwork for project conducted between
July 2013 and April
2015

338
While I draw on insights from all of these interviews, the bulk of the analysis draws on my
interviews with drip irrigation equipment dealers (n=12), henceforth “dealers”. I chose to focus on this
data source because the dealers are in a unique position to evaluate the institutional design of the subsidy
program in each state, including barriers to overall rates of adoption rates, as well as barriers to adoption
by the poorest farmers.
In my first field visits in 2013 to Andhra Pradesh and Maharashtra, I noticed the importance of
dealer networks to the spread of drip irrigation. Most of the private sector drip irrigation supply
companies, and all of the biggest ones, including JAIN Irrigation and Netafim, work through dealer
networks. Dealers are not directly employed by drip irrigation companies, but rather work on a
commission basis. Some dealers work exclusively with technology from one company, whereas other
dealers work with multiple companies. Dealers are responsible for engaging with farmers throughout the
adoption process and are especially important in marketing and outreach. The extent to which dealers are
involved with on-site design and installation of drip systems varies by state. However, in many states
(like Gujarat), dealers manage almost every step of the process, from initial outreach and marketing,
through instillation and after sales service, with limited oversight from engineers at the larger supplier
companies (e.g. Jain Irrigation and Netafim), who are ultimately responsible to the government for the
performance of the systems installed under the subsidy program.
There are two reasons why dealers offer particularly useful insights into drip irrigation innovation
systems in each state. First, dealers work very closely with farmers and understand the opportunities and
barriers to drip irrigation adoption, both generally and specifically, for the poorest farmers. Second, larger
private sector suppliers are often reticent to share propitiatory information, such as their overall sales in a
state, or the number of sales they make to small and marginal. Dealers, in contrast, because they are much
smaller companies (with an average of 5.2 employees among the 12 dealers I interviewed) are much less
invested in the politics of drip irrigation at the national level and are more willing to share what the larger
339
supplier companies perceive to be sensitive data. Dealers freely shared their context-rich understanding of
the nitty gritty details of the functioning of the subsidy program in their state. They were also willing to
share what I perceived to be unvarnished accounts of the failures of the subsidy programs. This included
both general problems, as well as specific barriers preventing the poorest farmers from benefiting from
drip irrigation technology.
In interviews with dealers, I asked about what they saw as the biggest barriers to widespread
adoption of drip irrigation in their state, as well as the specific barriers for the poorest farmers. I also
asked each dealer to estimate the proportion of small and marginal farmers among their clients. This
estimate is useful because I was unable to get data from the government on the distribution of landholding
among subsidy recipients and the 2010 data used in the process of case selection is both old and based on
a limited sample.129 Data on the distribution of landholdings served by dealers was a second-best
approach to estimating adoption of drip irrigation by small and marginal farmers in each state. In addition
to asking dealers about the proportion of their client base in the small and marginal landholding category,
I asked them to explain the reasons behind this proportion, which led to rich data on the specific
mechanisms preventing small and marginal farmers from benefiting from drip irrigation.130
In addition to interviews with dealers, I also interviewed farmers in each state (n=53). Most of
these farmers were drip adopters, but I also selected a limited number of non-adopters living in close
129 Indeed, based on data provided by the government body responsible for administering the drip irrigation subsidy program in Kerala, I do not believe the central government collects data on landholding or caste of subsidy recipients. The data I collected in Kerala was in standardized reporting format that they sent to the central government on a monthly basis. This data did not include any information about subsidy recipients that would allow for analysis of the socioeconomic profile of drip irrigation adopters. This is interesting in the context of this dissertation because it alludes to the central government’s lack of concern with measuring the benefits of this program to the poorest farmers. 130 I focused on landholding rather than caste as a proxy for well-being, because the relationship between specific caste categories and well-being differs significantly across states and requires nuanced understanding of caste at the state level. In addition, the central government’s subsidy program uses landholding rather than caste as the metric for targeting increased subsidies at the poorest farmers, so using landholding as the metric of analysis was also aligned with the policy program. That said, as discussed in the Kerala case study, it turns out that cross-state landholding comparisons as a proxy for well-being also has complications.
340
proximity to adopters, in order to understand the reasons why they had not adopted the technology. A
major drawback of the farmer interview data is that the majority of households I interviewed were not
randomly selected.131 Rather, field visits were conducted with drip irrigation supplier company staff,
dealers, and government extension agents. These field visits offered useful insights into the overall
processes involved in the spread of drip irrigation in each state, as well as some of the reasons farmers
chose to adopt drip irrigation, and the perceived benefits. But, due to the sampling methodology, the data
is used with caution.
Despite the drawbacks in the farmer interview data, I believe the robust quality of the interviews
with dealers provided robust evidence for studying the causal mechanisms driving adoption of drip
irrigation in each state, as well as the main barriers, both across socioeconomic groups of farmers and
specifically for the poorest farmers (as measured by landholdings).
4.3 Drip Irrigation: Background and Selection in India
4.3.1 Drip Irrigation: General Physical and Institutional Dimensions
Drip irrigation, in which very small amounts of water are regularly administered to crops, is one
of the most efficient irrigation technologies. Drip irrigation is one of three available micro-irrigation
technologies (drip, bubbler, and sprinkler). The advantages of drip irrigation are well documented. Drip
irrigation significantly decreases on-field water demand, waste, and runoff (Keller and Blisner, 1990;
Howell, 2001; Ayars et al., 2007). In addition, drip irrigation improves crop yields relative to traditional
irrigation methods, and reduces labor costs (Tiwari et al., 1998; Tiwari, Singh and Mal, 2003; Ibragimov
et al., 2007).
131 In Bihar and Gujarat, I also visited farmers without government or private sector staff as intermediaries. In these two states, I was able to obtain lists of drip irrigation subsidy recipients from the government and randomly selected farmers from these lists. However, the lists were confined to subsidy recipients, limiting broader generalizations from the interviews.

341
Drip irrigation has another important advantage – it saves water.132 Because irrigation accounts
for nearly 70% of global freshwater withdrawals, finding ways to increase the water use efficiency
(WUE) of irrigation is an important sustainable development concern (Postel, Daily and Ehrlich, 1996;
Gleick, 2009). A study looking at the use of drip irrigation for growing peppers in India, showed WUE
improvements of 38% (Paul et al., 2013). Other experiments with different crops have found WUE
improvements between 21% and 103% (Dalvi et al., 1999; Maisiri et al., 2005; Ibragimov et al., 2007). In
addition to saving water, drip irrigation’s high WUE has many other environmental benefits, including
reduced agricultural runoff and the prevention of soil salinity (Hanson and May, 2003).
There has also been a stream of research demonstrating the “pro-poor” potential of drip irrigation.
For example, in a study of four villages in West Africa, Burney et al. (2010) demonstrated how drip
irrigation improved nutrition and food security. Earlier work by Postel et al. (2001) estimated that if low
cost drip irrigation systems were widely adopted by poor farmers, drip irrigation could “boost annual net
income among the rural poor by some US $3 billion per year and inject two or three times this amount
into the poorest parts of the developing world’s economies” (p. 3). In addition, a 2013 perspectives article
in PNAS, argued for the need for “distributed irrigation” technologies, including drip irrigation, as a
development priority for sub-Saharan Africa (Burney, Naylor and Postel, 2013). Despite the hopeful
rhetoric around the potential of drip irrigation to serve as a “pro-poor” technology, there have been few
evaluations looking at the extent to which the poorest farmers are benefiting from drip irrigation in
countries where the technology has reached relatively widespread use. This study, undertaken in India,
provides the opportunity to perform such an evaluation. The conclusions are also policy relevant to the
132 Drip irrigation has a higher water use efficiency (WUE) both compared to most traditional flood irrigation methods as well as compared to other micro irrigation methods (bubbler and sprinkler) (Hanson and May, 2003).

342
development of programs intended to support drip irrigation adoption in sub-Saharan Africa, and other
parts of the developing world.
4.3.2 Drip Irrigation Innovation History
Modern drip irrigation methods were invented in Israel in the 1960s and 1970s. The invention of
drip irrigation in Israel was not (despite certain poetic creation myths, especially those found in Netafim’s
promotional materials) the result of a serendipitous discovery, but rather the outcome of institutional
incentives and government-funded, goal-oriented research, intended to address the specific needs of the
early Israeli State (Sne, 1989). I review Israel’s experience with both invention and widespread use of
drip irrigation here, because the institutions Israel developed to support widespread use of the technology,
share many commonalities with the institutions developed in the states in India, where drip irrigation has
also been widely adopted: namely, strong government support for the technology through a subsidy
program, combined with a transparent and efficient regulatory environment.
After the State of Israel was established, the fledgling government had to immediately contend
with four very pressing issues: securing the borders of the state in a hostile region; settling a huge influx
of new immigrant refugees fleeing Europe; securing the national food supply; and providing a productive
economic base for the new state. In response to these pressures, the early Israeli government prioritized
agricultural development. Agriculture effectively addressed all four issues at once, by maintaining
territorial claims and border security through physical occupation of the land; directly providing food for
the burgeoning population and a local economic driver for the state; and encouraging new immigrants to
settle in remote portions of the state, helping them to spatially disperse and integrate with local
communities (Feitelson, 2013).
Israel’s semi-arid tropical climate, however, did not lend itself to intensive agriculture. In order to
adequately divide, allocate, and supply limited water resources, Israel adopted a national-scale Integrated

343
Water Resource Management (IWRM) plan. The IWRM, placed all water in Israel under the ownership
of the central government, and gave responsibility for the management and allocation of water resources
to the Ministry of Agriculture. Centralizing the water supply and placing allocation responsibilities in a
central government agency, effectively ‘embedded’ water scarcity in the Israeli national consciousness.
Israel’s IWRM policies also put a price on water, linking farmers’ water use to their (subsidized)
expenses. Thus, Israeli farmers were financially and institutionally incentivized to conserve water and
limit their use of this precious national resource, which belonged not to each farmer, but to the state
(Fischhendler, 2008).
In addition to creating cultural and financial institutions to conserve water, the state invested
heavily in agricultural research to find technical solutions for growing more with less water (Garb and
Friedlander, 2014). Mottes wrote the first-known article on drip irrigation, which appeared in the Israeli
agronomic journal Hasadeh in February 1962, and proposed a buried system of 0.25 inch plastic lines
with vertically inserted drippers at regular intervals (Pasternak, 2008). Drip irrigation’s initial purpose
was to save water. Because of this, the first drip systems were buried to prevent evaporative water loss
and improve water use efficiency as much as possible. Buried drip systems on four test plots however,
consistently struggled with blockages from plant roots, and researchers realized that despite some
apparent early advantages, the technology could not be scaled-up with that kind of technical
inconsistency.
As an accident, drip laterals used additional test plots in 1965/6 that were not buried because the
machine for burying the plastic lines arrived too late. The engineer, Simcha Blass, involved in this above-
ground drip irrigation trial, realized that above ground drip irrigation overcame many of the original
problems with the technology. The yield successes of this new approach, coupled with the elimination of
the blockage problems, led to significantly increased interest in surface drip emitters.
344
After the initial invention of surface drip emitters, Blass conducted many trials with the new
technology, both independently and as a researcher with the Israeli Ministry of Agriculture. These early
trials presented the first barrier to drip’s adoption in Israel because they were never particularly
successful. As a result, many Israeli agronomists questioned the technology’s utility and scalability.
Yehudah Zohar, an Israeli agronomist who believed in the potential of drip technology, especially on
marginal soils with saline water, ignored directions from his superiors and continued to pursue research to
optimize the use of drip irrigation on poor soils. The results of Zohar’s field trials were so successful that
other actors in Israel’s agricultural research system called the results a ‘miracle’ (Pasternak, 2008).
As a result of the fact that the first successes with drip irrigation technology had been realized on
marginal soils with saline water, it would take many more years before drip irrigation was recognized as
an appropriate irrigation technology for general agricultural use. The technology only reached widespread
use as a direct result of the responses of influential Israeli actors to two external events. First, the World
Bank partially funded an initiative to increase water use efficiency in dryland agriculture. The program
offered Israeli farmers subsidies, grants, and other direct financial incentives to shift to drip irrigation or
other highly efficient water-use irrigation technologies. Second, the Israeli Ministry of Agriculture and
Water Commission were forced to respond to an extended drought throughout Israel, with severe cuts to
freshwater allocations to agriculture in the Israeli coastal strip. In their efforts to prevent widespread loss
of agricultural production, the Ministry of Agriculture developed an extensive extension and subsidy
support program to help farmers adopt and then optimize their use of drip irrigation (Sne, 1989).
In 1969, Simcha Blass and his son Yishayahu were awarded the first US patent for a surface drip
emitter, on the basis of an earlier Israeli patent. Blass eventually sold his surface-emitter patent to Kibbutz
Hatzerim, who founded the drip technology manufacturing company, Netafim, which continues to play a
leading role in the global spread of drip irrigation technology (Pasternak, 2008).

345
The invention and eventual widespread use of drip irrigation in Israel was achieved through
government incentives for both invention and widespread used. The government used their authority to
both create laws and regulations to promote water conservation, and supported farmers in the adoption of
drip irrigation through investments in capacity building and subsidies (Fischhendler, 2008).
As a result of government support for drip irrigation, Israel also has the largest proportion of
irrigated land area under drip irrigation, with 73% of total irrigated land area under drip irrigation (ICID,
2005). Israel’s high rate of drip adoption enabled a five-fold increase in irrigated land between 1951 and
1986, with only a three-fold increase in water-use. In 1989, it was estimated that productivity per cubic
meter of water used in agriculture tripled in Israel between the 1950s to the 1980s (Sne, 1989).
In contrast to the Israeli experience, global drip irrigation adoption has been much slower. In 2012,
drip irrigation accounted for less than 5% of total irrigated land area (ICID, 2005). Among the four
countries with the largest overall land areas under drip irrigation (see Table 4.2), only Spain has achieved
what might be called widespread use.
Table 4.2: Drip adoption by country
Source: (ICID, 2012)
Country Land under drip (ha) % total irrigated land Year reporting
India 1,897,280.00 3.1% 2010133 China 1,669,270.00 2.8% 2009 Spain 1,658,317.00 47.8% 2011 United States 1,639,676.11 6.6% 2009
Moreover, despite drip’s potential benefits for the poorest farmers in developing countries, drip
irrigation accounts for less than 1% of the total irrigated land area in most developing countries. In 2012,
133 Note that adoption of drip irrigation in India has risen sharply since 2010, when this data was collected. A more recent estimate of drip irrigation adoption in India, puts the total area under drip irrigation at 3.3 million hectares or closer to 10% of India’s total potential area (Liebrand, 2017).

346
Morocco, Egypt, South Africa, and Malawi were the only four African countries to report any drip
irrigation use (see map in Figure 4.2).
Figure 4.2: Drip Irrigation coverage by country. Source: (Data from ICID, 2012)
4.3.3 Initial Adoption of Drip Irrigation in India
The first experiments with drip irrigation in India were conducted in a university setting, at the
Agriculture University in Coimbatore Tamil Nadu, in the 1970s. Only a year after the first research
station experiments had been conducted, drip irrigation was pioneered in a farmer’s field in Jodpur village
in Madhya Pradesh (Bhamoriya and Mathew, 2014).
The private sector was not far behind the research community in its interest in drip irrigation, and
also played a significant role in the selection of drip irrigation in India. Bhavarlal Jain, a businessman and
entrepreneur in Maharashtra, attended an agricultural trade show in the United States in the early 1980s,
where he learned about drip irrigation. According to the company’s founding narrative, Jain saw in drip

347
irrigation, both a business opportunity and an opportunity to address a critical issue facing India’s
agricultural future – water scarcity. By the late 1980s, his company, Jain Irrigation Systems Ltd., was
manufacturing and selling a wide variety of drip irrigation systems (Goldberg, Knoop and Preble, 2011).
Today, JAIN Irrigation is one of the largest drip irrigation companies in the world – having purchased
Israel’s second largest drip irrigation company, NaanDan, in 2013.
In the 1980s and 1990s, despite the efforts of the private sector to promote drip irrigation, adoption
rates throughout the country remained low (Liebrand, 2017). Until the 21st century, in fact, drip irrigation
in India was virtually synonymous with the state of Maharashtra, where Jain Irrigation had its
headquarters. Until 2000, over 60% of drip irrigated area in India was in Maharashtra (Liebrand, 2017).
It was not until drip irrigation was selected more formally by the government, that the adoption of
drip irrigation in India began to rise. In 2003, the Chief Minister of Andhra Pradesh, Nara Chandrababu
Naidu, faced a challenging upcoming election. Naidu, known for his pro-business stance that had
transformed the state’s capital, Hyderabad, into an IT hub in India, was in danger of losing the rural vote
after a prolonged drought in the state wreaked havoc in the agricultural sector. Eager to both improve his
image among rural voters, and to find a solution to overcome the state’s water shortages, Naidu appointed
a cabinet subcommittee to create policy recommendations for supporting drip irrigation in the state
(Praveen Roa, personal interview, Hyderabad, March 5, 2015).
Dr. Praveen Rao, a newly appointed officer in the department of horticulture in Andhra Pradesh
was appointed to work with the subcommittee and design the policy recommendations. Rao had recently
returned from a post-doctoral fellowship in agronomy in Israel. This experience, along with his in-depth
knowledge of Andhra Pradesh’s extension system, gave him valuable perspective on the design of a
subsidy program for drip irrigation in Andhra Pradesh (Praveen Roa, personal interview, Hyderabad,
March 5, 2015).

348
Roa knew that to be successful, the drip irrigation program would have to align the incentives
between farmers, the private sector, and government. Roa’s vision was for the institutional design and
implementation of the subsidy program to create an incentive compatible structure for all actors in the
drip irrigation innovation system, that would spur drip irrigation adoption. One critical aspect of Roa’s
vision for a drip irrigation subsidy program, was to create an attractive business environment for the
private sector, while at the same time, forcing the private sector to reduce the cost of the technology to
make it more affordable to farmers. To achieve this goal, Roa used a carrot and stick approach with the
private sector, by offering the potential of hugely expanding the market over the long run, in exchange for
lower prices, immediately. One way he did this, was by asking all private sector companies to propose a
price reduction for their equipment, in order to be eligible for the state’s new subsidy scheme. The private
sector responded with a 27% reduction, but Roa felt they could cut their prices further. Rao did his own
analysis of input and production costs, and eventually convinced the private sector to reduce their
component prices by 37% in order to participate in the state’s subsidy program. While the private sector
was not happy with the price reductions, the long-term growth opportunities that the subsidy program
would create, ensured that the private sector did not completely balk.
Roa also carefully selected private sector companies to participate in the subsidy program, to
ensure both the quality of their product, but more importantly, their ability to provide quality and timely
service to farmers. Roa knew that if farmers developed a negative perception of drip irrigation due to
substandard technology or poor after sale service, it could ultimately doom the long-term success of drip
irrigation in the state (Praveen Roa, personal interview, Hyderabad, March 5, 2015).
Despite Chief Minister Naidu’s support for the proposed subsidy program, there was some dissent
in the government, with respect to subsidies for agricultural development. Not only were agricultural
subsidies out of favor with the international community, but subsidies for electricity, which were
responsible for dwindling groundwater supplies in western India, had become politically impossible to
349
repeal based on the strength of farmer lobbies in these states (Mukherji, 2006). This experience, among
others, created feelings of uneasiness towards agricultural subsidies on the part of many policy makers
(Praveen Roa, personal interview, Hyderabad, March 5, 2015).
Ultimately, the subcommittee recommended that the CM establish an independent body within the
Ministry of Horticulture to administer the subsidy, known as the Andhra Pradesh Micro Irrigation Project
(APMIP). APMIP’s target was to cover an additional 10,000 hectares per year under micro irrigation.
This goal was very ambitious, given that prior to 2003, annual adoption of micro irrigation in India was
around 75,000 across the entire country and almost none of this was in Andhra Pradesh. While the CM
accepted the committee’s recommendation, the realities of funding a subsidy program at this scale set in.
International donor agencies balked at the program Ultimately, however, the National Bank Agriculture
Development (NABARD) agreed to fund the first year of the program at a 6% interest rate, with future
funding contingent on meeting the 10,000-hectare goal. In the first year, APMIP surpassed their goal and
NABARD extended their funding (Reddy and Satyanarayana, 2010). The success of the program also
served as a model for a national framework to support drip irrigation.
4.3.3 Selection of Drip on a National Scale: The National Mission on Micro Irrigation (NMMI)
Encouraged by Andhra Pradesh’s success in meeting its targets for FY2003-2004, the
Government of India (GoI) set up a National Task Force on Micro Irrigation in 2004. The Task Force
which was asked to evaluate the design of APMIP and create a national policy for micro irrigation that
would encourage widespread use across India. This process resulted in the Centrally Sponsored Scheme
for Micro Irrigation, which was introduced nationally in January 2006. The scheme was updated in
November 2010 and renamed the National Mission on Micro Irrigation (NMMI). The two schemes were
very similar in design. The 2006 scheme, provided a 40% subsidy from the central government and
mandated that states provide an additional 10% subsidy. The 2010 scheme increased the central

350
government’s contribution from 40% to 50%, while maintaining a 10% contribution from the states. For
the purposes of brevity, I refer comprehensively to the subsidy program between 2006 and 2015 as the
NMMI subsidy, since the general framework of the subsidy program changed very little over this period,
despite the change in name (Government of India, 2010).
The NMMI program was intended by its creators to catalyze widespread adoption of drip irrigation
across India (Official NCPAH, personal interview, March 3, 2015). The government argued that drip
irrigation was necessary for both conserving India’s dwindling water reserves, and raising yields and
incomes for farmers (Government of India, 2010). While many subsidy programs in India for agricultural
equipment such as tractors, borewells and solar pumps are quantity limited, so that only a limited number
of subsidies are available at the local level (thereby limiting costs), the drip irrigation subsidy program
was intended to be available to all who applied. Subsidizing 40% of the cost of drip irrigation equipment
for any farmer who applied was a very large investment on the part of the central government.
Total spending on NMMI since 2006 has not been published by the government. While it is
difficult to estimate exactly how much money has been spent on the drip irrigation subsidy program in
India since its inception, data from 2013-2014 can be extrapolated for a rough estimate. In 2013-2014, the
central government allocated $260 million to the NMMI subsidy program for a single year (Government
of India, 2014). Given that the subsidy program has been ongoing since 2006 and even assuming that the
allocation in 2013-2014 was higher than previous years, it is likely that between 2006 and 2014, the
central government spent well over a billion dollars on the subsidy program to stimulate the drip
irrigation industry in the country.134
The public policy justification given for the NMMI subsidy program was the “harnessing
maximum benefits from available water resources.” The first goal of the subsidy program was to
134 This is in addition to the money spent by state governments which varies significantly between states depending on how much additional subsidy the state offers.

351
“increase the area under micro irrigation through improved technologies” and the second goal was to
“enhance the water use efficiency in the country” (Government of India, 2010, p. 3). Despite the
significant text devoted to justifying the subsidy program in terms of water savings and other positive
economic and environmental outcomes in the text of the NMMI guidelines, the guidelines do not address
why public intervention is required to promote adoption of the technology. However, all actors involved
in the NMMI implementation I interviewed said that the reason for the NMMI subsidy program is that
capital costs of drip irrigation are too high for farmers to pay for themselves and without a subsidy
program, drip irrigation would never reach widespread use.
The justification for the NMMI subsidy program rests on weak data. While drip irrigation almost
unquestionable has the potential to increase water use efficiency at the plot level, the degree to which the
technology saves water at the basin level is debated (Berbel et al., 2015; Fishman, Devineni and Raman,
2015; Liebrand, 2017). It is likely that a significant proportion of the water that drip irrigation saves at the
plot scale is not actually saved at the basin or aquifer scale. This is because water that is not used by the
crop often percolates to shallow aquifers where it is used by other farmers. The amount of water lost to
evapotranspiration differs by climate and crop, but in the context of a human environment like West
Bengal, drip irrigation likely results in no net water savings at the aquifer scale. At the same time,
evidence from India and Spain suggests that farmers who save water by using drip irrigation on one plot,
often choose to expand their area under irrigation, reducing the total water savings from the adoption of
drip irrigation.
Given this data, the ‘public good’ justification for subsidizing the adoption of drip irrigation for its
water saving and environmental benefits is hard to defend. The other justification given for the NMMI
subsidy policy are the benefits realized by the individual adopters who are able to increase yields, reduce
labor costs and (depending on local circumstances) save money on the cost of irrigation. Policies that
support increased agriculture productivity are not unique to the NMMI subsidy program. Much the public

352
policy undergirding the Green Revolution in the 1970s and 1980s came in the form of government
support to farmers in order to raise their yields (Chopra, 1985). The allocation of public money to support
the Green Revolution was justified as an effort to secure the India’s food security, prevent famine and
alleviate poverty (Chopra, 1985). Today, India is largely food secure and already has the capacity to
address localized famines through and extensive network of food reserves. The only remaining
justification for spending public money on the NMMI subsidy program is poverty alleviation. But for this
to be achieved, the NMMI subsidy program would have to benefit the poorest farmers. This I demonstrate
in the Section 4.4 is not the case.
4.3.4 Implementation of NMMI at the State Level
While the central government set up the subsidy program in 2006, they left implementation largely to the
states. States were given substantial independence to design their own implementation plans. States were
asked to submit Annual Action Plans to the NMMI Executive Committee, and to send monthly data on
subsidy disbursement to the National Committee on Plasticulture Applications in Horticulture (NCPAH),
a small committee loosely affiliated with the Ministry of Horticulture, which was tasked with
coordinating and monitoring the subsidy program.
Two key aspects of the NMMI program were standardized at the national level. The first aspect
aimed to ensure that small and marginal farmers (those farmers with less than two hectares of land; 5
acres) benefited from the NMMI subsidy program, by allocating an additional 10% subsidy from the
central government (Government of India, 2010). Many states also allocated their own additional
subsidies to small and marginal farmers –often adding an additional 5% to the central government’s 10%
or running special limited time programs with added incentives for small and marginal farmers, to try to
target this group.

353
The second aspect of the NMMI program, which was standardized at the national level, had to do
with the physical design of the technology itself. Based on experience in AP, the government wanted to
ensure that drip irrigation companies did not inflate their costs over market value. The concern was that
with such a large percentage of the cost of the technology being paid for by the government, that “free-
market” competition mechanisms would be ineffective at ensuring that private companies charged fair
prices for their technology (Krish Iyengar, Executive Director NCPAH, personal interview, New Delhi,
March 4, 2015). In order to ensure that companies neither inflated costs, nor skimped on system design
and quality, the NMMI subsidy program outlined specific standards and prices for any drip irrigation
equipment eligible for the subsidy program.
States began implementing the NMMI subsidy program in 2006. States varied markedly in their
implementation plans. While Andhra Pradesh continued with its strategy under APMIP, which housed the
drip irrigation subsidy program within an independent branch of the horticultural department, many
subsidy programs were run with much less independence, often within existing programs in the states’
agricultural or horticultural departments. Gujarat followed Andhra Pradesh’s lead and set up an
independent implementation agency, or special purpose vehicle, called the Gujarat Green Revolution
Council (GGRC) (Pullabhotla, Kumar and Verma, 2012) . The GGRC differed from APMIP in that it was
not housed within a government department, but rather was set up as a public company. This gave the
implementing agency considerable independence and authority. The Chief Minister of Gujarat at the time,
Narendra Modi (now India’s Prime Minister), was deeply invested in the success of the GGRC subsidy
program, believing that a more business-oriented subsidy delivery model would help his state improve
agricultural productivity in the face of declining groundwater tables (Shyamal Tikadar, joint managing
director GGRC, personal interview, December 26th, 2013). In order to make GGRC a success, Modi
personally recruited a retiring senior officer from the prestigious Indian Foreign Service to serve as joint

354
managing director, in order to set up GGRC, and ensure that the organization ran smoothly and cut
through red tape (Liebrand, 2017).
Apart from variation in the institutional design of NMMI subsidy programs at the state level, the
states also differed markedly in the amount of subsidy they allocated to the subsidy. States like Gujarat
and Kerala kept their subsidy in-line with the NMMI’s bassline policy of 50% (40% from the central
government and 10% from the state), whereas states like Andhra Pradesh and Bihar, decided to add
additional funding to the program, subsidizing drip irrigation for their farmers to the tune of 90% – even
100% at times in Bihar, for small and marginal farmers.
Interestingly, data collected in 2011 showed no correlation between the size of the drip irrigation
subsidy provided by a state and the extent of drip irrigation adoption in the state (see Figure 4.3). Some
states with lower subsidies, such as Maharashtra, had adoption levels as high as 25% of potential area.
While other states, such as Bihar, who had 90% subsidies, had less than 1% adoption rates.
Figure 4.3: Percent subsidy for drip irrigation and percent potential area adopted by state in 2010 Source: (Compiled from Palanisami et al., 2011; Data provided by state governments)
50
%
50
%
50
%
50
%
50
%
50
%
65
%
70
%
70
%
70
%
70
%
70
%
75
%
75
%
80
%
90
%
90
%
90
%
0.2
0%
0.3
2%
7.7
7%
9.3
3%
12
.19
%
25
.68
%
22
.58
%
2.1
6%
9.9
5%
12
.37
%
12
.79
% 29
.82
%
0.6
6%
28
.15
%
0.6
1%
0.0
2%
21
.99
%
50
.49
%
% Drip Subsidy % Potential Area Adopted

355
The lack of correlation between size of the subsidy and overall adoption of drip irrigation across
states, presents something of an empirical puzzle from a market economics perspective. Why were
farmers in states that had 90% subsidies, like Bihar, adopting drip irrigation at such low rates, whereas
farmers in states with only 50% subsidies were adopting drip irrigation much more widely?
Certainly, the answer lies in both the institutional design of the subsidy program, as well as in local
characteristics of each state. But understanding exactly what institutional mechanisms and local
characteristics favored the widespread use of drip irrigation technology is a useful empirical question. The
first goal of the cross-state comparison in this paper (Section 4.4) is to better understand the factors
behind the divergent rates of adoption of drip irrigation in India.
The second goal of the empirical design of the case studies, was to understand what institutional
factors allowed for small and marginal farmers to adopt drip irrigation in some states more than others.
Data from 2010 (Palanisami et al., 2011) showed that in most states, adoption of drip irrigation by small
and marginal farmers was below 20% of all adopters in the state – despite the additional 10% the NMMI
subsidy targeted at this group (see Figure 4.4).
Figure 4.4: Percent small and marginal farmers among drip irrigation adopters by state in 2010.
Sources: (Palanisami et al., 2011; Some data provided by state governments)
50%
2%
20%
15%
25%
15%
5%
10% 10%
0%
10%
20%
30%
40%
50%
60%
% Small & Marginal Farmers Among Adopters

356
The lack of small and marginal farmers amongst drip irrigation subsidy recipients in most states is
even more stark than appears from Table 4.4. This is because in most states in India, small and marginal
farmers account for considerably more than 50% of farming households. Thus, if the benefits of the
subsidy program were distributed evenly across socioeconomic groups, small and marginal farmers would
make up the greatest share of drip irrigation subsidy recipients.
Clearly, benefits of the NMMI subsidy program are skewed toward wealthier farmers. My research
question asked whether any state had begun to solve the problem, by designing mechanisms beyond the
additional 10% subsidy, that would give small and marginal farmers greater access to the subsidy
program. I selected Kerala, as the state with the greatest number of small and marginal farmers adopting
drip irrigation, for a case study on one end of the spectrum, and Bihar and Gujarat, as states with low rates
of adoption among small and marginal farmers (0.5% and 2% respectively). Andhra Pradesh, at 10% of
small and marginal farmers among adopters, came in somewhere in the middle of the pack.
4.4 Analysis: Implementation of NMMI in Four States
4.4.1 Andhra Pradesh
Andhra Pradesh was the first state to develop a drip irrigation subsidy program (APMIP). Data
from 2011 indicates that more than 50% of potential area in Andhra Pradesh is irrigated by drip irrigation
technology. It was clear during field my fieldwork in the state that drip irrigation is in widespread, and
that even farmers who have not adopted drip irrigation are still very well versed in the technology. This
included both the physical and institutional dimensions of the technology (e.g. the availability of the
subsidy program, the types of crops where drip irrigation is used, benefits associated with yield and
labor).
Interviews with private sector drip irrigation companies suggest that the biggest barrier to
increased adoption of drip irrigation in Andhra Pradesh is actually deteriorated performance of APMIP

357
itself. One of the important institutional dimensions of APMIP that led to the initial success of the
program was the decision for APMIP to pay subsidy money directly to the private sector drip irrigation
companies based on proof of successful instillation of the drip system. This decision reduced upfront
costs for farmers who under more typical subsidy programs would have to pay for the full cost of the
system, submit paperwork to the government and then wait to be reimbursed for the proportion of the cost
covered by the subsidy. Instead, under APMIP the private sector companies took on responsibility for
ensuring the paperwork for the subsidy application was in order and they were able to charge farmers
only the price of their drip system minus the subsidy amount. The government would then give the
subsidy money directly to the drip irrigation companies’ accounts after verifying that the drip irrigation
system had been installed.
Initially APMIPs institutional design was very effective, and in interviews with the private sector
officials in Andhra Pradesh, they credit the decision to pay subsidy money directly to the private sector
with the rapid adoption of drip irrigation by farmers who did not have to come up with capital to pay for
the full cost of the system, while waiting for the subsidy. However, starting around 2010, the government
began to release the subsidy funds to the private sector companies far more slowly than they did in the
early years of the APMIP scheme. This left the private sector companies with large accounts due from the
government, which were often behind by as much as two years and several million dollars. In response,
private sector companies began to slow down their growth in Andhra Pradesh to avoid ballooning their
accounts payable to their own creditors. Due to the slowdown in reimbursements under the APMIP
program, many private sector companies chose to focus their growth in other states, especially Gujarat.
In Andhra Pradesh, farmers felt that the biggest benefits of drip irrigation were increased yields
and water savings. Water savings in Andhra Pradesh were important to many farmers who relied on diesel
for irrigation and were able to cut their irrigation costs by using drip irrigation. However, the biggest
benefit all adopters cited was increased and higher quality yields.

358
The biggest barrier to adoption of drip irrigation cited by non-adopters in Andhra Pradesh is the
cropping cycle for farmers whose land is flooded during monsoon. The only crop that can be cultivated on
low-lying land during monsoon is rice, which is not a crop that is grown with drip irrigation.135 Farmers
with low-lying land felt that they could not use drip irrigation in the other two seasons because removing,
storing and then reinstalling the drip irrigation system during monsoon was prohibitive, both in terms of
time and expertise required to reinstall the system.
A second barrier cited by non-adopters was access to the technology. One small farmer I
interviewed said that he had inquired about drip irrigation but was told by the dealer that there was a
back-log in applications for the subsidy and that he would have to wait at least a year. In interviews with
the private sector and equipment dealers, I learnt that the back-log was not due to a waitlist for the
APMIP subsidy scheme itself, but due to the intentional slowing-down of business on the part of the
private sector suppliers, who were waiting for APMIP to reimburse them for earlier work.
The biggest barrier to adoption of drip irrigation in Andhra Pradesh by small and marginal farmers
was the lack of incentives for equipment dealers to work with small and marginal farmers. This was
confirmed by all three dealers I interviewed in the state. Instead, equipment dealers prefer to work with
larger farmers because they earn a much larger commission working with larger farmers, not only because
the size of the drip system is usually larger, but also because working with small and marginal farmers is
usually more time consuming. One dealer explained, “I don't spend more time convincing a large farmer
to buy drip irrigation, rather I spend more time explaining the system to a small farmer. This means that I
save time if I work mainly with larger farmers and because they are often buying a larger drip system, I
get a larger commission as compared to the time I spent selling the system.” Poorer farmers, drip
equipment dealers explained, require more hand-holding through the entire application process and more
135 Some agronomists including scientists at JAIN irrigation have demonstrated benefits of drip irrigation in rice cultivation, but using drip on rice was not in widespread use at the time of fieldwork.
359
training on how to use the equipment. All three equipment suppliers said that they targeted their outreach
and marketing toward medium and large landholders and only worked with small and marginal farmers
when the small and marginal farmers directly approached the dealers. Of the three equipment dealers I
interviewed, two estimated that small and marginal farmers made up less than 10% of their business. One
equipment dealer estimated that small and marginal farmers made up 25% of his business because he
worked in an area of the state where the majority of landholders were smaller. He also said the percentage
of his client base made up of small farmers had grown over the years as most of the medium and large
farmers had already adopted drip irrigation on their land. He also said that while small farmers made up
25% of his clients, very few of his clients were marginal farmers with less than 1 hectare of land.
4.4.2 Bihar
My own survey of 498 households in Bihar found only one farmer who had adopted drip
irrigation. This finding supports other estimates of drip irrigation adoption in Bihar being less than 1% of
land area in the state. Overall, Bihar is a case of both very low overall adoption and close to no adoption
by small and marginal farmers. In fact, one equipment dealer I interviewed told me that except for a few
NGO-led projects he was unaware of any marginal farmers in the state who had received the NMMI
subsidy. Moreover, 80-90% of his clients are large farmers with more than 10 hectares of land, which
means that few medium sized farmers in the state are not benefiting from the NMMI subsidy program.
My first visit to the office responsible for implementing the NMMI scheme in Bihar helped
explain these empirical findings. While most government departments I visited in Bihar were chaotic and
stacked with paper records, the chaos was active and one got the sense that things were getting done even
if not always efficiently. The department responsible for implementing the drip irrigation subsidy
program was not like this. It was dark, musty, and the lone computer looked like it had been purchased
360
before the turn of the millennium. In total, only three government employees work on Bihar’s NMMI
program when I visited and only one of the three was capable of working with a computer.
The management of the NMMI program by the government of Bihar is the biggest barrier to
growth of the subsidy program in Bihar according to three different private sector company officials I
interviewed. One major challenge the private sector faces is long delays getting the government to verify
instillation of the drip irrigations systems so that subsidy funds can be released. In addition, subsidy funds
are released to the farmers themselves and not to the private sector companies. That means that farmers
either have to pay the full cost of the system up front and wait to be reimbursed by the government which
can take over a year, or the private sector agrees to wait until the farmer has received the subsidy to take
full payment for the system from the farmer. While private sector companies do not like to do this
because it raises transaction costs and opportunities for farmers to attempt to avoid payment, dealers say
that most farmers will not adopt drip if they have to pay the full cost of the system upfront.
The main mechanisms through which the poor implementation of the subsidy program in Bihar
hampers adoption of drip irrigation is private sector avoidance of the market altogether. What made the
APMIP program successful is that the private sector took the responsibility for outreach and marketing to
farmers, which spurred adoption in the Andhra Pradesh. In Bihar, Jain Irrigation’s office in the capital of
Bihar had only eight employees when I visited in 2015. This stood in stark contrast to their operation in
Gujarat which had over fifty employees in the central office in addition to multiple satellite offices. This
example is reflective of other private sector drip irrigation companies in Bihar who mostly only have a
few employees in the state focused on larger clients.
Adopters of drip irrigation in Bihar are happy with their investments. In fact, many farmers had
managed to bypass the rules of the subsidy program by applying in the name of more than one household
member and had received the subsidy package more than once. Farmers cited increased yields, decreased
labor costs and decreased costs of irrigation as the main benefits to adoption. Farmers who irrigated using

361
high-cost diesel, rather than low-cost electricity were the happiest with drip irrigation because it
significantly reduced their costs. One farmer estimated that he would recoup his investment in less than
half a season.
While in theory, there might be many barriers to adoption of drip irrigation by small and marginal
farmers in Bihar, such as lack of well-ownership, in practice, the limiting barrier is simply that small and
marginal farmers have never heard of drip irrigation. In the survey of 498 households in Bihar, only 15%
of all farmers had even heard of drip irrigation or knew what it was. Moreover, only 11% of small and
marginal farmers said they had heard of drip irrigation.
4.4.3 Gujarat
My first visit to the implementing agency responsible for the NMMI program in Gujarat, the
Gujarat Green Revolution Council (GGRC), was impressive. The GGRC offices took up perhaps a city
block, were immaculate, and had no stacks of paper or clutter because all records were digitized. GGRC
had even hired their own external evaluators, and shared their reports with me when I arrived. They also
shared all of their raw data including GPS coordinates of the subsidy recipients as well as copious details
about each farmer who had adopted drip irrigation through the GGRC system. I was most impressed on
the following day, when I used the list they sent me to randomly visit villages and track down farmers in
their data set. Out of the seven farmers I interviewed, who I randomly selected from the GGRC data, all
seven of them were actively using the drip irrigation systems they had received through the GGRC
subsidy in their fields. Some of these households had drip irrigation systems older than five years (n=2)
that were still functioning well. This finding stood in contrast to published journal articles on adoption of
drip irrigation in the developing world, which showed high rates of disadoption among farmers
(Friedlander, Tal and Lazarovitch, 2013).

362
While 2011 data showed Gujarat significantly behind AP in terms of percent of potential area
under drip, estimates from 2015 showed that the GGRC program had the highest annual rate of adoption
of any state in India (Liebrand, 2017). Private sector companies explained that the business environment
in Gujarat was the best of all states in India. The GGRC program had built on the success of APMIP, but
by making GGRC an autonomous organization, the bureaucratic red tape the companies were used to
dealing with in other states, was practically non-existent in Gujarat. While the subsidy application process
required a lot of paperwork, the paperwork was streamlined, could be entirely completed by equipment
dealers and supplier company staff and was always processed efficiently by the GGRC.136 Most
importantly, the GGRC reimbursed private sector suppliers within three to four months. Simply put, the
cost of doing business in Gujarat was low and this incentivized private sector companies to hire more
staff and build more capacity in the state.
The 13 farmers who I interviewed that had adopted drip irrigation all cited increased yields and
decreased labor costs as the main benefits of the technology. Only one household was interested in the
water-saving characteristics of drip irrigation and this was not because of the high cost of water (he paid a
monthly flat rate for electricity) but rather because he was intrinsically concerned with the declining
groundwater in the state and wanted to do his part to concern water.
Two major barriers to adoption of drip irrigation were identified both by the farmers I interviewed
and the staff of GGRC. Both barriers had to do with water access. First, in areas where farmers own their
own wells, growth in drip irrigation adoption was high. But in regions where farmers use large communal
wells and were thus uncertain about when they would be able to access water, using drip irrigation
technology proved more difficult and adoption rates were significantly lower. A second major barrier for
136 One interesting proposal discussed by GGRC staff was their efforts to include iris-scanning in the subsidy application process as part of their effort to prevent the same farmer from receiving the subsidy more than once in a 10-year period. To an American, this idea struck me as invasive of privacy, but did show the lengths GGRC would go to foster transparency in the subsidy program.

363
many farmers in Gujarat is land fragmentation – the more individual pieces of land a farmer owns the
more difficult it was to adopt drip irrigation due to fixed costs associated with each individual plot of
land.
Overall, out of the five equipment dealers I interviewed, one said that about 15% of his client base
are small and marginal farmers; three equipment dealers said that small and marginal farmers made
approximately 10% of their clients; and one said that he only worked with large farmers because “I have
more business than I can handle only working with large farmers, so why would I do anything else?”.
However, given that Gujarat has a much smaller overall proportion of small and marginal farmers (25%)
the ratio of adoption among this group is higher than in any other state. When I asked dealers about this,
they said that like in Andhra Pradesh, they had less incentive to market to small and marginal farmers
because their profit margins are lower. However, because the GGRC often implements short-term
additional subsidies for small and marginal farmers that they advertise widely through radio, small and
marginal farmers approach the dealers themselves after seeing drip irrigation in their neighbor’s fields and
hearing on the radio that there is additional subsidy available for them. The dealers even said that they
thought the short-term subsidy offerings were useful in spurring interest by small and marginal farmers
because the limited time window served to overcame inertia on the part of farmers.137
Dealers said that while their profit margins were lower when working with small and marginal
farmers, they thought the main limiting factor preventing small and marginal farmers from adopting the
technology was water access. Small and marginal farmers they said faced the greatest barriers adopting
drip irrigation because they are also usually water-buyers. Borewells in Gujarat are expensive to build
because the water table is very low (often 500-700 feet). Small and marginal farmers cannot afford the
137 This is a very interesting finding that merits further exploration through the lens of behavioral economics. It also is supported by findings from Kenya, that behavioral incentives can encourage farmers to buy fertilizer when they otherwise might now (Duflo, Kremer and Robinson, 2011).

364
capital investments for a borewell and buy water from other farmers. As water-buyers, they have less
certainty over when they will be able to access water from their neighbor. They are thus unable to use drip
irrigation technology which requires a high degree of control over timing of irrigation.138
4.4.4 Kerala
I originally selected Kerala because it was one of the few states that had high rates of small and
marginal farmer adoption of drip irrigation – indeed small and marginal farmers make up 50% of farmers
adopting drip irrigation in the state. What quickly became apparent during my fieldwork, was that in the
case of Kerala, small and marginal farmers did not serve as a good proxy for the “poorest” farmers.
Indeed, many of the households I interviewed, despite having landholdings under two hectares, were
wealthy households whose members had often returned from working in the Gulf states or who had
children working in high-tech industries in the United States.139 Only four out of the 11 households who
had adopted drip irrigation saw agriculture as their primary source of income. For seven households,
agriculture was largely a retirement activity. Moreover, the two equipment dealers I interviewed both said
that about 85% of their clients have landholdings in the small and marginal range.
The primary reason for adopting drip irrigation amongst farmers in Kerala was labor costs.
Because Kerala’s labor force is highly educated with many opportunities outside the state, hiring daily
labor for agriculture is expensive, and the main value drip adopters saw from the technology was the
ability to reduce either their labor costs or their own labor field. One farmer, with one and a half acres of
138 Note: This is a feature of all field-level water conservation technologies including the system of rice intensification. In order for a farmer to irrigate her field less on one day, she must be confident she will have access to irrigation on day 2 when she needs it to keep her crop sufficiently irrigated. If she is uncertain about when she will next be able to access water, she is better off using traditional irrigation methods which ensures residual water is available to the plant between irrigations. 139 In fact, out of the 11 households I interviewed who had adopted drip irrigation, six of the households had immediate family members who either currently worked or used to work as high-income professionals in Gulf countries or in the United States as doctors, nurses and data scientists. A seventh household was a retired professor at the Indian Airforce Academy in New Delhi and his large home garden for which he had received a subsidized drip irrigations system was his retirement hobby.

365
land, said that because the cost of hired labor was just over $9 USD per day, he mostly watered his field
himself, spending five to six hours a day watering his vegetable crop. With drip, his time investment is
now under 15 minutes. He said drip irrigation had significantly improved his well-being because now “I
have more time to grow plantains near the house and more time to spend with the children which my wife
appreciates.”
Out of the 11 households I interviewed who had adopted drip irrigation, 11 cited labor costs as the
primary reason for adopting the technology and nine also cited increased yields. Only two households
mentioned water savings as a reason for adopting drip irrigation and in both cases, this was a secondary
benefit to the labor saving dimensions of the technology.
Most of the households I interviewed had learnt about the drip irrigation subsidy after being
approached by drip irrigation dealers in their district. Out of the 11 households, eight had decided to adopt
drip irrigation after a dealer visited their home; two learnt about drip irrigation from their local
government extension officer, who had then put them in touch with a drip irrigation dealer; and one had
read about the subsidy in a newspaper advertisement paid for by a local drip irrigation dealer and then
approached the dealer directly.
Based on interviews with three farmers who had not adopted drip irrigation in Kerala, as well as
with two equipment dealers and two representatives of drip manufacturers, a major barrier to adoption of
drip irrigation in Kerala is a result of the design of NMMI and local characteristics of agriculture in the
state. Many farmers who practice agriculture as their primary income source, lease land from wealthier
households who have moved out of agriculture into other careers (many outside the state). Because they
are leasing their land, they are ineligible for the NMMI subsidy. Moreover, they are uninterested in
making long-term capital investments in the land they lease. This barrier was raised by two farmers, two
dealers, one private sector official, and one government extension officer.
366
Another factor slowing the rate of growth of drip irrigation adoption in Kerala is lack of private
sector participation. One of the private sector companies said that because landholdings in Kerala are
small, their own profit margins in the state are also lower, so they have less incentive to invest in growth.
This private sector official suggested that in states with smaller farmers, the private sector should be given
greater incentives to do business. In addition, the design of the subsidy program in Kerala sends the
subsidy money to the farmer rather than the drip irrigation company which also limits growth in the state.
4.4.4 Comparing NMMI Across Four States
Looking across the four states, the variation in overall success of the NMMI subsidy program is
driven by the design and implementation of the subsidy programs at the state level. It is not driven by the
percent subsidy provided to farmers in each state. This is initially counter intuitive from a purely
economic incentive perspective and underscores the importance of institutions in the functioning of
innovation systems.
Adoption in both Andhra Pradesh and Gujarat is far higher as a percentage of potential land area
than in either Bihar or Kerala. And while Gujarat was behind Andhra Pradesh, the state is quickly
catching up. The reason for these differences in overall adoption rates is the institutional design of the
subsidy implementing agencies. In both the case of Andhra Pradesh and Gujarat, the chief ministers of
both states took a personal interest in the implementing of the drip irrigation subsidy program and
appointed directors of the programs with the necessary authority and resources to create an effective
implementing agency.
In the case of Andhra Pradesh, the chief minister established APMIP before even the national
scheme had been developed and convened a Task Force of high-level officials to think through an
effective institutional design for APMIP that would create the right incentives for the private sector to do
the “last mile” extension work connecting farmers with drip irrigation.

367
In the case of Gujarat, the chief minister at the time the GGRC implementing agency was
established was Narendra Modi who is now the Prime Minister of India. To ensure that GGRC had both
an effective institutional design as well as the authority to implement the program, Modi hired a retired
foreign service officer (a coveted and highly sought after position in India that only the brightest students
achieve) to design and implement the GGRC program. He also ensured that GGRC controlled a large
fund that allowed GGRC to repay private sector companies quickly, thereby reducing risk to the private
sector and making Gujarat that most attractive state for private sector retailers to focus their growth and
hire dealers to market their products to farmers.
In contrast, the offices responsible for implementing the subsidy program both in Bihar and Kerala
sit within larger ministries and are only one piece of their minister’s overall prevue. The individuals
tasked with implementing the subsidy program in both states have very little authority or control over
their own budgets.
One important institutional innovation of both the APMIP and GGRC programs was to give the
subsidy money directly to the private sector rather than passing it through the hands of the farmers. This
substantially improved the overall functioning of the subsidy system and also incentivized the private
sector to take over responsibility for farmer outreach and marketing.
In Bihar and to some extent Kerala, where the NMMI subsidy program is not run through a
separate implementing body and where the subsidy is given directly to farmers, the private sector has
found the business environment less stable and has not invested in growth and marketing in the state.
Only Gujarat has succeeded in designing institutional incentives to promote drip irrigation among
the poorest farmers (with the caveat that almost all farmers in Kerala are small and marginal and that
landholding size is not a good proxy for assets in the state). Gujarat, by advertising short term additional
subsidies directly to small and marginal farmers has spurred interest in the technology for the poorest

368
farmers. They have also overcome the private sector and equipment dealers’ reluctance to work with
smaller farmers by finding ways to get small and marginal farmers to approach the private sector.
In all states, the equipment dealers highlighted the smaller profit margins they receive when
working with small and marginal farmers. This suggests that the NMMI design, which targets additional
funds towards small and marginal farmers, has not aligned incentives structures appropriately to achieve
the goal of increased adoption by small and marginal farmers. Instead of offering small and marginal
farmers themselves increased subsidy, it may make more sense to provide additional incentives to
equipment dealers and the private sector more broadly to work with this group. I summarize the findings
from the four states below (see Table 4.3).

369
Table 4.3: Comparison of performance of NMMI across four states.
State
Ave % of small and marginal farmers in dealers’ client base
# of Dealers Interviewed
Summary of Key Findings by State
Andhra Pradesh 15% 3
• Equipment dealers and private sector concerned about management of APMIP. Slow re-payment from government.
• Barriers to increased overall adoption include institutional incentives for private sector and agroecological conditions.
• 80% of farmers in the state are small and marginal. • Small and marginal farmers originally made up a small percent of
subsidy recipients, now that most medium and large farmers who are interested having adopted drip, some dealers are targeting small farmers more.
Bihar 3.5% 2
• Equipment dealers in Bihar say that over 85% of their clients are medium and large farmers with over 10 acres of land.
• In Bihar, 97% of farmers are small and marginal. Less than 2% of farmers in Bihar have landholdings above 10 acres. At the same time, the two equipment dealers estimate that less than 5% of their clients are small farmers, and none are marginal farmers.
• Neither equipment dealer recalled selling drip irrigation to marginal farmers through the NMMI program.
• Only project where marginal farmers in Bihar have drip irrigation are through NGOs, and very few small farmer adopters.
Gujarat 9% 5
• GGRC subsidy program very effective. Private sector companies focusing growth in Gujarat because of design and stability of GGRC program, which creates good business environment.
• Small and marginal farmers make up approximately 25% of farmers in the state, which means that proportionally Gujarat is also doing better than Andhra Pradesh in reaching this group.
• Gujarat has designed effective incentives to target small and marginal farmers through short-term additional subsidies for this group. The GGRC advertises these short-term subsidies through radio.
• Major barrier to adoption by poorest is lack of well-ownership.
Kerala 85% 2
• The majority of farmers in Kerala who buy drip irrigation through the subsidy program belong to the small and marginal category.
• 96% of farmers in the state are small and marginal • Landholding size in Kerala is not well correlated with overall
assets. • Major barrier to adoption is high rates of land-leasing amongst
Kerala’s farmers who lease from wealthier households who have moved out of agriculture.

370
4.5 Findings: NMMI Delivers Mixed Results
4.5.1 NMMI at the National Level
There are also two major barriers preventing the poorest farmers from benefiting from drip
irrigation at the national level.
Data Collection: The NMMI scheme is centrally managed in Delhi. Despite the large overall
budget under NMMI, management of the scheme at the national level is relatively small. The office
responsible for collecting data on the states’ implementation of the subsidy program (NCPAH) has a
modest staff, who do not work full time on the NMMI scheme, but rather focus on multiple schemes and
programs related to the use of plastics in agriculture. While I was unable to convince NCPAH to share
their data with me, I was able to obtain the monthly reports sent to NCPAH from the implementing
agency in Kerala. If the reports that NCPAH collects from Kerala are similar to those used in other states
(and it appears to be a standard form) then NCPAH receives no socioeconomic data about subsidy
beneficiaries from the states. Kerala did not send demographic data such as caste, religion, income or total
landholdings of subsidy recipients to NCPAH. Failure to collect socioeconomic data on the part of
NMMI calls into question the strength of the programs commitment to ensure benefits of the technology
are realized by small and marginal farmers.
Design Standards: The NMMI subsidy program set technical standards for all drip irrigation
equipment covered by the subsidy. The original intention of these standards was to ensure that the private
sector did not sell sub-par equipment under the subsidy scheme. This was a significant concern because
with such a large percentage of the overall cost of the system provided by the public sector, it could limit
incentives for individual buyers to ensure they were getting the best product, especially in areas with
limited competition between drip irrigation sellers. However, the technical standards had an unintended
effect in that they excluded low-cost drip irrigation designs from the subsidy program. For example,
NMMI mandates that the minimum thickness of pipes used for drip irrigation should be no less than 600

371
microns. The thickness of the pipes is a major component of the entire system cost, and because of low-
cost systems all have pipes that are below 600 microns, this standard excludes low-cost systems from the
NMMI subsidy program (Sarah Huber, DripTech India, personal interview, March 23, 2015).
Low-cost drip irrigation designs are often more appropriate for small and marginal farmers. For
example, they are easier to install and uninstall, which means that small and marginal farmers can easily
store them in monsoon season during their paddy crop and then use them again in winter and summer for
vegetable crops. However, due to the exclusion of low-cost systems from NMMI’s design standards, low
cost drip irrigation companies have a difficult time competing in India and have mostly focused their
efforts on other countries. This limits availability of low cost drip irrigation systems on the market in
India. DripTech, a low-cost drip irrigation provider in India says that in most states their systems are
“costed out” by the NMMI subsidy. Because of this, they focus their business growth in states with low
overall subsidies and where the subsidy program is poorly implemented, so that farmers often choose to
purchase drip irrigation without the NMMI subsidy (Sarah Huber, DripTech India, personal interview,
March 23, 2015).
4.5.2 Success of NMMI: Public Incentives for Private Extensions
Measured against drip irrigation adoption, the NMMI program has been a qualified success. Many
states in India have succeeded in spurring widespread adoption of drip irrigation. Moreover, farmers who
have adopted drip irrigation through the NMMI program, report positive benefits and cost recovery periods
of under two years (and often as little as six months).
Supporters of the NMMI subsidy policy in India claim that the main mechanism that has moved drip
irrigation into widespread use is decreased prices to end users as a result of the subsidy program. While this
is partly true, the four cases analyzed in this chapter demonstrate that decreasing prices to end users alone
is not enough to encourage widespread use of the technology. If it were, Bihar with a 90% subsidy should

372
have higher rates of drip irrigation adoption than Gujarat with a 50% subsidy. Instead, the results of the
case studies demonstrate that the institutional design of subsidy implementation programs is important in
explaining overall adoption across states.
The APMIP and GGRC programs aligned incentives between actors in the public and private sector.
Under the APMIP and GGRC subsidy programs, the states created institutions that created stable and
attractive business environments for the private sector. This required providing a subsidy to decrease costs
to end users, but more importantly it required ensuring that the subsidy program functioned efficiently.
Under these conditions, the private sector focused on growth in Andhra Pradesh and Gujarat, and took over
responsibility for “last mile” technology marketing and delivery. In Bihar and to some extent Kerala, the
states failed to create institutions that assured the private sector of stability and growth and the private sector
in turn did not provide “last mile” technology delivery to the same extent as in Gujarat and Andhra Pradesh.
4.5.3 Subsidies for Whom? Failure of the NMMI Program to Benefit the Poorest Farmers
Despite the success of the NMMI subsidy program in spurring widespread use of drip irrigation in
several states in India, the program has been much less successful in benefiting small and marginal
farmers. There are two primary reasons for this.
First, the Task Force that designed the NMMI program wanted to ensure that small and marginal
farmers also benefited from the subsidy scheme. To do this, they designated an additional 10% subsidy
for small and marginal farmers. However, this additional 10% was largely ineffective because the
equipment dealers responsible for “last mile” extension of drip irrigation face higher transaction costs
when working with small and marginal farmers, with no extra benefit. Discussions with equipment
dealers led me to believe that if the dealers received a higher commission for working with small and
marginal farmers, their incentive structure would change and adoption amongst this group might rise. The
extra subsidy currently targeted at small and marginal farmers under the current NMMI guidelines could

373
be split between marginal farmers and dealers or additional subsidy funds could be allocated for dealers.
Alternatively, the quantity of subsidies given to larger farmers could be decreased, especially given
limited evidence of public benefits (such as aquifer-scale water savings) from drip irrigation and these
funds could be reallocated towards small and marginal farmers and equipment dealers.
Second, the standards set by the NMMI subsidy program exclude low-cost drip irrigation systems,
which are often most appropriate to the needs of small and marginal farmers. This has caused low-cost
drip irrigation systems to disappear from the market in many states in India. This may be changing, as
states such as Karnataka consider ways to include low-cost drip irrigation in their subsidy programs
(GGGI, 2015). It is likely that discussions in Karnataka about low-cost drip irrigation and even inquiries
from researchers like myself have prompted interest in how NMMI can be re-designed to include low-
cost system drip irrigation systems and better meet the needs of small and marginal farmers. What is
more, larger drip irritations companies may be sensing change on the horizon – JAIN irrigation decided to
invest in low-cost drip irrigation technology by buying DripTech, in late 2015.
4.6 Discussion: Public Led Market-Creation for Public Benefit?
The successful spread of drip irrigation in India sheds light on the strengths of the private sector in
“last mile” technology delivery. Successful implementation of the NMMI subsidy program in some states
has placed India among the top markets for drip irrigation globally (Research Nester, 2017).140 It has also
helped India’s home-grown drip irrigation company, JAIN Irrigation Systems Ltd, become one of the
largest players in the business with 980 million USD in revenue in 2014-2015 . At the same time, the
140 My guess is that India is the leader in drip irrigation sales, but I would have to pay over 2,000 USD for access to the market research to confirm this (Research Nester, 2017).
374
failure of the program to encourage adoption by small and marginal farmers, shows that relying on the
private sector for “last mile” technology delivery can easily exclude the poorest farmers.
The states that were the most successful in realizing widespread use of drip irrigation in India
aligned incentives between public sector goals and private sector profits. The states focused on creating a
stable and high growth business environment for the private sector. Understood this way, the NMMI
subsidy program is not only as a tool for decreasing the required capital expenditure on the part of farmers
to adopt the technology, but rather is a tool for catalyzing an entire innovation system through
government-led “market-creation” (Mazzucato, 2016). The NMMI subsidy program can be scrutinized as
a large-scale effort to support the emergence of a new market and industry. From a policy perspective,
given the size of the publicly funded investment in market-creation, the government should demand more
from the private sector in return for its investment.
The failure of drip irrigation in India to benefit the poorest farmers is a result of decisions made in
the design of the subsidy program, including failure to add additional incentives for the private sector to
work with small and marginal farmers. These decisions also included those made about technology
standards that excluded low-cost drip irrigation, alternatives which are more appropriate for the needs of
small and marginal farmers. Future iterations of the NMMI subsidy program should focus on realigning
incentives for the private sector so that the poorest farmers realize more of the benefits from the NMMI
subsidy program. The government can do this by offering specific financial incentives to the private
sector equipment dealers for working with the poorest farmers, by marketing specific subsidies directly to
the poorest farmers (like in Gujarat), and by limiting the availability of the subsidy for medium and larger
farmers.

375
Appendices
376
Appendix 1. A note on caste categories, monetary conversions, and translations.
Caste Categories
Caste is at once a central concern of any research project on poverty in India and at the same time a complicated social construction for which there is a great deal of scholarship. For the purposes of this dissertation, a lengthy discussion of caste and caste politics would take use too far afield. I will use the terminology in common use in Bihar to refer to different caste groupings and occasionally refer to specific castes (e.g. Yadavs) with reference to the larger category they are generally categorized in (e.g. Yadavs in Bihar belong to the OBC category).
The caste groupings include:
1. “upper castes” (UC). These castes have traditionally formed India’s elite. In Bihar, the major forward castes have traditionally controlled the vast majority of agriculture land.
2. The lower castes are grouped into several categories. The first, known as “other backward castes” or OBCs are generally the most socially and economically empowered of the lower castes.
3. Scheduled Castes and Scheduled Tribes (SCs and STs) are a level below OBCs in terms of the social and economic empowerment.
Caste categories are officially recognized in legislation and are eligible for affirmative action programs known as reservations. This in turn has led to extreme politicization of the classification process with different castes groups jockeying to be classified in a lower category, eligible for greater reservations from the State.
It is also worth noting, that the most common way to refer to the three caste categories is to use acronyms to describe OBC and SC/ST castes, but to use the full words when describing UC castes (upper castes). I find this discrepancy unfairly biased and use acronyms in most cases to describe all three groups. I sometimes continue to use the full spelled out version when the use of the caste category is meant as an adjective rather than a noun (e.g. upper caste hegemony; lower caste empowerment).
Monetary Conversions
In this dissertation, monetary values are usually important in a relative context within the agriculture systems I study. I have therefore used a single exchange rate to convert from rupees to dollars of 65 to 1. Over the course of my fieldwork, the exchange rate fluctuated between 60 and 70 to 1. This midpoint seemed like the best choice for consistency sake. Results are never dependent on the exact conversion. I chose to mostly work in dollars rather than rupees because it is more straightforward for most readers.
Translations
In an effort to make this dissertation as easily readable as possible, I have limited my use of Hindi to a few key words which I always used in italicized lettering. I explain the meaning of all Hindi words on first use in the text. Below is a list of Hindi words used with their translations.
• Kranti: Revolution

377
• rupee: Indian currency • Sri-vidhee: Sri in Hindi means respected. In Bihar, the technology SRI is often called Sri-vidhee
so that Hindi speakers translate the term as respected method. • tola: Hindi word to describe a sub-unit of a village or hamlet. • -walla: Hindi expression often used to create a rhyming or musical cadence. Used in the context
of rubber pipes, which all farmers refer to as rubber-walla pipes. The walla serves no linguistic purpose other than to embellish the name.
• ryotwari: Revenue collection system put in place by the British Colonial Government in other parts of India (i.e. not Bihar).
• zamindar (n) (zamindars (pl); zamindari (adj): landlord or large landholder. In Bihar, under British colonial rule, the zamindars were responsible for revenue collection. Today the word is still used at times to refer to large landholders.

378
Appendix 2. Additional figures and tables for Chapter 2
Figure A1: Distribution of farmers in survey by landholding classification. In India, standard classifications run from marginal to large, but in Bihar, so many farmers fall within the marginal classification, that I have further subdivided the marginal category into six sub-classifications (M0-M6). M0 means that farmers have no land, but practice agriculture either on a sharecropping basis or less frequently by leasing land from other farmers. M1 are farmers that have up to 0.5 acres of land. M2 farmers have between 0.5 and 1 acres. M3 farmers have 1 to 1.5 acres. M4 farmers have 1.5 to 2 acres. M5 farmer have 2-2.5 acres. Small farmers have 2.5 to 5 acres. Semi-medium farmers have 5 to 10 acres. Medium farmers have 10-25 acres. Large farmers have 25 acres or more.
0
20
40
60
80
100
120
140
160
Num
ber o
f Far
mer
s in
Surv
ey
Classification

379
Figure A2: Comparison of survey data and distribution of size classes of farmers in 2011 Census.
In order to have sufficient data on larger classes of farmers, small, semi-medium, medium and large farmers were all slightly oversampled in survey. This was done by ensuring that all tolas in each village we surveyed were randomly sampled (rather than randomly sampling at the village level). Because there is usually caste (and wealth) based stratification at the unit of the tola, sampling at the tola unit, ensured greater representation in the data set of larger farmers than background rates. As we are interested in within-group technology adoption rates, this improved the quality of our data for larger farmer’s without skewing the findings
91%
6%3%
1% 0%
84%
9%5%
1% 1%
0%
10%
20%
30%
40%
50%
60%
70%
80%
90%
100%
MARGINAL SMALL SEMI-MEDIUM MEDIUM LARGE
Number of Landholdings by Size Group:
Comparison of 2011 Census and Survey Data
Bihar Survey

380
Figure A3: When farmers were asked from a multiple-choice list what was their most trusted source of information, the majority across castes answered either other farmers or seed sellers. Other farmers are the most trusted sources for OBC and SC/ST farmers followed closely by seed sellers. For UC farmers, seed sellers are the most trusted source followed by other farmers and district agriculture officers.
0%
10%
20%
30%
40%
50%
60%
District
Agricultural
Officers (33)
ATMA
Officials (16)
Seed sellers
(154)
Regional
NGOs (6)
Other
Farmers (173)
Farmer Fares
(14)
Other
Sources (8)
Most Trusted Source of Information, by Caste
SC/ST (172)
OBC (203)
Upper caste (29)
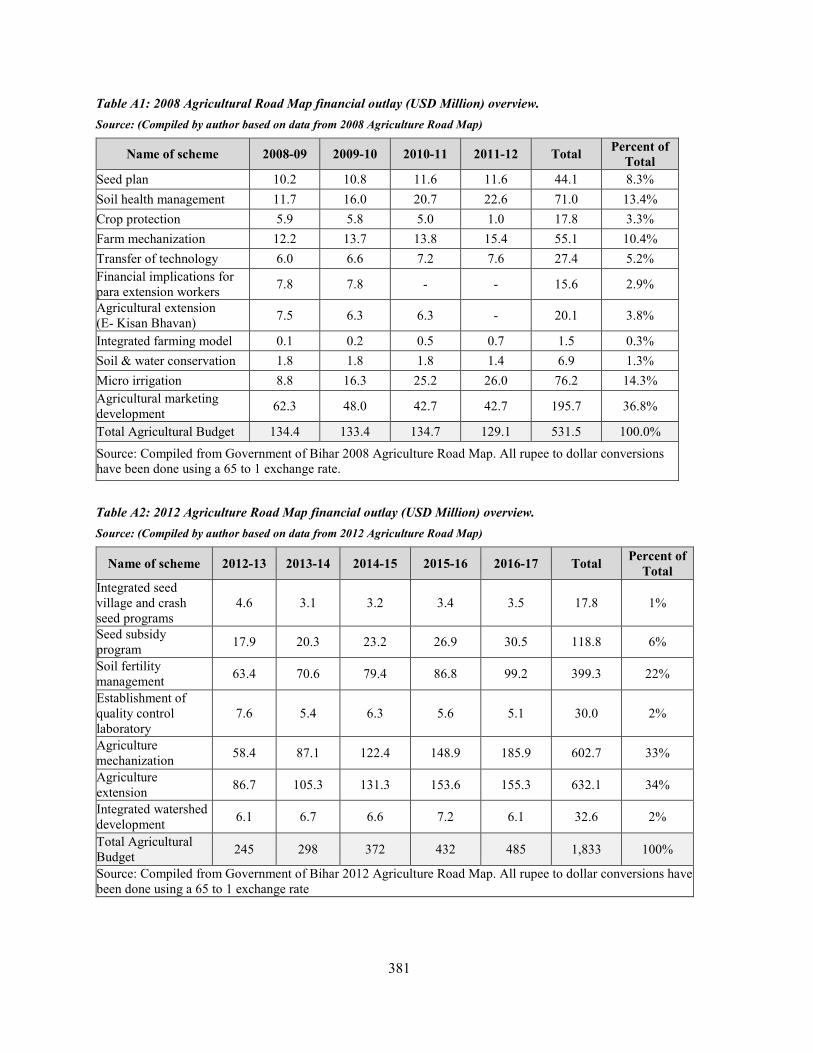
381
Table A1: 2008 Agricultural Road Map financial outlay (USD Million) overview. Source: (Compiled by author based on data from 2008 Agriculture Road Map)
Name of scheme 2008-09 2009-10 2010-11 2011-12 Total Percent of Total
Seed plan 10.2 10.8 11.6 11.6 44.1 8.3% Soil health management 11.7 16.0 20.7 22.6 71.0 13.4% Crop protection 5.9 5.8 5.0 1.0 17.8 3.3% Farm mechanization 12.2 13.7 13.8 15.4 55.1 10.4% Transfer of technology 6.0 6.6 7.2 7.6 27.4 5.2% Financial implications for para extension workers 7.8 7.8 - - 15.6 2.9%
Agricultural extension (E- Kisan Bhavan) 7.5 6.3 6.3 - 20.1 3.8%
Integrated farming model 0.1 0.2 0.5 0.7 1.5 0.3% Soil & water conservation 1.8 1.8 1.8 1.4 6.9 1.3% Micro irrigation 8.8 16.3 25.2 26.0 76.2 14.3% Agricultural marketing development 62.3 48.0 42.7 42.7 195.7 36.8%
Total Agricultural Budget 134.4 133.4 134.7 129.1 531.5 100.0%
Source: Compiled from Government of Bihar 2008 Agriculture Road Map. All rupee to dollar conversions have been done using a 65 to 1 exchange rate. Table A2: 2012 Agriculture Road Map financial outlay (USD Million) overview. Source: (Compiled by author based on data from 2012 Agriculture Road Map)
Name of scheme 2012-13 2013-14 2014-15 2015-16 2016-17 Total Percent of Total
Integrated seed village and crash seed programs
4.6 3.1 3.2 3.4 3.5 17.8 1%
Seed subsidy program 17.9 20.3 23.2 26.9 30.5 118.8 6%
Soil fertility management 63.4 70.6 79.4 86.8 99.2 399.3 22%
Establishment of quality control laboratory
7.6 5.4 6.3 5.6 5.1 30.0 2%
Agriculture mechanization 58.4 87.1 122.4 148.9 185.9 602.7 33%
Agriculture extension 86.7 105.3 131.3 153.6 155.3 632.1 34%
Integrated watershed development 6.1 6.7 6.6 7.2 6.1 32.6 2%
Total Agricultural Budget 245 298 372 432 485 1,833 100%
Source: Compiled from Government of Bihar 2012 Agriculture Road Map. All rupee to dollar conversions have been done using a 65 to 1 exchange rate

382
Table A3: 12-village household survey descriptive data. A total of 12 villages were surveyed evenly divided across three districts including Gaya and Jehanabad districts in south Bihar and Madhubani district in north Bihar.
Village (District)
UC OBC SC/ST
HH Surveyed
Average Land per
HH (Acres)
HH Surveyed
Average Land per
HH (Acres)
HH Surveyed
Average Land per
HH (Acres)
Village 1 (Gaya) 0 NA 63 1.0 98 0.3 Village 2 (Gaya) 3 1.2 9 0.8 26 0.3 Village 3 (Gaya) 0 NA 7 1.0 8 0.3 Village 4 (Gaya) 2 26.3 4 3.6 20 0.4 Village 5 (Jehanabad) 0 NA 16 1.4 6 0.2 Village 6 (Jehanabad) 0 NA 14 1.0 6 1.2 Village 7 (Jehanabad) 1 0.2 6 4.1 11 0.7 Village 8 (Jehanabad) 6 5.7 12 0.7 11 0.0 Village 9 (Madhubani) 0 NA 9 3.6 7 1.1 Village 10 (Madhubani) 2 2.8 9 1.4 4 0.4 Village 11 (Madhubani) 13 3.0 13 1.1 19 0.7 Village 12 (Madhubani) 0 NA 19 0.7 8 0.2 Total 27 6.5 181 1.7 224 0.48

383
Table A4: Factor by which poorest farmers are less likely to use a technology than wealthier farmers. This table is based on data from the 12-village survey
Category and Number of Farmers
Æ
Caste Category Upper Caste (OBC and UC) - 248;
Lower Caste (SC/ST) - 250
Landholding Size Marginal (M1 through M5) - 283;
Non-Marginal (Small, Semi-medium, Medium, Large) - 55
Technology
Factor by which a lower caste
farmer is less likely to use a
technology compared to an
upper caste farmer
Chi-Square Test P-value to Compare Difference
Between UC/OBC and SC/ST Farmers
Factor by which a marginal farmer
is less likely to use a technology than a non-marginal
farmer
Chi-Square Test P-value to Compare Difference
Between Marginal and Non-
Marginal Farmers
Rubber pipes 0.89 0.002* 0.93 0.137 Tractor 0.98 0.453 0.95 0.321 Improved seeds 0.93 0.134 0.92 0.225 Diesel engine 1.01 0.903 1.16 0.107 Introduced new crop 0.52 0.004* 0.93 0.861 SRI 0.34 0.000* 0.34 0.000* Started intercropping 0.58 0.115 0.67 0.337 Electrical motor 0.63 0.391 1.23 0.794 Vermi-compost 0.69 0.490 0.31 0.011* Drip (Count = 1) NA (Count = 1) NA Solar irrigation pumps (Count = 0) NA (Count = 0) NA * p < 0.05; I am interested in technologies whether or not p < 0.05. The chi-square test p-value gives important information about the data, but should not be interpreted in a way that makes some cases interesting and others not. For some technologies like improved seed varieties (ISV), p>0.05 because the factor difference between poor and wealthy farmers’ likelihood of use is low. In other words, ISVs are a technology that “raises all boats” and the p-value signifies this. The p-value is also greater than 0.05 for technologies with limited data because overall use across socio-economic groups in Bihar is low. This is true for intercropping for example. To select cases, I used a purposive selection methodology and included cases where the factors and p-values showed that there are large differences in likelihood of use between socioeconomic groups, as well as cases where there are small differences in likelihood of use between socioeconomic groups. I also selected cases of technologies where the technology is in widespread use, as well as technologies in limited use. I selected technologies in limited use to look at whether the technologies in limited use were the “missing” pro-poor technologies.
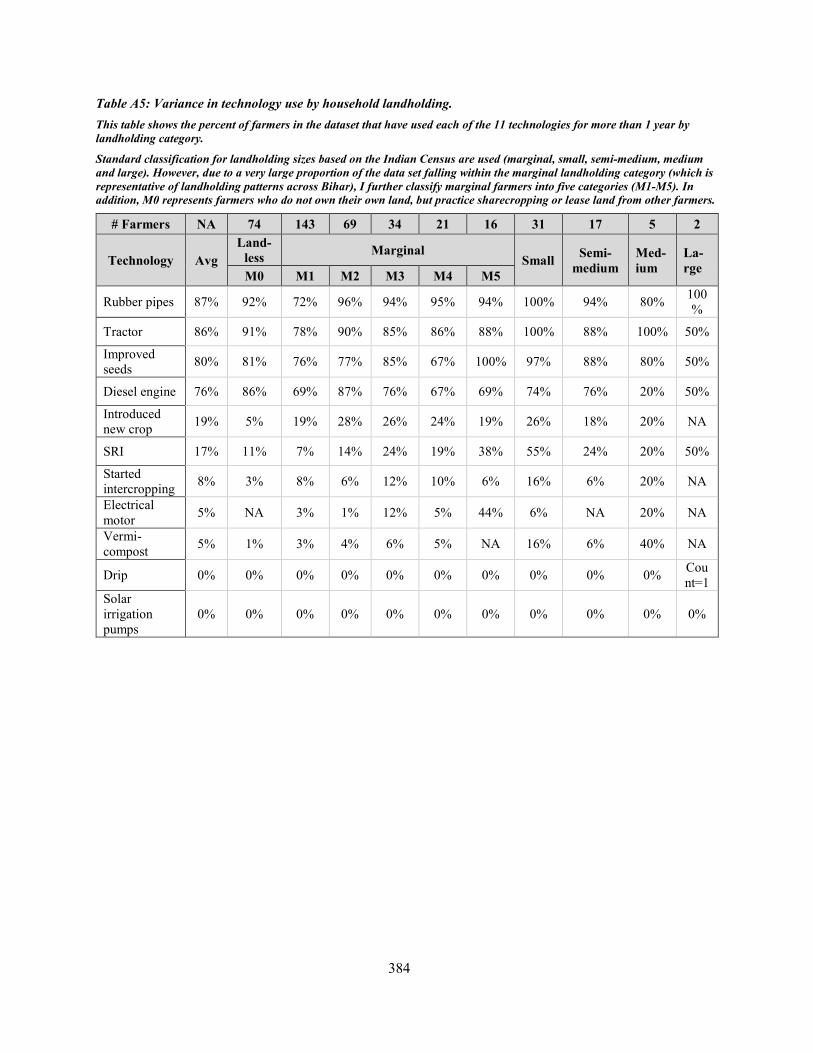
384
Table A5: Variance in technology use by household landholding. This table shows the percent of farmers in the dataset that have used each of the 11 technologies for more than 1 year by landholding category.
Standard classification for landholding sizes based on the Indian Census are used (marginal, small, semi-medium, medium and large). However, due to a very large proportion of the data set falling within the marginal landholding category (which is representative of landholding patterns across Bihar), I further classify marginal farmers into five categories (M1-M5). In addition, M0 represents farmers who do not own their own land, but practice sharecropping or lease land from other farmers.
# Farmers NA 74 143 69 34 21 16 31 17 5 2
Technology Avg Land-
less Marginal Small Semi-
medium Med-ium
La-rge M0 M1 M2 M3 M4 M5
Rubber pipes 87% 92% 72% 96% 94% 95% 94% 100% 94% 80% 100%
Tractor 86% 91% 78% 90% 85% 86% 88% 100% 88% 100% 50%
Improved seeds 80% 81% 76% 77% 85% 67% 100% 97% 88% 80% 50%
Diesel engine 76% 86% 69% 87% 76% 67% 69% 74% 76% 20% 50%
Introduced new crop 19% 5% 19% 28% 26% 24% 19% 26% 18% 20% NA
SRI 17% 11% 7% 14% 24% 19% 38% 55% 24% 20% 50%
Started intercropping 8% 3% 8% 6% 12% 10% 6% 16% 6% 20% NA
Electrical motor 5% NA 3% 1% 12% 5% 44% 6% NA 20% NA
Vermi-compost 5% 1% 3% 4% 6% 5% NA 16% 6% 40% NA
Drip 0% 0% 0% 0% 0% 0% 0% 0% 0% 0% Count=1
Solar irrigation pumps
0% 0% 0% 0% 0% 0% 0% 0% 0% 0% 0%

385
Table A6: Variance in technology use by household caste In Bihar and much of India, castes groups are generally divided into three categories: Upper Castes (UC), Other Backward Castes (OBC), and Scheduled Castes & Scheduled Tribes (SC/ST). The reason the sample size in this data table is larger than in table 2.9 is because it includes households that do not own their own land but use technology when sharecropping on others land. The farthest column to the right shows the gap between the weighted average of UC / OBC farmers and SC/ST farmers.
Technology
Percent all farmers using
technology (n=412)
Upper Castes (UC)
(n=28)
Other Backward
Castes (OBC) (n=207)
Scheduled Castes and
Tribes (SC/ST) (n=177)
SRI 17% 14% 24% 8% Rubber pipes 87% 93% 93% 80% Improved seeds 82% 86% 85% 77% Tractor 88% 93% 91% 84% Vermi-compost 5% 18% 4% 4% Intercropping 9% 4% 12% 6% Drip irrigation 0% 4% 0% 0% Solar irrigation pump 0% 0% 0% 0% Introduced new crop 20% 29% 25% 13% Electrical motor 5% 7% 6% 4% Diesel engine 76% 64% 80% 75%
Table A7: Data from 12-village survey showing the relationship between caste and well-ownership. In this table, open wells and borewells are treated equally.
Household Caste
Count of Farmers that do not own a
well
Count of Farmers that
own a well
Total Number of Farmers
Percentage of Farmers that
own a well
OBC 207 12 219 5% SC/ST 240 10 250 4% UC 22 7 29 24% Total (# farmers) or Average (percentage) 469 29 498 6%

386
Table A8: Farmers with land title by caste from 12 village survey (excludes landless HH)
Caste Number of Farmers
having Land Ownership Documents
Total Number of Farmers in
Sample
Percent Farmers Having Land
Ownership Documents OBC 166 179 93% SC/ST 109 131 83%
UC 27 28 96%
Grand Total 302 338 89%
Table A9: Farmers with land title by landholding (excluding landless HH)
Landholding Category
Number of Farmers having Land Ownership
Documents
Total Number of Farmers in Sample
Percent Farmers Having Land
Ownership Documents M1 123 143 86%
M2 61 69 88%
M3 31 34 91%
M4 19 21 90%
M5 16 16 100%
Small 29 31 94%
Semi-medium 16 17 94%
Medium 5 5 100%
Large 2 2 100%
Total (or Average) 302 338 89%
387
Appendix 3. Annotated bibliography of supporting literature for STCMs
STCM 1: Lack of financial assets • Banerjee et al. 2014. "Understanding biophysical and socioeconomic determinants of maize (Zea mays L.)
yield variability in eastern India." NJAS - Wageningen Journal of Life Sciences. o Banerjee et al. (2014) found that a lack of capital can lead to reduced yields of maize for farmers
in eastern India because they invest in fewer inputs and other technologies in the maize cultivation process. A farmer's income determines his/her ability to take risks and invest capital in farming practices. In addition, farmers who lack capital sometimes do off-farm work. The authors of the study believe that there is a negative relationship between off-farm work and crop yields.
• Dao et al. 2015. "Identifying farmers' preferences and constraints to maize production in two agro-
ecological zones in Burkina Faso." Agriculture & Food Security. o Dao et al. (2015) looked at constraints to maize production in Burkina Faso. The results showed
that the biggest constraint to increased maize production was poor cash flow, which made the high costs of seeds and fertilizer unaffordable. Small-scale farmers were unable to afford the inputs needed to prevent crop destruction from a root parasite called Striga hermonthica. As a result of financial constraints, the study showed that many poor farmers do not use enough pesticides or fertilizer, which hampers yields compared to wealthier farmers.
• Duflo et al. 2011. “Nudging Farmers to Use Fertilizer: Theory and Experimental Evidence from Kenya.”
The American Economic Review. o Duflo et al. (2011) found that it is not a lack of financial assets per se that hampered farmer
investments in fertilizer in Kenya. Rather it seems that the crux of the challenge is that farmers do not save money from the time of harvest for their last crop to invest in fertilizer during the next season when it is needed. This is the case, despite the fact that fertilizer is a relatively low cost technology investment which is shown to greatly increase yields. Through an experimental design, the authors found that by offering farmers a small time-limited discount at the time of Harvest (when they have cash on hand) encourages fertilizer adoption. This implies that lumpiness in farmers’ cash flow can impact technology investments even when overall farmers are not overly cash constrained to make a specific investment.
• Kishore, Avinash. 2004. “Understanding Agrarian Impasse in Bihar.” Political and Economic Weekly
o This study by Kishore (2004)looks specifically at the causes of low yields in Bihar. While he notes a wide variety of challenges including failure of land reform and expensive irrigation, his overall analysis is that intensive agriculture production is simply not remunerative enough in Bihar for farmers to pursue higher yields. Prices for everything from fertilizer to irrigation has risen, and farm gate food prices have declined. Because of these factors Kishore argues, farmers in Bihar tend to practice “cost covering agriculture” which maximizes neither yields nor profits, but is a safe strategy under such unfavorable factor to output price ratios. Notes: This argument is more nuanced than a simple lack of financial assets argument because it speaks to a different type of incentive structure. It’s not that farmers can’t afford a specific input at a specific time, rather, they see no point given the ratio of input costs to sale price to use the input. It would seem that this type of STCM 1 would impact both the poorest and wealthier farmers equally. However, there may also be ways for different socioeconomic groups to gain advantage in factor prices on the one hand, or to gain access to better sale prices on the other. Indeed, use of family labor (for the poorest) and exclusive access to government procurement programs through caste networks (for wealthier farmers) were two ways I observed farmers in Bihar influencing this ratio.

388
• Yengoh. 2012. "Determinants of yield differences in small-scale food crop farming systems in Cameroon." Agriculture & Food Security.
o Yengoh (2012) found that a lack of capital is a main factor in the inability of 61% of Cameroon farmers to meet their fertilizer needs. Household needs unrelated to farming often use up the resources that were originally allocated for fertilizer investments. The study concluded that the inability to afford fertilizer is the main reason smallholder farmers do use enough (or any) fertilizer. A lack of capital also makes it difficult for small-scale farmers to afford resources such as fuel and transportation.
STCM 2: Inappropriate technology design
• Chekene & Chancellor. 2015. “Factors affecting the adoption of improved rice varieties in Borno State,
Nigeria.” Journal of Agricultural Extension. o Chekene and Chancellor (2015) study the factors affecting Nigerian farmers’ adoption of
improved rice varieties. The authors used purposive and random sampling to gather data. Twelve farmer groups and 120 respondents from the southern part of Borno State, Nigeria were part of the study. The study found that two of the reasons farmers prefer to use older improved varieties or local varieties is that the new improved varieties mature too quickly. Although the early maturing varieties have high yield potential, they mature before the rainy season ends. This makes it difficult to dry the crop when harvested, which in turn makes threshing more challenging. In addition, harvesting during the rainy season increases susceptibility to mold and fungi while in storage. Many farmers continue to use an improved variety from the 1990’s because it matures later than the newer improved versions.
• Timu et al. 2014. “The role of varietal attributes on adoption of improved seed varieties: The case of sorghum in Kenya.” Agriculture and Food Security.
o Timu et al. (2014) evaluate the factors that determine whether farmers in Kenya adopt improved varieties of sorghum or continue to grow local varieties. Data was collected through random sampling of 140 farmers. The study found that of the five improved varieties available, only two were widely adopted. The improved varieties matured earlier, produced higher yields, and yielded premium market prices. However, the local varieties had better drought tolerance, Striga resistance, brewing qualities, and taste. Overall, the improved varieties were superior for selling but the local varieties had more desirable consumption attributes and better drought tolerance. Many farmers preferred the local variety partly because of its superior attributes in terms of production and consumption. Notably, farmers who did adopt one improved variety were likely to adopt a second.
STCM 3: Missing market linkages
• Jagwe, Machethe, & Ouma. 2010. “Transaction costs and smallholder farmers’ participation in banana markets in the Great Lakes Region of Burundi, Rwanda, and the Democratic Republic of Congo.” (Doctoral dissertation).
o Jagwe et al. (2010) use the Heckman procedure to analyze how transaction costs influence smallholder farmers’ participation in banana markets in the Great Lakes region of central Africa. The data was collected through purposive sampling and by interviewing 2,666 households of smallholder farmers in Rwanda, Burundi, and the DRC (North Kivu, South Kivu, and Bas-Congo). The secondary data was obtained from the Consortium for Improving Agriculture-based Livelihoods in Central Africa (CIALCA). One of the main factors in smallholder farmers’ decision to participate in markets is fixed transaction costs. Fixed transaction costs are mainly dependent on farmers’ proximity to markets, access to information, and geographical location.
389
Access to market information is crucial for market participation. Farmers who have no access to market information or are limited to information passed along by their neighbors are unlikely to participate in banana markets. Farmers in Gitega, Kirundo, and North Kivu Provinces were very unlikely to participate in markets due to poor infrastructure, relatively low economic activity, and political conflicts.
• Jayne, Mather, and Mghenyi. 2010. “Principal challenges confronting smallholder agriculture in Sub-Saharan Africa.” World Development.
o This study (Jayne, Mather and Mghenyi, 2010) used survey data on small farms in Ethiopia, Kenya, Malawi, Mozambique, and Zambia. The data was collected mainly by national statistical services. Michigan State University and local partners also contributed data. One of the findings of the study was that low crop productivity and inequality in productive assets has to be taken into account when trying to connect African farmers with markets. As a result of these factors, farmers do not have much surplus to sell. This inhibits the development of markets, which creates a negative cycle since a lack of markets means that smallholders are limited in their ability to sustainably use productive farm technologies. This then further reinforces farmers’ inability to produce enough crops to have a surplus to sell. Inelastic product demand at local markets is also a problem. When local markets are unable to absorb seasons of so called bumper crops or high output, prices drop significantly. This then means that it is risky for farmers to increase their crop production, since they may not be able to sell their surplus for enough to cover the money they put into increasing their crop production. The authors believe that these price drops due to overproduction for local markets are major causes in the subsequent dis-adoption of new technology by farmers.
• Markelova et al. 2009. "Collective action for smallholder market access." Food policy.
o This study (Markelova et al., 2009) argues that smallholders need access to local, regional, and even international markets in order to raise their incomes. There are currently multiple factors hindering poor farmers’ ability to participate in new marketing opportunities, including lack of information on prices and technology, high transaction costs, and credit constraints. Of these factors, high transaction costs are the largest obstacle. In addition, new procurement systems favor large farmers because they can provide larger supply volumes. Marketing perishables is especially difficult for smallholders because of the sophisticated and costly storage transportation facilities required. Similarly, cash crops require processing equipment that most smallholders cannot afford. Therefore, they are forced to sell to larger farmers or agribusinesses who can afford the equipment. Longer marketing chains present greater disadvantages for smallholders. The lack of rural infrastructure, extension services, credit markets, and accessible relevant information need to be addressed in order to lower the costs for farmers to participate in markets.
• Pradhan et al. 2015. “Closing yield gaps: How sustainable can we be?” PloS one.
o This article (Pradhan et al., 2015) looked at causes for yield gaps around the world using data from the Global Agro-ecological Zones. In addition to biophysical factors they analyzed socioeconomic factors. They found that travel time to the nearest market is a significant factor in productivity. This is because farmers who do not have easy access to markets have limited access to agricultural inputs such as fertilizer and high quality seeds. It also impedes the farmers’ ability to sell their produce. In addition, these farmers often have little access to current farming information from extension services. The study found that a long travel time (over six hours) to the nearest market was a common problem for farmers in Africa, South-East Asia, and Central Asia.

390
STCM 4: Lack of access to credit
• Olagunju & Ajiboye. 2010. "Agricultural lending decision: A tobit regression analysis." African Journal of Food Agriculture Nutrition and Development.
o Olagunju & Ajiboye (2010) argue that lack of access to credit means that small farmers cannot finance the purchase of fertilizer, better seeds, additional labor, etc. Therefore, investment in agriculture technology is hindered by an inadequate supply of institutional credit. This study looked at the factors that two Nigerian banks used when deciding which farmers to give loans to. Farmers with very small farms were very unlikely to be approved for a loan from either bank. This is likely because a large farm can be used as collateral. A large household size made farmers more likely to be approved for loans because they had more laborers available to cultivate large areas of land. A higher net farm income also made loan approval more likely because a wealthier farmer would be better equipped to absorb the cost of failure. The major significant variable for both banks was a good credit record—an asset many poor farmers lack. Another important conclusion from this study was that a delay in loan disbursements reduces farmers' abilities to repay the loans. Loans that arrive after the time period for which they were most needed often get spent on less productive or completely unproductive activities.
• Ololade & Olagunju. 2013. "Determinants of access to credit among rural farmers in Oyo State, Nigeria." Global Journal of Science Frontier Research Agriculture and Veterinary Services.
o Ololade & Olagunju (2013) found that farmers in Oyo State, Nigeria listed lack of collateral security, lack of guarantor, and high interest rates as the biggest obstacles to acquiring credit. Mode of repayment was also said to be a problem by 28.6% of farmers, and 23.8% said that a lack of information about available credit was a challenge. Unmarried farmers and female farmers were significantly less likely to have access to credit.
• Phillip et al. 2009. “Constraints to increasing agricultural productivity in Nigeria: A review. (No. 6).” International Food Policy Research Institute.
o Phillip et al. (2009) findings are based on preliminary material and research results from the IFPRI and its partners in Nigeria. The authors state that limited access to credit is a major issue in Nigeria’s farming systems. One of the main reasons for this is that banks with large loan funds are difficult for farmers to access. In addition, smallholder farmers often do not qualify for loans due to issues of collateral. High interest rates are another significant barrier for smallholder farmers. Agricultural loans are often not compatible with annual cropping because they are short term and have fixed repayment periods. Another problem is that the loan release date does not always coordinate with growing cycles.
• Kochar. 1997. “Does Lack of Access to Formal Credit Constrain Agricultural Production? Evidence from
the Land Tenancy Market in Rural India.” Amer. J. Agr. Econ. o In contrast to the three papers above which all use data from Nigeria, Kochar (1997) finds that in
India, lack of access to formal credit has little impact on farmer investment decisions. Rather, farmers rely on informal credit from family and friends, rather than turning to formal credit markets.
STCM 5: Missing Infrastructure
• Gajigo & Lukoma. 2011. “Infrastructure and agricultural productivity in Africa.” African Development Bank Marketing Brief.
o Gajigo and Lukoma (2011) in a briefing paper prepared for the African Development Bank argue that missing infrastructure plays a strong role in depressing yields and reducing productivity in sub-Saharan Africa. The paper argues that poor roads, inadequate irrigation infrastructure and inadequate food storage facilities are the main infrastructural challenges hampering agriculture on
391
the continent. Poor roads and inefficient transport links increase the cost of inputs and decreases farmers’ access to markets. Poor roads also make it more difficult for smallholder farmers to access credit. Long distances for professionals to reach farmers’ fields increases the administrative costs of lending, monitoring, and loan recovery, which results in higher intermediation costs. A lack of irrigation infrastructure also reduces productivity in Africa. Farmers who are entirely dependent on rainfall experience significant fluctuations in output, since rainfall is very unpredictable. This increases risk for farmers. Inadequate storage facilities result in produce losses due to pests and weather-related decay. This is an especially significant problem in Sub-Saharan countries, where 30-50% of perishable agro-commodities and 15-25% of grains are lost post-harvest. The challenge of storing perishable commodities leads to reductions in the food supply, which in turn increases prices. This creates high temporal price variations, in addition to the spatial price variations caused by poor roads. A lack of proper storage facilities also hinders the development of high-value agri-business industries that specialize in horticulture or other perishable products. In contrast, good infrastructure increases output per capita and output per unit of land.
• O.E. & D.G. 2009. “Effect of road infrastructure on agricultural output and income of rural households in Delta State, Nigeria.” Agricultura Tropica et Subtropica.
o O.E. and D.G.(2009) gathered data through multi-stage random sampling in three agricultural zones of Delta North, Delta Central, and Delta South in Nigeria. The study found that poor roads negatively impact output. Road quality had the greatest effect on output compared to the other independent variables (land area cultivated, value of other assets, distance to market, education, and household size). The study found that a 10% increase in road quality will result in a 12% increase in output. Well-paved roads would guarantee that farmers could transport produce to markets year-round, providing greater incentive to invest in increased production through technological inputs such as improved seeds and fertilizer.
• Narayanamoorthy & Hanjra. 2006. "Rural infrastructure and agricultural output linkages: A study of 256 Indian districts." Indian Journal of Agricultural Economics.
o Narayanamoorthy and Hanjra (2006) used data from the Indian Agricultural Statistics journal published by India’s Ministry of Agriculture among other sources to study the impact of rural infrastructure on agriculture output. Their results show that a lack of rural infrastructure can reduce yields. The Indian districts with lower agricultural outputs were the ones with less infrastructure including roads, irrigation, schools, electricity, etc. Irrigations, roads, and literacy were the three most significant factors affecting agricultural output.
• Tunde & Adeniyi. 2012. “Impact of road transport on agricultural development: A Nigerian example.”
Ethiopian Journal of Environmental Studies and Management. o Tunde and Adeniyi (2012) used questionnaires and focus group discussions to gather data on the
impact of roads on agriculture development in Nigeria. The study found that poor road conditions have a large impact on farmers’ production because they increase the cost of transporting produce from farms to markets. The results of the study showed that farmers spend a significant portion of their income on transportation. Transport costs depend on the type of produce being transported, the efficiency of the transport, and the distance being traveled. The high cost of transport means that farmers need to increase their selling price in order to recoup that money. However, if their prices are higher than other farmers the customers will not buy their produce. This can result in farmers having to sell at a loss. Transportation costs therefore limit production levels. When asked about transportation problems, farmers listed bad roads, high cost of transportation, irregular and insufficient vehicles, insufficient means of transportation, and long distances from their houses to their farms and from farms to markets. Interviews with transporters revealed that they were reluctant to provide transport for farms that were only accessible through bad roads because it was too rough on their vehicles.

392
STCM 6. Ineffective extension services
• Baloch & Thapa. 2016. “The effect of agricultural extension services: Date farmers’ case in Balochistan, Pakistan.” Journal of the Saudi Society of Agricultural Sciences.
o Baloch & Thapa (2016) study the impact extension services have had on farmers in Pakistan. The data was gathered through a questionnaire survey of 200 date palm farming households, group discussions, and surveys of key informants in Pakistan. The study found that farmers who had access to extension services had higher yields than farmers who did not have access. Small-scale farmers who used extension services had higher yields than medium- and large-scale farmers. Farmers who used extension-recommended land preparation methods experienced a positive change in date palm yields by 17.73 kg. However, in general the extension officials gave advice that the farmers could not apply. For example, the farmers could not follow the recommendation to irrigate their farms daily, since they didn’t even have enough water to irrigate twice a week. They also could not afford the specific pesticides the extension officials suggested they use. Nor did they have the equipment needed to properly use the pesticides. Although the extension services did have a positive impact on yields, the inadequate number of extension agents and their lack of knowledge about the specific challenges facing the resource poor farmers they worked with left most farmers dissatisfied with the extension services.
• Davis et al. 2010. “Impact of farmer field schools on agricultural productivity and poverty in East Africa.” World Development.
o Davis et al. (2012) used a longitudinal impact evaluation to assess the efficacy of farmer field schools (FFS) in East Africa. They collected data by analyzing documents, interviewing informants, and analyzing primary and secondary survey data. The study found that FFSs positively impact productivity. Kenyan farmers who participated in FFSs saw an 80% increase in the value of crop productivity per acre. In Tanzania, the increase was 23%. FFSs did not significantly impact crop productivity in Uganda. This may be because a National Agricultural Advisory Services program was already present in Uganda. Participation in FFSs especially benefited the productivity of female farmers. This is important to note, since female farmers contribute the most in agricultural production in Sub-Saharan Africa. It is important to note for the purposes of this study that FFSs actually had a negative, although nonsignificant, impact on the productivity of farmers with small land areas (the poorest farmers as measured by landholding). The authors hypothesized that this was because the smallholder farmers were resource-poor and could not follow the FFS recommendations about technology investments.
• Zhang et al. 2016. “Closing yield gaps in China by empowering smallholder farmers.” Nature. o Zhang et al. (2016) showed how effective extension services can increase yields. The study looked
at the impact the Network of Science and Technology Backyards (STB) program had in China. The STB program has agricultural scientists live in farming villages in order to help farmers learn more advanced and efficient farming practices. Data was gathered from the Quzhou Experimental Station, farmer surveys, and experiments carried out by leading farmers who had been under the instruction of STB staff. By living near and working closely with farmers, the STB staff were able to do extended trainings, farming schools, and field demonstrations. They were able to effectively pass information on to the farmers because they formed relationships with them and took farmers’ feedback into account. On-site advice and real-time reminders were also beneficial. Farmers from STB villages had better agronomic knowledge, higher adoptions of extension recommendations, and higher yields, nutrient and water-use efficiencies, and economic returns. These effects even spread to neighboring villages since they had better access to extension events and information than distant villages. The STB staff also started a farmer co-operative system of combining the land of 30-40 farmers in order to use management practices that are more effective on large areas of land. The farmers benefit from these practices and then harvest their lands individually. The importance of this paper to the issues explored in this dissertation is that the study demonstrates

393
what quality extension services can do when effectively administered. Where quality extension services are lacking, farmers lose. This is especially problematic from the perspective of this study when access to extension services is less available for poorer farmers.
STCM 7. Lack of individual farmer capacity
• Alene & Manyong. 2007. "The effects of education on agricultural productivity under traditional and improved technology in northern Nigeria: An endogenous switching regression analysis." Empirical Economics.
o Alene and Manyong (2007) found that a farmer's education level has a more significant effect on agricultural systems using modern technologies than in traditional agricultural systems. Both education and extension services enhance productivity to a greater extent when improved technology is being used rather than traditional technology. For example, the effects of farmer education on cowpea production were greater among farmers who have adopted improved cowpea varieties than on those who were using traditional varieties. Cowpea production increased by 25.6% as a result of four years of education and the use of improved technology, but showed no increase as a result of the same amount of education when traditional technology was being used. The main reason for this is that new technology creates instability and changing circumstances which require farmers to develop new skills and knowledge. Better-educated farmers are better equipped to meet this challenge.
• Croppenstedt & Muller. 2000. “The impact of farmer’s health and nutritional status on their productivity
and efficiency.” Economic Development and Cultural Change. o Croppenstedt and Muller (2000) demonstrate a link between the health and nutritional status of
farmers and their agricultural productivity amongst Ethiopian peasant farmers. This finding underscores the importance of STCM 7 because it shows how factors leading to poor health in rural farming households, such as food insecurity and poor nutrition, can reduce agricultural productivity and rural wages when peasant farmers are employed by larger landowners.
• Mani et al. 2013. “Poverty impedes cognitive function”. Science.
o Mani et al. (2013) demonstrate how the very stress of being poor irrespective of its impact on actual consumption, reduces the cognitive capacity of farmers thereby decreasing the individual capacity of the poorest farmers more than other farmers. This finding has implications for the design of agriculture policies: For example, complex extension interventions are best timed toward the end of harvest seasons and long and complex forms for programs targeting the poor should be minimized (e.g. a subsidy application). This causal mechanism leading to low yields affects poorer farmers more than other farmers because they are most likely to suffer from the cognitive stress due to poverty.
• Narayanamoorthy & Hanjra. 2006. "Rural infrastructure and agricultural output linkages: A study of 256
Indian districts." Indian Journal of Agricultural Economics. o Narayanamoorthy & Hanjra (2006) used data from the Indian Agricultural Statistics journal
published by India’s Ministry of Agriculture, a study by Bhalla and Singh (2001), and the Census of India. The conclusions about how infrastructure affects yields were based on cross-sectional data for 256 Indian districts in 13 states during the time periods of 1970-71, 1980-80, and 1990-91. The authors used both descriptive and regression analyses to study the relationship between rural infrastructure development and agricultural productivity. The results of these analyses were that a lack of rural infrastructure can reduce yields. The Indian districts with lower agricultural outputs were the ones with less infrastructure including roads, irrigation, schools, electricity, etc. Irrigations, roads, and literacy were the three most significant factors affecting agricultural output. The study found that the impact of irrigation on agricultural output has been increasing since the 1970’s. It’s interesting that education was included as a variable in a study on infrastructure.

394
• Yengoh. 2012. "Determinants of yield differences in small-scale food crop farming systems in Cameroon." Agriculture & Food Security.
o Yengoh (2012) found minimal effect on yields comparing a post-secondary school level education and an elementary-level education. However, there is a significant effect on yields when comparing A-level and no education. There is also a considerable difference between no education and an elementary-level education. The study hypothesized that the causal pathway undergirding this finding is that education enables farmers to better understand and use information on the potential pros and cons of new technology in their decision-making. In addition, farmers who have received some education are also usually more willing to test and adopt new technology.
STCM 8. Weak capacity for collective action
• Jagwe, Machethe, & Ouma. 2010. “Transaction costs and smallholder farmers’ participation in banana markets in the Great Lakes Region of Burundi, Rwanda, and the Democratic Republic of Congo.” (Doctoral dissertation).
o Jagwe, Machethe, and Ouma (2010) used the Heckman procedure to analyze how transaction costs influence smallholder farmers’ participation in banana markets in the Great Lakes region of central Africa. The data was collected through purposive sampling and by interviewing 2,666 households of smallholder farmers in Rwanda, Burundi, and the DRC. The secondary data was obtained from the Consortium for Improving Agriculture-based Livelihoods in Central Africa (CIALCA). The study found that collective action is beneficial in improving market access for smallholder farmers. The study results showed that when someone in the farm household was a member of a farmer group they were more likely to sell their bananas at markets. The researchers confirmed that farmer groups are a good way for farmers to exchange information. Farmer groups also reduce the transaction costs of market participation by enabling the farmers to link to buyers at a reduced cost.
• Markelova et al. 2009. “Collective action for smallholder market access”. Food Policy.
o Markelova et al. (2009) in the introduction to a special feature in the journal of Food Policy begin with the insight that research in other sectors has shown that voluntary collective action is advantageous for technology adoption. The special feature looks at the importance of collective action in agriculture systems. The special feature argues that cooperation is crucial for poor smallholders to overcome challenges created by unfavorable policies and markets and to create sustainable livelihoods. Collective action can enable small holders to solve transportation and storage issues, acquire technologies and certificates to comply with required quality standards, and reach the necessary scale to supply the desired quantity of their products. This will then allow the smallholders to reach larger domestic, urban, regional, and international markets that they are unable to reach individually.
• Otieno. 2012. “Impact of farmer groups on crop enterprise productivity and economic welfare of
smallholder farmers in South Kivu territories, Democratic Republic of Congo.” (Doctoral dissertation). o Otieno (2012) collected data for this study through structured interviews and multi-stage sampling
techniques. The study found that farmers who were members of a group had higher values of production and economic gains. This may have been the result of an increase in the use of fertilizers, organic manure, and new varieties and technologies among group member farmers. The study also found that group members were able to borrow more money than non-group members. This may be because financial institutions prefer group lending over lending to individuals. Group members may also have been better informed about the availability of funds thanks to group meetings and extension programs. In addition, group members adopted more technology than individual farmers. This may be because they had gained knowledge about technologies through the group meetings. The non-group members used more planting fertilizer and top-dressing fertilizer than group member farmers. The group members used more organic fertilizer, possibly

395
because it was all they could afford (the groups were mostly made up of poor farmers). The study also found that interventions in the area had encouraged the group members to use organic fertilizer. Group members adopted more new varieties and technologies. They also had increasing numbers of extension contacts, whereas non-group members had decreasing numbers of both extension contacts and lower rates of adoptions of technology.
• Thorp et al. 2005. “When and How Far is Group Formation a Route Out of Chronic Poverty?” World
Development. o Thorp et al (2005) look at the conditions under which group formation is a route out of chronic
poverty. They find that when the poor form groups, they often exclude even poorer groups. This is especially true for groups formed around market functions. They also find that the specific political function of groups is important in determining success in helping to overcome marginalization and social exclusion experienced by the poorest.
STCM 9: Structure of land tenure regimes
• Banerjee et al. 2014. "Understanding biophysical and socioeconomic determinants of maize (Zea mays L.) yield variability in eastern India." NJAS - Wageningen Journal of Life Sciences.
o Banerjee et al. (2014) found that poor land tenure systems negatively affect the yields of tribal farmers in eastern India. Tenant farmers tend to exploit the land and use short-term farming practices that eventually degrade the land resources. These unsustainable practices then result in lower yields. In addition, land owners often lease less-fertile land to tenant farmers and keep the better-quality land for themselves. Land owners in this study had higher mean yields than tenant farmers.
• Donkor & Owusu. 2014. “Effects of land tenure systems on resource-use productivity and
efficiency in Ghana's rice industry.” African Journal of Agricultural and Resource Economics. o Donkor & Owusu (2014) looked at the effects of land tenure systems on resource-use productivity
and efficiency in the Upper East region of Ghana. The authors sourced data from the country’s Agricultural Production survey (GAPS) and conducted a stochastic frontier model. The GAPS data was obtained by surveying 470 rice farmers in Ghana. The study examined farmers' resource-use productivity and efficiency for three land tenure systems: individual land ownership, fixed-rent tenancy and sharecropper tenure. The results showed that land ownership positively influenced technical efficiency because land owners were in a position to undertake both short-term and long-term measures to promote their farm outputs. Tenant farmers generally only made short-term improvements to the land since they likely wouldn’t benefit from long-term investments. Tenant farmers who rent land are more likely to use inputs than sharecroppers. Sharecroppers had the lowest technical efficiency. The authors concluded that owners are more efficient than either fixed-rent tenant farmers or sharecroppers.
• Henao & Baanante. 2006. "Agricultural production and soil mining in Africa: Implications for resource
conservation and policy development." IFDC. o Henao and Baanante (2006)began the study by estimating soil nutrient balances. They did this by
accounting for the effects of inputs, nitrogen fixation, and sedimentation, and then subtracting the effects of leaching, erosion, crop uptake, and volatilization. They used geographic information systems to complete spatial analyses that analyzed crop production and predicted leaching, erosion, and nutrient mining. They evaluated soil nutrient losses, current yields, and potential future yields with simulated modeling and transfer functions. The study found that poor land tenure systems can lead to nutrient mining. Tenant farmers in sub-Saharan Africa view soil mining as the least expensive source of plant nutrients. Because tenant farmers will probably not farm the land for more than a few years, they do not care about the long-term health of the soil or long term
396
impacts on yields. This is especially true when tenant farmers practice shifting cultivation. In contrast, famers who have well-established property rights or land tenure arrangements internalize the eventual costs of nutrient mining.
• Phillip et al. 2009. “Constraints to increasing agricultural productivity in Nigeria: A review. (No. 6).” International Food Policy Research Institute (IFPRI).
o Phillip et al. (2009) findings are based on preliminary material and research results from the International Food Policy Research Institute and its partners in Nigeria. The authors state that the communal system of land ownership in Nigeria is a problem for agricultural productivity. Communal land ownership provides little incentive for individual farmers to invest in improving the land or make long-term investments in land management. The farmers do not have the ability to use other farmlands, so they continue to use the communal lands. These lands become depleted and suffer from soil degradation. The lack of clear titles to the land and the inability to sell it make it impossible to use the land as collateral. This then hinders farmers’ access to credit and impedes the development of a rural credit market.
• Place & Otsuka. 2002. "Land tenure systems and their impacts on agricultural investments and productivity in Uganda.” Journal of Development Studies.
o Place and Otsuka (2002) study how land rights affect production in two sites in Uganda. The authors interviewed 47-50 households in each area. The study included farmers who owned land and tenant farmers. Because of the ever-changing politics in Uganda, even those who "owned" land felt uncertain about their future rights to the land. The study found that both owners and tenant farmers used short-term investment strategies for prolonged periods of time and had few long-term improvement plans.
STCM 10: Misaligned incentives
• McCullough & Matson. 2012. “Linking knowledge with action for sustainable development: A case study of change and effectiveness.” In Seeds of Sustainability.
o McCullough and Matson (2012) write in a long-term mixed methods study of the Yaqui Valley in Sonora, Mexico that farmer’s in the region failed to adopt best management practices for fertilizer application, which cost farmers money and also led to environmental pollution (McCullough and Matson, 2012). The research team found that the reasons farmers continued to over-apply fertilizer were complex, but one of the reasons was due to misaligned incentives between farmers, scientists and local credit unions. In the Yaqui Valley, large farmers received inputs such as seeds and fertilizer, but also crop insurance, post-harvest storage, marketing and technical assistance through their local credit unions. After the research team identified and published best management practices to reduce fertilizer use, the credit unions discouraged farmers from following the new guidelines. Rather the credit unions encouraged farmers to continue to apply the time-tested quantities of fertilizer to mitigate risks to farmers (who they ensured) but also likely because the credit unions profited from the sale of fertilizer. Interestingly, small farmers in the region who were ineligible to be members of local credit unions were more likely to adopt the new best management practices. While this example, does not demonstrate misaligned incentives leading to reduced yields, they likely led to reduced farmer profits over the long run.
• Mukherji, Aditi. 2006. “Political ecology of groundwater: the contrasting caseof water-abundant West Bengal and water-scarce Gujarat, India.” Hydrogeology Journal. o In this study, Mukherji (2006) looks at groundwater and electricity policy in two states in India:
West Bengal and Gujarat. The author shows that groundwater-related policies in India have very little to do with scarcity, depletion or quality of groundwater, and more to do with rural politics manifested in the strengths and interests of the farmers’ lobbies in the two states. In West Bengal, where the farmers’ lobby is in general weak compared to the political influence of the urban

397
educated elite and even when the farmer’s lobby is active, its interests are split because it represents the interests of the poorest farmers, larger landholders and rural non-farming households (three groups that have distinctly different needs). Because of this, the farm lobby has failed to demand electricity infrastructure for the agriculture sector to decrease the costs of pumping groundwater for irrigation (when electricity is unavailable farmers are forced to irrigate with more expensive diesel or not at all). Moreover, out of unfounded concerns about groundwater depletion the state government has limited the availability of electric pump connections. This has slowed the growth of groundwater markets and led to negative impacts on water buyers who are mostly small farmers.
• Phillip et al. 2009. “Constraints to increasing agricultural productivity in Nigeria: A review. (No. 6).”
International Food Policy Research Institute (IFPRI). o Phillip et al. (2009) findings are based on preliminary material and research results from the
International Food Policy Research Institute and its partners in Nigeria. Presidential initiatives were introduced in Nigeria to support the production of cassava, rice, vegetable oil, tree crops, livestock, and aquaculture products. However, these initiatives have not worked as well as hoped. The Presidential Initiative on Cassava (PIOC), and the Presidential Initiative on Rice (PIOR), have been hindered by inadequate and delayed release of funds, a lack of funds to buy the necessary processing equipment, a lack of implementation committees as state and local levels. The PIOC has especially suffered from external trade constraints as a result of the absence of storage facilities, railway systems, and ports equipped to handle agricultural exports. The presidential initiative for vegetable oil has been hindered by old and inefficient processing equipment, high costs of inputs and new machinery, inability to compete with cheaper imported vegetable oil products, inadequate funding, and delays in certifications for projects.
• Songco. 2002. “Do rural infrastructure investments benefit the poor? Evaluating linkages: A global view, a
focus on Vietnam.” World Bank Publications. o Songco (2002) studies the impact of infrastructure investment on the poor through a wide review
of published reports and literature. Of particular interest, the author notes that a 1994 World Bank report found that the use of electric pumps in India led to increased agricultural productivity through greater land use, decreased reliance on rainfall, and a move to higher-yield crops. Rural electrification had similar effects in Bangladesh. However, Songco’s review found that in several countries, rural electrification (RE) had little or no impact on agricultural productivity. In these countries, constraints to RE included prohibitively expensive connection costs, unclear land-use rights, extremely low income levels, limited access to credit, and/or existing agricultural patterns or low potential for irrigation improvements. This article supports SCTM 10 misaligned incentives rather than STCM 2 inappropriate technology design because it shows that the challenge is often not the physical dimensions of the technology itself but rather the institutional dimensions of the technology.
STCM 11. Corruption
• Anik, Breustedt, and Bauer. 2011. “The impact of corruption on farmers' efficiency in rice production: A natural experiment from Bangladesh. “EAAE 2011 Congress Change and Uncertainty. Zurich, Switzerland: EAAE.
o Anik et al. (2011) looked at the effects of corruption on Bangladesh rice production during two growing seasons. During the Aman season there is sufficient rainfall to compensate for a lack of irrigation. During the Boro season, the decreased rainfall and increased use of HYV seeds require irrigation and fertilizer for maximum yields. Farmers have to bribe officials in order to receive subsidies that are supposed to cover a portion of their electricity bill that was used for irrigation. In the Aman season, farmers often have to pay a bribe to get the slip needed to collect fertilizer from the retailers. The authors used data from a 2008 Aman season in which the fertilizer market was
398
quantity-restricted, leading to increased corruption. The subsequent Boro season had less corruption because the quantity-constraints had been resolved, but the farmers had more capital-constraints since this season requires more fertilizer and irrigation. The results of the study were that a 1% higher cost of corruption actually increases technical efficiency by 1.5% during the Aman season since farmers could afford to pay the bribes. However, it decreased technical efficiency during the Boro season by 0.5% because farmers were capital-constrained and could not afford the bribes. Bribe payers are "more efficient" because they received adequate fertilizer and/or irrigation to achieve improved yields. The likely implications for from this study for the poorest farmers is that poor farmers who are less likely to be able to afford the bribe will suffer more than wealthier farmers from this underlying causal mechanism.
• Bromley & Foltz. (2011). “Sustainability under siege: Transport costs and corruption on West Africa’s trade corridors.” Natural Resources Forum.
o Bromley and Foltz (2011) use data from a review of transport costs in Africa done by other researchers, and data from the Transport Study Project done by the West African Trade Hub (WATH). The researchers used a spatial model of institutional incoherence to connect corruption with farmers’ enterprise choices. The study used an Integrated Road Transport Group (IRTG) report to find that corruption costs make up 15-20% of the total cost of transportation for shea from Mali and cashews from Ghana when the products are transported in legal trucks. The percentage rises to almost 30% when illegal trucks are included. The researchers believe that a 10% reduction in total transportation costs would result in price increases of 12-13% for onions, 2% for cashews, and 7% for shea. Based on their study, the researchers conclude that corruption is a factor in undermining the net profitability of the crops. This leads to farmers postponing investments or not making them at all. As a result, yields fall and net returns decrease. Farmers begin a cycle of falling productivity, reduced tradable products, and potentially higher shipping costs.
• Fulginiti et al. 2004. Institutions and agricultural productivity in Sub-Saharan Africa. Agricultural
Economics. o Fulginiti et al. (2004) study agricultural productivity in 41 sub-Saharan African countries from
1960 to 1999 focusing on the rate of productivity change in agriculture systems across countries. They measure a significant reduction in productivity during political conflicts and wars, and significant increase in productivity among countries with higher levels of political rights and civil liberties.
• Mandemaker et al. 2011. “The Role of Governance in Agricultural Expansion and Intensification: A Global
Study of Arable Agriculture.” Ecology and Society. o Mandemaker et al. (2011) studied the empirical relationships between agricultural production
dynamics and six quantitative World Bank governance indicators for 173 countries between 1975 and 2007. They found that countries with higher quality governance are more likely to achieve yield gains by intensification of yields on existing land. In contrast, countries with poor governance are more likely to achieve agriculture production gains via extensification of agriculture onto new lands. Note: The World Bank indicators included both values for corruption as well as rule of law and political stability, two issues which improved after the election of Nitish Kumar in Bihar.
• Ministry of Agriculture. 2006. “Agriculture governance in Bangladesh: A survey of six thanas.” Agriculture Sector Review, Ministry of Agriculture, Government of Bangladesh, Dhaka.
o This review of agricultural governance (Government of Bangladesh, 2006) in Bangladesh was done by the Government of Bangladesh’ Ministry of Agriculture. The survey was conducted 36 villages in Bangladesh. The data about the effects of agriculture governance on crops was based on the survey responses from fifty farm households of different sizes in each of the 36 villages.

399
The surveys found that there is corruption among Bangladesh Chemical Industries Corporation appointed fertilizer dealers. BCIC dealers are supposed to sell the fertilizer directly to the local farmers. Instead, they sell it to retailers across the country, who then sell it to farmers after adding in their contingency costs and profit margins. The majority of farmers purchase their fertilizer from the local market rather than BCIC dealers. There is also corruption in the government’s fertilizer and electricity subsidy programs. The surveys found that the subsidies for imported fertilizer had had no effect on price. This is likely because importers and dealers took advantage of the subsidy. The subsidy intended to lower the costs of irrigation was also fraught with corruption. The majority of deep borewell (DTW) operators received the subsidy but did not lower the costs of irrigation water for the farmers. The study did not look at the impact of the corruption on yields or across socioeconomic groups, though the assumption is that corruption negatively impacts farmer well-being when they fail to receive government benefits due to corrupt practices of bureaucrats and the private sector.
400
Appendix 4. World Bank SRI toolkit: Transcription of interviews
In response to the controversy over SRI, the World Bank Institute developed a toolkit to explain SRI technology. Instead of avoiding the controversies around the technology, the World Bank addressed them directly by interviewing farmers, researchers, practitioners and development agency staff about their views on SRI. These videos were at one time online, but the website is no longer available. Fortunately, I transcribed these interviews while they were still available, and I felt the text was worth including in the dissertation as useful data for the study of boundary work (Gieryn, 1983) in innovation systems. Farmers Farmer 1 – Singadavardan
Normally I would need 30 Kilos of seed to be used for 1 acre of land. But with this new process, I use 3 Kilos of seed for 1 acre of land. Labor wise it has been very economical. I can further reduce from 3 Kilos to 2.5 Kilos. Considering the results, the neighbors may want to try. I used to have 20 laborers, now I use only 10. To develop a nursery for planting it used to cost at least a 1000 rupees per acre, now it costs me less than 200 rupees per acre with seed reduction. Planting is cheaper and other advantage is that planting is easier as well using the marker. People who experimented with this say they are getting 38-40 bags of paddy per acre but with old method they were only getting 25-30 bags per acre. I believe this was a good venture.
Framer 2 – Uma Less labor is required because I am using a weeder. The weeder also makes it easier to eliminate
weeds and because of this I also get more yield. With the old method, the yield was 20-25 bags for one acre and with the new method I get more than 30 bags. Farmer 3 – Santhalingam
The fertilizer was the same as the old method but the yield went up to 35-42 bags and previously it was only 25 bags. Main difference is that I am using less water and less labor.
Framer 4 – Murgan
Now with this method, planting is done with 13 day old seedlings. I am using only about 3 Kilos of seed breaker versus 30 Kilos breaker with the old method. As a result, I am only using 10 percent of the seeds and growth is very robust. Old method produced 20 tillers but only 10 were healthy. Now, the new method results in 45-50 tillers per plant all healthy and as a result the yield is increasing. In each of the tillers I used to get 130-150 grains, now I get about 250-300 grains per tiller. Wider spacing results in healthier plants. Previously I used to use 30 laborers, now I only use 9 laborers.
Researchers
Dr. Norman T. Uphoff Why is there resistance to the acceptance of SRI? Well, I think it’s a good question why there has been as much resistance to SRI as we have
encountered. I think it comes on to the fact this is really a paradigm shift from an earlier understanding of
401
how we can get the most out of rice crops or wheat crops or other crops. The Green Revolution was very successful and had a very simple paradigm which was you improve the genetic potential of the crop and then you add extra inputs, more fertilizers, more water, more agrichemicals and so forth. And it works. Reason it took me 3 years to understand and accept SRI was that it didn’t do either of that. Didn’t do anything to improve the genes, took whatever varieties farmers were already using and didn’t add extra inputs, it reduced them. And so was very hard for me to understand it first time. So this alternative paradigm is one where you change the manners of the plants, the soil, the water and the nutrients to get a better phenotype from any genotype. And so it’s a whole different approach to the way in which we can nurture and benefit from the crops. And I think it’s very hard for a lot of people to understand and accept. And I say it took me 3 years and I am sympathetic with skepticism about this but I have decided that we should follow the motto – “Skepticism is the very good but it should be optimized, not maximized”. And so I would hope that more and more scientist as see the evidence accumulating would be willing to shift their concept (1:29) of how you do things. And don’t depend upon genetic change, don’t depend upon external inputs but really capitalize upon the symbiosis between the plants and the soil organisms. We are still learning about the SRIs. I mean that I keep emphasizing that this is a work in progress, we are not finished with it yet. The changes and innovations are coming all the time, mostly from farmers but also from researchers, NGOs, retired school teachers who get involved with this and just find it really exciting to work with this potential in the plant, that one little rice seed.
What are the benefits of applying SRI, especially in relation to climate change? Well I think we know already that 21st century is going to be very different from 20th century for
agriculture. We are going to have to deal with less land per capita as population keeps growing and some line gets degraded and goes out of production. We are going to deal with less water and it’s going to be less reliable water so we have to have production price at a very economic(0:12) with our water. Energy cost are going to keep going up I am afraid so that the kind of highly mechanized production large scale is going to become less and less economic. And I think the climate change then just adds a whole different set of problems on top of that where we have more pests and diseases to deal with, more draught, more storm damage. We find that once you have used these SRI practices with the rice plant for example, it can withstand draught much better than other plants because it has developed a large and deep and a healthy root system. We have had incredible pictures sent in of crops where the typhoon has gone over and blown the whole normal crop down and yet the SRI plants are all standing upright, vigorous. As one farmer where I visited several times in Xinjiang province in China who actually got a 12 ton SRI yield in 2004 which was the highest yield in the whole province that year. Next year this area had 3 typhoons, all within six weeks of each other yet he still harvested a crop of 11.15 tons per hectare according to the China National Rice Research Institute researchers working with him. Whereas his neighbor’s crops were very badly affected. So the rice plants with SRI methods are more vigorous, they have stronger tillers, stronger root systems, they can resist pest disease damage which is going to be more serious with climate change.
Is there a relation between SRI and energy? Our present modern day issues develop when petroleum crosses 10-20 dollars per barrel. We are
now talking about petroleum crossing 110-120 dollars per barrel. So we have to rethink the energy relationship. Things that were not economic 10-20 years ago are going to start being economic now in the next 10 and 20 years. So I think energy is going to figure very prominently. We have to capitalize as much as we can upon natural sources of nutrients, of water. Rather than transporting water large distances for this big irrigation. I think how do we get green water, how do we maximally capture and utilize water in-situ in the places where plants are growing.

402
Is SRI labor-intensive? When we first started working with SRI, we were working in Madagascar where farmers found the
methods to be fairly labor intensive requiring more work per hectare to get their results. So we accepted that this is a labor intensive technology but that is the price you pay to save water, to save seeds, to higher yields and so forth. That seemed to make sense, then farmers in Suyaka few (could not understand the name) in Madagascar started telling me that actually after the second or third season it started saving them labor. It took me a while to absorb that, I think. But we had a study done by GTZ team in Cambodia in 2004. 500 farmers in 5 provinces chosen randomly. 4 of them were SRI users and 100 were controls in the same villages who did not use SRI. They found that this was labor neutral. In fact there was not more labor per hectare for SRI with about 75 percent more yield. It turns out that if you look at the SRI farmers, some are new farmers some are experienced farmers. And the new farmers they take 10-20 percent more labor per hectare for their results. But once farmers get used to the methods and techniques and acquire both skill and confidence, it’s less labor. We have studies done in India by International Water Management Institute(IWMI), by Tamil Nadu Agriculture University both of which said it is 8 percent less labor per hectare with SRI. In China, there is one village in Sichuan province where it was studied by China Agriculture University researchers because they were told that this is very unusual village. In 2003 they had 7 farmers use SRI next year they had 398, 50 times more farmers “what’s going on?” And they interviewed these farmers, these farmers got 45 percent more yield 40 plus percent less water but the thing I liked the most SRI is it that saved them labor. In China labor is a big constraint. So you have to acquire both techniques and confidence and use them quickly and skillfully. When I was in Xinjiang province in Eastern China last August where they have over 110000 hectare of SRI rice that season. The extension agents told me the reason why this is moving so quickly and why if that is popular among large farmers and small farmers is because it is labor saving as well as water saving, seed saving and cost saving. There is an article published in the American Journal of Agriculture Economics, 2004 based on 108 farmers who are doing both practices were studied very carefully. So by year four it was 4 percent less labor and by year five it was 10 percent less labor. So I think once farmers realized they can save not just cost and water and seed but also labor then I am very confident it’s going to catch on very widely. So we are having to change our thinking. I am afraid some of the skeptics haven’t caught up to the data, from IWMI, from GTZ, from the different universities, from NIP and COY(3:01). In fact the intensification is really management not necessarily even more labor per hectare once you learn how to do this. There is always a learning cost, there is a learning curve we have to climb up on.
What are the leading constraints in disseminating SRI? The leading constraints I think are mostly mental. It’s just the idea that you can get more
production with less inputs, it goes against all our intuition, experience. We can explain this in scientific terms. How and why, less water, less plants, wider spacing gives you those results. There is objectively the limitation that if you don’t have any water control, if you can’t keep the soil in mostly aerated conditions you won’t see these results. And so good water control which is a combination of hardware and software, that’s subjective. If you want to go the organic route and use organic fertilization, you need to have enough biomass. Rice straw is of course the basis for this but you want other kinds of grasses, leaves, manure any kind of other material to decompose to enrich the soil biologically. In some places we have had some pest control problems. The most unusual was one on the edge of the Amazon jungle in Peru in Pucallpa where they tried SRI on an acre of land just using instruction they got from a drilling article and they got 8 ton yield instead of 2 tons. And one thing they really liked was that for the last month normally they have to be out scaring the birds away from the jungle with SRI the pinnacles are heavy enough that they hung down, the birds could not get them so they saved that labor of bird scaring and got 8 ton yield. Other constraints to get the best results you need to use a push wheel which will aerate the soil and at the same time removes weeds. At some places the farmers don’t have the access to
403
or don’t have the credit. Yet they don’t cost much 10-20 dollars that’s all. You can pay that back easily with the increased yield but you got to have the money upfront. I think the biggest constraint still is the mental one. My wife and I were in the Tripura state of India last August. Just village to village, in some village farmers were like “it’s so easy it almost recreational, this weeder were so fast and easy” other would say “this weeder is so much work and difficult”. So there are very different human reactions. We do find most of the times once you get past that first month. I mean another thing I think I should mention is that for the first month the field looks terrible. These tiny little seedlings widely spaced not flooded, you don’t see much green. There is no water to reflect the blue sky and give you a nice blue color to your planted field. This looks muddy. We had wives leave their husband for the first four five six weeks. Said “you fool you have ruined our families food supply”. The Cambodian farmer told us at a workshop that after the six weeks when it started the tillerings she came back and when we harvested these we were pretty good friends again. I remember in Cuba, a farmer said that his Father in law was embarrassed and said that I have been transplanting more seedlings at night so that the field won’t look so embarrassed so naked. So it does take a certain amount of courage and audacity just to be the first farmer in your area to try this. Once you have seen this crop cycle and seen the crop by the end of the season then those kinds of apprehensions and fears pretty much go away.
SRI demands good irrigation infrastructure. Is this a major constraint? Water control is as I said is part of the most objective requirement for SRI results. So that you
have to ensure that soil is not continuously flooded, not hypoxic, not suffocating the plant roots and the soil organisms. Once you passed the first month once those roots are going down, the plant is pretty tolerant and pretty forgiving. If you start flooding the plant from the really beginning of the roots they become deformed degenerated. Then if you water stress they are finished, they can’t survive. The water requirement is kind of a time frame. It’s the first month which is very critical to get enough water but not too much.
What role can governments play in disseminating SRI? One of the characterizations of the SRI we view is that it is a civil society innovation, it comes
really from the community, it hasn’t come through the standard channels of the researchers then extensions going to the farmers to tell them what to do. Initially it was mostly NGOs, universities and others that were interested in this. But in several countries it was government agents who picked up on this. In Nepal, in the Indian state of Tripura the leadership has really come from extension, agriculture government civil servants. So we are really pleased to see this is a coalition of Government, NGO, university, research institutes, private sector participants. Governments has got a key role to play. At this point where we have got we can demonstrate this. We can show people the results but for a large scale impact its going to require governments to get involved. In the state of Tripura, this one government researcher started on his own with SRI in 2000. He tried it for 2 years to adapt it to their very rainy conditions there. In 2002 he got 44 farmers to try it, next year 88, next year he got 440 (five times more) then he got 880. But that year he got the Chief Minister of the state, the Minister of Agriculture, the Finance Minister to come and see it and talk to farmers. And they said fine we got to reach this target of self-sufficiency by the year 2010, you can have one-third of the state’s agriculture budget. So in 2 years’ time it went from under a 1000 to over 70000. But all the state institutions worked with them. The local government institutions got very much involved. They gave subsidies for the weeders so that you can do that aeration with weed control. They gave them some subsidies for organic fertilizations, certain bio fertilizers and so forth. One interesting thing that any farmer growing SRI got a yellow flag on a stick that he put in his field. They are very proud to show this yellow flag in their fields. That was a nice visual reinforcement. I think that it’s not a matter of giving free seeds. It’s not a matter of giving subsidies or I call them often bribes. It does mean working with the irrigation department to make sure that they can

404
deliver the water in a reliable way. Not more water but reliable water, that’s an important thing governments can do. If they can facilitate farmer to farmer meetings or visits that’s probably the suo most important to spread SRI. Extension play the important role. They are the planners, facilitators and help answer the scientific questions. But they are not out there to sell the innovation to the farmers rather to facilitate farmers learnings from peers. So if I was designing a program I would say that this superior extension is probably the most important thing. Having access to weeders, roller markers and so for(3:11). Not to give them out as zzzzzz(3:12) but may be to make them easy to purchase, keeping the price low ensuring availability. Working on the irrigation to make that those are probably the 3 most important things for this to spread.
Could SRI be the future of irrigated rice? Well, some may think that SRI could be seen as the future of irrigated rice agriculture. We found
that SRI methods and concepts work for unirrigated rain fed rice cultivation as well. So I wouldn’t want to limit it just to irrigation but I think it is going to change the way in which we do irrigated rice. I think we can make our rice so productive that farmers can get both better incomes and we can have much lower price for consumers.
What are some downsides to SRI? Well when we started we were sure that there had to be some downsides to this. I mean I have
worked in the development for 40 years and nothing is ultimately as good as it appears at first. At first as I said we thought that labor intensive is going to be a sticking point but that has not proved to be the case. At some point if our productivity gains really hold up we are going to have a negative effect upon price. That of course is a good for the poor especially and for the consumer. What we want to do is to encourage diversification of agriculture. In Cambodia our NGO partners are already working with farmers who even as small as half hectare. When they will go from 1 or even 0.9 ton per hectare yield or 3 or 4 SRI then they will go back and take half of their time out of rice because they can get more than enough food than on just half of their rice land. And then they will have fish ponds, fruits, vegetables, legumes, poultries over. So they diversify and intensify their whole farming system. I just think we have to figure out of how do we solve the problem of this intensification, diversification and higher productivity. If we can put less of our land, less of our labor, less of our water, less of our money into rice production for our staple foods, we are going to be able to improve both our household economies and our national economies. I have been looking for the negatives, we are not afraid of them. First of all we have got so many positives that we can certainly absorb some negatives but I just haven’t seen them. We even get 15 percent more outturn of milled rice per bushel of unmilled paddy. That was something of a bonus on top our paddy yields we get 15 percent more milled rice because there are less breakage of grains and less chaff, that’s the unfilled grains in the paddy. So see that’s really quite a nice bonus. We find that the crops mature 1 to even 3 weeks sooner which means we use less water for irrigation and we also have land freed up for vegetable and other crops.
Final comments? We didn’t demonstrate outside Madagascar anywhere before 2000. Now 8 years later we are up to
30 countries where we have been able to demonstrate this. Without any major donor support. Little support from Rockefeller foundation, little from GGSIT(0:15), little from World Vision, little from AI but basically it has been done by people of different countries who are interested, who care about farmers, who care about the environment and want to help the consumers. We really welcome whatever support we get then from the World Bank, from the major donors, from the foundations, from national

405
governments. I think national governments should probably pick this up before the others because they have the most immediate needs to be able to use water more efficiently and more productively and SRI is one of the ways in which we can help to get higher water productivity.
Dr. Amir Kassam
What are the benefits of applying SRI, especially in relation to climate change? SRI offers you immediate advantage in terms of addressing the water scarcity problem. SRI is a
production system which offers you at least double the yield with half the water. That is water saving as well as a cost saving advantage. But more importantly it offers you double the productivity. In terms of climate change SRI is a much more robust system and it has characteristics which can tolerate variability much better than the conventional system and certainly during drought period it can stand up to water shortages much better.
Why is SRI controversial? SRI to some people appears controversial. I think that the main reason is that it offers a new way
of looking at agriculture. It offers a paradigm which is more agro-ecologically based, it is more closer to nature and it offers for the first time an ability to pay special attention to environmental issues. SRI in one sweep offers you increase in productivity, offers you better environmental services and it is less costly. I think that these features make some people believe that it is not true and therefore they question the validity of SRI. But I would say to those people “go to the field and see the evidence for yourself”. There is now close to million hectares under SRI and that cannot be regarded as a delusion. It is real.
What is the implication of SRI to irrigation investments? Investing in irrigation without specifying the way the water will be used for production is not the
best way of managing investment. Policymakers and decision makers should always insist that SRI approach would be an integral part of irrigation investment.
Comments on SRI’s agro-ecological aspects? Agro-ecological principles have been ignored over the last 2-3 decades and we have followed a
very simple approach, the so called Green Revolution approach which relies heavily on agro-chemicals but SRI shows that we can produce more using less but rely more on agro-ecological resources. SRI is an example of what future agriculture would be like.
Dr. Achim Dobermann Can you share the reservations of IRRI on SRI? I think it is important to understand first what SRI means. It is essentially a set of management
practices, nothing else. Many of which one way or another have either been known for a long time. In some cases where they make most sense in terms of adaptation to a particular environment or cropping system, they are already recommended best management practices. So scientifically speaking I do not believe there is any miracle in these practices or any sort of unexplained synergistic miracles by the combination of these different practices. I think we have strong scientific understanding of most of these things. Now the situation is basically such that whenever people independently and with scientific methods have evaluated the SRI practices as they have been proposed then the results have usually been

406
quite different from what has been reported from one formula ideations (1:24) conducted by NGOs and other who are promoting it. In other words, many scientists have had great difficulties to replicate those observations or have failed completely. That’s one thing. But I think the more important one is what do you compare against this. What I have often seen in these reports is SRIs being compared in farmers’ fields against something that is called conventional management. What is called conventional management has nothing to do or very little to do to with what we would consider being a best management practice. What I am trying to say is that “Yes”, if you implement these practices very carefully you will get pretty good rice yield but we know we can achieve that. We know we can achieve this with management practices that are by and large much more readily adoptable by farmers than many of the techniques that are being promoted under SRI. So, we have strong reservations scientifically about the claims that are being made. But what is probably more important is that we have strong reservations in terms of the claims being made about the general applicability of SRI. Because it is a very labor intensive practice, it is very knowledge intensive. It is in my opinion in many ways going against the socioeconomic transfer that we see in rice farming where labor is becoming less available or more expensive. Where the trend is more generally towards more mechanized forms of production, more labor efficient forms of production. So, I think that is a complicating factor. There are many rice cropping systems in the world where it will be next to impossible to convince farmers to use management practices of the labor-intensive kind that the SRI represents. Go to small fields and small farms where plenty of labor is available then that is normally not a constraint.
How do you explain reports of higher yields from some farmers adopting SRI? If you compare SRI with what we would promote as a best management practice is no significant
difference. But I think the more important thing is that there has been a lot of confusion about what means adoption of SRI. If some states like Tamil Nadu claims half a million hectare or like it has always been reported from Zhejiang province (0:26) in China 1 million hectares. If you look very carefully what those practices that farmers use are you will notice two things. One is that lot of the practices that are now called SRI have been around there for long time and have actually been standard management practice e.g. alternative wetting and drying instead of flood irrigation has been the standard recommended management practice in Chinese hyperdry (0:56) systems for 20 years. There is nothing new there. Or the fact that planting younger seedlings gives higher yield has been the standard management practice zzzzzz (1:09) of 30 years. It is basically just good management in general. One important piece of research that needs to be done is actually clarify what has been adopted where in terms of the practices and in terms of the modifications of those that have been made compared to what has originally been thought to be the SRI. I think we have lot of confusion out there.
Why have some SRI trials by scientists failed? Whenever this has happened and this happened quite frequently, the proponents of SRI usually say
well that is because you haven’t done it right or because it takes some time to learn how to do it right or they will say it takes some time, overtime, even years until the new positive effects become implemented or in terms of benefits or soil fertility or things like that. But I think these are fairly poor excuses because if scientists can’t do that easily and replicate it or really verify it properly, I think it’s very risky to go out and recommend things to farmers that aren’t really explained properly. So whether there is any clear explanation for that failure is an interesting question.
Are you saying that SRI is simply a set of good management practices? That basically what I look at it those management practices some of them are the same as we
recommend, some of them I think are unnecessary or are very difficult to implement by farmers so but it is basically a set of management practices. We don’t call it SRI we call it good management practices or
407
best management practices or recommended management practices. But the goal is in the end the same to optimize the management of the crop in the given environment and given cropping season.
Explain why some farmers get better yields compared to scientific trials? No they, Ok let’s define failure, they have followed these practices very closely as they had been
recommended but the yields that they were getting were not better or even less in some cases than what they were getting with what we already recommend as known good management practices. There was no difference. You have to look at the baseline for the comparison. If what is called the common practice or conventional practice yields very low, 1 ton or 2 tons, there is something wrong with it. There is obviously something fundamentally wrong. If you then with better management achieve 4 tons, you have doubled the yield but you are still far away from what the optimal yield should be. So I don’t like these kinds of comparisons unless it is very clear also in terms of measurements and characterization what the common or conventional practice is. I don’t question you can achieve this if you follow these management practices to the point. Any time you come there with improved management practices you are going to increase the yield so this not something that will only happen with SRI.
Comment on the plans for joint research by IRRI, Cornell, and Wageningen? We have developed a first draft of proposal that will be led by Wageningen University in
Netherlands with IRRI and Cornell University as partners. The proposal has essentially two major purposes. One is to really document, that goes back to my first answer, what is really actually happening out there in areas where there have been claims of adoption of SRI. So that’s basically a surveying activity that we will conduct together but led by an independent institution who has not been directly involved in this debate so far. Second major component is to address scientifically some of the roots or the fundamental hypothesis on the zzzzzz SRI(1:01). So we propose to conduct jointly a set of very carefully designed experiments in a number of key locations across Asia. I would expect that we have results in about 3-4 years that will hopefully clarify a lot of the uncertainties that currently exist there and also the confusion that exists.
Practitioners Mr. Shuichi Sato
What has been the constraints to disseminating SRI to farmers in Indonesia? Biggest constraint is confidence. Financially not problem because SRI no increase external inputs.
Main constraint is because of drastic change of the way of doing. Most of course farmer difficult to understand or afraid and question a lot more. So first we must prepare some demonstration farm. Most important point is first knowledge information. So we prepare material like pamphlet, vinyl (0:36). Also very important point is government side understanding and their cooperation. Structured practice (0:43) on the field. Only knowledge in the classroom not enough. Practice is important.
Why do you differentiate organic SRI from non- organic SRI? I say basic SRI and organic SRI. Organic approach was commonly understood that part of
important aspect of SRI but difficulty also exist. Many countries due to organic approach dissemination is very slow. Most farmer faced difficulty of organic approach because the organic mean for example consists of (0:27) compost need big energy but real effect come out not first year but second or third year. If market is not variable or organic rice cannot sell in higher price what’s the return for them for their effort, this is question. So, in my project 5 years ago when we start we follow the original idea basic SRI

408
only without using organic material and very great success already. But now after 5 years we gradually disseminate organic approach now. We are now proposing phased approach First basic SRI then come to organic approach. Step by step this is realistic. But of course, some farmer like West Java start from the organic SRI directly because market ability or farmer level everything is good. So, we must be flexible how to do. There are many choices.
Are there differences in the quality and price of SRI rice? SRI rice quality is better than conventional system even same variety. One is taste is good. Second
after cooking one or two or three days later, SRI rice no quality change still delicious. But conventional rice after one day stale smell come out, not delicious. This really happens and also very big difference is milling quality is different. It means SRI rice is much better reducing the broken rice after milling. SRI rice is much better price. In Indonesia SRI rice, but not organic, may be 20 percent higher than conventional rice but organic SRI rice 2 times or 2.5 times so benefit of farmers are very high.
Mr. Carlos Salazar
What has been the reaction of farmers in your area to SRI? In the Philippines, farmers still believe that if we could achieve what really happened they don’t
tend to agree. They want to see it first for them to follow. That’s why I am recommending demonstration farm will be established nationwide. This is the best way to convince farmers. Actually, many were surprised after seeing that specially in the intermittent method of water application because farmers in the Philippines practice flooding method with continuous water but when they saw that with intermittent method of water application even to the extent of soil cracking (0:49) produced more tillers, that’s why they were surprised and many are now convinced to adopt the system of farming.
From your experience, does SRI require more labor? I agree that increase application of organic fertilizer will increase labor because zzzzz (0:09) we
are recommending something like 20 zzzzz (0:12) or bags of organic fertilizer not like chemical fertilizer that we are only recommending 3-5 bags per hectare so there is accordingly an increase of labor requirement. But as we go on applying organic fertilizer, the trend is reducing. May be in 3-4 years no organic fertilizer will be applied because soil will already become fertile, ideal for rice farming. So no more application of organic fertilizer or chemical fertilizer. So the idea that there is that increase in labor if we go on organic farming is not true.
Development Agencies Dr. Willem Janssen
How did you see the potential of SRI in project preparation? This project was very novel in the way that it tried to combine agriculture and irrigation which to
most outsiders seems pretty logical but in many projects is done separately. And SRI came up that is one of the best options for actually kind of let’s say economizing water and getting higher yield. And so it brought together the two main things that we wanted to do in this project, get agriculture to become more productive and to be more effective with water resources available. Up to now it’s been living up to that promise. We really have been more efficient with water use. Farmers are because of that able to plant higher areas in rice because water is very scarce in the state and they are getting rice of good quality.

409
Some of the reasons why we were very willing to go forward at that state is that the project was being developed by a very competent group of people. University of Tamil Nadu which is recognized in the country, is probably the best Agriculture University of the country. And we also were aware of the fact that the SRI system had been functioning quite well in other places. Often at somewhat smaller scales but we felt that it was quite ok to try to scale it up at another level. Some other reasons why we felt it was a very good component in this project was that we would be able to reduce and produce. We would be able to reduce the use of fertilizer and also the use of herbicides. And since these are very major cost elements that was very essential to make farming more profitable to farmers. All those things together made us decide that it was a very wise and good move to try out SRI and to try it out on a big scale.
How was the idea of SRI introduced in the project? It was certainly not the World Bank that introduced the technology to India. India has a very
vibrant kind of scientific community both in the Indian Council of Agriculture Research and in the State Agriculture Universities and I believe that some of those have been in kind of touch very early on with the System of Rice Intensification. And those were the ones that actually started to push it. I think what the bank did is we picked up on it and we picked up on it not so much because we had a specific interest in rice but we had a specific interest in combining improved economy with improved irrigation. SRI was just in the middle of it.
What is needed for scaling up SRI? One of the main elements for scaling up will be that the technology is going to be adapted to
specific conditions. And the specific conditions can be agro-biological conditions like the type of soil, like when the water is available, like the planting months. But they may also be socioeconomic conditions like when there is labor available and that is a point where SRI system needs to be adapted with care. Because the labor peaks change through the cropping cycle towards let’s say more at the early start of the crop. Other than that an important change in many irrigations systems is that the water must come at different moments and that might be one of the more difficult things to manage. Many irrigation systems in India work with quite big bulk delivery of water. So at a certain moment the canal opens up, the water starts coming out. Farmers have water for a day or two and then it stops again in the gravity systems. An important would be in these SRI systems that the amount of water that the arrives at the farm is going to be smaller, it might need to come a bit more often and with the surplus water that is not required any more, the additional land will be irrigated. And those are let’s say relatively substantial changes. And those are the changes that go beyond the management of the field into the management of irrigation system.
Do you view SRI expansion as a bottom up approach? In the 70s of the last century, we became very used to a type of model of technological change
where all the change was coming out of the research organizations. So, change started with a scientist having a bright idea and then further developing that. And one of the interesting things that we see occurring now in the last 10-15 years is that the change increasingly comes up from the bottom. SRI is a very typical example of that and it’s an example that in retrospect merits a lot of study. Understanding why it was able to mushroom in quite so many places? What were the key success factors? And in the retrospect, it has also been seen occasionally as a challenge for the small traditional technological change models which tend to start withresearch organizations. There is no reason to be concerned there as there is a lot of follow up work to be done once the technology arrives in order to put in place, in order to understand how you make it work best. And so, there is certainly more work even than before for scientists.

410
What is the role of the World Bank in response to paradigm shifts like SRI? SRI really is a paradigm shift. It’s a system of producing rice in which basically everything that we
knew about rice is going to be turned around and the surprising thing is that it actually yields higher. I think the first thing that the bank should do with respect to paradigms is we should be very careful with adopting them. We have had a lot of bad experiences with being hooked on to paradigms too strongly. We must be very let’s say sober about what is possible, what can be funded, what can be done. Then the next thing that we need to do is we need to look at the evidence. We are not scientists so for the bank what counts is the bottom-line. We need to make sure we come out with technologies that were better for the people that we have to deal with. The point that we need to make sure is that we really are evidence based and we are practical. The bank is not about proving or disproving scientific paradigms. And one of the main reasons why we went forward with the System of Rice Intensification in India is basically because it had worked at substantial scales, it was backed by a good team and under those conditions we could just try it. At the same time, we also need to be careful and we need to listen. We should not do things basically because somebody believes in it. We should make sure that there is a group of people that is able to understand why it works and why it comes about. It’s also very important to understand that increasingly innovation is based not on very big changes. It’s based on many small changes in many different places and if we do that we can also avoid that we get locked into let’s say paradigms that afterwards turn out not to be valid.

411
Appendix 5. SRI songs from Bihar
The text of these songs was provided by PRAN. I also have recordings of PRAN SRI farmers singing these songs before the beginning of meetings and at district-wide agricultural fairs. When PRAN expands to a new area, it brings female farmers from other villages all wearing yellow saris to sing these songs. As the women sing, other women are curious and gather to hear the songs which describe the techniques and benefits of SRI in detail. Song No. 1 Sisters, spread your knowledge to each and everyone, SRI method is very great. (Twice) We will adopt Sri method, We will facilitate our girls' study, Sisters, our daughters would become pride for our village. SRI method is very great. (Twice) We will use weeders on 15th day, We will repeat it on 30th day, Then the plants would become healthy, SRI method is very great. (Twice) We will prepare manures on our own, We will prepare pesticides on our own, Sisters, we will not give our command to the market, SRI method is very great. (Twice) We will prepare SRI Pranamrit (plant energizer), We will repel urea and DAP, We will repel chemicals as it is our pride, SRI method is very great. (Twice) We will practice SRI method, We will propagate it to every person, Sisters, we will collectively develop the world, SRI method is very great. (Twice) We will enhance our knowledge on PRAN (spirit of life), We will keep going on the path of truth, Sisters, God will be found in every people, SRI method is very great. (Twice)
We will construct the temple of SRI method, We will also keep SRI method in our minds, Then our sons and daughters may become great, SRI method is very great. (Twice) Song No. 2 Transplantation of paddy seedlings through SRI method is pleasant. Transplant it slowly, sister; Transplant it slowly, aunty, (twice) Paddy plants look nice when transplanted in rows, Transplantation of paddy seedlings through SRI method is pleasant. Less seed is needed for SRI method, It will also consume less labor, You will find its transplantation pleasant and nice, Transplantation of paddy seedlings through SRI method is pleasant. Do use the weeders on 15th day, Do repeat it on 30th day, Then double will be yield of paddy and pleasant, Transplantation of paddy seedlings through SRI method is pleasant.

412
It may yield three maunds141 a Kattha142, It may yield four maunds a Kattha, Leave the practice of growing one maund a Kattha, it is pleasant, Transplantation of paddy seedlings through SRI method is pleasant. Purify and treat the seeds at first, Only then develop the nursery, Sow the seeds after germination, Mulch them using paddy straw, Do the watering and go to check it every day, You will fill in with joy to see, it is pleasant, Transplantation of paddy seedlings through SRI method is pleasant. (Twice) Song No. 3 He introduced the SRI method village to village, My brother is knowledgeable. My brother is knowledgeable; my sister is knowledgeable, (twice) He introduced the SRI method village to village, My brother is knowledgeable. Receiving the training from PRAN office, He became VRP143 of SRI method, He visited and convinced village to village, My brother is knowledgeable. He facilitated us grow paddy, wheat, vegetables, finger millet, He introduced the technique of SRI method, He lit candles in the houses of the poor, My brother is knowledgeable, He introduced the SRI method village to village, My brother is knowledgeable. Brother from PRAN is sailor for the poor, Facilitator of farming on the farms of the poor, He eradicated the feeling of superior and inferior (people),
141 A measurement of weight (forty seers). 142 A measurement of land.
My brother is knowledgeable. He extended the method locally and abroad, He extended it to the oppressed and backwards, He enhanced the yield farm by farm, He caused it to grow three maunds a Kattha, My brother is knowledgeable. My brother is knowledgeable; my sister is knowledgeable, (twice) He introduced the SRI method village to village, My brother is knowledgeable. Song No. 4 Grow SRI method paddy, grow my sisters. Grow SRI method paddy, grow my sisters. SRI method consumes less water, It consumes less seeds, less labor, Adopt it farm to farm, adopt it my sisters, Grow SRI method paddy, grow my sisters. (twice) Brother from PRAN is sailor for the poor, Coordination with Government, growth promoter for farmers, Prevent him from enemies, prevent my sisters, Grow SRI method paddy, grow my sisters. Sisters stay hungry at homes; they do not get their meals, Adopt it house to house, adopt my sisters, Grow SRI method paddy, grow my sisters. Honorable Minister is sentry for poor, Welcome him with garlands, Put on him garlands; put not my sisters, Grow SRI method paddy, grow my sisters. Song No. 5 Come brothers and sisters, We visited here to extend you the knowledge, To enhance the knowledge of farming through SRI method.
143 Village resource person

413
Transplant the seedlings very young, Do not use seedlings more than one, The farms will be prosperous, The crops will yield limitless, dear sisters. PRAN visited to tell all of us, To use weeders only on 15th day, To grow green manures in the fields, Then, it will grow, bunches will grow again and again, dear sisters. PRAN visited to tell all of us, Come brothers and sisters …. Less crop will yield more, Sons and daughters will go to read, The family will be well to do, dear sisters. PRAN visited to tell all of us, Come brothers and sisters, We visited here to extend you the knowledge, To enhance the knowledge of farming through SRI method. Song No. 6 We will enhance awareness for SRI method, we will change the world. We will …. We will transplant paddy field by field using SRI method, We will change the minds of every family towards SRI method, We will turn every village into heaven, we will change the world. We will … We will also prepare manure and pesticides (twice) We will not buy chemical poison from market (twice) We will repel the diseases from every family, we will change the world. We will …. We have learnt farming through SRI method, I will be beloved of parents and all, We will facilitate the children be great, we will change the world.
We will…. We have turned the views of society, We have enhanced the capacities through SRI method, We will flow the Ganges of knowledge, we will change the world. We will…. We will adopt the lesson of five 'S' in our families, We will extend our respect to the elders, We will bow before them in our families, We will get the well wishes of the elders, We will enlighten house to house, we will change the world. We will…. We will turn the earth into heaven with five 'J', We will improve water, forest, animals, land, (twice) We will turn every person into true human being, We will change the world. We will …. The demons polluted the earth (twice) Spread poison in air and water, (twice) We will enhance the knowledge of PRAN, we will change the world.
414
References
Abbi, B. L. and Singh, K. (1997) Post Green Revolution Rural Punjab: A Profile of Economic Socio-Cultural Change (1965-1995). Chandigarh: Centre for Research in Rural and Industrial Development.
Acharya, S. (2013) ‘Progress and Poverty in Bihar’, in Singh, N. and Stern, N. (eds) The New Bihar. Noida: Harper Collins Publishers India, pp. 79–99.
Africare, Oxfam America and WWF-ICRISAT (2010) More Rice for the People. More Water for the Planet. System of Rice Intensification (SRI). Hyderabad, India. Available at: https://www.oxfamamerica.org/publications/more-rice-for-people-more-water-for-the-planet/.
Ahmad, F. (2013) ‘Agriculture Revolution Takes Shape Silently’, The Times of India (TOI), 22 March. Available at: https://timesofindia.indiatimes.com/city/patna/Agriculture-revolution-takes-shape-silently/articleshow/19118673.cms.
Ahujal, A. (2017) ‘SIT to visit Uttar Pradesh, Bihar to investigate 16 crore wheat seeds scam’, The Times of India (TOI), 21 November. Available at: https://timesofindia.indiatimes.com/city/dehradun/sit-to-visit-uttar-pradesh-bihar-to-investigate-16-crore-wheat-seeds-scam/articleshow/61729159.cms.
Aker, J. C. and Mbiti, I. M. (2010) ‘Mobile Phones and Economic Development in Africa’, Journal of Economic Perspectives, 24(3), pp. 207–232. doi: 10.1257/jep.24.3.207.
Alene, A. D. and Manyong, V. M. (2007) ‘The effects of education on agricultural productivity under traditional and improved technology in northern Nigeria: An endogenous switching regression analysis’, Empirical Economics, 32(1), pp. 141–159. doi: 10.1007/s00181-006-0076-3.
Alston, J. M., Chan-Kang, C., Marra, M. C., Pardey, P. G. and Wyatt, T. J. (2000) A Meta-Analysis of Rates of Return to Agricultural R&D: Ex Pede Herculem?, IFPRI.
Anadon, L. D., Chan, G., Harley, A. G., Matus, K., Moon, S., Murthy, S. L. and Clark, W. C. (2016) ‘Making technological innovation work for sustainable development’, Proceedings of the National Academy of Sciences, 113(35), pp. 9682–9690. doi: 10.1073/pnas.1525004113.
Anadon, L. D., Matus, K., Moon, S., Chan, G., Harley, A., Murthy, S., Trimmer, V., Abdel Latif, A., Araujo, K., Booker, K., Choi, H., Dubrawski, K., Friedlander, L., Ingersoll, C., Kempster, E., Pereira, L., Stephens, J., Vinsel, L. and Clark, W. C. (2014) Innovation and Access to Technologies for Sustainable Development: Diagnosing Weaknesses and Identifying Interventions in the Transnational Arena. Cambridge. Available at: https://www.hks.harvard.edu/publications/innovation-and-access-technologies-sustainable-development-diagnosing-weaknesses-and.
Andrews, M., Pritchett, L. and Woolcock, M. (2017) Building State Capability: Evidence, Analysis, Action. Oxford: Oxford University Press.
Anik, A. R., Breustedt, G. and Bauer, S. (2011) The Impact of Corruption on Farmers’ Efficiency in Rice Production: A Natural Experiment from Bangladesh. Paper prepared for presentation at the EAAE 2011 International Congress, August 30-September 2, 2011, Zurich, Switzerland. Available at:

415
http://ageconsearch.umn.edu/bitstream/114224/2/Anik_Asif_407.pdf.
Ansari, S., Munir, K. and Gregg, T. (2012) ‘Impact at the “Bottom of the Pyramid”: The role of social capital in capability development and community empowerment’, Journal of Management Studies. Blackwell Publishing Ltd, 49(4), pp. 813–842. doi: 10.1111/j.1467-6486.2012.01042.x.
Argyris, C. (1976) ‘Single-Loop and Double-Loop Models in Research on Decision Making’, Administrative Science Quarterly, 21(3), p. 363. doi: 10.2307/2391848.
Argyris, C. and Schön, D. (1978) Organizational Learning: A Theory of Action Perspective. Reading, Massachussets: Addison Wesley.
Arrow, K. J., Dasgupta, P., Goulder, L. H., Mumford, K. J. and Oleson, K. (2012) ‘Sustainability and the measurement of wealth’, Environment and Development Economics, 17(October), pp. 317–353.
Ashby, J. A. (1997) ‘Fostering Farmer First Methodological Innovation: Organizational Learning and Change in International Agricultural Research’, in Scoones, I. and Thompson, J. (eds) Farmer First Revisited : Innovation for Agricultural Research and Development. Bourton on Dunsmore, UK: Practical Action Publishing, p. 7.
Asrat, S., Yesuf, M., Carlsson, F. and Wale, E. (2010) ‘Farmers’ preferences for crop variety traits: Lessons for on-farm conservation and technology adoption’, Ecological Economics, 69(12), pp. 2394–2401. doi: 10.1016/j.ecolecon.2010.07.006.
Ayars, J. E., Bucks, D. A., Lamm, F. R. and Nakayama, F. S. (2007) ‘Introduction’, in Lamm, F. R., Ayars, J. E., and Nakayama, F. S. (eds) Microirrigation for Crop Production - Design, Operation and Management. Elsevier Science, pp. 1–26.
Baloch, M. A. and Thapa, G. B. (2016) ‘The effect of agricultural extension services: Date farmers’ case in Balochistan, Pakistan’, Journal of the Saudi Society of Agricultural Sciences. doi: 10.1016/j.jssas.2016.05.007.
Bandyopadhyay, D. (2009) ‘Lost Opportunity in Bihar’, Economic & Political Weeekly, 44(47), pp. 12–14. doi: 10.2307/25663804.
Banerjee, A. and Iyer, L. (2005) ‘History, Institutions, and Economic Performance: The Legacy of Colonial Land Tenure Systems in India’, The American Economic Review, 95(4), pp. 1190–1213.
Banerjee, H., Goswami, R., Chakraborty, S., Dutta, S., Majumdar, K., Satyanarayana, T., Jat, M. L. and Zingore, S. (2014) ‘Understanding biophysical and socio-economic determinants of maize (Zea mays L.) yield variability in eastern India’, NJAS - Wageningen Journal of Life Sciences, 70–71, pp. 79–93. doi: 10.1016/j.njas.2014.08.001.
Banerjee, S. (2009) ‘Nitish Says No to New Land Reform Law’, The Hindu, 21 October. Available at: http://www.thehindu.com/todays-paper/tp-national/Nitish-says-no-to-new-land-reform-law/article16499013.ece.
Barah, B. C. (2009) ‘Economic and ecological benefits of system of rice intensification (SRI) in Tamil Nadu’, Agricultural Economics Research Review, 22(2), pp. 209–214.
Barrett, C. B., Moser, C. M., McHugh, O. V and Barison, J. (2004) ‘Better technology, better plots, or

416
better farmers? Identifying changes in productivity and risk among Malagasy rice farmers’, American Journal of Agricultural Economics, 86(4), pp. 869–888. doi: org/10.1111/j.0002-9092.2004.00640.x.
Basu, K. (2013) ‘The Bihar Economy: An Overview and Some Field Notes’, in Singh, N. and Stern, N. (eds) The New Bihar. Noida: Harper Collins Publishers India, pp. 8–19.
Baulch, B. and Hoddinott, J. (2000) ‘Economic mobility and poverty dynamics in developing countries’, Journal of Development Studies, 36(6), pp. 1–24. doi: 10.1080/00220380008422652.
Bengtsson, N. and Nilsson, J. (2015) Solar Water Pumping for Irrigation. Halmstad University, Halmstad.
Berbel, J., Gutiérrez-Martín, C., Rodríguez-Díaz, J. A., Camacho, E. and Montesinos, P. (2015) ‘Literature Review on Rebound Effect of Water Saving Measures and Analysis of a Spanish Case Study’, Water Resources Management, 29(3), pp. 663–678. doi: 10.1007/s11269-014-0839-0.
Berdegué, J. and Escobar, G. (2002) Rural diversity, agricultural innovation policies and poverty reduction. 122. Agricultural Research and Extension Network. Available at: https://www.researchgate.net/profile/Julio_Berdegue/publication/266370155_Innovacin_Agrcola_y_Reduccin_de_la_Pobreza/links/54a2c78f0cf257a63604d702.pdf.
Berkhout, E. and Glover, D. (2011) The Evolution of the System of Rice Intensification as a Socio-Technical Phenomenon: A Report to the Bill & Melinda Gates Foundation, Wageningen University and Research Centre. doi: 10.2139/ssrn.1922760.
Berkhout, F. G. H., Angel, D. and Wieczorek, A. J. (2009) ‘Sustainability transitions in developing Asia: are alternative development pathways likely?’, Technological Forecasting and Social Change, 76(2), pp. 215–217. doi: 10.1016/j.techfore.2008.04.003.
Bhagwati, J. N. (1988) ‘Poverty and public policy’, World Development, 16(5), pp. 539–555. doi: 10.1016/0305-750X(88)90184-2.
Bhalla, G. S. and Singh, G. (2001) Indian Agriculture: Four Decades of Development, Indian agriculture: four decades of development. New Delhi: Sage Publications India Pvt Ltd.
Bhamoriya, V. and Mathew, S. (2014) An Analysis of Resource Conservation Technology : A Case of Micro-Irrigation System. Centre for Management in Agriculture. Indian Institute of Management, Ahmedabad. Available at: http://www.iimahd.ernet.in/users/webrequest/files/cmareports/15Analysis_Resource_Final.pdf.
Biggs, S. D. (1990) ‘A multiple source of innovation model of agricultural research and technology promotion’, World Development, 18(11), pp. 1481–1499. doi: 10.1016/0305-750X(90)90038-Y.
Biggs, S. D. and Clay, E. J. (1981) ‘Sources of innovation in agricultural technology’, World Development, 9(4), pp. 321–336. doi: org/10.1016/0305-750X(81)90080-2.
Bijker, W. E., Hughes, T. P. and Pinch, T. J. (1987) The Social Construction of Technological Systems. Masachussets: MIT Press. doi: 10.1177/030631289019001010.
Binz, C. and Anadon, L. D. (2016) Transplanting clean-tech paths from elsewhere: The emergence of the

417
Chinese solar PV industry. Papers in Innovation Studies 2016/29. Lundt University - Centre for Innovation, Research, and Competence in the Learning Economy. Available at: http://www.circle.lu.se/publications.
Borlaug Institute for South Asia (2015) ‘Comparative performance of System of rice-wheat intensification (SRI-SWI) vis-a-vis other crop establishment methods’, in Major Accomplishments 2012-2014. BISAReport Series 1. New Delhi, India, pp. 12–13.
Borooah, V. K. (2005) ‘Caste , Inequality , and Poverty in India’, Review of Development Economics, 9(3), pp. 399–414. doi: 10.1111/j.1467-9361.2005.00284.x.
Bromley, D. and Foltz, J. (2011) ‘Sustainability under siege: Transport costs and corruption on West Africa’s trade corridors’, Natural Resources Forum, 35(1), pp. 32–48. doi: 10.1111/j.1477-8947.2011.01342.x.
Brooks, H. (1980) ‘Technology, Evolution, and Purpose’, Daedalus, 109(1), pp. 65–81. Available at: www.jstor.org/stable/20024649.
Burney, J. A., Naylor, R. L. and Postel, S. L. (2013) ‘The case for distributed irrigation as a development priority in sub-Saharan Africa’, Proceedings of the National Academy of Sciences, 110(31), pp. 12513–12517. doi: 10.1073/pnas.1203597110.
Burney, J. A., Woltering, L., Burke, M., Naylor, R. and Pasternak, D. (2010) ‘Solar-powered drip irrigation enhances food security in the Sudano-Sahel’, Proceedings of the National Academy of Sciences, 107(5), pp. 1848–1853. doi: 10.1073/pnas.0909678107.
Business Standard (2013) ‘Bihar to produce 100 lakh tonnes paddy this year’, Business Standard, April. Available at: https://advance-lexis-com.ezp-prod1.hul.harvard.edu/document/?pdmfid=1516831&crid=7cb2da86-a53a-42bd-95a3-.
Callon, M. (1990) ‘Techno-economic Networks and Irreversibility’, The Sociological Review, 38(S1), pp. 132–161. doi: 10.1111/j.1467-954X.1990.tb03351.x.
Callon, M. (1998) ‘Actor-Network Theory-The Market Test’, The Sociological Review, 46(S), pp. 181–195. doi: 10.1111/1467-954X.46.s.10.
Castañeda, A., Doan, D., Newhouse, D., Nguyen, M. C., Uematsu, H. and Azevedo, J. P. (2016) Who Are the Poor in the Developing World? Washington, DC: World Bank Group. Available at: https://papers.ssrn.com/sol3/papers.cfm?abstract_id=2848472.
Central Ground Water Board (2013) Groundwater Information Booklet: Gaya District, Bihar State. Patna, Bihar. Available at: http://cgwb.gov.in/District_Profile/Bihar/Gaya.pdf.
Chakrabarti, R. (2013) Bihar Breakthrough: The Turnaround of a Beleaguered State. New Delhi: Rupa Publications.
Chambers, R. W., Pacey, A. and Thrupp, A. (1989) Farmer first: Farmer Innovation and Agriculture Research. London: Intermediate Technology Publications.
Charmaz, K. (2014) Constructing grounded theory : a practical guide through qualitative analysis. London: Sage Publications.

418
Chekene, M. B. and Chancellor, T. S. B. (2015) ‘Factors Affecting the Adoption of Improved Rice Varieties in Borno State, Nigeria’, Journal of Agricultural Extension, 19(2), p. 21. doi: 10.4314/jae.v19i2.2.
Chintu and Kumar, A. (2017) ‘Why Land Reforms Remained an Unfinished Task in Bihar’, IOSR Journal Of Humanities And Social Science, 22(7), pp. 91–99. doi: 10.9790/0837-2206079199.
Chopra, R. N. (1985) Green Revolution in India: The Relevance of Administrative Support for its Success. New Delhi: Intellectual Publishing House.
CIIFAD (2018) SRI International Network and Resources Center. Available at: http://sri.ciifad.cornell.edu (Accessed: 9 May 2018).
Clark, N. (2002) ‘Innovation Systems, Institutional Change and the New Knowledge Market: Implications for the Third World Agricultural Development’, Economics of Innovation and New Technology, 11(4), pp. 353–368. doi: 10.1080/10438590200000004.
Clark, W. C., Tomich, T. P., van Noordwijk, M., Guston, D., Catacutan, D., Dickson, N. M. and McNie, E. (2016) ‘Boundary work for sustainable development: Natural resource management at the Consultative Group on International Agricultural Research (CGIAR)’, Proceedings of the National Academy of Sciences, 113(17), pp. 4615–4622. doi: 10.1073/pnas.0900231108.
Coady, D., Grosh, M. and Hoddinott, J. (2004) ‘Outcomes Targeting Redux’, The World Bank Research Observer, 19(1), pp. 61–85. doi: 10.1093/wbro/lkhOI6.
Cochrane, W. W. (1993) ‘Government Intervention, Cannibalism, and the Treadmill’, in Development of American Agriculture: A Historical Analysis. Minneapolis: University of Minnesota Press, pp. 417–436.
Collier, P. (2007) The Bottom Billion: Why the Poorest Countries are Falling and What Can Be Done About It. Oxford: Oxford University Press. doi: 10.1080/02615470903159885.
Croppenstedt, A. and Muller, C. (2000) ‘The Impact of Farmers’ Health and Nutritional Status on Their Productivity and Efficiency: Evidence from Ethiopia’, Economic Development and Cultural Change, 48(3), pp. 475–502. doi: 10.1086/452607.
Dalvi, V. B., Tiwari, K. N., Pawade, M. N. and Phirke, P. S. (1999) ‘Response surface analysis of tomato production under microirrigation’, Agricultural Water Management, 41(1), pp. 11–19. doi: 10.1016/S0378-3774(99)00021-9.
Dao, A., Sanou, J., Gracen, V. and Danquah, E. Y. (2015) ‘Indentifying farmers’ preferences and constraints to maize production in two agro-ecological zones in Burkina Faso’, BioMed Central, 4(1), pp. 1–7. doi: 10.1186/s40066-015-0035-3.
Dasgupta, P. (2000) ‘Trust as a Commodity’, in Gambetta, D. (ed.) Trust: Making and Breaking Cooperative Relations. Oxford: Basil Blackwell, pp. 49–72.
Davis, K., Nkonya, E., Kato, E., Mekonnen, D. A., Odendo, M. and Nkuba, J. (2012) ‘Impact of Farmer Field Schools on Agricultural Productivity and Poverty in East Africa’, World Development, 40(2), pp. 402–413. doi: 10.1016/j.worlddev.2011.05.019.

419
Dayal, R. (2011) ‘Govt prepared to tackle drought-like situation in S Bihar dists: Minister’, The Times of India (TOI), 29 July. Available at: https://timesofindia.indiatimes.com/city/patna/Govt-prepared-to-tackle-drought-like-situation-in-S-Bihar-dists-Minister/articleshow/9399810.cms.
Dercon, S. and Christiaensen, L. (2011) ‘Consumption risk, technology adoption and poverty traps: Evidence from Ethiopia’, Journal of Development Economics, 96, pp. 159–173. doi: 10.1016/j.jdeveco.2010.08.003.
Dobermann, A. (2004) ‘A critical assessment of the system of rice intensification (SRI)’, Agricultural Systems, 79(3), pp. 261–281. doi: 10.1016/S0308-521X(03)00087-8.
Dobermann, A. (2013) ‘Another new rice yield record ? Let’ s move beyond it’, IRRI Website. Available at: http://irri.org/blogs/achim-dobermann-s-blog/another-new-rice-yield-record-let-s-move-beyond-it.
Donkor, E. and Owusu, V. (2014) ‘Effects of land tenure systems on resource-use productivity and efficiency in Ghana’s rice industry’, African Journal of Agricultural and Resource Economics, 9(4), pp. 286–299.
Drab, B. and Mandell, D. (2009) The Agricultural Irrigation Industry. Chicago, Illinois.
Duflo, E. (2006) ‘Poor But Rational?’, in Banerjee, A. V., Bénabou, R., and Mookherjee, D. (eds) Understanding Poverty. New York: Oxford University Press, pp. 1–12.
Duflo, E., Kremer, M. and Robinson, J. (2011) ‘Nudging Farmers to Use Fertilizer: Theory and Experimental Evidence from Kenya’, American Economic Review, 101(6), pp. 2350–2390.
Durga, N., Verma, S., Gupta, N., Kiran, R. and Pathak, A. (2016) ‘Can solar pumps energize Bihar’s agriculture?’, International Water Management Institute, 3, p. 8. Available at: http: www.iwmi-tata.blogspot.in.
Dutta, P., Murgai, R., Ravallion, M., Van, D. DE, Van Walle, D. DE, Galasso, E., Gottret, P. and Mansuri, G. (2012) ‘Does India’s Employment Guarantee Scheme Guarantee Employment?’, Economic and Political Weekly, 47(21), pp. 55–64.
Edquist, C. (1997) Systems of Innovation. London: Routledge. Available at: https://www.taylorfrancis.com/books/9780203357620.
Edquist, C. (2005) ‘Systems of Innovation: Perspectives and Challenges’, in Fagerberg, J., Mowery, D., and Nelson, R. (eds) The Oxford Handbook of Innovation. Oxford: Oxford University Press, pp. 181–208. Available at: http://oxfordhandbooks.com/view/10.1093/oxfordhb/9780199286805.001.0001/oxfordhb-9780199286805-e-7.
Edwards, E. O. (1974) Employment in developing nations : report on a Ford Foundation study. New York: Columbia University Press.
Feder, G., Just, R. E., Zilberman, D. and Bank, W. (2012) ‘Adoption of agricultural innovations in developing countries: A survey’, Economic Development and Cultural Change, 33(2), pp. 255–298.
Feitelson, E. (2013) Water Policy in Israel: Context, Issues and Options. Edited by N. Becker. Dordrecht,

420
Heidelberg, New York, London: Springer. doi: 10.1007/978-94-007-5911-4.
Fernandes, V. (2015) ‘Nitish’s Rice Revolution in Bihar is Stalling: Agro-Scientists Look for a New Formula’, FirstPost, 8 June. Available at: https://www.firstpost.com/business/nitishs-rice-revolution-bihar-stalling-agro-scientists-look-new-formula-2284512.html.
Fischer, R. A., Byerlee, D. and Edmeades, G. O. (2009) ‘Can technology deliver on the yield challenge to 2050?’, in Expert Meeting on How to Feed the World in 2050? Rome, 12-13 October. Available at: http://www.fao.org/3/a-ak977e.pdf.
Fischhendler, I. (2008) ‘Institutional conditions for IWRM: the Israeli case.’, Ground water, 46(1), pp. 91–102. doi: 10.1111/j.1745-6584.2007.00383.x.
Fishman, R., Devineni, N. and Raman, S. (2015) ‘Can improved agricultural water use efficiency save India’s groundwater?’, Environmental Research Letters. IOP Publishing, 10(8), p. 084022. doi: 10.1088/1748-9326/10/8/084022.
Freeman, C. (1987) Technology, policy, and economic performance : lessons from Japan. Pinter Publishers.
Friedlander, L., Tal, A. and Lazarovitch, N. (2013) ‘Technical considerations affecting adoption of drip irrigation in sub-Saharan Africa’, Agricultural Water Management, 126, pp. 125–132. doi: 10.1016/j.agwat.2013.04.014.
Fuenfschilling, L. and Truffer, B. (2014) ‘The structuration of socio-technical regimes—Conceptual foundations from institutional theory’, Research Policy, 43(4), pp. 772–791. doi: 10.1016/j.respol.2013.10.010.
Fulginiti, L. E., Perrin, R. K. and Yu, B. (2004) ‘Institutions and agricultural productivity in Sub-Saharan Africa’, Agricultural Economics. Blackwell Publishing Ltd, 31(2–3), pp. 169–180. doi: 10.1111/j.1574-0862.2004.tb00255.x.
Gajigo, O. and Lukoma, A. (2011) Infrastructure and agricultural productivity in Africa. African Development Bank, Market Brief. Available at: https:www.adb.org.
Garb, Y. and Friedlander, L. (2014) ‘From transfer to translation: Using systemic understandings of technology to understand drip irrigation uptake’, Agricultural Systems, 128, pp. 13–24. doi: 10.1016/j.agsy.2014.04.003.
Gates, M. (2007) ‘Malaria Forum Keynote Address’, Gates Foundation Malaria Forum, October.
Geels, F. W. (2002) ‘Technological transitions as evolutionary reconfiguration processes: a multi-level perspective and a case-study’, Research Policy, 31(8–9), pp. 1257–1274. doi: 10.1016/S0048-7333(02)00062-8.
Geels, F. W. (2004) ‘From sectoral systems of innovation to socio-technical systems: Insights about dynamics and change from sociology and institutional theory’, Research Policy, 33(6–7), pp. 897–920. doi: 10.1016/j.respol.2004.01.015.
Geels, F. W. (2005) ‘The dynamics of transitions in socio-technical systems: A multi-level analysis of the transition pathway from horse-drawn carriages to automobiles (1860–1930)’, Technology Analysis
421
& Strategic Management, 17(4), pp. 445–476. doi: 10.1080/09537320500357319.
Geels, F. W. (2011) ‘The multi-level perspective on sustainability transitions: Responses to seven criticisms’, Environmental Innovation and Societal Transitions, 1(1), pp. 24–40. doi: 10.1016/j.eist.2011.02.002.
Geels, F. W., Kern, F., Fuchs, G., Hinderer, N., Kungl, G., Mylan, J., Neukirch, M. and Wassermann, S. (2016) ‘The enactment of socio-technical transition pathways: A reformulated typology and a comparative multi-level analysis of the German and UK low-carbon electricity transitions (1990–2014)’, Research Policy, 45(4), pp. 896–913. doi: 10.1016/j.respol.2016.01.015.
George, G., McGahan, A. M. and Prabhu, J. (2012) ‘Innovation for Inclusive Growth: Towards a Theoretical Framework and a Research Agenda’, Journal of Management Studies, 49(4), pp. 661–683. doi: 10.1111/j.1467-6486.2012.01048.x.
GGGI (2015) Implementation Roadmap for Karnataka Micro Irrigation Policy. New Delhi.
Giddens, A. (1986) The constitution of society: Outline of the theory of structuration. Berkeley: University of California Press.
Gieryn, T. F. (1983) ‘Boundary-Work and the Demarcation of Science from Non-Science: Strains and Interests in Professional Ideologies of Scientists’, American Sociological Review, 48(6), p. 781. doi: 10.2307/2095325.
Gieryn, T. F. (1995) ‘Boundaries of Science’, in Science and the Quest for Reality. London: Palgrave Macmillan UK, pp. 293–332. doi: 10.1007/978-1-349-25249-7_12.
Glaser, B. G. and Strauss, A. L. (1967) The Discovery of Grounded Theory: Strategies for Qualitative Research. New Brunswick (USA) and London (UK): Aldine Transaction.
Gleick, P. (2009) The Biennial Report on Freshwater Resources, The World’s Water Volume. Washington D.C.: Island Press.
Glover, D. (2011) ‘Science, practice and the System of Rice Intensification in Indian agriculture’, Food Policy. Elsevier Ltd, 36(6), pp. 749–755. doi: 10.1016/j.foodpol.2011.07.008.
Glover, D. (2011) ‘The System of Rice Intensification: Time for an empirical turn’, Technography and Interdisciplinarity: Performance, Practices and Experiments. Royal Netherlands Society for Agriculture Sciences, 57(3–4), pp. 217–224. doi: DOI: 10.1016/j.njas.2010.11.006.
Glover, D. (2012) ‘Reply to Comment to: “The System of Rice Intensification: Time for an empirical turn”, by D. Glover’, NJAS - Wageningen Journal of Life Sciences. Elsevier, 59(1–2), pp. 61–62. doi: 10.1016/J.NJAS.2012.02.002.
Goesling, B. (2001) ‘Changing Income Inequalities within and between Nations: New Evidence’, American Sociological Review, 66(5), pp. 745–761.
Goldberg, R. A., Knoop, C.-I. and Preble, M. (2011) ‘Jain Irrigation Systems Limited: More Crop Per Drop’, Harvard Business School Case, (N9-911–419).
Government of Bangladesh (2006) Agriculture Governance in Bangladesh: A Survey of S Thanas. Dhaka.

422
Available at: http://www.un-bd.org/Docs/Publication/Volume IV Survey.Pdf.
Government of Bihar (2008) Road Map for Agriculture and Allied Sectors.
Government of Bihar (2012) 2012-2017 Agricultural Road Map.
Government of Bihar (2015) Economic Survey 2014-2015. Available at: http://www.finance.bih.nic.in/Reports/Economic-Survey-2015-EN.pdf.
Government of India (2010) National Mission on Micro Irrigation: Operational Guidelines. New Delhi. Available at: http://www.nccd.gov.in/PDF/Guidelines-NMMI.pdf.
Government of India (2012) Agriculture Census 2010-11: All India Report on Number and Area of Operational Holding. Department of Agriculture. Available at: http://agcensus.nic.in/document/agcensus2010/agcen2010rep.htm.
Government of India (2014) Department of Agriculture and Cooperation: Annual Report 2013-2014. New Delhi.
Govt. of India (2001) ‘Census of India’.
Griliches, Z. (1981) ‘Market value, R&D, and patents’, Economics Letters, 7(2), pp. 183–187. doi: 10.1016/0165-1765(87)90114-5.
Gross, P. R. and Levitt, N. (1994) Higher Superstition: The Academic Left and its Quarrels with Science. Baltimore, MD: Johns Hopkins University Press.
Gruère, G. and Sengupta, D. (2011) ‘Bt Cotton and Farmer Suicides in India: An Evidence-based Assessment’, Journal of Development Studies, 47(2), pp. 316–337. doi: 10.1080/00220388.2010.492863.
Guha, R. (2007) India After Gandhi: the History of the World’s Largest Democracy. 1st edn. New York: Ecco.
Gupta, A. K. (2016) Grassroots Innovation: Minds on the Margin are not Marginal Minds. Gurgaon, India: Penguin Books India.
Guston, D. H. (2001) ‘Boundary Organizations in Environmental Policy and Science: An Introduction’, Science, Technology, & Human Values. Sage PublicationsSage CA: Thousand Oaks, CA, 26(4), pp. 399–408. doi: 10.1177/016224390102600401.
Hake, J. F., Fischer, W., Venghaus, S. and Weckenbrock, C. (2015) ‘The German Energiewende – History and status quo’, Energy. Elsevier Ltd, 92, pp. 532–546. doi: 10.1016/j.energy.2015.04.027.
Hall, A., Bockett, G., Taylor, S., Sivamohan, M. V. K. and Clark, N. (2001) ‘Why Research Partnerships Really Matter: Innovation Theory, Institutional Arrangements and Implications for Developing New Technology for the Poor’, World Development, 29(5), pp. 783–797. doi: 10.1016/S0305-750X(01)00004-3.
Hamilton, S. F. and Sunding, D. (1998) ‘Returns to Public Investments in Agriculture with Imperfect Downstream Competition’, American Journal of Agricultural Economics, 80(4), pp. 830–838. doi: 10.2307/1244067.

423
Hannay, B. N. and McGinn, R. E. (1980) ‘The Anatomy of Modern Technology: Prolegomenon to an Improved Public Policy for the Social Management of Technology’, Daedalus, 109(1), pp. 25–53.
Hanson, B. and May, D. (2003) ‘Drip irrigation increases tomato yields in salt-affected soil of San Joaquin Valley’, California Agriculture, 57(4), pp. 132–137. doi: 10.3733/ca.v057n04p132.
Hardoon, D. (2017) An Economy for the 99%: It’s time to build a human economy that benefits everyone, not just the privileged few. Oxford. doi: 10.21201/2017.8616.
Harley, A. G., Holbrook, M. and Clark, W. C. (2015) Innovation for Vulnerable Farmers: Drought and Water Scarcity Adaptation Technologies. Cambridge, Massachusetts. Available at: https://dash.harvard.edu/bitstream/handle/1/22341420/Harley_2015-01 vulnerable farmers.pdf?sequence=1.
Hayami, Y. (1981) ‘Agrarian Problems of India: An East and Southeast Asian Perspective’, Economic & Political Weeekly, 16(16), pp. 707–712.
Hayami, Y. and Ruttan, V. W. (1971) Agricultural development: An international perspective. Baltimore: Johns Hopkins Press.
Hayami, Y. and Ruttan, V. W. (1984) ‘Toward a theory of induced institutional innovation’, Journal of Development Studies, 20, pp. 203–223. doi: 10.1080/00220388408421914.
Hekkert, M. P., Suurs, R. A. A., Negro, S. O., Kuhlmann, S. and Smits, R. E. H. M. (2007) ‘Functions of innovation systems: A new approach for analysing technological change’, Technological Forecasting and Social Change, 74(4), pp. 413–432. doi: 10.1016/j.techfore.2006.03.002.
Hellin, J. (2012) ‘Agricultural Extension, Collective Action and Innovation Systems: Lessons on Network Brokering from Peru and Mexico’, The Journal of Agricultural Education and Extension. Taylor & Francis Group , 18(2), pp. 141–159. doi: 10.1080/1389224X.2012.655967.
Henao, J. and Baanante, C. (2006) Agricultural production and soil nutrient mining in Africa: implications for resource conservation and policy development. IFDC - International Center for Soil Fertility and Agricultural Development.
Henderson, R. M. and Clark, K. B. (1990) ‘Architectural Innovation: The Reconfiguration of Existing Product Technologies and the Failure of Established Firms’, Administrative Science Quarterly. Sage Publications, Inc.Johnson Graduate School of Management, Cornell University, 35(1), p. 9. doi: 10.2307/2393549.
Hoda, A., Rajkhowa, P. and Gulati, A. (2017) Unleashing Bihar’s Agriculture Potential: Sources and Drivers of Agriculture Growth. Working Paper 336.
Honey Bee Network (no date) About Us. Available at: http://www.sristi.org/hbnew/aboutus.php (Accessed: 21 January 2018).
Howell, T. A. (2001) ‘Enhancing Water Use Efficiency in Irrigated Agriculture’, Agronomy Journal, 93(2), pp. 281–28. doi: 10.2134/agronj2001.932281x.
Hussain, I. and Hanjra, M. (2004) ‘Irrigation and poverty alleviation: review of the empirical evidence’, Irrigation and Drainage, 53(1), pp. 1–15.

424
Ibragimov, N., Evett, S. R., Esanbekov, Y., Kamilov, B. S., Mirzaev, L. and Lamers, J. P. A. (2007) ‘Water use efficiency of irrigated cotton in Uzbekistan under drip and furrow irrigation’, Agricultural Water Management, 90(1–2), pp. 112–120. doi: 10.1016/j.agwat.2007.01.016.
ICID (2005) International Commission on Irrigation and Drainage, Canadian Research Index. doi: 10.2499/0896299139.
ICID (2012) Annual Report: International Commission on Irrigation and Drainage.
ICIMOD (2015) ‘Reviving springs and providing access to solar powered irrigation pumps (SPIP) through community based water use planning’, in Launch Workshop, pp. 1–22.
IFAD (2016) Rural Development Report 2016 Fostering inclusive rural transformation. Available at: https://www.ifad.org/documents/30600024/30604583/RDR_WEB.pdf/c734d0c4-fbb1-4507-9b4b-6c432c6f38c3.
Inoni, O. E. and Omotor, D. G. (2009) ‘Review articles: Effect of road infrastructure on agricultural output and income of rural households in Delta State, Nigeria’, Agricultura Tropica Et Subtropica, 42(2), pp. 90–97.
IRRI (2014) System of Rice Intensification (SRI). Available at: http://irri.org/news/hot-topics/system-of-rice-intensification-sri (Accessed: 7 March 2017).
IRRI (2018) IRRI - Our organization. Available at: http://irri.org/about-us/our-organization.
Irz, X., Lin, L., Thirtle, C. and Wiggins, S. (2001) ‘Agricultural productivity growth and poverty alleviation’, Development Policy Review, 19(4), pp. 449–466. doi: 10.1111/1467-7679.00144.
Jagwe, J., Machethe, C. and Ouma, E. (2010) ‘Transaction costs and smallholder farmers’ participation in banana markets in the Great Lakes Region of Burundi, Rwanda and the Democratic Republic of Congo’, African Journal of Agricultural and Resource Economics, 6(1), pp. 302–317.
James, J. (2009) ‘Leapfrogging in mobile telephony: A measure for comparing country performance’, Technological Forecasting and Social Change, 76(7), pp. 991–998. doi: 10.1016/j.techfore.2008.09.002.
de Janvry, A. and Sadoulet, E. (2010) ‘Agricultural growth and poverty reduction: Additional evidence’, World Bank Research Observer, 25(1), pp. 1–20. doi: 10.1093/wbro/lkp015.
Jasanoff, S. (1987) ‘Contested Boundaries in Policy-Relevant Science’, Social Studies of Science, 17(2), pp. 195–230. doi: 10.1177/030631287017002001.
Jasanoff, S. (1991) The Fifth Branch: Science Advisers as Policymakers. Cambridge, MA: Harvard University Press.
Jasanoff, S. (2003) ‘Technologies of humiliation: Citizen participation in governing science’, Minerva, 41(3), pp. 223–244. doi: 10.2307/41821248.
Jasanoff, S. (2004) States of knowledge: The co-production of science and the social order. London: Routledge. doi: 10.4324/9780203413845.
Jasanoff, S. (2017) ‘A field of its own: The emergence of science and technology studies’, in Frodeman,

425
R. (ed.) The Oxford Handbook of Interdisciplinarity 2nd Edition. Oxford: Oxford University Press, pp. 173–187. doi: 10.1093/oxfordhb/9780198733522.013.15.
Jasanoff, S. and Kim, S. H. (2009) ‘Containing the Atom: Sociotechnical Imaginaries and Nuclear Power in the United States and South Korea’, Minerva, 47(2), pp. 119–146. doi: 10.1007/s11024-009-9124-4.
Jasanoff, S. S. (2010) Ordering Knowledge, Ordering Society,” in States of Knowledge - The co-production of science and social order. Routledge.
Jayachandran, S. and Pande, R. (2015) Why Are Indian Children So Short? NBER Working Paper No. 21036.
Jayne, T. S., Mather, D. and Mghenyi, E. (2010) ‘Principal Challenges Confronting Smallholder Agriculture in Sub-Saharan Africa’, World Development, 38(10), pp. 1384–1398. doi: 10.1016/j.worlddev.2010.06.002.
Jensen, A. R. (1975) ‘The Price of Inequality’, Oxford Review of Education, 1(1), pp. 59–71. doi: 10.1080/0305498750010107.
Jha, G. (2011) ‘Dalit MLA is Bihar CM’s rice choice’, Mail Today, 31 January.
Jick, T. D. (1979) ‘Mixing Qualitative and Quantitative Methods: Triangulation in Action’, Administrative Science Quarterly, 24(4), p. 602. doi: 10.2307/2392366.
Johnston, B. F. and Clark, W. C. (1982) Redesigning Rural Development: A Strategic Perspective. Baltimore, MD: The Johns Hopkins University Press.
Jones, C. and Williams, J. (1998) ‘Measuring the social return to R&D’, The Quarterly Journal of Economics. Oxford University Press, 113(4), pp. 1119–1135. doi: 10.1162/003355398555856.
Kanayo, F. N. (2011) Smallholders Can Feed the World. Rome. Available at: http://www.ifad.org/pub/viewpoint/smallholder.pdf.
Kates, R. W. and Haarmann, V. (1992) ‘Where the poor live: Are the assumptions correct?’, Environment, 34(4), pp. 4–28. doi: 10.1080/00139157.1992.9932557.
Kaul, I., Conceicao, P., Goulven, K. Le and Mendoza, R. U. (eds) (2003) Providing Global Public Goods. New York: Oxford University Press.
Keller, J. and Blisner, R. (1990) Sprinkle and Trickle Irrigation. New York, NY: Chapman and Hall.
Kelley, L. C., Gilbertson, E., Sheikh, A., Eppinger, S. D. and Dubowsky, S. (2010) ‘On the feasibility of solar-powered irrigation’, Renewable and Sustainable Energy Reviews, 14(9), pp. 2669–2682. doi: 10.1016/j.rser.2010.07.061.
Kemp, R. and Loorbach, D. (2007) ‘Transition management as a model for managing processes of co-evolution towards sustainable development’, International Journal of Sustainable Development, 14(1), pp. 78–91. doi: 10.1080/13504500709469709.
Keusch, G. T., Kilama, W. L., Moon, S., Szlezák, N. A. and Michaud, C. M. (2010) ‘The Global Health System: Linking Knowledge with Action—Learning from Malaria’, PLoS Medicine, 7(1), p.
426
e1000179. doi: 10.1371/journal.pmed.1000179.
Kharas, H., McArthur, J., Gertz, G., Mowlds, S. and Noe, L. (1994) ‘Executive summary’, ASHE Higher Education Report, 23(7), pp. iii–vii. doi: 10.1002/aehe.3640230702.
Kikulwe, E. M., Fischer, E. and Qaim, M. (2014) ‘Mobile Money, Smallholder Farmers, and Household Welfare in Kenya’, PLoS ONE. Edited by A. Mahal, 9(10), p. e109804. doi: 10.1371/journal.pone.0109804.
Kilelu, C. W., Klerkx, L. and Leeuwis, C. (2013) ‘Unravelling the role of innovation platforms in supporting co-evolution of innovation: Contributions and tensions in a smallholder dairy development programme’, Agricultural Systems, 118, pp. 65–77. doi: 10.1016/j.agsy.2013.03.003.
Kishore, A. (2014) ‘Agrarian Impasse Understanding in Bihar’, Economic and Political Weekly, 39(31), pp. 3484–3491.
Kishore, A., Joshi, P. K. and Pandey, D. (2014) Droughts, distress, and policies for drought proofing agriculture in Bihar, India. December 31. IFPRI Discussion Paper 01398. Available at: http://ebrary.ifpri.org/utils/getfile/collection/p15738coll2/id/128868/filename/129079.pdf.
Kishore, A., Joshi, P. K. and Pandey, D. (2015) ‘Drought, distress, and a conditional cash transfer programme to mitigate the impact of drought in Bihar, India’, Water International, 40(3), pp. 417–431. doi: 10.1080/02508060.2015.1050579.
Kishore, A., Joshi, P. and Pandey, D. (2017) ‘Harnessing the sun for an evergreen revolution: a study of solar-powered irrigation in Bihar, India’, Water International, 42(3), pp. 291–307. doi: 10.1080/02508060.2017.1312085.
Kishore, A. and Mishra, K. (2005) ‘Cost of Energy for Irrigation and Agrarian Dynamism in Eastern Uttar Pradesh’, International Water Management Institute, 21, p. 7.
Kishore, A., Shah, T. and Tewari, N. (2014) ‘Solar Powered Irrigation Pumps: Farmers’ Experience and State Policy in Rajasthan’, Economic & Political Weekly, 49(10), pp. 55–62. Available at: http://ebrary.ifpri.org/utils/getfile/collection/p15738coll2/id/128216/filename/128427.pdf.
Kishore, A., Sharma, B. and Joshi, P. K. (2014) Putting agriculture on the takeoff trajectory: Nurturing the seeds of growth in Bihar, India.
Kislev, Y. and Shchori-Bachrach, N. (1973) ‘The Process of an Innovation Cycle’, American Journal of Agricultural Economics, 55(1), pp. 28–37. doi: 10.2307/1238658.
Klerkx, L. and Leeuwis, C. (2009) ‘Establishment and embedding of innovation brokers at different innovation system levels: Insights from the Dutch agricultural sector’, Technological Forecasting and Social Change, 76(6), pp. 849–860. doi: 10.1016/j.techfore.2008.10.001.
Kochar, A. (1997) ‘Does Lack of Access to Formal Credit Constrain Agricultural Production? Evidence from the Land Tenancy Market in Rural India’, American Journal of Agricultural Economics. Oxford University Press - Agricultural & Applied Economics Association, 79(3), pp. 754–763. doi: 10.2307/1244417.
Van der Kooij, S., Zwarteveen, M., Boesveld, H. and Kuper, M. (2013) ‘The Efficiency of Drip Irrigation

427
Unpacked’, Agricultural Water Management. Elsevier B.V., 123, pp. 103–110. doi: 10.1016/j.agwat.2013.03.014.
Krishnan, A. (2013) ‘Bihar’s claim of rice record “fake,” says top China scientist’, The Hindu, 22 February. Available at: http://www.thehindu.com/news/national/other-states/bihars-claim-of-rice-record-fake-says-top-china-scientist/article4439924.ece.
Kristjanson, P., Reid, R. S., Dickson, N., Clark, W. C., Romney, D., Puskur, R., MacMillan, S. and Grace, D. (2009) ‘Linking international agricultural research knowledge with action for sustainable development’, Proceedings of the National Academy of Sciences, 106(13), pp. 5047–5052. doi: 10.1073/pnas.0807414106.
Kuhn, T. S. (1962) The structure of scientific revolutions. Chicago: University of Chicago Press.
Kumar, A. K. S. (2011) ‘Why are levels of child malnutrition high ?’, Economic and Political Weekly, 42(15), pp. 2007–2009.
Kumar, M. D., Scott, C. A. and Singh, O. P. (2013) ‘Can India raise agricultural productivity while reducing groundwater and energy use?’, International Journal of Water Resources Development, 29(4), pp. 557–573. doi: 10.1080/07900627.2012.743957.
Kumar, R. (2013) ‘For Farmers in Bihar, A Simple Solution for More Crops’, New York Times, April.
Kumar, R. M., Gopalakrishnan, S., Surekha, K., Padmavathi, C., Soma Shekhar, N., Muthuraman, P., Prasad, M., Srinivas, D., Brajendra, P. and Latha, P. (2017) ‘Influence of different methods of rice (oryza sativa l.) cultivation on microbes, soil health, water productivity and grain yield’, Journal of Pharmacognosy and Phytochemistry, 6(6S), pp. 394–399. Available at: http://www.phytojournal.com/archives/2017/vol6issue6S/PartI/SP-6-6-92.pdf.
Lamers, D., Schut, M., Klerkx, L. and van Asten, P. (2017) ‘Compositional dynamics of multilevel innovation platforms in agricultural research for development’, Science and Public Policy, 44(6), pp. 739–752. doi: 10.1093/scipol/scx009.
De Laulanié, H. (1993) ‘Le Système de Riziculture Intensive Malgache’, Tropicultura, 11(3), pp. 110–114.
De Laulanié, H. (2011) ‘Intensive Rice Farming in Madagascar’, Tropicultura. Agri-Overseas, 29(3), pp. 183–187. Available at: http://www.tropicultura.org/text/v29n3/183.pdf (Accessed: 30 December 2017).
Leach, M., Scoones, I. and Stirling, A. (2007) Pathways to Sustainability: an overview of the STEPS Centre approach. Brighton: STEPS Centre.
Lichtenberg, E. (2004) ‘Cost-Responsiveness of Conservation Practice Adoption : A Revealed Preference Approach’, Journal of Agricultural and Resource Economics, 29(3), pp. 420–435. Available at: www.jstor.org/stable/40987242.
Liebrand, J. (2017) ‘Drip irrigation and state subsidies in India: understanding the success of the Gujarat Green Revolution Company’, in Venot, J.-P., Kuper, M., and Zwarteveen, M. (eds) Drip Irrigation for Agriculture: Untold Stories of Efficiency, Innovation and Development. London: Routledge, pp. 303–323. doi: 10.4324/9781315537146.

428
Liu, Y. and Barrett, C. (2012) Heterogeneous Pro-Poor Targeting in India’s Mahatma Gandhi National Rural Employment Guarantee Scheme. 01218.
Loorbach, D., Frantzeskaki, N. and Avelino, F. (2017) ‘Sustainability Transitions Research: Transforming Science and Practice for Societal Change’, Annual Review of Environment and Resources, 41(1), pp. 1–35. doi: 10.1146/annurev-environ-102014-021340.
Lundvall, B. (ed.) (1992) National systems of innovation: towards a theory of innovation and interactive learning. London: Pinter Publishers.
Lundvall, B. (2007) ‘National Innovation Systems—Analytical Concept and Development Tool’, Industry & Innovation, 14(1), pp. 95–119. doi: 10.1080/13662710601130863.
Maisiri, N., Senzanje, A., Rockstrom, J. and Twomlow, S. J. (2005) ‘On farm evaluation of the effect of low cost drip irrigation on water and crop productivity compared to conventional surface irrigation system’, Physics and Chemistry of the Earth, 30, pp. 783–791.
Maithani, P. C. and Gupta, D. (2015) Achieving Universal Energy Access. New Delhi, India: Sage Publications India Pvt Ltd.
Mandemaker, M., Bakker, M. and Stoorvogel, J. (2011) ‘The role of governance in agricultural expansion and intensification: A global study of arable agriculture’, Ecology and Society. The Resilience Alliance, 16(2). doi: 10.5751/ES-04142-160208.
Mani, A., Mullainathan, S., Shafir, E. and Zhao, J. (2013) ‘Poverty Impedes Cognitive Function’, Science, 341(6149), pp. 976–980. doi: 10.1126/science.1238041.
March, J. G. and Olsen, J. P. (2009) ‘The Logic of Appropriateness’, in Goodin, R. E., Moran, M., and Rein, M. (eds) The Oxford Handbook of Public Policy. Oxford University Press. doi: 10.1093/oxfordhb/9780199548453.003.0034.
Markard, J., Raven, R. and Truffer, B. (2012) ‘Sustainability transitions: An emerging field of research and its prospects’, Research Policy, 41(6), pp. 955–967. doi: 10.1016/j.respol.2012.02.013.
Markelova, H., Meinzen-Dick, R., Hellin, J. and Dohrn, S. (2009) ‘Collective action for smallholder market access’, Food Policy, 34(1), pp. 7–14. doi: https://doi.org/10.1016/j.foodpol.2008.10.001.
Matson, P., Clark, W. C. and Andersson, K. (2016) Pursuing Sustainability: A Guide to the Science and Practice. Princeton, NJ: Princeton University Press.
Mazzucato, M. (2013) The Entrepeneurial State: Debunking Public vs. Private Sector Myths. New York: Anthem Press. doi: https://doi.org/10.1093/scipol/scu071.
Mazzucato, M. (2016) ‘From market fixing to market-creating: a new framework for innovation policy’, Industry and Innovation, 23(02), pp. 140–156. doi: 10.1080/13662716.2016.1146124.
McCullough, E. and Matson, P. (2012) ‘Linking knowledge with action for sustainable development: A case study of change and effectiveness’, in Maston, P. (ed.) Seeds of sustainability. Washington D.C.: Island Press, pp. 63–82. doi: 10.5822/978-1.
Mcdonald, A. J., Hobbs, P. R. and Riha, S. J. (2006) ‘Does the system of rice intensification outperform

429
conventional best management?A synopsis of the empirical record’, Field Crops Research, 96(1), pp. 31–36. doi: 10.1016/j.fcr.2005.05.003.
Meinzen-Dick, R. (2011) ‘Property Rights for Poverty Reduction?’, in Sundaram, J. and Chowdhury, A. (eds) Poor poverty: The impoverishment of analysis, measurement and policies. Bloomsbury Academic.
Meinzen-Dick, R. and Gregorio, M. Di (2004) Collective action and property rights for sustainable development. Available at: http://dlc.dlib.indiana.edu/dlc/bitstream/handle/10535/3916/focus11.pdf?sequence=1&isAllowed=y
Menon, P., Deolalikar, A. and Bhaskar, A. (2009) India State Hunger Index. Washington DC.
Milanovic, B. (2013) ‘Global Income Inequality in Numbers: in History and Now’, Global Policy, 4(2), pp. 198–208. doi: 10.1111/1758-5899.12032.
Milanovic, B. (2016) Global Inequality: A New Approach for the Age of Globalization. Harvard University Press.
Ministry of Rural Development (GoI) (2009) Report of the Committee on State Agrarian Relations and the Unfinished Task in Land Reforms. New Delhi.
Moon, S., Bermudez, J. and ’t Hoen, E. (2012) ‘Innovation and Access to Medicines for Neglected Populations: Could a Treaty Address a Broken Pharmaceutical R&D System?’, PLoS Medicine. Public Library of Science, 9(5), p. e1001218. doi: 10.1371/journal.pmed.1001218.
Moser, C. and Barrett, C. (2003) ‘The disappointing adoption dynamics of a yield-increasing, low external-input technology: the case of SRI in Madagascar’, Agricultural Systems, 76(3), pp. 1085–1100. doi: 10.1016/S0308-521X(02)00041-0.
Moser, C. M. and Barrett, C. B. (2006) ‘The complex dynamics of smallholder technology adoption: The case of SRI in Madagascar’, Agricultural Economics, 35(3), pp. 373–388. doi: 10.1111/j.1574-0862.2006.00169.x.
Mueller, N. D. and Binder, S. (2015) ‘Closing Yield Gaps: Consequences for the Global Food Supply, Environmental Quality & Food Security’, Daedalus, 144(4), pp. 45–56. doi: 10.1162/DAED_a_00353.
Mukherji, A. (2005) ‘The spread and extent of irrigation rental market in India, 1976-77 to 1997-98: what does the national sample survey data reveal?’, IWMI-Tata Water Policy Research Highlight.
Mukherji, A. (2006) ‘Political ecology of groundwater: the contrasting case of water-abundant West Bengal and water-scarce Gujarat, India’, Hydrogeology Journal, 14(3), pp. 392–406. doi: 10.1007/s10040-005-0007-y.
Mukherji, A. (2007) ‘The energy-irrigation nexus and its impact on groundwater markets in eastern Indo-Gangetic basin: Evidence from West Bengal, India’, Energy Policy, 35(12), pp. 6413–6430. doi: 10.1016/j.enpol.2007.08.019.
Mukherji, A. and Mukherji, A. (2012) Bihar: What Went Wrong? And What Changed? 12/107.

430
Murthy, S. L., Bichai, F., Davis, S., Williams, M., Kajenthira, A. and Lantagne, D. (2013) Water Sector Discussion Paper: Background Paper for the Project on Innovation and Access to Technologies for Sustainable Development. Cambridge, Massachusetts.
Nadimi, F. (2012) ‘Award for Nalanda farmers at India International Expo | Patna News - Times of India’, The Times of India, December. Available at: https://timesofindia.indiatimes.com/city/patna/Award-for-Nalanda-farmers-at-India-International-Expo/articleshow/17725558.cms.
Narayan, D. (1997) Voices of the poor: poverty and social capital in Tanzania, Environmentally and socially sustainable development studies and monographs: Series 20. Washington D.C.: The World Bank.
Narayanamoorthy, A. and Hanjra, M. A. (2006) ‘Rural infrastructure and agricultural output linkages: A study of 256 Indian districts’, Indian Journal of Agricultural Economics, 61(3), pp. 444–459.
Nature Plants (2017) ‘Editorial: Strategies for survival’, Nature Plants. Nature Publishing Group, 3(12), pp. 907–907. doi: 10.1038/s41477-017-0081-x.
Naylor, R. L., Falcon, W. P., Goodman, R. M., Jahn, M. M., Sengooba, T., Tefera, H. and Nelson, R. J. (2004) ‘Biotechnology in the developing world: a case for increased investments in orphan crops’, Food Policy, 29(1), pp. 15–44. doi: 10.1016/j.foodpol.2004.01.002.
Neckerman, K. M. and Torche, F. (2007) ‘Inequality: Causes and Consequences’, Annual Review of Sociology, 33(1), pp. 335–357. doi: 10.1146/annurev.soc.33.040406.131755.
Nelson, R. R. (1993) National Innovation Systems: A Comparative Analysis. Edited by R. R. Nelson. New York: Oxford University Press.
Nelson, R. R. and Nelson, K. (2002) ‘Technology, institutions, and innovation systems’, Research Policy, 31(2), pp. 265–272. doi: 10.1016/S0048-7333(01)00140-8.
Nestlé (2011) Popularly positioned products: Affordable and nutritious. Available at: http://www.wphna.org/htdocs/downloadsdec2012/2011_Nestle_PPPs.pdf.
North, D. C. (1990) Institutions, Institutional Change and Economic Performance, North. doi: 10.2307/2234910.
Oda, H. and Tsujita, Y. (2011) ‘The determinants of rural electrification: The case of Bihar, India’, Energy Policy, 39(6), pp. 3086–3095. doi: 10.1016/j.enpol.2011.02.014.
Odeh, I., Yohanis, Y. G. and Norton, B. (2006) ‘Economic viability of photovoltaic water pumping systems’, Solar Energy, 80(7), pp. 850–860. doi: 10.1016/j.solener.2005.05.008.
Olagunju, F. and Ajiboye, A. (2010) ‘Agricultural lending decision: a tobit regression analysis’, African Journal of Food, Agriculture, Nutrition and Development, 10(5), pp. 1–27. doi: 10.4314/ajfand.v10i5.57897.
Ololade R.A.; Olagunju, F. I. (2013) ‘Determinants of Access to Credit among Rural Farmers in Oyo State, Nigeria’, Global Journal of Science Frontier Research Agriculture and Veterinary Sciences, 13(2), pp. 16–22. Available at: https://globaljournals.org/GJSFR_Volume13/4-Determinants-of-

431
Access-to-Credit-among.pdf.
Ostrom, E. (1990) Governing the commons: The evolution of institutions for collective action. Cambridge, England: Cambridge University Press.
Ostrom, E., Janssen, M. A. and Anderies, J. M. (2007) ‘Going beyond panaceas.’, Proceedings of the National Academy of Sciences, 104(39), pp. 15176–15178. doi: 10.1073/pnas.0701886104.
Otieno, O. D. (2012) Impact of Farmer Groups on Crop Enterprise Productivity and Economic Welfare of Smallholder Farmers in South Kivu Territories, Democratic Republic of Congo. Egerton University.
Palanisami, K., Mohan, K., Kakumanu, K. R. and Raman, S. (2011) ‘Spread and Economics of Micro-irrigation in India: Evidence from Nine States’, Economic and Political Weekly, xivi(26 & 27), pp. 81–86.
Palanisami, K. and Raman, S. (2012) ‘Potential and Challenges in Up-scaling Micro-irrigation in India: Experiences from Nine States’, IWMI-TATA Water Policy Program: Water Policy Research Highlight, 20(30), pp. 95–96.
Panagariya, A. (2012) ‘Understanding the Bihar miracle’, The Times of India, July. Available at: https://timesofindia.indiatimes.com/edit-page/Understanding-the-Bihar-miracle/articleshow/15211222.cms.
Pandey, A. (2016) ‘System of Rice Intensification (SRI) Methods in Bihar: A District Level Study’, Journal of Rural Development. National Institute of Rural Development, 35(2), pp. 211–237.
Parayil, G. (1992) ‘The Green Revolution in India: A Case Study of Technological Change’, Technology and Culture. The Johns Hopkins University Press - Society for the History of Technology, 33(4), p. 737. doi: 10.2307/3106588.
Parthasarathy Rao, P. and Hall, A. J. (2003) ‘Importance of crop residues in crop-livestock systems in India and farmers’ perceptions of fodder quality in coarse cereals’, in Field Crops Research, pp. 189–198. doi: 10.1016/S0378-4290(03)00150-3.
Pasternak, D. (2008) The Evolution of Drip Irrigation-A Personal Account. Rishon Letzion, Israel; Niamey, Niger. Available at: https://www.yumpu.com/en/document/view/28776382/the-evolution-of-drip-irrigation-a-personal-account-cop-horti.
Paul, J. C., Mishra, J. N., Pradhan, P. L. and Panigrahi, B. (2013) ‘Effect of drip and surface irrigation on yield , water- use-efficiency and economics of capsicum ( capsicum annum l .) grown under mulch and non mulch conditions in eastern coastal india’, European Journal of Sustainable Development, 2(1), pp. 99–108.
Pavitt, K. (1995) ‘National Systems of innovation: Towards a theory of innovation and interactive learning’, Research Policy, 24(2), p. 320. doi: 10.1016/0048-7333(95)90017-9.
Phillip, D., Nkonya, E., Pender, J. and Oni, O. A. (2009) Constraints to Increasing Agricultural Productivity in Nigeria, International Food Policy Research Institute. IFPRI Review Paper.
Piketty, T. (2015) ‘Capital, Inequality and Justice: Reflections on Capital in the Twenty-First Century’,

432
Basic Income Studies, 10(1), pp. 141–156. doi: 10.1515/bis-2015-0014.
Pingali, P. L. (2012) ‘Green Revolution: Impacts, limits, and the path ahead’, Proceedings of the National Academy of Sciences, 109(31), pp. 12302–12308. doi: 10.1073/pnas.0912953109.
Place, F. and Otsuka, K. (2002) ‘Land tenure systems and their impacts on agricultural investments and productivity in Uganda’, Journal of Development Studies, 38(6), pp. 105–128. doi: 10.1080/00220380412331322601.
Place, F. and Otsuka, K. (2002) ‘Land Tenure Systems and Their Impacts on Agricultural Investments and Productivity in Uganda’, Journal of Development Studies, 38(6), pp. 105–128. doi: 10.1080/00220380412331322601.
Planning Commission (2011) Report of the Working Group On Employment, Planning & Policy for the Twelfth Five Year Plan (2012-2017).
Polyani, K. (2001) The Great Transformation. The Political and Economic Origins of Our Time. 2nd Beacon. Boston, MA: Beacon Press.
Postel, S. L., Daily, G. C. and Ehrlich, P. R. (1996) ‘Human Appropriation of Renewable Fresh Water’, Science, 271(5250), pp. 785–788. doi: 10.1126/science.271.5250.785.
Postel, S., Polak, P., Gonzales, F. and Keller, J. (2001) ‘Drip Irrigation for Small Farmers’, Water International, 26(1), pp. 3–13. doi: 10.1080/02508060108686882.
Pradhan, P., Fischer, G., van Velthuizen, H., Reusser, D. E. and Kropp, J. P. (2015) ‘Closing Yield Gaps: How Sustainable Can We Be?’, PLoS ONE. Edited by J. L. Gonzalez-Andujar, 10(6), p. e0129487. doi: 10.1371/journal.pone.0129487.
Prahladachar, M. (1983) ‘Income Distribution Effects on the Green Revolution in India: A Review of Empirical Evidence’, World Development, 11(11), pp. 927–944.
Prakash, A. (2005) The dark zone: groundwater irrigation, politics and social power in North Gujarat. Hyderabad, India: Orient Longman.
Prasad, C. S., Prajit, K. B. and Andrew, H. (2005) ‘Assessing System of Rice Intensification as a process: Evidence from India’, International Water Management Institute.
Prasad, S. (2006) ‘System of Rice Intensification in India: Innovation History and Institutional Challenges’. Bhubaneshwar, India: WWF International, pp. 1–77.
Pti (2017) ‘All villages in Bihar electrified, says Nitish Kumar’, The Hindu, December.
Pullabhotla, H., Kumar, C. and Verma, S. (2012) ‘Micro-irrigation subsidies in Gujarat and Andhra Pradesh implications for market dynamics and growth’, IWMI-TATA Water Policy Program: Water Policy Research Highlight, 43(43). Available at: http://dspace.ilri.org/handle/10568/36088.
Purohit, P. and Michaelowa, A. (2008) ‘CDM potential of SPV lighting systems in India’, Mitigation and Adaptation Strategies for Global Change, 13(1), pp. 23–46. doi: 10.1007/s11027-006-9078-x.
Qaim, M., Subramanian, A., Naik, G. and Zilberman, D. (2006) ‘Adoption of Bt Cotton and Impact Variability: Insights from India’, Review of Agricultural Economics, 28(1), pp. 48–58. doi:

433
10.1111/j.1467-9353.2006.00272.x.
Raff, H. and Wagner, J. (2013) ‘Productivity and the product scope of multi-product firms: A test of Feenstra-Ma’, Economics Bulletin. (World Institute for Development Economics Research), 33(1), pp. 415–419.
Raitha, S., Verma, S. and Durga, N. (2014) ‘Karnataka’s Smart, New Solar Pump Policy for Irrigation’, Economic & Political Weekly, pp. 10–14.
RAU (2017) About Pusa, Dr. Rajendra Prasad Central Agricultural University, Pusa. Available at: https://www.rpcau.ac.in/about-pusa/ (Accessed: 8 May 2018).
Reddy, K. Y. and Satyanarayana, T. V (2010) Micro Irrigation pays rich dividends – experiences of Andhra Pradesh, India. Available at: http://www.rid.go.th/thaicid/_6_activity/Technical-Session/SubTheme3/3.19-K_Yella_R-TV_Satyanarayana.pdf.
Research Nester (2017) Drip Irrigation Market: Global Demand, Growth Analysis and Opportunity Outlook 2023. Available at: https://www.researchnester.com/reports/drip-irrigation-market-global-demand-growth-analysis-opportunity-outlook-2023/209.
Reserve Bank of India (2015) Handbook of Statistics on Indian Economy. Available at: https://rbidocs.rbi.org.in/rdocs/Publications/PDFs/22SDP_240617B1BD6F0DBBEE409C8F393292CB3DEBB2.PDF.
Rodell, M., Velicogna, I. and Famiglietti, J. S. (2009) ‘Satellite-based estimates of groundwater depletion in India.’, Nature. Nature Publishing Group, 460(7258), pp. 999–1002. doi: 10.1038/nature08238.
Rorabacher, J. A. (2008) ‘Gerrymandering, Poverty and Flooding: A Perennial Story of Bihar’, Economic and Political Weekly, 43(7), pp. 45–53.
Ruttan, V. (1977a) ‘Induced innovation and agricultural development’, Food Policy, 2(3), pp. 196–216. doi: 10.1016/0306-9192(77)90080-X.
Ruttan, V. (1977b) ‘The Green Revolution: Seven Generalizations’, International Development Review, 19(4), pp. 16–24.
Ruttan, V. (2000) Technology, growth, and development: an induced innovation perspective. Oxford: Oxford University Press.
Sagasti, F. and Timmer, V. (2008) An Approach to the CGIAR as a Provider of International Public Goods: System-Wide Review of CGIAR System.
Samuelson, P. A. (1954) ‘The Pure Theory of Public Expenditure’, The Review of Economics and Statistics, 36(4), pp. 387–389.
Sayer, J. and Cassman, K. G. (2013) ‘Agricultural innovation to protect the environment.’, Proceedings of the National Academy of Sciences, 110(21), pp. 8345–8. doi: 10.1073/pnas.1208054110.
Schlager, E. and Ostrom, E. (1992) ‘Property-rights regimes and natural resources: a conceptual analysis’, Land economics.
Schultz, T. W. (1966) ‘Transforming Traditional Agriculture: Reply’, Journal of Farm Economics. New

434
Haven, CT: Yale University Press, 48(4), p. 1015. doi: 10.2307/1236629.
Schultz, T. W. (1980) ‘Nobel Lecture: The Economics of Being Poor’, Journal of Political Economy, 88(4), pp. 639–651. doi: 10.1086/260895.
Schumpeter, J. A. (1947) ‘Economic History Association The Creative Response in Economic History’, The Journal of Economic History. Cambridge University Press, 7(2), pp. 149–159. doi: 10.1017/S0022050700054279.
Schumpeter, J. A. (1982) Business Cycles: A Theoretical, Historical, and Statistical Analysis of the Capitalist Process. New York: McGraw-Hill Book Co.
Schut, M., Klerkx, L., Rodenburg, J., Kayeke, J., Hinnou, L. C., Raboanarielina, C. M., Adegbola, P. Y., van Ast, A. and Bastiaans, L. (2015) ‘RAAIS: Rapid Appraisal of Agricultural Innovation Systems (Part I). A diagnostic tool for integrated analysis of complex problems and innovation capacity’, Agricultural Systems, 132, pp. 1–11. doi: 10.1016/j.agsy.2014.08.009.
Scoones, I. and Thompson, J. (2009) Farmer first revisited:Innovation for Agricultural Research and Development. Rugby, UK: Practical Action Publishing.
Seawright, J. and Gerring, J. (2008) ‘Case Selection Techniques in Case Study Research’, Political Research Quarterly, 61(2), pp. 294–308. doi: 10.1177/1065912907313077.
Sehgal, V. K., Singh, M. R., Chaudhary, A., Jain, N. and Pathak, H. (2013) Vulnerability of Agriculture to Climate Change: District Level Assessment in the Indo-Gangetic Plains. New Delhi.
Sen, A. (1999) Development as Freedom. Oxford: Oxford University Press.
Sen, A. and Drèze, J. (2013) An Uncertain Glory. Princeton, NJ: Princeton University Press.
Sethy, J. P., Singh, D. R., RH, A. and Sharma, V. (2016) Adoption and Sustainability of Eco-Friendly SRI Method of Rice Cultivation in Bihar, Research Journal of Agricultural Sciences.
Shah, T. (2007) ‘Crop per Drop of Diesel? Energy Squeeze on India’s Smallholder Irrigation’, Economic and Political Weekly, 42(39), pp. 4002–4009. doi: 10.2307/40276478.
Shah, T. (2009) Taming the Anarchy: Groundwater Governance in South Asia. Washington, DC: Resources for the Future.
Shah, T. and Ballabh, V. (1997) ‘Water Markets in North Bihar: Six Village Studies in Muzaffarpur District’, Economic and Political Weekly, 32(52), pp. A183–A190. doi: 10.2307/4406234.
Shambu Prasad, C. (2009) ‘Conversations on knowledge and democracy: fables from SRI’, Seminar, 597(Knowledge in Question), pp. 2–6.
Sheehy, J. E., Ferrer, A. B. and Mitchell, P. L. (2008) ‘Harnessing Photosynthesis in Tomorrow’s World: Humans, Crop Production and Poverty Alleviation’, in Photosynthesis. Energy from the Sun. Dordrecht: Springer Netherlands, pp. 1237–1242. doi: 10.1007/978-1-4020-6709-9_267.
Sheehy, J. E. and Mitchell., P. L. (2013) ‘Designing rice for the 21st century: the three laws of maximum yield’, Discussion Paper Series. Los Banos, Philippines (Discussion Paper Series), (48), p. 19.
435
Sheehy, J. E., Peng, S., Dobermann, A., Mitchell, P. L., Ferrer, A., Yang, J., Zou, Y., Zhong, X. and Huang, J. (2004) ‘Fantastic yields in the system of rice intensification: fact or fallacy?’, Field Crops Research, 88(1), pp. 1–8. doi: 10.1016/j.fcr.2003.12.006.
Sheehy, J. E., Sinclair, T. R. and Cassman, K. G. (2005) ‘Curiosities, nonsense, non-science and SRI’, Field Crops Research, 91(2–3), pp. 355–356.
Shiva, V. and Jafri, A. (2004) Failure of GMOs in India, Synthesis/Regeneration. Available at: http://www.greens.org/s-r/33/33-04.html.
Shiva, V., Jafri, A. H., Emani, A. and Pande, M. (2000) ‘Seeds of suicide: the ecological and human costs of globalisation of agriculture.’ Research Found. for Science, Technology and Ecology.
Sinclair, T. R. (2004) ‘Agronomic UFOs waste valuable scientific resources’, Rice Today, 3(3), p. 43.
Sinclair, T. R. and Cassman, K. G. (2004) ‘Agronomic UFOs’, Field Crops Research, 88(1), pp. 9–10. doi: 10.1016/j.fcr.2004.01.001.
Singh, G. (2010) Final Report on Planning Commission Project Growth of Indian Agriculture : A District Level Study, Planning Commission of India Project Report. New Delhi.
Singh, N. K. and Stern, N. (2013) The New Bihar: Rekindling Governance and Development. Noida, Uttar Pradesh: Harper Collins Publishers India.
Sinha, D., Ahmad, N. and Singh, K. M. (2016) ‘Shrinking Net Sown Area: An Analysis of Changing Land Use Pattern in Bihar’, Journal of AgriSearch, 3(4), pp. 238–243. doi: org/10.2139/ssrn.2907238.
Sinha, S. K. (2013) Nitish Engineering: Reconstructing Bihar. New Delhi: Kalpaz Publications.
Smith, M. G. and Urpelainen, J. (2016) ‘Rural electrification and groundwater pumps in India: Evidence from the 1982-1999 period’, Resource and Energy Economics. Elsevier B.V., 45, pp. 31–45. doi: 10.1016/j.reseneeco.2016.05.004.
Sne, M. (1989) ‘The Role of Extension in Irrigation: The Israeli Experience’, in Le Moigne, G., Barghouti, S., and Plusquellec, H. (eds) Technological and Institutional Innovation in Irrigation. Washington D.C., pp. 128–136.
Sokal, A. D. (1996) ‘A Physicist Experiments With Cultural Studies’, Lingua Franca.
Solow, R. M. (1957) ‘Technical Change and the Aggregate Production Function’, The Review of Economics and Statistics, 39(3), pp. 312–320.
Songco, J. A. (2002) Do Rural Infrastructure Investments Benefit the Poor? Evaluating Linkages: a Global View, a Focus on Vietnam, Poverty Reduction and Economic Management Sector Unit. 2796. Washington D.C.
Sooksa-Nguan, T., Gypmantasiri, P., Boonkerd, N., Thies, J. E. and Teaumroong, N. (2010) ‘Changes in Bacterial Community Composition in the System of Rice Intensification (SRI) in Chiang Mai, Thailand’, Microbes and Environments. The Japanese Society of Soil Microbiology, 25(3), pp. 224–227. doi: 10.1264/jsme2.ME09184.

436
Spielman, D. J., Ekboir, J. and Davis, K. (2009) ‘The art and science of innovation systems inquiry: Applications to Sub-Saharan African agriculture’, Technology in Society, 31(4), pp. 399–405. doi: 10.1016/j.techsoc.2009.10.004.
Stakman, E. C., Bradfield, R. and Mangelsdorf, P. C. (1967) Campaigns Against Hunger. Cambridge: Harvard University Press.
Steward, F. (2012) ‘Transformative innovation policy to meet the challenge of climate change: sociotechnical networks aligned with consumption and end-use as new transition arenas for a low-carbon society or green economy’, Technology Analysis & Strategic Management, 24(4), pp. 331–343. doi: 10.1080/09537325.2012.663959.
Stiglitz, J., Sen, A. and Fitoussi, J. P. (2009) Report by the Commission on the Measurement of Economic Performance and Social Progress. Available at: http://ec.europa.eu/eurostat/documents/118025/118123/Fitoussi+Commission+report.
Stoop, W. A., Adam, A. and Kassam, A. (2009) ‘Comparing rice production systems: A challenge for agronomic research and for the dissemination of knowledge-intensive farming practices’, Agricultural Water Management, 96(11), pp. 1491–1501. doi: 10.1016/j.agwat.2009.06.022 ER.
Stoop, W. A., Uphoff, N. and Kassam, A. (2002) ‘A review of agricultural research issues raised by the system of rice intensification (SRI) from Madagascar: opportunities for improving farming systems for resource-poor farmers’, Agricultural Systems, 71(3), pp. 249–274. doi: 10.1016/S0308-521X(01)00070-1.
Sundig, D. and Zilberman, D. (1999) ‘The agricultural innovation process: Research and technology adoption in a changing agricultural sector’, in Handbook of Agricultural Economics. doi: 10.1016/S1574-0072(01)10007-1.
Surridge, C. (2002) ‘The rice squad’, Nature, 416(April), pp. 2–4.
Surridge, C. (2004) ‘Rice cultivation: Feast or famine?’, Nature, March, pp. 360–361. doi: 10.1038/428360a ER.
Takahashi, K. (2013) ‘The roles of risk and ambiguity in the adoption of the system of rice intensification (SRI): evidence from Indonesia’, Food Security, 5, pp. 513–524.
Takahashi, K. and Barrett, C. B. (2013) ‘The System of Rice Intensification and its impacts on household income and child schooling: evidence from rural Indonesia’, Amer. J. Agr. Econ, 96(1), pp. 269–289. doi: 10.1093/ajae/aat086.
The C4 Rice Project (2017) History of the C4 Rice Project. Available at: https://c4rice.com/the-project-2/our-history/ (Accessed: 7 March 2018).
The Times of India (2013) ‘Bihar gets pat for agriculture revolution’, The Times of India (TOI), 1 March. Available at: https://timesofindia.indiatimes.com/city/patna/Bihar-gets-pat-for-agriculture-revolution/articleshow/18740157.cms.
Thiyagarajan, T. M. and Gujja, B. (2012) Transforming rice production with SRI (System of Rice Intensification): Knowledge and Practice. Hyderabad, India: AGSRI.

437
Thorgeirsson, T. and Kawachi, I. (2013) ‘Behavioral Economics’, American Journal of Preventive Medicine. (NBER Working Paper), 44(2), pp. 185–189. doi: 10.1016/j.amepre.2012.10.008.
Thorp, R., Stewart, F. and Heyer, A. (2005) ‘When and how far is group formation a route out of chronic poverty?’, World Development, 33(6), pp. 907–920. doi: 10.1016/j.worlddev.2004.09.016.
Times of India (2010) ‘Beyond the rat race’, Times of India, 29 December. Available at: https://timesofindia.indiatimes.com/city/patna/Beyond-the-rat-race/articleshow/7182371.cms.
Times of India (2014) ‘Innovations in Govt bring positive results’, Times of India`, July. Available at: https://timesofindia.indiatimes.com/city/patna/Innovations-in-govt-bring-positive-results/articleshow/38764188.cms.
Timu, A., Mulwa, R., Okello, J. and Kamau, M. (2014) ‘The role of varietal attributes on adoption of improved seed varieties: the case of sorghum in Kenya’, Agriculture & Food Security. BioMed Central, 3(1), p. 9. doi: 10.1186/2048-7010-3-9.
Tiwari, K. ., Singh, A. and Mal, P. . (2003) ‘Effect of drip irrigation on yield of cabbage (Brassica oleracea L. var. capitata) under mulch and non-mulch conditions’, Agricultural Water Management, 58(1), pp. 19–28. doi: 10.1016/S0378-3774(02)00084-7.
Tiwari, K. N., Mal, P. K., Singh, R. M. and Chattopadhyay, A. (1998) ‘Response of okra (Abelmoschus esculentus (L.) Moench.) to drip irrigation under mulch and non-mulch conditions’, Agricultural Water Management, 38(2), pp. 91–102. doi: 10.1016/S0378-3774(98)00063-8.
Trouiller, P., Olliaro, P., Torreele, E., Orbinski, J., Laing, R. and Ford, N. (2002) ‘Drug development for neglected diseases: a deficient market and a public-health policy failure’, The Lancet, 359(9324), pp. 2188–2194. doi: 10.1016/S0140-6736(02)09096-7.
Truong, T. T. A., Fry, J., Van Hoang, P. and Ha, H. H. (2017) ‘Comparative energy and economic analyses of conventional and System of Rice Intensification (SRI) methods of rice production in Thai Nguyen Province, Vietnam’, Paddy and Water Environment. Springer Japan, 15(4), pp. 931–941. doi: 10.1007/s10333-017-0603-1.
Tunde, A. M. and Adeniyi, E. E. (2012) ‘Impact of Road Transport on Agricultural Development: a Nigerian Example’, Ethiopian Journal of Environmental Studies and Management, 5(3), pp. 232–238. doi: http://dx.doi.org/10.4314/ejesm.v5i3.3.
UNDP (2011) Bihar Economic and Human Development Indicators.
United Nations (2015) Transforming our world: the 2030 Agenda for Sustainable Development.
United Nations (2016) Sustainable Development Goal 10: Reduce inequality within and among countries, Sustainable Development Knowledge Platform.
Uphoff, N. (1999) ‘Agroecological Implications of the System of Rice Intensification (SRI) in Madagascar’, Environment, Development and Sustainability, 1(3), pp. 297–313. doi: 10.1023/A:1010043325776.
Uphoff, N. (2003) ‘Higher yields with fewer external inputs? The system of rice intensification and potential contributions to agricultural sustainability’, International Journal of Agricultural

438
Sustainability, 1(1).
Uphoff, N. (2012) ‘Comment to “The System of Rice Intensification: Time for an empirical turn”, [NJAS - Wageningen Journal of Life Sciences 57 (2011) 217-224]’, NJAS - Wageningen Journal of Life Sciences, (0). doi: 10.1016/j.njas.2012.02.001.
Uphoff, N. (2012) ‘We are not alone: Messages from inner space’, International Journal of Agricultural Sustainability, pp. 263–267. doi: 10.1080/14735903.2012.690957.
Uphoff, N., Kassam, A. and Harwood, R. (2011) ‘SRI as a methodology for raising crop and water productivity: Productive adaptations in rice agronomy and irrigation water management’, Paddy and Water Environment, 9(1), pp. 3–11. doi: 10.1007/s10333-010-0224-4.
Uphoff, N., Kassam, A. and Stoop, W. (2008) ‘A critical assessment of a desk study comparing crop production systems: The example of the “system of rice intensification” versus “best management practice”’, Field Crops Research, 108(1), pp. 109–114. doi: 10.1016/j.fcr.2007.12.016 ER.
Venot, J.-P., Kuper, M. and Zwarteveen, M. (eds) (2017) Drip Irrigation for Agriculture: Untold Stories of Efficiency, Innovation and Development. London: Routledge. doi: 10.4324/9781315537146.
Verma, A. (2013) ‘SRI in Bihar: From one to 350,000’, Farming Matters, March, pp. 42–44. Available at: https://www.ileia.org/2013/03/25/sri-bihar-one-350000/.
Vidal, J. (2013) ‘India’s rice revolution’, The Guardian, 16 February. Available at: https://www.theguardian.com/global-development/2013/feb/16/india-rice-farmers-revolution.
Virmani, A. (2008) ‘Growth and Poverty: Policy Implications for Lagging States’, Economic and Political Weekly, 43(2), pp. 54–62.
Waris, A. (2017) ‘Gender dimensions and training needs of farm women in system of rice intensification in selected districts of Bihar state’, Agriculture Update, 12(1), pp. 109–112. doi: 10.15740/HAS/AU/12.1/109-112.
Watanarojanaporn, N., Boonkerd, N., Tittabutr, P., Longtonglang, A., Peter, J., Young, W. and Teaumroong, N. (2013) ‘Effect of Rice Cultivation Systems on Indigenous Arbuscular Mycorrhizal Fungal Community Structure’, Microbes Environ, 28(3), pp. 316–324. doi: 10.1264/jsme2.ME13011.
Wilson, K. (1999) ‘Patterns of accumulation and struggles of rural labour: Some aspects of Agrarian change in Central Bihar’, Journal of Peasant Studies, 26(2–3), pp. 316–354. doi: 10.1080/03066159908438710.
Winner, L. (1980) ‘Do artifacts have politics?’, Daedalus, 109(1), pp. 121–136. doi: 10.2307/20024652.
Witsoe, J. (2006) India’s Second Green Revolution? The Sociopolitical Implications of Corporate-driven Agricultural Growth. Pennsylvania: CASI, University of Pennsylvania.
Witsoe, J. (2013) Democracy against Development: Lower-Caste Politics and the Political Modernity in Postcolonial India. Chicago: University of Chicago Press.
World Bank (1990) World Development Report 1990: Poverty. New York: Oxford University Press. doi:

439
10.1596/0-1952-0851-X.
World Bank (2001) World Development Report 2000/2001: Attacking Poverty. New York: Oxford University Press. doi: 10.1596/0-1952-1129-4.
World Bank (2013) Project Signing: $10 Million Grant for Solar Irrigation in Bangladesh. Dhaka. Available at: http://www.worldbank.org/en/news/press-release/2013/09/30/project-signing-10-million-grant-for-solar-irrigation-in-bangladesh (Accessed: 8 May 2018).
World Bank (2016) World Development Report 2016: Digital Dividends. Washington D.C. doi: 10.1596/978-1-4648-0671-1.
Yengoh, G. T. (2012) ‘Determinants of yield differences in small-scale food crop farming systems in Cameroon’, Agriculture & Food Security, 1(1), p. 19. doi: 10.1186/2048-7010-1-19.
Yesuf, M. and Bluffstone, R. A. (2009) ‘Poverty, risk aversion, and path dependence in low-income countries: Experimental evidence from Ethiopia’, American Journal of Agricultural Economics. Oxford University Press, 91(4), pp. 1022–1037. doi: 10.1111/j.1467-8276.2009.01307.x.
Young, O. (2002) The Institutional Dimensions of Environmental Change: Fit, Interplay, and Scale. Cambridge, Massachusetts: The MIT Press.
Zhang, W., Cao, G., Li, X., Zhang, H., Wang, C., Liu, Q., Chen, X., Cui, Z., Shen, J., Jiang, R., Mi, G., Miao, Y., Zhang, F. and Dou, Z. (2016) ‘Closing yield gaps in China by empowering smallholder farmers’, Nature, 537(7622), pp. 671–674. doi: 10.1038/nature19368.
Zimmerer, K. S., Lambin, E. F. and Vanek, S. J. (2018) ‘Smallholder telecoupling and potential sustainability’, Ecology and Society. The Resilience Alliance, 23(1). doi: 10.5751/ES-09935-230130.
Zoellick, R. (2009) ‘India Could be a New Pole of Global Growth’, The Hindustan Times, 2 December. Available at: http://web.worldbank.org/archive/website01291/WEB/0__CO-45.HTM.