decaying schools in new york city’s poorest neighborhoods · decaying schools in new york...
TRANSCRIPT
Local 32BJService Employees International Union25 West 18th StreetNew York, NY 10011-1991
Decaying Schools in New York City’s Poorest Neighborhoods
Falling Further Apart
Printed on Recycled Paper.
Decaying Schools in New York City’s Poorest Neighborhoods 1
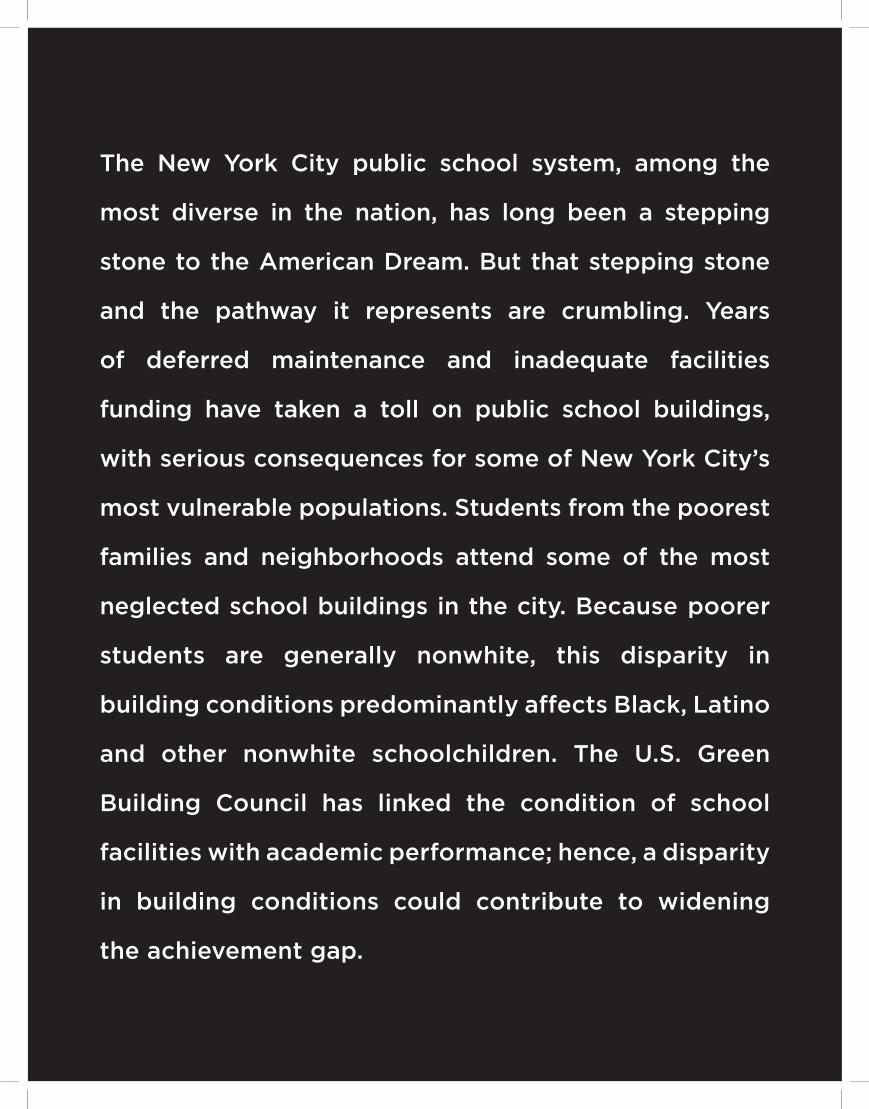
The New York City public school system, among the
most diverse in the nation, has long been a stepping
stone to the American Dream. But that stepping stone
and the pathway it represents are crumbling. Years
of deferred maintenance and inadequate facilities
funding have taken a toll on public school buildings,
with serious consequences for some of New York City’s
most vulnerable populations. Students from the poorest
families and neighborhoods attend some of the most
neglected school buildings in the city. Because poorer
students are generally nonwhite, this disparity in
building conditions predominantly affects Black, Latino
and other nonwhite schoolchildren. The U.S. Green
Building Council has linked the condition of school
facilities with academic performance; hence, a disparity
in building conditions could contribute to widening
the achievement gap.
2 FALLINGFURTHERAPART Decaying Schools in New York City’s Poorest Neighborhoods 3
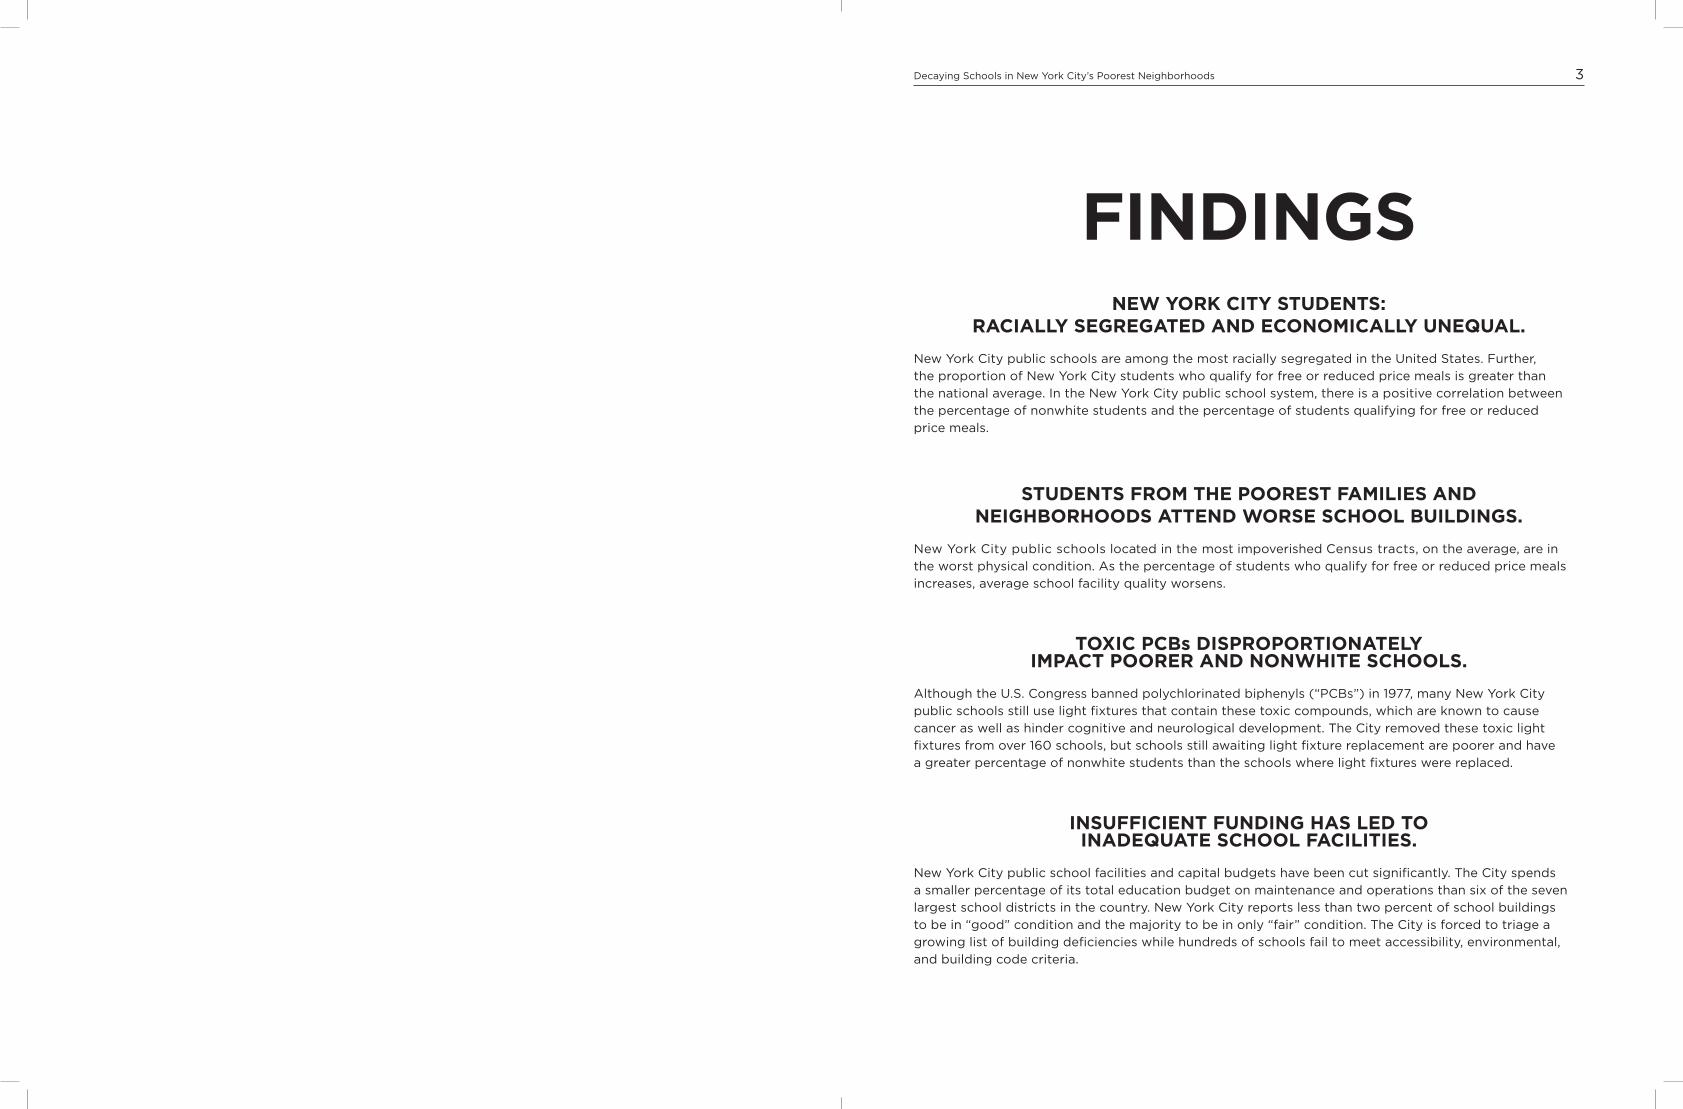
FINDINGSNEWYORKCITYSTUDENTS:
RACIALLYSEGREGATEDANDECONOMICALLYUNEQUAL.
New York City public schools are among the most racially segregated in the United States. Further,
the proportion of New York City students who qualify for free or reduced price meals is greater than
the national average. In the New York City public school system, there is a positive correlation between
the percentage of nonwhite students and the percentage of students qualifying for free or reduced
price meals.
STUDENTSFROMTHEPOORESTFAMILIESANDNEIGHbORHOODSATTENDWORSESCHOOLbUILDINGS.
New York City public schools located in the most impoverished Census tracts, on the average, are in
the worst physical condition. As the percentage of students who qualify for free or reduced price meals
increases, average school facility quality worsens.
TOXICPCbsDISPROPORTIONATELYIMPACTPOORERANDNONWHITESCHOOLS.
Although the U.S. Congress banned polychlorinated biphenyls (“PCBs”) in 1977, many New York City
public schools still use light fixtures that contain these toxic compounds, which are known to cause
cancer as well as hinder cognitive and neurological development. The City removed these toxic light
fixtures from over 160 schools, but schools still awaiting light fixture replacement are poorer and have
a greater percentage of nonwhite students than the schools where light fixtures were replaced.
INSUFFICIENTFUNDINGHASLEDTOINADEQUATESCHOOLFACILITIES.
New York City public school facilities and capital budgets have been cut significantly. The City spends
a smaller percentage of its total education budget on maintenance and operations than six of the seven
largest school districts in the country. New York City reports less than two percent of school buildings
to be in “good” condition and the majority to be in only “fair” condition. The City is forced to triage a
growing list of building deficiencies while hundreds of schools fail to meet accessibility, environmental,
and building code criteria.
4 FALLINGFURTHERAPART Decaying Schools in New York City’s Poorest Neighborhoods 5
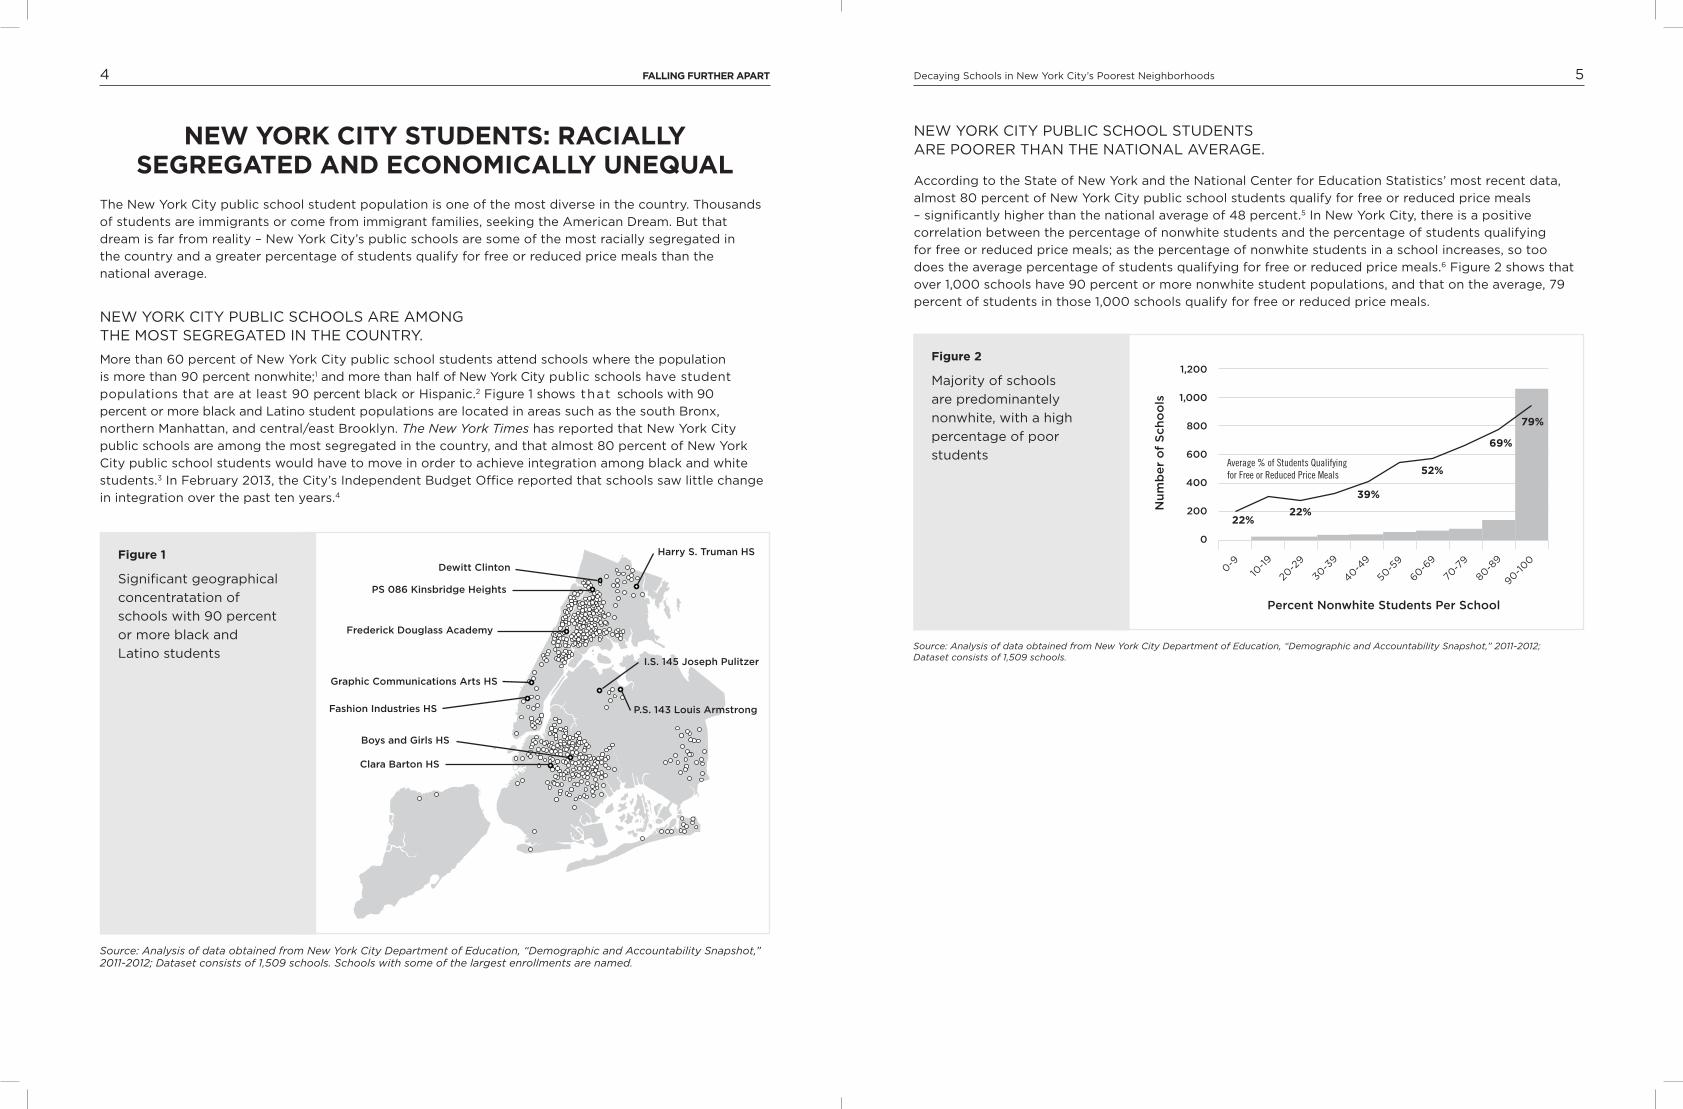
NEW YORK CITY PUBLIC SCHOOL STUDENTS ARE POORER THAN THE NATIONAL AVERAGE.
According to the State of New York and the National Center for Education Statistics’ most recent data,
almost 80 percent of New York City public school students qualify for free or reduced price meals
– significantly higher than the national average of 48 percent.5 In New York City, there is a positive
correlation between the percentage of nonwhite students and the percentage of students qualifying
for free or reduced price meals; as the percentage of nonwhite students in a school increases, so too
does the average percentage of students qualifying for free or reduced price meals.6 Figure 2 shows that
over 1,000 schools have 90 percent or more nonwhite student populations, and that on the average, 79
percent of students in those 1,000 schools qualify for free or reduced price meals.
Figure2
Majority of schools
are predominantely
nonwhite, with a high
percentage of poor
students
Source: Analysis of data obtained from New York City Department of Education, “Demographic and Accountability Snapshot,” 2011-2012; Dataset consists of 1,509 schools.
0-910
-19
20-2
9
30-3
9
40-49
50-5
9
60-69
70-7
9
80-89
90-100
1,200
1,000
800
600
400
200
0
22%22%
39%
52%
69%
79%
Average % of Students Qualifying for Free or Reduced Price Meals
Nu
mb
er
of
Sch
oo
ls
Percent Nonwhite Students Per School
NEWYORKCITYSTUDENTS:RACIALLYSEGREGATEDANDECONOMICALLYUNEQUAL
The New York City public school student population is one of the most diverse in the country. Thousands
of students are immigrants or come from immigrant families, seeking the American Dream. But that
dream is far from reality – New York City’s public schools are some of the most racially segregated in
the country and a greater percentage of students qualify for free or reduced price meals than the
national average.
NEW YORK CITY PUBLIC SCHOOLS ARE AMONG THE MOST SEGREGATED IN THE COUNTRY.
More than 60 percent of New York City public school students attend schools where the population
is more than 90 percent nonwhite;1 and more than half of New York City public schools have student
populations that are at least 90 percent black or Hispanic.2 Figure 1 shows that schools with 90
percent or more black and Latino student populations are located in areas such as the south Bronx,
northern Manhattan, and central/east Brooklyn. The New York Times has reported that New York City
public schools are among the most segregated in the country, and that almost 80 percent of New York
City public school students would have to move in order to achieve integration among black and white
students.3 In February 2013, the City’s Independent Budget Office reported that schools saw little change
in integration over the past ten years.4
Figure1
Significant geographical
concentratation of
schools with 90 percent
or more black and
Latino students
Source: Analysis of data obtained from New York City Department of Education, “Demographic and Accountability Snapshot,” 2011-2012; Dataset consists of 1,509 schools. Schools with some of the largest enrollments are named.
PS 086 Kinsbridge Heights
Frederick Douglass Academy
Graphic Communications Arts HS
Fashion Industries HS
Boys and Girls HS
Clara Barton HS
Dewitt Clinton
Harry S. Truman HS
I.S. 145 Joseph Pulitzer
P.S. 143 Louis Armstrong
6 FALLINGFURTHERAPART Decaying Schools in New York City’s Poorest Neighborhoods 7
SCHOOL FACILITIES CONDITION AFFECTS ACADEMIC PERFORMANCE
The disparity in school building conditions could widen the already substantial achievement gap that ex-
ists between New York City’s most vulnerable populations and the less vulnerable. According to a recent
study, for New York City public schools, neighborhood income and racial composition are very strong
predictors of a student’s college readiness, with some of the lowest readiness rates in the Bronx and east
Brooklyn.11 The U.S. Green Building Council references a study of Chicago and Washington, DC schools,
citing “better school facilities can add 3 to 4 percentage points to a school’s standardized test scores,
even after controlling for demographic factors.”12 Two low performing schools in North Carolina improved
from less than 60 percent to 80 percent of students on grade level in reading and math after moving into
better facilities, according to the Green Building Council’s report.13 Quality school buildings are an impor-
tant component of student achievement, and neglecting school buildings attended by some of the most
vulnerable students threaten their academic potential.
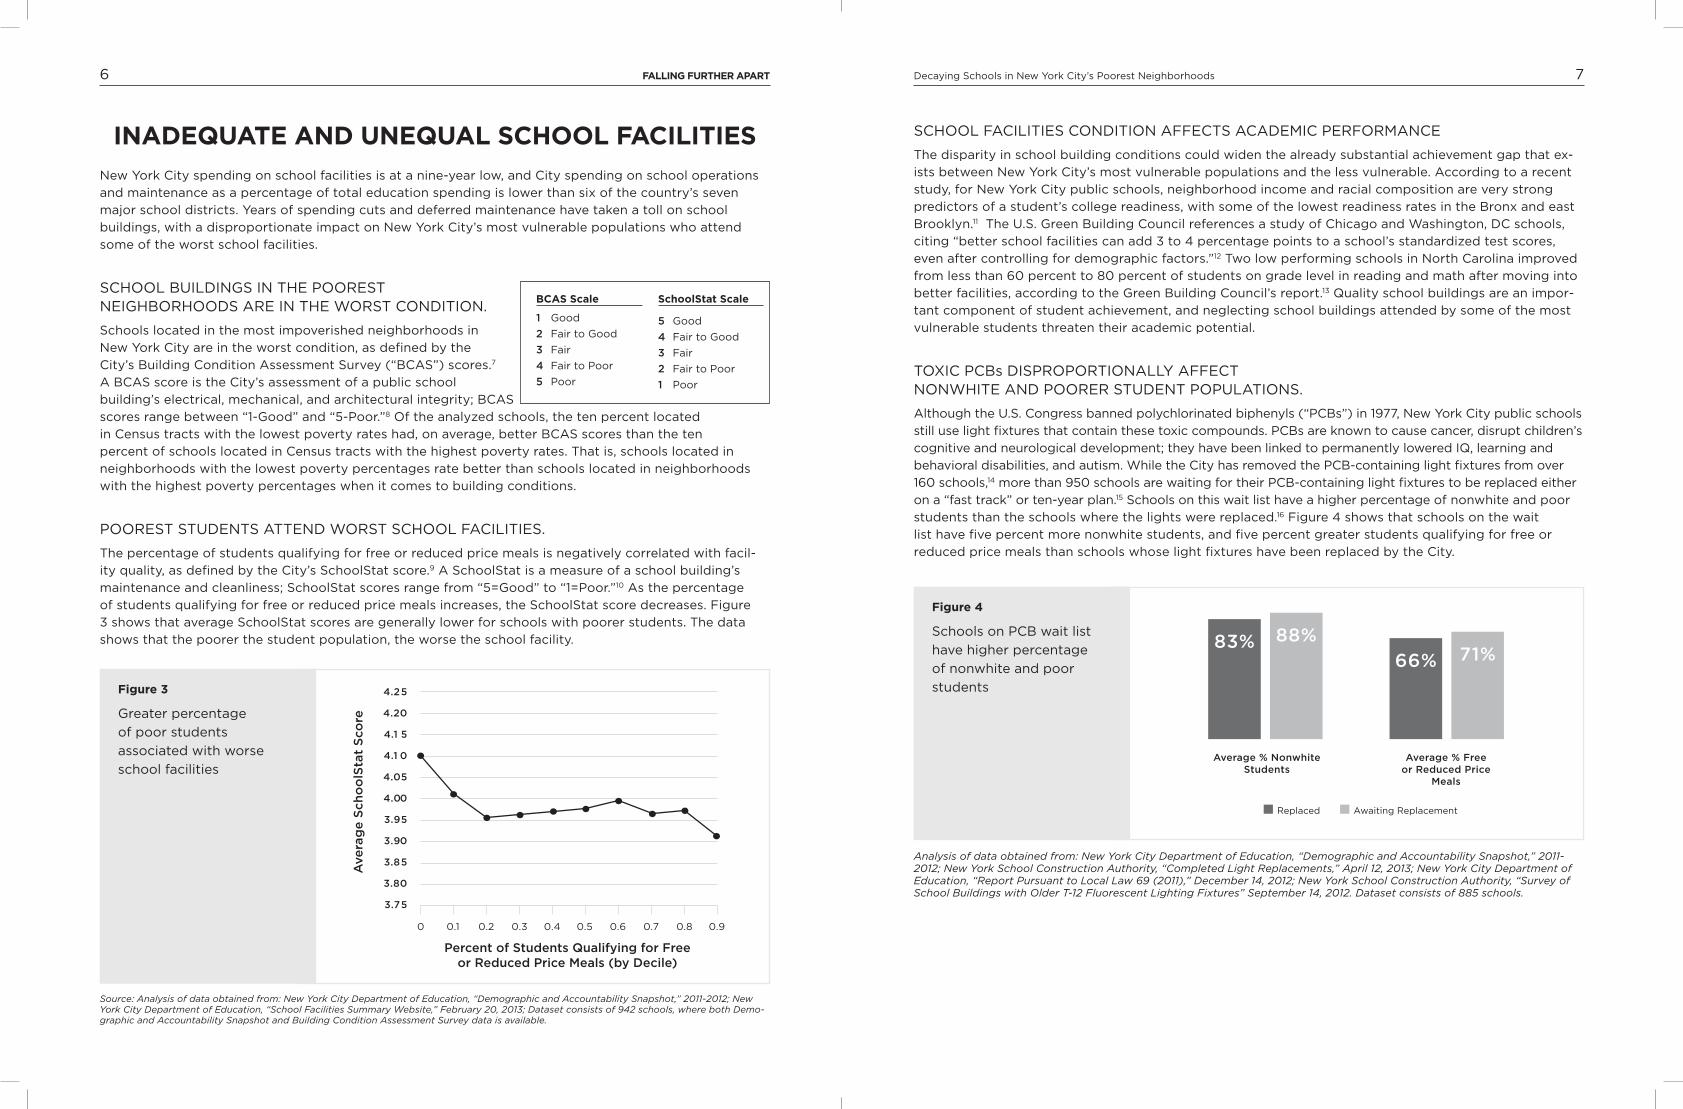
TOXIC PCBs DISPROPORTIONALLY AFFECT NONWHITE AND POORER STUDENT POPULATIONS.
Although the U.S. Congress banned polychlorinated biphenyls (“PCBs”) in 1977, New York City public schools
still use light fixtures that contain these toxic compounds. PCBs are known to cause cancer, disrupt children’s
cognitive and neurological development; they have been linked to permanently lowered IQ, learning and
behavioral disabilities, and autism. While the City has removed the PCB-containing light fixtures from over
160 schools,14 more than 950 schools are waiting for their PCB-containing light fixtures to be replaced either
on a “fast track” or ten-year plan.15 Schools on this wait list have a higher percentage of nonwhite and poor
students than the schools where the lights were replaced.16 Figure 4 shows that schools on the wait
list have five percent more nonwhite students, and five percent greater students qualifying for free or
reduced price meals than schools whose light fixtures have been replaced by the City.
Figure4
Schools on PCB wait list
have higher percentage
of nonwhite and poor
students
Analysis of data obtained from: New York City Department of Education, “Demographic and Accountability Snapshot,” 2011-2012; New York School Construction Authority, “Completed Light Replacements,” April 12, 2013; New York City Department of Education, “Report Pursuant to Local Law 69 (2011),” December 14, 2012; New York School Construction Authority, “Survey of School Buildings with Older T-12 Fluorescent Lighting Fixtures” September 14, 2012. Dataset consists of 885 schools.
n Replaced n Awaiting Replacement
Average % Nonwhite Students
Average % Free or Reduced Price
Meals
83% 88%
66% 71%
INADEQUATEANDUNEQUALSCHOOLFACILITIES
New York City spending on school facilities is at a nine-year low, and City spending on school operations
and maintenance as a percentage of total education spending is lower than six of the country’s seven
major school districts. Years of spending cuts and deferred maintenance have taken a toll on school
buildings, with a disproportionate impact on New York City’s most vulnerable populations who attend
some of the worst school facilities.
SCHOOL BUILDINGS IN THE POOREST NEIGHBORHOODS ARE IN THE WORST CONDITION.
Schools located in the most impoverished neighborhoods in
New York City are in the worst condition, as defined by the
City’s Building Condition Assessment Survey (“BCAS”) scores.7
A BCAS score is the City’s assessment of a public school
building’s electrical, mechanical, and architectural integrity; BCAS
scores range between “1-Good” and “5-Poor.”8 Of the analyzed schools, the ten percent located
in Census tracts with the lowest poverty rates had, on average, better BCAS scores than the ten
percent of schools located in Census tracts with the highest poverty rates. That is, schools located in
neighborhoods with the lowest poverty percentages rate better than schools located in neighborhoods
with the highest poverty percentages when it comes to building conditions.
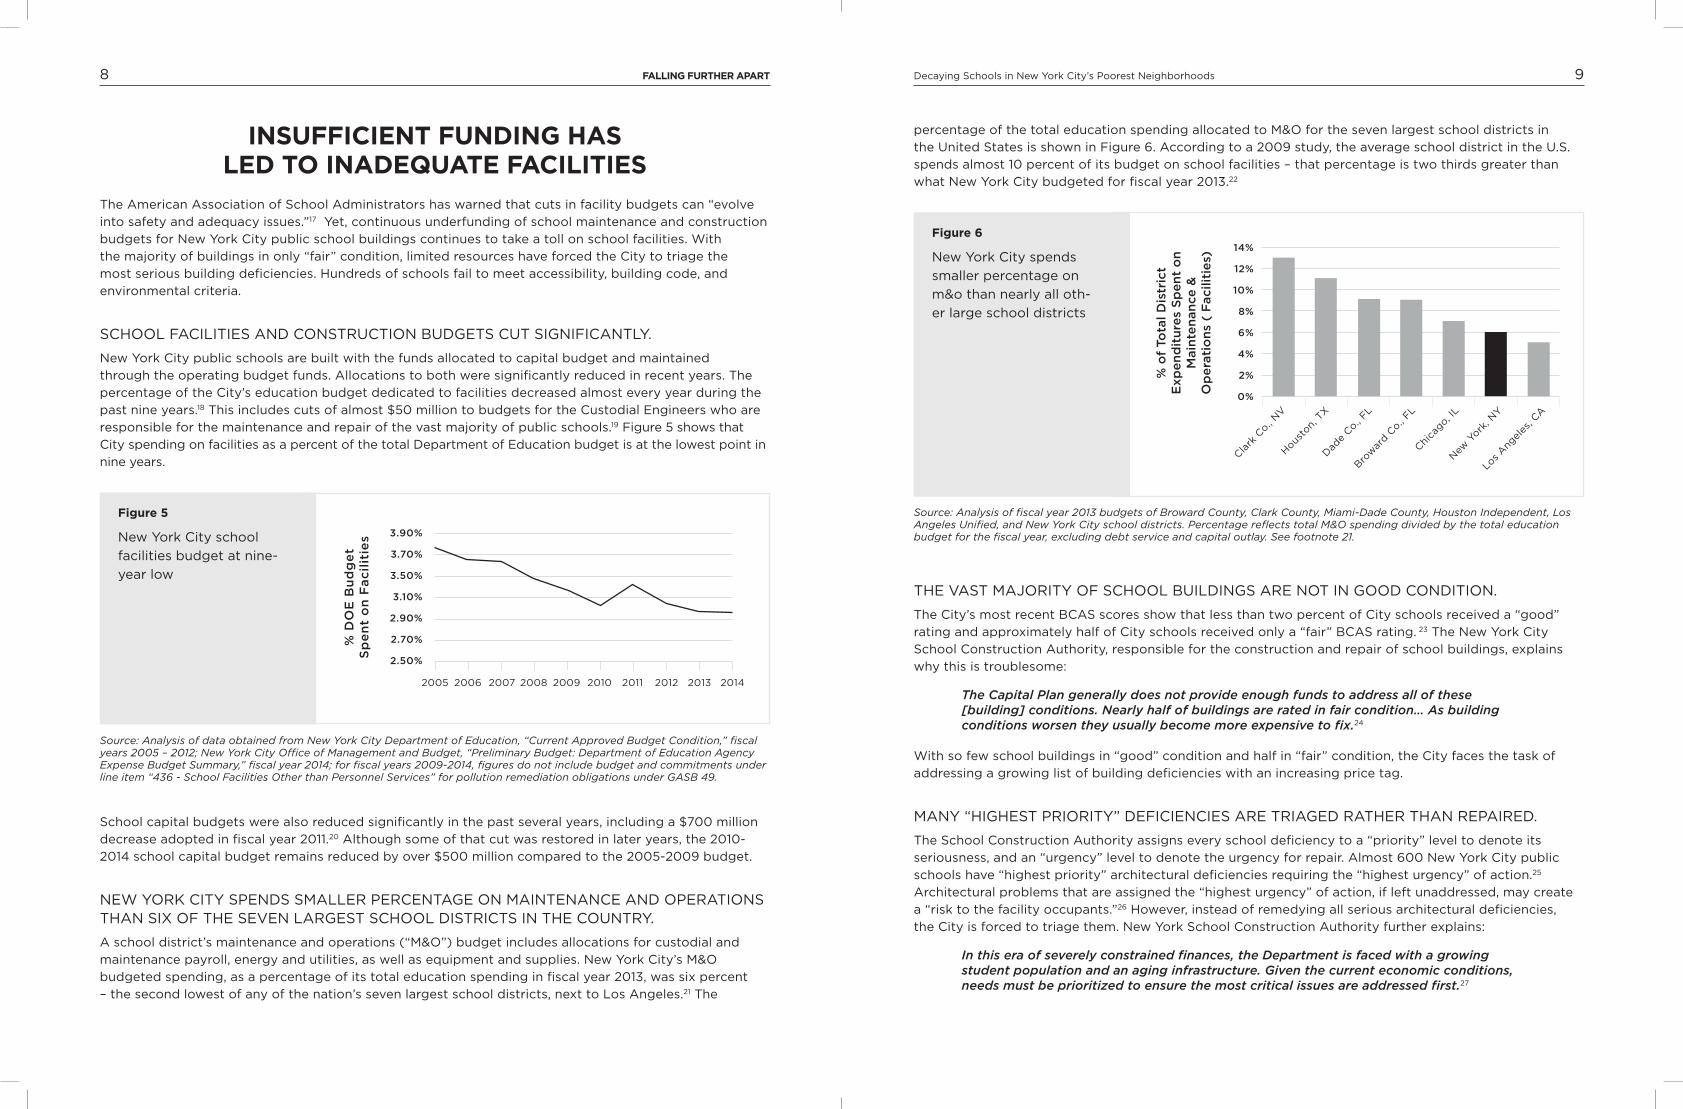
POOREST STUDENTS ATTEND WORST SCHOOL FACILITIES.
The percentage of students qualifying for free or reduced price meals is negatively correlated with facil-
ity quality, as defined by the City’s SchoolStat score.9 A SchoolStat is a measure of a school building’s
maintenance and cleanliness; SchoolStat scores range from “5=Good” to “1=Poor.”10 As the percentage
of students qualifying for free or reduced price meals increases, the SchoolStat score decreases. Figure
3 shows that average SchoolStat scores are generally lower for schools with poorer students. The data
shows that the poorer the student population, the worse the school facility.
Figure3
Greater percentage
of poor students
associated with worse
school facilities
Source: Analysis of data obtained from: New York City Department of Education, “Demographic and Accountability Snapshot,” 2011-2012; New York City Department of Education, “School Facilities Summary Website,” February 20, 2013; Dataset consists of 942 schools, where both Demo-graphic and Accountability Snapshot and Building Condition Assessment Survey data is available.
4.25
4.20
4.1 5
4.1 0
4.05
4.00
3.95
3.90
3.85
3.80
3.75
0 0.1 0.2 0.3 0.4 0.5 0.6 0.7 0.8 0.9
Ave
rag
e S
ch
oo
lSta
t S
co
re
Percent of Students Qualifying for Free or Reduced Price Meals (by Decile)
bCASScale
1 Good
2 Fair to Good
3 Fair
4 Fair to Poor
5 Poor
SchoolStatScale
5 Good
4 Fair to Good
3 Fair
2 Fair to Poor
1 Poor
8 FALLINGFURTHERAPART Decaying Schools in New York City’s Poorest Neighborhoods 9
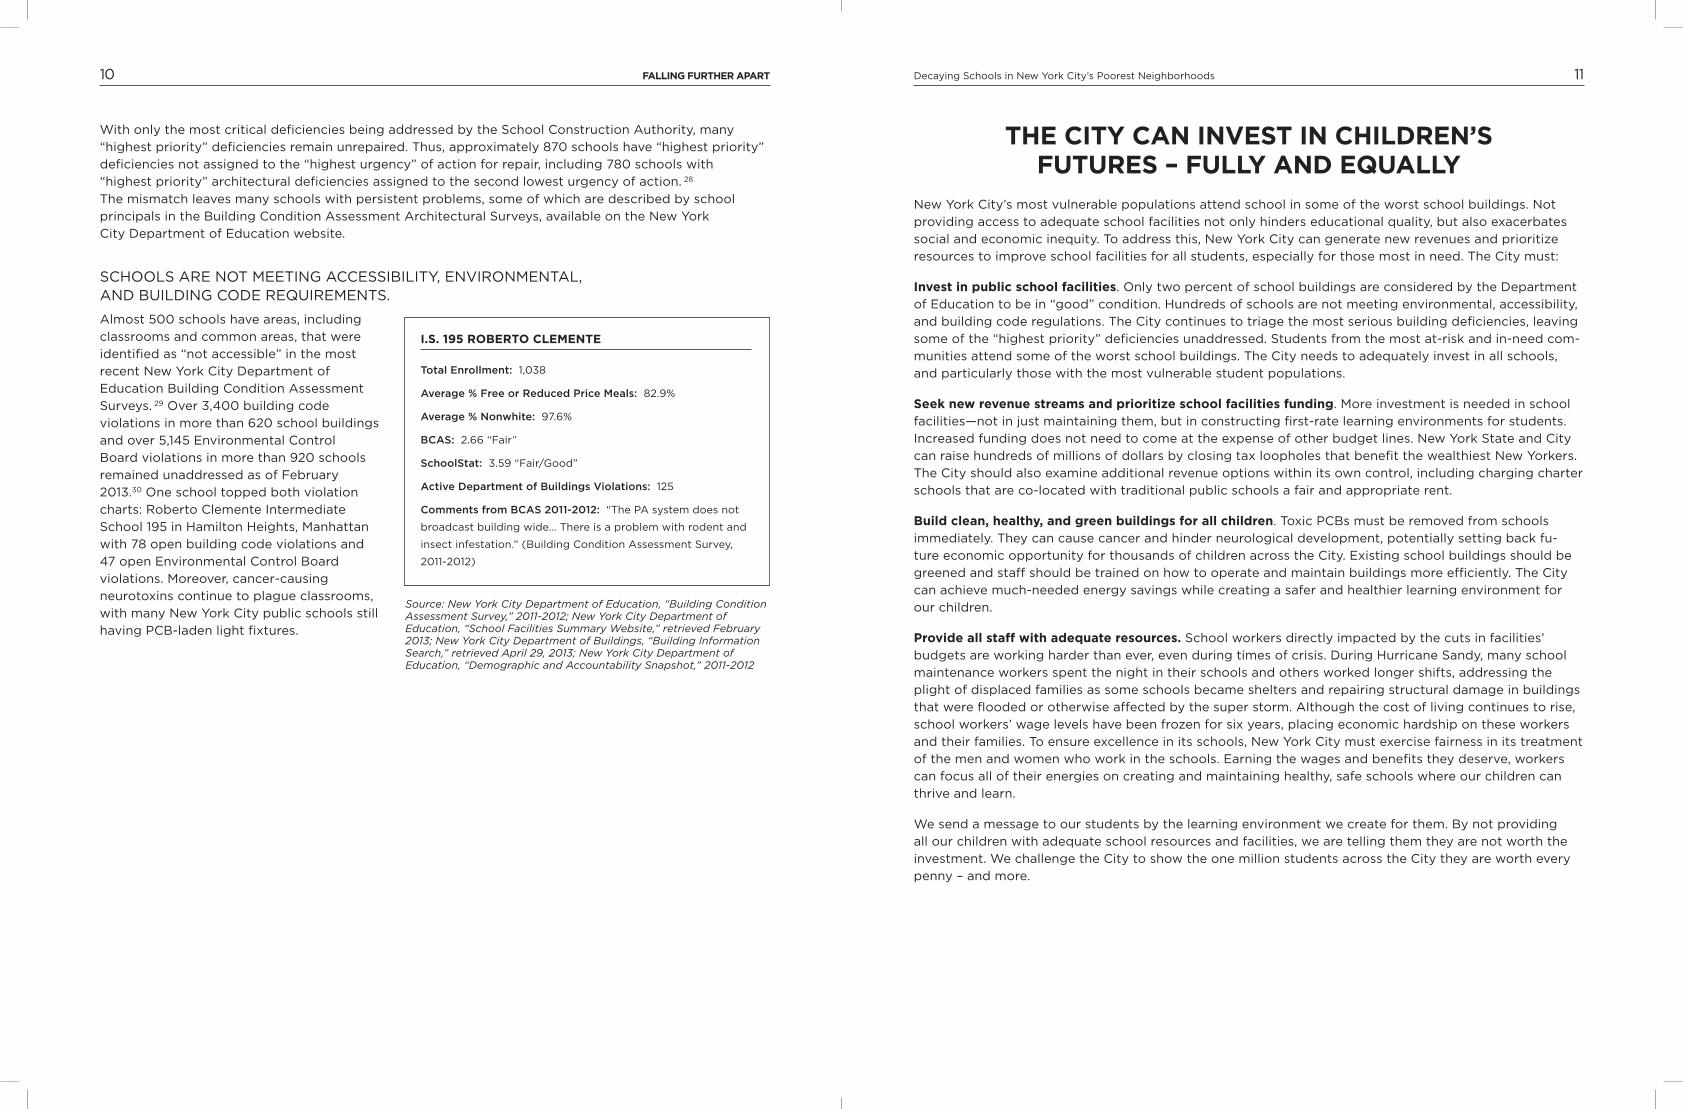
percentage of the total education spending allocated to M&O for the seven largest school districts in
the United States is shown in Figure 6. According to a 2009 study, the average school district in the U.S.
spends almost 10 percent of its budget on school facilities – that percentage is two thirds greater than
what New York City budgeted for fiscal year 2013.22
Figure6
New York City spends
smaller percentage on
m&o than nearly all oth-
er large school districts
Source: Analysis of fiscal year 2013 budgets of Broward County, Clark County, Miami-Dade County, Houston Independent, Los Angeles Unified, and New York City school districts. Percentage reflects total M&O spending divided by the total education budget for the fiscal year, excluding debt service and capital outlay. See footnote 21.
14%
12%
10%
8%
6%
4%
2%
0%
% o
f To
tal D
istr
ict
Exp
en
dit
ure
s S
pe
nt
on
M
ain
ten
an
ce
&
Op
era
tio
ns
( F
acilit
ies)
Cla
rk C
o., NV
Hous
ton,
TX
Dad
e Co.,
FL
Brow
ard C
o., FL
Chi
cago, I
L
New
York
, NY
Los Ang
eles
, CA
THE VAST MAJORITY OF SCHOOL BUILDINGS ARE NOT IN GOOD CONDITION.
The City’s most recent BCAS scores show that less than two percent of City schools received a “good”
rating and approximately half of City schools received only a “fair” BCAS rating. 23 The New York City
School Construction Authority, responsible for the construction and repair of school buildings, explains
why this is troublesome:
The Capital Plan generally does not provide enough funds to address all of these [building] conditions. Nearly half of buildings are rated in fair condition… As building conditions worsen they usually become more expensive to fix.24
With so few school buildings in “good” condition and half in “fair” condition, the City faces the task of
addressing a growing list of building deficiencies with an increasing price tag.
MANY “HIGHEST PRIORITY” DEFICIENCIES ARE TRIAGED RATHER THAN REPAIRED.
The School Construction Authority assigns every school deficiency to a “priority” level to denote its
seriousness, and an “urgency” level to denote the urgency for repair. Almost 600 New York City public
schools have “highest priority” architectural deficiencies requiring the “highest urgency” of action.25
Architectural problems that are assigned the “highest urgency” of action, if left unaddressed, may create
a “risk to the facility occupants.”26 However, instead of remedying all serious architectural deficiencies,
the City is forced to triage them. New York School Construction Authority further explains:
In this era of severely constrained finances, the Department is faced with a growing student population and an aging infrastructure. Given the current economic conditions, needs must be prioritized to ensure the most critical issues are addressed first.27
INSUFFICIENTFUNDINGHASLEDTOINADEQUATEFACILITIES
The American Association of School Administrators has warned that cuts in facility budgets can “evolve
into safety and adequacy issues.”17 Yet, continuous underfunding of school maintenance and construction
budgets for New York City public school buildings continues to take a toll on school facilities. With
the majority of buildings in only “fair” condition, limited resources have forced the City to triage the
most serious building deficiencies. Hundreds of schools fail to meet accessibility, building code, and
environmental criteria.
SCHOOL FACILITIES AND CONSTRUCTION BUDGETS CUT SIGNIFICANTLY.
New York City public schools are built with the funds allocated to capital budget and maintained
through the operating budget funds. Allocations to both were significantly reduced in recent years. The
percentage of the City’s education budget dedicated to facilities decreased almost every year during the
past nine years.18 This includes cuts of almost $50 million to budgets for the Custodial Engineers who are
responsible for the maintenance and repair of the vast majority of public schools.19 Figure 5 shows that
City spending on facilities as a percent of the total Department of Education budget is at the lowest point in
nine years.
Figure5
New York City school
facilities budget at nine-
year low
Source: Analysis of data obtained from New York City Department of Education, “Current Approved Budget Condition,” fiscal years 2005 – 2012; New York City Office of Management and Budget, “Preliminary Budget: Department of Education Agency Expense Budget Summary,” fiscal year 2014; for fiscal years 2009-2014, figures do not include budget and commitments under line item “436 - School Facilities Other than Personnel Services” for pollution remediation obligations under GASB 49.
3.90%
3.70%
3.50%
3.10%
2.90%
2.70%
2.50%
2005 2006 2007 2008 2009 2010 2011 2012 2013 2014
% D
OE
Bu
dg
et
Sp
en
t o
n F
ac
ilit
ies
School capital budgets were also reduced significantly in the past several years, including a $700 million
decrease adopted in fiscal year 2011.20 Although some of that cut was restored in later years, the 2010-
2014 school capital budget remains reduced by over $500 million compared to the 2005-2009 budget.
NEW YORK CITY SPENDS SMALLER PERCENTAGE ON MAINTENANCE AND OPERATIONS THAN SIX OF THE SEVEN LARGEST SCHOOL DISTRICTS IN THE COUNTRY.
A school district’s maintenance and operations (“M&O”) budget includes allocations for custodial and
maintenance payroll, energy and utilities, as well as equipment and supplies. New York City’s M&O
budgeted spending, as a percentage of its total education spending in fiscal year 2013, was six percent
– the second lowest of any of the nation’s seven largest school districts, next to Los Angeles.21 The
10 FALLINGFURTHERAPART Decaying Schools in New York City’s Poorest Neighborhoods 11
THECITYCANINVESTINCHILDREN’SFUTURES–FULLYANDEQUALLY
New York City’s most vulnerable populations attend school in some of the worst school buildings. Not
providing access to adequate school facilities not only hinders educational quality, but also exacerbates
social and economic inequity. To address this, New York City can generate new revenues and prioritize
resources to improve school facilities for all students, especially for those most in need. The City must:
Investinpublicschoolfacilities. Only two percent of school buildings are considered by the Department
of Education to be in “good” condition. Hundreds of schools are not meeting environmental, accessibility,
and building code regulations. The City continues to triage the most serious building deficiencies, leaving
some of the “highest priority” deficiencies unaddressed. Students from the most at-risk and in-need com-
munities attend some of the worst school buildings. The City needs to adequately invest in all schools,
and particularly those with the most vulnerable student populations.
Seeknewrevenuestreamsandprioritizeschoolfacilitiesfunding. More investment is needed in school
facilities—not in just maintaining them, but in constructing first-rate learning environments for students.
Increased funding does not need to come at the expense of other budget lines. New York State and City
can raise hundreds of millions of dollars by closing tax loopholes that benefit the wealthiest New Yorkers.
The City should also examine additional revenue options within its own control, including charging charter
schools that are co-located with traditional public schools a fair and appropriate rent.
build clean,healthy,andgreenbuildingsforallchildren. Toxic PCBs must be removed from schools
immediately. They can cause cancer and hinder neurological development, potentially setting back fu-
ture economic opportunity for thousands of children across the City. Existing school buildings should be
greened and staff should be trained on how to operate and maintain buildings more efficiently. The City
can achieve much-needed energy savings while creating a safer and healthier learning environment for
our children.
Provideallstaffwithadequateresources. School workers directly impacted by the cuts in facilities’
budgets are working harder than ever, even during times of crisis. During Hurricane Sandy, many school
maintenance workers spent the night in their schools and others worked longer shifts, addressing the
plight of displaced families as some schools became shelters and repairing structural damage in buildings
that were flooded or otherwise affected by the super storm. Although the cost of living continues to rise,
school workers’ wage levels have been frozen for six years, placing economic hardship on these workers
and their families. To ensure excellence in its schools, New York City must exercise fairness in its treatment
of the men and women who work in the schools. Earning the wages and benefits they deserve, workers
can focus all of their energies on creating and maintaining healthy, safe schools where our children can
thrive and learn.
We send a message to our students by the learning environment we create for them. By not providing
all our children with adequate school resources and facilities, we are telling them they are not worth the
investment. We challenge the City to show the one million students across the City they are worth every
penny – and more.
With only the most critical deficiencies being addressed by the School Construction Authority, many
“highest priority” deficiencies remain unrepaired. Thus, approximately 870 schools have “highest priority”
deficiencies not assigned to the “highest urgency” of action for repair, including 780 schools with
“highest priority” architectural deficiencies assigned to the second lowest urgency of action. 28
The mismatch leaves many schools with persistent problems, some of which are described by school
principals in the Building Condition Assessment Architectural Surveys, available on the New York
City Department of Education website.
SCHOOLS ARE NOT MEETING ACCESSIBILITY, ENVIRONMENTAL, AND BUILDING CODE REQUIREMENTS.
Almost 500 schools have areas, including
classrooms and common areas, that were
identified as “not accessible” in the most
recent New York City Department of
Education Building Condition Assessment
Surveys. 29 Over 3,400 building code
violations in more than 620 school buildings
and over 5,145 Environmental Control
Board violations in more than 920 schools
remained unaddressed as of February
2013.30 One school topped both violation
charts: Roberto Clemente Intermediate
School 195 in Hamilton Heights, Manhattan
with 78 open building code violations and
47 open Environmental Control Board
violations. Moreover, cancer-causing
neurotoxins continue to plague classrooms,
with many New York City public schools still
having PCB-laden light fixtures.
I.S.195RObERTOCLEMENTE
Total Enrollment: 1,038
Average % Free or Reduced Price Meals: 82.9%
Average % Nonwhite: 97.6%
BCAS: 2.66 “Fair”
SchoolStat: 3.59 “Fair/Good”
Active Department of Buildings Violations: 125
Comments from BCAS 2011-2012: “The PA system does not
broadcast building wide… There is a problem with rodent and
insect infestation.” (Building Condition Assessment Survey,
2011-2012)
Source: New York City Department of Education, “Building Condition Assessment Survey,” 2011-2012; New York City Department of Education, “School Facilities Summary Website,” retrieved February 2013; New York City Department of Buildings, “Building Information Search,” retrieved April 29, 2013; New York City Department of Education, “Demographic and Accountability Snapshot,” 2011-2012
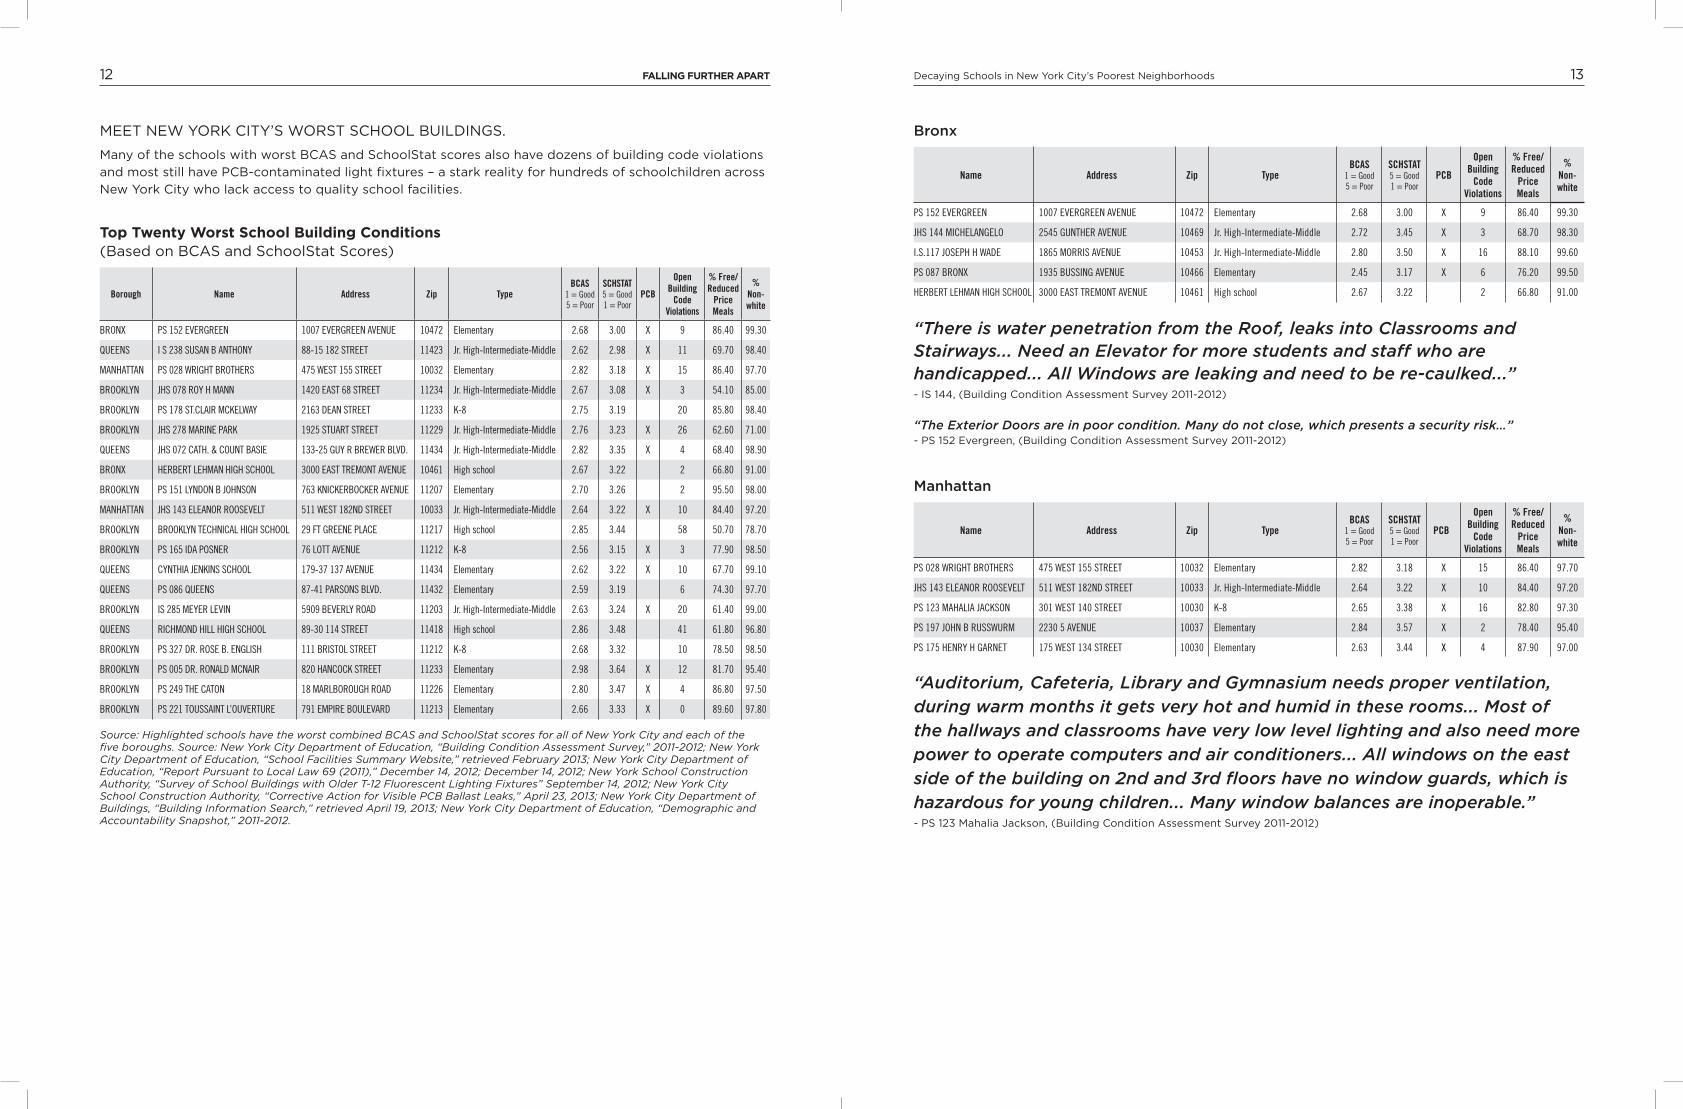
12 FALLINGFURTHERAPART Decaying Schools in New York City’s Poorest Neighborhoods 13
Bronx
Name Address Zip TypeBCAS
1 = Good 5 = Poor
SCHSTAT 5 = Good 1 = Poor
PCB
Open Building
Code Violations
% Free/Reduced
Price Meals
% Non-white
PS 152 EVERGREEN 1007 EVERGREEN AVENUE 10472 Elementary 2.68 3.00 X 9 86.40 99.30
JHS 144 MICHELANGELO 2545 GUNTHER AVENUE 10469 Jr. High-Intermediate-Middle 2.72 3.45 X 3 68.70 98.30
I.S.117 JOSEPH H WADE 1865 MORRIS AVENUE 10453 Jr. High-Intermediate-Middle 2.80 3.50 X 16 88.10 99.60
PS 087 BRONX 1935 BUSSING AVENUE 10466 Elementary 2.45 3.17 X 6 76.20 99.50
HERBERT LEHMAN HIGH SCHOOL 3000 EAST TREMONT AVENUE 10461 High school 2.67 3.22 2 66.80 91.00
“There is water penetration from the Roof, leaks into Classrooms and Stairways... Need an Elevator for more students and staff who are handicapped... All Windows are leaking and need to be re-caulked...”
- IS 144, (Building Condition Assessment Survey 2011-2012)
“The Exterior Doors are in poor condition. Many do not close, which presents a security risk…” - PS 152 Evergreen, (Building Condition Assessment Survey 2011-2012)
Manhattan
Name Address Zip TypeBCAS
1 = Good 5 = Poor
SCHSTAT 5 = Good 1 = Poor
PCB
Open Building
Code Violations
% Free/Reduced
Price Meals
% Non-white
PS 028 WRIGHT BROTHERS 475 WEST 155 STREET 10032 Elementary 2.82 3.18 X 15 86.40 97.70
JHS 143 ELEANOR ROOSEVELT 511 WEST 182ND STREET 10033 Jr. High-Intermediate-Middle 2.64 3.22 X 10 84.40 97.20
PS 123 MAHALIA JACKSON 301 WEST 140 STREET 10030 K-8 2.65 3.38 X 16 82.80 97.30
PS 197 JOHN B RUSSWURM 2230 5 AVENUE 10037 Elementary 2.84 3.57 X 2 78.40 95.40
PS 175 HENRY H GARNET 175 WEST 134 STREET 10030 Elementary 2.63 3.44 X 4 87.90 97.00
“Auditorium, Cafeteria, Library and Gymnasium needs proper ventilation, during warm months it gets very hot and humid in these rooms... Most of the hallways and classrooms have very low level lighting and also need more power to operate computers and air conditioners... All windows on the east side of the building on 2nd and 3rd floors have no window guards, which is hazardous for young children... Many window balances are inoperable.” - PS 123 Mahalia Jackson, (Building Condition Assessment Survey 2011-2012)
MEET NEW YORK CITY’S WORST SCHOOL BUILDINGS.
Many of the schools with worst BCAS and SchoolStat scores also have dozens of building code violations
and most still have PCB-contaminated light fixtures – a stark reality for hundreds of schoolchildren across
New York City who lack access to quality school facilities.
TopTwentyWorstSchoolbuildingConditions(Based on BCAS and SchoolStat Scores)
Borough Name Address Zip TypeBCAS
1 = Good 5 = Poor
SCHSTAT 5 = Good 1 = Poor
PCB
Open Building
Code Violations
% Free/ Reduced
Price Meals
% Non-white
BRONX PS 152 EVERGREEN 1007 EVERGREEN AVENUE 10472 Elementary 2.68 3.00 X 9 86.40 99.30
QUEENS I S 238 SUSAN B ANTHONY 88-15 182 STREET 11423 Jr. High-Intermediate-Middle 2.62 2.98 X 11 69.70 98.40
MANHATTAN PS 028 WRIGHT BROTHERS 475 WEST 155 STREET 10032 Elementary 2.82 3.18 X 15 86.40 97.70
BROOKLYN JHS 078 ROY H MANN 1420 EAST 68 STREET 11234 Jr. High-Intermediate-Middle 2.67 3.08 X 3 54.10 85.00
BROOKLYN PS 178 ST.CLAIR MCKELWAY 2163 DEAN STREET 11233 K-8 2.75 3.19 20 85.80 98.40
BROOKLYN JHS 278 MARINE PARK 1925 STUART STREET 11229 Jr. High-Intermediate-Middle 2.76 3.23 X 26 62.60 71.00
QUEENS JHS 072 CATH. & COUNT BASIE 133-25 GUY R BREWER BLVD. 11434 Jr. High-Intermediate-Middle 2.82 3.35 X 4 68.40 98.90
BRONX HERBERT LEHMAN HIGH SCHOOL 3000 EAST TREMONT AVENUE 10461 High school 2.67 3.22 2 66.80 91.00
BROOKLYN PS 151 LYNDON B JOHNSON 763 KNICKERBOCKER AVENUE 11207 Elementary 2.70 3.26 2 95.50 98.00
MANHATTAN JHS 143 ELEANOR ROOSEVELT 511 WEST 182ND STREET 10033 Jr. High-Intermediate-Middle 2.64 3.22 X 10 84.40 97.20
BROOKLYN BROOKLYN TECHNICAL HIGH SCHOOL 29 FT GREENE PLACE 11217 High school 2.85 3.44 58 50.70 78.70
BROOKLYN PS 165 IDA POSNER 76 LOTT AVENUE 11212 K-8 2.56 3.15 X 3 77.90 98.50
QUEENS CYNTHIA JENKINS SCHOOL 179-37 137 AVENUE 11434 Elementary 2.62 3.22 X 10 67.70 99.10
QUEENS PS 086 QUEENS 87-41 PARSONS BLVD. 11432 Elementary 2.59 3.19 6 74.30 97.70
BROOKLYN IS 285 MEYER LEVIN 5909 BEVERLY ROAD 11203 Jr. High-Intermediate-Middle 2.63 3.24 X 20 61.40 99.00
QUEENS RICHMOND HILL HIGH SCHOOL 89-30 114 STREET 11418 High school 2.86 3.48 41 61.80 96.80
BROOKLYN PS 327 DR. ROSE B. ENGLISH 111 BRISTOL STREET 11212 K-8 2.68 3.32 10 78.50 98.50
BROOKLYN PS 005 DR. RONALD MCNAIR 820 HANCOCK STREET 11233 Elementary 2.98 3.64 X 12 81.70 95.40
BROOKLYN PS 249 THE CATON 18 MARLBOROUGH ROAD 11226 Elementary 2.80 3.47 X 4 86.80 97.50
BROOKLYN PS 221 TOUSSAINT L’OUVERTURE 791 EMPIRE BOULEVARD 11213 Elementary 2.66 3.33 X 0 89.60 97.80
Source: Highlighted schools have the worst combined BCAS and SchoolStat scores for all of New York City and each of the five boroughs. Source: New York City Department of Education, “Building Condition Assessment Survey,” 2011-2012; New York City Department of Education, “School Facilities Summary Website,” retrieved February 2013; New York City Department of Education, “Report Pursuant to Local Law 69 (2011),” December 14, 2012; December 14, 2012; New York School Construction Authority, “Survey of School Buildings with Older T-12 Fluorescent Lighting Fixtures” September 14, 2012; New York City School Construction Authority, “Corrective Action for Visible PCB Ballast Leaks,” April 23, 2013; New York City Department of Buildings, “Building Information Search,” retrieved April 19, 2013; New York City Department of Education, “Demographic and Accountability Snapshot,” 2011-2012.
14 FALLINGFURTHERAPART Decaying Schools in New York City’s Poorest Neighborhoods 15
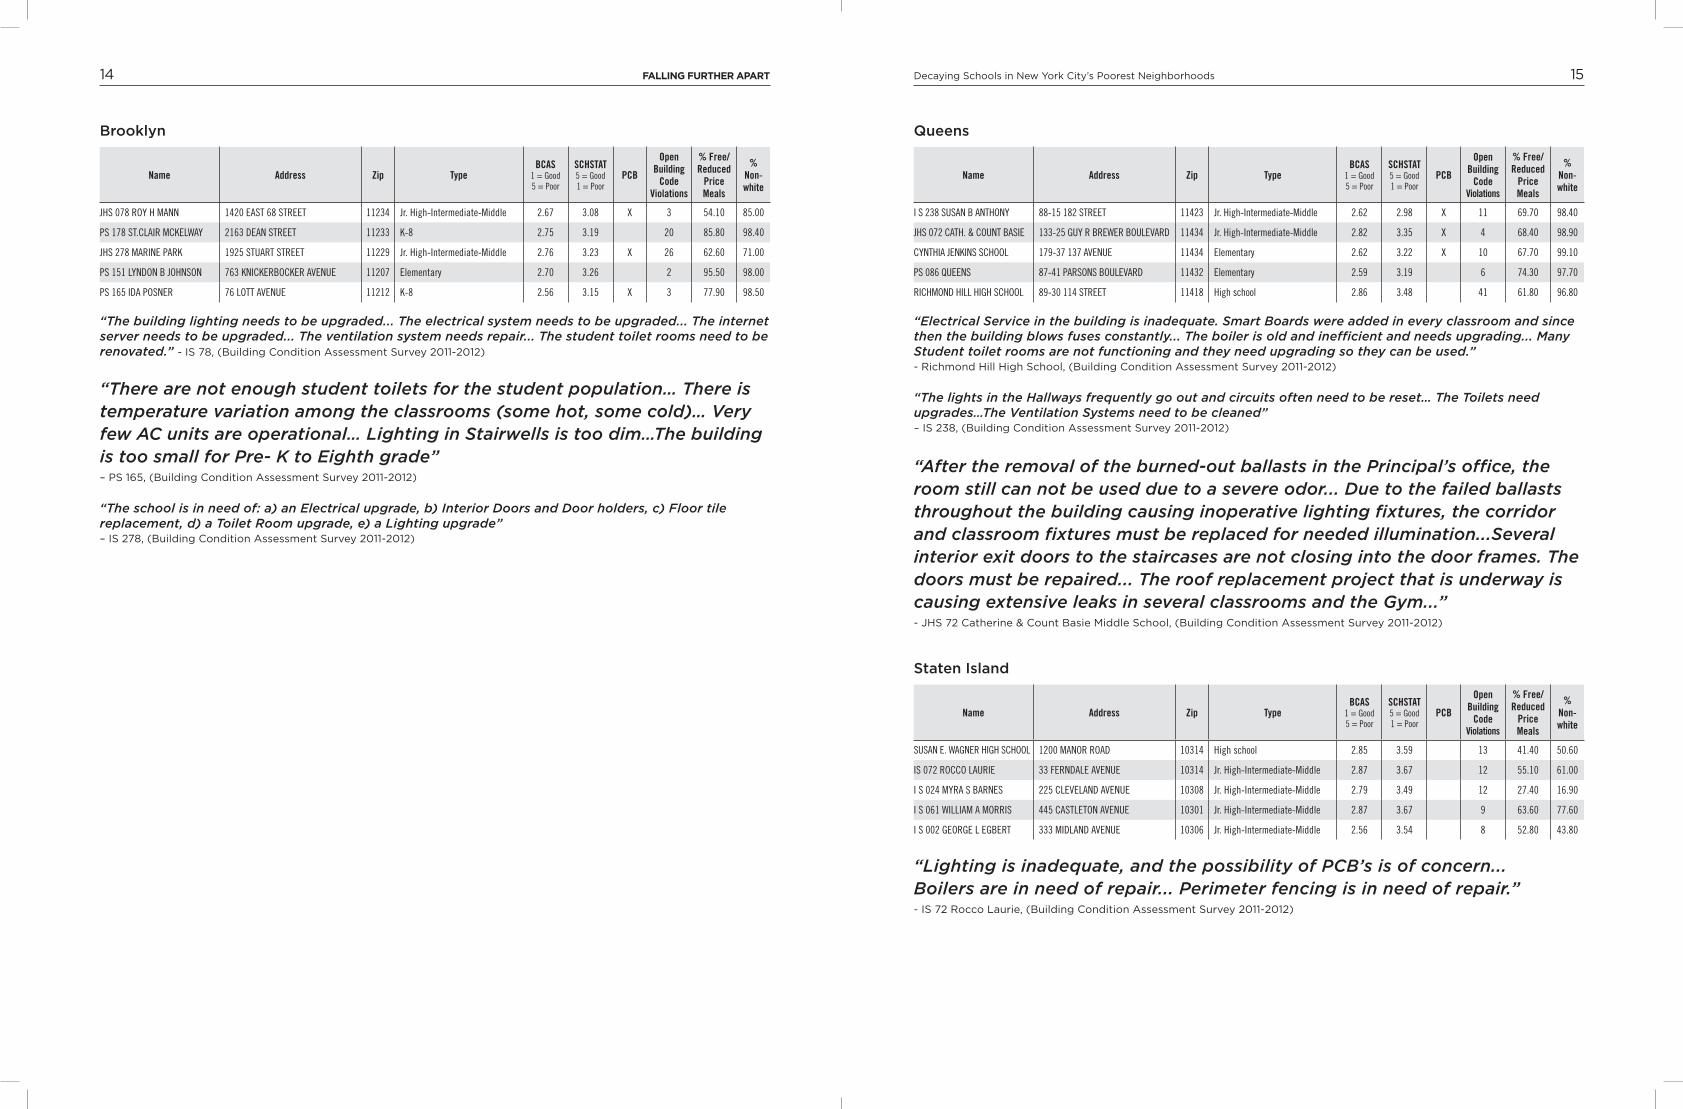
Queens
Name Address Zip TypeBCAS
1 = Good 5 = Poor
SCHSTAT 5 = Good 1 = Poor
PCB
Open Building
Code Violations
% Free/Reduced
Price Meals
% Non-white
I S 238 SUSAN B ANTHONY 88-15 182 STREET 11423 Jr. High-Intermediate-Middle 2.62 2.98 X 11 69.70 98.40
JHS 072 CATH. & COUNT BASIE 133-25 GUY R BREWER BOULEVARD 11434 Jr. High-Intermediate-Middle 2.82 3.35 X 4 68.40 98.90
CYNTHIA JENKINS SCHOOL 179-37 137 AVENUE 11434 Elementary 2.62 3.22 X 10 67.70 99.10
PS 086 QUEENS 87-41 PARSONS BOULEVARD 11432 Elementary 2.59 3.19 6 74.30 97.70
RICHMOND HILL HIGH SCHOOL 89-30 114 STREET 11418 High school 2.86 3.48 41 61.80 96.80
“Electrical Service in the building is inadequate. Smart Boards were added in every classroom and since then the building blows fuses constantly... The boiler is old and inefficient and needs upgrading... Many Student toilet rooms are not functioning and they need upgrading so they can be used.” - Richmond Hill High School, (Building Condition Assessment Survey 2011-2012)
“The lights in the Hallways frequently go out and circuits often need to be reset… The Toilets need upgrades…The Ventilation Systems need to be cleaned” – IS 238, (Building Condition Assessment Survey 2011-2012)
“After the removal of the burned-out ballasts in the Principal’s office, the room still can not be used due to a severe odor... Due to the failed ballasts throughout the building causing inoperative lighting fixtures, the corridor and classroom fixtures must be replaced for needed illumination...Several interior exit doors to the staircases are not closing into the door frames. The doors must be repaired... The roof replacement project that is underway is causing extensive leaks in several classrooms and the Gym...”
- JHS 72 Catherine & Count Basie Middle School, (Building Condition Assessment Survey 2011-2012)
Staten Island
Name Address Zip TypeBCAS
1 = Good 5 = Poor
SCHSTAT 5 = Good 1 = Poor
PCB
Open Building
Code Violations
% Free/Reduced
Price Meals
% Non-white
SUSAN E. WAGNER HIGH SCHOOL 1200 MANOR ROAD 10314 High school 2.85 3.59 13 41.40 50.60
IS 072 ROCCO LAURIE 33 FERNDALE AVENUE 10314 Jr. High-Intermediate-Middle 2.87 3.67 12 55.10 61.00
I S 024 MYRA S BARNES 225 CLEVELAND AVENUE 10308 Jr. High-Intermediate-Middle 2.79 3.49 12 27.40 16.90
I S 061 WILLIAM A MORRIS 445 CASTLETON AVENUE 10301 Jr. High-Intermediate-Middle 2.87 3.67 9 63.60 77.60
I S 002 GEORGE L EGBERT 333 MIDLAND AVENUE 10306 Jr. High-Intermediate-Middle 2.56 3.54 8 52.80 43.80
“Lighting is inadequate, and the possibility of PCB’s is of concern... Boilers are in need of repair... Perimeter fencing is in need of repair.” - IS 72 Rocco Laurie, (Building Condition Assessment Survey 2011-2012)
Brooklyn
Name Address Zip TypeBCAS
1 = Good 5 = Poor
SCHSTAT 5 = Good 1 = Poor
PCB
Open Building
Code Violations
% Free/Reduced
Price Meals
% Non-white
JHS 078 ROY H MANN 1420 EAST 68 STREET 11234 Jr. High-Intermediate-Middle 2.67 3.08 X 3 54.10 85.00
PS 178 ST.CLAIR MCKELWAY 2163 DEAN STREET 11233 K-8 2.75 3.19 20 85.80 98.40
JHS 278 MARINE PARK 1925 STUART STREET 11229 Jr. High-Intermediate-Middle 2.76 3.23 X 26 62.60 71.00
PS 151 LYNDON B JOHNSON 763 KNICKERBOCKER AVENUE 11207 Elementary 2.70 3.26 2 95.50 98.00
PS 165 IDA POSNER 76 LOTT AVENUE 11212 K-8 2.56 3.15 X 3 77.90 98.50
“The building lighting needs to be upgraded... The electrical system needs to be upgraded... The internet server needs to be upgraded... The ventilation system needs repair... The student toilet rooms need to be renovated.” - IS 78, (Building Condition Assessment Survey 2011-2012)
“There are not enough student toilets for the student population… There is temperature variation among the classrooms (some hot, some cold)… Very few AC units are operational… Lighting in Stairwells is too dim…The building is too small for Pre- K to Eighth grade” – PS 165, (Building Condition Assessment Survey 2011-2012)
“The school is in need of: a) an Electrical upgrade, b) Interior Doors and Door holders, c) Floor tile replacement, d) a Toilet Room upgrade, e) a Lighting upgrade” – IS 278, (Building Condition Assessment Survey 2011-2012)
16 FALLINGFURTHERAPART
1 New York City Department of Education “Demographic and Accountability Snapshot” denotes ethnicity options as “White”, “Black”, “Hispanic”, and “Asian.” The percentage of Nonwhite students is the result of subtracting the percentage of “White” students in a school from 100 percent.
2 Analysis of data obtained from New York City Department of Education, “Demographic and Accountability Snapshot,” 2011-2012, available online at http://schools.nyc.gov/Accountability/data/default.htm; Dataset consists of 1,509 schools.
3 New York Times, “A Portrait of Segregation in New York City’s Schools,” May 11, 2012, available online at http://www.nytimes.com/interactive/2012/05/11/nyregion/segregation-in-new-york-city-public-schools.html.
4 New York City Independent Budget Office, “Have NYC Schools Become More or Less Integrated Over the Last 10 Years?,” February 21, 2013, available online at www.ibo.nyc.ny.us/iboreports/printnycbtn11.pdf.
5 State of New York, “KWIC Indicator: Children Receiving Free or Reduced-price Lunch – Public Schools,” 2010-2011; U.S. Department of Education National Center for Education Statistics, “Numbers and Types of Public Elementary and Secondary Schools from the Common Core of Data,” 2010-2011.
6 Analysis of data obtained from New York City Department of Education, “Demographic and Accountability Snapshot,” 2011-2012; The correlation between percent of students qualifying for free or reduced price meals and percentage of nonwhite students in a school was tested using a Pearson’s r test, a test of the strength of linear correlation for paired numeric data. The relationship is significant at the 95 percent level with a P-value of <0.00001 and a sample size of 1,509.
7 Analysis of data obtained from: New York City Department of Education, “School Facilities Summary Website,” retrieved February 2013; United States Census, “American Community Survey Five-Year Estimates,” 2011 using the variable “Percentage of families and people whose income in the past 12 months is below the poverty level.” A t-test, a statistical hypothesis test used to determine if two sets of data are significantly different from each other, was used to determine if the BCAS scores are significantly different for the highest and lowest ten percent of schools in the dataset, according to Census poverty rate for the school’s Census tract. The BCAS values for the two groups of schools are significantly different from each other at the 95 percent level with a P-value, the probability of obtaining a test statistic at least as extreme as the one that was actually observed, of 0.0290 and a sample size of 176.
8 All New York City schools are subject to the Building Condition Assessment Survey once every five years. The assessments are conducted by a team of building profes-sionals that include professional engineers and architects, one of whom must be licensed in New York State. Each school is given a score for its electrical, mechanical, and architectural integrity. These scores are used to compute an overall score for the building on a scale from 1 to 5 (1 = Good; 2 = Fair to Good; 3 = Fair; 4 = Fair to Poor; 5 = Poor).
9 Analysis of data obtained from: New York City Department of Education, “Demographic and Accountability Snapshot,” 2011-2012; New York City Department of Education, “School Facilities Summary Website,” retrieved February 2013. The correlation between percent of students qualifying for free or reduced price meals and SchoolStat for a school was tested using a Pearson’s r test. The relationship is significant at the 95 percent level with a P-value of 0.000424 and a sample size of 942.
10 A SchoolStat is assigned by the Division of School Facilities (“DSF”) to standardize the evaluation of maintenance and cleanliness. According to the DSF, data derived from a list of standardized questions are converted into numerical values on a scale of 1 to 5 (1 = Poor; 2 = Fair to Poor; 3 = Fair; 4 = Fair to Good; 5 = Good).
11 Annenberg Institute for School Reform, “Is Demography Still Destiny?,” 2012.
12 U.S. Green Building Council, “Greening America’s Schools: Costs and Benefits,” October, 2006.
13 Ibid
14 Where there are multiple schools within a building, each school is treated as a separate school. New York School Construction Authority, “Completed Light Replacements,” April 12, 2013.
15 Analysis of data obtained from: New York City Department of Education, “Report Pursuant to Local Law 69 (2011),” December 14, 2012; December 14, 2012; New York School Construction Authority, “Survey of School Buildings with Older T-12 Fluorescent Lighting Fixtures” September 14, 2012; New York City School Construction Authority, “Corrective Action for Visible PCB Ballast Leaks,” April 23, 2013. All reports available online at www.nycsca.org/Community/Programs/EPA-NYC-PCB/Pages/default.aspx.
16 Analysis of data obtained from: New York City Department of Education, “Demographic and Accountability Snapshot,” 2011-2012; New York School Construction Authority, “Completed Light Replacements,” April 12, 2013; New York City Department of Education, “Report Pursuant to Local Law 69 (2011),” December 14, 2012; New York School Construction Authority, “Survey of School Buildings with Older T-12 Fluorescent Lighting Fixtures” September 14, 2012. A t-test was used to determine if the percentage of students qualifying for free or reduced price meals and the percentage of nonwhite students are significantly different for the schools whose PCB lights have been removed and those who still await replacement. The values for the two groups of schools are significantly different from each other at the 95 percent level with a P-value of 0.0061 for free or reduced price lunch test and a P-value of 0.0140 for the nonwhite test, with a sample size of 885 (122 for completed schools and 766 wait list schools).
17 American Association of School Administrators, “Surviving a Thousand Cuts: America’s Public Schools and the Recession,” December 2010.
18 Analysis of data obtained from New York City Department of Education, “Current Approved Budget Condition,” fiscal years 2005 – 2012; New York City Office of Management and Budget, “Preliminary Budget: Department of Education Agency Expense Budget Summary,” fiscal year 2014; for fiscal years 2009, 2010, 2011, and 2010 figures do not include budget and commitments under line item “436 - School Facilities Other than Personnel Services” for pollution remediation obligations under GASB 49.
19 Analysis of data obtained from Department of Education Division of School Facilities, “Custodial Engineer Circulars,” June 2011, December 2009, June 2008, October 2006, October 2003.
20 New York School Construction Authority, “Five-Year Capital Plan Amendment” February 2013.
21 Analysis of fiscal year 2013 budgets of Broward County, Clark County, Miami-Dade County, Houston Independent, Los Angeles Unified, and New York City school districts. Percentage reflects total spent by districts on M&O divided by the total expenditures for the fiscal year, excluding debt service and capital outlay. See: Broward County 2012-13 General Fund Budget (includes “Maintenance of Plant” and “Operation of Plant”); Chicago Public Schools Amended Budget 2012-2013 (includes “Department of Facilities Operations and Maintenance”); Clark County School District Comprehensive Annual Budget Report for Fiscal Year Ending June 30, 2013 (includes “Operations and Maintenance of Plant: Percentage of Budget”); Miami-Dade Public Schools Budget Summary Proposed Operating Budget Expenditures for Fiscal Year 2012-2013 (includes “Operation of Plant” and “Maintenance of Plant”)Houston Independent School District 2012-2013 Adopted Budget Financial Section (Facilities budget includes “Plant Maintenance and Operations”); Los Angeles Unified School District Superintendent’s 2012-2013 Final Budget (includes “2400 Maintenance and Operations Employees” and “5500 Utilities and Housekeeping Services” from General Fund – Unrestricted and Restricted Program Expenditures by Sub-Object); New York City Department of Education Agency Expense Budget Summary Current Modified Budget for Fiscal Year 2013 (includes “435 School Facilities Personnel Services,” “436 School Facilities Other Than Personnel Services”, “444 Energy and Leases”).
22 American School and University Magazine, “38th Annual Maintenance and Operations Cost Study for Schools,” April 1, 2009 (most recent available).
23 Analysis of data obtained from the New York City Department of Education, “Building Condition Assessment Survey,” 2011-2012; Dataset consists of 1,125 schools.
24 New York City Department of Education – School Construction Authority, “Hearing on the Fiscal 2014 Preliminary Capital Budget and the Fiscal 2013 Mayor’s Management Report,” March 19, 2013.
25 Analysis of data obtained from the New York City Department of Education, “Building Condition Assessment Survey,” 2011-2012; Dataset consists of 990 schools.
26 Ibid
27 New York City Department of Education – School Construction Authority, “Proposed Five-Year Capital Plan Amendment,” February 2013.
28 Analysis of data obtained from the New York City Department of Education, “Building Condition Assessment Survey,” 2011-2012; Dataset consists of 990 schools.
29 Ibid
30 Analysis of data obtained from New York City Department of Buildings, “Building Information Search,” retrieved February 2013
Endnotes