vulnerabilities to climate change in the agriculture · pdf filevulnerabilities to climate...
TRANSCRIPT

Vulnerabilities to climate change in the agriculture sector
Satya Priya, PhD
AIT/UNEP Regional Resource Centre for Asia and the Pacific
August, 2010

2
DroughtDroughtrisk
Hazard(potential)
Flood
Vulnerabilityto hazard
Risk dueto hazard
Floodrisk
StormStormrisk
GlobalClimate
Climaterelatedrisk
Changein hazard
Changein risk
What does “Vulnerability to Climate Change“ mean?

Elements of Agriculture Sector Value Chain
3
Step 1: Field preparation
Step 2: Crop development stage
Step 3: Post harvest treatments
Step 4: Rural roads to reach markets
Step 5: Traders/export markets
Irrigation facilities
Crop mgt/fertigation, etc
Drying Threshing Milling Storage
Types of roads, e.g., national, municipal, local etc
Head rice
Rice bran Ethanol Others...
Source: RMSI, 2008

Understanding the problem
Trends
Hotter, drier summers
Milder, wetter winters
Greater proportion of rain in heavy downpours
Sea level rise
EventsHeat waves
Droughts
Floods
Fewer cold snaps
Storms
ImpactsDamage to physical assets
Loss of access to agri. facilities
Effects on biological/ industrial processes
Changing commodity prices/ availability
Damage to critical infrastructure
Changing lifestyles and consumer tastes
Uncomfortable indoor environment
Consequences
Loss of business continuity
Changing raw material, repair, maintenance, insurance costs
Increased/ decreased productivity
Changing markets
Effect on reputation
Health/ comfort implications for employees

Understanding Climate Vulnerabilities for Agriculture
• Vulnerability
– Heuristic approach
• Climate indices
• Critical threshold
• Risk indices
– A process based deterministic approach
• A case study from India
• From impacts to future risk
– Probabilistic approach – reference case study from Philippines
• Vulnerability to risk (loss) quantification
• Key messages
– Recommendations

6
Heuristically developed metrics using
stakeholder consultations
Source: Cynthia Rosenzweig, et al

7
Design climate indices for rainfed rice
Climate indices related to farming practice and crop phenology:
Assume planting when rainfall exceeds a certain threshold
Calculate rainfall and temperature characteristics for the 3 different crop growth stages (vegetative, reproductive, ripening)
Calculate the net water to the soil at different crop stages
Source: PhilRice, 2007

8
Critical threshold and Risk indices

Case Study: Drought Prone Andhra Pradesh in India
Source: World Bank, 2009
Background:
5th largest state in terms of
both geography and
population
State falls under arid part
of Indian peninsula
Drought is a recurring
threat
Surface water are limited
Groundwater extraction is
high
Water availability is binding
constraints on farming
systems
Source: World Bank, 2009

Objective:
Mainstream climate risk management into development policy through a bottom up approach
Approach:
• To generate information and understand current coping and CRM strategies in response to droughts
• To understand government responses and their effectiveness
• To develop and demonstrate the climate modelling framework for future risks
• To use this knowledge to assist adaptation plan that can help improve adaptive capacity
10
Objective and Approach

11Source: World Bank, 2009
Study Framework
Current coping and adaptation measures
Based on existing studies, Information and knowledge
Opportunities for enhancing adaptation and reducing vulnerability to climate variability and change
Evaluation of current climate
and its variability
Evaluation of impacts due to climate change
& variability
Evaluate farm-level economic
impact and response options
Assessment of current coping and adaptation strategies
Development of integrated model to consider present climate trends and future climate scenarios and possible impacts on sectors
Assessment of government
responses
Issues and options in reducing vulnerability through adaptation

12
Process: Methodology for Climate Impact Analysis
• Learning from the past and Present
• Looking to the future
Source: World Bank, 2009

13
Anatomy of the Sample Villages
Study Villages in Ananthpur district
Source: World Bank, 2009
Income
Average monthly income
ranges from Rs 2686 to 1731
Definition of household:
Large: >= 5 Ha of land size
Medium: >= 3.5 Ha of land
Marginal <=2 Ha of land
Landless
High Dependence on agriculture:
Large and medium obtain
86% of income from farming
Small and landless farmers
has almost no asset – forced
into wage employment

14
Socioeconomic Profile of Study Villages
Source: World Bank, 2009

15
Impact of Drought on Households:
Current Coping Options
Source: World Bank, 2009; Drought year 2002-03 and Normal year 2003-04

Future Prospects under Climate Change
Spatial Distribution of Average Annual Rainfall in Pennar Basin
(Baseline and Climate Change Scenarios)
Baseline:
1961-1990
Climate Change
Scenarios:
A2, B2: 2071-
2100
Change in Average
Annual Rainfall:
A2: 8%; B2: 4%
Variability of Rainfall
Within and
between years
June & July are
expected to
receive less
rainfall
Source: World Bank, 2009
Maximum Temperature in Kharif Season

0
0.5
1
1.5
2
2.5
Rice Groundnut Jowar
Yield (t/ha)
BaselineA2B2
Yields of Rice, Groundnut and Jowar under Climate Change Scenarios
Focus:
Three major crops – 70% of
total outputs
Jowar and Groundnut are
dryland crops whereas rice is
a subsistence crop
Results:
Changes in the level and
distribution of rainfall
Groundnut yields fall in A2 by
28% and in B2 by 6%
Jowar exhibits resilience - 4%
decline in A2 and 2% in B2
Rice yield declines by 10%
and 4% in A2 and B2
Crop Response to Climate Change

18
Evaluation of Farm Economic Impact Options
Will Crop Response to Climate
Change influence
Farm incomes?
Crop Choices? and
Farm management
regimes?
To answer these questions the
economic model compares
and estimates
The baseline, A2, B2
Cropping mix options
based on farm size,
returns, with climatic
events and water avail.
Prices used (as in 2007) Source: RMSI, 2008

Economic Assessment: Baseline Comparisons
Per Ha Baseline Comparisons
Groundnut dominates on
average profitability
followed by jowar and
rice crop
Profits from each crop
reflect a) the yield; b) the
price of the crop and )
the production costs
0
1000
2000
3000
4000
5000
6000
7000
8000
Rice Groundnut Jow ar
(Rs/Ha)
Per Hectare Average Profits in Baseline Scenario
Area in Baseline Predicts
Cropping mix options
based on farm size,
returns, MSP, with
climatic events and
water avail.
Prices used (as in 2007)
Rice, 0.5 Rice, 0.5 Rice, 0.5
Groundnut, 1.5
Groundnut, 3
Groundnut, 4
Jowar, 0
Jowar, 0
Jowar, 0
0
0.5
1
1.5
2
2.5
3
3.5
4
4.5
5
Small Farm Medium Farm Large Farm
(Ha)
Area Allocation in Baseline Scenario, Ananthpur
Source: World Bank, 2009

20
Per Hectare Profits
With all else equals under
climate change scenarios :
groundnut remains the most
profitable crop
Therefore, there is no change
in planting mix between the
three crops
Per Hectare Average Profits in CC Scenario
Total Profits
With declining average yield
– overall profitability declines
Greatest reduction in A2 ~
20%; B2 ~ 5%
With returns falling down -
income of small farmers are
not enough to sustain
Total Profits in CC Scenario, Ananthpur
3715
7077
4034
3483
5080
33243633
6594
3583
0
1000
2000
3000
4000
5000
6000
7000
8000
Rice Groundnut Jow ar
(Rs/Ha)
BaselineA2B2
0
5
10
15
20
25
30
35
Small Farms Medium Farms Large Farms
(Thousand Rs)
BaselineA2B2
Projected Impacts of Climate Change Scenarios
Source: World Bank, 2009

21
Pulling Together the Pieces: Policy Implications
• Innovation and Reforms in Agriculture– Water conversation and management
– Agriculture diversification
– Smart subsidies and incentives
• Information on Vulnerabilities and Risks to Build Adaptive Capacity and Resilience– Tools are needed to identify area facing increased risks to build synergies
with existing program and communities
– Diagnostic tools are needed to assess economic life of long-terms infrastructure investments against climate risks
• Financial and Economic Instruments– Debt Relief to Facilitate Income Diversification
– Weather Indexed Insurance: Challenge and Opportunity (An illustration)
• Institutional Needs and Priorities– Vertical and horizontal integration
22
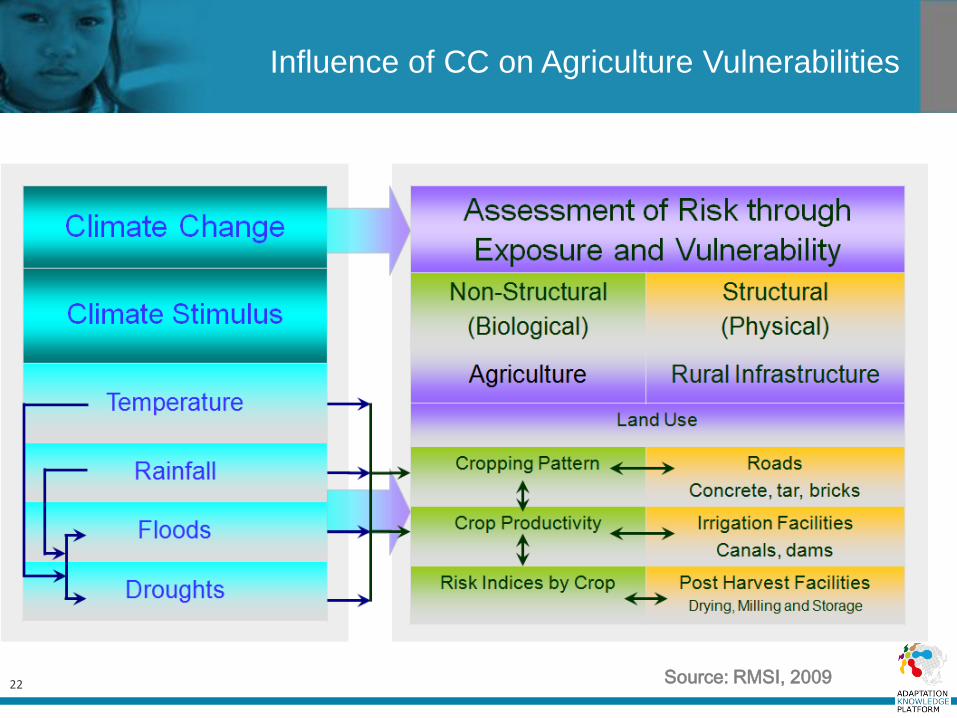
Influence of CC on Agriculture Vulnerabilities
Source: RMSI, 2009

23
• Climate Change Analysis
– Historical analysis and changes
– Future climate change and scenarios
– Downscaling of climate data
• Risk Assessment
– Development of probablistic risk model
– Impacts of Climate Change on hydro-meteo risks and expected economic losses
– Agriculture and rural infrastructure such as agri. production chain
• Address Adaptation issues such as
– Status of todays rural infrastructure inventory
– Evaluation of rural infrastructure in a longer term planning context
• Deliver a climate-resilient approach through
– Ex: climate and drought/flood risk model
Assessing Impacts to the Rural Infrastructure Sector

Disaggregating Risk
Estimate Return Period and
Extent of Events
SimulateHydro-
meteorological Phenomena
Stochastic Module
Hazard Module
Estimate Vulnerability of
Rural and Agricultural
Assets
VulnerabilityModule
Map Exposure of Agricultural
Assets Categories
Exposure Module
Compute Damages to Agricultural
Assets
Loss Module
Historical Observations of Floods, Streamflow, Precipitation, and
Temperature.
Historical Losses, Crop Models, Field
Experiments, Cropping Systems, Water Use, Engineering Data etc.
GIS data on cropping patterns,
(non-) irrigated areas, land use,
infrastructure etc.
Economic Losses in Rural Areas due toExtreme Hydro-Meteorological Events
Probabilistic Estimates of
Potential Economic Losses
Source: RMSI, 2009

Resolution
Philippines Provinces
Philippines Provinces - 6
Area – 22269.5 sq. km.
Philippines Municipalities
Number of Municipalities - 93
Philippines Barangys
Number of Barangys - 2329Source: RMSI, 2009

Risk Quantifier and Exposure
Drought - Event definition
Probabilistic approach
Location, size, and rate
Exposure definition
Location and value
Crop acreage and yield
Roads, irrigation and buildings replacement cost
Vulnerability
Crop acreage and yield reduction
Roads, irrigation canals and buildings repair cost (MDR)
Loss
Monetary quantification

27
Rain-fed crop wet season - Cagayan Irrigated crop wet season - Isabella
Loss exceedance curves
Source: RMSI, 2008

Example: Deviation in rainfall and impact on yield
170mm
11-24Jun 25Jun-15Jul 16Jul-26Aug 27Aug-7Oct 8Oct-11Nov
Presowing Seedling Vegetative Reproductive Maturity
2 wks 3 wks 6 wks 6 wks 5.5 wks
50mm
60mm
170mm
40mm
40-50mm 50-60mm 150-170mm 160-170mm 40mm
100mm
170mm
Loss in
yield
Wate
r
requ
ire
me
nt
Sta
ge
s
Tim
e
Output
100mm
(Source: ICICI Lombard)
Risk Transfer Mechanism: Weather Insurance

29
Key Recommendations
Phenophase-based vulnerability assessment– Existing damage matrices need to be upgraded to phenophase (crop stage)
based matrices
Modeling framework/tools can be utilized and ported to other areas with following modifications
– Data base
– Model base
– Knowledge base
Examine effectiveness of wide range of policy interventions – Changes in MSP
– Resource optimization
– Weather Index Insurance
Sufficient data are needed to perform fully deterministic and probabilistic risk analysis for drought, flood and cyclones– Such an approach should be followed in any further analysis
– Stochastic set of events for hydro-meto perils should be generated to create a unbiased picture of the risk

Secretariat
AdaptationKnowledgePlatform
Asian Institute of Technology/UNEP Regional Resource Center for Asia & the PacificAsian Institute of Technology, Outreach Building
P O Box 4, Klong Luang, Pathumthani 12120, Thailand
30
Working closely with national & regional partners to develop and implement programme of activities
Thank you!!
Email: [email protected]