volume 23 number 11 medical sureillance monthly report
TRANSCRIPT

M E D I C A L S U R V E I L L A N C E M O N T H L Y R E P O R T
MSMR
A publication of the Armed Forces Health Surveillance Branch
NOVEMBER 2016
Volume 23Number 11
P A G E 2 Excessive vomiting in pregnancy, active component service women, U.S. Armed Forces, 2005–2014Valerie F. Williams, MA, MS; Leslie L. Clark, PhD, MS; Gi-Taik Oh, MS
P A G E 1 0 Importance of external cause coding for injury surveillance: lessons from assessment of overexertion injuries among U.S. Army soldiers in 2014Michelle Canham-Chervak, PhD, MPH; Ryan A. Steelman, MPH; Anna Schuh, PhD; Bruce H. Jones MD, MPH
P A G E 1 6 Acetaminophen overdoses, active component, U.S. Armed Forces, 2006–2015
Leslie L. Clark, PhD, MS; Stephen B. Taubman, PhD
U.S. Food and Drug Administration

MSMR Vol. 23 No. 11 November 2016 Page 2
Up to 80% of women experience some form of nausea and vomiting during pregnancy. However, in some women, nausea and vomiting can be exces-sive and require inpatient and/or outpatient treatment. Data were obtained on 149,071 live births from 116,510 service women from 1 January 2005 through 31 December 2014. A total of 19,175 of the service women with live births had pregnancies complicated by excessive vomiting in pregnancy (EVP) and accounted for 20,511 EVP cases (overall rate of 13.8%). Mild and severe hyperemesis gravidarum (HG) combined accounted for almost two-thirds of the total EVP cases. The slight increase observed in the annual rate of EVP between 2005 and 2014 was driven largely by the outpatient trend for mild HG. Together, mild and severe HG accounted for three-quarters of all hospital bed days for EVP. About one-third of the women with EVP-compli-cated pregnancies had two or more EVP-related medical encounters. A bet-ter awareness of this medical condition, severity of its symptoms, and their effect on a woman’s functioning is needed to provide effective interventions that protect a woman’s health-related functional status.
Excessive Vomiting in Pregnancy, Active Component Service Women, U.S. Armed Forces, 2005–2014Valerie F. Williams, MA, MS; Leslie L. Clark, PhD, MS; Gi-Taik Oh, MS
Nausea and vomiting affect 50%–80% of all pregnant women1-4 and can have a substantial negative
effect on quality of life during pregnancy.5-7 In most women, nausea and vomiting are mild, self-limiting, and have little or no impact on the mother and the developing fetus. However, in some women, nausea and vomiting can be excessive and persistent—lasting beyond the first trimester and requiring dietary changes or medication to control symptoms.8
The most severe form of excessive vomit-ing in pregnancy (EVP) is called hyperemesis gravidarum (HG). HG has been estimated to occur in 0.3%–3% of all pregnancies9-12 and is characterized by severe and intractable nau-sea and vomiting that can lead to dehydration, electrolyte and metabolic disturbances, and nutritional deficiencies.13-14 Hospitalization may be required for correction of fluid and electrolyte imbalances as well as administra-tion of antiemetic medication and provision of nutritional counseling. Adverse maternal
and fetal outcomes may occur in cases with lack of symptom control, poor maternal weight gain, and persistent electrolyte abnor-malities. 8-9,13,15-16 An estimated 50% of women presenting with HG will require inpatient treatment (general U.S. population).5
Despite its low incidence, HG is the sec-ond most common reason for prenatal hospi-talizations in the U.S., accounting for 11.4% of all non-delivery prenatal admissions.17-18 In the U.S. in 2012, more than 285,000 women were admitted to hospitals for HG with costs per HG patient estimated at $47,351.19 The actual cost of HG is likely significantly higher when considering other factors such as emer-gency department visits, complications due to severe HG, and the fact that up to 35% of women with paid employment will lose time from work due to this condition.20
Women of reproductive age represent the majority of military females.21 Dur-ing 2001–2012, approximately 190,000 live births occurred among active component
service women.22 Accordingly, the past decade has seen a considerable increase in military-specific reproductive research.21 However, no studies have focused on EVP among a population of U.S. service women since the 1990s.23 The majority of studies of this condition among U.S. civilian women have focused on hospital admissions for HG.
9,14,24-28 The current study broadens the case definition to include all EVP diagnosis codes and draws on records of both inpatient and outpatient healthcare encounters.
This report summarizes the counts, rates, trends, and demographic and occu-pational characteristics of active component service women who had live births and were diagnosed with EVP in the course of their pregnancies during the surveillance period from 2005 through 2014. This report also provides estimates of the “morbidity bur-den” attributable to EVP based on the total number of EVP-related medical encounters, number of service women affected, and total bed days during hospitalizations for EVP.
M E T H O D S
The surveillance period was 1 Janu-ary 2005 through 31 December 2014. The surveillance population included all active component service women of the U.S. Army, Navy, Air Force, and Marine Corps who served at any time during the surveil-lance period. Records of both inpatient and outpatient healthcare encounters docu-mented in the databases of the Defense Medical Surveillance System (DMSS) were searched to ascertain cases of EVP.
A case of EVP was defined by a record of a hospitalization or an outpatient encounter that included an ICD-9 code for EVP in either the first or the second diag-nostic position (Table 1). Each individual could be diagnosed as a case of EVP only

November 2016 Vol. 23 No. 11 MSMR Page 3
T A B L E 1 . ICD-9 diagnostic codes used to identify excessive vomiting in pregnancy (EVP)
T A B L E 2 . Numbers of live births, cases of excessive vomiting in pregnancy (EVP), and service women affected, active component, U.S. Armed Forces, 2005–2014
one time each per live birth and, for the pur-poses of examining rates over time, occur-rence of EVP was linked to the year of live birth. If female service members had more than one case-defining encounter during pregnancy, an inpatient diagnosis was pri-oritized over an outpatient diagnosis, after which diagnoses were prioritized in terms of severity—for example, severe HG (ICD-9: 643.1x) > mild HG (ICD-9: 643.0x) > late vomiting (ICD-9: 643.2x) > other vomiting complicating pregnancy (ICD-9: 643.8x) > unspecified vomiting of pregnancy (ICD-9: 643.9x).
In estimating the rate of EVP, the appropriate denominator is difficult to define. It is problematic to determine the number of pregnancies in the study popu-lation for a given period. Studies of early pregnancy have estimated that up to 40% of all conceptions are lost before 24 weeks, and that 22% of those are not even clini-cally recognized.29-30 Because live births are more easily identified, the rate of EVP to live births is presented here rather than the rate of EVP in pregnancy.
The denominator for rate calculations consisted of active component females who had medical encounters that docu-mented live births. A live birth delivery was defined by a hospitalization record with an ICD-9 code of 650.xx–659.xx (if fifth digit is specified, must be 1 or 2 for
delivered) [excluded: 656.41, intrauter-ine death], 660.xx–679.xx (if fifth digit is specified, must be 1 or 2 for delivered) or V27.0, V27.2, V27.3, V27.5, V27.6 in any diagnostic position. Individuals were allowed one live birth delivery every 280 days. The estimated date of conception was defined as the date 280 days before the start of the delivery hospitalization. The surveillance period was extended an addi-tional 280 days to capture information on live births for service women with EVP diagnoses recorded near the end of calen-dar year 2014.
The numerator for rate calculations consisted of cases among the cohort of service women with a live birth during the surveillance period who met the case definition for EVP during the 280 days before the start of their delivery hospital-ization. The rate of EVP was calculated as a percentage of live births. Service women in the numerator were further catego-rized as having had a multiple pregnancy (ICD-9: V27.2, V27.3, V27.5, V27.6, 651.x1, 652.61, 660.51) or a single pregnancy (all other codes not multiple). It is impor-tant to note that, because EVP can result in poor fetal health outcomes (including miscarriage/mortality), rates as a percent-age of live births will be an underestima-tion of all EVP. To capture information on any excluded cases, the number of
individuals with EVP who did not have a live birth on record also was summarized.
The burden of morbidity attributable to EVP was estimated based on the total number of prenatal EVP-related medi-cal encounters (i.e., total hospitalizations and ambulatory visits for EVP with a limit of one encounter per individual per EVP diagnosis per day), number of service women affected, and total bed days dur-ing hospitalizations for EVP. For reporting by diagnosis code, the same prioritization rule was applied (e.g., severe HG > mild HG > late vomiting > other vomiting com-plicating pregnancy > unspecified vomit-ing of pregnancy).
R E S U L T S
Data were obtained on a total of 149,071 live births from 116,510 service women during the 10-year surveillance period. A total of 19,175 of the service women with live births had pregnancies complicated by EVP. Of the service women affected by EVP, a total of 6,490 (33.8%) contributed two or more live births. Because a subset of these service women had multiple live births with pregnancies complicated by EVP, the total live births accounted for 20,511 EVP cases overall (Table 2).
The overall rate of EVP during the surveillance period was 13.8%. Total EVP rates were highest for mild HG (7.4%) and “unspecified vomiting of pregnancy” (3.2%) and lowest for “other vomiting
ICD-9 code Diagnosis Description
643.0x Mild hyperemesis gravidarum (HG)
HG, mild or unspecified, starting before the end of the 22nd week of gestation
643.1xHG with meta-bolic disturbance (severe)
HG, starting before the end of the 22nd week of gestation, with metabolic disturbance such as: carbohydrate depletion, dehydration, electrolyte imbalance
643.2xLate vomiting of pregnancy, un-specified
Excessive vomiting starting after 22 completed weeks of gestation
643.8xOther vomiting complicating preg-nancy
Vomiting due to organic disease or other cause, specified as compli-cating pregnancy, or as a reason for obstetric care during pregnancy
643.9x Unspecified vomit-ing of pregnancy
Vomiting as a reason for care during pregnancy, length of gestation unspecified
Total no.Live births during surveillance period 149,071
Service women with live births 116,510
Cases of EVP 20,511
Service women affected 19,175
With 1 live birth 12,865
With 2+ live births 6,490

MSMR Vol. 23 No. 11 November 2016 Page 4
complicating pregnancy” (0.5%) (Table 3). Taken together, mild and severe HG accounted for close to two-thirds of the total EVP cases. The vast majority (95.5%) of total EVP cases were associ-ated with outpatient encounters. Severe HG accounted for a higher proportion of inpatient EVP cases than outpatient cases (31.7% vs. 9.1%, respectively). A simi-lar but less pronounced difference was observed for “late vomiting of pregnancy”; this diagnostic subcategory accounted for 15.1% of inpatient EVP cases and 9.2% of outpatient cases. “Unspecified vomiting of pregnancy” accounted for a higher pro-portion of outpatient EVP cases than inpa-tient cases (23.8% vs. 4.6%, respectively).
The annual EVP rate was 28.8% higher in 2014 than in 2005 (14.9% and 11.6%, respectively). Because the vast majority of EVP cases (95.5%) were diagnosed as out-patients, the upward trend in the overall rate was largely a reflection of the outpa-tient trend. Inpatient rates of EVP were relatively low and stable throughout the surveillance period (Figure 1). Mild HG
and “unspecified vomiting of pregnancy” were the two diagnoses that showed the most pronounced changes in annual rates over the course of the surveillance period. The annual rate for mild HG was 36.8% higher in 2014 than in 2005 (9.0% and 6.5%, respectively). The annual rate for “unspecified vomiting of pregnancy” peaked in 2010 at 4.0% followed by a slight decline in 2011 and then a leveling off through 2014 (Figure 2).
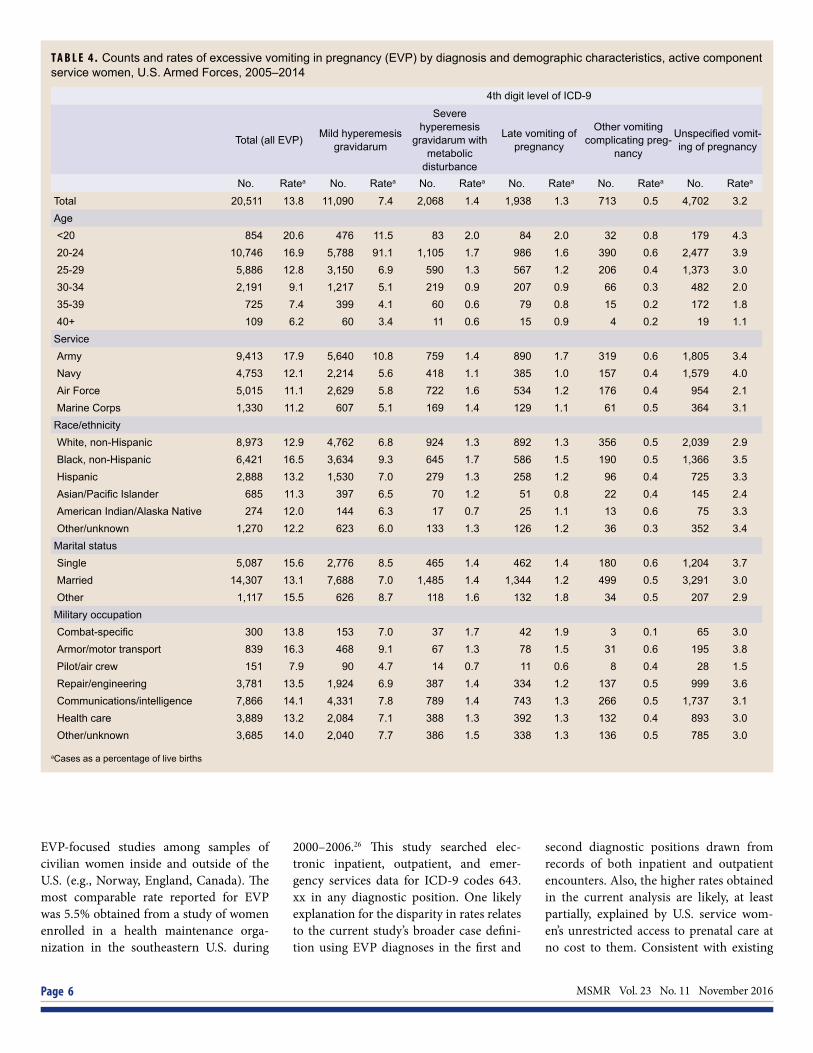
During 2005–2014, service women aged 24 years or younger had the highest overall EVP rates and the highest rates of mild and severe HG, compared with those in the other age groups (Table 4). Com-pared with other race/ethnicity groups, the overall EVP rate and the rate of mild HG were notably higher among black, non-Hispanic service women. Among the Services, rates of overall EVP and rates of mild HG were highest among female Army members, whereas the rate of severe HG was highest among female Air Force members. Married service women had the lowest rates of overall EVP and mild HG,
compared with those in the “single” and “other” categories. Compared with other service women, those in armor/motor transport occupations had higher rates of overall EVP and mild HG (Table 4).
Of the 20,511 EVP cases ascertained, the vast majority (98.1%) were associated with single pregnancies (data not shown). These cases represent 18,778 of the 19,175 service women with EVP-complicated pregnancies (data not shown). The overall distribution of proportions of EVP diag-noses associated with single versus mul-tiple pregnancies were roughly similar, with the highest percentages of cases rep-resented by mild HG and “unspecified vomiting of pregnancy” (data not shown). However, a slightly higher percentage of total EVP cases associated with multiple pregnancies were diagnosed as inpatients, compared with cases associated with sin-gle pregnancies (9.6% vs. 4.4%, respec-tively) (data not shown).
To capture information on any cases excluded from the main analysis, ser-vice women with EVP who did not have a live birth on record also were identified. A total of 21,132 incident EVP cases had no associated records of live births (data not shown). The proportions by encoun-ter type (inpatient vs. outpatient) for these EVP cases were comparable to that of the 20,511 cases with records of live births (data not shown). The diagnosis of “unspec-ified vomiting of pregnancy” accounted for a slightly higher proportion of the EVP cases without a live birth on record than among cases associated with a live birth (28.5% vs. 22.9%, respectively) (data not shown).
The 19,175 service women with preg-nancies complicated by EVP contributed a total of 37,688 prenatal EVP-related medical encounters during the surveil-lance period, the majority of which were ambulatory visits (96.9%) (Figure 3). Com-bined, mild HG and “unspecified vomit-ing of pregnancy” accounted for more than three-quarters (77.0%) of the total EVP-related medical encounters (48.3% and 28.7%, respectively). Severe HG and “late vomiting of pregnancy” accounted for 10.7% and 8.9% of total EVP-related encounters, respectively. Mild HG and “other vomiting complicating pregnancy”
T A B L E 3 . Counts and rates of EVP by diagnosis and encounter type, active component service women, U.S. Armed Forces, 2005–2014
Total 2005–2014
ICD-9 code Diagnosis Encounter type No. Ratea
TotalInpatient 921 0.62Outpatient 19,590 13.14Total 20,511 13.76
643.0xMild hyperemesis gravidarum
Inpatient 413 0.28Outpatient 10,677 7.16Total 11,090 7.44
643.1xSevere hyperemesis gravidarum
with metabolic disturbance
Inpatient 292 0.20Outpatient 1,776 1.19Total 2,068 1.39
643.2xLate vomiting of pregnancy
Inpatient 139 0.09Outpatient 1,799 1.21Total 1,938 1.30
643.8xOther vomiting complicating
pregnancy
Inpatient 35 0.02Outpatient 678 0.45Total 713 0.48
643.9xUnspecified vomiting
of pregnancy
Inpatient 42 0.03Outpatient 4,660 3.13Total 4,702 3.15
aCases as a percentage of live births

November 2016 Vol. 23 No. 11 MSMR Page 5
accounted for similar proportions of both inpatient and outpatient encounters. However, severe HG and “late vomiting of pregnancy” accounted for higher propor-tions (29.3% and 14.1%, respectively) of inpatient EVP-related medical encounters than outpatient encounters (10.1% and 8.7%, respectively). “Unspecified vomiting
of pregnancy” accounted for the second highest proportion of outpatient encoun-ters (29.5%) but less than 5% of inpatient encounters (Figure 3).
Mild HG accounted for more hos-pital bed days (n=1,946) than any other diagnosis and 47.0% of all hospital bed days overall (Figure 4). Together, mild and
severe HG accounted for three-quarters (75.5%) of all hospital bed days. The diag-nosis “other vomiting complicating preg-nancy” accounted for the fewest number of hospital days (n=105) and 2.5% of all hospital days.
During the 10-year surveillance period, about one-third (33.9%; n=6,506) of the service women with pregnancies complicated by EVP had two or more EVP-related medical encounters (data not shown). Among these service women, the median number of inpatient encounters was 2 (range 2–10) and the median num-ber of outpatient encounters was also 2 (range 2–157). The majority (97.3%) of the service women with two or more EVP-related medical encounters had outpa-tient encounters only; 2.4% (n=156) had both inpatient and outpatient EVP-related medical encounters. Only 18 of the ser-vice women with two or more EVP-related medical encounters had inpatient encoun-ters only (data not shown).
E D I T O R I A L C O M M E N T
This report documents that, during the 10-year surveillance period, close to one in six (16.5%) active component ser-vice women with live births had pregnan-cies complicated by EVP. The overall rate of EVP during this period was 13.8%. Considered together, mild and severe HG accounted for close to two-thirds of the total EVP cases and yielded a combined rate of 8.8%. As expected, severe HG and “late vomiting of pregnancy” accounted for a higher proportion of inpatient EVP cases than outpatient cases.
Estimates of EVP and HG incidence vary widely because of the different diag-nostic criteria, study designs, and study populations (race/ethnicity composition) employed.12, 31-32 More specifically, there is no single accepted definition of HG; it is a clinical diagnosis of exclusion based on a typical presentation in the absence of other diseases that could explain the find-ings.31 The overall rate of EVP and the HG-specific rate computed in the current analysis are considerably higher than esti-mates reported in the past two decades by
F I G U R E 1 . Annual rates of excessive vomiting in pregnancy (EVP) by medical encounter type, active component service women, U.S. Armed Forces, 2005–2014
F I G U R E 2 . Annual rates of excessive vomiting in pregnancy (EVP) by diagnosis, active component service women, U.S. Armed Forces, 2005–2014
0.0
2.0
4.0
6.0
8.0
10.0
12.0
14.0
16.0
18.0
2005 2006 2007 2008 2009 2010 2011 2012 2013 2014
EVP
rate
a
TotalInpatientOutpatient
aCases as a percentage of live births
aCases as a percentage of live births
0.0
1.0
2.0
3.0
4.0
5.0
6.0
7.0
8.0
9.0
10.0
2005 2006 2007 2008 2009 2010 2011 2012 2013 2014
EVP
rate
a
Mild HGSevere HGLate vomitingOther vomitingUnspecifed vomiting
MSMR Vol. 23 No. 11 November 2016 Page 6
EVP-focused studies among samples of civilian women inside and outside of the U.S. (e.g., Norway, England, Canada). The most comparable rate reported for EVP was 5.5% obtained from a study of women enrolled in a health maintenance orga-nization in the southeastern U.S. during
2000–2006.26 This study searched elec-tronic inpatient, outpatient, and emer-gency services data for ICD-9 codes 643.xx in any diagnostic position. One likely explanation for the disparity in rates relates to the current study’s broader case defini-tion using EVP diagnoses in the first and
second diagnostic positions drawn from records of both inpatient and outpatient encounters. Also, the higher rates obtained in the current analysis are likely, at least partially, explained by U.S. service wom-en’s unrestricted access to prenatal care at no cost to them. Consistent with existing
T A B L E 4 . Counts and rates of excessive vomiting in pregnancy (EVP) by diagnosis and demographic characteristics, active component service women, U.S. Armed Forces, 2005–2014
4th digit level of ICD-9
Total (all EVP) Mild hyperemesis gravidarum
Severe hyperemesis
gravidarum with metabolic
disturbance
Late vomiting of pregnancy
Other vomiting complicating preg-
nancy
Unspecified vomit-ing of pregnancy
No. Ratea No. Ratea No. Ratea No. Ratea No. Ratea No. Ratea
Total 20,511 13.8 11,090 7.4 2,068 1.4 1,938 1.3 713 0.5 4,702 3.2Age<20 854 20.6 476 11.5 83 2.0 84 2.0 32 0.8 179 4.320-24 10,746 16.9 5,788 91.1 1,105 1.7 986 1.6 390 0.6 2,477 3.925-29 5,886 12.8 3,150 6.9 590 1.3 567 1.2 206 0.4 1,373 3.030-34 2,191 9.1 1,217 5.1 219 0.9 207 0.9 66 0.3 482 2.035-39 725 7.4 399 4.1 60 0.6 79 0.8 15 0.2 172 1.840+ 109 6.2 60 3.4 11 0.6 15 0.9 4 0.2 19 1.1
ServiceArmy 9,413 17.9 5,640 10.8 759 1.4 890 1.7 319 0.6 1,805 3.4Navy 4,753 12.1 2,214 5.6 418 1.1 385 1.0 157 0.4 1,579 4.0Air Force 5,015 11.1 2,629 5.8 722 1.6 534 1.2 176 0.4 954 2.1Marine Corps 1,330 11.2 607 5.1 169 1.4 129 1.1 61 0.5 364 3.1
Race/ethnicityWhite, non-Hispanic 8,973 12.9 4,762 6.8 924 1.3 892 1.3 356 0.5 2,039 2.9Black, non-Hispanic 6,421 16.5 3,634 9.3 645 1.7 586 1.5 190 0.5 1,366 3.5Hispanic 2,888 13.2 1,530 7.0 279 1.3 258 1.2 96 0.4 725 3.3Asian/Pacific Islander 685 11.3 397 6.5 70 1.2 51 0.8 22 0.4 145 2.4American Indian/Alaska Native 274 12.0 144 6.3 17 0.7 25 1.1 13 0.6 75 3.3Other/unknown 1,270 12.2 623 6.0 133 1.3 126 1.2 36 0.3 352 3.4
Marital statusSingle 5,087 15.6 2,776 8.5 465 1.4 462 1.4 180 0.6 1,204 3.7Married 14,307 13.1 7,688 7.0 1,485 1.4 1,344 1.2 499 0.5 3,291 3.0Other 1,117 15.5 626 8.7 118 1.6 132 1.8 34 0.5 207 2.9
Military occupationCombat-specific 300 13.8 153 7.0 37 1.7 42 1.9 3 0.1 65 3.0Armor/motor transport 839 16.3 468 9.1 67 1.3 78 1.5 31 0.6 195 3.8Pilot/air crew 151 7.9 90 4.7 14 0.7 11 0.6 8 0.4 28 1.5Repair/engineering 3,781 13.5 1,924 6.9 387 1.4 334 1.2 137 0.5 999 3.6Communications/intelligence 7,866 14.1 4,331 7.8 789 1.4 743 1.3 266 0.5 1,737 3.1Health care 3,889 13.2 2,084 7.1 388 1.3 392 1.3 132 0.4 893 3.0Other/unknown 3,685 14.0 2,040 7.7 386 1.5 338 1.3 136 0.5 785 3.0
aCases as a percentage of live births

November 2016 Vol. 23 No. 11 MSMR Page 7
literature on EVP in the U.S. civilian pop-ulation, results of this study showed that EVP- and HG-complicated pregnancies (and/or associated hospital admissions) were more common among women of
black, non-Hispanic race/ethnicity9,25,28,33
and younger age.9,28 The slight increase observed in the
annual rate of EVP between 2005 and 2014 was driven largely by the outpatient trend;
this trend was, in turn, largely a reflec-tion of the trend observed for mild HG. Review of the published literature from the past two decades identified one study that examined annual rates of hospital admis-sions for severe vomiting during pregnancy (per 100 deliveries).25 The authors posited that the dramatic declines observed in rates of this condition from 1991 through 2003 reflected a transition from in-hospital care to out-of-hospital care.25
During the past several years, there has been an increase in research on alternatives to inpatient treatment of EVP, including day care treatment and midwifery support. Results from one recent trial suggest that initial treatment of EVP in outpatient day care reduced subsequent hospital admis-sions, compared with standard inpatient treatment.34 Findings from another recent trial indicate that day care treatment plus ongoing midwifery support may be an effective alternative for treating women with severe EVP.35 Additional research is needed to examine characteristics that con-tribute to decisions regarding inpatient ver-sus outpatient management of EVP.
During the surveillance period, mild HG accounted for more hospital bed days than any other EVP diagnosis and close to half of all hospital bed days for EVP overall.
F I G U R E 3 . Percentage of excessive vomiting in pregnancy (EVP)-related medical encoun-ters by encounter type and diagnosis, active component service women, U.S. Armed Forc-es, 2005–2014
F I G U R E 4 . Numbers of medical encounters for excessive vomiting in pregnancy (EVP),a individuals affected,b and hospital bed days, by diagnosis, active component service women, U.S. Armed Forces, 2005–2014
48.3 49.0 48.3
28.7
4.2
29.5
10.7
29.3
10.1
8.9 14.1 8.7 3.4 3.4 3.4
0%
10%
20%
30%
40%
50%
60%
70%
80%
90%
100%
Total Inpatient Outpatient
% o
f to
tal E
VP
-rela
ted
med
ical
enc
ount
ers
Other vomitingLate vomitingSevere HGUnspecifed vomitingMild HG
37,688 encounters
1,182 encounters
36,506 encounters
18,220
4,020 3,343
1,281
10,824 11,365
2,126 2,646 1,050
6,947
0
200
400
600
800
1,000
1,200
1,400
1,600
1,800
2,000
0
2,000
4,000
6,000
8,000
10,000
12,000
14,000
16,000
18,000
20,000
Mild HG Severe HG Late vomiting Other vomiting Unspecifed vomiting
No.
of h
ospi
tal b
ed d
ays
No.
of m
edic
al e
ncou
nter
s/in
divi
dual
s af
fect
ed
Diagnosis
Total medical encountersTotal individuals affectedBed days
HG, hyperemesis gravidarumaTotal hospitalizations and ambulatory visits for EVP (with no more than one encounter per individual per day)bIndividuals with at least one hospitalization or ambulatory visit for EVP
No.
of m
edic
al e
ncou
nter
s or
no. o
f ind
ivid
uals
affe
cted

MSMR Vol. 23 No. 11 November 2016 Page 8
Together, mild and severe HG accounted for three-quarters of all hospital bed days for EVP. The majority of the service women with two or more EVP-related medical encounters had outpatient encounters only; less than 3% had both inpatient and outpa-tient EVP-related medical encounters and only 18 had inpatient encounters only.
Research indicates that HG is likely to recur in subsequent pregnancies.28,36-37 A recent population-based study of hospi-tal readmission for HG found that history of HG was the strongest independent risk factor for readmission for HG.28 Two pop-ulation-based studies reported the risk of recurrent HG in a second pregnancy was 15%36 and 20%15 in women with previous HG, but only 0.7% in women with no such history.36 Despite this research, under-standing of the risks of EVP readmission in a current pregnancy and reoccurrence rates in later pregnancies is limited, both of which are necessary for developing measures to reduce the onset or worsening of the condition. The potentially high risk of recurrence has led to recommendations that women with a previous history of HG and their providers may want to discuss a treatment plan before pregnancy.37 In addition, women with previous HG may need to be seen more frequently in early pregnancy to facilitate more rapid diagno-sis and treatment of the condition.37
There are several important limita-tions that should be considered when interpreting the results of this analysis. First, the findings presented here are likely to underestimate the numbers and rates of EVP. As previously noted, because rates in this analysis were computed as a per-centage of live births, EVP-complicated pregnancies that resulted in miscarriage/mortality were excluded. In addition, it is possible that patients presented with EVP (ICD-9: 643.xx) but received alterna-tive or less specific diagnostic coding (i.e., gastritis, nausea, or vomiting) and thus were not included in the analysis. Finally, this report summarizes diagnoses of EVP that were reported on standardized records of hospitalizations and outpatient encounters in fixed U.S. and civilian (i.e., purchased care) medical facilities if reim-bursed through the Military Health Sys-tem (MHS). Records of non-reimbursed
care received at medical facilities outside of the MHS were not available for this analysis.
Also, there are limitations to the gen-eralizability of the findings because of the characteristics of the surveillance popula-tion. For example, active component ser-vice women have unrestricted access to prenatal care at no cost; as such this may limit the validity of comparisons to civilian women, for whom limited access to, and inability to pay for, care may restrict hos-pitalization and use of outpatient services. Thus, generalizations of the observed results should be limited to similar groups. Finally, findings related to temporal trends need to take into account factors such as changes in awareness of the condition and shifts in clinical practice patterns that may have occurred during the course of the surveillance period. Because of changes in management of pregnancy complica-tions (e.g., transition from in-hospital care to out-of-hospital care), it is likely that some of the service women who were hospitalized at the beginning of the sur-veillance period would now be treated as outpatients.25,34
The results of this analysis showed a substantial burden of EVP-related morbid-ity, as measured by prenatal EVP-related medical encounters, number of service women affected, and total bed days during hospitalizations for EVP. Research on the psychosocial morbidity associated with EVP indicates that severe EVP has sub-stantial effects on women’s occupational, family, and social functioning.37 Given its negative impact on women’s quality of life, EVP is a condition that should be taken seriously by healthcare professionals responsible for providing care to women during pregnancy.37-41
As women become more established in U.S. military operations, pregnancy care ensuring healthy outcomes should remain a principal area of research. Spe-cifically, a better awareness of this medi-cal condition, severity of its symptoms, and their effect on a woman’s functioning are needed to provide effective interven-tions that protect a woman’s health-related functional status.
R E F E R E N C E S
1. Flaxman SM, Sherman PW. Morning sickness: a mechanism for protecting mother and embryo. Q Rev Biol. 2000;75(2):113–148.2. Lacroix R, Eason E, Melzack R. Nausea and vomiting during pregnancy: a prospective study of its frequency, intensity, and patterns of change. Am J Obstet Gynecol. 2000;182(4):931–937.3. Verberg MF, Gillott DJ, Al-Fardan N, Grudzinskas JG. Hyperemesis gravidarum, a literature review. Hum Reprod Update. 2005;11(5):527–539. 4. Pepper GV, Craig Roberts S. Rates of nausea and vomiting in pregnancy and dietary characteristics across populations. Proc Biol Sci. 2006;273(1601):2675–2679.5. McCarthy FP, Khashan AS, North RA, Moss-Morris R, Baker PN, Dekker G. A prospective cohort study investigating associations between hyperemesis gravidarum and cognitive behavioural and emotional well-being in pregnancy. PLoS ONE. 2011;6(11):e27678.6. Wood H, McKellar LV, Lightbody M. Nausea and vomiting in pregnancy: blooming or bloomin’ awful? a review of the literature. Women Birth. 2013;26(2):100–104.7. Tan PC, Zaidi SN, Azmi N, Omar SZ, Khong SY. Depression, anxiety, stress and hyperemesis gravidarum: temporal and case controlled correlates. PLoS ONE. 2014;9(3):e92036.8. McCarthy FP, Lutomski JE, Greene RA. Int J Womens Health. Hyperemesis gravidarum: current perspectives. 2014;6:719–725.9. Bailit JL. Hyperemesis gravidarium: Epidemiologic findings from a large cohort. Am J Obstet Gynecol. 2005;193(3 Pt 1):811–814.10. Matsuo K, Ushioda N, Nagamatsu M, Kimura T. Hyperemesis gravidarum in Eastern Asian population. Gynecol Obstet Invest. 2007;64(4):213–216. 11. Roseboom TJ, Ravelli AC, van der Post JA, Painter RC. Maternal characteristics largely explain poor pregnancy outcome after hyperemesis gravidarum. Eur J Obstet Gynecol Reprod Biol. 2011;156(1):56–59.12. Matthews A, Haas D, O’Mathúna D, Dowswell T. Interventions for nausea and vomiting in early pregnancy. Cochrane Database Syst Rev. 2015;8(9):CD007575. 13. Philip B. Hyperemesis gravidarum: literature review. WMJ. 2003;102(3):46–51.14. Niebyl JR. Clinical practice. Nausea and vomiting in pregnancy. N Engl J Med. 201014;363(16):1544–1550.15. Dodds L, Fell DB, Joseph KS, et al. Outcome of pregnancies complicated by hyperemesis gravidarum. Obstet Gynecol. 2006;107(2 Pt 1):285–292.16. Veenendaal MV, van Abeelen AF, Painter RC, van der Post JA, Roseboom TJ. Consequences of hyperemesis gravidarum for offspring: a systematic review and meta-analysis. BJOG. 2011; 118(11):1302–1313.17. Bacak SJ, Callaghan WM, Dietz PM., et al. Pregnancy associated hospitalizations in the United States, 1999–2000. Am J Obstet Gynecol. 2005;192(2):592–597.18. Gazmararian J, Petersen R, Jamieson DJ, Schild L, Adams M, Deshpande A, Franks

November 2016 Vol. 23 No. 11 MSMR Page 9
A. Hospitalizations during pregnancy among managed care enrollees. Obstet Gynecol. 2002;100(1):94–100.19. Piwko C, Koren G, Babashov V, Vicente C, Einarson TR. Economic burden of nausea and vomiting of pregnancy in the USA. J Popul Ther Clin Pharmacol. 2013;20(2):e149–e160. 20. Gadsby R, Barnie-Adshead AM, Jagger C. A prospective study of nausea and vomiting during pregnancy. Br J Gen Pract. 1993;43(371):245–248.21. Braun L, Kennedy H, Womack J, Wilson C. Integrative literature review: U.S. military women’s genitourinary and reproductive health. Mil Med. 2016;181(1):35–49. 22. Armed Forces Health Surveillance Center. Surveillance snapshot: births, active component service women, U.S. Armed Forces, 2001–2012. MSMR. 2013;20(9):28.23. Adams M, Harlass F, Sarno A, Read J, Rawlings J. Prenatal hospitalization among enlisted servicewomen, 1987–1990. Obstet Gynecol. 1994;84(1):35–39.24. Fell D, Dodds L, Joseph K, Allen V, Butler B. Risk factors for hyperemesis gravidarum requiring hospital admission during pregnancy. Obstet Gynecol. 2006;107(2 Pt 1):277–284.25. Liu S, Heaman M, Sauve R, et al. An analysis of prenatal hospitalization in Canada, 1991–2003. Matern Child Health J. 2007;11(2):181–187. 26. Bruce F, Berg C, Joski P, Roblin D, Callaghan W, Bulkley J, Bachman D, Hornbrook M. Extent of maternal morbidity in a managed care
population in georgia. Paediatr Perinat Epidemiol. 2012;26(6):497–505. 27. Vikanes Å, Stoer N, Magnus P, Grjibovski A. Hyperemesis gravidarum and pregnancy outcomes in the Norwegian Mother and Child Cohort - a cohort study. BMC Pregnancy Childbirth. 2013;Sep 3;13:169. 28. Fiaschi L, Nelson-Piercy C, Tata L. Hospital admission for hyperemesis gravidarum: a nationwide study of occurrence, reoccurrence and risk factors among 8.2 million pregnancies. Hum Reprod. 2016;31(8):1675–1684. 29. Wilcox AJ, Weinberg CR, O’Connor JF, Baird DD, Schlatterer JP, Canfield RE, et al. Incidence of early loss of pregnancy. N Engl J Med 1988;319(4):189–194.30. Wang X, Chen C, Wang L, Chen D, Guang W, French J. Conception, early pregnancy loss, and time to clinical pregnancy: a population-based prospective study. Fertil Steril. 2003;79(3):577–584.31. American College of Obstetricians and Gynecologists. Practice Bulletin No. 153: Nausea and Vomiting of Pregnancy. Obstet Gynecol. 2015;126(3):e12–e24.32. Grooten I, Roseboom T, Painter R. Barriers and Challenges in Hyperemesis Gravidarum Research. Nutr Metab Insights. 2016;8(Suppl 1):33–39. 33. Louik C, Hernandez-Diaz S, Werler M, Mitchell A. Nausea and vomiting in pregnancy: maternal characteristics and risk factors. Paediatr Perinat Epidemiol. 2006;20(4):270–278.34. McCarthy F, Murphy A, Khashan AS, et al.
Day care compared with inpatient management of nausea and vomiting of pregnancy: a randomized controlled trial. Obstet Gynecol. 2014;124(4): 743–748. 35. McParlin C, Carrick-Sen D, Steen I, Robson S. Hyperemesis in Pregnancy Study: a pilot randomised controlled trial of midwife-led outpatient care. Eur J Obstet Gynecol Reprod Biol. 200 (2016) 6–10.36. Trogstad LI, Stoltenberg C, Magnus P, et al. Recurrence risk in hyperemesis gravidarum. BJOG. 2005;112(12 ):1641–1645.37. Fejzo MS, Macgibbon KW, Romero R, et al. Recurrence risk of hyperemesis gravidarum. J Midwifery Womens Health. 2011;56(2):132–136.38. O’Brien B, Naber S. Nausea and vomiting during pregnancy: effects on the quality of women’s lives. Birth. 1992;19(3):138–143.39. Mazzotta P, Maltepe C, Navioz Y, et al. Attitudes, management and consequences of nausea and vomiting of pregnancy in the United States and Canada. Int J Gynaecol Obstet. 2000;70(3):359–365.40. Smith C, Crowther C, Beilby J, Dandeaux J. The impact of nausea and vomiting on women: a burden of early pregnancy. Aust N Z J Obstet Gynaecol.2000;40(4):397–401.41. Attard CL, Kohli MA, Coleman S, et al. The burden of illness of severe nausea and vomiting of pregnancy in the United States. Am J Obstet Gynecol. 2002;186(5 Suppl Understanding): S220–S227.
MSMR’s Invitation to ReadersMedical Surveillance Monthly Report (MSMR) invites readers to submit topics for consideration as the basis for future MSMR reports. The
MSMR editorial staff will review suggested topics for feasibility and compatibility with the journal’s health surveillance goals. As is the case with most of the analyses and reports produced by Armed Forces Health Surveillance Branch staff, studies that would take advantage of the healthcare and personnel data contained in the Defense Medical Surveillance System (DMSS) would be the most plausible types. For each promising topic, Armed Forces Health Surveillance Branch staff members will design and carry out the data analysis, interpret the results, and write a manuscript to report on the study. This invitation represents a willingness to consider good ideas from anyone who shares the MSMR’s objective to publish evidence-based reports on subjects relevant to the health, safety, and well-being of military service members and other beneficiaries of the Military Health System (MHS).
In addition, MSMR encourages the submission for publication of reports on evidence-based estimates of the incidence, distribution, impact, or trends of illness and injuries among members of the U.S. Armed Forces and other beneficiaries of the MHS. Information about manuscript submissions is available at www.health.mil/Military-Health-Topics/Health-Readiness/Armed-Forces-Health-Surveillance-Branch/Reports-and-Publications/Medical-Surveillance-Monthly-Report/Instructions-for-Authors.
Please email your article ideas and suggestions to the MSMR editorial staff at: [email protected].

MSMR Vol. 23 No. 11 November 2016 Page 10
Injuries are a barrier to military medical readiness, and overexertion has his-torically been a leading mechanism of injury among active duty U.S. Army soldiers. Details are needed to inform prevention planning. The Defense Medi-cal Surveillance System (DMSS) was queried for unique medical encounters among active duty Army soldiers consistent with the military injury definition and assigned an overexertion external cause code (ICD-9: E927.0–E927.9) in 2014 (n=21,891). Most (99.7%) were outpatient visits and 60% were attributed specifically to sudden strenuous movement. Among the 41% (n=9,061) of vis-its with an activity code (ICD-9: E001–E030), running was the most common activity (n=2,891, 32%); among the 19% (n=4,190) with a place of occurrence code (ICD-9: E849.0–E849.9), the leading location was recreation/sports facili-ties (n=1,332, 32%). External cause codes provide essential details, but the data represented less than 4% of all injury-related medical encounters among U.S. Army soldiers in 2014. Efforts to improve external cause coding are needed, and could be aligned with training on and enforcement of ICD-10 coding guidelines throughout the Military Health System.
Importance of External Cause Coding for Injury Surveillance: Lessons from Assessment of Overexertion Injuries Among U.S. Army Soldiers in 2014Michelle Canham-Chervak, PhD, MPH; Ryan A. Steelman, MPH; Anna Schuh, PhD; Bruce H. Jones MD, MPH (COL, USA, Ret.)
Among active duty U.S Army per-sonnel, injuries and injury-related musculoskeletal conditions result
in more than 1.3 million medical encoun-ters annually and affect nearly 300,000 soldiers.1 For commanders and medi-cal personnel determined to address this leading medical readiness issue, summa-ries of available medical surveillance data offer a starting point for understanding Army injuries. Information available from existing medical surveillance data has the potential to facilitate data-driven injury prevention planning such that scarce pre-vention resources are directed at leading causes, mechanisms, and activities.2-5
In the past, cause-coded injury hos-pitalization data were a focus of military injury surveillance analyses.6-8 Nearly all traumatic injury hospitalizations received cause codes because the reporting of cause codes was required for all traumatic injury
hospitalizations (i.e., formerly hospitaliza-tions with International Classification of Diseases, Ninth Revision, Clinical Mod-ification [ICD-9-CM] diagnosis codes 800–999).9 However, in recent years, hospi-talization rates for injuries declined among U.S. service members10; in 2014, for exam-ple, less than 2% of injuries among active duty U.S. Army personnel resulted in hos-pitalization.1 Many injuries treated in out-patient settings cause significant morbidity and functional impairment; for example, in 2014, nearly one out of 10 (9%) were due to fractures and nearly half (46%) were due to sprains or strains.1 To date, there is no national requirement to assign external cause of injury codes for injuries treated in outpatient settings11; in turn, in military as in civilian treatment facilities, cause-of-injury coding has been incomplete.6 As has been recommended in the past, now more than ever there is a need for outpatient
injury cause coding to identify targets for prevention.3,9,12
Monthly installation injury reports produced by the Armed Forces Health Surveillance Branch (AFHSB) and Army annual injury surveillance reports have consistently identified overexertion as the leading mechanism of outpatient inju-ries among active duty U.S. Army sol-diers.1,13,14 Overexertion, as defined in the International Classification of Diseases, Tenth Revision, Clinical Modification (ICD-10-CM), includes prolonged static or awkward postures, repetitive movements, specified strenuous movements or pos-tures, and strenuous movement or load.11 The purpose of this analysis is to provide additional details concerning overexertion injuries among active duty U.S. Army sol-diers to inform prevention planning for this leading mechanism of injury.
M E T H O D S
In December 2015, the databases of the Defense Medical Surveillance System (DMSS) were searched for records of med-ical encounters for overexertion injuries sustained by individuals who served in the active component of the U.S. Army during calendar year 2014, the latest full calendar year of data available at the time of analy-sis. Injuries were ascertained from records of medical encounters that included diag-noses within the ICD-9 Injury and Poison-ing code group (800–999); codes related to late effects of injuries, toxic effects, poison-ings, and surgical or medical complications were excluded. Selected diagnoses from the ICD-9 Diseases of the Musculoskeletal System and Connective Tissue code group (710–739) were also included, consistent with recommendations for military injury surveillance15 and current military injury

November 2016 Vol. 23 No. 11 MSMR Page 11
surveillance definitions.16 A complete code list is presented elsewhere.16
The database used for analyses con-sisted of inpatient and outpatient medical records (direct military treatment facility care and TRICARE purchased care) with injury-specific ICD-9 codes as primary diagnoses. If multiple relevant diagnosis codes were reported on single records, the analysis used the primary diagnosis as the case-defining diagnosis, since the primary diagnosis indicates the most serious injury, according to coding guidelines.17
Because a majority of injuries among active duty U.S. Army soldiers are treated in outpatient settings1 and a maximum of four diagnosis codes can be entered for outpa-tient visits, for analysis purposes, any exter-nal cause codes present in the electronic medical record were assumed to apply to the primary diagnosis. To limit follow-up encounters, multiple encounters for the same three-digit ICD-9 diagnosis within 60 days were considered as single episodes of the indicated injury. Overexertion inju-ries were identified as those containing an “overexertion” external cause of injury code (ICD-9: E927.0–E927.9) in any diagnosis field following the primary injury diagno-sis. For each overexertion injury-related medical encounter, the injured patient’s age, gender, military rank, military occupa-tional specialty (MOS), and injury diagno-sis were obtained.
Rates were calculated using denomina-tors from the DMSS reflecting 2014 distri-butions by age, gender, rank and MOS for active duty Army personnel. Rate ratios (RRs) and 95% confidence intervals (CIs) were calculated using OpenEpi.18 Injuries were classified by injury type and body region using two different injury classifi-cation tools. Diagnoses with ICD-9 codes 800–999 were categorized using the Barell injury diagnosis matrix, a tool developed by members of the International Collaborative Effort on Injury Statistics to summarize traumatic injuries.19 This matrix includes all injuries in ICD-9 codes 800–995, exclud-ing Injury and Poisoning codes related to complications of surgical and medical care, not elsewhere classified (996–999). Diag-noses with ICD-9 codes 710–739 were summarized using the injury-related mus-culoskeletal condition matrix developed by
Army epidemiologists and clinicians and described by Hauret et al.20 This matrix was developed to categorize and standard-ize reporting of musculoskeletal conditions common in young, active populations (e.g., meniscal tears, recurrent shoulder disloca-tions, Achilles tendinitis, stress fractures) that often result from microtrauma due to overuse and related to participation in recreational activities, sports, and physical training. The matrix does not include con-ditions in the ICD-9 Diseases of the Mus-culoskeletal System and Connective Tissue code group (710–739) such as osteoar-thritis and acquired deformities. Place of occurrence (ICD-9: E849.0–E849.9) and activity (ICD-9: E001–E030) codes asso-ciated with overexertion injuries were also described. Place of occurrence codes
supplement external cause codes and spec-ify the location of the patient at the time of injury (e.g., home, recreational facility, workplace). Activity codes (E001–E030) describe the activity that caused or con-tributed to the injury. ICD-9 coding guide-lines recommended assignment of external cause codes for the initial encounter only. Place of occurrence was not assigned if the location of injury was not stated in the record.17
This analysis was part of an ad hoc request made by an installation injury prevention team and is part of a project plan approved by the Army Public Health Center Public Health Review Board. The request for DMSS data was fulfilled by the AFHSB, Defense Health Agency.
T A B L E 1 . Counts and rates of overexertion injury visitsa (n=21,891) by demographic characteristics of service members, active component, U.S. Army, 2014
Overexertion injuries n (%)
Injury rate (per 1,000)
Rate ratio (95% CI)
Sex
Male 18,587 (85) 45.2 1
Female 3,304 (15) 49.0 1.09 (1.05, 1.13)
Age (years)
<25 9,137 (42) 55.4 1.92 (1.78, 2.07)
25–34 8,525 (39) 44.1 1.53 (1.41, 1.65)
35–44 3,529 (16) 36.6 1.27 (1.17, 1.37)
45+ 700 (3) 28.9 1
Rank
Jr. enlisted (E1–E4) 12,124 (55) 58.9 2.83 (2.52, 3.17)
Sr. enlisted (E5–E9) 7,288 (33) 40.2 1.93 (1.72, 2.17)
Jr. officer (O1–O4) 1,757 (8) 27.7 1.33 (1.18, 1.51)
Sr. officer (O5–O10) 295 (1) 20.8 1
Warrant officer (W1–W5) 427 (2) 30.0 1.44 (1.25, 1.67)
Occupation
Motor transport 750 (3) 52.5 1.31 (1.21, 1.41)
Repair/engineer 4,869 (22) 50.1 1.25 (1.20, 1.30)
Communications/intelligence 5,780 (26) 48.4 1.20 (1.16, 1.25)
Health care 2,332 (11) 45.7 1.14 (1.08, 1.19)
Infantry/artillery/combat engineer 4,807 (22) 40.2 1
Pilot/air crew 176 (1) 22.1 0.55 (0.47-0.64)
Other 3,177 (15) 45.9 1.14 (1.09, 1.19)
aInjuries were defined using the current military injury surveillance definition, which includes visits with a primary diagnosis in ICD-9 Injury and Poisoning (800–999) and selected injury-related Diseases of the Musculoskeletal System and Connective Tissue (710–739).16 Overexertion injuries were identified by selected external cause codes (ICD-9: E927.0–E927.9) in any diagnosis field following the primary injury diagnosis.

MSMR Vol. 23 No. 11 November 2016 Page 12
R E S U L T S
Among individuals who served in the active component of the U.S. Army in 2014, a total of 21,891 unique medical encounters consistent with the injury definition and assigned an overexertion external cause code were identified. The majority (99.7%) were outpatient visits.
Overexertion visit rates were higher among female soldiers, compared with males (RR 1.09, 95% CI: 1.05, 1.13); sol-diers younger than 25 years of age, com-pared with those older than 45 years of age (RR 1.92, 95% CI: 1.78, 2.07); those with a junior enlisted rank (E1–E4), com-pared with senior officers (O5–O10) (RR 2.83, 95% CI: 2.52, 3.17); and soldiers in a motor transport occupation, compared with infantry/artillery/combat engineers (RR 1.31, 95% CI: 1.21, 1.41) (Table 1).
More than half (60%) of overexertion injuries were attributed specifically to sud-den strenuous movement. Overexertion injuries were seen in a variety of medical departments, from primary care (39%) to emergency medicine (28%) to family prac-tice (20%). Most overexertion injuries (87%) received a diagnosis in the Injury and Poi-soning code group (800–999) and the lead-ing specific diagnosis related to overexertion was “Unspecified site of ankle sprain” (ICD-9: 845.00) (18%) (Table 2).
Among overexertion injuries with traumatic injury diagnoses in the ICD-9: 800–999 (Injury and Poisoning) code series (n=18,929), all could be classified in the Barell matrix.19 The majority of acute inju-ries (72%) were sprains and strains. More than half (59%) were to the lower extremi-ties (Table 3).
Of those overexertion injuries consis-tent with the military injury definition that received a diagnosis with ICD-9 codes 710–739 (Diseases of the Musculoskeletal System and Connective Tissue) (n=2,962), nearly 100% (n=2,961) were musculoskeletal con-ditions likely due to overuse in young, active populations and as a result could be classi-fied in the injury-related musculoskeletal matrix.20 More than 70% of cases of injury-related musculoskeletal conditions attrib-uted to overexertion received diagnoses consistent with inflammation and/or pain
resulting from physical damage to muscu-loskeletal tissue due to overuse. Nearly half of these injuries (47%) were to the lower extremities (Table 4).
Forty-one percent of outpatient vis-its for overexertion injuries also contained external cause of injury codes specifying the activities associated with the injuries (ICD-9: E001–E030). Running, along with walk-ing/marching/hiking, and basketball, were the most common activities associated with overexertion injuries (32%, 11%, and 10%, respectively) (Table 5).
Nineteen percent of outpatient vis-its for overexertion injuries also contained external cause of injury codes indicating the places of occurrence (ICD-9: E849), pro-viding further detail on the locations where the injuries occurred. Approximately half of
overexertion injuries occurred in recreation/sports facilities (32%), at home (13%), or in industrial places/premises (6%) (Table 6).
E D I T O R I A L C O M M E N T
This report summarizes information available from military medical surveil-lance data regarding injuries due to “over-exertion” during calendar year 2014, the first detailed look at a leading mechanism of injury among U.S. Army soldiers.
The findings of this report document that lower extremity sprains and strains occurring while running or during sports activities account for disproportionate numbers of overexertion injuries among
T A B L E 2 . Overexertion injury visit details, active component, U.S. Army, 2014 (n=21,891)
Variable Category Overexertion injuriesn (%)
Specific overexertion mechanism (four-digit codes)
Overexertion from sudden strenuous movement (E927.0) 13,194 (60)
Other overexertion and strenuous and repetitive movements or loads (E927.8) 4,466 (20)
Unspecified (E927.9) 1,481 (7)
Cumulative trauma from repetitive motion (E927.3) 1,441 (7)Excessive physical exertion from prolonged activity (E927.2) 784 (4)
Cumulative trauma from repetitive impact (E927.4) 397 (2)Overexertion from prolonged static position (E927.1) 128 (1)
Medical department where diagnosis assigned
Primary care or primary medical care not else-where classified 8,631 (39)
Emergency medical 6,206 (28)
Family practice care not elsewhere classified 4,341 (20)
Other 1,768 (8)
Missing 945 (4)
ICD-9 category Diseases of the Musculoskeletal System and Con-nective Tissue (710–739) 2,962 (13)
Injury and Poisoning (800–999) 18,929 (87)
Top five specific diagnoses
Unspecified site of ankle sprain (845.00) 4,098 (18)Other and unspecified injury to knee, leg, ankle, and foot (959.7) 1,807 (8)
Sprain of unspecified site of knee and leg (844.9) 1,463 (7)
Lumbar sprain (847.2) 1,257 (6)Other and unspecified injury of other sites of trunk (959.19) 1,016 (5)

November 2016 Vol. 23 No. 11 MSMR Page 13
T A B L E 3 . Traumatic injury visits due to overexertion by body location and diagnosis (n=18,929), active component, U.S. Army, 2014a
T A B L E 4 . Injury-related musculoskeletal condition visits due to overexertion by body location and diagnosis (n=2,961), active component, U.S. Army, 2014a
Diagnosis
Fracture Dislocation Sprains/ strains Internal Open
woundAmputa-
tionBlood vessel
Contusion/ superficial Crush Burns Nerves
Unspeci-fied
System-wide and
late effects
No. of visits (%)
Bod
y re
gion
Traumatic brain injury (TBI) - - - 2 - - - - - - - - - 2 (<0.1)
Other head, face, neck 3 7 - - 15 - - 11 - 0 0 71 - 107 (0.6)
Spinal cord - - - - - - - - - - - - - 0
Vertebral column 4 1 1,968 - - - - - - - - - -
1,973 (10.4)
Torso 12 2 1,004 1 4 - - 74 - - - 1,076 -2,173 (11.5)
Upper extremity
117 169 1,963 - 19 - - 67 2 3 7 699 -3,046 (16.1)
Lower extremity
500 130 8,221 - 15 - - 287 2 - - 1,933 -11,088 (58.5)
Other, unspecified 1 - 436 1 - - - 32 - 1 2 30 - 503 (2.7)
System-wide and late effects - - - - - - - - - - - - 37 37 (0.2)
Total (%) 637 (3.4) 309 (1.6)13,592 (71.8)
4 (<0.1) 53 (0.3) 0 0 471 (2.5) 4 (<0.1) 4 (<0.1) 9 (<0.1)3,809 (20.1)
37(0.2)18,929 (100)
aMatrix includes all ICD-9 codes 800–995.19 Eighty-seven percent (87%) of overexertion injuries had diagnoses within ICD-9-CM Injury and Poisoning (800–995).
Diagnosis
Injury location Inflammation and pain (overuse) Joint derangement
Joint derangement with neurological
involvement
Stress fracture
Sprains/strains/ rupture Dislocation No. of visits
(%)
Bod
y re
gion
Vertebral column 179 32 716 - - - 927 (31.3)
Upper extremity 585 12 - - 6 7 610 (20.6)
Lower extremity 1,305 40 - 29 11 - 1,385 (46.8)
Others and unspecified 32 - 1 4 2 - 39 (1.3)
Total (%) 2,101 (71.0) 84 (2.8) 717 (24.2) 33 (1.1) 19 (0.6) 7 (0.2) 2,961 (100)aMatrix includes selected musculoskeletal condition codes (710–739) attributed to overuse and common in young, active populations.20 Thirteen percent (13%) of overexer-tion injuries had diagnoses contained in this matrix. One code within the military surveillance definiton16 (733.99) was not part of the matrix.
U.S. Army soldiers. The finding is not sur-prising because physical training and sports have been identified as leading activities associated with military injuries overall.21,22 The identification of military occupational activities and demographic subgroups that are most associated with increased injury risk should be a priority. To this end, mul-tivariable analyses to identify independent
risk factors associated specifically with overexertion injuries are warranted.
Of note, during the year of interest for this report, only a small portion (12%) of the electronic medical records documenting injury-related outpatient medical encoun-ters included external cause codes.1 As a result, the overexertion injuries described in the report account for less than 4% of all
injury-related medical encounters among U.S. Army soldiers during the year of inter-est. ICD-9 coding guidelines recommend assignment of an external cause code for “the initial encounter of an injury, poison-ing, or adverse effect of drugs, not for subse-quent treatment.”17 Possible reasons for the low levels of external cause coding include inadequate enforcement of recommended

MSMR Vol. 23 No. 11 November 2016 Page 14
cause coding practices and lack of under-standing of how and when to enter cause codes. Furthermore, a strict interpreta-tion of ICD-9 coding guidelines could have resulted in external cause codes not being assigned to encounters outside the Injury and Poisoning code group (ICD-9: 800–999). Such an interpretation could result in a lack of cause codes for numerous mili-tary-relevant injuries with diagnosis codes in Diseases of the Musculoskeletal System and Connective Tissue (ICD-9: 710–739). Further investigation into barriers to exter-nal cause coding in the Military Health Sys-tem is warranted.
Causes of and circumstances related to injury incidents are part of a recommended minimum basic data set for injury preven-tion23, and mandatory cause coding of out-patient records has been recommended to support military injury prevention efforts.6,12 In the U.S., more than one-half of states have mandated cause coding in either hospital discharge or emergency
department data systems.24 Factors that have contributed to improved external cause coding in civilian medical treatment facilities have included policies mandating assignment of external cause codes, moni-toring of the completeness and accuracy of cause coding, training on external cause coding, and increased awareness among providers and medical record coders of the role and value of external cause codes in the prioritization and evaluation of injury pre-vention efforts. 24
The most recent version of the medical record coding guidelines used throughout the Military Health System is the ICD-10. The ICD-10 contains approximately 6,200 more external cause of injury codes than were available in its predecessor (ICD-9).25 As such, the new coding manual provides enhanced ability to capture information essential for planning and monitoring the
effects of injury prevention initiatives.11 Notably, ICD-10 codes enable the cap-ture of details such as the intent of injured persons or intentional injury perpetra-tors, causal mechanisms, objects involved, places of occurrence, and activities associ-ated with injuries (e.g., work-related, dur-ing sports).5
Important changes with ICD-10 include that coding guidelines recommend assigning external cause code(s) for each encounter, and that external cause codes may be used for any condition (injury or illness) attributable to an external source.11 Previously, ICD-9 guidelines recom-mended assigning external cause codes only for initial encounters and those con-ditions that indicated an injury, poisoning, or adverse effect of an external cause. This change represents an opportunity to cap-ture causes of musculoskeletal conditions, often the result of overuse, that may have an identifiable cause and are often tracked along with injuries by sports medicine and occupational health communities as well as the military.16,26-28 Medical provid-ers can help to improve prevention efforts by ensuring that health care encounters for injuries and musculoskeletal conditions, and the medical records that document such encounters, include details regarding mechanisms, intents, locations, and activi-ties associated with injuries.24
To support the Army and other Ser-vices’ needs for data to guide injury prevention planning, the quality and com-pleteness of reporting of causes of injuries must be improved. AFHSB Installation Injury Reports, which began reporting out-patient cause of injury information in 2015, reported that only 12%–13% of all active duty Army incident outpatient injury vis-its had causes documented in the asso-ciated medical records.14 The effects of ICD-10 implementation in October 2015 on external cause coding are not yet clear. The experience of one country was an ini-tial reduction in external cause coding in the first few years after implementation of ICD-10.29 This finding emphasizes the need for training on and enforcement of ICD-10 coding guidelines throughout the Military Health System.
The findings of this report should be interpreted in light of its limitations. Most
T A B L E 5 . Top 10 activities associated with overexertion injury visits,a active component, U.S. Army, 2014
T A B L E 6 . Places of occurrence for overexertion injury visits,a active com-ponent, U.S. Army, 2014
Activity Total (%)
Running (E001.1) 2,891 (32)
Walking, marching, and hiking (E001.0) 989 (11)
Basketball (E007.6) 880 (10)
Free weights (E010.2) 662 (7)
Push-ups, pull-ups, sit-ups (E010.1) 445 (5)
Martial arts (E008.4) 350 (4)
Tackle football (E007.0) 336 (4)
Other activity involving other muscular strengthening exercises (E010.9)
285 (3)
Soccer (E007.5) 214 (2)
Baseball (E007.3) 167 (2)
aICD-9 activity code (E001–E030) was assigned to a total of 9,061 injury visits with an overexertion external cause code.
ICD-9 place of occurrence code
Count (% of overexertion injury visits
with place of occurrence
code)Recreation/sports facility (E849.4) 1,332 (32)
Home (E849.0) 563 (13)
Industrial place/premise (E849.3) 262 (6)
Street/highway (E849.5) 184 (4)
Public building (E849.6) 161 (4)
Residential institution (E849.7) 37 (1)
Farm (E849.1) 5 (<1)
Mine/quarry (E849.2) 5 (<1)
Other specified place (E849.8) 1,029 (25)
Unspecified place (E849.9) 612 (15)
aICD-9 place of occurrence code (E849.0–E849.9) was assigned to 4,190 injury visits with an overexertion external cause code.

November 2016 Vol. 23 No. 11 MSMR Page 15
notably, and as discussed in detail above, most of the injuries of interest for the report were not documented with cause of injury codes. Although the data are not complete, they represent findings on almost 22,000 cases of overexertion injuries and results are consistent with what would be expected based on prior military surveillance and survey analyses.20,21,22 A key strength of the analysis is the use of records of all inpa-tient and outpatient medical encounters of all active component members of the U.S. Army during the year of interest.
In summary, this report highlights the potential value of routinely reporting the causes of and circumstances related to inju-ries, a major source of morbidity, disability, lost duty, and early termination of service of U.S. military members. Small invest-ments in coding and recording time could enable military medical and front line lead-ers, health promotion practitioners, and medical staffs to tailor injury prevention programs, policies, and practices for spe-cific installations, units, activities, and mili-tary and demographic subgroups.
Author affiliations: Army Public Health Center, Aberdeen Proving Ground, MD (Dr. Canham-Chervak, Dr. Schuh, Dr. Jones); Defense Health Agency, Army Satellite, Aber-deen Proving Ground, MD (Mr. Steelman).
Disclaimer: The views expressed in this arti-cle are those of the author(s) and do not necessarily reflect the official policy of the Department of Defense, Department of the Army, U.S. Army Medical Department, or the U.S. Government.
R E F E R E N C E S
1. Army Public Health Center (Provisional). 2015. U.S. Army injury surveillance summary 2014. http://phc.amedd.army.mil/whatsnew/Pages/PeriodicPublications.aspx. Accessed November 2016.2. Jones BH, Canham-Chervak M, Sleet DA. An evidence-based public health approach to injury priorities and prevention recommendations for the U.S. Military. Am J Prev Med. 2010;38(1 Suppl):S1–S10.3. Centers for Disease Control and Prevention.
Recommended framework for presenting injury mortality data. MMWR. 1997;46(RR-14):1–30.4. Canham-Chervak M, Hooper TI, Brennan FH, et al. A systematic process to prioritize prevention activities: Sustaining progress toward reduction of military injuries. Am J Prev Med. 2010;38(1S):S11–S18.5. McKenzie K, Fingerhut L, Walker S, Harrison A, Harrison JE. Classifying external causes of injury: history, current approaches, and future directions. Epidemiol Rev. 2012;34:4–16.6. Jones BH, Canham-Chervak M, Canada S, Mitchener T, Moore S. Medical surveillance of injuries in the U.S. military: descriptive epidemiology and recommendations for improvement. Am J Prev Med. 2010;38(1S):S42–S60.7. Gardner JW, Amoroso PJ, Grayson K, Helmkamp J, Jones BH. Chapter 5. Hospitalizations due to injury: inpatient medical records data. Mil Med. 1999;164(8 Suppl):5-1 to 5-143.8. Amoroso PJ, Yore MM, Weyandt B, Jones BH. Chapter 8. Total Army injury and health outcomes database: a model comprehensive research database. Mil Med. 1999;164(8 Suppl):1–-36.9. Amoroso PJ, Smith GD, Bell NS. Qualitative assessment of cause-of-injury coding in U.S. military hospitals: NATO standardization agreement (STANAG) 2050. Am J Prev Med. 2002;18(3S):174–187.10. Armed Forces Health Surveillance Center. Hospitalizations among active component members, U.S. Armed Forces, 2004. MSMR. 2005;11(2):2–9.11. Centers for Medicare and Medicaid Services and National Center for Health Statistics. ICD-10-CM official guidelines for coding and reporting, FY2017. www.cdc.gov/nchs/icd/icd10cm.htm. Accessed November 2016.12. Ruscio BA, Jones BH, Bullock SH, et al. A process to identify military injury prevention priorities based on injury type and limited duty days. Am J Prev Med. 2010;38(1S):S19–S33.13. Marshall SW, Canham-Chervak, M, Dada EO, Jones BH. Military injuries. The Burden of Musculoskeletal Diseases in the United States, Third Edition. Rosemont, IL: United States Bone and Joint Initiative; 2014. www.boneandjointburden.org/2013-report/military-injuries/vi5.14. Armed Forces Health Surveillance Branch. Installation Injury Reports, January through December 2015. (Table 2. Manner and causes of incident injury outpatient encounters, Army total injuries with a documented cause). www.health.mil/Military-Health-Topics/Health-Readiness/Armed-Forces-Health-Surveillance-Branch/Reports-and-Publications/Installation-Injury-Reports. Accessed November 2016.15. Department of Defense (DoD) Military Injury Metrics Working Group. 2002. DoD Military Injury Metrics Working Group White Paper. Aberdeen Proving Ground, MD: U.S. Army Center for Health Promotion and Preventive Medicine. www.denix.osd.mil/ergoworkinggroup/metrics/unassigned/dod-military-injury-metrics-working-group-white-paper. Accessed November 2016.16. Armed Forces Health Surveillance Branch. 2015. Injuries by anatomic region: Case definition for AFHSC Installation Injury Report. www.health.
mil/Military-Health-Topics/Health-Readiness/Armed-Forces-Health-Surveillance-Branch/Epidemiology-and-Analysis/Surveillance-Case-Definitions. Accessed November 2016. 17. Centers for Medicare and Medicaid Services and National Center for Health Statistics. ICD-9-CM official guidelines for coding and reporting, effective October 1, 2011. www.cdc.gov/nchs/icd/icd9cm_addenda_guidelines.htm. Accessed November 2016.18. OpenEpi: Open Source Epidemiologic Statistics for Public Health, Version. www.OpenEpi.com, updated 4 May 2015.19. Barell V, Aharonson-Daniel L, Fingerhut L, et al. An introduction to the Barell body region by nature of injury diagnosis matrix. Inj Prev. 2002;8(2):91–96.20. Hauret KG, Jones BH, Bullock SH, Canham-Chervak M, Canada S. Musculoskeletal injuries: description of an under-recognized injury problem among military personnel. Am J Prev Med. 2010;38(1S):S61–S70.21. Hauret KG, Bedno S, Loringer K, Kao TC, Mallon T, Jones BH. Epidemiology of exercise- and sports-related injuries in a population of young, physically active adults: a survey of military servicemembers. Am J Sports Med. 2015;43(11):2645–2653.22. Jones B, Hauschild VD. Physical training, fitness, and injuries: lessons learned from military studies. J Strength Cond Res. 2015;29 Suppl(11):S57–S64.23. Lund J, Holder Y, Smith RJ. Minimum basic data set (MBDS), unintentional injuries. Proceedings of the International Collaborative Effort on Injury Statistics, Vol 1. Hyattsville, MD: National Center for Health Statistics; 1995.24. Annest JL, Fingerhut LA, Gallagher SS, et al. Strategies to improve external cause-of-injury coding in state-based hospital discharge and emergency department data systems. MMWR. 2008;57(RR01):1–15.25. Hedegaard H, Johnson RL, Warner M, Chen LH, Annest JL. Proposed framework for presenting injury data using the International Classification of Diseases, Tenth Revision, Clinical Modification (ICD-10-CM) diagnosis codes. Natl Health Stat Report. 2016;22(89):1–20.26. Roos KG, Marshall SW, Kerr ZY, et al. Epidemiology of overuse injuries in collegiate and high school athletics in the United States. Am J Sports Med. 2015;43(7):1790–1797.27. National Institute for Occupational Safety and Health. National occupational research agenda for musculoskeletal disorders. Cincinnati, OH: U.S. Department of Health and Human Services; 2001.28. National Research Council. Work-related musculoskeletal disorders: report, workshop summary, and workshop papers. Washington, DC: National Academy Press; 1999.29. Nilson F, Bonander C, Andersson R. The effect of the transition from the ninth to the tenth revision of the International Classification of Diseases on external cause registration of injury morbidity in Sweden. Inj Prev. 2015;21(3):189–194.

MSMR Vol. 23 No. 11 November 2016 Page 16
Acetaminophen, a drug commonly used to relieve pain and fever, is generally safe and effective when used as directed. However, acetaminophen overdose can cause serious adverse events, including liver damage and death. From 2006 through 2015, a total of 2,588 cases of acetaminophen overdose were identified in active component military members. Rates of acetaminophen overdose declined during this 10-year surveillance period, from 2.2 cases per 10,000 person-years (p-yrs) in 2006 to 1.2 cases per 10,000 p-yrs in 2015. Rates of overdose were higher among females, members of the Army, and service members younger than 25 years of age. Despite the apparent decline in acetaminophen overdose in the active component, continued surveillance is warranted to monitor this trend.
Acetaminophen Overdoses, Active Component, U.S. Armed Forces, 2006–2015Leslie L. Clark, PhD, MS; Stephen B. Taubman, PhD
Acetaminophen (also known as paracetamol), a commonly used antipyretic and analgesic drug, has
been available over the counter (OTC) in the U.S. since 1960. It is used alone and in combination in hundreds of OTC and pre-scription medications. Although generally safe and well tolerated when taken at ther-apeutic doses, acetaminophen overdose can cause serious adverse events, including liver damage and death.1
In the U.S., acetaminophen is one of the most frequently identified drugs in both intentional and unintentional poison-ings. On average, more than 100,000 calls annually to poison control centers involve acetaminophen and up to one-third of these calls are for intentional overdose. It is estimated that more than 30,000 Amer-icans are hospitalized for acetaminophen overdose per year and approximately 10% experience liver toxicity as a result. Acet-aminophen toxicity is the leading cause of acute liver failure in the U.S.2-5
In 2012, Taylor et al. reported that the annual prevalence of acetaminophen over-dose in the Military Health System had increased by 38.5% between 2004 and 2008. In addition, this analysis documented that
the period prevalence of overdose in active duty military males (3.9 per 10,000 people) and females (14.4 per 10,000 people) was more than twice that in non-active duty males and females.6
This analysis reports on the prevalence of acetaminophen overdoses in active com-ponent service members identified in hos-pital discharge records or theater medical records, and the relative proportions that were intentional. Additionally, the propor-tion of cases subsequently receiving a diag-nosis indicating hepatic toxicity is reported.
M E T H O D S
The surveillance period for this analy-sis was 1 January 2006 through 31 Decem-ber 2015. The surveillance population included all individuals who served at any time in the active component of the U.S. Air Force, Army, Navy, or Marine Corps during the surveillance period. For this analysis, cases of acetaminophen overdose were ascertained from the Defense Medi-cal Surveillance System (DMSS), a large, longitudinal data warehouse that contains
records of all U.S. military members’ hos-pitalizations and ambulatory healthcare visits in U.S. military and civilian medical facilities worldwide. DMSS also contains medical records from the Theater Medical Data Store (TMDS), which include medical encounters of service members deployed in support of operations in Southwest Asia and the Middle East.
For surveillance purposes, a case of acetaminophen overdose was defined as the presence of the ICD-9 code 965.4 or the ICD-10 code T39.1 in any diagnos-tic position of a record of a hospitaliza-tion or TMDS medical encounter. These codes have been reported as having high sensitivity, specificity, and positive predic-tive value for acetaminophen overdose.6,7 Intentionally self-inflicted acetaminophen overdoses were defined as those cases with either of the following external cause of injury codes in any diagnostic position in the same medical record as the overdose itself: ICD-9 code E950.0 or ICD-10 code X60. All diagnostic codes used to identify cases of acetaminophen overdose and the intentionality of overdose are shown in Table 1. An individual could be counted as a case each time he or she was hospitalized with a defining diagnosis indicating acet-aminophen overdose; for cases identified in TMDS, an individual could be counted as a case once every 30 days. Service members who died as a result of an acetaminophen overdose without being hospitalized were not included in this study.
Cases of hepatotoxicity (e.g., hepatic necrosis, toxic hepatitis) were identified using the codes listed in Table 2. All inci-dent (first-time) cases of acetaminophen overdose were reviewed for an occurrence of any of these codes in any inpatient or outpatient medical encounter occurring at any time after being identified as an acet-aminophen overdose case. Acetamino-phen overdose cases were followed from the time of their first overdose until they

November 2016 Vol. 23 No. 11 MSMR Page 17
left service or until the end of the surveil-lance period. A published and validated algorithm was initially used to identify ICD-9 and ICD-10 codes suggestive of,
and sensitive to, diagnoses indicative of hepatotoxicity related to acetaminophen overdose.7 For reporting purposes, identi-fied cases of hepatotoxicity were reported
in the year of the acetaminophen overdose to which they were linked. For example, if a service member was diagnosed with an acetaminophen overdose in 2010 and sub-sequently received a diagnosis of hepatic necrosis in 2012, the diagnosis of hepatic necrosis would have been reported in 2010. The percentage of acetaminophen overdose cases with a subsequent diagnosis indicat-ing hepatotoxicity was calculated by year; the denominator was calculated as the number of incident (first-time) acetamino-phen overdoses identified that year and the numerator included the number of those cases which subsequently had a diagnosis indicating hepatotoxicity at any time later in the surveillance period.
R E S U L T S
During 2006–2015, there were 2,588 cases of acetaminophen overdose identi-fied in active component military mem-bers. The overall crude rate during the period was 1.9 cases per 10,000 person-years (p-yrs) (Table 3). The rate declined during the period from 2.2 cases per 10,000 p-yrs in 2006 to 1.2 cases per 10,000 p-yrs in 2015. The rates peaked in 2007 and 2008 at 2.7 per 10,000 p-yrs and then declined steadily (Figure). About 1% of the total cases (n=30) were ascertained from TMDS med-ical encounters and occurred while the ser-vice member was deployed. All but one of these cases resulted in medical evacuation from theater, hospitalization in theater, or both (data not shown).
Female active component service members were almost three times as likely to receive a diagnosis of acetaminophen overdose as their male counterparts (Table 3). Although the male-specific annual rates of acetaminophen overdose declined every year since 2007, the rate in females was lowest in 2014 but increased slightly in 2015 (Figure).
During 2006–2015, crude rates of acet-aminophen overdose were slightly higher among black, non-Hispanic service mem-bers than other race/ethnicity groups. Among the Services, rates of acetamino-phen overdose were highest in the Army (Table 3).
T A B L E 1 . ICD-9/ICD-10 diagnostic codes used to identify acetaminophen overdose and intentionality of overdose
T A B L E 2 . ICD-9/ICD-10 diagnostic codes used for identification of potential hepatotoxic outcomes
Diagnostic codes Description
ICD-9
965.4 Poisoning by aromatic analgesics including acetaminophen
E850.4 Accidental poisoning by aromatic analgesics including acetaminophen
E950.0 Suicide and self-inflicted poisoning by analgesics, antipyretics, and antirheumatics
ICD-10
T39.1 Poisoning by 4-aminophenol derivatives
X40* Accidental poisoning by and exposure to nonopioid analgesics, antipyretics, and antirheumatics including acetaminophen
X60* Intentional self-poisoning by and exposure to nonopioid analgesics, antipyretics, and antirheumatics including acetaminophen
Y10* Poisoning by and exposure to nonopioid analgesics, antipyretics, and antirheumatics, including acetaminophen, of undetermined intent
Diagnosis ICD-9 ICD-10
Hepatic necrosis 570 K71.1
Toxic hepatitis 573.3 K71.2, K71.6, K71.9
Hepatic encephalopathy 572.2 K72.0, K72.9
Jaundice 782.4 R17
Hepatorenal syndrome 572.4 K76.7
F I G U R E . Annual rates of acetaminophen overdose overall and by sex, active component, U.S. Armed Forces, 2006–2015
0.0
1.0
2.0
3.0
4.0
5.0
6.0
7.0
2006 2007 2008 2009 2010 2011 2012 2013 2014 2015
Rat
e pe
r 10,
000
p-yr
s
OverallFemaleMale

MSMR Vol. 23 No. 11 November 2016 Page 18
The highest overall age- and sex- spe-cific rates of acetaminophen overdose occurred in females under 20 years of age. Females in every age stratum, except for those 55 years of age or older, had higher rates of acetaminophen overdose than their male counterparts. In both males and females, incidence rates decreased with increasing age (Table 3).
Over the entire surveillance period, almost half (48.7%) of all acetaminophen overdose cases were classified as inten-tional. The overall proportion of inten-tional overdoses declined about 30% during the period from 2006 to 2016 (52.8% and 37.0%, respectively) (Table 4). Over the 10-year surveillance period, a relatively low proportion of acetaminophen overdoses (7.5%) had concurrent diagnostic codes indicating that the overdose was acciden-tal or of undetermined intent. A substan-tial proportion (43.8%) of acetaminophen overdoses had no causal diagnostic codes that would allow for categorization of the overdose as intentional or accidental. Dur-ing the surveillance period, the proportion of these “unclassifiable” overdoses ranged from 40.9% in 2006 to 58.0% in 2015 (Table 4).
During 2006–2015, the most frequent hepatotoxic diagnosis received any time after an initial (first time) acetaminophen overdose was toxic hepatitis (n=81, 3.3%), followed by hepatic necrosis (n=60, 2.5%) (Table 5).
E D I T O R I A L C O M M E N T
During 2006–2015, active component military members were hospitalized or treated in theater for acetaminophen over-dose more than 2,500 times. Rates of over-dose were higher among females, members of the Army, and service members younger than 25 years of age.
This report demonstrates that rates of acetaminophen overdoses have been declining in active component military members since 2008. This finding mir-rors that of a recently published summary of civilian trends in rates of acetamino-phen-related adverse events in the U.S. that reported declining rates of hospitalization
T A B L E 3 . Counts and rates of acet-aminophen overdoses by demographic characteristics, active component, U.S. Armed Forces, 2006–2015
Total 2006–2015
No.Rate (per 10,000 p-yrs)
Total 2,588 1.9
Sex
Female 876 4.4
Male 1,712 1.5
Service
Army 1,371 2.6
Navy 514 1.6
Air Force 343 1.0
Marine Corps 360 1.9
Race/ethnicityAmerican Indian/Alaska Native 31 2.0
Asian/Pacific Islander 97 1.8
Black, non-Hispanic 532 2.4
Hispanic 291 1.8
White, non-Hispanic 1,502 1.8
Other 135 1.8
Age group
17–19 439 5.0
20–24 1,306 2.9
25–29 485 1.5
30–34 190 0.9
35–39 101 0.6
40–44 47 0.5
45–54 19 0.4
55+ 1 0.4
Age group (females)
17–19 172 11.9
20–24 446 6.6
25–29 164 3.3
30–34 51 1.7
35–39 24 1.2
40–44 14 1.2
45–54 5 0.8
55+ 0 0.0
Age group (males)
17–19 267 3.6
20–24 860 2.3
25–29 321 1.2
30–34 139 0.8
35–39 77 0.6
40–44 33 0.4
45-54 14 0.3
55+ 1 0.4
for acetaminophen-related poisoning since 2009.4 These declines come after signifi-cant media attention was generated about the risks of acetaminophen overdoses and the risk of concomitant liver damage. Sub-sequently, the U.S. Food and Drug Admin-istration has adopted changes in the dosing and labeling of acetaminophen products in the U.S., including labeling requirements warning of the risk of severe liver injury.8 In addition, several education programs were established to increase consumer awareness regarding the safe use of acetaminophen, such as the “Know Your Dose” campaign launched in 2010 by the Acetaminophen Awareness Coalition.9
The rates of acetaminophen overdose in this report differ substantially from the prevalence rates reported in the analysis by Taylor et al. In the Taylor et al. report, the overall period prevalence of acetaminophen overdose for active duty females and males was reported as 14.4 and 3.9 per 10,000 people, respectively. This is higher than the overall rates reported here. There were sev-eral differences in the methodology of the two analyses that could partially account for these differences. The denominator for this report was person time, rather than number of service members. The underly-ing surveillance period for the Taylor et al. report was 5 years while the current report covers a 10-year surveillance period. The current analysis focused specifically on active component service members rather than active duty as reported by Taylor et al. (which presumably includes activated reservists and guard members). The under-lying data sources were different and the current study also included acetaminophen overdoses that occurred in theater, but such overdoses were not included in the Taylor et al. study. There were undoubtedly other methodologic differences between the two studies that also contribute to the dispar-ity in estimates. However, it is notewor-thy that many findings of the two reports are similar. Among these are that females had higher rates of overdose than males; that overdose rates were higher in service members who were less than 25 years of age, compared to their older counterparts; and that the Army had higher overall rates of acetaminophen overdose, compared to other Services.

November 2016 Vol. 23 No. 11 MSMR Page 19
There are several limitations to con-sider when interpreting the results of this report. As with any analysis relying on administrative data, the numbers, rates, and trends of acetaminophen overdoses relied on identification of the event through
ICD-9 and ICD-10 diagnostic codes that are subject to miscoding. In addition, more than 40% of overdoses could not be classi-fied as intentional or accidental due to the absence of causal coding in the hospital or theater medical records.
In summary, this report provides encouraging evidence that the rate of acet-aminophen overdose in the active com-ponent force has been declining, and that a relatively small percentage of overdose cases receive diagnoses indicating subse-quent hepatotoxicity. However, continued surveillance is warranted to confirm these trends.
R E F E R E N C E S
1. Hodgman MJ, Garrard AR. A review of acetaminophen poisoning. Crit Care Clin. 2012;28(4):499–516.2. Blieden M, Paramore LC, Shah D, Ben-Joseph R. A perspective on the epidemiology of acetaminophen exposure and toxicity in the United
States. Expert Rev Clin Pharmacol. 2014;7(3):341–348.3. Mowry JB, Spyker DA, Brooks DE, McMillan N, Schauben JL. 2014 Annual Report of the American Association of Poison Control Centers National Poison Data System (NPDS): 32nd Annual Report. Clin Toxicol (Phila). 2015;53(10):962–1147.4. Major JM, Zhou EH, Wong HL, et al. Trends in rates of acetaminophen-related adverse events in the United States. Pharmacoepidemiol Drug Saf. 2016; 25(5):590–598.5. Yoon E, Babr A, Choudhary M, Kutner M, Pyrsopoulos. Acetaminophen Induced Hepatotoxocity: A Comprehensive Update. J Clin Trans Hepatol. 2016;4(2):131–142.6. Taylor LG, Xie S, Meyer TE, Coster T. Acetaminophen overdose in the Military Health System. Pharmacoepidemiol Drug Saf. 2012;21(4): 375–383. 7. Myers RP, Leung Y, Shaheen AA, Li B. Validation of ICD-9/ICD-10 coding algorithms for the identification of patients with acetaminophen overdose and hepatotoxicity using administrative data. BMC Health Serv Res. 2007;7:159.8. Federal Register Notice: Prescription Drug Products Containing Acetaminophen; Actions to Reduce Liver Injury From Unintentional Overdose. www.regulat ions.gov/document?D=FDA-2011-N-0021-0001. Accessed 18 August 2016.9. Acetaminophen Awareness Coalition. Know Your Dose Campaign. www.knowyourdose.org. [14 October 2015].
T A B L E 5 . Number and proportion of acetaminophen overdose cases with a subsequent diagnosis indicating liv-er problems, active component, U.S. Armed Forces, 2006–2015
T A B L E 4 . Intentionality of acetaminophen overdose, active component, U.S. Armed Forces, 2006–2015
2006 2007 2008 2009 2010 2011 2012 2013 2014 2015 Total 2006–2015
No. % No. % No. % No. % No. % No. % No. % No. % No. % No. % No. %Total acetaminophen overdoses
303 100.0 368 100.0 367 100.0 326 100.0 286 100.0 260 100.0 190 100.0 172 100.0 154 100.0 162 100.0 2,588 100.0
Intentional or self-inflicted 160 52.8 170 46.2 190 51.8 164 50.3 141 49.3 126 48.5 102 53.7 78 45.3 70 45.5 60 37.0 1,261 48.7
Accidental 19 6.3 26 7.1 25 6.8 30 9.2 23 8.0 20 7.7 16 8.4 12 7.0 14 9.1 8 4.9 193 7.5
Unclassified 124 40.9 172 46.7 152 41.4 132 40.5 122 42.7 114 43.8 72 37.9 82 47.7 70 45.5 94 58.0 1,134 43.8
Total
No. %
Total acetaminophen overdoses 2,437 100.0
Hepatic necrosis 60 2.5
Toxic hepatitis 81 3.3
Hepatic encephalopathy 16 0.7
Jaundice 30 1.2
Hepatorenal syndrome 4 0.2

Medical Surveillance Monthly Report (MSMR)Armed Forces Health Surveillance Branch11800 Tech Road, Suite 220 (MCAF-CS) Silver Spring, MD 20904
MEDICAL SURVEILLANCE MONTHLY REPORT (MSMR), in continuous publication since 1995, is produced by the Armed Forces Health Surveillance Branch (AFHSB). The MSMR provides evidence-based estimates of the incidence, distribution, impact and trends of illness and injuries among United States military members and associated populations. Most reports in the MSMR are based on summaries of medical administrative data that are routinely provided to the AFHSB and integrated into the Defense Medical Surveillance System for health surveillance purposes.
Archive: Past issues of the MSMR are available at www.health.mil/Military-Health-Topics/Health-Readiness/Armed-Forces-Health-Surveillance-Branch/Reports-and-Publications/Medical-Surveillance-Monthly-Report/View-Past-Reports.
Subscriptions (electronic and hard copy): Submit subscription requests online at www.health.mil/Military-Health-Topics/Health-Readiness/Armed-Forces-Health-Surveillance-Branch/Reports-and-Publications/Medical-Surveillance-Monthly-Report/Subscribe-to-the-MSMR.
Editorial inquiries: Call (301) 319-3240 or send email to: [email protected].
Instructions for authors: Information about article submissions is provided at www.health.mil/Military-Health-Topics/Health-Readiness/Armed-Forces-Health-Surveillance-Branch/Reports-and-Publications/Medical-Surveillance-Monthly-Report/Instructions-for-Authors.
All material in the MSMR is in the public domain and may be used and reprinted without permission. Citation formats are available at www.health.mil/Military-Health-Topics/Health-Readiness/Armed-Forces-Health-Surveillance-Branch/Reports-and-Publications/Medical-Surveillance-Monthly-Report.
Opinions and assertions expressed in the MSMR should not be construed as reflecting official views, policies, or positions of the Department of Defense or the United States Government.
Follow us: www.facebook.com/AFHSCPAGE
http://twitter.com/AFHSBPAGE
ISSN 2158-0111 (print) ISSN 2152-8217 (online)
Chief, Armed Forces Health Surveillance Branch COL Douglas A. Badzik, MD, MPH (USA)
EditorFrancis L. O’Donnell, MD, MPH
Contributing Editors John F. Brundage, MD, MPH Leslie L. Clark, PhD, MS
Writer/EditorValerie F. Williams, MA, MS
Managing/Production EditorElizabeth J. Lohr, MA
Layout/DesignDarrell Olson
Data AnalysisStephen B. Taubman, PhD
Editorial OversightCol Dana J. Dane, DVM, MPH (USAF) LTC(P) P. Ann Loveless, MD, MS (USA)Joel C. Gaydos, MD, MPH Mark V. Rubertone, MD, MPH