medical surveillance monthly report volume 18 number 10
TRANSCRIPT

M E D I C A L S U R V E I L L A N C E M O N T H L Y R E P O R T
msmrmsmr
A publication of the Armed Forces Health Surveillance Center
October 2011
Volume 18Number 10
P A G E 2 Relationships between increasing outpatient encounters for neurological disorders and introductions of associated diagnostic codes, active duty military service members, 1998-2010
P A G E 9 Alcohol-related diagnoses, active component, U.S. Armed Forces, 2001-2010
P A G E 1 4 Update: Cold weather injuries, U.S. Armed Forces, July 2006-June 2011
P A G E 1 9 Surveillance Snapshot: Reportable medical events of heat injury in relation to heat index, June-September 2011
S U M M A R Y T A B L E S A N D F I G U R E S
P A G E 2 0 Deployment-related conditions of special surveillance interest

M S M R Vol. 18 No.10 October 2011 Page 2
In addition, this analysis assesses rela-tionships between increases in diagnoses of neurological disorders overall and intro-ductions of new neurological disorder-related ICD-9 diagnostic codes. Of note in this regard, of 160 new “Diseases of the Nervous System”-related codes that were introduced between 1998 and 2010, 75 are encompassed within three 3-digit level codes that were recently added to the ICD-9: 327 “organic sleep disorders”, 338 “pain, not elsewhere classifi ed”, and 339 “other headache syndromes”. Th ese three 3-digit ICD-9 codes include relatively common conditions that were previously not classi-fi ed in the ICD-9 as “Diseases of the Ner-vous System”.
M E T H O D S
Th e surveillance period encompassed the 13 years from 1 January 1998 through 31 December 2010. Th e population included all members of the active compo-nent of the U.S. Armed Forces who served any time on active duty during the surveil-lance period. Outcomes of interest were all outpatient encounters for which a diagno-sis of a neurological disorder was recorded in the fi rst diagnostic position.
Relationships between Increasing Outpatient Encounters for Neurological Disorders and Introductions of Associated Diagnostic Codes, Active Duty Military Service Members, 1998-2010
Previous surveillance summaries of administrative data have indicated increases in the incidence and health care burdens of neurological disorders among active component U.S. military members during the last decade. Seventy-eight percent of the increase in average annual numbers of neurological disorders-related outpatient encounters during 2005-2010 is attributable to new diagnostic codes for three common conditions--sleep disorders, pain, and headache. Th e new codes were added to the International Classifi cation of Diseases as “diseases of the nervous system” between 2005 and 2008. Th e pre-existing codes for these conditions are in most cases not classifi ed as neurological. Visits for “organic sleep disorders” in particular represented nearly one-half of all outpatient encounters for neurological disorders in 2010. Th e use of the new diagnostic codes by healthcare providers can mask trends of the “true incidence” of illnesses and injuries and should be considered when interpreting surveillance analyses.
the Defense Medical Surveillance System (DMSS) is an admin-istrative data set and executive
information system maintained by the Armed Forces Health Surveillance Center (AFHSC). DMSS captures diagnoses that are recorded during health care encoun-ters (outpatient visits and hospitalizations) of U.S. military members in military treat-ment facilities and in civilian sources of care funded by the Department of Defense (DoD). Such diagnoses are documented and reported using codes that are specifi ed in the International Classifi cation of Dis-eases, 9th Revision (ICD-9). ICD-9 coded diagnoses are used to conduct epidemio-logic studies of diseases and injuries that aff ect benefi ciaries of the Military Health System (MHS) and to monitor preventive health services that are delivered to them.
Previous surveillance analyses have indicated that the incidence and health care burdens of neurological disorders (ICD-9 codes 320-359) among active com-ponent members of the U.S. military have risen dramatically during the last decade. Th is report summarizes results of analyses of factors associated with increasing health care encounters for and new (fi rst time per person) diagnoses of conditions catego-rized in the ICD-9 as “Diseases of the Ner-vous System”.
Neurological disorders were defi ned as conditions that were documented within any of the 38 three-digit level ICD-9 codes in the range 320–359 inclusive. In addition to tallying the total outpatient visits with neurological disorders recorded as pri-mary (fi rst-listed) diagnoses, the numbers of incident (fi rst per person) diagnoses of various disorders were estimated. Incident cases were defi ned as individuals who had two outpatient encounters, at least 7 days apart, in which the same three-digit ICD-9 code was recorded. Th e incidence date was the date of the fi rst of two such defi n-ing encounters. Counts and trends of both total encounters and incident diagnoses were determined for the entire surveillance period. For each disorder (as documented with a 3-digit level ICD-9 code), an indi-vidual could be counted as an incident case only once during the surveillance period. However, individuals could be counted as incident cases of multiple three-digit level defi ned disorders during the period.
R E S U L T S
During the surveillance period, the annual number of outpatient encounters associated with diagnoses of neurologi-cal disorders in the fi rst diagnostic posi-tion rose steadily from 1998 (67,685 visits) through 2004 (102,617 visits). In 2005, the number of visits decreased slightly (96,281 visits), but from 2006 (126,909 visits) through 2010 (413,349 visits), annual vis-its sharply increased (Figure 1). Similarly, annual numbers of incident neurological disorder cases were fairly stable from 1998 through 2005 and dramatically increased through the remainder of the period (Fig-ure 1).
During the 13-year surveillance period, there were 2,004,537 outpatient encoun-ters for the 38 neurological disorders con-sidered here; more than three-fourths (78.5%; n=1,574,109) of the encounters

October 2011 Vol. 18 No. 10 M S M R Page 3
1998-2004(7 years)
2005-2010(6 years)
Increase between the periods
No. encounters
No. incident cases
No. encounters
No. incident cases
% increase, encounters
% increase, incident cases
Total encounters/incident cases
All neurological disorders 613,183 98,881 1,391,354 196,023
Six most frequently reported diagnoses 429,659 75,069 1,144,450 168,225
All other diagnoses (n=32) 183,524 23,812 246,904 27,798
Average annual encounters/incident cases
All neurological disorders 87,598 14,126 231,892 32,671
Six most frequently reported diagnoses 61,380 10,724 190,742 28,038 89.7 93.4
All other diagnoses (n=32) 26,218 3,402 41,151 4,633 10.3 6.6
Average annual encounters/incident cases, most frequently diagnosed disorders
Organic sleep disorders (ICD-9 327) 0 0 83,608 12,410 57.9 66.9
Pain, not elsewhere classifi ed (ICD-9 338) 0 0 18,027 2,576 12.5 13.9
Migraine (ICD-9 346) 33,402 6177 46,618 6,285 9.2 0.6
Other headache syndromes (ICD-9 339) 0 0 11,506 2,192 8.0 11.8
Mononeuritis lower limb, unspecifi ed site (ICD-9 355) 6,987 1146 9,729 1,482 1.9 1.8
Mononeuritis upper limb, monon. multiplex (ICD-9 354) 20,990 3400 21,255 3,093 0.2 -1.7
T A B L E 1 . Outpatient encounters and incident cases of “diseases of the nervous system”, comparison of the periods 1998-2004 and 2005-2010, active component, U.S. Armed Forces, 2001-2010
were attributable to six 3-digit level ICD-9 diagnoses: ICD-9 346 “migraine” (25.6% of the total), ICD-9 327 “organic sleep disor-ders” (25.0%), ICD-9 354 “mononeuritis of upper limb and mononeuritis multiplex” (13.7%), ICD-9 338 “pain, not elsewhere classifi ed” (5.4%), ICD-9 355 “mononeu-ritis of lower limb and unspecifi ed site” (5.4%), and ICD-9 339 “other headache syndromes” (3.4%) (Figure 2).
From 1998-2010, there were 294,904 incident diagnoses of neurological disor-ders during outpatient encounters. More than four-fi ft hs (82.5%) of the incident diagnoses were attributable to the six 3-digit level ICD-9 defi ned disorders that accounted for the most neurological disor-der-related outpatient encounters overall (Figure 2).
Trends of annual visits and inci-dent diagnoses of neurological disorders changed dramatically aft er 2005 (Figures 1,2). Th e sharply increasing counts over-all aft er 2005 were mostly attributable to increases in four of the six 3-digit level ICD-9-defi ned diagnoses cited above; of note, three of the ICD-9 codes that speci-fi ed these diagnoses were not added to the
ICD-9 coding system until October 2005 (327), October 2006 (338), and October 2008 (339). Prior to those dates, diagnoses for sleep disorders, pain not elsewhere clas-sifi ed, and other headache syndromes were generally documented with ICD-9 codes that were not included in the major diag-nostic category of “Diseases of the Nervous System.”
During the seven-year period from 1998 to 2004, the average of annual out-patient encounters for neurological dis-orders was 87,598; during the subsequent six years, the average of annual outpatient encounters for neurological disorders was 231,892. From before to aft er 2005, the six most frequently diagnosed neurological disorders overall accounted for approxi-mately 90% of the increase in the average number of neurological disorder-related encounters and more than 90% of the increase in incident neurological disorder diagnoses (Table 1).
Of note, of the six most frequently diagnosed neurological conditions over-all, ICD-9 codes 354 “mononeuritis of the upper limb and mononeuritis multi-plex” and 355 “mononeuritis of the lower
limb and unspecifi ed site” made only small or no contributions to the large overall increases in total encounters for and inci-dent diagnoses of neurological disorders. In fact, the average annual incidence of the former diagnosis (ICD-9: 354) declined during the last six years of the surveillance period. Also, while diagnoses of migraine (ICD-9: 346) accounted for 9% of the increase in the average annual number of encounters for neurological disorders, the average annual incidence of migraine diag-noses increased by less than one percent aft er 2005.
Of the six most frequently diag-nosed neurological conditions overall, four (ICD-9 codes 327, 338, 339, and 346) accounted for nearly all of the increases in the average numbers of encounters (87.6%) and incident cases (93.2%) aft er 2005 (Table 1). Of particular note in this regard, the three neurological disorder-specifi c ICD-9 codes that were newly introduced between 2005 and 2008 accounted for 78.4% and 92.6% of the overall increases in the average annual numbers of outpatient encounters for and incident diagnoses of neurological disorders, respectively, aft er 2005 (Table 1).

M S M R Vol. 18 No.10 October 2011 Page 4
Organic sleep disorders
During the 13-year surveillance period, 501,653 outpatient encounters were reported with ICD-9 327 “organic sleep disorders” as the primary (fi rst-listed) diagnosis. Although nearly all of these encounters took place aft er 1 October 2005, they represented 25% of all encoun-ters for neurological disorders during the entire period and nearly one-half (46%) of all encounters for neurological disorders in 2010. Among the 73,727 service mem-bers who had more than one encounter for organic sleep disorders during the sur-veillance period, the average number of encounters for this diagnosis was 6.4. Anal-yses of specifi c diagnoses (ICD-9 327.xx) classifi ed under ICD-9 327 “organic sleep disorders” revealed that 472,911 (94.3%) of all such encounters were associated with ICD-9 327.23 “obstructive sleep apnea”. Of the 69,047 individuals with more than one encounter for “obstructive sleep apnea,” the average number of encounters was 6.5.
Prior to the introduction of ICD-9 327 in 2005, diagnoses of obstructive sleep apnea (ICD-9 327.23) would have been coded as ICD-9 780.57 “unspecifi ed sleep
apnea.” Th e “old” code is still valid and classifi ed under the major diagnostic cat-egory of “Signs, Symptoms and Ill-Defi ned Conditions”; as such, encounters that are documented with this diagnostic code are not considered neurological disorder-related encounters for routine surveillance purposes. Numbers of encounters docu-mented with ICD-9 780.57 “unspecifi ed sleep apnea” increased steadily from 1998 to a peak in 2006 and have been fairly sta-ble since then. Of the 50,349 service mem-bers with more than one encounter for ICD-9 780.57 “unspecifi ed sleep apnea”, the average number of encounters for this diagnosis was 4.4.
Pain, not elsewhere classifi ed
During the 13-year surveillance period, 108,159 outpatient encounters were reported with ICD-9 338 “pain, not elsewhere classifi ed” as the primary (fi rst-listed) diagnosis. Although nearly all of these encounters took place aft er 1 October 2006, they represented 5% of all encoun-ters for neurological disorders through-out the surveillance period and 10% of all encounters for neurological disorders in
2010. Among the 15,604 service members with more than one encounter for “pain, not elsewhere classifi ed”, the average num-ber of encounters for this diagnosis was 4.9. Analyses of specifi c diagnoses (ICD 338.xx) classifi ed under ICD-9 338 “pain, not elsewhere classifi ed” revealed that 88,299 (82%) of all such encounters were associated with ICD-9 codes 338.29 “other chronic pain” (37%), 338.4 “chronic pain syndrome” (24%), and 338.18 “other acute postoperative pain” (21%).
Prior to the introduction of ICD-9 338 in 2006, diagnoses of pain were docu-mented with a variety of codes according to the location, organ system, or presumed etiology. Th ese codes are still valid and con-tained within the ICD-9 major diagnostic categories pertaining to Mental Disorders, Nervous System, Sense Organs, Circula-tory System, Digestive System, Genitouri-nary System, Musculoskeletal System, and Symptoms, Signs, and Ill-Defi ned Condi-tions. During the surveillance period, the numbers of encounters associated with these diverse pain-related ICD-9 codes far outnumbered those documented with ICD-9 338, remained relatively stable until 2005, and rose steadily aft er 2006 (the year that ICD-9 338 was introduced). Most of the increase in encounters docu-mented with the “old” pain-related diag-nostic codes were attributable to increases in reports of ICD-9 719.4 “pain in joint” and ICD-9 729.5 “pain in limb” as well as ICD-9 724.1 “pain in thoracic spine”, ICD-9 724.2 “lumbago”, and ICD-9 724.5 “backache, unspecifi ed” (Figure 3). More than 97% of the encounters for which older pain codes were used were attributable to the musculoskeletal system (90.7%) or to unspecifi ed or other chest pain (6.5%). Despite the trend of increasing encoun-ters associated with pain-related diagnos-tic codes (old and new) overall, incident pain-related diagnoses overall declined or remained relatively stable during the sur-veillance period (Figure 4).
Other headache syndromes
During the 13-year surveillance period, 69,037 outpatient encounters were reported with ICD-9 339 “other headache syndromes” as the primary (fi rst-listed)
F I G U R E 1 . Outpatient visits and incident cases of “diseases of the nervous system”, (ICD-9-CM: 320-359), by year, active component, U.S. Armed Forces, 1998-2010
0
10,000
20,000
30,000
40,000
50,000
60,000
0
50,000
100,000
150,000
200,000
250,000
300,000
350,000
400,000
450,000
1998 1999 2000 2001 2002 2003 2004 2005 2006 2007 2008 2009 2010
No.
of i
ncid
ent c
ases
No.
of o
utpa
tient
vis
its
Calendar year
Outpatient visits
Incident cases

October 2011 Vol. 18 No. 10 M S M R Page 5
Other diagnoses
Th e analyses conducted for this report focused on the six most frequently reported (of 38) three-digit level diagnoses included within the ICD-9 major diagnostic category of Diseases of the Nervous System. Th e 32 other diagnoses in the category accounted for just 21.5% of all encounters and 17.5% of all incident cases of neurological disor-ders during the surveillance period. Dur-ing the period, the average annual number of encounters documented with the 32 less frequently reported neurological dis-order-related diagnoses increased by 57%; in contrast, the increase of encounters documented with the six most frequently reported 3-digit level codes was 210%. Similarly, the average annual number of incident cases increased 36% for the 32 relatively infrequently reported codes and 161% for the six most frequently reported codes. Of note, during the surveillance period, 55 new ICD-9 codes were intro-duced to supplement the codes that have been used to document the 32 less fre-quently reported neurological disorders. Th is analysis did not assess associations between introductions of these new diag-nostic codes and increases in encounters for and incident diagnoses of these less fre-quently diagnosed conditions.
E D I T O R I A L C O M M E N T
Th e preponderance of the increase in recorded diagnoses of “neurological disor-ders” in outpatient encounters since 2005 is attributable to the growing use by health care providers of three new 3-digit level ICD-9 codes introduced in the autumns of 2005, 2006, and 2008, respectively. Each of the new codes is associated with a common clinical entity: sleep disorders, pain, and headache.
Prior to the introduction of the new codes, diagnoses of these common dis-orders were reported with ICD-9 codes that, in most cases, are not included in the ICD-9 category that specifi es diagnoses of “Diseases of the Nervous System”. For example, prior to October 1, 2005, diagno-ses of the various conditions that now fall under ICD-9 327 “organic sleep disorders”
diagnosis. Although nearly all of these encounters took place aft er 1 October 2008, they represented 3.4% of all encounters for neurological disorders during the surveil-lance period and 8.7% of all encounters for neurological disorders in 2010. Among the 12,603 service members with more than one encounter for “other headache syn-dromes”, the average number of encoun-ters for this diagnosis was 3.7. Analyses of specifi c diagnoses (ICD-9 339.xx) clas-sifi ed under ICD-9 339 “other headache syndromes” revealed that 64,611 (94%) of all such encounters were associated with ICD-9 339.89 “other specifi ed headache syndromes” (70%), ICD-9 339.20-339.22 “post-traumatic headaches, unspecifi ed, acute, or chronic” (12%), or ICD-9 339.10-339.12 “tension headaches, unspecifi ed, episodic, or chronic” (12%).
Prior to the introduction of ICD-9 code 339 in 2008, diagnoses of headache were documented with the following codes: ICD-9 307.81 “tension headache”; ICD-9 310.2 “postconcussion syndrome”; ICD-9 346.20-346.21 “variants of migraine, not elsewhere classifi ed, without mention of status migrainosus”; ICD-9 346.90-346.91
“migraine unspecifi ed, with or without mention of intractable migraine or status migrainosus”; or ICD-9 784.0 “headache”. Th ese codes are still valid and classifi ed within the major diagnostic categories per-taining to Mental Disorders, Nervous Sys-tem, and Symptoms, Signs, and Ill-Defi ned Conditions. During the surveillance period, the numbers of encounters docu-mented with these older headache-related ICD-9 codes were relatively stable until 2006, rose steadily in 2007 and 2008, and decreased in 2009 and 2010 (aft er ICD-9 339 was introduced). Most of the recent decrease in encounters documented with older headache-related codes was due to decreases in diagnoses reported as ICD-9 784.0 “headache”, ICD-9 307.81 “tension headache”, and ICD-9 310.2 “postconcus-sion syndrome”. More than 96% of the encounters for which the older headache-related codes were used were attributable to ICD-9 784.0 “headache” (58% of total), ICD-9 346.90 “migraine unspecifi ed with-out mention of intractable migraine or status migrainosus” (25%), ICD-9 307.81 “tension headache” (7%), and ICD-9 310.2 “postconcussion syndrome” (7%).
F I G U R E 2 . Outpatient visits and incident cases of “diseases of the nervous system”, (ICD-9-CM: 320-359), by year, active component, U.S. Armed Forces, 1998-2010
0
5,000
10,000
15,000
20,000
25,000
30,000
35,000
40,000
45,000
50,000
0
50,000
100,000
150,000
200,000
250,000
300,000
350,000
400,000
1998 1999 2000 2001 2002 2003 2004 2005 2006 2007 2008 2009 2010
No.
of i
ncid
ent c
ases
No.
of o
utpa
tient
vis
its
Calendar year
Medical encounters, 6 most frequently
reported 3-digit level diagnoses
Medical encounters, all other diagnoses (n=32)
Incident cases, 6 most frequently reported 3-digit level diagnoses
Incident cases, all other diagnoses (n=32)

M S M R Vol. 18 No.10 October 2011 Page 6
were likely documented with ICD-9 codes that are classifi ed under “Signs, Symptom, and Ill-Defi ned Conditions” (specifi cally, ICD-9 780.50–780.59) or “Mental Disor-ders” (specifi cally, ICD-9 307.41, 307.43, 307.45, and 306.8). Also, before 1 Octo-ber 2006, diagnoses that are now classifi ed under ICD-9 338 “pain, not elsewhere clas-sifi ed” were likely assigned diagnostic codes from several major categories, including “Mental Disorders” and disorders of the circulatory, digestive, and musculoskele-tal systems. Similarly, diagnoses now clas-sifi ed under ICD-9 339 “other headache syndromes” (introduced on 1 October 2008) were likely documented with diag-nostic codes from the major categories of “Signs, Symptoms and Ill-Defi ned Condi-tions” and “Mental Disorders”. (Of note, many encounters have been documented with diagnoses of “migraine” which have been and continue to be included in the major category of “Diseases of the Nervous System”.)
Individuals who are diagnosed with obstructive sleep apnea present a substan-tial burden to the health care system. For
example, service members with more than one encounter for this condition average 6.4 encounters; and approximately 14,000 aff ected service members have had 10 or more outpatient encounters in the course of their care. A previous study of obstruc-tive sleep apnea among active duty service members documented a six-fold increase in incident diagnoses during the 10-year period 2000-2009.1 Although the study confi rmed that incidence rates increased with advancing age, consistent with the published literature, it was noteworthy that, within the oldest age group (40 years or more), the rates rose more than eight-fold during the 10-year surveillance period. Factors associated with these trends likely include increasing awareness of the impor-tance of obstructive sleep apnea and its comorbidities and sequelae as well as increasing capabilities to screen for, detect, and diagnose this disorder. Against that backdrop, it is diffi cult to determine how much of the observed sharply increasing trend is attributable to an increase in the numbers and incidence rates of actual cases and how much is due to an enhancement of
the capability to detect cases.2-5 Whatever factors underlie the surge in encounters and cases associated with obstructive sleep apnea, uses of diagnostic codes in the cat-egory of “Diseases of the Nervous System” has substantially increased the numbers and rates of neurological disorder-related diagnoses since 2005.
Numerous factors aff ect numbers of health care encounters for various diagno-ses. For example, an increase in the actual incidence of a condition in a population of interest may be refl ected as an increased frequency of health care utilization by those aff ected (if the condition is serious enough to prompt health care seeking behaviors). Epidemiologists and the public health community in general are most interested in discerning changes in incidence and prevalence in order to inform eff orts at disease and injury prevention and control. In the case of the U.S. Armed Forces dur-ing an extended period of military confl ict, military public health surveillance eff orts seek to develop reasonably accurate esti-mates of the natures and magnitudes of the health impacts of military operations.
F I G U R E 3 . Number of outpatient encounters and incident cases of pain-related diagnoses, by year, active component, U.S. Armed Forces, 1998-2010
0
20,000
40,000
60,000
80,000
100,000
120,000
0
100,000
200,000
300,000
400,000
500,000
600,000
700,000
800,000
900,000
1998 1999 2000 2001 2002 2003 2004 2005 2006 2007 2008 2009 2010
No. o
f inc
iden
t cas
es
No. o
f out
patie
nt e
ncou
nter
s
Calendar year
Joint, limb pain encounters Spine, back pain encounters
New pain code (ICD-9 338)-related encounters All other older pain code-related encounters
Joint, limb pain incidence Spine, back pain incidence
New pain code (ICD-9 338)-related incidence All other older pain-related incidence

October 2011 Vol. 18 No. 10 M S M R Page 7
Unfortunately, other factors may con-found surveillance eff orts to monitor inci-dence and prevalence. Th is report reveals that introductions of new ICD-9 codes into the broad category of neurological disor-ders likely altered coding practices by pro-viders; incident diagnoses of neurological disorders in general sharply increased fol-lowing introductions of the new codes. In the case of the new codes for “pain, not elsewhere classifi ed”, for example, health care providers now have the opportunity to document the presence of pain symp-toms that were not well described in the previously available codes for pain. Th e new codes available under ICD-9 338 pro-vide for such entities as acute and chronic pain occurring aft er trauma and surgery and acute and chronic pain not other-wise characterized. Since the older codes tended to focus on pain localized to partic-ular body locations, the newer codes per-mit the recording of pain symptoms that previously may have gone unrecorded in patients’ records.
Enhanced screening of a popula-tion for its members’ health status aff ords
the opportunity to increase the frequency of identifi cation of cases of illnesses and injuries that might otherwise have gone unrecognized. Even if the true incidence or prevalence of a condition is stable in a population, closer scrutiny of its mem-bers will augment the counts of cases and aff ect the quantitative estimates of inci-dence and prevalence. Service members who have been engaged in combat opera-tions in southwest Asia have been the sub-jects of more detailed medical screening in recent years as part of an eff ort to identify clinically subtle adverse health eff ects of their deployments. To the extent that such screening results in increased numbers of diagnosable conditions, interpretations of data summaries related to numbers and trends of diagnoses of various conditions must consider the eff ects of activities that increase the detection and reporting of cases.
A recent MSMR report considered the impact of screening on estimates of disease incidence and prevalence and also described a number of other factors that must be considered when interpreting
medical encounter data.6 Th e report illus-trated the potentially large eff ects of vary-ing defi nitions, strategies, and data sources used in analytic methods on surveillance estimates of disease incidence. Th e case study utilized estimates of the incidence of traumatic brain injury, a disorder for which enhanced screening and new diag-nostic and reporting guidelines have been implemented in the U.S. Armed Forces in the past few years.
In summary, there has been a dramatic increase in the numbers of service mem-bers’ health care encounters for Diseases of the Nervous System over the last 13 years and particularly aft er 2005. Th e vast majority of the increase in such encounters is attributable to the introduction of three new diagnostic codes that are classifi ed in the ICD-9 as Diseases of the Nervous Sys-tem. Th e clinical entities represented by the new codes for “organic sleep disor-ders”, “pain, not elsewhere classifi ed”, and “other headache syndromes”, are all very common. Th e pre-existing codes which were, and can still be, used to document such entities are in most cases not classifi ed under the ICD-9 category of Diseases of the Nervous System. To the extent that the new codes better represent clinical diagnoses and that health care providers have begun to use the new codes, the eff ect has been to boost the counts of neurological disor-ders overall and mask trends of the “true incidence” of such disorders over time. In addition, one of the new codes (ICD-9 327 “organic sleep disorders”) represents a diagnosis formerly classifi ed under the cat-egory of Symptoms, Signs, and Ill-Defi ned Conditions; of note, this diagnosis has dra-matically increased in reporting frequency during the surveillance period. Th is exami-nation of trends in encounters and incident diagnoses of neurological disorders illu-minates factors that should be considered when interpreting summaries of adminis-trative data for use in estimating incidence, prevalence, and trends of diseases and inju-ries in general.
R E F E R E N C E S
1. Armed Forces Health Surveillance Center. Obstructive sleep apnea, active component, U.S.
F I G U R E 4 . Outpatient encounters and incident cases, all pain-related diagnosis codes, by year, active component, U.S. Armed Forces, 1998-2010
0
200,000
400,000
600,000
800,000
1,000,000
1,200,000
1,400,000
1,600,000
1998 1999 2000 2001 2002 2003 2004 2005 2006 2007 2008 2009 2010
No. o
f enc
ount
ers
and
Incid
ent c
ases
Calendar year
Encounters for all pain-related diagnosis codes
Incident cases, all pain-related diagnosis codes

M S M R Vol. 18 No.10 October 2011 Page 8
Armed Forces, January 2000-December 2009. Medical Surveillance Monthly Report (MSMR). 2010;17(05):8-11.2. Lee, N. Lab aims to put sleep disorders to rest. Stars and Stripes. 20 Sep 2008. Available at: http://www.stripes.com/news/lab-aims-to-put-sleep-disorders-to-rest-1.83223. Accessed 2 Nov 2011.3. Duren, R. Pensacola Hospital Springs Forward With Opening of Expanded Sleep Lab. Navy.mil
web site. 6 Mar 2009. Available at: http://www.navy.mil/search/display.asp?story_id=43182. Accessed 2 Nov 2011.4. Avalona-Butler, A. New WAMC sleep lab a dream come true. Paraglide. 16 Dec 2010. Available at: http://paraglideonline.net/121610_news2.html . Accessed 2 Nov 2011.5. Coleman, M. Patients with TBI, sleep disorders can get treatment at new Tripler clinics. Hawai’i Army Weekly. 21 Oct 2010. Available at: http://
www.hawaiiarmyweekly.com/news/2010/10/21/patients-with-tbi-sleep-disorders-can-get-treatment-at-new-t.html. Accessed 2 Nov 2011.6. Armed Forces Health Surveillance Center. Deriving case counts from medical encounter data: considerations when interpreting health surveillance reports. Medical Surveillance Monthly Report (MSMR). 2009;16(12):2-8.

October 2011 Vol. 18 No. 10 M S M R Page 9
alcohol-related diagnoses among active component members of the U.S. Armed Forces.
M E T H O D S
Th e surveillance period was 1 January 2001 to 31 December 2010. Th e surveil-lance population included all individu-als who served in the active component of any branch of the U.S. military at any time during the surveillance period. Records of health care encounters (hospitalizations and outpatient clinic visits) in the Defense Medical Surveillance System were searched to identify encounters associated with alco-hol abuse-related ICD-9 diagnostic codes. Medical encounters that included alcohol abuse-related ICD-9-CM codes (in any diagnostic position) were used to defi ne “acute” or “chronic” cases (Table 1). An individual’s fi rst encounter of acute and/or chronic abuse was recorded as the inci-dent date; each service member could be counted as an acute case and/or a chronic case only once each during the surveillance period.
A “recurrent acute” case was defi ned as an individual with three or more acute encounters each separated by at least 30 days but occurring within 1 year of the fi rst
Alcohol-related Diagnoses, Active Component, U.S. Armed Forces, 2001-2010
alcohol abuse and dependence in the U.S. military are well-described public health problems.
Given the accessibility of alcohol and its common use in military culture, service members may use alcohol consumption as a recreational activity or to help cope with stressful or traumatic events associated with military duties or combat.1,2 Among respondents to a 2008 survey of health-related behavior, 47 percent of service members self-reported as “binge drinkers”; military personnel showed signifi cantly higher rates of “heavy drinking” than civil-ians across all age groups; and 5 percent reported possible “dependence”.3
Alcohol abuse and dependence can result in serious consequences that impede the operational eff ectiveness of the force and may negatively impact family life and career advancement. Abuse and depen-dence are associated with poor health out-comes (e.g., poisonings, long-term sequelae of chronic abuse), social disruption (e.g., domestic strife), career stunting (e.g., low performance ratings, loss of promotion, attrition from service), misconduct (e.g., fi ghting, drunk driving), and accidental and intentional injuries.2,3
Th is report describes the ten-year trends and demographic characteris-tics of acute, chronic, and “recurrent”
Alcohol abuse and dependence in the U.S. military are well-described public health problems. From 2001-2010, numbers and rates of incident alcohol-related diagnoses and alcohol-related medical encounters have increased among active component members, with the sharpest increases since 2007. Numbers of hospital bed days for acute alcohol diagnoses increased more than three-fold. Incidence rates of acute and chronic alcohol-related diagnoses were highest in 21-24-year-old males in the Army, but among women rates were highest among those under 21. More than one-fi ft h (21%) of all acute alcohol-related encounters were recurrent diagnoses and the proportion of recurrences was higher among those in combat occupations (26%) and in the Air Force (35%). Recent increases in incident alcohol-related diagnoses may refl ect increasing scrutiny of alcohol use among military members and a concomitant focus on referrals for evaluation of alcohol misuse.
Acute case 305.0x Alcohol abuse/drunk NOS 980.x Toxic effect of alcohol 790.3 Excessive BAC E860.x Alcohol poisoning Chronic case
303.0x Acute intoxication in presence of alcohol dependence
291.x Alcohol-induced mental disorders
303.9xOther and unspecifi ed alcohol dependence (chronic alcoholism)
571.0-571.3 Alcoholic liver disease 425.5 Alcoholic cardiomyopathy 535.3x Alcoholic gastritis 357.5 Alcoholic polyneuropathy V11.3 Personal history of alcoholism
T A B L E 1 . ICD-9-CM diagnostic codes for alcohol-related diagnoses
of the three diagnoses. An individual could be a “recurrent acute” case only once dur-ing the surveillance period.
Counts of medical evacuations (MEDEVACs) for alcohol-related condi-tions were derived from records of service members who were medically evacuated during the surveillance period from the U.S. Central Command (CENTCOM) area of responsibility (AOR) to a medical treat-ment facility outside of CENTCOM AOR. Evacuations were included in analyses if the aff ected service member had at least one inpatient or outpatient alcohol-related medical encounter in a fi xed U.S. military medical facility within 10 days aft er the evacuation date.
To estimate the health care burden associated with alcohol abuse, all inpatient and outpatient medical encounters with alcohol abuse-related ICD-9-CM codes (per Table 1) reported as primary (fi rst-listed) diagnoses were identifi ed. Health care burdens were quantifi ed by the total number of medical encounters attributable to an acute or chronic alcohol diagnosis; the

M S M R Vol. 18 No.10 October 2011 Page 10
total number of unique individuals aff ected by an acute or chronic diagnosis; and the total number of bed-days during hospital-izations for acute or chronic diagnoses.
R E S U L T S
Acute cases
During the 10-year surveillance period, 190,302 active component mem-bers had at least one medical encounter in which they received an acute alcohol diag-nosis (crude incidence rate: 13.72 per 1,000 person-years [p-yrs]). Of these incident diagnoses, 21% (n=39,819) were consid-ered recurrent acute cases.
Among active component members, annual numbers and rates of both inpa-tient and outpatient incident acute alcohol diagnoses decreased slightly from 2001 to 2003, remained relatively stable until 2005 and then increased slightly until 2009 (Fig-ure 1). Th e rates of inpatient incident acute diagnoses were marginally higher at the end compared to the beginning of the sur-veillance period (crude incidence rate 1.35 per 1,000 p-yrs in 2010 vs. 0.98 per 1,000 p-yrs in 2001); incident outpatient diagno-ses were slightly lower in 2010 than in 2001 (crude incidence rate 13.04 per 1,000 p-yrs vs. 14.72 per 1,000 p-yrs).
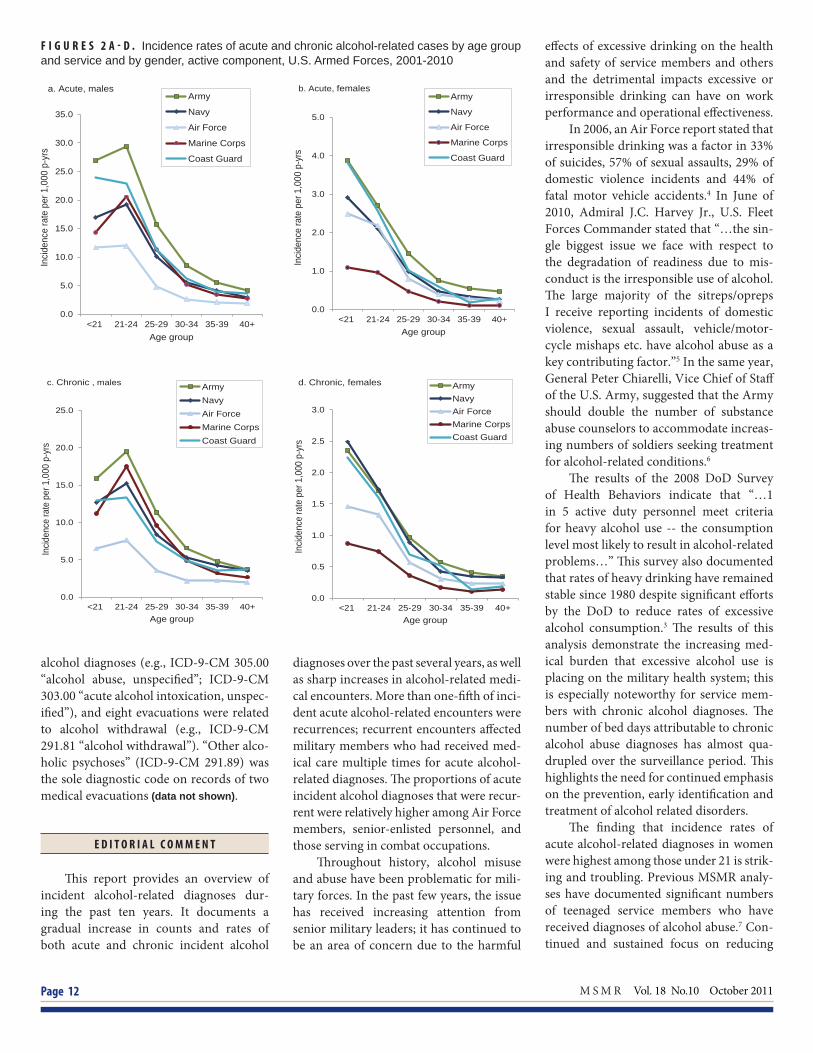
Th e crude overall incidence rate of acute alcohol diagnoses among males (14.52 per 1,000 p-yrs) was 1.6 times the rate among females (9.13 per 1,000 p-yrs).In females, the crude incidence rates decreased monotonically with age, while for males, incidence rates were highest in the 21-24 year old category (7.4 per 1,000 p-yrs) and then decreased with increasing age (Table 2).
Overall, and among both males and females, crude incidence rates of acute alco-hol diagnoses were higher in the Army than the other services. In each of the Services, rates were highest among males younger than 25 years old and then sharply declined with increasing age; among females, rates were highest among those younger than 21 years old and then declined with increasing age (Figures 2a,b).
Although numbers of total alco-hol related medical encounters did not
0.00
0.20
0.40
0.60
0.80
1.00
1.20
1.40
1.60
0.00
2.00
4.00
6.00
8.00
10.00
12.00
14.00
16.00
18.00
2001 2002 2003 2004 2005 2006 2007 2008 2009 2010
Inci
denc
e ra
te p
er 1
,000
p-y
rs (d
ashe
d lin
es)
Inci
denc
e ra
te p
er 1
,000
p-y
rs (l
ines
)
Calendar year
Outpatient Acute Outpatient Chronic Inpatient Acute Inpatient Chronic
F I G U R E 1 . Incidence rates of acute and chronic alcohol-related inpatient and outpatient cases, active component, U.S. Armed Forces, 2001-2010
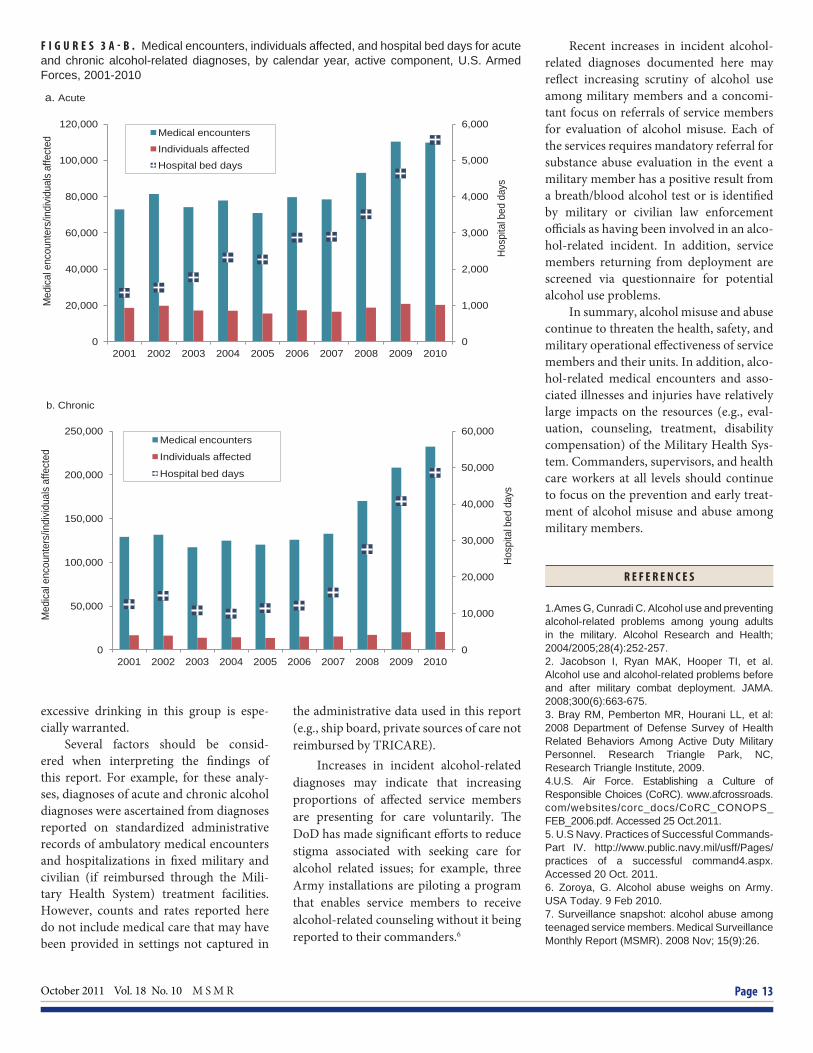
increase in a linear fashion during the surveillance period, the number of medi-cal encounters in 2010 (n=109,780) was approximately 50% higher than in 2001 (n=72,931). Active component mem-bers with incident acute alcohol diagno-ses accounted for a more than three-fold increase in numbers of hospital bed days during the period (Figure 3a).
Chronic cases
During the 10-year surveillance period, 141,341 active component mem-bers had at least one medical encounter in which they received a chronic alcohol diag-nosis (crude incidence rate: 10.10 per 1,000 p-yrs).
Patterns that were evident in relation to incident acute diagnoses were similar to those in relation to incident chronic diag-noses. For example, among active com-ponent members, annual numbers and rates of both inpatient and outpatient inci-dent chronic alcohol diagnoses slightly decreased in the beginning of the surveil-lance period and then slightly increased. Also, crude incidence rates were lower for outpatient chronic incident diagnoses in 2010 than in 2001 (crude incidence rate: 9.77 vs. 12.53 per 1,000 p-yrs) while inpa-tient chronic incident diagnoses were mar-ginally higher at the end than the beginning
of the surveillance period (crude incidence rate: 1.00 vs. 0.80 per 1,000 p-yrs (Figure 1).
As with acute diagnoses, the crude overall incidence rate of chronic alcohol diagnoses was higher among males than females (10.72 vs. 6.51 per 1,000 p-yrs). Also, among females, crude incidence rates were highest among the youngest aged and then decreased monotonically with age, while among males, incidence rates were highest among 21-24 year olds and then decreased sharply with age (Figures 2c,d).
Among active component members with incident chronic alcohol-related diag-noses, both total alcohol-related medical encounters and hospital bed days markedly increased during 2007-2010 (Figure 3b).
Recurrent cases
Approximately 21% of total incident acute alcohol diagnoses were considered recurrent cases (i.e., aff ected members had had at least three medical encounters with acute alcohol diagnoses). While more males than females had recurrent acute alcohol encounters, the proportions of all incident acute encounters that were recur-rent did not substantially diff er between the genders. Senior enlisted members (grades E5-E9) had a marginally higher propor-tion (22%) of recurrent alcohol diagnoses than those in other military grades. Across

October 2011 Vol. 18 No. 10 M S M R Page 11
all demographic and military subgroups, the highest proportions of recurrent acute encounters aff ected service members in combat-specifi c occupations (26%) and in the Air Force (35%) (Table 2).
MEDEVACs
During the approximately nine-year portion of the surveillance period for which medical evacuation data were
available (October 2001–December 2010), records of 75 medical evacuations included acute or chronic alcohol diagnoses in at least one diagnostic position. Of these, more than 50% (n=41) documented acute
T A B L E 2 . Number and incidence rates of acute and chronic cases and number and percentage of “recurrent acute” cases, active component, U.S. Armed Forces, 2001-2010
Acute Cases Chronic Cases Recurrent Cases
No Rate IRRa No Rate IRRa No.% of all incident
acute casesTotal 190,302 13.72 . 141,341 10.10 . 39,819 21
Inpatient 15,462 1.12 . 11,151 0.80 . .Outpatient 174,840 12.61 . 130,190 9.31 . .
Sex Female 18,576 9.13 Ref 13,324 6.51 Ref 3,942 21Male 171,726 14.52 1.6 128,017 10.72 1.6 35,877 21
Age group <21 42,194 21.53 6.5 27,849 14.13 4.2 7,936 1921-24 86,932 23.57 7.1 63,061 16.86 5.0 18,008 2125-29 35,728 12.05 3.6 27,475 9.14 2.7 8,279 2330-34 12,844 6.41 1.9 10,770 5.33 1.6 2,946 2335-39 7,667 4.35 1.3 7,172 4.05 1.2 1,719 2240+ 4,937 3.33 Ref 5,014 3.38 Ref 931 19
Age group (males) <21 36,825 22.47 6.5 24,166 14.66 4.2 6,864 1921-24 79,042 25.46 7.4 57,598 18.28 5.2 16,306 2125-29 32,598 13.05 3.8 25,147 9.92 2.8 7,580 2330-34 11,767 6.79 2.0 9,903 5.67 1.6 2,696 2335-39 7,017 4.51 1.3 6,618 4.24 1.2 1,584 2340+ 4,477 3.44 Ref 4,585 3.52 Ref 847 19
Age group (females) <21 5,369 16.72 6.6 3,683 11.43 4.9 1,072 2021-24 7,890 13.52 5.3 5,463 9.28 3.9 1,702 2225-29 3,130 6.72 2.7 2,328 4.96 2.1 669 220-34 1,077 3.95 1.6 867 3.16 1.3 250 2335-39 650 3.10 1.2 554 2.64 1.1 135 2140+ 460 2.53 Ref 429 2.35 Ref 84 18
Race/ethnicity White, non-Hispanic 127,204 14.52 1.8 95,995 10.86 1.9 26,922 21Black, non-Hispanic 27,348 11.26 1.4 19,402 7.93 1.4 5,653 21Hispanic 20,953 15.05 1.8 14,865 10.55 1.9 4,285 20Asian/Pacifi c Islander 5,240 8.19 Ref 3,612 5.61 Ref 1,077 21American Indian/Alaskan Native 5,321 23.41 2.9 4,415 19.20 3.4 1,033 19Other 4,236 10.18 1.2 3,052 7.28 1.3 849 20
Service Army 92,330 18.92 2.6 63,690 12.88 2.6 21,977 24Navy 42,319 12.41 1.7 35,523 10.34 2.1 5,923 14Air Force 24,414 7.17 Ref 16,808 4.91 Ref 8,455 35Marine Corps 26,131 14.61 2.0 21,989 12.22 2.5 2,673 10Coast Guard 5,108 13.38 1.9 3,331 8.62 1.8 791 15
Military status (grade) Junior enlisted (E1-E4) 148,101 24.61 19.0 107,615 17.68 12.9 30,806 21Senior enlisted (E5-E9) 37,323 6.74 5.2 29,957 5.36 3.9 8,104 22Junior offi cers (O1-O3 [W1-W3]) 3,707 2.64 2.0 2,535 1.80 1.3 670 18Senior offi cers (O4-O10 [W4-W5]) 1,168 1.29 Ref 1,234 1.37 Ref 239 20
Occupation Combat-specifi c 12,001 10.52 Ref 8,954 7.79 Ref 3,139 26Healthcare 46,274 16.43 1.6 33,891 11.91 1.5 8,932 19Other 132,027 13.32 1.3 98,496 9.85 1.3 27,748 21
aIncidence Rate Ratio (IRR)
M S M R Vol. 18 No.10 October 2011 Page 12
F I G U R E S 2 A - D . Incidence rates of acute and chronic alcohol-related cases by age group and service and by gender, active component, U.S. Armed Forces, 2001-2010
0.0
5.0
10.0
15.0
20.0
25.0
30.0
35.0
<21 21-24 25-29 30-34 35-39 40+
Inci
denc
e ra
te p
er 1
,000
p-y
rs
Age group
Army
Navy
Air Force
Marine Corps
Coast Guard
a. Acute, males
0.0
1.0
2.0
3.0
4.0
5.0
<21 21-24 25-29 30-34 35-39 40+
Incid
ence
rate
per
1,0
00 p
-yrs
Age group
Army
Navy
Air Force
Marine Corps
Coast Guard
b. Acute, females
0.0
5.0
10.0
15.0
20.0
25.0
<21 21-24 25-29 30-34 35-39 40+
Incid
ence
rate
per
1,0
00 p
-yrs
Age group
Army Navy Air Force Marine Corps Coast Guard
c. Chronic , males
0.0
0.5
1.0
1.5
2.0
2.5
3.0
<21 21-24 25-29 30-34 35-39 40+
Incid
ence
rate
per
1,0
00 p
-yrs
Age group
Army Navy Air Force Marine Corps Coast Guard
d. Chronic, females
alcohol diagnoses (e.g., ICD-9-CM 305.00 “alcohol abuse, unspecifi ed”; ICD-9-CM 303.00 “acute alcohol intoxication, unspec-ifi ed”), and eight evacuations were related to alcohol withdrawal (e.g., ICD-9-CM 291.81 “alcohol withdrawal”). “Other alco-holic psychoses” (ICD-9-CM 291.89) was the sole diagnostic code on records of two medical evacuations (data not shown).
E D I T O R I A L C O M M E N T
Th is report provides an overview of incident alcohol-related diagnoses dur-ing the past ten years. It documents a gradual increase in counts and rates of both acute and chronic incident alcohol
diagnoses over the past several years, as well as sharp increases in alcohol-related medi-cal encounters. More than one-fi ft h of inci-dent acute alcohol-related encounters were recurrences; recurrent encounters aff ected military members who had received med-ical care multiple times for acute alcohol-related diagnoses. Th e proportions of acute incident alcohol diagnoses that were recur-rent were relatively higher among Air Force members, senior-enlisted personnel, and those serving in combat occupations.
Th roughout history, alcohol misuse and abuse have been problematic for mili-tary forces. In the past few years, the issue has received increasing attention from senior military leaders; it has continued to be an area of concern due to the harmful
eff ects of excessive drinking on the health and safety of service members and others and the detrimental impacts excessive or irresponsible drinking can have on work performance and operational eff ectiveness.
In 2006, an Air Force report stated that irresponsible drinking was a factor in 33% of suicides, 57% of sexual assaults, 29% of domestic violence incidents and 44% of fatal motor vehicle accidents.4 In June of 2010, Admiral J.C. Harvey Jr., U.S. Fleet Forces Commander stated that “…the sin-gle biggest issue we face with respect to the degradation of readiness due to mis-conduct is the irresponsible use of alcohol. Th e large majority of the sitreps/opreps I receive reporting incidents of domestic violence, sexual assault, vehicle/motor-cycle mishaps etc. have alcohol abuse as a key contributing factor.”5 In the same year, General Peter Chiarelli, Vice Chief of Staff of the U.S. Army, suggested that the Army should double the number of substance abuse counselors to accommodate increas-ing numbers of soldiers seeking treatment for alcohol-related conditions.6
Th e results of the 2008 DoD Survey of Health Behaviors indicate that “…1 in 5 active duty personnel meet criteria for heavy alcohol use -- the consumption level most likely to result in alcohol-related problems…” Th is survey also documented that rates of heavy drinking have remained stable since 1980 despite signifi cant eff orts by the DoD to reduce rates of excessive alcohol consumption.3 Th e results of this analysis demonstrate the increasing med-ical burden that excessive alcohol use is placing on the military health system; this is especially noteworthy for service mem-bers with chronic alcohol diagnoses. Th e number of bed days attributable to chronic alcohol abuse diagnoses has almost qua-drupled over the surveillance period. Th is highlights the need for continued emphasis on the prevention, early identifi cation and treatment of alcohol related disorders.
Th e fi nding that incidence rates of acute alcohol-related diagnoses in women were highest among those under 21 is strik-ing and troubling. Previous MSMR analy-ses have documented signifi cant numbers of teenaged service members who have received diagnoses of alcohol abuse.7 Con-tinued and sustained focus on reducing
October 2011 Vol. 18 No. 10 M S M R Page 13
excessive drinking in this group is espe-cially warranted.
Several factors should be consid-ered when interpreting the fi ndings of this report. For example, for these analy-ses, diagnoses of acute and chronic alcohol diagnoses were ascertained from diagnoses reported on standardized administrative records of ambulatory medical encounters and hospitalizations in fi xed military and civilian (if reimbursed through the Mili-tary Health System) treatment facilities. However, counts and rates reported here do not include medical care that may have been provided in settings not captured in
F I G U R E S 3 A - B . Medical encounters, individuals affected, and hospital bed days for acute and chronic alcohol-related diagnoses, by calendar year, active component, U.S. Armed Forces, 2001-2010
0
1,000
2,000
3,000
4,000
5,000
6,000
0
20,000
40,000
60,000
80,000
100,000
120,000
2001 2002 2003 2004 2005 2006 2007 2008 2009 2010
Hosp
ital b
ed d
ays
Med
ical e
ncou
nter
s/in
divid
uals
affe
cted
Medical encounters
Individuals affected
Hospital bed days
a. Acute
0
10,000
20,000
30,000
40,000
50,000
60,000
0
50,000
100,000
150,000
200,000
250,000
2001 2002 2003 2004 2005 2006 2007 2008 2009 2010
Hosp
ital b
ed d
ays
Med
ical
enc
ount
ers/
indi
vidua
ls a
ffect
ed Medical encounters
Individuals affected
Hospital bed days
b. Chronic
the administrative data used in this report (e.g., ship board, private sources of care not reimbursed by TRICARE).
Increases in incident alcohol-related diagnoses may indicate that increasing proportions of aff ected service members are presenting for care voluntarily. Th e DoD has made signifi cant eff orts to reduce stigma associated with seeking care for alcohol related issues; for example, three Army installations are piloting a program that enables service members to receive alcohol-related counseling without it being reported to their commanders.6
Recent increases in incident alcohol-related diagnoses documented here may refl ect increasing scrutiny of alcohol use among military members and a concomi-tant focus on referrals of service members for evaluation of alcohol misuse. Each of the services requires mandatory referral for substance abuse evaluation in the event a military member has a positive result from a breath/blood alcohol test or is identifi ed by military or civilian law enforcement offi cials as having been involved in an alco-hol-related incident. In addition, service members returning from deployment are screened via questionnaire for potential alcohol use problems.
In summary, alcohol misuse and abuse continue to threaten the health, safety, and military operational eff ectiveness of service members and their units. In addition, alco-hol-related medical encounters and asso-ciated illnesses and injuries have relatively large impacts on the resources (e.g., eval-uation, counseling, treatment, disability compensation) of the Military Health Sys-tem. Commanders, supervisors, and health care workers at all levels should continue to focus on the prevention and early treat-ment of alcohol misuse and abuse among military members.
R E F E R E N C E S
1.Ames G, Cunradi C. Alcohol use and preventing alcohol-related problems among young adults in the military. Alcohol Research and Health; 2004/2005;28(4):252-257.2. Jacobson I, Ryan MAK, Hooper TI, et al. Alcohol use and alcohol-related problems before and after military combat deployment. JAMA. 2008;300(6):663-675.3. Bray RM, Pemberton MR, Hourani LL, et al: 2008 Department of Defense Survey of Health Related Behaviors Among Active Duty Military Personnel. Research Triangle Park, NC, Research Triangle Institute, 2009.4.U.S. Air Force. Establishing a Culture of Responsible Choices (CoRC). www.afcrossroads.com/websites/corc_docs/CoRC_CONOPS_FEB_2006.pdf. Accessed 25 Oct.2011.5. U.S Navy. Practices of Successful Commands-Part IV. http://www.public.navy.mil/usff/Pages/practices of a successful command4.aspx. Accessed 20 Oct. 2011.6. Zoroya, G. Alcohol abuse weighs on Army. USA Today. 9 Feb 2010.7. Surveillance snapshot: alcohol abuse among teenaged service members. Medical Surveillance Monthly Report (MSMR). 2008 Nov; 15(9):26.

M S M R Vol. 18 No.10 October 2011 Page 14
Update: Cold Weather Injuries, U.S. Armed Forces, July 2006-June 2011
From July 2010 through June 2011, the number of U.S. service members treated for cold injuries (n=557) was similar to recent prior years. Th e most frequently reported cold injury was hypothermia in the Marine Corps and frostbite in the other service branches. Cold injury rates were generally high-est among service members who were less than 20 years old and of black, non-Hispanic race/ethnicity. Service members who train in wet and freezing conditions - and their supervisors at all levels - should know the signs of cold injury, ensure adequate hydration, and avoid tobacco, caff eine, and vasocon-strictive medications.
prolonged and/or intense exposures to cold can signifi cantly impact the health, well-being and opera-
tional eff ectiveness of service members and their units.1-5 Because U.S. military opera-tions are conducted in diverse geographic and weather conditions, the U.S. military has developed extensive countermeasures against threats associated with training and operating in cold environments.1-6
In recent years, rates of hospitalization for cold weather injuries of U.S. military members have generally declined, at least in part, because of improvements in cloth-ing, equipment, policies, and practices.2
F I G U R E 1 . Rates of cold injurya by service and year, active component, U.S. Armed Forces, July 2006-June 2011
Still, cold injuries (many of them prevent-able) aff ect hundreds of service members each year. Th is report summarizes fre-quencies, rates, and correlates of risk of cold injuries among members of active and reserve components of the U.S. Armed Forces during the past fi ve years.
M E T H O D S
Th e surveillance period was 1 July 2006 to 30 June 2011. Th e surveillance popula-tion included all individuals who served
in an active and/or reserve component of the U.S. Armed Forces any time during the surveillance period. For analysis purposes, years were divided into 1 July through 30 June intervals so that complete “cold weather seasons” could be represented in year-to-year summaries. Inpatient, outpatient, and reportable medical event records in the Defense Medical Surveillance System (DMSS) were searched to identify all primary (fi rst-listed) diagnoses of “frostbite” (ICD-9-CM codes: 991.0-991.3), “immersion foot” (ICD-9-CM: 991.4), “hypothermia”(ICD-9-CM: 991.6), and “other specifi ed/unspecifi ed eff ects of reduced temperature” (ICD-9-CM: 991.8-991.9). To exclude follow-up encounters for single cold injury episodes, only one cold injury per individual per year was included. In summaries by type of cold injury, one of each type of cold injury per individual per year was included. If multiple medical encounters for cold injuries occurred on the same day, only one was used for analysis (hospitalizations were prioritized over ambulatory visits).
Annual rates of cold injuries (per 100,000 person-years of service) were
0
10
20
30
40
50
60
70
Jul 2006- Jun 2007
Jul 2007- Jun 2008
Jul 2008- Jun 2009
Jul 2009- Jun 2010
Jul 2010- Jun 2011
Cas
es p
er 1
00,0
00 p
erso
n-ye
ars Army
Navy
Coast Guard
Air Force
Marine Corps
F I G U R E 2 . Cold injuriesa among members of active and reserve components, U.S. Armed Forces, by service and year, July 2006-June 2011
aOne cold injury per individual per year
aOne cold injury per individual per year
0
50
100
150
200
250
300
350
400
450
500
Jul 2006- Jun 2007
Jul 2007- Jun 2008
Jul 2008- Jun 2009
Jul 2009- Jun 2010
Jul 2010- Jun 2011
No.
of c
old
inju
ries
Cold year
Army Marine Corps Air Force Navy Coast Guard
Cold year

October 2011 Vol. 18 No. 10 M S M R Page 15
T A B L E 1 A . Cold injuries, active component, U.S. Army, July 2006-June 2011
T A B L E 1 B . Cold injuries, active component, U.S. Navy, July 2006-June 2011
estimated only for the active component because the start and end dates of all active duty service periods of reserve component members were not available.
R E S U L T S
From July 2010 through June 2011, 557 members of the U.S. Armed Forces had at least one medical encounter with a primary diagnosis of cold injury. During the past year, nearly one-fi ft h (n=105) of those aff ected by cold injury were members of the reserve component. Th e numbers of reserve component members aff ected by cold injuries in 2010-11 was similar to recent prior years (data not shown). During the year, 452 members of the active component were aff ected by cold injuries; in general, the cold injury rates among active component members (32 per 100,000 person years [p-yrs]) have been remarkably stable over the past four years (data not shown). During the 2010-11 cold season, in the active components of the Services, the rate of any cold injury in the Army (46.6 per 100,000 p-yrs) was approximately 17 percent higher than in the Marine Corps (39.7 per 100,000 p-yrs), 142 percent higher than in the Coast Guard (19.2 per 100,000 p-yrs), 95% higher than in the Air Force (23.6 per 100,000 p-yrs), and approximately fi ve and a half times higher than in the Navy (7.1 per 100,000 p-yrs) (Figure 1). In the past year, soldiers accounted for more than one-half (58%) of all active component members aff ected by cold injuries (Figure 2). During the past cold season, the most frequently reported cold injuries among the Services were hypothermia in the Marine Corps and frostbite in the Army, Navy, Air Force and Coast Guard (Table 1a-e). In the Army, the rate of cold injuries (any cause) in 2010-11 was similar to that of the previous 3 years; there were increases in the numbers of frostbite and hypothermia cases and declines in immersion foot and unspecifi ed cold injuries (Table 1a). In the Air Force, the rate of cold injuries (any cause) in 2010-11 was similar to those of the previous four years (Table 1c). In the
Frostbite Immersion foot Hypothermia Unspecifi ed All coldinjuriesb
No. Ratea No. Ratea No. Ratea No. Ratea No. Ratea
Total 688 25.7 150 5.6 148 5.5 390 14.5 1,376 51.3 Sex Male 517 22.3 133 5.7 128 5.5 243 10.5 1,021 44.1 Female 171 46.9 17 4.7 20 5.5 147 40.3 355 97.4 Race/ethnicity White, non-Hisp 297 17.8 97 5.8 93 5.6 154 9.3 641 38.5 Black, non-Hisp 293 54.8 37 6.9 34 6.4 179 33.5 543 101.5 Other 98 20.3 16 3.3 21 4.3 57 11.8 192 39.8 Age group <20 69 42.0 19 11.6 26 15.8 58 35.3 172 104.6 20-24 269 31.8 62 7.3 76 9.0 144 17.0 551 65.2 25-29 159 24.5 34 5.2 23 3.5 80 12.3 296 45.6 30-34 78 19.4 17 4.2 11 2.7 49 12.2 155 38.6 35-39 57 17.1 14 4.2 5 1.5 33 9.9 109 32.7 40-44 34 17.8 3 1.6 5 2.6 16 8.4 58 30.4 45+ 22 22.7 1 1.0 2 2.1 10 10.3 35 36.0 Military status Enlisted 629 28.1 135 6.0 139 6.2 353 15.8 1,256 56.1 Offi cer 59 13.3 15 3.4 9 2.0 37 8.3 120 27.0 Cold year (Jul-Jun) 2006-2007 154 30.7 37 7.4 28 5.6 92 18.3 311 61.9 2007-2008 124 23.8 27 5.2 26 5.0 72 13.8 249 47.9 2008-2009 131 24.2 27 5.0 26 4.8 74 13.7 258 47.6 2009-2010 131 23.7 38 6.9 31 5.6 85 15.4 285 51.5 2010-2011 148 26.2 21 3.7 37 6.6 67 11.9 273 48.4aRate per 100,000 person-yearsbOne of each type of cold injury per individual per year
Frostbite Immersion foot Hypothermia Unspecifi ed All coldinjuriesb
No. Ratea No. Ratea No. Ratea No. Ratea No. Ratea
Total 84 5.1 44 2.7 44 2.7 27 1.6 199 12.1 Sex Male 71 5.1 40 2.9 40 2.9 24 1.7 175 12.5 Female 13 5.2 4 1.6 4 1.6 3 1.2 24 9.7 Race/ethnicity White, non-Hisp 45 5.0 27 3.0 23 2.6 14 1.6 109 12.2 Black, non-Hisp 16 5.7 3 1.1 9 3.2 7 2.5 35 12.5 Other 23 4.9 14 3.0 12 2.5 6 1.3 55 11.7 Age group <20 15 15.9 15 15.9 5 5.3 3 3.2 38 40.2 20-24 33 6.2 16 3.0 24 4.5 11 2.1 84 15.8 25-29 17 4.4 6 1.6 8 2.1 6 1.6 37 9.6 30-34 5 2.0 4 1.6 5 2.0 3 1.2 17 6.9 35-39 5 2.4 2 1.0 1 0.5 1 0.5 9 4.3 40-44 5 4.5 1 0.9 0 0.0 2 1.8 8 7.1 45+ 4 6.2 0 0.0 1 1.6 1 1.6 6 9.4 Military status Enlisted 71 5.1 40 2.9 42 3.0 22 1.6 175 12.6 Offi cer 13 5.0 4 1.5 2 0.8 5 1.9 24 9.2 Cold year (Jul-Jun) 2006-2007 15 4.4 7 2.1 17 5.0 4 1.2 43 12.6 2007-2008 21 6.4 9 2.7 3 0.9 9 2.7 42 12.7 2008-2009 25 7.6 14 4.3 8 2.4 5 1.5 52 15.9 2009-2010 11 3.4 12 3.7 9 2.8 6 1.8 38 11.7 2010-2011 12 3.7 2 0.6 7 2.2 3 0.9 24 7.4
aRate per 100,000 person-yearsbOne of each type of cold injury per individual per year
M S M R Vol. 18 No.10 October 2011 Page 16
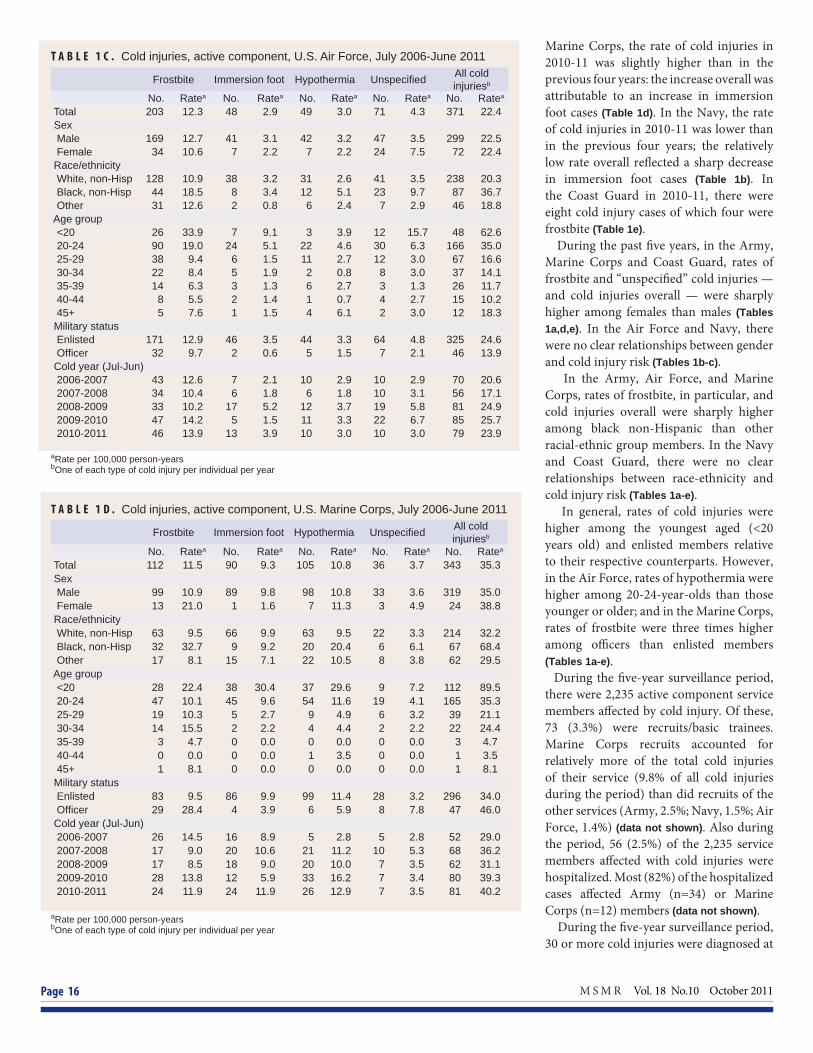
T A B L E 1 C . Cold injuries, active component, U.S. Air Force, July 2006-June 2011
T A B L E 1 D . Cold injuries, active component, U.S. Marine Corps, July 2006-June 2011
Marine Corps, the rate of cold injuries in 2010-11 was slightly higher than in the previous four years: the increase overall was attributable to an increase in immersion foot cases (Table 1d). In the Navy, the rate of cold injuries in 2010-11 was lower than in the previous four years; the relatively low rate overall refl ected a sharp decrease in immersion foot cases (Table 1b). In the Coast Guard in 2010-11, there were eight cold injury cases of which four were frostbite (Table 1e). During the past fi ve years, in the Army, Marine Corps and Coast Guard, rates of frostbite and “unspecifi ed” cold injuries — and cold injuries overall — were sharply higher among females than males (Tables 1a,d,e). In the Air Force and Navy, there were no clear relationships between gender and cold injury risk (Tables 1b-c). In the Army, Air Force, and Marine Corps, rates of frostbite, in particular, and cold injuries overall were sharply higher among black non-Hispanic than other racial-ethnic group members. In the Navy and Coast Guard, there were no clear relationships between race-ethnicity and cold injury risk (Tables 1a-e). In general, rates of cold injuries were higher among the youngest aged (<20 years old) and enlisted members relative to their respective counterparts. However, in the Air Force, rates of hypothermia were higher among 20-24-year-olds than those younger or older; and in the Marine Corps, rates of frostbite were three times higher among offi cers than enlisted members (Tables 1a-e). During the fi ve-year surveillance period, there were 2,235 active component service members aff ected by cold injury. Of these, 73 (3.3%) were recruits/basic trainees. Marine Corps recruits accounted for relatively more of the total cold injuries of their service (9.8% of all cold injuries during the period) than did recruits of the other services (Army, 2.5%; Navy, 1.5%; Air Force, 1.4%) (data not shown). Also during the period, 56 (2.5%) of the 2,235 service members aff ected with cold injuries were hospitalized. Most (82%) of the hospitalized cases aff ected Army (n=34) or Marine Corps (n=12) members (data not shown). During the fi ve-year surveillance period, 30 or more cold injuries were diagnosed at
Frostbite Immersion foot Hypothermia Unspecifi ed All coldinjuriesb
No. Ratea No. Ratea No. Ratea No. Ratea No. Ratea
Total 203 12.3 48 2.9 49 3.0 71 4.3 371 22.4 Sex Male 169 12.7 41 3.1 42 3.2 47 3.5 299 22.5 Female 34 10.6 7 2.2 7 2.2 24 7.5 72 22.4 Race/ethnicity White, non-Hisp 128 10.9 38 3.2 31 2.6 41 3.5 238 20.3 Black, non-Hisp 44 18.5 8 3.4 12 5.1 23 9.7 87 36.7 Other 31 12.6 2 0.8 6 2.4 7 2.9 46 18.8 Age group <20 26 33.9 7 9.1 3 3.9 12 15.7 48 62.6 20-24 90 19.0 24 5.1 22 4.6 30 6.3 166 35.0 25-29 38 9.4 6 1.5 11 2.7 12 3.0 67 16.6 30-34 22 8.4 5 1.9 2 0.8 8 3.0 37 14.1 35-39 14 6.3 3 1.3 6 2.7 3 1.3 26 11.7 40-44 8 5.5 2 1.4 1 0.7 4 2.7 15 10.2 45+ 5 7.6 1 1.5 4 6.1 2 3.0 12 18.3 Military status Enlisted 171 12.9 46 3.5 44 3.3 64 4.8 325 24.6 Offi cer 32 9.7 2 0.6 5 1.5 7 2.1 46 13.9 Cold year (Jul-Jun) 2006-2007 43 12.6 7 2.1 10 2.9 10 2.9 70 20.6 2007-2008 34 10.4 6 1.8 6 1.8 10 3.1 56 17.1 2008-2009 33 10.2 17 5.2 12 3.7 19 5.8 81 24.9 2009-2010 47 14.2 5 1.5 11 3.3 22 6.7 85 25.7 2010-2011 46 13.9 13 3.9 10 3.0 10 3.0 79 23.9
aRate per 100,000 person-yearsbOne of each type of cold injury per individual per year
Frostbite Immersion foot Hypothermia Unspecifi ed All coldinjuriesb
No. Ratea No. Ratea No. Ratea No. Ratea No. Ratea
Total 112 11.5 90 9.3 105 10.8 36 3.7 343 35.3 Sex Male 99 10.9 89 9.8 98 10.8 33 3.6 319 35.0 Female 13 21.0 1 1.6 7 11.3 3 4.9 24 38.8 Race/ethnicity White, non-Hisp 63 9.5 66 9.9 63 9.5 22 3.3 214 32.2 Black, non-Hisp 32 32.7 9 9.2 20 20.4 6 6.1 67 68.4 Other 17 8.1 15 7.1 22 10.5 8 3.8 62 29.5 Age group <20 28 22.4 38 30.4 37 29.6 9 7.2 112 89.5 20-24 47 10.1 45 9.6 54 11.6 19 4.1 165 35.3 25-29 19 10.3 5 2.7 9 4.9 6 3.2 39 21.1 30-34 14 15.5 2 2.2 4 4.4 2 2.2 22 24.4 35-39 3 4.7 0 0.0 0 0.0 0 0.0 3 4.7 40-44 0 0.0 0 0.0 1 3.5 0 0.0 1 3.5 45+ 1 8.1 0 0.0 0 0.0 0 0.0 1 8.1 Military status Enlisted 83 9.5 86 9.9 99 11.4 28 3.2 296 34.0 Offi cer 29 28.4 4 3.9 6 5.9 8 7.8 47 46.0 Cold year (Jul-Jun) 2006-2007 26 14.5 16 8.9 5 2.8 5 2.8 52 29.0 2007-2008 17 9.0 20 10.6 21 11.2 10 5.3 68 36.2 2008-2009 17 8.5 18 9.0 20 10.0 7 3.5 62 31.1 2009-2010 28 13.8 12 5.9 33 16.2 7 3.4 80 39.3 2010-2011 24 11.9 24 11.9 26 12.9 7 3.5 81 40.2
aRate per 100,000 person-yearsbOne of each type of cold injury per individual per year

October 2011 Vol. 18 No. 10 M S M R Page 17
T A B L E 1 E . Cold injuries, active component, U.S. Coast Guard, July 2006-June 2011each of 21 locations worldwide. Of these locations, eight had more (and 13 had fewer) cold injuries in 2010-11 than the average of cold injury episodes per year during the prior four years at the respective locations (Figure 3). In the past year, Fort Jackson, SC (n=28), Forts Wainwright and Richardson in Alaska (n=27), Marine Corps Base Camp LeJeune, NC (n=25) and Fort Bliss, TX (n=25) had more than 20 cold injury cases each among active and reserve component members (Figure 3).
E D I T O R I A L C O M M E N T
In general, during the past cold season, numbers, rates, and types of cold injuries among U.S. service members were similar to those in recent years. Th e fi nding should be interpreted in light of the unusual severity of the winter of 2010-11 in many parts of the eastern United States and Europe. As in the past, rates of cold injuries overall remain higher in the Army and Marine Corps than in the Air Force,
F I G U R E 3 . Annual number of cold injuriesa, 2010-11 and mean during 2006-2010, at locations with at least 30 cold injuries during the surveillance period, active component, U.S. Armed Forces, July 2006-June 2011
Frostbite Immersion foot Hypothermia Unspecifi ed All coldinjuriesb
No. Ratea No. Ratea No. Ratea No. Ratea No. Ratea
Total 15 7.3 4 1.9 15 7.3 6 2.9 40 19.4 Sex Male 11 6.1 4 2.2 14 7.8 5 2.8 34 18.8 Female 4 15.3 0 0.0 1 3.8 1 3.8 6 23.0 Race/ethnicity White, non-Hisp 10 6.8 3 2.0 13 8.8 3 2.0 29 19.6 Black, non-Hisp 0 0.0 1 8.8 0 0.0 0 0.0 1 8.8 Other 5 10.5 0 0.0 2 4.2 3 6.3 10 21.1 Age group <20 3 42.0 0 0.0 3 42.0 1 14.0 7 97.9 20-24 5 9.4 4 7.6 5 9.4 0 0.0 14 26.4 25-29 3 5.5 0 0.0 2 3.7 3 5.5 8 14.7 30-34 2 5.7 0 0.0 2 5.7 0 0.0 4 11.5 35-39 1 3.9 0 0.0 1 3.9 0 0.0 2 7.8 40-44 1 5.5 0 0.0 2 10.9 2 10.9 5 27.3 45+ . . . . . . . . . . Military status Enlisted 12 7.2 4 2.4 13 7.8 4 2.4 33 19.9 Offi cer 3 7.3 0 0.0 2 4.9 2 4.9 7 17.1 Cold year (Jul-Jun) 2006-2007 7 17.5 0 0.0 5 12.5 3 7.5 15 37.4 2007-2008 2 4.9 0 0.0 1 2.4 0 0.0 3 7.3 2008-2009 1 2.4 2 4.8 4 9.6 2 4.8 9 21.6 2009-2010 1 2.4 1 2.4 3 7.1 0 0.0 5 11.8 2010-2011 4 9.6 1 2.4 2 4.8 1 2.4 8 19.2
aRate per 100,000 person-yearsbOne of each type of cold injury per individual per year
0
5
10
15
20
25
30
35
40
45
0
5
10
15
20
25
30
35
40
45
Fort
Jack
son,
SC
Fort
Wain
wrigh
t/For
t Ri
char
dson
, AK
MCB
Cam
p Le
jeune
, NC
Fort
Bliss
, TX
Fairc
hild A
FB, W
A
Fort
Brag
g, N
C
Fort
Cars
on, C
O
MCB
Qua
ntico
, VA
MCB
Cam
p Pe
ndlet
on, C
A
Fort
Cam
pbell
, KY
Elm
endo
rf AF
B, A
K
Fort
Lewi
s, W
A
Fort
Leon
ard
Woo
d,
MO
Fort
Benn
ing, G
A
Fort
Knox
, KY
Fort
Sill,
OK
Fort
Drum
, NY
Seou
l, Kor
ea
Fort
Riley
, KS
MCR
D Pa
rris I
sland
, SC
NTC
Grea
t Lak
es, I
L
Mea
n of
cold
injur
y cas
es p
er ye
ar, 2
006-
10 (h
orizo
ntal
lines
)
Cold
injur
y cas
es, 2
010-
11 (g
reen
/red
bars
)
Red bars: incident cases in 2010-11 > mean of prior years
Green bars: incident cases in 2010-11 < mean of prior years
Horizontal lines: mean cases per year, 2006-10
aOne cold injury per individual per year

M S M R Vol. 18 No.10 October 2011 Page 18
Navy, and Coast Guard. In the Marine Corps, the rate of cold injuries overall was higher during the past cold season than the previous four cold seasons. Compared to the prior season, in 2010-11, rates were similar in the Army, Air Force and Coast Guard and declined in the Navy. Comparisons of cold injury experiences among the Services should be done carefully if at all. For example, diff erences across services in cold injury rates – overall, by type, and in relation to the military characteristics of those most aff ected – refl ect diff erences in the natures, locations, and circumstances of the training and operations of the Services. Also, diff erences in rates across services may refl ect diff erences in the ascertainment and/or reporting of cold injury cases (e.g., records of medical encounters during fi eld exercises, deployment operations, and aboard Navy ships are not routinely available for health surveillance purposes). In general, among service members overall, the youngest aged, female, enlisted, and black non-Hispanic service members have
relatively high rates of cold injuries—particularly frostbite. Other reports have documented that African American soldiers and soldiers with prior cold injuries have increased susceptibilities to cold injuries during prolonged or intense cold exposures.2,3 Special vigilance by individuals, line supervisors, commanders, and medical staff is indicated to prevent cold injuries among those with known or suspected increased susceptibilities. Commanders and supervisors at all levels should implement appropriate countermeasures to prevent cold injuries, including proper clothing and equipment, wind chill temperature monitoring and awareness training.1,4 Service members who train in wet and freezing conditions should know the signs of cold injury, obtain adequate hydration, and avoid tobacco, caff eine, and vasoconstrictive medications.1,4,6 Up-to-date cold injury prevention materials (including posters, presentation outlines, policies, regulations, and technical bulletins) are available
online: http://phc.amedd.army.mil/topics/discond/cip/Pages/default.aspx
R E F E R E N C E S
1. Sec II: Cold environments, in Medical aspects of harsh environments,vol 1. DE Lounsbury and RF Bellamy, eds. Washington, DC: Offi ce of the Surgeon General, Department of the Army, United States of America, 2001:311-609.2. DeGroot DW, Castellani JW, Williams JO, Amoroso PJ. Epidemiology of U.S. Army cold weather injuries, 1980-1999. Aviat Space Environ Med. 2003 May;74(5):564-70.3. Candler WH, Ivey H. Cold weather injuries among U.S. soldiers in Alaska: a fi ve-year review. Mil Med. 1997 Dec;162(12):788-91.4. Castellani JW, O’Brien C, Baker-Fulco C, et al. Sustaining health and performance in cold weather operations. Technical note no. TN/02-2. US Army Research Institute of Environmental Medicine, Natick, Massachusetts. October 2001.5. Hall A, Evans K, Pribyl S. Cold injury in the United States military population: current trends and comparison with past confl icts. J Surg Educ. 2010 Mar-Apr;67(2):61-5.6. Castellani JW, Young AJ, Ducharme MB, et al. American College of Sports Medicine. American College of Sports Medicine position stand: prevention of cold injuries during exercise. Med Sci Sports Exerc. 2006 Nov;38(11):2012-29.

October 2011 Vol. 18 No. 10 M S M R Page 19
Surveillance Snapshot: Reportable Medical Events of Heat Injury in Relation to Heat Index, June-September 2011
In the U.S. military, notifiable heat injuries include heat stroke and other moderate to severe heat-related injuries that require medical intervention or result in lost duty time. During June through September of 2011, 1,265 heat injuries among active and reserve component members were reported from 46 U.S. military installations worldwide. Of these, nearly one-half (n=618) were reported from one large training installation in the southeastern United States; and at this installation, 80 percent (n=498) were reported on just 7 days with at least 48 cases each day.
Clusters of heat injuries at this installation were reported during periods of increasing heat stress (e.g. heat index), though not on the days with the highest measurements of heat index. Th ere were no heat injuries associated with the 25 days when the heat index was 105 or greater. Eighty-six percent (n=529) of the heat injuries were associated with heat index readings between 90 and 104.
0
20
40
60
80
100
120
0 10 20 30 40 50 60 70 80 90
100
1-Ju
n
8-Ju
n
15-J
un
22-J
un
29-J
un
6-Ju
l
13-J
ul
20-J
ul
27-J
ul
3-A
ug
10-A
ug
17-A
ug
24-A
ug
31-A
ug
7-S
ep
14-S
ep
21-S
ep
28-S
ep
Hea
t ind
ex (
ºF)
(line
)
No.
of h
eat i
njur
ies
(bar
s)
Reported heat injuries Heat index
Notifi able heat injuries reported from a single training installation in the southeastern United States (n=380) and heat index at that installa-tion, by day, 1 June - 30 September 2011
aBased on National Weather Service data
a

M S M R Vol. 18 No.10 October 2011 Page 20
Deployment-related conditions of special surveillance interest, U.S. Armed Forces, by month and service, January 2003 - September 2011 (data as of 27 October 2011)
Motor vehicle accident-related deaths (outside of the operational theater) (per the DoD Medical Mortality Registry)
Reference: Armed Forces Health Surveillance Center. Motor vehicle-related deaths, U.S. Armed Forces, 2010. Medical Surveillance Monthly Report (MSMR). Mar 11;17(3):2-6.Note: Death while deployed to/within 90 days of returning from OEF/OIF/OND. Excludes accidents involving military-owned/special use motor vehicles. Excludes individuals medically evacuated from CENTCOM and/or hospitalized in Landstuhl, Germany within 10 days prior to death.
Note: Hospitalization (one per individual) while deployed to/within 90 days of returning from OEF/OIF/OND. Excludes accidents involving military-owned/special use motor vehicles. Excludes individuals medically evacuated from CENTCOM and/or hospitalized in Landstuhl, Germany within 10 days of a motor vehicle accident-related hospitalization.
Motor vehicle accident-related hospitalizations (outside of the operational theater) (ICD-9-CM: E810-E825; NATO Standard Agreement 2050 (STANAG): 100-106, 107-109, 120-126, 127-129)
0
5
10
15
20
25
Janu
ary
2003
April
200
3
July
2003
Oct
ober
200
3
Janu
ary
2004
April
200
4
July
2004
Oct
ober
200
4
Janu
ary
2005
April
200
5
July
2005
Oct
ober
200
5
Janu
ary
2006
April
200
6
July
2006
Oct
ober
200
6
Janu
ary
2007
April
200
7
July
2007
Oct
ober
200
7
Janu
ary
2008
April
200
8
July
2008
Oct
ober
200
8
Janu
ary
2009
April
200
9
July
2009
Oct
ober
200
9
Janu
ary
2010
April
201
0
July
2010
Oct
ober
201
0
Janu
ary
2011
April
201
1
July
2011
No. o
f hos
pita
lizat
ions
Motorcycle accident-related hospitalizations
Other MVA-related hospitalizations
9.0/mo 9.9/mo 8.0/mo 8.4/mo 6.9/mo 8.8/mo 9.7/mo 8.7/mo 6.4/mo
0
2
4
6
8
10
12
Janu
ary
2003
April
200
3
July
2003
Oct
ober
200
3
Janu
ary
2004
April
200
4
July
2004
Oct
ober
200
4
Janu
ary
2005
April
200
5
July
2005
Oct
ober
200
5
Janu
ary
2006
April
200
6
July
2006
Oct
ober
200
6
Janu
ary
2007
April
200
7
July
2007
Oct
ober
200
7
Janu
ary
2008
April
200
8
July
2008
Oct
ober
200
8
Janu
ary
2009
April
200
9
July
2009
Oct
ober
200
9
Janu
ary
2010
April
201
0
July
2010
Oct
ober
201
0
Janu
ary
2011
April
201
1
July
2011
No.
of d
eath
s
Motorcycle accident-related deaths
Other MVA-related deaths
2.5/mo 2.2/mo 4.2/mo 3.3/mo 2.1/mo 2.6/mo 1.3/mo 1.9/mo 0.7/mo

October 2011 Vol. 18 No. 10 M S M R Page 21
Deployment-related conditions of special surveillance interest, U.S. Armed Forces, by month and service, January 2003 -September 2011 (data as of 27 October 2011)
Reference: Armed Forces Health Surveillance Center. Deriving case counts from medical encounter data: considerations when interpreting health surveillance reports. MSMR. Dec 2009; 16(12):2-8.aIndicator diagnosis (one per individual) during a hospitalization or ambulatory visit while deployed to/within 30 days of returning from OEF/OIF. (Includes in-theater medical encounters from the Theater Medical Data Store [TMDS] and excludes 3,261 deployers who had at least one TBI-related medical encounter any time prior to OEF/OIF).
Reference: Isenbarger DW, Atwood JE, Scott PT, et al. Venous thromboembolism among United States soldiers deployed to Southwest Asia. Thromb Res. 2006;117(4):379-83.bOne diagnosis during a hospitalization or two or more ambulatory visits at least 7 days apart (one case per individual) while deployed to/within 90 days of returning from OEF/OIF.
Traumatic brain injury (ICD-9: 310.2, 800-801, 803-804, 850-854, 907.0, 950.1-950.3, 959.01, V15.5_1-9, V15.5_A-F, V15.52_0-9, V15.52_A-F, V15.59_1-9, V15.59_A-F)a
Deep vein thrombophlebitis/pulmonary embolus (ICD-9: 415.1, 451.1, 451.81, 451.83, 451.89, 453.2, 453.40 - 453.42 and 453.8)b
0
200
400
600
800
1000
1200
1400
1600
1800
Janu
ary
2003
Ap
ril 2
003
Ju
ly 20
03
Oct
ober
200
3
Janu
ary
2004
Ap
ril 2
004
Ju
ly 20
04
Oct
ober
200
4
Janu
ary
2005
Ap
ril 2
005
Ju
ly 20
05
Oct
ober
200
5
Janu
ary
2006
Ap
ril 2
006
Ju
ly 20
06
Oct
ober
200
6
Janu
ary
2007
Ap
ril 2
007
Ju
ly 20
07
Oct
ober
200
7
Janu
ary
2008
Ap
ril 2
008
July
2008
O
ctob
er 2
008
Janu
ary
2009
Ap
ril 2
009
July
2009
O
ctob
er 2
009
Janu
ary
2010
Ap
ril 2
010
July
2010
O
ctob
er 2
010
Janu
ary
2011
Ap
ril 2
011
July
2011
No. o
f cas
es
Marine Corps Air Force Navy Army
482.8/mo 621.3/mo 72.0/mo 85.8/mo 133.1/mo 259.3/mo 532.3/mo 604.2/mo 576.4/mo
0
10
20
30
40
Janu
ary
2003
April
200
3
July
200
3
Oct
ober
200
3
Janu
ary
2004
April
200
4
July
200
4
Oct
ober
200
4
Janu
ary
2005
April
200
5
July
200
5
Oct
ober
200
5
Janu
ary
2006
April
200
6
July
200
6
Oct
ober
200
6
Janu
ary
2007
April
200
7
July
200
7
Oct
ober
200
7
Janu
ary
2008
April
200
8
July
200
8
Oct
ober
200
8
Janu
ary
2009
April
200
9
July
200
9
Oct
ober
200
9
Janu
ary
2010
April
201
0
July
201
0
Oct
ober
201
0
Janu
ary
2011
April
201
1
July
201
1
No.
of c
ases
Marine Corps
Air Force
Navy
Army
18.8/mo 20.4/mo 12.2/mo 15.7/mo 13.9/mo 17.9/mo 22.8/mo 17.9/mo 20.6/mo
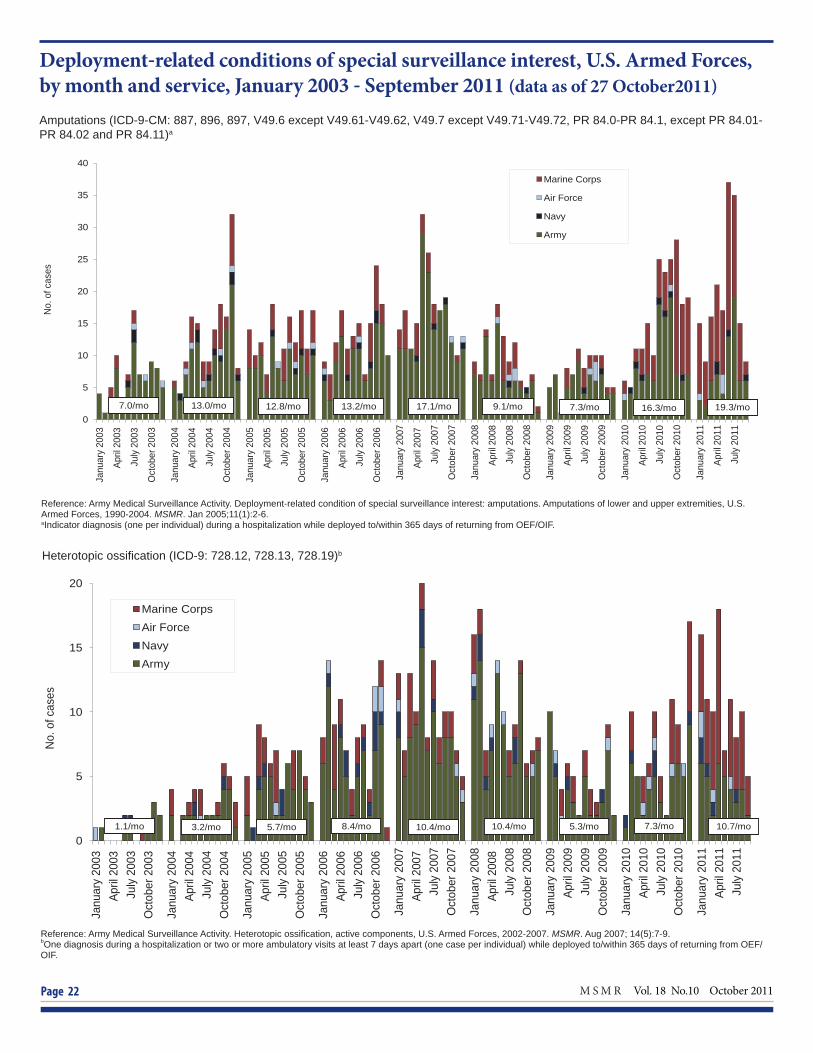
M S M R Vol. 18 No.10 October 2011 Page 22
Deployment-related conditions of special surveillance interest, U.S. Armed Forces, by month and service, January 2003 - September 2011 (data as of 27 October2011)
Amputations (ICD-9-CM: 887, 896, 897, V49.6 except V49.61-V49.62, V49.7 except V49.71-V49.72, PR 84.0-PR 84.1, except PR 84.01-PR 84.02 and PR 84.11)a
Reference: Army Medical Surveillance Activity. Deployment-related condition of special surveillance interest: amputations. Amputations of lower and upper extremities, U.S. Armed Forces, 1990-2004. MSMR. Jan 2005;11(1):2-6.aIndicator diagnosis (one per individual) during a hospitalization while deployed to/within 365 days of returning from OEF/OIF.
Heterotopic ossifi cation (ICD-9: 728.12, 728.13, 728.19)b
Reference: Army Medical Surveillance Activity. Heterotopic ossifi cation, active components, U.S. Armed Forces, 2002-2007. MSMR. Aug 2007; 14(5):7-9.bOne diagnosis during a hospitalization or two or more ambulatory visits at least 7 days apart (one case per individual) while deployed to/within 365 days of returning from OEF/OIF.
0
5
10
15
20
25
30
35
40
Janu
ary
2003
April
200
3
July
200
3
Oct
ober
200
3
Janu
ary
2004
April
200
4
July
200
4
Oct
ober
200
4
Janu
ary
2005
April
200
5
July
200
5
Oct
ober
200
5
Janu
ary
2006
April
200
6
July
200
6
Oct
ober
200
6
Janu
ary
2007
April
200
7
July
200
7
Oct
ober
200
7
Janu
ary
2008
April
200
8
July
200
8
Oct
ober
200
8
Janu
ary
2009
April
200
9
July
200
9
Oct
ober
200
9
Janu
ary
2010
April
201
0
July
201
0
Oct
ober
201
0
Janu
ary
2011
April
201
1
July
201
1
No.
of c
ases
Marine Corps
Air Force
Navy
Army
7.3/mo 16.3/mo 7.0/mo 13.0/mo 17.1/mo 12.8/mo 13.2/mo 9.1/mo 19.3/mo
0
5
10
15
20
Janu
ary
2003
Ap
ril 2
003
Ju
ly 20
03
Oct
ober
200
3
Janu
ary
2004
Ap
ril 2
004
Ju
ly 20
04
Oct
ober
200
4
Janu
ary
2005
Ap
ril 2
005
Ju
ly 20
05
Oct
ober
200
5
Janu
ary
2006
Ap
ril 2
006
Ju
ly 20
06
Oct
ober
200
6
Janu
ary
2007
Ap
ril 2
007
Ju
ly 20
07
Oct
ober
200
7
Janu
ary
2008
Ap
ril 2
008
Ju
ly 20
08
Oct
ober
200
8
Janu
ary
2009
Ap
ril 2
009
July
2009
O
ctob
er 2
009
Janu
ary
2010
Ap
ril 2
010
July
2010
O
ctob
er 2
010
Janu
ary
2011
Ap
ril 2
011
July
2011
No.
of c
ases
Marine Corps Air Force Navy Army
5.3/mo 7.3/mo 3.2/mo 1.1/mo 5.7/mo 8.4/mo 10.4/mo 10.4/mo 10.7/mo

October 2011 Vol. 18 No. 10 M S M R Page 23
Deployment-related conditions of special surveillance interest, U.S. Armed Forces, by month and service, January 2003 - September 2011 (data as of 27 October 2011)
Reference: Army Medical Surveillance Activity. Deployment-related condition of special surveillance interest: severe acute pneumonia. Hospitalizations for acute respiratory failure (ARF)/acute respiratory distress syndrome (ARDS) among participants in Operation Enduring Freedom/Operation Iraqi Freedom, active components, U.S. Armed Forces, Janu-ary 2003-November 2004. MSMR. Nov/Dec 2004;10(6):6-7.aIndicator diagnosis (one per individual) during a hospitalization while deployed to/within 30 days of returning from OEF/OIF.
Severe acute pneumonia (ICD-9: 518.81, 518.82, 480-487, 786.09)a
Leishmaniasis (ICD-9: 085.0 to 085.9)b
Reference: Army Medical Surveillance Activity. Deployment-related condition of special surveillance interest: leishmaniasis. Leishmaniasis among U.S. Armed Forces, January 2003-November 2004. MSMR. Nov/Dec 2004;10(6):2-4.bIndicator diagnosis (one per individual) during a hospitalization, ambulatory visit, and/or from a notifi able medical event during/after service in OEF/OIF.
0
50
100
150
Janu
ary
2003
Ap
ril 20
03
July
2003
O
ctob
er 2
003
Janu
ary
2004
Ap
ril 20
04
July
2004
O
ctob
er 2
004
Janu
ary
2005
Ap
ril 20
05
July
2005
O
ctob
er 2
005
Janu
ary
2006
Ap
ril 20
06
July
2006
O
ctob
er 2
006
Janu
ary
2007
Ap
ril 20
07
July
2007
O
ctob
er 2
007
Janu
ary
2008
Ap
ril 20
08
July
2008
O
ctob
er 2
008
Janu
ary
2009
Ap
ril 20
09
July
2009
O
ctob
er 2
009
Janu
ary
2010
Ap
ril 20
10
July
2010
O
ctob
er 2
010
Janu
ary
2011
Ap
ril 20
11
July
2011
No. o
f cas
es
Marine Corps Air Force Navy Army
5.4/mo 51.8/mo 48.9/mo 8.2/mo 4.6/mo 5.3/mo 13.9/mo 4.0/mo 3.0/mo
0
1
2
3
4
5
Janu
ary
2003
Ap
ril 20
03
July
2003
O
ctob
er 2
003
Janu
ary
2004
Ap
ril 20
04
July
2004
O
ctob
er 2
004
Janu
ary
2005
Ap
ril 20
05
July
2005
O
ctob
er 2
005
Janu
ary
2006
Ap
ril 20
06
July
2006
O
ctob
er 2
006
Janu
ary
2007
Ap
ril 2
007
Ju
ly 20
07
Oct
ober
200
7
Janu
ary
2008
Ap
ril 20
08
July
2008
O
ctob
er 2
008
Janu
ary
2009
Ap
ril 20
09
July
2009
O
ctob
er 2
009
Janu
ary
2010
Ap
ril 20
10
July
2010
O
ctob
er 2
010
Janu
ary
2011
Ap
ril 20
11
July
2011
No. o
f cas
es
Marine Corps Air Force Navy Army
0.6/mo 0.8/mo 0.8/mo 1.7/mo 0.6/mo 0.7/mo 0.9/mo 1.0/mo 0.2/mo
Medical Surveillance Monthly Report (MSMR)Armed Forces Health Surveillance Center11800 Tech Road, Suite 220 (MCAF-CS)Silver Spring, MD 20904
T H E M E D I C A L S U R V E I L L A N C E M O N T H L Y R E P O R T ( M S M R ) , in continuous publication since 1995, is produced by the Armed Forces Health Surveillance Center (AFHSC). Th e MSMR provides evidence-based estimates of the incidence, distribution, impact and trends of illness and injuries among United States military members and associated populations. Most reports in the MSMR are based on summaries of medical administrative data that are routinely provided to the AFHSC and integrated into the Defense Medical Surveillance System for health surveillance purposes.
All previous issues of the MSMR are available online at www.afh sc.mil. Subscriptions (electronic and hard copy) may be requested online at www.afh sc.mil/msmrSubscribe or by contacting AFHSC at (301) 319-3240. E-mail: msmr.afh [email protected]
Submissions: Suitable reports include surveillance summaries, outbreak reports and cases series. Prospective authors should contact the Editor at msmr.afh [email protected]
All material in the MSMR is in the public domain and may be used and reprinted without permission. When citing MSMR articles from April 2007 to current please use the following format: Armed Forces Health Surveillance Center. Title. Medical Surveillance Monthly Report (MSMR). Year Month;Volume(No):pages. For citations before April 2007: Army Medical Surveillance Activity. Title. Medical Surveillance Monthly Report (MSMR). Year Month; Volume(No): pages.
Opinions and assertions expressed in the MSMR should not be construed as refl ecting offi cial views, policies, or positions of the Department of Defense or the United States Government.
ISSN 2158-0111 (print)ISSN 2152-8217 (online)Printed on acid-free paper
Director, Armed Forces Health Surveillance Center
CAPT Kevin L. Russell, MD, MTM&H, FIDSA (USN)
Editor
John F. Brundage, MD, MPH
Writer-Editor
Ellen R. Wertheimer, MHSDenise S. Olive, MS
Contributing Editor
Leslie L. Clark, PhD, MS
Visual Information Specialist
Jennifer L. Bondarenko
Data Analysis
Stephen B. Taubman, PhDMonique-Nicole Anthony, MPHTannya F. Martin
Editorial Oversight
COL Robert J. Lipnick, ScD (USA) Francis L. O’Donnell, MD, MPH Mark V. Rubertone, MD, MPH Joel C. Gaydos, MD, MPH