volume 24 number 8 medical sureillance monthly …
TRANSCRIPT
M E D I C A L S U R V E I L L A N C E M O N T H L Y R E P O R T
MSMR
A publication of the Armed Forces Health Surveillance Branch
AUGUST 2017
Volume 24Number 8
P A G E 2 Multiple sclerosis among service members of the active and reserve components of the U.S. Armed Forces and among other beneficiaries of the Military Health System, 2007–2016Valerie F. Williams, MA, MS; Shauna Stahlman, PhD, MPH; Saixia Ying, PhD
P A G E 1 2 Challenges with diagnosing and investigating suspected active tuberculosis disease in military traineesDavid Chang, MD; Bryant J. Webber, MD, MPH; Steven M. Hetrick, MD, MPH; Jerry B. Owen, DO, MPH; Audra A. Blasi, DVM; Bernadette M. Steele, DVM, MPH; Heather C. Yun, MD
P A G E 1 7 Brief report: Mid-season influenza vaccine effectiveness estimates for the 2016–2017 influenza seasonElizabeth Toure, MPH; Angelia A. Eick-Cost, PhD, ScM; Anthony W. Hawksworth; Michael J. Cooper, PhD; Zheng Hu, MS; Christopher A. Myers, PhD; Peter E. Kammerer, MD; Michelle N. Ricketts; Susan Federinko, MD, MPH
Sandra Bermúdez
NIH
NINDS/Govind Bhagavatheeshwaran, Daniel Reich

MSMR Vol. 24 No. 8 August 2017 Page 2
During 2007–2016, a total of 2,031 active component service members received incident diagnoses of multiple sclerosis (MS), for an overall unadjusted inci-dence rate of 14.9 cases per 100,000 p-yrs. The average overall unadjusted rate among reserve/guard members during this surveillance period was 6.9 cases per 100,000 persons. In both components, women had a higher overall inci-dence of MS than men across all race/ethnicity groups. Overall rates of MS were highest among non-Hispanic black service members. Crude annual incidence rates among active component members decreased slightly during 2007–2016, while rates among reserve/guard members were relatively stable. Among active component members, the annual female-to-male incidence ratios decreased during the 10-year period (3.7:1 in 2007 to 2.5:1 in 2016). Annual numbers of incident cases of MS decreased among non–service member Military Health System beneficiaries during this period. The median age at MS case-defining diagnosis was 32 years among active component members, 37 years among reserve/guard members, and 48 years among non–service member beneficia-ries. The median time intervals between initial presentation and case-defining MS-related encounter ranged from 15 days among reserve/guard component members to 20 days among active component service members. This study makes a useful contribution to the literature on temporal changes in the inci-dence of MS by sex and race/ethnicity.
Multiple Sclerosis Among Service Members of the Active and Reserve Components of the U.S. Armed Forces and Among Other Beneficiaries of the Military Health System, 2007–2016Valerie F. Williams, MA, MS; Shauna Stahlman, PhD, MPH; Saixia Ying, PhD
Multiple sclerosis (MS) is an immune-mediated inf lam-matory demyelinating disease
of the central nervous system, affecting approximately 400,000 people in the U.S. and more than 2 million people worldwide.1,2 Common MS symptoms include numb-ness and tingling in limbs, visual loss, motor weakness, double vision, gait disturbance, and balance problems.3 Disease activity is determined by clinical relapses or magnetic resonance imaging (MRI) evidence of cen-tral nervous system lesions.3 The inflamma-tory demyelination and axonal injury that characterize MS result in significant clinical disability and economic burden.4,5
The clinical course of MS is highly variable and evolves over many years. The main MS phenotypes are relapsing and remitting (RRMS) and progressive disease.6 A relapsing and remitting course is the pre-dominant MS presentation (85%) and is characterized by periods of acute decline in neurologic functioning followed by partial or complete recovery.7,8 The median age of onset for RRMS is 30 years.7 Between 10% and 15% of the MS population are affected by primary progressive MS (PPMS), which is associated with rapid disease progres-sion.8 The median age of onset for PPMS is 40 years.8 Clinically isolated syndrome (CIS) also is considered one of the MS
disease courses. A CIS is an initial event of demyelination that lasts 24 hours or more and is consistent with MS but is isolated in time and may or may not be isolated in space (i.e., symptoms present at a single site/lesion in one location vs. symptoms present at multiple sites/lesions in multi-ple locations).9 Individuals who experience CIS may or may not develop MS in the future.9 Based on the 2010 revisions to the McDonald criteria for MS, the diagnosis of MS can be made when CIS is accompanied by MRI findings (prior lesions) indicating that an earlier episode of damage occurred in a different location in the central ner-vous system.10 With advances in MRI tech-nology and improved diagnostic criteria, it is likely that MS will be diagnosed more quickly, and that fewer people will be diag-nosed with CIS.11 An accurate diagnosis is critical at this time because starting treat-ment with a disease-modifying therapy may delay or prevent a second neurologic episode and, therefore, the conversion of CIS to clinically definite MS.11
The active component of the U.S. Armed Forces comprises predominantly young adults, the major at-risk population for MS.12,13 The associated disability, cost of treatment/clinical management, and poten-tial impact on readiness and deployability make MS of particular relevance to the U.S. military population.4 In January 2011, the MSMR reported the numbers, incidence rates, trends, and correlates of MS diag-noses among active component U.S. ser-vice members during 2000–2009.14 Since that time, one other study has reported incidence rates among a U.S. military population: Gulf War–era veterans dur-ing 1990–2007.15 Although the Gulf War veteran study yielded incidence rates that were slightly higher than those reported in the 2011 MSMR article, the overall inci-dence patterns by sex, race/ethnicity, and

August 2017 Vol. 24 No. 8 MSMR Page 3
T A B L E 1 . ICD-9 and ICD-10 diagnostic codes used for multiple sclerosis case classificationa
service were similar.14,15 The current anal-ysis updates and expands on this earlier work by including reserve/guard compo-nent members as well as other beneficiaries of the Military Health System (MHS).
M E T H O D S
The surveillance period was 1 Janu-ary 2007 through 31 December 2016. The surveillance population included active and reserve component members of the U.S. Army, Navy, Air Force, and Marine Corps who served at any time during the surveillance period. The non-military sur-veillance population included other ben-eficiaries (i.e., retired service members, family members, and other dependents of service members and retirees, and other authorized government employees and their family members) of the MHS who accessed care through either a military medical facility/provider or a civilian facil-ity/provider (if paid for by the MHS). The data used in this analysis were obtained from the Defense Medical Surveillance Sys-tem (DMSS), which maintains electronic records of all actively serving U.S. military members’ and other beneficiaries’ hospital-izations and ambulatory visits in U.S. mil-itary and civilian (contracted/purchased care through the MHS) medical facilities worldwide.
For surveillance purposes, incident cases of MS were identified from records of hospitalizations and ambulatory vis-its that included diagnostic codes (ICD-9 and ICD-10) specific for MS (Table 1). An incident case of MS was defined as a ser-vice member or other beneficiary having
DMSS documentation of any one of the fol-lowing: 1) one hospitalization with a defin-ing diagnosis in any diagnostic position; or 2) two outpatient medical encounters at least 1 day apart with a defining diagnosis of MS in any diagnostic position; or 3) one hospitalization or one outpatient medical encounter with any of the defining diagno-ses of “other demyelinating disease of the central nervous system” in any diagnostic position, followed by one outpatient medi-cal encounter with a defining diagnosis of MS in any diagnostic position.
The incident date was considered the date of the first hospitalization or outpa-tient medical encounter that included a diagnosis of MS or a case-defining diag-nosis of “other demyelinating diseases of the central nervous system.” An individual could be considered a case once per life-time. Service members with case-defining MS diagnoses before the start of the surveil-lance period were excluded from the analy-sis because they were not considered at risk of incident (i.e., first ever) MS. Person-time incidence rates were calculated only for members of the active component (number of cases per 100,000 person-years [p-yrs] of service). Person-time for active compo-nent service members was censored when any of the following conditions was met: an individual was identified as an MS case; an individual left service or died; the surveil-lance period ended. Person-time incidence rates were not calculated for reserve/guard component members because start and end dates of active duty service periods (and corresponding TRICARE eligibility) were not available. Instead, incidence rates for reserve/guard members were calculated per 100,000 individuals who served at any time during the given calendar year. Average
rates during the overall surveillance period were calculated by taking the mean of the annual rates. Individuals not at risk during the given calendar year were removed. Sim-ilarly, rates were not computed for non–service member beneficiaries because their time periods of TRICARE eligibility were not available.
The time between the initial and case-defining medical encounter was calculated for each incident case. The total number of inpatient and outpatient encounters for MS were computed for the 2016 calendar year among all MS cases and among cases diag-nosed in 2016.
R E S U L T S
Active component
During 2007–2016, a total of 2,031 active component service members received incident diagnoses of MS, for an overall crude (unadjusted) incidence rate of 14.9 cases per 100,000 p-yrs (Table 2). The overall rate of MS among females (34.4 cases per 100,000 p-yrs) was three times that of males (11.5 cases per 100,00 p-yrs). The highest overall incidence rates were observed among service members diag-nosed after age 30 with rates peaking among those aged 40 years or older (26.4 cases per 100,000 p-yrs) (Table 2). The median age at case-defining MS diagnosis was 32 years (interquartile range [IQR]=26–38) (data not shown). There were no pronounced differ-ences in median age at diagnosis between race/ethnicity groups among incident MS cases in the active component (data not shown). The overall incidence rate was
Condition ICD-10 codes ICD-9 codes
Multiple sclerosis G35 340
Other demyelinating diseases of the central nervous system G36.*, G37.* 341.0, 341.1, 341.2*, 341.8, 341.9
aArmed Forces Health Surveillance Branch. Surveillance Case Definitions: Multiple sclerosis. https://www.health.mil/Military-Health-Topics/Health-Readiness/Armed-Forces-Health-Surveillance-Branch/Epidemiology-and-Analysis/Surveillance-Case-Definitions *Any digit/character, up to and including the last position

MSMR Vol. 24 No. 8 August 2017 Page 4
highest among non-Hispanic black service members (20.3 cases per 100,000 p-yrs) and lowest among Hispanic service mem-bers and those of other or unknown race/ethnicity (11.3 cases per 100,000 p-yrs and 11.2 cases per 100,000 p-yrs, respec-tively). Overall race/ethnicity-specific sex incidence ratios (female to male) ranged from 2.6:1 among non-Hispanic black ser-vice members to 3.8:1 among service mem-bers of other or unknown race/ethnicity. The overall incidence rate was higher in the Air Force than all other services (1.5 times that of the Navy and 2.2 times that of the Marine Corps) (Table 2). Among mili-tary occupational groups, service mem-bers in healthcare occupations had the highest overall incidence rate (23.4 cases per 100,000 p-yrs) and those in combat-specific occupations had the lowest overall rate (9.6 cases per 100,000 p-yrs). The over-all incidence rate of MS was 18.2% higher among officers compared to enlisted service members and 22.4% higher among service members who had ever been deployed to CENTCOM compared to those who had never been deployed (Table 2).
During the 10-year surveillance period, crude annual incidence rates of MS decreased by 25.4%. Annual rates of MS were higher among female service members than male service members throughout the 10-year period and decreased by 43.2% dur-ing this time (Figure 1). The annual rates of MS among male service members decreased by 16.6% from 2007 to 2016. These reduc-tions resulted in a decrease in the annual sex incidence ratios (female to male) dur-ing the surveillance period (3.7:1 in 2007 to 2.5:1 in 2016). The higher annual incidence rates among non-Hispanic black service members were consistent throughout the surveillance period and decreased by 40.8% during this time (Figure 2). Stratification of annual incidence rates by race/ethnicity and sex showed that rates among non-Hispanic black females were higher than rates among non-Hispanic white females in all but 4 years of the surveillance period (2010, 2011, 2013, and 2015) (Figure 3). Non-Hispanic black males showed a similar pattern with annual incidence rates that were higher than rates among their non-Hispanic white coun-terparts in 7 of the 10 years (2007 and 2009–2014). The decrease in sex incidence ratios
T A B L E 2 . Incident cases and incidence rates of multiple sclerosis, active component, U.S. Armed Forces, 2007–2016
Total 2007–2016No. % Ratea
Total 2,031 100.0 14.9SexMale 1,340 66.0 11.5Female 691 34.0 34.4
Age at diagnosis<20 72 3.5 4.320–24 306 15.1 8.525–29 468 23.0 14.430–34 405 19.9 19.335–39 399 19.6 25.240+ 381 18.8 26.4
Race/ethnicityNon-Hispanic white 1,230 60.6 14.8Non-Hispanic black 448 22.1 20.3Hispanic 192 9.5 11.3Other/unknown 161 7.9 11.2
Male, by race/ethnicityNon-Hispanic white 886 43.6 12.0Non-Hispanic black 243 12.0 14.5Hispanic 124 6.1 8.8Other/unknown 87 4.3 7.4
Female, by race/ethnicityNon-Hispanic white 344 16.9 36.9Non-Hispanic black 205 10.1 38.4Hispanic 68 3.3 24.1Other/unknown 74 3.6 28.2
ServiceArmy 765 37.7 14.6Navy 428 21.1 13.3Air Force 659 32.4 20.3Marine Corps 179 8.8 9.3
Military gradeEnlisted 1,636 80.6 14.4Officer 395 19.4 17.1
Military occupationCombat-specific 193 9.5 9.6Health care 276 13.6 23.4Other 1,562 76.9 14.9
Ever deployed to CENTCOMNo 955 47.0 13.4Yes 1,076 53.0 16.4
aRate per 100,000 person-years
was apparent among non-Hispanic white (4.4:1 in 2007 to 2.2:1 in 2016) and non-His-panic black service members (3.5:1 in 2007 to 2.6:1 in 2016). For the military services, annual rates were highest among Air Force members in all years of the surveillance
period and lowest among Marine Corps members in all years except 2014 (Figure 4). Throughout the surveillance period, rates among service members in healthcare occu-pations were consistently higher than those in the other occupational groups (data not

August 2017 Vol. 24 No. 8 MSMR Page 5
shown). During 2012–2016, the annual inci-dence rates of service members who had ever deployed to CENTCOM were higher than for those who had never been deployed (data not shown).
Among active component service members, the distribution of the time interval between initial presentation and case-defining MS-related encounter was unimodal with a median of 20 days (Fig-ure 5, data not shown). Approximately four-fifths (80.5%; n=1,635) of the incident MS cases received their case-defining diag-noses between 0 and 90 days after initial presentation. The vast majority (93.3%) of cases received their case-defining diag-noses within a year of initial presentation (Figure 5).
Close to two-thirds (66.0%) of the incident MS cases among active compo-nent service members met the case defini-tion criteria of having had an MS-related (ICD-9: 340; ICD-10: G35) hospitalization or two MS-related ambulatory visits during the surveillance period (data not shown). The remainder (34.0%) met the case definition criteria of having had an initial diagnosis of “other demyelinating disease of the central nervous system” (CIS) followed by a case-defining diagnosis (outpatient) of MS (data not shown).
Among active component service members in 2016, approximately one-third (33.9%; n=688) of all MS cases had at least one MS-related ambulatory encounter sub-sequent to their case-defining encounter. These cases contributed a total of 3,347 ambulatory encounters, representing about five outpatient visits per individual. In 2016, slightly less than 2% (n=38) of all cases had one or more MS-related hospitalizations. These cases contributed a total of 418 hospi-tal bed days, representing about 11 bed days per individual. Of the incident cases diag-nosed in 2016 (n=154), the vast majority (93.5%) had at least one MS-related ambu-latory encounter in the months after their case-defining diagnoses. On average, there were approximately seven MS-related out-patient visits per individual. Less than one-eighth (11.7%; n=18) of the cases diagnosed with MS in 2016 had one or more inpatient encounters during 2016. These cases con-tributed a total of 85 hospital bed days, rep-resenting about five bed days per individual.
Reserve/guard component
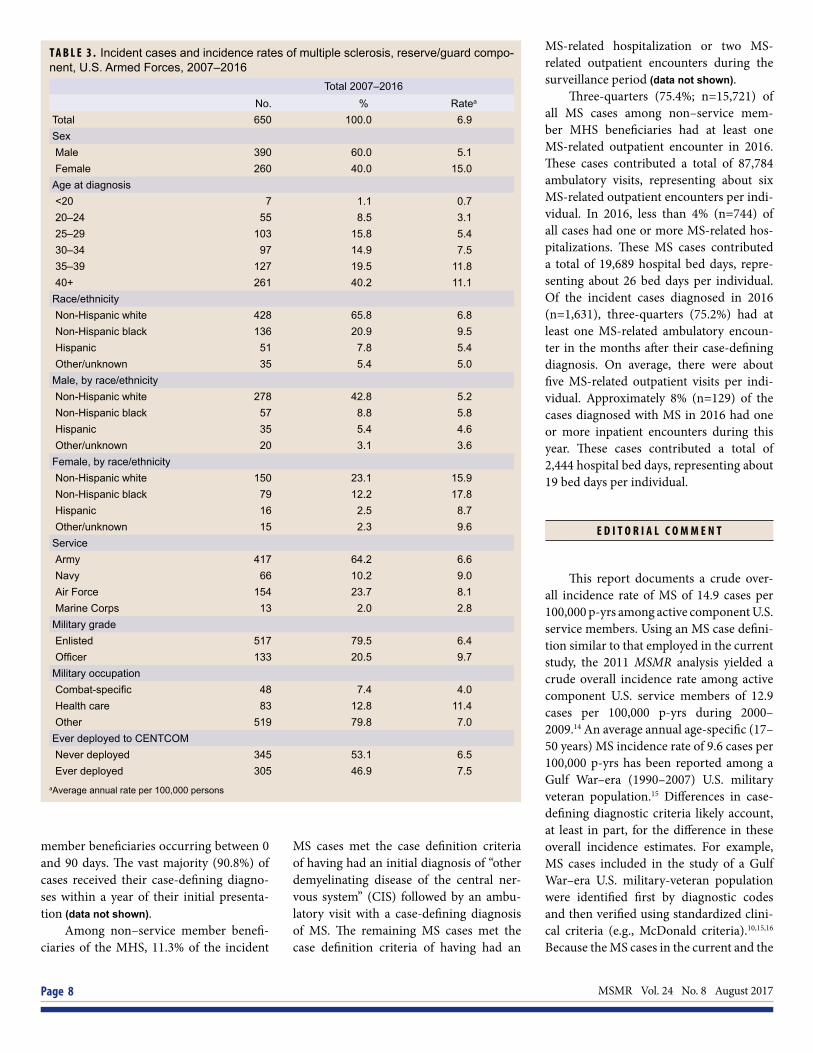
During the 10-year surveillance period, there were 650 incident diagnoses of MS among reserve/guard component ser-vice members, for an average overall crude
incidence rate of 6.9 cases per 100,000 per-sons (Table 3). The average overall rate of MS among females (15.0 cases per 100,000 per-sons) was approximately three times that of males (5.1 cases per 100,000 persons). The
F I G U R E 1 . Annual incidence rates of multiple sclerosis, total and by sex, active component, U.S. Armed Forces, 2007–2016
F I G U R E 2 . Annual incidence rates of multiple sclerosis, by race/ethnicity, active component, U.S. Armed Forces, 2007–2016
0.0
10.0
20.0
30.0
40.0
50.0
60.0
2007 2008 2009 2010 2011 2012 2013 2014 2015 2016
Inci
denc
e ra
te p
er 1
00,0
00 p
-yrs
Total
Female
Male
0.0
10.0
20.0
30.0
40.0
50.0
60.0
2007 2008 2009 2010 2011 2012 2013 2014 2015 2016
Inci
denc
e ra
te p
er 1
00,0
00 p
-yrs
Non-Hispanic blackNon-Hispanic whiteHispanicOther/unknown

MSMR Vol. 24 No. 8 August 2017 Page 6
highest average overall incidence rates were observed among reserve/guard component members diagnosed after age 35 with rates peaking among those aged 35–39 years (11.8 cases per 100,000 persons) (Table 3). The median age at case-defining MS
diagnosis was 37 years (IQR=29–44) (data not shown). There were no pronounced differences in median age at diagnosis between race/ethnicity groups among inci-dent MS cases in the reserve/guard compo-nent (data not shown). The average overall
incidence rate of MS was highest among non-Hispanic black reserve/guard compo-nent members (9.5 cases per 100,000 per-sons) and lowest among Hispanic reserve/guard component members and those of other or unknown race/ethnicity (5.4 and 5.0 cases per 100,000 persons, respectively) (Table 3). The average overall rate was higher among Navy and Air Force members (9.0 and 8.1 cases per 100,000 persons, respec-tively) than Army and Marine Corps mem-bers (6.6 and 2.8 cases per 100,000 persons, respectively). Reserve/guard members in healthcare occupations had the highest average overall incidence rate of MS (11.4 cases per 100,000 persons) and those in combat-specific occupations had the low-est overall rate (4.0 cases per 100,000 per-sons). The overall average incidence rate of MS was 51.2% higher among officers, com-pared to enlisted service members (Table 3).
Among reserve/guard component members, the crude annual incidence rates of MS remained relatively stable throughout the surveillance period (Figure 6). Annual rates of MS were consistently higher among females than males during the 10-year period. The annual incidence rates among females fluctuated between 12.0 (2014) and 18.4 cases per 100,000 persons (2013), while rates among males decreased by 24.5% during the period (Figure 6). The annual sex incidence ratios ranged from 2.4:1 in 2014 to 4.1:1 in 2016. Small group sizes precluded stratification by race/ethnicity and other demographic and military characteristics.
The distribution of the time interval between initial presentation and case-defin-ing MS-related encounter among reserve/guard component members was similar in shape to that observed among active com-ponent members (data not shown). The median interval was 15 days with four-fifths (80.0%; n=520) of the MS cases among ser-vice members in the reserve/guard com-ponent occurring between 0 and 90 days after initial presentation. The vast majority (93.1%) of cases received their case-defin-ing diagnoses within a year of initial pre-sentation (data not shown).
Among reserve/guard component members, slightly less than one-quarter (23.5%) of the incident MS cases met the case definition criteria of having had an
F I G U R E 3 . Annual incidence rates of multiple sclerosis, by race/ethnicity (non-Hispanic black and non-Hispanic white) and sex, active component, U.S. Armed Forces, 2007–2016
F I G U R E 4 . Annual incidence rates of multiple sclerosis, by service, active component, U.S. Armed Forces, 2007–2016
0.0
10.0
20.0
30.0
40.0
50.0
60.0
2007 2008 2009 2010 2011 2012 2013 2014 2015 2016
Inci
denc
e ra
te p
er 1
00,0
00 p
-yrs
Non-Hispanic black female Non-Hispanic white femaleNon-Hispanic black male Non-Hispanic white male
0.0
10.0
20.0
30.0
40.0
50.0
60.0
2007 2008 2009 2010 2011 2012 2013 2014 2015 2016
Inci
denc
e ra
te p
er 1
00,0
00 p
-yrs
Air ForceArmyNavyMarine Corps

August 2017 Vol. 24 No. 8 MSMR Page 7
initial diagnosis of “other demyelinating dis-ease of the central nervous system” (CIS) followed by an ambulatory visit with a case-defining diagnosis of MS. The remaining
MS cases met the case definition criteria of having had an MS-related hospitalization or two MS-related outpatient encounters dur-ing the surveillance period (data not shown).
About one-third (32.9%; n=214) of all MS cases among reserve/guard com-ponent members had at least one MS-related outpatient encounter in 2016. These cases contributed a total of 929 outpatient encounters, representing about four ambu-latory visits per individual. In 2016, slightly less than 2% (n=10) of all cases had one or more MS-related hospitalizations dur-ing the surveillance period. These MS cases contributed a total of 111 hospital bed days, representing about 11 bed days per individual. Of the incident cases diag-nosed in 2016 (n=56), the vast majority (83.9%) had at least one MS-related ambu-latory encounter in the months after their case-defining diagnoses. On average, there were about five MS-related ambulatory vis-its per individual. About 10% (n=6) of the cases diagnosed with MS in 2016 had one or more inpatient encounters during 2016. These cases contributed a total of 65 hos-pital bed days, representing about 11 bed days per individual (data not shown).
Other beneficiaries of the MHS
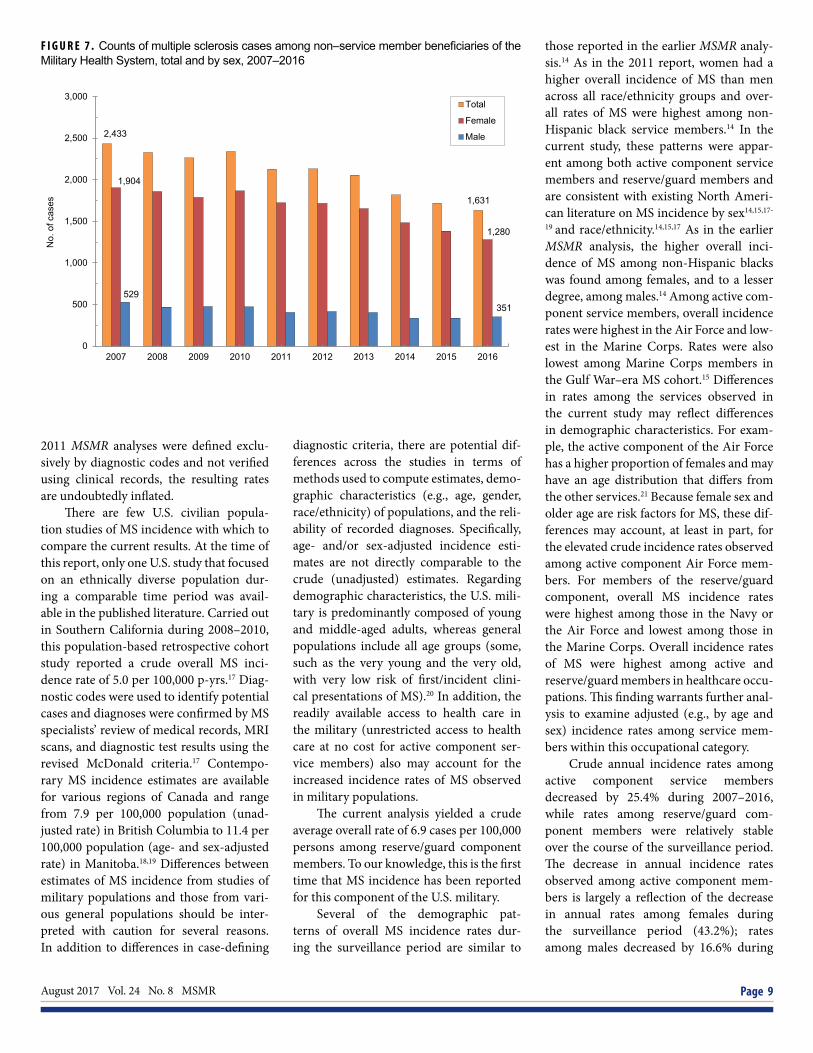
During 2007–2016, there were 20,849 incident diagnoses of MS among non– service member beneficiaries of the MHS. The majority of incident MS diagnoses were among females (79.9%) and those aged 40 years or older (67.9%). Limited availability of information on race/ethnic-ity for this population precluded stratifi-cation by this demographic characteristic. The median age at MS case-defining diag-nosis was 48 years (IQR=35–60) (data not shown). Between 2007 and 2016, annual numbers of incident cases of MS decreased among non–service member MHS benefi-ciaries (Figure 7). The annual numbers of female MS cases were consistently higher than the annual numbers of male cases throughout this period.
Among non–service member benefi-ciaries, the distribution of the time inter-vals between initial presentation and case-defining MS-related encounter was similar to those observed for incident MS cases among active component and reserve/guard component service members (data not shown). The median interval was 19 days with three-quarters (75.6%; n=15,764) of the MS cases among non–service
F I G U R E 5 . Time interval between initial diagnosis and case-defining diagnosis among multiple sclerosis cases, active component, U.S. Armed Forces, 2007–2016
17.5
42.3
20.7
7.2 5.6 6.7
0.0
10.0
20.0
30.0
40.0
50.0
0 1–30 31–90 91–180 181–364 365+
Per
cent
age
of c
ases
Time interval (days)
F I G U R E 6 . Annual incidence rates of multiple sclerosis, total and by sex, reserve/guard compo-nent, U.S. Armed Forces, 2007–2016
0.0
10.0
20.0
30.0
40.0
2007 2008 2009 2010 2011 2012 2013 2014 2015 2016
Inci
denc
e ra
te p
er 1
00,0
00 p
erso
ns
TotalFemaleMale
MSMR Vol. 24 No. 8 August 2017 Page 8
member beneficiaries occurring between 0 and 90 days. The vast majority (90.8%) of cases received their case-defining diagno-ses within a year of their initial presenta-tion (data not shown).
Among non–service member benefi-ciaries of the MHS, 11.3% of the incident
MS cases met the case definition criteria of having had an initial diagnosis of “other demyelinating disease of the central ner-vous system” (CIS) followed by an ambu-latory visit with a case-defining diagnosis of MS. The remaining MS cases met the case definition criteria of having had an
MS-related hospitalization or two MS-related outpatient encounters during the surveillance period (data not shown).
Three-quarters (75.4%; n=15,721) of all MS cases among non–service mem-ber MHS beneficiaries had at least one MS-related outpatient encounter in 2016. These cases contributed a total of 87,784 ambulatory visits, representing about six MS-related outpatient encounters per indi-vidual. In 2016, less than 4% (n=744) of all cases had one or more MS-related hos-pitalizations. These MS cases contributed a total of 19,689 hospital bed days, repre-senting about 26 bed days per individual. Of the incident cases diagnosed in 2016 (n=1,631), three-quarters (75.2%) had at least one MS-related ambulatory encoun-ter in the months after their case-defining diagnosis. On average, there were about five MS-related outpatient visits per indi-vidual. Approximately 8% (n=129) of the cases diagnosed with MS in 2016 had one or more inpatient encounters during this year. These cases contributed a total of 2,444 hospital bed days, representing about 19 bed days per individual.
E D I T O R I A L C O M M E N T
This report documents a crude over-all incidence rate of MS of 14.9 cases per 100,000 p-yrs among active component U.S. service members. Using an MS case defini-tion similar to that employed in the current study, the 2011 MSMR analysis yielded a crude overall incidence rate among active component U.S. service members of 12.9 cases per 100,000 p-yrs during 2000–2009.14 An average annual age-specific (17–50 years) MS incidence rate of 9.6 cases per 100,000 p-yrs has been reported among a Gulf War–era (1990–2007) U.S. military veteran population.15 Differences in case-defining diagnostic criteria likely account, at least in part, for the difference in these overall incidence estimates. For example, MS cases included in the study of a Gulf War–era U.S. military-veteran population were identified first by diagnostic codes and then verified using standardized clini-cal criteria (e.g., McDonald criteria).10,15,16 Because the MS cases in the current and the
T A B L E 3 . Incident cases and incidence rates of multiple sclerosis, reserve/guard compo-nent, U.S. Armed Forces, 2007–2016
Total 2007–2016No. % Ratea
Total 650 100.0 6.9SexMale 390 60.0 5.1Female 260 40.0 15.0
Age at diagnosis<20 7 1.1 0.720–24 55 8.5 3.125–29 103 15.8 5.430–34 97 14.9 7.535–39 127 19.5 11.840+ 261 40.2 11.1
Race/ethnicityNon-Hispanic white 428 65.8 6.8Non-Hispanic black 136 20.9 9.5Hispanic 51 7.8 5.4Other/unknown 35 5.4 5.0
Male, by race/ethnicityNon-Hispanic white 278 42.8 5.2Non-Hispanic black 57 8.8 5.8Hispanic 35 5.4 4.6Other/unknown 20 3.1 3.6
Female, by race/ethnicityNon-Hispanic white 150 23.1 15.9Non-Hispanic black 79 12.2 17.8Hispanic 16 2.5 8.7Other/unknown 15 2.3 9.6
ServiceArmy 417 64.2 6.6Navy 66 10.2 9.0Air Force 154 23.7 8.1Marine Corps 13 2.0 2.8
Military gradeEnlisted 517 79.5 6.4Officer 133 20.5 9.7
Military occupationCombat-specific 48 7.4 4.0Health care 83 12.8 11.4Other 519 79.8 7.0
Ever deployed to CENTCOM Never deployed 345 53.1 6.5 Ever deployed 305 46.9 7.5aAverage annual rate per 100,000 persons
August 2017 Vol. 24 No. 8 MSMR Page 9
2011 MSMR analyses were defined exclu-sively by diagnostic codes and not verified using clinical records, the resulting rates are undoubtedly inflated.
There are few U.S. civilian popula-tion studies of MS incidence with which to compare the current results. At the time of this report, only one U.S. study that focused on an ethnically diverse population dur-ing a comparable time period was avail-able in the published literature. Carried out in Southern California during 2008–2010, this population-based retrospective cohort study reported a crude overall MS inci-dence rate of 5.0 per 100,000 p-yrs.17 Diag-nostic codes were used to identify potential cases and diagnoses were confirmed by MS specialists’ review of medical records, MRI scans, and diagnostic test results using the revised McDonald criteria.17 Contempo-rary MS incidence estimates are available for various regions of Canada and range from 7.9 per 100,000 population (unad-justed rate) in British Columbia to 11.4 per 100,000 population (age- and sex-adjusted rate) in Manitoba.18,19 Differences between estimates of MS incidence from studies of military populations and those from vari-ous general populations should be inter-preted with caution for several reasons. In addition to differences in case-defining
diagnostic criteria, there are potential dif-ferences across the studies in terms of methods used to compute estimates, demo-graphic characteristics (e.g., age, gender, race/ethnicity) of populations, and the reli-ability of recorded diagnoses. Specifically, age- and/or sex-adjusted incidence esti-mates are not directly comparable to the crude (unadjusted) estimates. Regarding demographic characteristics, the U.S. mili-tary is predominantly composed of young and middle-aged adults, whereas general populations include all age groups (some, such as the very young and the very old, with very low risk of first/incident clini-cal presentations of MS).20 In addition, the readily available access to health care in the military (unrestricted access to health care at no cost for active component ser-vice members) also may account for the increased incidence rates of MS observed in military populations.
The current analysis yielded a crude average overall rate of 6.9 cases per 100,000 persons among reserve/guard component members. To our knowledge, this is the first time that MS incidence has been reported for this component of the U.S. military.
Several of the demographic pat-terns of overall MS incidence rates dur-ing the surveillance period are similar to
those reported in the earlier MSMR analy-sis.14 As in the 2011 report, women had a higher overall incidence of MS than men across all race/ethnicity groups and over-all rates of MS were highest among non-Hispanic black service members.14 In the current study, these patterns were appar-ent among both active component service members and reserve/guard members and are consistent with existing North Ameri-can literature on MS incidence by sex14,15,17-
19 and race/ethnicity.14,15,17 As in the earlier MSMR analysis, the higher overall inci-dence of MS among non-Hispanic blacks was found among females, and to a lesser degree, among males.14 Among active com-ponent service members, overall incidence rates were highest in the Air Force and low-est in the Marine Corps. Rates were also lowest among Marine Corps members in the Gulf War–era MS cohort.15 Differences in rates among the services observed in the current study may reflect differences in demographic characteristics. For exam-ple, the active component of the Air Force has a higher proportion of females and may have an age distribution that differs from the other services.21 Because female sex and older age are risk factors for MS, these dif-ferences may account, at least in part, for the elevated crude incidence rates observed among active component Air Force mem-bers. For members of the reserve/guard component, overall MS incidence rates were highest among those in the Navy or the Air Force and lowest among those in the Marine Corps. Overall incidence rates of MS were highest among active and reserve/guard members in healthcare occu-pations. This finding warrants further anal-ysis to examine adjusted (e.g., by age and sex) incidence rates among service mem-bers within this occupational category.
Crude annual incidence rates among active component service members decreased by 25.4% during 2007–2016, while rates among reserve/guard com-ponent members were relatively stable over the course of the surveillance period. The decrease in annual incidence rates observed among active component mem-bers is largely a reflection of the decrease in annual rates among females during the surveillance period (43.2%); rates among males decreased by 16.6% during
F I G U R E 7 . Counts of multiple sclerosis cases among non–service member beneficiaries of the Military Health System, total and by sex, 2007–2016
2,433
1,631
1,904
1,280
529 351
0
500
1,000
1,500
2,000
2,500
3,000
2007 2008 2009 2010 2011 2012 2013 2014 2015 2016
No.
of c
ases
Total
Female
Male
MSMR Vol. 24 No. 8 August 2017 Page 10
the period. These reductions resulted in a decrease in the annual sex incidence ratios (female to male) during the 10-year period. Reductions in annual sex incidence ratios also have been observed in two recent Canadian studies.18,19 In a recent study using a primary care database representa-tive of the UK population, Mackenzie et al. reported a consistent downward trend in MS incidence rates among both sexes.22 One possible explanation for the down-ward trend in MS incidence is a reduction in false-positive diagnoses through the use of improved diagnostic techniques and cri-teria. However, this potential explanation does not account for the difference in the rate of change in incidence by sex observed in the current study.
Among non–service member MHS beneficiaries, annual numbers of incident cases of MS decreased during the sur-veillance period; the annual numbers of female MS cases were consistently higher than those of male cases. It is important to note that the sex distribution of this pop-ulation of non–service member beneficia-ries is much more balanced (closer to 50% female) than the two service member pop-ulations in this analysis.23 Given this differ-ence in the sex distribution and the higher prevalence and incidence of MS among women in general, the markedly higher numbers of female MS cases observed among non–service member beneficiaries is not unexpected.
The median age at MS case-defining diagnosis was 32 years among members of the active component, 37 years among reserve/guard members, and 48 years among non–service member beneficiaries. This statistic was not presented in 2011 MSMR article but a mean age at diagnosis of 33.3 years (SD=7.9 years) was reported among service members with active duty during the Gulf War era.15 There were no pronounced differences in median age at diagnosis between race/ethnicity groups among incident MS cases in the active component or the reserve/guard compo-nent. However, the median age at diagnosis among reserve/guard component members with MS was 5 years higher than that for active component members with MS. The median age at MS case-defining diagnosis among non–service member beneficiaries
is most comparable with the median age of 42 years reported from a population-based cohort in Southern California.17
The median time intervals between initial presentation and case-defining MS-related encounter ranged from 15 days among reserve/guard component members to 20 days among active component ser-vice members. There were no pronounced differences between the three study popu-lations in terms of the proportion of the incident MS cases who received their case-defining diagnoses between 0 and 90 days after initial presentation (range=76% to 81%). The 2011 MSMR analysis reported that a little over half (54%) of the MS cases had an interval of between 0 and 90 days.14 This proportion is markedly lower than those observed in the current study. This difference likely reflects, at least in part, the effects of improved diagnostic tech-niques and criteria introduced over the past decade.
The proportion of MS cases with an initial diagnosis of CIS (“other demyelin-ating disease of the central nervous sys-tem”) varied by group. Slightly more than one-third (34.0%) of the MS cases among active component members had an initial diagnosis of CIS, compared to 23.5% of cases among reserve/guard members and 11.3% cases among non–service member beneficiaries. Some CIS-related encoun-ters among MS cases in the reserve/guard component may have occurred in the civil-ian healthcare system. Records for such encounters would not have been available for analysis, which may, in part, account for the lower proportion of reserve/guard MS cases with an initial CIS diagnosis com-pared to MS cases in the active component.
The results of this study should be interpreted with consideration of sev-eral important limitations. As previously mentioned, because the cases of MS were defined exclusively by diagnostic codes and not verified by professional clinical review, the numbers of cases of MS presented here are likely inflated. Wallin et al. found that only about half of patients with ICD-9 codes for MS within the medical record system of academically affiliated Veter-ans Affairs Medical Centers actually had a correct MS diagnosis after rigorous clini-cal review using the McDonald criteria.15,16
Conversely, other factors could have led to MS incidence being underestimated. For instance, cases could have been missed if service members sought care from sources other than the MHS or purchased care pro-viders, or if affected individuals terminated their military service after a single out-patient encounter with an MS diagnosis. In addition, incidence rates could not be computed for non–service member benefi-ciaries because their time periods of TRI-CARE eligibility were not available. Finally, because the summary of MS-related in-patient and outpatient encounters were computed for the 2016 calendar year, most MS cases diagnosed in 2016 did not have full 12-month follow-up periods.
Also, there are limitations to the gen-eralizability of the findings because of the characteristics of the surveillance popula-tions. For example, active component ser-vice members have unrestricted access to health care at no cost as well as open access to specialists; as such, this may limit the validity of comparisons to civilian popu-lations, for whom limited access to, and inability to pay for, care may restrict hos-pitalization and use of outpatient services. Thus, generalizations of the observed results should be limited to similar groups during a similar time period.
As one of the few published U.S. stud-ies of MS incidence among a demographi-cally diverse population, this study makes a useful contribution to the literature on tem-poral changes in the incidence of MS by sex and race/ethnicity. Observed differences in incidence rates of MS by occupational cat-egory and service warrant further analysis to examine adjusted (e.g., by age, sex, race/ethnicity) incidence rates among service members within these categories. Findings also suggest a need for sensitivity analy-ses to assess the robustness of the apparent decrease in MS incidence observed in this study, particularly among females. Results indicating that non-Hispanic blacks have higher incidence of MS than non-Hispanic whites are consistent with recent literature and highlight the importance of studying a racially and ethnically diverse population as findings may lead to important insights into the etiology and prognosis of MS.14,15,17,24
MS has the potential to impose a significant operational and healthcare
August 2017 Vol. 24 No. 8 MSMR Page 11
burden on the military. Compared with direct all-cause medical costs for other chronic conditions reported in the litera-ture, MS ranked second behind conges-tive heart failure.4 Estimated costs of MS increase when comorbidities are taken into account. Comorbidities are com-mon among individuals with chronic diseases, including MS.24 Relative to the general population, people with MS have an increased risk of comorbidities such as cardiovascular disease (e.g., hypertension, stroke), psychiatric disorders (e.g., depres-sion, anxiety), and autoimmune condi-tions (e.g., thyroiditis, systemic lupus).26-30 Recent research indicates that comorbid-ity is associated with diagnostic delays, disability progression, and progression of lesion burden (as evidenced by mag-netic resonance imaging).30-35 Such find-ings highlight the importance of enhanced medical surveillance of the MS population to allow for targeted earlier interventions that may improve quality of life and reduce the impact of comorbidities on the func-tional status of those with MS.
R E F E R E N C E S
1. Milo R, Kahana E. Multiple sclerosis: geoepi-demiology, genetics and the environment. Autoim-mun Rev. 2010;9(5):A387–A394. 2. Evans C, Beland SG, Kulaga S, et al. Inci-dence and prevalence of multiple sclerosis in the Americas: a systematic review. Neuroepidemiol-ogy. 2013;40(3):195–210.3. Richards RG, Sampson FC, Beard SM, Tap-penden P. A review of the natural history and epi-demiology of multiple sclerosis: implications for resource allocation and health economic models. Health Technol Assess Reports. 2002;6(10):1–73.4. Adelman G, Rane SG, Villa KF. The cost bur-den of multiple sclerosis in the United States: a systematic review of the literature. J Med Econ. 2013;16(5):639–637.5. Owens GM. Economic burden of multiple scle-rosis and the role of managed care organizations in multiple sclerosis management. Am J Manag Care. 2016;22(6 Suppl):S151–S158.6. Lublin FD, Reingold SC, Cohen JA, et al. De-fining the clinical course of multiple sclerosis: the 2013 revisions. Neurology. 2014;15;83(3):278–286.7. McKay KA, Kwan V, Duggan T, Tremlett H.
Risk factors associated with the onset of relaps-ing-remitting and primary progressive multiple sclerosis: a systematic review. Biomed Res Int. 2015;2015:817238. 8. Koch M, Kingwell E, Rieckmann P, Tremlett H. The natural history of primary progressive multiple sclerosis. Neurology. 2009;73(23):1996–2002.9. National Multiple Sclerosis Society. Clinically isolated syndrome (CIS). http://www.nationalms-society.org/What-is-MS/Types-of-MS/Clinically- Isolated-Syndrome-(CIS). Accessed on 14 August 2017.10. Polman CH, Reingold SC, Banwell B, et al. Diagnostic criteria for multiple sclerosis: 2010 revisions to the McDonald criteria. Ann Neurol. 2011;69(2):292–302.11. Marcus JF, Waubant EL. Updates on clinically isolated syndrome and diagnostic criteria for mul-tiple sclerosis. Neurohospitalist. 2013;3(2):65–80.12. Department of Defense, Office of the Deputy Assistant Secretary of Defense for Military Com-munity and Family Policy (ODASD (MC&FP)). 2016. 2015 Demographics: Profile of the Military Community. Washington, DC. 13. Ramagopalan SV, Sadovnick AD. Epide-miology of multiple sclerosis. Neurol Clin. 2011; 29(2):207–217.14. Deussing EC, Armed Forces Health Surveil-lance Center. Multiple sclerosis, active component, U.S. Armed Forces, 2000–2009. MSMR. 2011; 18(1):12–15.15. Wallin MT, Culpepper WJ, Coffman P, et al. The Gulf War era multiple sclerosis cohort: age and incidence rates by race, sex and service. Brain. 2012;135(Pt 6):1778–1785.16. Culpepper WJ 2nd, Ehrmantraut M, Wallin MT, Flannery K, Bradham DD. Veterans Health Admin-istration multiple sclerosis surveillance registry: the problem of case-finding from administrative data-bases. J Rehabil Res Dev. 2006;43(1):17–24.17. Langer-Gould A, Brara SM, Beaber BE, Zhang JL. Incidence of multiple sclerosis in multiple racial and ethnic groups. Neurology. 2013;80(19):1734–1739.18. Kingwell E, Zhu F, Marrie RA, et al. High in-cidence and increasing prevalence of multiple sclerosis in British Columbia, Canada: findings from over two decades (1991–2010). J Neurol. 2015;262(10):2352–2363.19. Marrie RA, Yu N, Blanchard J, Leung S, Elliott L. The rising prevalence and changing age distri-bution of multiple sclerosis in Manitoba. Neurol-ogy. 2010;74(6):465–471.20. O'Donnell FL, Stahlman S, Taubman SB. Brief report: Selected demographic and service charac-teristics of the U.S. Armed Forces, active and re-serve components, 2001, 2009, and 2016. MSMR. 2017;24(1):19–23.21. Department of Defense, Office of the Deputy Assistant Secretary of Defense for Military Com-munity and Family Policy (ODASD (MC&FP)). (2016). 2015 Demographics: Profile of the Military Community. Washington, DC.22. Mackenzie IS, Morant SV, Bloomfield GA, MacDonald TM, O'Riordan J. Incidence and prev-alence of multiple sclerosis in the UK 1990–2010:
a descriptive study in the General Practice Re-search Database. J Neurol Neurosurg Psychiatry. 2014;85(1):76–84.23. Defense Health Agency, Decision Support Divi-sion, Office of the Assistant Secretary of Defense (OASD[HA]). Evaluation of the TRICARE Program: Fiscal Year 2017 Report to Congress. http://www.health.mil/Military-Health-Topics/Access-Cost-Qual-ity-and-Safety/Health-Care-Program-Evaluation/Annual-Evaluation-of-the-TRICARE-Program.24. Khan O, Williams MJ, Amezcua L, Javed A, Larsen KE, Smrtka JM. Multiple sclerosis in U.S. minority populations. Neurol Clin Pract. 2015;5(2):132–142.25. Simpson RJ, McLean G, Guthrie B, Mair F, Mer-cer SW. Physical and mental health comorbidity is common in people with multiple sclerosis: nationally representative cross-sectional population database analysis. BMC Neurol. 2014;14:128.26. Sloka JS, Phillips PW, Stefanelli M, et al. Co-occurrence of autoimmune thyroid disease in a mul-tiple sclerosis cohort. J Autoimmune Dis. 2005;2:9.27. Christiansen CF, Christensen S, Farkas DK, Miret M, Sorensen HT, Pedersen L. Risk of arterial cardiovascular diseases in patients with multiple sclerosis: a population-based cohort study. Neuro-epidemiology. 2010;35(4):267–274.28. Jadidi E, Mohammadi M, Moradi T. High risk of cardiovascular diseases after diagnosis of multiple sclerosis. Mult.Scler. 2013;19(10):1336–1340.29. Capkun G, Dahlke F, Lahoz R, et al. Mortality and comorbidities in patients with multiple sclerosis compared with a population without multiple scle-rosis: an observational study using the US Depart-ment of Defense administrative claims database. Mult Scler Relat Disord. 2015;4(6):546–554.30. Turpin KV, Carroll LJ, Cassidy JD, Hader WJ. Deterioration in the health-related quality of life of persons with multiple sclerosis: the possible warn-ing signs. Mult Scler. 2007;13(8):1038–1045.31. Marrie RA, Horwitz RI, Cutter G, Tyry T, Cam-pagnolo D, Vollmer T. Comorbidity delays diagnosis and increases disability at diagnosis in MS. Neurol-ogy. 2009;72(2):117–124.32. Warren SA, Turpin KV, Pohar SL, Jones CA, Warren KG. Comorbidity and health-related qual-ity of life in people with multiple sclerosis. Int J MS Care. 2009;11(1):6–16.33. Marrie RA, Rudick R, Horwitz R, et al. Vascu-lar comorbidity is associated with more rapid dis-ability progression in multiple sclerosis. Neurology. 2010;74(13):1041–1047.34. Weinstock-Guttman B, Zivadinov R, Horakova D, et al. Lipid profiles are associated with lesion for-mation over 24 months in interferon-β treated pa-tients following the first demyelinating event. J Neu-rol Neurosurg Psychiatry. 2013;84(11):1186–1191.35. Marrie RA, Cohen J, Stuve O, et al. A system-atic review of the incidence and prevalence of co-morbidity in multiple sclerosis: overview. Mult Scler J. 2015;21(3):263–281.

MSMR Vol. 24 No. 8 August 2017 Page 12
Between 1 January 2010 and 31 December 2016, a total of 14 U.S. and inter-national military personnel in training at Joint Base San Antonio–Lackland, TX, were hospitalized due to suspected pulmonary tuberculosis (TB); of these, five personnel were diagnosed with active TB disease. Only one TB case had pulmonary symptoms, but these symptoms were not suggestive of TB. The incidence rate in the training population was 1.89 per 100,000 popu-lation (95% CI: 0.81, 4.42), with a higher rate when restricted to international military students attending the Defense Language Institute English Language Center. No instances of TB transmission were identified. The variety of atypi-cal presentations and their resulting diagnostic and public health challenges prompted this retrospective review of all hospitalized cases. This case series highlights both the importance of a high index of clinical suspicion when TB is being considered in close congregate settings as well as the risk of overre-liance on acid-fast bacilli staining and nucleic acid amplification testing for ruling out active pulmonary disease in young, otherwise healthy trainees. Practical solutions are suggested.
Challenges with Diagnosing and Investigating Suspected Active Tuberculosis Disease in Military TraineesDavid Chang, MD (CPT, USA); Bryant J. Webber, MD, MPH (Maj, USAF); Steven M. Hetrick MD, MPH; Jerry B. Owen, DO, MPH; Audra A. Blasi, DVM (Capt, USAF); Bernadette M. Steele, DVM, MPH (Lt Col, USAF); Heather C. Yun, MD (Lt Col, USAF)
The incidence rates of active tuber-culosis (TB) disease in the gen-eral U.S. population1 and the U.S.
military2 have declined over the past two decades, with foreign birth remaining one of the strongest correlates of risk. The dis-parity between foreign-born and U.S.-born persons, and its implications for prevention and elimination, are particu-larly important at Joint Base San Antonio (JBSA)–Lackland, TX. As one of the larg-est military installations in the U.S., JBSA-Lackland hosts three training platforms with trainees who include large numbers of foreign-born students: 1) the Defense Language Institute English Language Cen-ter (DLIELC), which conducts English language training for international mili-tary and civilian personnel from more than 110 countries; 2) the Inter-American
Air Forces Academy (IAAFA), which pro-vides military and technical education to Air Force members representing more than 20 Latin American and Caribbean countries; and 3) Basic Military Training (BMT), which provides the initial entry training for all enlisted members of the U.S. Air Force, among whom 1%–2% are born overseas.
Current TB testing programs vary by training platform. International mil-itary students are required to have a screening chest x-ray as part of their medical examination before arrival to evaluate for active disease. If abnormali-ties are found on arrival, further evalu-ation is performed by sputum smear tests and culture. IAAFA-projected avia-tors are also screened for active TB with a chest x-ray during their flight physical,
conducted at variable times during train-ing. New U.S. Air Force recruits are uni-versally tested during BMT in-processing week for latent TB. U.S.-born recruits who report no history of a positive tuberculin skin test (TST) are screened with a single TST; all others are screened with an inter-feron gamma release assay (IGRA)—pre-viously either the QuantiFERON®-TB or QuantiFERON®-TB Gold, and currently, as of January 2017, the T-SPOT® TB.
Regardless of birthplace, persons with pulmonary TB may present with a variety of clinical features. Atypical and asymp-tomatic presentations can pose diagnostic challenges, resulting in potentially serious treatment delays,3,4 belated contact inves-tigations, and increased transmission risk. Because of close-quarter living arrange-ments5 and a degree of stress-induced immunosuppression,6 the TB transmission risk may be greater in military training environments. Recently, there have been several atypical and asymptomatic presen-tations of active TB, as well as suspected cases that were eventually found not to have TB, among the population of trainees at JBSA-Lackland. This report summarizes the retrospective case series to review the challenges and lessons learned from these atypical presentations.
M E T H O D S
All trainees at JBSA-Lackland who are suspected to have active TB dis-ease, whether identified through screen-ing or clinical symptoms, are admitted to the San Antonio Military Medical Center for evaluation. Admission is based on a reviewing physician’s clinical suspicion; in review, this is typically based on risk fac-tors such as positive TST or IGRA and

August 2017 Vol. 24 No. 8 MSMR Page 13
abnormal radiographic imaging. By using the trainee health hospitalization regis-try and cross-referencing against consult records of the San Antonio Military Med-ical Center Infectious Disease Service, a case list was generated for all JBSA-Lack-land trainees hospitalized for TB diagnostic evaluation between 1 January 2010 and 31 December 2016.
For each case, a chart review was con-ducted to collect the following information: age, sex, country of birth, and state of birth, if U.S.-born; history of Bacillus Calmette–Guérin (BCG) vaccination; type and dura-tion of symptoms, if any; results of TST, IGRA, chest x-ray, and chest computed tomography (CT); results of testing of spu-tum or other body fluid by acid-fast bacilli (AFB) staining, culture, and GeneXpert, an automated nucleic acid amplification
test used to detect Mycobacterium tuber-culosis DNA; and final diagnosis. For those with culture-positive TB, the results of drug resistance testing for first-line anti-TB drugs were obtained through either the electronic health record or regional health department. For foreign-born train-ees without any BCG documentation in the record, receipt of the vaccination was presumed on the basis of country-specific standard policy, as outlined in the BCG World Atlas (www.bcgatlas.org). For the cases of confirmed pulmonary TB, the public health contact investigations were reviewed.
To allow for better comparison to other populations in the literature, TB inci-dence rates were calculated per 100,000 population with 95% CI for all trainees and for each training platform.
R E S U L T S
A total of 14 trainees were hospitalized for TB evaluation during the 7-year study period. One case of active pulmonary TB in a DLIELC student was previously reported7
and was included as trainee E. This case was included in the incidence rate calculation. All were male, aged 19–29 years. Half (four of eight) of the BMT trainees and all (six of six) of the DLIELC trainees were born overseas. A slight majority (eight of 14) were asymptomatic at the time of hospital admission, and TST and IGRA results were highly variable (Table 1). All trainees had abnormalities on their chest x-ray, chest CT, or both with predominantly upper lobe involvement and a minority demonstrating cavitation (Table 2).
T A B L E 1 . Descriptions and diagnoses of trainees hospitalized for suspected active tuberculosis, Joint Base San Antonio–Lackland, TX, 2010–2016 (N=14)
Trainee Year Age Status Birthplace BCG TST IGRA Symptoms Diagnosis
A 2012 21 BMT U.S. (Texas) No 29 mm Positive (>10 IU/mL)b Cough, congestion x2 days Pulmonary TB
B 2012 27 BMT Ghana Yes N/A Positive (>10 IU/mL)b None Culture-negative TB
C 2015 19 DLI Saudi Arabia Yes 15 mm Positive (7.26)b None Pulmonary TB
D 2016 23 DLI Cameroon Presumeda Reactive Not available Testicular pain x5 months Pulmonary and genitouri-nary TB
Ee 2010 28 DLI Afghanistan Presumeda N/A Positive (quantitative not reported)b None Pulmonary TB
F 2010 28 BMT Peru Presumeda 18 mm Not available Fever, chills, cough x2 weeks Latent TB infection
G 2010 19 BMT U.S. (Arizona) No 0 mm Negative (quantitative not reported)b
Pleuritic chest pain x1 week Nocardiosis
H 2010 20 BMT Philippines Yes 24 mm Positive (quantitative not reported)b None Pneumonia
I 2012 22 DLI Afghanistan Presumeda N/A Not available Cough x8 days; hemoptysis x1 week Pneumonia
J 2015 29 DLI Afghanistan Presumeda N/A Positive (quantitative not reported)b None Latent TB infection
K 2015 22 DLI Saudi Arabia Presumeda 0 mm Indeterminatec Cough, congestion x8 days Pneumonia
L 2016 21 BMT U.S. (Ohio) No Reactive Negative (0.00)b None Histoplasmosis
M 2016 19 BMT Philippines Yes N/A Positive (0.39)b None History of treated TB
N 2016 19 BMT U.S. (Texas) No 27 mm Positive (>50, 37)d None Mycobacterium simiae
BCG, Bacillus Calmette–Guérin; BMT, Basic Military Training; DLI, Defense Language Institute; GU, genitourinary; IGRA, interferon gamma release assay; TB, tuberculosis; TST, tuberculin skin testaPresumed vaccination based on country-specific standard policy outlined in BCG World Atlas (www.bcgatlas.org)bQuantiFERON®-TB minus Nil (patient's background) expressed as international units/mL (IU/mL)cIndeterminate due to mitogen low response for the QuantiFERON®-TB Goldd(Panel A minus Nil control, Panel B minus Nil control)ePreviously published case, included in the incidence rate calculations

MSMR Vol. 24 No. 8 August 2017 Page 14
Five of the trainees were eventually diagnosed with active TB disease: trainees A, C, and E with culture-positive pulmo-nary TB; trainee B with culture-negative pulmonary TB; and trainee D with cul-ture-positive pulmonary TB and concur-rent genitourinary TB. The remaining nine trainees received the alternative diagnoses of pneumonia (n=3), latent TB infection (n=2), prior treated pulmonary TB (n=1), non-TB mycobacterium infection (n=1), histoplasmosis (n=1), and nocardiosis (n=1) (Table 1).
The majority (three of five) of trainees with TB originated from the DLIELC, and four were born overseas (Ghana, Saudi Arabia, Cameroon, and Afghanistan). Most trainees with TB pre-sented with no symptoms (three of five). Only trainee A reported respiratory symp-toms, and these were most consistent with an afebrile upper respiratory infection. Trainees B, C, and E were admitted due to high clinical suspicion of TB based on screening tests and imaging, while trainee D was hospitalized with scrotal pain poten-tially attributable to TB. Trainees A, B, and C had repeated sputa, including induced sputa, that were AFB smear and GeneXpert
negative, and diagnoses were made based on recovery of M. tuberculosis from culture, except for trainee B, who was diagnosed with culture-negative TB due to history and radiological features. Trainee D initially had three negative AFB smears and Gen-eXpert assays; after AFB smear and GeneX-pert of a testicular abscess tested positive, a fourth sputum sample was obtained, which was smear and GeneXpert positive. Trainee E underwent a bronchoscopy to obtain samples that were AFB smear and GeneXpert negative, but the diagnosis was made on the basis of culture recovery of M. tuberculosis. All isolates from culture-posi-tive cases were pan-susceptible to first-line medications (Table 3).
During this period, the incidence rate of active TB in the JBSA training popu-lation (including the previously published case) was 1.89 per 100,000 population (95% CI: 0.81, 4.42). The rates were 13.1 (95% CI: 3.71, 35.7) and 0.83 (0.14, 2.73) in the DLIELC and BMT training platforms, respectively. Contact investigations did not reveal any secondary cases indicating transmission, but there were difficulties in conducting these investigations and identi-fying any potential transmission. The delay
in diagnosis was particularly problematic in the DLIELC population because many trainees already completed their training and had left JBSA-Lackland. The delayed diagnosis also prevented the establishment of baseline LTBI rates for comparison after the conversion period. The DLIELC was additionally complicated in that there was a heterogeneous population of trainees from different countries, each with a differ-ent baseline latent TB rate making it diffi-cult to establish when concentric TB testing should be expanded.
E D I T O R I A L C O M M E N T
Among 14 trainees at JBSA-Lackland admitted for TB evaluation during the 7-year surveillance period, five were diag-nosed with pulmonary TB disease. These cases were notable for their atypical pre-sentations. All lacked the classic signs of prolonged fever, hemoptysis, anorexia, and unexplained weight loss, reaffirming that TB is challenging to diagnose based on clinical symptoms and can even pres-ent without symptoms. The microbiologic
T A B L E 2 . Imaging results of trainees hospitalized for suspected active tuberculosis, Joint Base San Antonio–Lackland, TX, 2010–2016 (N=14)
Trainee Chest x-ray Chest computed tomography
A R apical opacities R lung apex nodular opacities (largest 8 mm) with cluster GGO
B RUL focal opacities RUL focal opacification and coalescing lung nodules
C RUL nodular opacities RUL mass-like cavitary consolidation with TIB distribution, hilar lymphadenopathy
D Unremarkable R lung apex scarring, 13 mm juxtaesophageal lymph node with rim enhancement
Ea RUL and RLL consolidation RUL nodules with calcification and hilar lymphadenopathy
F RML possible cystic cavity (4.5 x 3.6 cm) Unremarkable
G LUL thin walled cavity (11 mm) LUL cavity with surrounding consolidation (4.3 x 3.2 cm) with TIB distribution and GGO
H Cardiac apex focal opacities RLL, RML, and RUL apex patchy multifocal infiltrates
I RUL focal consolidations Not performed
J RUL nodular opacities RUL calcified nodularity with associated bronchiectasis
K RUL and LLL consolidations RUL and LLL consolidations with air bronchograms
L LUL nonspecific lesion (2 cm) LUL cavitary nodule (2 cm) with small adjacent airspace opacity
M L apical nodular opacities LUL and L apical calcified and non-calcified nodules with TIB distribution
N Enlarged azygos shadow (1.3 cm) RUL subplural nodular opacities (largest 16 mm) with TIB distribution and RLL GGO
GGO, ground glass opacity; LLL, left lower lobe; LUL, left upper lode; RLL, right lower lobe; RML, right middle lobe; RUL, right upper lobe; TIB, tree-in-budaPreviously published case, included in the incidence rate calculations

August 2017 Vol. 24 No. 8 MSMR Page 15
diagnosis was particularly challenging because AFB smear and GeneXpert results for all sputum samples were negative—except the fourth sample from trainee D, which was obtained only after the diagnosis of genitourinary TB was established. The diagnoses of pulmonary TB, and the ensu-ing contact investigations, were delayed until cultures returned as positive, up to 6 weeks after admission.8 The lack of symp-toms and low mycobacterial burden may have been due to either early disease or host suppression of mycobacteria in this cohort of otherwise healthy young males.9
This case series raises concern about the increasing reliance on molecular tests for rapid diagnosis of active TB, especially in patients with minimal to no pulmonary symptoms. Although nucleic acid amplifi-cation tests have excellent overall accuracy for the detection of M. tuberculosis DNA from sputum samples,10,11 their sensitivity decreases precipitously, to as low as 68%, when AFB smears are negative.11 Bayesian approaches based on multiple rapid tests may not be ideal in situations when more aggressive TB exclusion is desired, such as high volume military and educational settings.
Because these TB cases were largely AFB smear negative, and patients were mostly asymptomatic and had no cavitary lesions on plain radiographs, the risk for mycobacterial transmission was low.12,13 However, in close congregate and mass
training settings, even a low transmission risk poses outbreak potential. Because of this risk, using guidance from the Centers for Disease Control and Prevention, local public health officials gathered contact information on all 14 cases and conducted contact investigations for those eventually diagnosed as pulmonary TB. Investigations of the DLIELC cases proved challenging due to language barriers, politico-cultural sensitivities, and the transience and het-erogeneity of the population. The heteroge-neous trainee population was particularly problematic for establishing a baseline latent TB infection rate, which is required for concentric testing.14,15 By extrapolating data from Saudi Arabian healthcare worker studies16,17 and other published incidence rates, a generous baseline of 30% positive screening tests was established. In both the DLIELC and BMT cases, the time lag between negative smears and positive cul-tures further complicated the investiga-tions, as many potentially exposed persons had been moved to their next assignments or returned to their home countries. Some individuals who had permanently left the installation were unable to be contacted, highlighting the need to collect accurate, long-term personal contact information (e.g., cell phone and personal email).
In close congregate settings, it is cru-cial to maintain a high clinical suspicion and not prematurely dismiss cases of pul-monary TB. Clinicians should notify public
health personnel as soon as pulmonary TB is being considered, rather than waiting to report once the diagnosis is officially estab-lished. Public health investigators and mili-tary training leadership have learned that it is essential to begin the preliminary stages of a contact investigation, and to establish a close working relationship with the clini-cians overseeing the case, as soon as pos-sible. This is especially prudent when the patient and exposed persons may be trav-eling internationally, because that factor increases the resources necessary to con-duct the investigation.
In light of these lessons learned, JBSA-Lackland has developed a new policy whereby BMT trainees hospitalized with suspected pulmonary TB, who are dis-charged without a diagnosis explaining their imaging results (i.e., no TB or alter-native diagnosis), may be placed on conva-lescent leave until at least three cultures are negative at the 6-week mark.8 This recom-mendation is made on a case-by-case basis by a multidisciplinary team, including clin-ical and public health personnel, and pre-sented to the training commander for a final decision. Because convalescent leave is not an option for students at the DLIELC, cases are discussed with training leadership and the country sponsor. If a student must be returned to training before active TB is formally ruled out, treatment for active TB can be considered, even in the absence of culture growth.18
T A B L E 3 . Diagnostic microbiologic evaluation of trainees diagnosed with active tuberculosis (N=5), Joint Base San Antonio–Lackland, TX, 2010–2016
Trainee AFB source AFB smear (positive/tested)
GeneXpert(positive MTB/tested)
AFB culture(positive MTB/tested) Drug resistance
A Sputum 0/3 0/3 3/3 None (INH, RIF, EMB, PZA)
B Sputum 0/6 0/1 0/6
Bronchoscopy 0/1 0/0 0/1
C Sputum 0/4 0/3 3/4 None (INH, RIF, EMB, PZA, STM)
D First sputum 0/3 0/3 2/3
Testicular abscess 1/1 1/1 1/1
Second sputum 1/1 1/1 1/1 None (INH, RIF, EMB, PZA)
Ea Bronchoscopy 0/2 0/2 1/2 None (INH, RIF, EMB, PZA)
AFB, acid-fast bacilli; MTB, Mycobacterium tuberculosis; INH, isoniazid; RIF, rifampin; EMB, ethambutol; PZA, pyrazinamide; STM, streptomycin aPreviously published case, included in the incidence rate calculations

MSMR Vol. 24 No. 8 August 2017 Page 16
Although active TB disease remains rare in the training population at JBSA-Lackland, a high degree of clinical suspi-cion should be maintained when trainees present with suspected TB, particularly for those born overseas. Often these cases have no pulmonary symptoms or have atypi-cal presentations and clinical suspicion should persist even if initial AFB smears and nucleic acid amplification testing are negative. Healthcare providers and public health personnel must communicate early and frequently to understand the nuances of the clinical workup and its implications for contact investigations.
Disclaimer: The views expressed are those of the authors and do not reflect the official views or policy of the Department of Defense and its components.
Author affiliations: San Antonio Military Medical Center, Joint Base San Antonio–Fort Sam Houston, TX (Dr. Chang, Dr. Yun); 59th Medical Wing, Joint Base San Anto-nio–Lackland, TX (Dr. Webber, Dr. Hetrick, Dr. Owen, Dr. Blasi, Dr. Steele, Dr. Yun); Uniformed Services University of the Health Sciences, Bethesda, MD (Dr. Yun).
R E F E R E N C E S
1. Scott C, Kirking HL, Jeffries C, Price SF, Pratt R. Tuberculosis trends—United States, 2014. MMWR. 2015;64(10):265–269.2. Mancuso JD, Aaron CL. Tuberculosis trends in the U.S. Armed Forces, active component, 1998–2012. MSMR. 2013;20(5):4–8.3. Ismail Y. Pulmonary tuberculosis—a review of clinical features and diagnosis in 232 cases. Med J Malaysia. 2004;59(1):56–64.4. Sanchez JL, Sanchez JL, Cooper MJ, Hiser MJ, Mancuso JD. Tuberculosis as a force health protection threat to the United States military. Mil Med. 2015;180(3):276–284.5. Sepkowitz KA. How contagious is tuberculo-sis? Clin Infect Dis. 1996;23(5):954–962.6. Gomez-Merino D, Drogou C, Chennaoui M, Tiollier E, Mathieu J, Guezennec CY. Effects of combined stress during intense training on cellu-lar immunity, hormones and respiratory infections. Neuroimmunomodulation. 2005;12(3):164–172.7. Aaron CL, Fotinos MJ, West KB, Goodwin DJ, Mancuso JD. Tuberculosis among nonimmi-grant visitors to US Military installations. Mil Med. 2013;178(3):346–352.8. Lewinsohn DM, Leonard MK, LoBue PA, et al. Official American Thoracic Society/Infectious Diseases Society of America/Centers for Disease Control and Prevention Clinical Practice Guide-lines: Diagnosis of Tuberculosis in Adults and Chil-dren. Clin Infect. 2017;64(2):111–115.9. Rizvi N, Shah RH, Inayat N, Hussain N. Differ-ences in clinical presentation of pulmonary tuber-culosis in association with age. J Pak Med Assoc. 2003;53(8):321–324. 10. Zeka AN, Tasbakan S, Cavusoglu C. Evalu-
ation of the GeneXpert MTB/RIF assay for rapid diagnosis of tuberculosis and detection of rifampin resistance in pulmonary and extrapulmonary speci-mens. J Clin Microbiol. 2011;49(12):4138–4141.11. Boehme CC, Nabeta P, Hillemann D, et al. Rap-id molecular detection of tuberculosis and rifampin resistance. New Engl J Med. 2010;363(11):1005–1015.12. Liippo KK, Kulmala K, Tala EO. Focusing tuber-culosis contact tracing by smear grading of index cases. Am Rev Resp Dis. 1993;148(1):235–236.13. Madhi F, Fuhrman C, Monnet I, et al. Trans-mission of tuberculosis from adults to children in a Paris suburb. Ped Pulm. 2002;34(3):159–163.14. National Tuberculosis Controllers Associa-tion; Centers for Disease Control and Prevention. Guidelines for the investigation of contacts of per-sons with infectious tuberculosis. Recommenda-tions from the National Tuberculosis Controllers Association and CDC. MMWR Recomm Rep. 2005;54(RR-15):1–47.15. Bailey WC, Gerald LB, Kimerling ME, et al. Predictive model to identify positive tuberculo-sis skin test results during contact investigations. JAMA. 2002;287(8):996–1002.16. Abbas MA, AlHamdan NA, Fiala LA, AlEnezy AK, AlQahtani MS. Prevalence of latent TB among health care workers in four major tertiary care hospitals in Riyadh, Saudi Arabia. J Egypt Public Health Assoc. 2010;85(1–2):61–71.17. Al Jahdali HH, Baharoon S, Abba AA, et al. Saudi guidelines for testing and treatment of latent tuberculosis infection. Ann Saudi Med. 2010;30(1):38–49.18. Gunnels JJ, Bates JH, Swindoll H. Infectivity of sputum-positive tuberculous patients on chemo-therapy. Am Rev Resp Dis. 1974;109(3):323–330.

August 2017 Vol. 24 No. 8 MSMR Page 17
The Department of Defense (DoD) conducts year-round influenza sur-veillance for military healthcare
beneficiaries and select civilian populations. Data from routine respiratory surveillance are used to estimate midseason influenza vaccine effectiveness (VE) and findings are shared annually at the Food and Drug Administration’s advisory committee meet-ing on U.S. influenza vaccine strain selec-tion. DoD VE estimates from the Defense Health Agency Armed Forces Health Sur-veillance Branch (AFHSB) and Naval Health Research Center (NHRC) are presented in this report.
M E T H O D S
The AFHSB–Air Force Satellite Cell (AFHSB-AF) conducted a test-negative case-control study using data from the U.S. Air Force School of Aerospace Medicine’s worldwide sentinel site-based program, the DoD Global, Laboratory-Based, Influenza Surveillance Program. Respiratory speci-mens were collected from DoD dependents presenting to outpatient military treatment facilities with influenza-like illness (ILI). Influenza cases were identified using reverse transcription–polymerase chain reaction (RT-PCR) or viral culture; controls were ILI patients who tested negative for influ-enza. From 2 October 2016 through 18 February 2017, a total of 534 cases and 838 test-negative controls were identified. Vacci-nation status was ascertained via electronic immunization records (Air Force Complete Immunization Tracking Application and the Aeromedical Services Information Manage-ment System) and self-report from patient questionnaires. Individuals were consid-ered vaccinated if they received the current
season’s vaccine at least 14 days before illness onset. Those who were vaccinated within 14 days of illness onset were excluded.
NHRC’s study utilized a test-negative case-control design using data from their febrile respiratory illness (FRI) surveillance program, which included outpatient DoD dependents in Southern California, Arizona, and Illinois, as well as outpatient civilians presenting at clinics in California near the U.S.–Mexico border. Cases were identified using RT-PCR; controls were FRI patients who tested negative for influenza. From 29 December 2016 through 16 February 2017, a total of 75 cases and 224 test-negative con-trols were identified. Vaccination status was ascertained by medical chart review when possible and self-report when necessary. Individuals were considered vaccinated if illness occurred between 14 and 180 days since vaccination.
AFHSB conducted a matched case-control study using data from the Defense Medical Surveillance System (DMSS) and Standard Ancillary Service–processed labo-ratory data from the Navy and Marine Corps Public Health Center to evaluate VE among active component, nonrecruit service mem-bers worldwide, across all services. Cases were defined as service members with influ-enza-positive laboratory tests (rapid antigen tests, RT-PCR or culture). Healthy controls were identified using medical encounters for injuries or mental health conditions with-out any ILIs reported at the encounter and no medical encounters for influenza during the season. Healthy controls were matched to cases by sex, age, date of encounter (±3 days), and treatment facility. From 1 Decem-ber 2016 through 25 February 2017, a total of 909 cases and 3,424 matched healthy con-trols were identified. Vaccination status was ascertained by electronic immunization records from DMSS.
Multivariable logistic regression was used to calculate adjusted odds ratios (AORs) using SAS 9.3 (SAS Institute Inc., Cary, NC). VE was calculated as (1−AOR) × 100. Given the predominance of influenza A(H3N2), VE analyses against influenza A(H1N1)pdm09 were not possible, and only one study (AFHSB-AF) was able to con-duct an influenza B VE analysis. All analy-ses evaluated the effectiveness of inactivated influenza vaccines because the live attenu-ated influenza vaccine was not used during the 2016–2017 influenza season in the U.S.1 AFHSB-AF adjusted for age group, month of illness, and region for the overall and influenza A(H3N2) analyses; the influenza B analysis was adjusted for month of illness only. NHRC adjusted for age group and sur-veillance population. AFHSB adjusted for 5-year influenza vaccination history (at least one influenza vaccination in the previous 5 years vs. no influenza vaccinations dur-ing the previous 5 years). Control selection methods varied between the studies and were chosen based on the characteristics of the population and the data available.
R E S U L T S
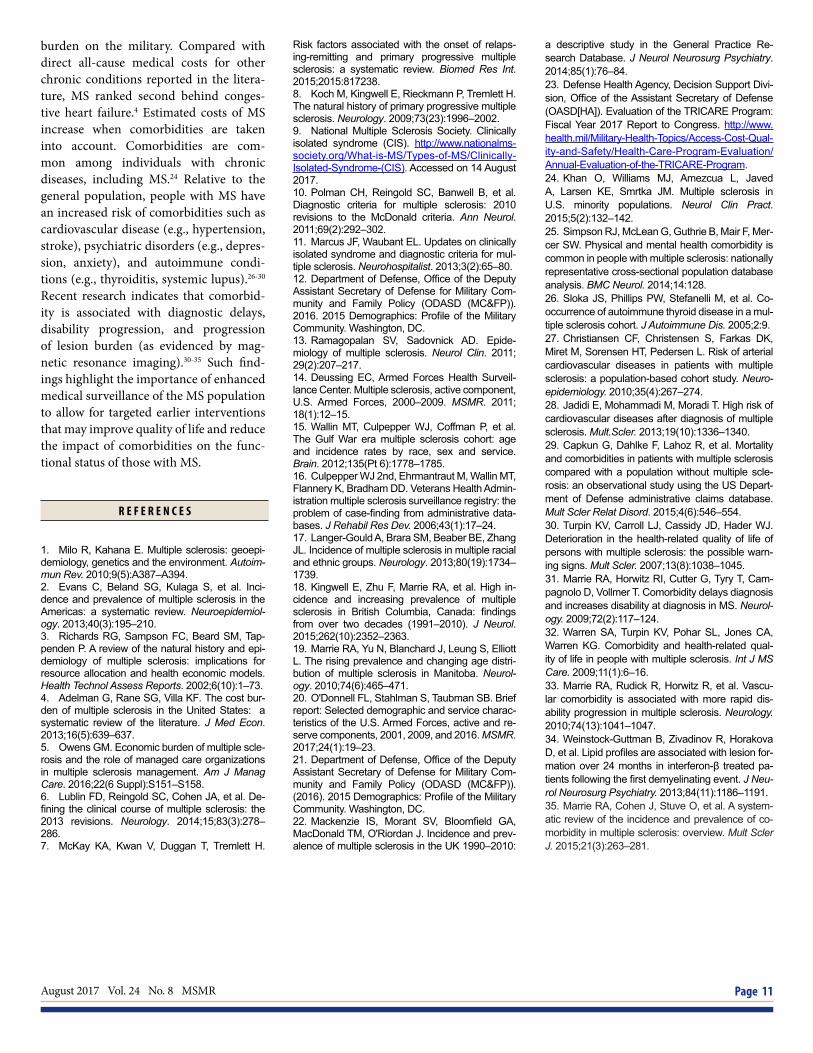
Adjusted VE for dependents and civil-ians against all influenza types was simi-lar across studies and showed statistically significant protection (Table). AFHSB-AF found that, for all influenza types, VE was 42% (95% CI: 24%–55%), similar to NHRC’s overall VE of 45% (95% CI: 5%–68%). VE against influenza A(H3N2) for dependents and civilians was also similar across stud-ies with AFHSB-AF estimating influenza A(H3N2) VE at 42% (95% CI: 24%–56%) and NHRC estimating influenza A(H3N2) VE at 46% (95% CI: 6%–70%). VE against influenza B was slightly higher at 53% (95%
Brief Report Mid-Season Influenza Vaccine Effectiveness Estimates for the 2016–2017 Influenza SeasonElizabeth Toure, MPH; Angelia A. Eick-Cost, PhD, ScM; Anthony W. Hawksworth; Michael J. Cooper, PhD (CAPT, USPHS); Zheng Hu, MS; Christopher A. Myers, PhD; Peter E. Kammerer, MD; Michelle N. Ricketts; Susan Federinko, MD, MPH (Lt Col, USAF)
MSMR Vol. 24 No. 8 August 2017 Page 18
CI: 11%–75%), as estimated by AFHSB-AF. Adjusted VE estimates for active compo-nent service members were not statistically significant. The AFHSB analysis found that VE against all influenza A was 3% (95% CI: -25%–25%) and VE against influenza A(H3N2) was 33% (95% CI: -6%–57%).
D I S C U S S I O N
Mid-season influenza VE estimates indicated that vaccination reduced the odds of medically attended influenza infection by approximately 45% among DoD dependents and civilians. These results were consistent with other studies, which have also found moderate VE this season.2,3 Additionally, the DoD’s findings were similar to VE estimates from previous influenza A(H3N2)–predom-inant seasons without vaccine mismatch.4,5
VE estimates for active component service members are frequently lower than those for civilians.6,7 There are many factors that could lead to decreased VE among mili-tary personnel, including their high influ-enza vaccination rates (approximately 90%), annual (repeat) vaccinations, and early-sea-son vaccination.6 Studying VE in a highly vaccinated population adversely affects the
statistical power of the analysis given the limited number of unexposed cases and con-trols. Additionally, repeated vaccination has been shown in some studies to reduce VE and potentially diminish antibody response to influenza.5,8-10 Lastly, military personnel may experience waning immunity due to the fact that the U.S. military tends to start influenza vaccinations very early in the sea-son.11-13 Further research is necessary to determine how these factors might influence VE in the military population.
Limitations included a relatively small number of cases, which decreased the power of the studies and prevented VE estimation against influenza A(H1N1)pdm09 and, for two of the studies, influenza B. Addition-ally, these studies were limited in that only ILI cases severe enough to seek medical care were included, and the study populations tended to be younger than the general pop-ulation. Therefore, it is difficult to comment on VE in less severe cases or among older populations.
Author affiliations: Defense Health Agency/Armed Forces Health Surveillance Branch–U.S. Air Force School of Aerospace Medicine, Wright-Patterson AFB, OH (Ms. Toure, Lt Col Federinko); Armed Forces Health Sur-veillance Branch, Silver Spring, MD (Dr.
Eick-Cost, CAPT Cooper, Ms. Hu); Naval Health Research Center, San Diego, CA (Dr. Myers, Mr. Hawksworth, Dr. Kammerer, Ms. Ricketts); Oak Ridge Institute for Science and Education, Oak Ridge, TN (Ms. Toure); and the Henry M. Jackson Foundation for the Advancement of Military Medicine Inc., Bethesda, MD (Mr. Hawksworth, Dr. Kam-merer, Ms. Ricketts).
Acknowledgments: The authors thank the DoD Global, Laboratory-Based Influenza Surveillance Program and its sentinel site partners, the Centers for Disease Control and Prevention’s Border Infectious Disease Sur-veillance program in San Diego and Impe-rial counties, and the Navy and Marine Corps Public Health Center.
Disclaimer: The authors are government employees, contractors, or fellows whose work on this study was part of their official duties on behalf of the U.S. Government. Human subjects participated in this study after giving their free and informed consent. This research has been conducted in compliance with all applicable federal regulations governing the protection of human subjects in research (Pro-tocol NHRC.2007.0024).
T A B L E . Mid-season influenza vaccine effectiveness (VE) estimates, 2016–2017
Population Influenza type No. of cases
% vaccinated
No. of controls
% vaccinateda Crude VE 95% CI Adjusted
VE 95% CIb
Dependents (AFHSB-AF) Overall 534 32 838 36 17 (-5–34) 42 (24–55)
Influenza A(H3N2) 477 32 838 36 14 (-9–32) 42 (24–56)
Influenza B 53 26 838 36 35 (-21–65) 53 (11–75)
Dependents and civilians (NHRC) Overall 75 33 224 48 45 (6–68) 45 (5–68)
Influenza A(H3N2) 70 33 224 48 47 (6–70) 46 (6–70)
Active component service members (AFHSB) Influenza Ac 909 91 3,424 91 5 (-23–27) 3 (-25–25)
Influenza A(H3N2) 261 87 991 91 32 (-6–57) 33 (-6–57)
AFHSB-AF, Armed Forces Health Surveillance Branch–Air Force Satellite Cell; NHRC, Naval Health Research Center; AFHSB, Armed Forces Health Surveillance BranchaAFHSB-AF and NHRC used unmatched, influenza test–negative controls; AFHSB used healthy controls (matched to cases by sex, age, date [+/– 3 days] and location).bAFHSB-AF adjusted for age group, month of illness and region (overall and influenza A[H3N2]). Influenza B analysis adjusted for month of illness only; NHRC adjusted for age group and surveillance population; AFHSB adjusted for 5-year prior vaccination status (Y/N).cCases and controls include all influenza A–positive cases, subtyped and not subtyped.

August 2017 Vol. 24 No. 8 MSMR Page 19
R E F E R E N C E S
1. Grohskopf LA, Sokolow LZ, Broder KR, et al.Prevention and control of seasonal influenza with vaccines: recommendations of the Advisory Com-mittee on Immunization Practices—United States, 2016–17 influenza season. MMWR Recomm Rep. 2016;65(5):1–54.2. Flannery B, Chung JR, Thaker SN, et al. Interimestimates of 2016–17 seasonal influenza vaccine effectiveness—United States, February 2017. MMWR Morb Mortal Wkly Rep. 2017;66(6):167–171.3. Skowronksi DM, Chambers C, Sabaiduc S, etal. Interim estimates of 2016/17 vaccine effective-ness against influenza A(H3N2), Canada, January 2017. Euro Surveill. 2017;22(6):pii:30460.4. Skowronski DM, Janjua NZ, De Serres G, etal. Interim estimates of influenza vaccine effec-tiveness in 2012/13 from Canada’s sentinel sur-
veillance network, January 2013. Euro Surveill. 2013;18(5):pii:20394.5. Ohmit SE, Thompson MG, Petrie JG, et al.Influenza vaccine effectiveness in the 2011–2012 season: protection against each circulating virus and the effect of prior vaccination on estimates. Clin Infect Dis. 2014;58(3):319–327.6. Cost AA, Hiser MJ, Hu Z, et al. Brief report:mid-season influenza vaccine effectiveness es-timates for the 2013–2014 influenza season. MSMR. 2014;21(6):15–17.7. Eick-Cost AA, Hu Z, Cooper MJ, et al. Mid-sea-son influenza vaccine effectiveness for the 2012–2013 influenza season. MSMR. 2013;20(3):15–16.8. McLean HQ, Thompson MG, Sundaram ME, etal. Impact of repeated vaccination on vaccine effec-tiveness against influenza A(H3N2) and B during 8 seasons. Clin Infect Dis. 2014;59(10):1375–1385.9. Ohmit SE, Petrie JG, Malosh RE, et al. Influ-enza vaccine effectiveness in the community and the household. Clin Infect Dis. 2013;56(10):1363–1369.
10. Thompson MG, Naleway A, Fry AM, et al. Ef-fects of repeated annual inactivated influenza vac-cination among healthcare personnel on serum hemagglutinin inhibition antibody response to A/Perth/16/2009 (H3N2)-like virus during 2010-11. Vaccine. 2016;34(7):981–988.11. Belongia EA, Sundaram ME, McClure DL,Meece JK, Ferdinands J, VanWormer JJ. Wan-ing vaccine protection against influenza A (H3N2) illness in children and older adults during a single season. Vaccine. 2015;33(1):246–251.12. Kissling E, Nunes B, Robertson C, et al. I-MOVE multicentre case-control study 2010/11 to 2014/15: is there within-season waning of in-fluenza type/subtype vaccine effectiveness with increasing time since vaccination? Euro Surveill. 2016;21(16):pii:30201.13. Radin JM, Hawksworth AW, Myers CA, Rick-etts MN, Hansen EA, Brice GT. Influenza vaccine effectiveness: maintained protection throughout the duration of influenza seasons 2010–2011 through 2013–2014. Vaccine. 2016;34(33):3907–3912.
Erratum: Armed Forces Health Surveillance Branch. Update: Heat illness, active component, U.S. Armed Forces, 2016. MSMR. 2017;24(3):9–13.On p. 12, the footnote in Table 2 should read “One heat illness per person per year.” The footnote text was corrected in each online version of the MSMR's annual heat illness updates for 2013–2017.
MSMR’s Invitation to ReadersMedical Surveillance Monthly Report (MSMR) invites readers to submit topics for consideration as the basis for future MSMR reports. The
MSMR editorial staff will review suggested topics for feasibility and compatibility with the journal’s health surveillance goals. As is the case with most of the analyses and reports produced by Armed Forces Health Surveillance Branch staff, studies that would take advantage of the healthcare and personnel data contained in the Defense Medical Surveillance System (DMSS) would be the most plausible types. For each promising topic, Armed Forces Health Surveillance Branch staff members will design and carry out the data analysis, interpret the results, and write a manuscript to report on the study. This invitation represents a willingness to consider good ideas from anyone who shares the MSMR’s objective to publish evidence-based reports on subjects relevant to the health, safety, and well-being of military service members and other beneficiaries of the Military Health System (MHS).
In addition, MSMR encourages the submission for publication of reports on evidence-based estimates of the incidence, distribution, impact, or trends of illness and injuries among members of the U.S. Armed Forces and other beneficiaries of the MHS. Information about manuscript submissions is available at www.health.mil/MSMRInstructions.
Please email your article ideas and suggestions to the MSMR editorial staff at: [email protected].
Medical Surveillance Monthly Report (MSMR)Armed Forces Health Surveillance Branch11800 Tech Road, Suite 220 Silver Spring, MD 20904
MEDICAL SURVEILLANCE MONTHLY REPORT (MSMR), in continuous publication since 1995, is produced by the Armed Forces Health Surveillance Branch (AFHSB). The MSMR provides evidence-based estimates of the incidence, distribution, impact and trends of illness and injuries among U.S. military members and associated populations. Most reports in the MSMR are based on summaries of medical administrative data that are routinely provided to the AFHSB and integrated into the Defense Medical Surveillance System for health surveillance purposes.
Archive: Past issues of the MSMR are available as downloadable PDF files at www.health.mil/MSMRArchives.
Online Subscriptions: Submit subscription requests at www.health.mil/MSMRSubscribe.
Editorial Inquiries: Call (301) 319-3240 or send email to: [email protected].
Instructions for Authors: Information about article submissions is provided at www.health.mil/MSMRInstructions.
All material in the MSMR is in the public domain and may be used and reprinted without permission. Citation formats are available at www.health.mil/MSMR.
Opinions and assertions expressed in the MSMR should not be construed as reflecting official views, policies, or positions of the Department of Defense or the United States Government.
Follow us: www.facebook.com/AFHSCPAGE
http://twitter.com/AFHSBPAGE
ISSN 2158-0111 (print) ISSN 2152-8217 (online)
Chief, Armed Forces Health Surveillance Branch COL Douglas A. Badzik, MD, MPH (USA)
EditorFrancis L. O’Donnell, MD, MPH
Contributing EditorsLeslie L. Clark, PhD, MSShauna Stahlman, PhD, MPH
Writer/EditorValerie F. Williams, MA, MS
Managing/Production EditorElizabeth J. Lohr, MA
Layout/DesignDarrell Olson
Data AnalysisStephen B. Taubman, PhD
Editorial OversightCol Dana J. Dane, DVM, MPH (USAF) COL P. Ann Loveless, MD, MS (USA)Mark V. Rubertone, MD, MPH