volume 24 number 12 medical sureillance monthly report
TRANSCRIPT

M E D I C A L S U R V E I L L A N C E M O N T H L Y R E P O R T
MSMR
A publication of the Armed Forces Health Surveillance Branch
DECEMBER 2017
Volume 24Number 12
P A G E 2 Insomnia and motor vehicle accident–related injuries, active component, U.S. Armed Forces, 2007–2016Elizabeth A. Erickson, MD; Shauna Stahlman, PhD, MPH; Mark G. McNellis, PhD
P A G E 1 2 Seizures among active component service members, U.S. Armed Forces, 2007–2016Julie A. Bytnar, MPH; Shauna Stahlman, PhD, MPH; Saixia Ying, PhD
P A G E 2 0 Brief report: Prevalence of hepatitis B and C virus infections in U.S. Air Force basic military trainees who donated blood, 2013–2016Douglas F. Taylor, DO; Ryan S. Cho, MD; Jason F. Okulicz, MD; Bryant J. Webber, MD, MPH; John G. Gancayco, MD
P A G E 2 3 Fatigue and related comorbidities, active component, U.S. Armed Forces, 2007–2016Robert M. Guido, MD, MPH; Shauna Stahlman, PhD, MPH; Saixia Ying, PhD

MSMR Vol. 24 No. 12 December 2017 Page 2
Insomnia is the most common sleep disorder in adults, and its incidence is increasing in the U.S. Armed Forces. A potential consequence of insomnia (including medications used to treat it) is increased risk of motor vehicle accidents (MVAs), which cause significant morbidity and mortality in service members. To examine the relationship between insomnia and MVA-related injuries in the U.S. Armed Forces, this retrospective cohort study compared incidence rates of MVA-related injuries from 2007 through 2016 between service members with diagnosed insomnia and an unexposed cohort. After adjustment for multiple covariates, service members with insomnia had more than double the rate of MVA-related injuries, compared to service members without insomnia (adjusted incidence rate ratio: 2.08; 95% CI: 1.95–2.22). A subanalysis of service members with insomnia during 2014–2016 found no difference in risk of MVA-related injury based on days' supply of sleep aid medications prescribed in 365 days following insomnia diagnosis. Insomnia is an important potential risk factor for MVAs in the military. Sleep health should be a component of MVA prevention efforts.
Insomnia and Motor Vehicle Accident–Related Injuries, Active Component, U.S. Armed Forces, 2007–2016Elizabeth A. Erickson, MD (Lt Col, USAF); Shauna Stahlman, PhD, MPH; Mark G. McNellis, PhD
Insomnia, defined broadly by inade-quate sleep duration and quality, is the most common sleep disorder among
adults in the U.S.1,2 Diagnosed insom-nia cases are unlikely to represent the full extent of those experiencing inadequate sleep. Approximately one-third of adults in the U.S. report sleeping less than 7 hours per night (the lower limit of recommended sleep duration).3 A consequence of inade-quate sleep is increased risk of motor vehi-cle accidents (MVA).1,4-7 Given that MVAs are the leading cause of peacetime deaths and a major cause of non-fatal injuries in U.S. military members,8-10 it is important to understand the relationship between insomnia and MVAs in the U.S. Armed Forces.
Insomnia is defined by difficulty initiat-ing or maintaining sleep, early awakenings, and/or non-restorative sleep.1,11 Additional symptoms include fatigue and low energy,
poor concentration, cognitive slowing, and mood disturbances.1,11,12 Insomnia is more common in females and older adults, and is often comorbid with mental health dis-orders (such as anxiety, depression, and post-traumatic stress disorder [PTSD]) and substance-related disorders.1,2,11,13,14 Occu-pational and environmental factors may contribute to insomnia, such as shift work, long work hours and stress—factors com-monly encountered in military service.1,2 In the U.S. military, the incidence of diagnosed insomnia increased from 7.2 to 135.8 cases per 10,000 person-years (p-yrs) between 2000 and 2009, with some evidence of increased rates of incident insomnia after deployments to Iraq or Afghanistan among Army and Marine Corps service members.2
Insomnia can be managed in vari-ous ways: pharmacologically with medi- cations that induce sleep; pharmacologi-cally by treating comorbid conditions;
or non-pharmacologically with a variety of behavioral modalities.15,16 Medications approved for treatment of insomnia include some benzodiazepines; the non-benzo-diazepine hypnotics zaleplon, zolpidem, and eszopiclone (known as the Z-drugs); the melatonin receptor agonist ramelteon; the antidepressant doxepin; and the orexin receptor agonist suvorexant.1,15,16 Insom-nia treatment guidelines suggest not using these medications longer than 4–5 weeks.15 The Z-drugs, doxepin, and suvorexant have been shown to improve insomnia symp-toms.15,16 By design, most of the sleep aid medications cause sedation, and some have additional effects that could result in day-time impairment, behavioral changes, hal-lucinations, and even sleep-driving.15,17 The risks and benefits of pharmacotherapy for insomnia must be carefully considered when making treatment decisions.
Both insomnia and the use of sleep aid medications have been found to be associ-ated with MVAs in non-military popula-tions.4,6,7,18,19 MVAs are the leading cause of death in Americans aged 5–24 years.20 In the U.S. in 2012, non-fatal MVAs resulted in 2.5 million emergency department vis-its and estimated medical costs of $18.4 bil-lion.21 Injuries sustained due to MVAs may result in short- or long-term health conse-quences and decreased occupational perfor-mance. In the military, these consequences of MVA-related injuries decrease opera-tional readiness. Of many studies focused on MVAs in military members, few have evaluated insomnia or use of sleep aid med-ications as a risk factor.9,10,18,22-25 This report explores the relationship between insomnia diagnoses and rates of MVA-related injury in the active component of the U.S. Armed Forces over a 10-year period. Additionally, a subanalysis evaluated the potential associa-tion between the amount of sleep aid medi-cation prescribed for insomnia and the risk of MVA-related injury.

December 2017 Vol. 24 No. 12 MSMR Page 3
T A B L E 1 . ICD-9/ICD-10 diagnostic codes for insomnia M E T H O D S
The surveillance period was 1 January 2007 through 31 December 2016. The sur-veillance population included all individ-uals who served at any time in the active component of the Army, Navy, Air Force, or Marine Corps. All data used to deter-mine incident cases of insomnia, pre-scriptions of sleep aid medications, and MVA-related injuries were derived from the Defense Medical Surveillance System (DMSS). These records document both ambulatory encounters and hospitaliza-tions of active component members of the U.S. Armed Forces in fixed military and civilian (if reimbursed through the Military Health System) treatment facilities.
The study design was a retrospective matched cohort study. An incident case of insomnia was defined by records of two outpatient medical encounters within 90 days of each other or one hospitalization with a diagnosis of insomnia in any diag-nostic position, in a non-deployed health-care setting. The ICD-9 or ICD-10 codes used to define a case of insomnia are listed in Table 1. Each individual could be an inci-dent case only once during the surveillance period for insomnia, which ended on 31 December 2015 to allow for 365 days of follow-up post-diagnosis. An unexposed comparison cohort was selected at ran-dom (case-to-comparison ratio 1:1) from among service members in service at the same time as their matched cases (within 1 month). Matched individuals in the com-parison cohort were followed for 365 days. Follow-up time was censored at time of deployment or leaving military service. Individuals with prior diagnoses of insom-nia before the surveillance period were eli-gible for inclusion.
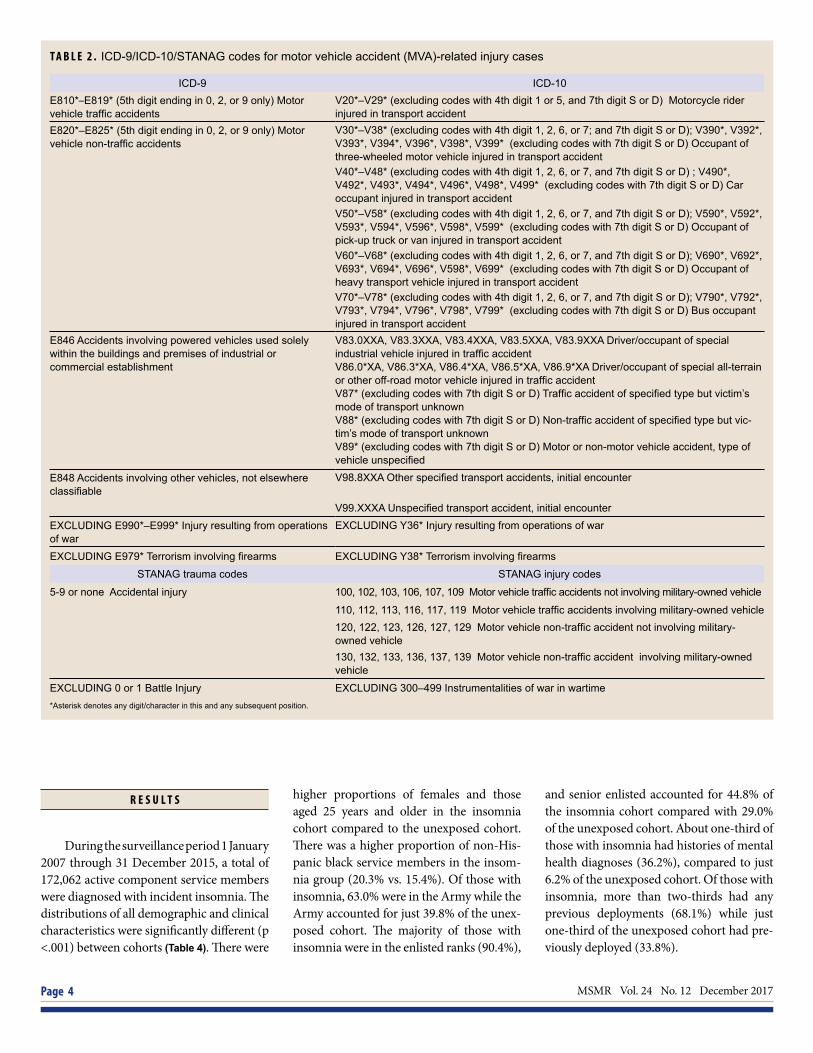
MVA-related injury during the 365-day follow-up period was defined as an out-patient or inpatient encounter that included any of the MVA-related ICD-9 or ICD-10 external cause of injury codes, or NATO Standardization Agreement (STANAG 2050) hospitalization cause of injury and trauma codes listed in Table 2. Encounters with ICD-10 codes indicating subsequent or sequelae-related visits, and codes spe-cifically indicating injuries to passengers
of motor vehicles, were not included in the case definition for MVA-related injury. Individuals could have multiple cases of MVA-related injury during the 365-day fol-low-up, with a requirement of 30 days with-out case-defining encounters between each incident case.
Baseline demographic and clini-cal characteristics at the time of insomnia diagnosis or selection to the comparison cohort were analyzed. Clinical character-istics included any past history of a men-tal health diagnosis (limited to anxiety, depression, bipolar disorder, and PTSD) or alcohol-related disorders, per Armed Forces Health Surveillance Branch (AFHSB) standardized case definitions.26 Pearson chi-square tests were used to com-pare demographic and clinical character-istics between cohorts. Incidence rates of MVA-related injuries during the 365-day follow-up periods were calculated by using the number of incident MVA-related inju-ries and the number of p-yrs of follow-up. Incidence rate ratios (IRRs) were used to compare rates between insomnia and com-parison cohorts and between categories of demographic and clinical characteristics.
A Poisson regression model was used to generate IRRs adjusted (aIRR) for sex, age, race/ethnicity, branch of service, mil-itary rank/grade, occupational category,
deployment history, history of mental health diagnosis, and history of alcohol-related disorder.
A subpopulation of those with insom-nia diagnoses first recorded between 1 January 2014 and 31 December 2015 was used to analyze the association between the amount of sleep aid medications pre-scribed and risk for MVA-related injuries. The sleep aid medications included in this analysis are listed in Table 3. Three exposure categories were defined by the number of days’ supply of any of the included medica-tions prescribed during the 365 days after incident insomnia diagnosis: no medica-tions, 1–30 days’ supply, and more than 30 days’ supply. MVA-related injury was con-sidered as a dichotomous outcome (any vs. none) within 365 days following the insom-nia diagnosis.
A log-linear regression model was used to generate adjusted risk ratios (aRRs) for the association between days’ supply of sleep aid medications prescribed and MVA-related injury, adjusting for sex, age, race/ethnicity, branch of service, military rank/grade, occupational category, deployment history, history of mental health diagnosis, and history of alcohol-related disorder. All analyses were performed using SAS/ STAT® software, version 9.4 (2014, SAS Institute, Cary, NC).
ICD-9 ICD-10
- F51.0 Insomnia not due to a substance or known physiological condition
307.42 Persistent disorder of initiating or maintaining sleep F51.01 Primary insomnia
307.41 Transient disorder of initiating or maintaining sleep F51.02 Adjustment insomnia
307.42 (see above) F51.03 Paradoxical insomnia
327.02 Insomnia due to mental disorder F51.04 Psychophysiological insomniaF51.05 Insomnia due to other mental disorder
307.41 (see above) F51.09 Other insomnia not due to a substance or known physiological conditionG47.0 Insomnia
780.52 Insomnia unspecified G47.00 Insomnia, unspecified
327.00 Organic Insomnia, unspecified G47.01 Insomnia due to a medical condition
327.01 Insomnia due to medical condition classified elsewhere
327.09 Other organic insomnias G47.09 Other insomnia
MSMR Vol. 24 No. 12 December 2017 Page 4
R E S U L T S
During the surveillance period 1 January 2007 through 31 December 2015, a total of 172,062 active component service members were diagnosed with incident insomnia. The distributions of all demographic and clinical characteristics were significantly different (p <.001) between cohorts (Table 4). There were
higher proportions of females and those aged 25 years and older in the insomnia cohort compared to the unexposed cohort. There was a higher proportion of non-His-panic black service members in the insom-nia group (20.3% vs. 15.4%). Of those with insomnia, 63.0% were in the Army while the Army accounted for just 39.8% of the unex-posed cohort. The majority of those with insomnia were in the enlisted ranks (90.4%),
and senior enlisted accounted for 44.8% of the insomnia cohort compared with 29.0% of the unexposed cohort. About one-third of those with insomnia had histories of mental health diagnoses (36.2%), compared to just 6.2% of the unexposed cohort. Of those with insomnia, more than two-thirds had any previous deployments (68.1%) while just one-third of the unexposed cohort had pre-viously deployed (33.8%).
T A B L E 2 . ICD-9/ICD-10/STANAG codes for motor vehicle accident (MVA)-related injury cases
ICD-9 ICD-10E810*–E819* (5th digit ending in 0, 2, or 9 only) Motor vehicle traffic accidents
V20*–V29* (excluding codes with 4th digit 1 or 5, and 7th digit S or D) Motorcycle rider injured in transport accident
E820*–E825* (5th digit ending in 0, 2, or 9 only) Motor vehicle non-traffic accidents
V30*–V38* (excluding codes with 4th digit 1, 2, 6, or 7; and 7th digit S or D); V390*, V392*, V393*, V394*, V396*, V398*, V399* (excluding codes with 7th digit S or D) Occupant of three-wheeled motor vehicle injured in transport accidentV40*–V48* (excluding codes with 4th digit 1, 2, 6, or 7, and 7th digit S or D) ; V490*, V492*, V493*, V494*, V496*, V498*, V499* (excluding codes with 7th digit S or D) Car occupant injured in transport accidentV50*–V58* (excluding codes with 4th digit 1, 2, 6, or 7, and 7th digit S or D); V590*, V592*, V593*, V594*, V596*, V598*, V599* (excluding codes with 7th digit S or D) Occupant of pick-up truck or van injured in transport accidentV60*–V68* (excluding codes with 4th digit 1, 2, 6, or 7, and 7th digit S or D); V690*, V692*, V693*, V694*, V696*, V598*, V699* (excluding codes with 7th digit S or D) Occupant of heavy transport vehicle injured in transport accidentV70*–V78* (excluding codes with 4th digit 1, 2, 6, or 7, and 7th digit S or D); V790*, V792*, V793*, V794*, V796*, V798*, V799* (excluding codes with 7th digit S or D) Bus occupant injured in transport accident
E846 Accidents involving powered vehicles used solely within the buildings and premises of industrial or commercial establishment
V83.0XXA, V83.3XXA, V83.4XXA, V83.5XXA, V83.9XXA Driver/occupant of special industrial vehicle injured in traffic accidentV86.0*XA, V86.3*XA, V86.4*XA, V86.5*XA, V86.9*XA Driver/occupant of special all-terrain or other off-road motor vehicle injured in traffic accidentV87* (excluding codes with 7th digit S or D) Traffic accident of specified type but victim’s mode of transport unknownV88* (excluding codes with 7th digit S or D) Non-traffic accident of specified type but vic-tim’s mode of transport unknownV89* (excluding codes with 7th digit S or D) Motor or non-motor vehicle accident, type of vehicle unspecified
E848 Accidents involving other vehicles, not elsewhere classifiable
V98.8XXA Other specified transport accidents, initial encounter
V99.XXXA Unspecified transport accident, initial encounterEXCLUDING E990*–E999* Injury resulting from operations of war
EXCLUDING Y36* Injury resulting from operations of war
EXCLUDING E979* Terrorism involving firearms EXCLUDING Y38* Terrorism involving firearms
STANAG trauma codes STANAG injury codes
5-9 or none Accidental injury 100, 102, 103, 106, 107, 109 Motor vehicle traffic accidents not involving military-owned vehicle
110, 112, 113, 116, 117, 119 Motor vehicle traffic accidents involving military-owned vehicle 120, 122, 123, 126, 127, 129 Motor vehicle non-traffic accident not involving military-owned vehicle 130, 132, 133, 136, 137, 139 Motor vehicle non-traffic accident involving military-owned vehicle
EXCLUDING 0 or 1 Battle Injury EXCLUDING 300–499 Instrumentalities of war in wartime*Asterisk denotes any digit/character in this and any subsequent position.

December 2017 Vol. 24 No. 12 MSMR Page 5
There were 5,587 cases of MVA-related injuries during the surveillance period; 3,849 (68.9%) in the insomnia cohort and 1,738 (31.1%) in the unexposed cohort (Table 5). The majority of individuals who experienced MVA-related injuries had just one injury during their 365-day fol-low-up period. The overall crude rate of MVA-related injury during the surveil-lance period was 27.7 cases per 1,000 p-yrs in the insomnia cohort and 11.2 per 1,000 p-yrs in the unexposed cohort. Across the surveillance period, annual rates of MVA-related injuries were higher in the insomnia cohort than the unexposed cohort (Figure 1). Annual rates of MVA-related injuries were highest in the insomnia cohort in 2007 and 2008, and lowest in 2016. Among all demographic and clinical subgroups in the analysis, overall crude rates of MVA-related injuries were higher in those with insomnia than those without (Table 5). The highest overall crude rates of MVA-related injuries were seen in those less than 25 years old, junior enlisted rank/grade, armor/trans-port occupation, those with a history of mental health diagnosis, and those with a history of alcohol-related disorders.
Multivariable Poisson regression model results revealed that, after adjust-ing for key background characteris-tics, those with insomnia had more than double the rate of MVA-related injuries, compared to those without insomnia
(aRR: 2.08; 95% CI: 1.95–2.22) (Table 6). Other key background characteristics asso-ciated with increased rate of MVA-related injuries included: female sex; age less than 25 years; non-Hispanic black race/ethnic-ity; Army branch of service; junior enlisted rank/grade; history of a mental health diag-nosis; history of alcohol-related disorders; and history of one or more deployments.
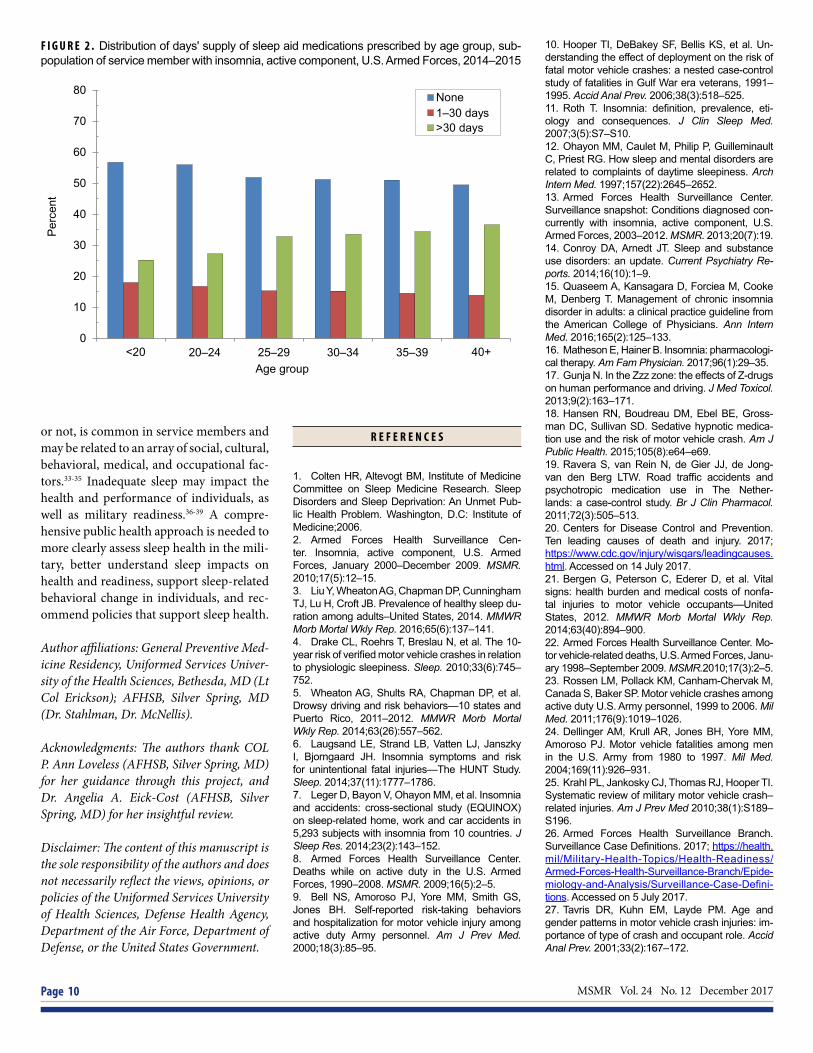
There were 23,160 individuals with incident insomnia diagnoses between 1 January 2014 and 31 December 2015 included in the subanalysis (Table 7). Of this subpopulation, 52.3% were not prescribed any sleep aid medications in the 365 days following their diagnosis, 15.3% were pre-scribed one to 30 days’ supply, and 32.4% were prescribed more than 30 days’ supply (Table 7). Some demographic and clinical subgroups were more likely to have been prescribed more than 30 days’ supply of sleep aid medications, compared with none or 1–30 days’ supply: older age groups, those with senior rank/grade, healthcare occupations, those with history of a mental health or alcohol-related disorder diagno-sis, and those with prior deployments (Table 7). Figure 2 shows the increasing percentage of those prescribed more than 30 days’ sup-ply of sleep aid medications within older age groups.
There were 537 cases of an MVA-related injury in the subpopulation, with an overall crude risk of 2.3% (Table 7). The crude risks
of MVA-related injury were similar for all exposure groups. In the log-linear model, there was no significant difference in risk of MVA-related injury between those who were prescribed one to 30 days’ supply of sleep aid medications (aRR: 1.05; 95% CI: 0.83–1.33) and those who were prescribed more than 30 days’ supply (aRR: 1.04; 95% CI: 0.86–1.26), compared to those not pre-scribed sleep aid medications, after adjust-ing for covariates (data not shown).
E D I T O R I A L C O M M E N T
This report documents that insomnia was associated with an increased rate of MVA-related injuries in active component U.S. military members between 2007 and 2016. This finding is consistent with prior studies in civilian populations,6,7 and adds to the knowledge base about MVA risk fac-tors in the U.S. Armed Forces. A subanalysis of those with insomnia diagnosed in 2014 and 2015 found no association between the days’ supply of sleep aid medications pre-scribed in the 365 days following diagnosis and risk of MVA-related injury.
The distribution of characteristics of those diagnosed with insomnia in this analysis was generally consistent with risk factors identified in the general popula-tion, with those diagnosed with insomnia
T A B L E 3 . Sleep aid prescription medica-tions
Drug (generic) name Brand name(s)
Eszopiclone Lunesta®
Zaleplon Sonata®
Zolpidem Ambien®
Zolpidem, extended release Ambien CR®
Zolpidem sublingual Intermezzo, Edluar®
Zolpidem tartrate Zolpimist®
Ramelteon Rozerem®
Suvorexant Belsomra®
Temazepam Restoril®
Triazolam Halcion®
Estazolam ProSom®
Doxepin Silenor®
F I G U R E 1 . Annual rates of motor vehicle accident–related injuries, active component service members with and without diagnoses of insomnia, U.S. Armed Forces, 2007–2016
0
10
20
30
40
2007 2008 2009 2010 2011 2012 2013 2014 2015 2016
Rat
e pe
r 1,0
00 p
-yr
InsomniaNo insomnia
Rat
e pe
r 1,0
00 p
-yrs

MSMR Vol. 24 No. 12 December 2017 Page 6
T A B L E 4 . Characteristics of study population,a active component, U.S. Armed Forces, 2007–2016
Insomnia No insomnia OverallN % N % N % p-value
Total 172,062 50.0 172,062 50.0 344,124 100.0Sex
Male 138,897 80.7 147,398 85.7 286,295 83.2 <.001Female 33,165 19.3 24,664 14.3 57,829 16.8
Age group<20 5,790 3.4 24,638 14.3 30,428 8.8 <.00120–24 49,727 28.9 63,504 36.9 113,231 32.925–29 41,268 24.0 37,038 21.5 78,306 22.830–34 25,862 15.0 20,917 12.2 46,779 13.635–39 22,946 13.3 13,895 8.1 36,841 10.740+ 26,469 15.4 12,070 7.0 38,539 11.2
Race/ethnicityNon-Hispanic white 102,857 59.8 105,463 61.3 208,320 60.5 <.001Non-Hispanic black 35,004 20.3 26,512 15.4 61,516 17.9Hispanic 19,749 11.5 22,282 13.0 42,031 12.2Other/unknown 14,452 8.4 17,805 10.4 32,257 9.4
ServiceArmy 108,367 63.0 68,546 39.8 176,913 51.4 <.001Air Force 17,487 10.2 37,695 21.9 55,182 16.0Navy 30,176 17.5 34,244 19.9 64,420 18.7Marine Corps 16,032 9.3 31,577 18.4 47,609 13.8
Military rank/gradeE1–E4 78,397 45.6 94,062 54.7 172,459 50.1 <.001E5–E9 77,044 44.8 49,812 29.0 126,856 36.9O1–O3 6,981 4.1 17,729 10.3 24,710 7.2O4–O10 6,986 4.1 8,233 4.8 15,219 4.4WO1–WO5 2,654 1.5 2,226 1.3 4,880 1.4
Primary occupational categoryInfantry/artillery/combat 32,788 19.1 26,753 15.6 59,541 17.3 <.001Armor/motor transport 7,164 4.2 5,400 3.1 12,564 3.7Pilot/air crew 1,625 0.9 5,965 3.5 7,590 2.2Repair/engineer 40,945 23.8 44,823 26.1 85,768 24.9Communications/intelligence 41,599 24.2 34,009 19.8 75,608 22.0Health care 20,348 11.8 12,116 7.0 32,464 9.4Other/unknown 27,593 16.0 42,996 25.0 70,589 20.5
History of mental health diagnosisb
No 109,794 63.8 161,399 93.8 271,193 78.8 <.001Yes 62,268 36.2 10,663 6.2 72,931 21.2
History of alcohol-related disorderNo 153,377 89.1 166,253 96.6 319,630 92.9 <.001Yes 18,685 10.9 5,809 3.4 24,494 7.1
Deployment historyNone 54,889 31.9 113,844 66.2 168,733 49.0 <.001One 56,713 33.0 27,983 16.3 84,696 24.6Two or more 60,460 35.1 30,235 17.6 90,695 26.4
Prior insomnia diagnosisc
No 168,938 98.2 171,782 99.8 340,720 99.0 <.001Yes 3,124 1.8 280 0.2 3,404 1.0
One or more more motor vehicle accident–related injuryNo 168,294 97.8 170,378 99.0 338,672 98.4 <.001Yes 3,768 2.2 1,684 1.0 5,452 1.6
a Time-varying covariates are the values at time of insomnia diagnosis or assignment to unexposed cohort.bPre-existing anxiety, depression, bipolar, or post-traumatic stress disordercAny diagnosis of insomnia prior to the study period

December 2017 Vol. 24 No. 12 MSMR Page 7
more likely to be older and female.1 The distribution of characteristics was also con-sistent with risk factors previously identi-fied in the U.S. Armed Forces, with those diagnosed with insomnia more likely to be in the Army and have a history of deploy-ment.2 This analysis found that a dispro-portionate number of those with insomnia were of enlisted rank/grade, especially senior enlisted, which has not previously been evaluated as a potential insomnia risk factor. It is possible that enlisted service members are more likely to experience shift work or stressors that can cause insomnia, or perhaps are more likely to seek care for insomnia than officers and warrant officers. Further consideration of enlisted rank as an insomnia risk factor is warranted.
There was an increased rate of MVA-related injuries in women overall, which was unexpected because men are typi-cally at higher risk for MVAs.9,22,23,27 How-ever, this analysis only considered non-fatal MVA-related injuries for which persons sought medical care. Prior studies that have focused on specific types of MVAs or spe-cific clinical outcomes (e.g., requiring hos-pitalization, fatal vs. non-fatal) have had inconsistent findings with respect to gender. Males tend to be at higher risk for higher-impact crashes, more severe clinical out-comes and death,22,27,28 but results of some studies suggest that females have higher rates of crashes per miles driven.27,29,30 In this analysis, it is possible that females experienced more MVAs of lower severity, and also may have been more likely to seek medical care for injuries. Given the known increased risk of insomnia in females, it is also possible that there were more females with undiagnosed insomnia in the unex-posed cohort compared to males, which could have contributed to the overall increased rate of MVA-related injuries in females.
This report has several limitations that should be considered when interpret-ing the results. Insomnia, as captured by clinical diagnostic codes, was likely under-diagnosed and not representative of the true amount of inadequate sleep within the population. Individuals with mental health conditions often have concurrent sleep problems that may not receive a separate diagnostic code. The potential for exposure
T A B L E 5 . Crude incidence rates and incidence rate ratios (IRRs) of motor vehicle ac-cident (MVA)-related injury in those with and without insomnia diagnoses, by subgroup, active component, U.S. Armed Forces, 2007–2016
Insomnia Cases of MVA-related injury
Incidence rate per 1,000 p-yr IRR
TotalNo 1,738 11.2 refYes 3,849 27.7 2.47
SexMale No 1,339 10.1 ref
Yes 2,943 26.4 2.61Female No 399 18.0 ref
Yes 906 33.0 1.84Age group
<20 No 284 12.5 refYes 179 41.8 3.36
20–24 No 752 13.3 refYes 1,484 38.6 2.90
25–29 No 341 10.3 refYes 986 29.6 2.87
30–34 No 182 9.6 refYes 498 22.8 2.38
35–39 No 100 7.9 refYes 374 18.8 2.38
40+ No 79 7.4 refYes 328 15.6 2.09
Race/ethnicityNon-Hispanic white No 958 10.1 ref
Yes 2,283 27.7 2.73Non-Hispanic black No 384 16.1 ref
Yes 820 28.7 1.78Hispanic No 241 11.9 ref
Yes 439 27.2 2.30Other/unknown No 155 9.6 ref
Yes 307 26.1 2.72Service
Army No 830 13.8 refYes 2,599 29.8 2.16
Navy No 353 10.4 refYes 381 27.3 2.63
Air Force No 302 9.6 refYes 538 21.5 2.24
Marine Corps No 253 8.8 refYes 331 26.4 3.02
Military rank/gradeE01–E04 No 1,107 13.2 ref
Yes 2,176 36.2 2.74E05–E09 No 497 11.1 ref
Yes 1,483 23.0 2.06O01–O03 No 82 4.9 ref
Yes 90 14.8 3.00O04–O10 No 37 4.9 ref
Yes 65 11.2 2.30W01–W05 No 15 7.6 ref
Yes 35 15.6 2.07Primary occupational category
Infantry/artillery/combat No 252 10.8 refYes 734 28.5 2.64
Armor/motor transport No 69 14.6 refYes 194 34.1 2.33
Pilot/air crew No 18 3.3 refYes 25 19.9 5.98
Repair/engineer No 474 11.8 refYes 908 27.7 2.34
Communications/intelligence No 389 12.8 refYes 877 25.8 2.02
Health care No 146 13.0 refYes 488 28.2 2.16
Other/unknown No 390 9.8 refYes 623 28.2 2.87
History of mental health diagnosisa
No No 1,574 10.8 refYes 2,205 24.7 2.29
Yes No 164 18.6 refYes 1,644 33.2 1.79
History of alcohol-related disorderNo No 1,661 11.1 ref
Yes 3,340 26.8 2.42Yes No 77 16.6 ref
Yes 509 36.0 2.17Deployment history
None No 1,010 9.7 refYes 1,372 31.9 3.28
One No 411 17.0 refYes 1,340 29.4 1.73
Two or more No 317 11.9 refYes 1137 22.6 1.90
aPre-existing anxiety, depression, bipolar, or post-traumatic stress disorder

MSMR Vol. 24 No. 12 December 2017 Page 8
T A B L E 6 . Adjusted incidence rate ratios (IRRs) of motor vehicle accident–related injury, active component service members, U.S. Armed Forces, 2007–2016
Adjusted IRRa 95% CI
InsomniaNo ref -Yes 2.08 1.95–2.22
SexMale ref -Female 1.37 1.28–1.46Age group<20 ref -20–24 0.97 0.87–1.0825–29 0.75 0.66–0.8430–34 0.61 0.53–0.7035–39 0.51 0.44–0.6040+ 0.46 0.39–0.54
Race/ethnicityNon-Hispanic white ref -Non-Hispanic black 1.17 1.10–1.26Hispanic 1.00 0.92–1.09Other 0.98 0.89–1.09
ServiceArmy ref -Navy 0.87 0.80–0.95Air Force 0.76 0.70–0.83Marine Corps 0.74 0.67–0.81
Military rank/gradeE01–E04 ref -E05–E09 0.89 0.82–0.96O01–O03 0.51 0.43–0.59O04–O10 0.59 0.48–0.74W01–W05 0.71 0.53–0.95
Primary occupational categoryInfantry/artillery/combat ref -Armor/motor transport 0.85 0.74–0.98Pilot/aircrew 0.75 0.54–1.05Repair/engineer 0.92 0.80–1.05Communications/intelligence 0.85 0.75–0.98Health care 0.93 0.81–1.08Other/unknown 0.87 0.75–0.99
History of mental health diagnosisb
No ref -Yes 1.39 1.31–1.48
History of alcohol-related disorderNo ref -Yes 1.25 1.14–1.36
Deployment historyNone ref -One 1.25 1.16–1.34Two or more 1.16 1.06–1.26
aAdjusted for all covariates in this tablebPre-existing anxiety, depression, bipolar, or post-traumatic stress disorder
misclassification could impact the dif-ference in rates of MVA-related injuries between cohorts.
There are potential insomnia treat-ments that were not considered in this anal-ysis. The primary analysis did not include any treatment information, and the sub-analysis did not include treatments other than prescribed sleep aid medications, such as behavioral therapies, over-the-counter medications, and off-label use of other med-ications. Treatments could have improved insomnia symptoms and thereby decreased MVA risk, or increased MVA risk due to medication side effects. This potential for confounding by treatment effect may have contributed to the lack of a significant dif-ference in MVA-related injury risk between medication groups in the subanalysis of those with insomnia.
The MVA-related injury outcome was based on ICD-9/ICD-10/STANAG codes reflecting cause of injury within medical encounters. Cause of injury coding is rec-ognized to be incomplete,21,31 so the rates of MVA-related injuries may be under-estimated. The transition from ICD-9 to ICD-10 in late 2015 may have contributed to the decreased rate of MVA-related inju-ries seen in 2016. ICD-10 includes hun-dreds more MVA-related cause of injury codes than ICD-9, which may have affected coding practices and decreased the assign-ment or accuracy of cause of injury codes. Although care was taken to exclude cause of injury codes that specifically indicated injury to a passenger, other included codes were non-specific and it is possible that some injuries included in the analysis were sustained when individuals were not driv-ers of the vehicle. Because only cause of injury codes were used to define cases, the types and severity of the injuries were not included. This analysis cannot estimate the actual impact of the MVA-related injuries on health and military readiness.
In summary, the findings of this report highlight insomnia as a potential risk fac-tor for MVA-related injuries, a high-prior-ity public health issue for the U.S. Armed Forces.32 MVA prevention efforts should address sleep with the same level of inten-sity applied to other recognized MVA risk factors. Inadequate sleep, whether accom-panied by a clinical diagnosis of insomnia

December 2017 Vol. 24 No. 12 MSMR Page 9
T A B L E 7 . Characteristics of subpopulationa of service members with insomnia diagnoses, active component, U.S. Armed Forces, 2014–2015
No meds 1–30 days' supply
>30 days' supply Total
N % N % N % N %Total 12,110 52.3 3,555 15.4 7,495 32.4 23,160 100.0SexMale 9,562 79.0 2,708 76.2 5,740 76.6 18,010 77.8Female 2,548 21.0 847 23.8 1,755 23.4 5,150 22.2
Age groupa
<20 375 3.1 119 3.4 167 2.2 661 2.920–24 3,013 24.9 902 25.4 1,469 19.6 5,384 23.325–29 2,603 21.5 770 21.7 1,646 22.0 5,019 21.730–34 2,158 17.8 643 18.1 1,412 18.8 4,213 18.235–39 2,036 16.8 580 16.3 1,374 18.3 3,990 17.240+ 1,925 15.9 541 15.2 1,427 19.0 3,893 16.8
Race/ethnicityNon-Hispanic white 6,317 52.2 1,829 51.5 4,035 53.8 12,181 52.6Non-Hispanic black 2,989 24.7 905 25.5 1,767 23.6 5,661 24.4Hispanic 1,679 13.9 487 13.7 993 13.3 3,159 13.6Other 1,125 9.3 334 9.4 700 9.3 2,159 9.3
ServiceArmy 7,333 60.6 2,051 57.7 4,534 60.5 13,918 60.1Navy 1,437 11.9 432 12.2 861 11.5 2,730 11.8Air Force 2,168 17.9 791 22.3 1,344 17.9 4,303 18.6Marine Corps 1,172 9.7 281 7.9 756 10.1 2,209 9.5
Military rank/gradeE01–E04 4,462 36.9 1,339 37.7 2,373 31.7 8,174 35.3E05–E09 6,260 51.7 1,740 49.0 4,046 54.0 12,046 52.0O01–O03 568 4.7 207 5.8 454 6.1 1,229 5.3O04–O10 535 4.4 196 5.5 439 5.9 1,170 5.1W01–W05 285 2.4 73 2.1 183 2.4 541 2.3
Primary occupational categoryInfantry/artillery/combat 1,860 15.4 475 13.4 1,100 14.7 3,435 14.8Armor/motor transport 455 3.8 97 2.7 287 3.8 839 3.6Pilot/aircrew 99 0.8 42 1.2 70 0.9 211 0.9Repair/engineer 2,968 24.5 831 23.4 1,632 21.8 5,431 23.5Communications/intelligence 3,344 27.6 1,031 29.0 2,015 26.9 6,390 27.6Health care 1,485 12.3 528 14.9 1,257 16.8 3,270 14.1Other/unknown 1,899 15.7 551 15.5 1,134 15.1 3,584 15.5
History of mental health diagnosisb
No 7,973 65.8 2,437 68.6 4,250 56.7 14,660 63.3Yes 4,137 34.2 1,118 31.5 3,245 43.3 8,500 36.7
History of alcohol-related disorderNo 11,008 90.9 3,279 92.2 6,760 90.2 21,047 90.9Yes 1,102 9.1 276 7.8 735 9.8 2,113 9.1
Deployment historyNone 4,023 33.2 1,278 36.0 2,259 30.1 7,560 32.6One 2,985 24.7 876 24.6 1,909 25.5 5,770 24.9Two or more 5,102 42.1 1,401 39.4 3,327 44.4 9,830 42.4
Motor vehicle accident–related injuryNo 11,831 97.7 3,471 97.6 7,321 97.7 22,623 97.7Yes 279 2.3 84 2.4 174 2.3 537 2.3
aTime-varying covariates are the values at time of insomnia diagnosis.bPre-existing anxiety, depression, bipolar, or post-traumatic stress disorder
MSMR Vol. 24 No. 12 December 2017 Page 10
or not, is common in service members and may be related to an array of social, cultural, behavioral, medical, and occupational fac-tors.33-35 Inadequate sleep may impact the health and performance of individuals, as well as military readiness.36-39 A compre-hensive public health approach is needed to more clearly assess sleep health in the mili-tary, better understand sleep impacts on health and readiness, support sleep-related behavioral change in individuals, and rec-ommend policies that support sleep health.
Author affiliations: General Preventive Med-icine Residency, Uniformed Services Univer-sity of the Health Sciences, Bethesda, MD (Lt Col Erickson); AFHSB, Silver Spring, MD (Dr. Stahlman, Dr. McNellis).
Acknowledgments: The authors thank COL P. Ann Loveless (AFHSB, Silver Spring, MD) for her guidance through this project, and Dr. Angelia A. Eick-Cost (AFHSB, Silver Spring, MD) for her insightful review.
Disclaimer: The content of this manuscript is the sole responsibility of the authors and does not necessarily reflect the views, opinions, or policies of the Uniformed Services University of Health Sciences, Defense Health Agency, Department of the Air Force, Department of Defense, or the United States Government.
R E F E R E N C E S
1. Colten HR, Altevogt BM, Institute of Medicine Committee on Sleep Medicine Research. Sleep Disorders and Sleep Deprivation: An Unmet Pub-lic Health Problem. Washington, D.C: Institute of Medicine;2006.2. Armed Forces Health Surveillance Cen-ter. Insomnia, active component, U.S. Armed Forces, January 2000–December 2009. MSMR. 2010;17(5):12–15.3. Liu Y, Wheaton AG, Chapman DP, Cunningham TJ, Lu H, Croft JB. Prevalence of healthy sleep du-ration among adults–United States, 2014. MMWR Morb Mortal Wkly Rep. 2016;65(6):137–141.4. Drake CL, Roehrs T, Breslau N, et al. The 10-year risk of verified motor vehicle crashes in relation to physiologic sleepiness. Sleep. 2010;33(6):745–752.5. Wheaton AG, Shults RA, Chapman DP, et al. Drowsy driving and risk behaviors—10 states and Puerto Rico, 2011–2012. MMWR Morb Mortal Wkly Rep. 2014;63(26):557–562.6. Laugsand LE, Strand LB, Vatten LJ, Janszky I, Bjorngaard JH. Insomnia symptoms and risk for unintentional fatal injuries—The HUNT Study. Sleep. 2014;37(11):1777–1786.7. Leger D, Bayon V, Ohayon MM, et al. Insomnia and accidents: cross-sectional study (EQUINOX) on sleep-related home, work and car accidents in 5,293 subjects with insomnia from 10 countries. J Sleep Res. 2014;23(2):143–152.8. Armed Forces Health Surveillance Center. Deaths while on active duty in the U.S. Armed Forces, 1990–2008. MSMR. 2009;16(5):2–5.9. Bell NS, Amoroso PJ, Yore MM, Smith GS, Jones BH. Self-reported risk-taking behaviors and hospitalization for motor vehicle injury among active duty Army personnel. Am J Prev Med. 2000;18(3):85–95.
10. Hooper TI, DeBakey SF, Bellis KS, et al. Un-derstanding the effect of deployment on the risk of fatal motor vehicle crashes: a nested case-control study of fatalities in Gulf War era veterans, 1991–1995. Accid Anal Prev. 2006;38(3):518–525.11. Roth T. Insomnia: definition, prevalence, eti-ology and consequences. J Clin Sleep Med. 2007;3(5):S7–S10.12. Ohayon MM, Caulet M, Philip P, Guilleminault C, Priest RG. How sleep and mental disorders are related to complaints of daytime sleepiness. Arch Intern Med. 1997;157(22):2645–2652.13. Armed Forces Health Surveillance Center. Surveillance snapshot: Conditions diagnosed con-currently with insomnia, active component, U.S. Armed Forces, 2003–2012. MSMR. 2013;20(7):19.14. Conroy DA, Arnedt JT. Sleep and substance use disorders: an update. Current Psychiatry Re-ports. 2014;16(10):1–9.15. Quaseem A, Kansagara D, Forciea M, Cooke M, Denberg T. Management of chronic insomnia disorder in adults: a clinical practice guideline from the American College of Physicians. Ann Intern Med. 2016;165(2):125–133.16. Matheson E, Hainer B. Insomnia: pharmacologi-cal therapy. Am Fam Physician. 2017;96(1):29–35.17. Gunja N. In the Zzz zone: the effects of Z-drugs on human performance and driving. J Med Toxicol. 2013;9(2):163–171.18. Hansen RN, Boudreau DM, Ebel BE, Gross-man DC, Sullivan SD. Sedative hypnotic medica-tion use and the risk of motor vehicle crash. Am J Public Health. 2015;105(8):e64–e69.19. Ravera S, van Rein N, de Gier JJ, de Jong-van den Berg LTW. Road traffic accidents and psychotropic medication use in The Nether-lands: a case-control study. Br J Clin Pharmacol. 2011;72(3):505–513.20. Centers for Disease Control and Prevention. Ten leading causes of death and injury. 2017; https://www.cdc.gov/injury/wisqars/leadingcauses.html. Accessed on 14 July 2017.21. Bergen G, Peterson C, Ederer D, et al. Vital signs: health burden and medical costs of nonfa-tal injuries to motor vehicle occupants—United States, 2012. MMWR Morb Mortal Wkly Rep. 2014;63(40):894–900.22. Armed Forces Health Surveillance Center. Mo-tor vehicle-related deaths, U.S. Armed Forces, Janu-ary 1998–September 2009. MSMR.2010;17(3):2–5.23. Rossen LM, Pollack KM, Canham-Chervak M, Canada S, Baker SP. Motor vehicle crashes among active duty U.S. Army personnel, 1999 to 2006. Mil Med. 2011;176(9):1019–1026.24. Dellinger AM, Krull AR, Jones BH, Yore MM, Amoroso PJ. Motor vehicle fatalities among men in the U.S. Army from 1980 to 1997. Mil Med. 2004;169(11):926–931.25. Krahl PL, Jankosky CJ, Thomas RJ, Hooper TI. Systematic review of military motor vehicle crash–related injuries. Am J Prev Med 2010;38(1):S189–S196.26. Armed Forces Health Surveillance Branch. Surveillance Case Definitions. 2017; https://health.mil/Military-Health-Topics/Health-Readiness/Armed-Forces-Health-Surveillance-Branch/Epide-miology-and-Analysis/Surveillance-Case-Defini-tions. Accessed on 5 July 2017.27. Tavris DR, Kuhn EM, Layde PM. Age and gender patterns in motor vehicle crash injuries: im-portance of type of crash and occupant role. Accid Anal Prev. 2001;33(2):167–172.
F I G U R E 2 . Distribution of days' supply of sleep aid medications prescribed by age group, sub-population of service member with insomnia, active component, U.S. Armed Forces, 2014–2015
0
10
20
30
40
50
60
70
80
<20 20–24 25–29 30–34 35–39 40+
Perc
ent
Age group
None1–30 days >30 days

December 2017 Vol. 24 No. 12 MSMR Page 11
28. Beck LF, Dellinger AM, O'Neil ME. Motor ve-hicle crash injury rates by mode of travel, United States:using exposure-based methods to quantify differences. Am J Epidemiol. 2007;166(2):212–218.29. Massie DL, Campbell KL, Williams AF. Traffic accident involvement rates by driver age and gen-der. Accid Anal Prev. 1995;27(1):73–87.30. Massie DL, Green PE, Campbell KL. Crash involvement rates by driver gender and the role of average annual mileage. Accid Anal Prev. 1997;29(5):675–685.31. Canham-Chervak M, Hooper TI, Brennan FH Jr., et al. A systematic process to prioritize prevention activities: sustaining progress toward the reduction of military injuries. Am J Prev Med. 2010;38(1):S11–S18.
32. Angello JJ, Smith JW. The military accident and injury prevention challenge. Am J Prev Med. 2010;38(1):S212–S213.33. Pedersen ER, Troxel WM, Shih RA, Pinder E, Lee D, Geyer L. Increasing resilience through pro-motion of healthy sleep among service members. Mil Med. 2015;180(1):4–6.34. Bramoweth AD, Germain A. Deployment- related insomnia in military personnel and veter-ans. Curr Psychiatry Rep. 2013;15(10):1–8.35. Luxton DD, Greenburg D, Ryan J, Niven A, Wheeler G, Mysliwiec V. Prevalence and impact of short sleep duration in redeployed OIF soldiers. Sleep. 2011;34(9):1189–1195.36. Lewis PE, Emasealu OV, Rohrbeck P, Hu Z. Risk of type II diabetes and hypertension associ-
ated with chronic insomnia among active com-ponent, U.S. Armed Forces, 1998–2013. MSMR 2014;21(10):6–13.37. LoPresti ML, Anderson JA, Saboe KN, McGurk DL, Balkin TJ, Sipos ML. The impact of insufficient sleep on combat mission performance. Mil Behav Health. 2016;4(4):356.38. Williams SG, Collen J, Wickwire E, Lettieri CJ, Mysliwiec V. The impact of sleep on soldier perfor-mance. Curr Psychiatry Rep. 2014;16(8):1–13.39. Lentino CV, Purvis DL, Murphy KJ, Deuster PA. Sleep as a component of the performance triad: the importance of sleep in a military population. US Army Med Dept J. 2013 Oct–Dec:98–108.
MSMR Vol. 24 No. 12 December 2017 Page 12
Traumatic brain injury (TBI) is a known risk factor for seizures. Evidence also shows that post-traumatic stress disorder (PTSD) is associated with seizures, but the relationship in the absence of TBI remains unclear. This retrospective study spanning 2007–2016 separately quantifies the rates of seizures diagnosed among deployed and non-deployed active component military service members to understand the factors associated with seizures and whether they differ in deployed settings. Higher rates of seizures were associated with service members who were in the Army or Marine Corps; female; black; younger; lower enlisted; in a combat-specific, armor/motor transport, or healthcare occupation; and who had no more than one previ-ous deployment. These associations were similar among both deployed and non-deployed service members. Either a TBI or recent PTSD diagnosis was associated with a 3- to 4-fold increased seizure rate. For service members who had received both diagnoses, seizure rates among the deployed and the non-deployed were two and three times the rates among those with only one of those diagnoses, respectively. If the current results are supported by future investigations, there may be implications for both clinical care and military policy.
Seizures Among Active Component Service Members, U.S. Armed Forces, 2007–2016Julie A. Bytnar, MPH (SGT, USA); Shauna Stahlman, PhD, MPH; Saixia Ying, PhD
Seizures have been defined as parox-ysmal neurologic episodes caused by abnormal neuronal activity in the
brain.1 Epilepsy is a condition that can cause seizures from abnormal brain activ-ity. However, not all seizures are due to epilepsy. Some seizures may instead be triggered by reversible insults to the brain (e.g., fever or trauma). Known risk factors for epilepsy include central nervous sys-tem disease or infections, head injury, and family history. These factors can differ from transient or temporary triggers for indi-vidual seizures such as traumatic events, exposure to chemicals, and some medical conditions.2-5
Seizures may also have psychological origins as in the case of psychogenic non-epileptic seizures (PNES). There is evi-dence that former psychological trauma and post-traumatic stress disorder (PTSD)
may be associated with PNES.6-9 It is often difficult to determine the causes of seizures and therefore to diagnose epilepsy, which is usually treated with antiepileptic medi-cations. It is common for a PNES patient to receive years of inappropriate treatment prior to receiving an accurate diagno-sis.1,10,11 It can be difficult to clarify the etio-logic nature and the diagnosis of a seizure disorder because epileptic seizures are also related to behavioral health concerns such as PTSD, depression, and anxiety.1,7,11
Approximately one in 10 individu-als will experience a seizure in their life-time.2 The risk of recurrence following an initial unprovoked seizure has been esti-mated at 40%–52%; the risk increases to 73% after two unprovoked seizures.12 The age-adjusted prevalence of epilepsy among Iraq and Afghanistan War veterans is 6.1 cases per 1,000 persons; this rate is lower
than the rate among the general U.S. pop-ulation of 10 cases per 1,000.11,13,14 The incidence rate among active component military members in 2012 was approxi-mately 4.7 cases per 10,000 person-years (p-yrs), which represented a decline from a high of 7.5 cases per 10,000 p-yrs in 2010.15 In 2007, the incidence rate of epilepsy in the general U.S. population was estimated to be 4.8 cases per 10,000 p-yrs.5
Traumatic brain injury (TBI) is rec-ognized as one of the contributing causes of epilepsy.1,5,14,15 The Centers for Disease Control and Prevention estimated the rate of TBI in the U.S. population as 82.4 inci-dents per 10,000 p-yrs.16 Before the wars in Iraq and Afghanistan, the TBI rate among U.S. military personnel was similar to the civilian rate but it has since more than dou-bled to 181.1 cases per 10,000 p-yrs, with the largest increases occurring among active component soldiers and Marines.17 An estimated one-third of those in the mil-itary diagnosed with TBI also had PTSD, but that estimate doubled among Iraq and Afghanistan war veterans.11,17 Studies have shown that PTSD may have affected 8.6%–14% of veterans of Operation Endur-ing Freedom and Operation Iraqi Freedom (OEF/OIF).18,19 In contrast, it is estimated that only 3.5% of the adult U.S. population has PTSD.20
Seizures of all etiologies among military service members are an important concern, as evidenced by Congress establishing the Veterans Health Administration Epilepsy Centers of Excellence in 2008. Department of Defense induction standards mandate that individuals must be seizure free with-out medications for 5 years and have nor-mal EEG and neurologic exams before they are eligible for military service.21 Retention standards are more lenient in that service members can continue to serve provided they remain seizure free with medication. However, seizure disorders are considered

December 2017 Vol. 24 No. 12 MSMR Page 13
deployment-limiting conditions. For exam-ple, in the Army, soldiers must remain sei-zure free for a minimum of 1 year before they are eligible to deploy.22
Although TBI has received increased levels of scrutiny in the military and the association between seizures, TBI, and PTSD has been acknowledged, the extent to which other potential risk factors, such as PTSD alone, may be associated with seizures remains to be thoroughly evalu-ated. This report attempts to bridge that knowledge gap by determining the inci-dence rates and correlates of seizures among active component military service members. Deployed service members are exposed to different environmental and occupational factors and must maintain a higher standard of medical readiness. Sepa-rate analyses were performed on deployed service members and on non-deployed ser-vice members to determine whether there are differences between the two groups in the factors that may be associated with the occurrence of seizures.
M E T H O D S
This retrospective cohort study spanned a surveillance period from 1 Janu-ary 2007 through 31 December 2016. The study population included all individuals who served in active components of the Army, Navy, Air Force, or Marine Corps at any time during the surveillance period. Data were retrieved from the Defense Medical Surveillance System (DMSS) from records of both ambulatory encounters and hospitalizations of active component mem-bers of the U.S. Armed Forces in fixed mili-tary treatment facilities and civilian sources of purchased care. The secondary analysis included members of the study population during periods of deployment to OEF, OIF, or Operation New Dawn (OND). Due to incomplete medical encounter data dur-ing deployments in 2007, the secondary analysis utilized data from 1 January 2008 through 31 December 2016.
The outcome variable was diagnoses of seizure events documented in the first or second diagnostic position of health-care records (Table 1). Both epileptic and
non-epileptic seizure events were included. For the primary analysis, the diagnosis must have been documented in the record of a hospitalization or an encounter in an urgent or emergency care facility within the military healthcare system (as defined by the Medical Expense and Performance Reporting System [MEPRS] codes BIA or BHI). Limiting the case definition to hos-pitalizations and emergency settings was intended to minimize the inclusion of encounters for routine or follow-up seizure care. This primary analysis used outcomes and person-time derived from periods not spent on OEF, OIF, or OND deployments. Incidence rates were calculated as the num-ber of cases per 10,000 p-yrs.
Febrile seizures (ICD-9: 780.31, 780.32; ICD-10: R56.00, R56.01) were excluded from consideration as such seizures are pri-marily diagnosed in young children and at a very low rate (0.65 cases per 10,000 p-yrs) in the active component.23 The sec-ondary analysis allowed seizure diagnoses to be made during any type of deployed medical encounter as documented in the records of the Theater Medical Data Store (TMDS). During deployment, individuals
were eligible to be counted as a seizure case only once every 30 days. This restric-tion was applied to reduce the likelihood of counting follow-up care because in-theater records did not have MEPRS codes avail-able to determine emergency care.
In addition to demographic and mili-tary factors, the primary covariates of inter-est were the diagnoses of PTSD and/or TBI. For the purpose of this analysis, an incident PTSD case was defined by a record of an ICD-9 or ICD-10 code for PTSD in the first or second diagnostic position of a record of any one of the following: 1) one hospitaliza-tion, or 2) two outpatient medical encoun-ters (or deployment medical encounters) within 180 days of each other, or 3) one outpatient medical encounter in a psychi-atric or mental healthcare facility (Table 1). The at-risk period for a seizure event fol-lowing a diagnosis of PTSD was restricted to 365 days following the incident PTSD diagnosis, as well as 365 days following any medical encounter with PTSD listed in any diagnostic position, as long as the individual was previously diagnosed as an incident case. TBI was defined as either: 1) one hospitalization, or 2) one outpatient
T A B L E 1 . ICD-9/ICD-10 diagnostic codes for post-traumatic stress disorder (PTSD), seizures, and traumatic brain injury (TBI)
ICD-9 ICD-10
PTSD 309.81 F43.1, F43.10, F43.11, F43.12
Epileptic seizures 345.*, 649.4*, G40.*
Non-epileptic seizures 780.33, 780.39 F44.5, R56.1, R56.9
TBI 310.2, 800.0*804.*, 850.0–850.9, 850.11, 850.12, 851.*–854.*, 905.0, 907.0, 950.1–950.3, 950.01, 959.01, V15.5, V15.52, V15.59, V80.01
F07.81, S04.02–S04.04, S04.06, S04.02X, S04.02XA, S04.031, S04.031A, S04.032, S04.032A, S04.039, S04.039A, S04.041, S04.041A, S04.042, S04.042A, S04.049, S04.049A, S06.0X0–S06.0X9, S06.0X0A–S06.0X9A, S06.1X–S06.2X, S06.1X0–S06.2X0, S06.1X0A–S06.2X9A, S06.30–S06.38, S06.300–S389, S06.300A–S06.389A, S06.4X–S06.6X, S06.4X0–S06.6X9, S06.4X0A–S06.4X9A, S06.89, S06.890–S06.899, S06.890A–S06.899A, S06.9X, S06.9X0–S06.9X9, S06.9X0A–S06.9X9A, S06.9X9S, S02.0–S02.11, S02.19, S02.111–S02.113, S02.119, S02.0XXA, S02.0XXB, S02.10XA, S02.10XB, S02.110A–S02.113A, S02.110B–S02.113B, S02.118A, S02.118B, S02.119A, S02.119B, S02.19XA, S02.19XB, S02.8, S02.9, S02.8XXA, S02.8XXB, S02.91, S02.91XA, S02.91XB, S07.1, S07.1XXA, Z87.820
*Asterisk denotes any digit/character in this and any subsequent position.
MSMR Vol. 24 No. 12 December 2017 Page 14
medical encounter, or 3) one deployment medical encounter with a qualifying TBI ICD-9 or ICD-10 diagnosis in any diagnos-tic position (Table 1). The at-risk period for a seizure event following a TBI diagnosis extended through the surveillance period. Additional covariates included sex, race, age, rank, service branch, and number of previous deployments.
Crude incidence rates were calcu-lated for seizures diagnosed among cur-rently non-deployed and among currently deployed service members. Because the etiology of seizures is complex and mul-tifactorial, crude incidence rates were ini-tially stratified by type of seizure. However, results for this stratified analysis failed to yield new information or patterns and were therefore not presented in this report. To better understand the relationship between having been recently diagnosed with PTSD without TBI and subsequent seizures, crude incidence rates of seizures were also calculated among a population of service members without any history of TBI. A multivariable Poisson regression model was used with a 5% random sample of ser-vice members to calculate the incidence rate ratios for seizure events diagnosed during OIF, OEF, and OND deployments after adjusting for service branch, race, age group, military occupation, previous deployments, TBI diagnosis, and recent PTSD diagnosis. As part of a sensitivity analysis, the model was also run on a non-deployed population who had no prior his-tory of seizure. All statistical analyses were conducted using SAS 9.4 (SAS Institute Inc, Cary, NC).
R E S U L T S
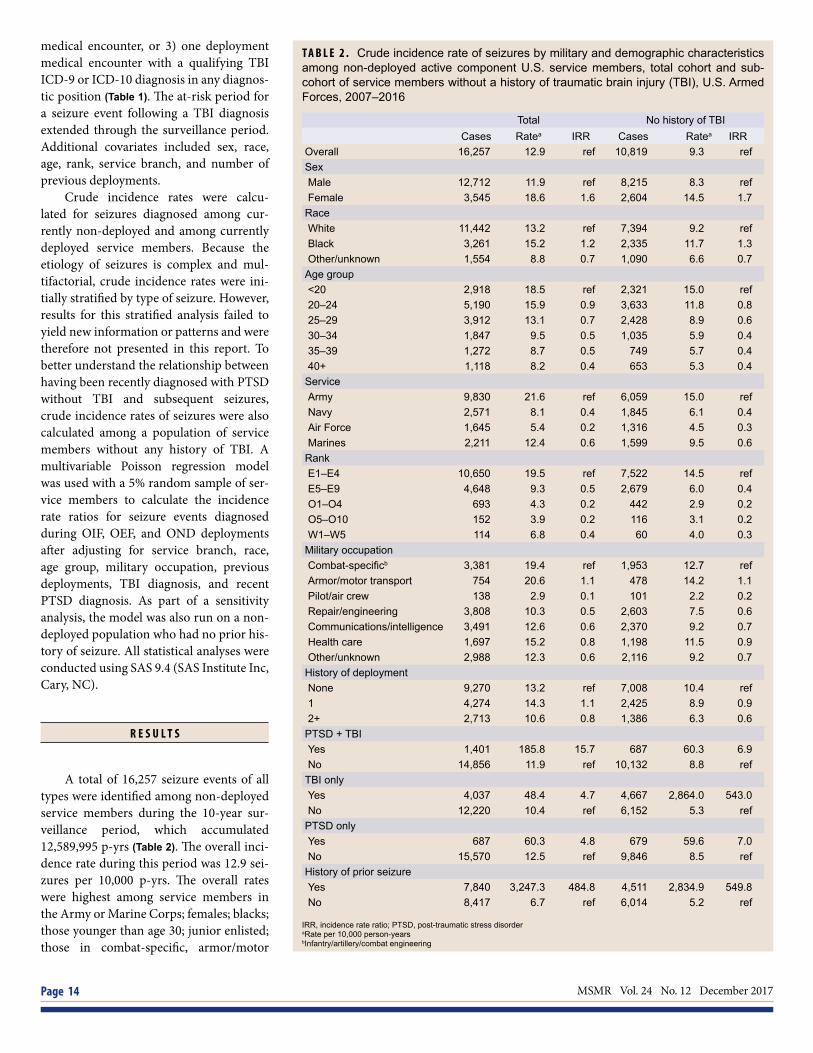
A total of 16,257 seizure events of all types were identified among non-deployed service members during the 10-year sur-veillance period, which accumulated 12,589,995 p-yrs (Table 2). The overall inci-dence rate during this period was 12.9 sei-zures per 10,000 p-yrs. The overall rates were highest among service members in the Army or Marine Corps; females; blacks; those younger than age 30; junior enlisted; those in combat-specific, armor/motor
T A B L E 2 . Crude incidence rate of seizures by military and demographic characteristics among non-deployed active component U.S. service members, total cohort and sub-cohort of service members without a history of traumatic brain injury (TBI), U.S. Armed Forces, 2007–2016
Total No history of TBI Cases Ratea IRR Cases Ratea IRR
Overall 16,257 12.9 ref 10,819 9.3 refSexMale 12,712 11.9 ref 8,215 8.3 refFemale 3,545 18.6 1.6 2,604 14.5 1.7
RaceWhite 11,442 13.2 ref 7,394 9.2 refBlack 3,261 15.2 1.2 2,335 11.7 1.3Other/unknown 1,554 8.8 0.7 1,090 6.6 0.7
Age group<20 2,918 18.5 ref 2,321 15.0 ref20–24 5,190 15.9 0.9 3,633 11.8 0.825–29 3,912 13.1 0.7 2,428 8.9 0.630–34 1,847 9.5 0.5 1,035 5.9 0.435–39 1,272 8.7 0.5 749 5.7 0.440+ 1,118 8.2 0.4 653 5.3 0.4
ServiceArmy 9,830 21.6 ref 6,059 15.0 refNavy 2,571 8.1 0.4 1,845 6.1 0.4Air Force 1,645 5.4 0.2 1,316 4.5 0.3Marines 2,211 12.4 0.6 1,599 9.5 0.6
RankE1–E4 10,650 19.5 ref 7,522 14.5 refE5–E9 4,648 9.3 0.5 2,679 6.0 0.4O1–O4 693 4.3 0.2 442 2.9 0.2O5–O10 152 3.9 0.2 116 3.1 0.2W1–W5 114 6.8 0.4 60 4.0 0.3
Military occupationCombat-specificb 3,381 19.4 ref 1,953 12.7 refArmor/motor transport 754 20.6 1.1 478 14.2 1.1Pilot/air crew 138 2.9 0.1 101 2.2 0.2Repair/engineering 3,808 10.3 0.5 2,603 7.5 0.6Communications/intelligence 3,491 12.6 0.6 2,370 9.2 0.7Health care 1,697 15.2 0.8 1,198 11.5 0.9Other/unknown 2,988 12.3 0.6 2,116 9.2 0.7
History of deploymentNone 9,270 13.2 ref 7,008 10.4 ref1 4,274 14.3 1.1 2,425 8.9 0.92+ 2,713 10.6 0.8 1,386 6.3 0.6
PTSD + TBIYes 1,401 185.8 15.7 687 60.3 6.9No 14,856 11.9 ref 10,132 8.8 ref
TBI onlyYes 4,037 48.4 4.7 4,667 2,864.0 543.0No 12,220 10.4 ref 6,152 5.3 ref
PTSD onlyYes 687 60.3 4.8 679 59.6 7.0No 15,570 12.5 ref 9,846 8.5 ref
History of prior seizureYes 7,840 3,247.3 484.8 4,511 2,834.9 549.8No 8,417 6.7 ref 6,014 5.2 ref
IRR, incidence rate ratio; PTSD, post-traumatic stress disorderaRate per 10,000 person-yearsbInfantry/artillery/combat engineering

December 2017 Vol. 24 No. 12 MSMR Page 15
transport, or healthcare occupations; and those with a history of only one deploy-ment. During the surveillance period, the annual rates increased from 13.9 seizures per 10,000 p-yrs in 2007 to a peak of 15.1 seizures per 10,000 p-yrs in 2011. Rates reached their lowest point in 2015 (9.0 sei-zures per 10,000 p-yrs) (Figure 1). Annual rates were markedly higher among service members with recent PTSD and TBI diag-noses, and among those with prior seizure diagnoses (Table 2, Figure 2). Approximately half (55%) of individuals experienced only one seizure during the surveillance period, 19% experienced two, and 26% experienced three or more (data not shown). When sei-zure rates were stratified by epileptic ver-sus non-epileptic seizures, the same overall demographic patterns were observed (data not shown). The rate of non-epileptic sei-zures was higher (7.8 seizures per 10,000 p-yrs) than epileptic (5.1 seizures per 10,000 p-yrs) among the non-deployed. However, among those diagnosed with a seizure during deployment, the epileptic rate was higher (5.4 seizures per 10,000 p-yrs) than the non-epileptic rate (3.7 sei-zures per 10,000 p-yrs) (Table 3).
The results of the multivariable Pois-son model indicated that history of PTSD, TBI, and both, as well as military branch, sex, and deployment history were signifi-cantly positively associated with seizures of all types after controlling for all other fac-tors (Table 4). The adjusted incidence rate ratio (aIRR) for those with a previous TBI diagnosis (without a recent PTSD diagno-sis) was 4.9, and the aIRR ratio for those with a recent PTSD diagnosis (without any history of TBI) was 5.9. However, for those with a diagnosis of both PTSD and TBI, the aIRR was 15.6.
A total of 814 cases of seizures were identified during deployment among mili-tary service members deployed to Iraq and Afghanistan during the 9-year surveillance period (2008–2016), which accumulated 897,768 p-yrs (Table 5). For deployed ser-vice members, the overall incidence rate was 9.1 seizures per 10,000 p-yrs. Over-all incidence rates among deployed ser-vice members were highest for those in the Army; females; those younger than age 25; junior enlisted; and in healthcare occupa-tions. The annual rates of seizures among
T A B L E 3 . Distribution of seizures by type and crude incidence rate stratified by seizure types of two active active component U.S. military populations
F I G U R E 1 . Annual crude incidence rates of seizures among non-deployed active component service members, U.S. Armed Forces, 2007–2016
F I G U R E 2 . Annual crude incidence rates of seizures by traumatic brain injury (TBI) and recent post-traumatic stress disorder (PTSD) diagnosis among non-deployed active component ser-vice members, U.S. Armed Forces, 2007–2016
0.0
2.0
4.0
6.0
8.0
10.0
12.0
14.0
16.0
2007 2008 2009 2010 2011 2012 2013 2014 2015 2016R
ate
per 1
0,00
0 p-
yrs
Overall rate = 12.91
0.0
100.0
200.0
300.0
400.0
500.0
2007 2008 2009 2010 2011 2012 2013 2014 2015 2016
Rat
e pe
r 10,
000
p-yr
s
PTSD + TBITBI onlyPTSD onlyOverall
Epileptic seizures Non-epileptic seizures
Cases % Ratea Cases % Ratea
Non-deployed service members 6,433 40 5.1 9,824 60 7.8
Service members deployed to Iraq or Afghanistan 482 59 5.4 332 41 3.7aRate per 10,000 person-years

MSMR Vol. 24 No. 12 December 2017 Page 16
deployed service members remained fairly stable from 2008 (9.8 seizures per 10,000 p-yrs) through 2011 (9.9 seizures per 10,000 p-yrs) and then declined to their lowest value in 2016 (4.0 seizures per
10,000 p-yrs) (Figure 3). The annual rates of seizures stratified by other demographic and military characteristics followed a sim-ilar pattern (data not shown). As with the non-deployed cohort, seizure rates were
elevated in deployed service members with a TBI diagnosis, recent PTSD diagnosis, and prior seizures (Table 5).
Several sensitivity analyses were car-ried out to assess the robustness of the results (data not shown). A 30-day incidence rule for the ascertainment of seizures was used in the analysis of the non-deployed population. The resulting seizure rates were predictably lower, but the patterns were similar to those obtained from the previous analyses. When a Poisson model was used with the non-deployed population without a prior history of seizures or TBI, a history of PTSD remained positively associated with incident seizure events (aIRR=6.3, p<.001) (data not shown).
E D I T O R I A L C O M M E N T
This report documents a decrease in the rate of seizures diagnosed in the active component of the military during a 10-year period. The decrease was evident in popu-lations whose seizures were diagnosed dur-ing periods of non-deployment as well as in service members deployed to Iraq or Afghanistan. The initially stable annual seizure rates in both populations began a gradual decrease after 2011 to current rates. The declines in rates accompanied the changing size and missions of the mili-tary in both Iraq and Afghanistan.
The highest rates of seizures were found among soldiers and Marines, who share similar military combat missions. The rate was also significantly higher among females. This finding may be due to the higher rate of idiopathic general-ized epilepsy and PNES among females.24,25 The demographic and temporal pat-terns of seizure incidence were similar in non-deployed service members and in a deployed population.
One pronounced difference between the two populations was the increased risk of seizures diagnosed during deployment among healthcare workers. Prior stud-ies have indicated that healthcare workers are at higher risk for developing PTSD in a deployed environment.26,27 Medical per-sonnel had the same level of risk as service members in other occupations who leave
T A B L E 4 . Adjusted incidence rate ratios (aIRRs) of seizures by military and demograph-ic characteristics among non-deployed active component U.S. service members, U.S. Armed Forces, 2007–2016
Total
aIRR 95% CI p-value
Sex
Male ref - - -
Female 1.66 1.18 2.34 .004
Race
White ref - - -
Black 1.10 0.73 1.66 .655
Other 0.86 0.48 1.53 .610
Age group
<20 ref - - -
20–24 0.62 0.41 0.93 .020
25–29 0.59 0.35 0.99 .046
30–34 0.32 0.19 0.56 <.0001
35–39 0.38 0.19 0.75 .005
40+ 0.26 0.15 0.47 <.0001
Service
Army ref - - -
Navy 0.44 0.26 0.73 .002
Air Force 0.31 0.20 0.47 <.0001
Marines 0.75 0.50 1.11 .148
Military occupation
Combat-specifica ref - - -
Health care 1.16 0.65 2.05 .619
Other/unknown 0.76 0.51 1.15 .199
History of deployment
None ref - - -
1 0.89 0.60 1.33 .578
2+ 0.55 0.36 0.85 .007
PTSD + TBI
Yes 15.65 8.79 27.86 <.0001
No ref - - -
TBI only
Yes 4.91 3.28 7.34 <.0001
No ref - - -
PTSD only
Yes 5.90 3.14 11.08 <.0001
No ref - - -
PTSD, post-traumatic stress disorder; TBI, traumatic brain injuryaInfantry/artillery/combat engineering

December 2017 Vol. 24 No. 12 MSMR Page 17
the relative safety of the forward operat-ing bases. It should be noted that health-care workers were often uniquely exposed to multiple traumas and deaths while work-ing in medical facilities during a combat deployment. They also had higher access to medical care resulting in a greater chance of receiving a diagnosis.
Having either a TBI or recent PTSD diagnosis alone was associated with a 3- to 4-fold increase in the rate of seizures. Compared to service members with TBI or PTSD alone, among service members who had been previously diagnosed with both TBI and PTSD, the seizure rate doubled among the deployed population and more than tripled among those not currently deployed. There appeared to be a greater than additive association between TBI and recent diagnoses of PTSD on subsequent seizure occurrence, at least among the non-deployed service members. The effects of recent PTSD and TBI were attenuated in the deployed population. The apparent reduced level of interaction between the two exposures during deployment may be due in part to the small number of cases identified. Only 19 cases of seizures were diagnosed among deployed individuals with a recent PTSD diagnosis during the 9-year surveillance period.
This study was limited by the use of administrative data. Seizure events identi-fied here may not have represented unique incidents of seizures but may have included follow-up care. Specifying only emergency clinic encounters and hospitalizations was designed to minimize this limitation. Pre-liminary analysis stratifying by seizure type did not yield differences in the pat-terns of seizure rates in this study. Medi-cal providers may misdiagnose as seizures the pseudoseizures of PNES. The resul-tant administrative records of such diag-noses may reflect the misclassification of seizure type, introducing a greater degree of uncertainty into the results of stratified analyses. Stratified results were therefore not presented. Administrative records also may not capture all seizures because some individuals who suffer from multiple sei-zures often do not seek treatment for each episode.
Some selection bias may be intro-duced because only direct care encounters
T A B L E 5 . Crude incidence rates of seizures diagnosed during deployment, by military and demographic characteristics, among service members deployed to Operation En-during Freedom, Operation Iraqi Freedom, and Operation New Dawn: total cohort and subcohort of service members without a history of traumatic brain injury (TBI), U.S. Armed Forces, 2008–2016
All No history of TBI Cases Ratea IRR Cases Ratea IRR
Overall 814 9.1 ref 657 7.8 refSexMale 683 8.5 ref 544 7.2 refFemale 131 14.4 1.7 113 13.1 1.8
RaceWhite 601 9.3 ref 483 8.0 refBlack 145 9.8 1.1 113 8.1 1.0Other 68 6.4 0.7 61 6.1 0.8
Age group<20 88 10.6 ref 81 10.0 ref20–24 295 10.8 1.0 245 9.4 0.925–29 222 9.3 0.9 168 7.6 0.830–34 114 8.5 0.8 89 7.2 0.735–39 58 6.1 0.6 45 5.1 0.540+ 37 5.0 0.5 29 4.3 0.4
ServiceArmy 696 11.9 ref 555 10.3 refNavy 21 4.3 0.4 18 3.8 0.4Air Force 46 3.1 0.3 44 3.1 0.3Marines 51 4.4 0.4 40 3.6 0.3
RankE1–E4 478 11.4 ref 399 9.9 refE5–E9 275 8.2 0.7 206 6.7 0.7O1–O4 47 4.4 0.4 42 4.2 0.4O5–O10 7 4.2 0.4 4 2.5 0.3W1–W5 7 3.7 0.3 6 3.4 0.3
Military occupationCombat-specificb 229 10.1 ref 184 8.9 refArmor/motor transport 40 10.9 1.1 33 9.7 1.1Pilot/air crew 3 0.9 0.1 3 0.9 0.1Repair/engineering 155 7.1 0.7 123 5.9 0.7Communications/intelligence 182 9.0 0.9 144 7.6 0.9Health care 106 19.3 1.9 89 17.2 1.9Other/unknown 99 7.9 0.8 81 6.8 0.8
PTSD and TBIYes 9 55.3 6.2 - - -No 805 9.0 ref - - -
TBI onlyYes 148 27.6 3.5 - - -No 666 7.9 ref - - -
PTSD onlyYes 10 26.1 2.9 10 26.1 3.4No 804 9.0 ref 647 7.7 ref
History of prior seizureYes 167 1,356.4 188.0 121 1,290.9 202.7No 647 7.2 ref 536 6.4 ref
IRR, incidence rate ratio; PTSD, post-traumatic stress disorderaRate per 10,000 person-yearsbInfantry/artillery/combat engineering

MSMR Vol. 24 No. 12 December 2017 Page 18
at military treatment facilities were consid-ered for this analysis. This methodology may have underestimated seizure rates due to missing data from civilian emergency care facilities. Because individuals who had seizures prior to the surveillance period were not excluded, no conclusions can be drawn regarding causality.
Ascertainment of exposures may have changed during the surveillance period as increased attention was given to both PTSD and TBI. There also exists the pos-sibility of differential misclassification of exposures. There is evidence that both PTSD and TBI, especially mild TBI, are underreported, despite increased attention, in the military for reasons such as stigma-tization and incomplete documentation.28,29 These factors have the potential of biasing the association between PTSD and seizures towards the null.
Another limitation is the slightly dif-ferent rules for case determination used in the analysis of the deployed and non-deployed populations. Because MEPRS codes are not utilized in the TMDS system, seizure rates among service members dur-ing deployment may be underestimated. Patterns remain similar between the two populations despite this limitation.
In summary, having a history of TBI is a recognized risk factor for seizures and was also indicated as a risk factor in this study. In addition, this analysis found that
recently diagnosed PTSD (within 365 days) was independently associated with subse-quent seizure events in a military popu-lation. Prior diagnoses of both TBI and PTSD were associated with a much higher rate of seizures. In light of these findings, it is important to develop future studies to further evaluate the interaction between PTSD and TBI on seizure risk. PTSD appears to be associated with both epilep-tic and non-epileptic seizures, but how this association varies between types of sei-zure remains unclear. It is important to try to evaluate these associations as the treat-ments for seizure types differ significantly.
If the results reported here are repli-cated in future investigations, there may be implications for both clinical care and military policy. For example, providers may want to consider patients with a his-tory of TBI and PTSD to have a potentially increased risk for seizures. Currently, the Joint Trauma System, representing all ser-vices, has a list of Clinical Practice Guide-lines.30 Given the prevalence of TBI and PTSD in the military as well as the potential impact of seizures, formal evidence-based Clinical Practice Guidelines may standard-ize care and improve outcomes. Also, results from this study may provide justification to eventually reevaluate military profiling and retention standards to include a more conservative standard for patients with co-occurring TBI and PTSD diagnoses.
Author affiliations: Uniformed Services Uni-versity of the Health Sciences, F. Edward Hébert School of Medicine, Department of Preventive Medicine and Biostatistics, Bethesda, MD (SGT Bytnar); Armed Forces Health Surveillance Branch, Defense Health Agency, Silver Spring, MD (Dr. Stahlman, Dr. Ying).
Disclaimer: The contents of this publication are the sole responsibility of the authors and do not necessarily reflect the views, asser-tions, opinions, or policies of the Uniformed Services University of the Health Sciences, Department of Defense, Department of the Army, Department of the Navy, or Depart-ment of the Air Force.
R E F E R E N C E S
1. Stafstrom CE, Carmant L. Seizures and epi-lepsy: an overview for neuroscientists. Cold Spring Harb Perspect Med. 2015;5(6).2. Gavvala JR, Schuele SU. New-onset sei-zure in adults and adolescents: a review. JAMA. 2016;316(24):2657–2668.3. Herman ST. Epilepsy after brain insult: target-ing epileptogenesis. Neurology. 2002;59(9 Suppl 5):S21–S26.4. Jett DA. Chemical toxins that cause seizures. Neurotoxicology. 2012;33(6):1473–1475.5. Institute of Medicine. Epilepsy Across the Spectrum: Promoting Health and Understanding. Washington, DC: National Academies Press, 2012.6. Fiszman A, Alves-Leon SV, Nunes RG, D’Andrea I, Figueira I. Traumatic events and post-traumatic stress disorder in patients with psycho-genic nonepileptic seizures: a critical review. Epi-lepsy Behav. 2004;5(6):818–825.7. Chen YH, Wei HT, Bai YM, et al. Risk of epilep-sy in individuals with posttraumatic stress disorder: a nationwide longitudinal study. PsychosomMed. 2017;79(6):664–669.8. Myers L, Perrine K, Lancman M, Fleming M, Lancman M. Psychological trauma in patients with psychogenic nonepileptic seizures: trauma charac-teristics and those who develop PTSD. Epilepsy Behav. 2013;28(1):121–126.9. Salinsky M, Storzbach D, Goy E, Evrard C. Traumatic brain injury and psychogenic sei-zures in veterans. J Head Trauma Rehabil. 2015;30(1):E65–E70.10. Baslet G, Seshadri A, Bermeo-Ovalle A, Will-ment K, Myers L. Psychogenic non-epileptic seizures: an updated primer. Psychosomatics. 2016;57(1):1–17.11. Pugh MJ, Van Cott AC, Amuan M, et al. Epi-lepsy among Iraq and Afghanistan War veterans—United States, 2002–2015. MMWR Morb Mortal Wkly Rep. 2016;65(44):1224–1227.12. Fisher RS, Acevedo C, Arzimanoglou A, et al. ILAE official report: a practical clinical definition of epilepsy. Epilepsia. 2014;55(4):475–482.13. Kobau R, Luo Y, Zack M, Helmers S, Thurman
F I G U R E 3 . Annual crude incidence rates of seizures diagnosed among service members de-ployed to Operation Enduring Freedom, Operation Iraqi Freedom, or Operation New Dawn, U.S. Armed Forces, 2008–2016
0.0
2.0
4.0
6.0
8.0
10.0
12.0
2008 2009 2010 2011 2012 2013 2014 2015 2016
Rat
e pe
r 10,
000
p-yr
s
Overall rate = 9.1
December 2017 Vol. 24 No. 12 MSMR Page 19
D. Epilepsy in adults and access to care—United States, 2010. MMWR Morb and Mortal Wkly Rep. 2012;61(45):909–913.14. Pugh MJ, Orman JA, Jaramillo CA, et al. The prevalence of epilepsy and association with traumatic brain injury in veterans of the Afghani-stan and Iraq wars. J Head Trauma Rehabil. 2015;30(1):29–37.15. Armed Forces Health Surveillance Center. Epilepsy in active component service members, 1998–2012. MSMR. 2013;20(5):19–22.16. Centers for Disease Control and Prevention. Report to Congress on Traumatic Brain Injury in the United States: Epidemiology and Rehabilitation. At-lanta, GA, 2015.17. Centers for Disease Control and Prevention, National Institutes of Health, Department of De-fense, Department of Veterans Affairs. Report to Congress on Traumatic Brain Injury in the United States: Understanding the Public Health Problem Among Current and Former Military Personnel. 2013.18. Invisible wounds of war: psychological and cog-nitive injuries, their consequences, and services to
assist recovery. Santa Monica, CA: RAND, 2008.19. Kessler RC, Heeringa SG, Stein MB, et al. Thirty-day prevalence of DSM-IV mental disorders among nondeployed soldiers in the U.S. Army: results from the Army Study to Assess Risk and Resilience in Servicemembers (Army STARRS). JAMA Psychiatry. 2014;71(5):504–513.20. Kessler RC, Chiu WT, Demler O, Merikangas KR, Walters EE. Prevalence, severity, and comor-bidity of 12-month DSM-IV disorders in the National Comorbidity Survey Replication. Arch Gen Psychi-atry. 2005;62(6):617–627.21. Medical standards for appointment, enlistment, or induction in the military services. Department of Defense Instruction 6130.03, 28 April 2010.22. Standards of medical fitness. Department of the Army Regulation 40-501, 22 December 2016.23. Armed Forces Health Surveillance Branch. De-fense Medical Epidemiological Database 5.0. Ac-cessed on 2 June 2017.24. McHugh JC, Delanty N. Epidemiology and classification of epilepsy: gender comparisons. Int Rev Neurobiol. 2008;83:11–26.25. Asadi-Pooya AA. Psychogenic nonepilep-
tic seizures are predominantly seen in women: potential neurobiological reasons. Neurol Sci. 2016;37(6):851–855.26. Brundage JF, Taubman SB, Hunt DJ, Clark LL. Whither the “signature wounds of the war” after the war: estimates of incidence rates and proportions of TBI and PTSD diagnoses attributable to back-ground risk, enhanced ascertainment, and active war zone service, active component, U.S. Armed Forces, 2003–2014. MSMR. 2015;22(2):2–11.27. Hickling EJ, Gibbons S, Barnett SD, Watt D. The psychological impact of deployment on OEF/OIF healthcare providers. J Trauma Stress. 2011;24(6):726–734.28. Sharp ML, Fear NT, Rona RJ, et al. Stigma as a barrier to seeking health care among military personnel with mental health problems. Epidemiol Rev. 2015;37:144–162.29. Chapman JC, Diaz-Arrastia R. Military trau-matic brain injury: a review. Alzheimers Dement. 2014;10(3 Suppl):S97–S104.30. U.S. Army Institute of Surgical Research. Joint Trauma System. http://www.usaisr.amedd.army.mil/10_jts.html. Accessed on 21 June 2017.

MSMR Vol. 24 No. 12 December 2017 Page 20
Hepatitis B virus (HBV) and hepatitis C virus (HCV) can cause significant morbidity in military service members. Prevalences of HBV and HCV infec-tions among military recruits accessioning into the U.S. Air Force have not previously been described. The Joint Base San Antonio-Lackland Blood Donor Center was queried for the results of HBV and HCV screening tests among all basic military trainees who donated blood between 25 Novem-ber 2013 and 16 April 2016. Other active and reserve component mem-bers were excluded. The estimated prevalences of HBV and HCV infections among recruit blood donors were 0.0098% and 0.007%, respectively. This study suggests that the overall estimated prevalence of HBV and HCV infec-tion is much lower among U.S. Air Force basic trainees, compared to other active and reserve component members and U.S. civilian populations. HBV and HCV viral infections can have a negative impact on mission readiness and individual deployment status, and have significant costs for the military. Additional studies are needed to determine cost effectiveness of screening for viral hepatitis among military populations.
Chronic hepatitis B virus (HBV) and hepatitis C virus (HCV) infections can cause significant morbidity
in military service members due to pro-longed inflammatory damage to the liver and potential complications including cir-rhosis, hepatocellular carcinoma, and ful-minant liver failure, which may necessitate liver transplantation.1,2 The estimated prev-alence of chronic HBV infection in the U.S. civilian population is 0.4%; however, it is possible that the prevalence in the civilian population is underestimated because prior studies assessing hepatitis B prevalence excluded groups of people at higher risk of infection such as Asians, Pacific Island-ers, and homeless populations.3 The prev-alence of chronic HBV infections among residents of group quarters, such as mili-tary barracks, college dormitories, nursing
homes, and long-term care facilities in the U.S., has been estimated as approximately 0.5%.3 The overall prevalence of chronic HCV infection in the U.S. has been found to be 0.48%, 5.4% and 1.6% for active duty, veteran, and civilian populations respec-tively. 4-6 Risk factors for acquisition of HBV include high-risk sexual behavior, intra-venous (IV) drug use, and vertical trans-mission through childbirth in developing countries. Risk factors for acquiring HCV include IV drug use, receiving blood trans-fusions before 1992, and engaging in high-risk sexual behavior.7
Although the overall prevalence and incidence rates of chronic HBV and HCV infections have been previously estimated in active component service members, the prevalence among military recruits acces-sioning into the U.S. Air Force has not been
described. Incoming trainees are not rou-tinely screened for acute or chronic HBV and HCV infection. They are screened for immunity for hepatitis B, and they are given the hepatitis B vaccination series if they test negative for the hepatitis B surface antibody. Screening for hepatitis B immu-nity involves screening only for the surface antibody, with a positive test indicating immunity from either prior vaccination or resolved acute HBV infection. Sero-logic test results for acute and chronic HBV infections, along with the different phases of infection are summarized in the Table.
Screening for HCV infection is ini-tially performed with serum antibody test-ing. If the HCV antibody test is positive, then assessment for active infection is per-formed by testing for the presence of HCV RNA. A positive HCV RNA result indicates active infection, whereas a negative RNA test in the presence of HCV antibody indi-cates cleared infection, or, rarely, a false-positive test.
Identification of the prevalence of acute and chronic HBV and HCV infections is important because of not only the possible health consequences of these infections, but also the high cost of clinical evaluation and treatment. Identification of recruits with acute and chronic HBV or HCV infections would likely benefit the military from a mission readiness standpoint because these individuals do not meet the standards for entry into active military service and dis-ease management costs would be avoided.
M E T H O D S
The Joint Base San Antonio-Lackland Blood Donor Center was queried for the results of HBV and HCV screening for all
Brief Report Prevalence of Hepatitis B and C Virus Infections in U.S. Air Force Basic Military Trainees Who Donated Blood, 2013–2016Douglas F. Taylor, DO (Capt, USAF); Ryan S. Cho, MD (Maj, USAF); Jason F. Okulicz, MD (Lt Col, USAF); Bryant J. Webber, MD, MPH (Maj, USAF); John G. Gancayco, MD (Lt Col, USAF)
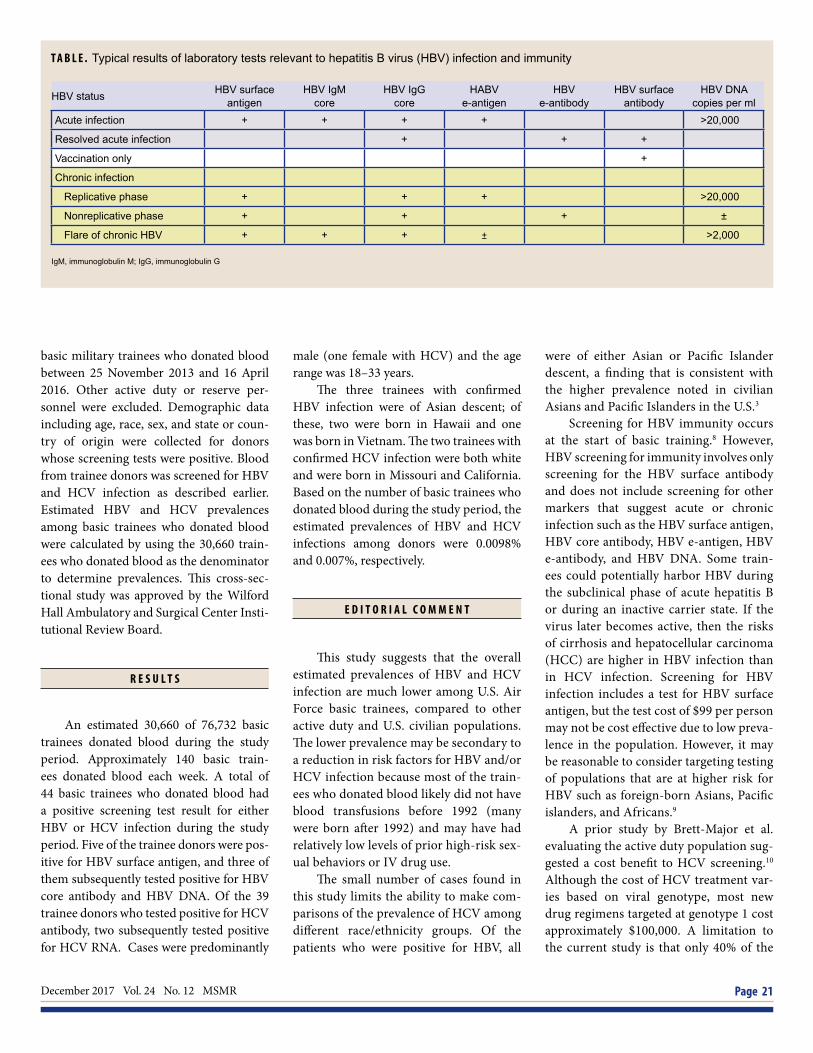
December 2017 Vol. 24 No. 12 MSMR Page 21
basic military trainees who donated blood between 25 November 2013 and 16 April 2016. Other active duty or reserve per-sonnel were excluded. Demographic data including age, race, sex, and state or coun-try of origin were collected for donors whose screening tests were positive. Blood from trainee donors was screened for HBV and HCV infection as described earlier. Estimated HBV and HCV prevalences among basic trainees who donated blood were calculated by using the 30,660 train-ees who donated blood as the denominator to determine prevalences. This cross-sec-tional study was approved by the Wilford Hall Ambulatory and Surgical Center Insti-tutional Review Board.
R E S U L T S
An estimated 30,660 of 76,732 basic trainees donated blood during the study period. Approximately 140 basic train-ees donated blood each week. A total of 44 basic trainees who donated blood had a positive screening test result for either HBV or HCV infection during the study period. Five of the trainee donors were pos-itive for HBV surface antigen, and three of them subsequently tested positive for HBV core antibody and HBV DNA. Of the 39 trainee donors who tested positive for HCV antibody, two subsequently tested positive for HCV RNA. Cases were predominantly
male (one female with HCV) and the age range was 18–33 years.
The three trainees with confirmed HBV infection were of Asian descent; of these, two were born in Hawaii and one was born in Vietnam. The two trainees with confirmed HCV infection were both white and were born in Missouri and California. Based on the number of basic trainees who donated blood during the study period, the estimated prevalences of HBV and HCV infections among donors were 0.0098% and 0.007%, respectively.
E D I T O R I A L C O M M E N T
This study suggests that the overall estimated prevalences of HBV and HCV infection are much lower among U.S. Air Force basic trainees, compared to other active duty and U.S. civilian populations. The lower prevalence may be secondary to a reduction in risk factors for HBV and/or HCV infection because most of the train-ees who donated blood likely did not have blood transfusions before 1992 (many were born after 1992) and may have had relatively low levels of prior high-risk sex-ual behaviors or IV drug use.
The small number of cases found in this study limits the ability to make com-parisons of the prevalence of HCV among different race/ethnicity groups. Of the patients who were positive for HBV, all
were of either Asian or Pacific Islander descent, a finding that is consistent with the higher prevalence noted in civilian Asians and Pacific Islanders in the U.S.3
Screening for HBV immunity occurs at the start of basic training.8 However, HBV screening for immunity involves only screening for the HBV surface antibody and does not include screening for other markers that suggest acute or chronic infection such as the HBV surface antigen, HBV core antibody, HBV e-antigen, HBV e-antibody, and HBV DNA. Some train-ees could potentially harbor HBV duringthe subclinical phase of acute hepatitis Bor during an inactive carrier state. If thevirus later becomes active, then the risksof cirrhosis and hepatocellular carcinoma(HCC) are higher in HBV infection thanin HCV infection. Screening for HBVinfection includes a test for HBV surfaceantigen, but the test cost of $99 per personmay not be cost effective due to low preva-lence in the population. However, it maybe reasonable to consider targeting testingof populations that are at higher risk forHBV such as foreign-born Asians, Pacificislanders, and Africans.9
A prior study by Brett-Major et al. evaluating the active duty population sug-gested a cost benefit to HCV screening.10 Although the cost of HCV treatment var-ies based on viral genotype, most new drug regimens targeted at genotype 1 cost approximately $100,000. A limitation to the current study is that only 40% of the
T A B L E . Typical results of laboratory tests relevant to hepatitis B virus (HBV) infection and immunity
HBV status HBV surface antigen
HBV IgM core
HBV IgG core
HABV e-antigen
HBV e-antibody
HBV surface antibody
HBV DNA copies per ml
Acute infection + + + + >20,000
Resolved acute infection + + +
Vaccination only +
Chronic infection
Replicative phase + + + >20,000
Nonreplicative phase + + + ±
Flare of chronic HBV + + + ± >2,000
IgM, immunoglobulin M; IgG, immunoglobulin G

MSMR Vol. 24 No. 12 December 2017 Page 22
total number of recruits during the study time period donated blood, so this study could not assess the proportion of all basic trainees that may have tested positive for viral hepatitis. Although this study esti-mated a prevalence of HCV infection of 0.0065%, the Brett-Major study estimated a prevalence of 0.043%. It is likely that, if all recruits were screened rather than only those who donated blood, there would be more positive tests for HBV and HCV infection, but this approach would greatly increase the cost of screening. Based on these data, it is not possible to demon-strate a cost benefit for HCV screening in basic military trainees as was demon-strated in the Brett-Major study because a significant portion of the trainee popula-tion was not tested. However, this analysis does not factor in the potential long-term costs to the U.S. military health system of managing patients with liver compli-cations due to HCV, such as HCC and/or cirrhosis, that may be associated with delayed diagnosis and treatment.
A significant limitation of the study is that it failed to include infected basic trainees who chose not to donate blood,
leading to possible selection bias due to the healthy donor effect. Recruit trainee donors, when compared to the general population, tend to be younger, healthier, and likely exposed to fewer risk factors for acquisition of viral hepatitis. All of these factors may have potentially lowered the prevalence rates of HBV and HCV infec-tion within the study population.
HBV and HCV infections can have a negative impact on mission readiness and individual deployment status, and have significant costs for the military. Currently, it is unclear whether routine screening for HBV and HCV infections would result in a cost benefit for the mili-tary healthcare system. Additional studies are needed to determine cost effectiveness of screening for viral hepatitis among mil-itary populations.
Author affiliations: Gastroenterology Ser-vice, San Antonio Military Medical Center, Fort Sam Houston TX (Dr. Taylor, Dr. Cho, Dr. Gancayco); Infectious Disease Service, San Antonio Military Medical Center, Fort Sam Houston, TX (Dr. Okulicz); Preventive Medicine Joint Base San Antonio-Lackland, TX (Dr. Webber).
R E F E R E N C E S
1. Hiotis SP, Rahbari NN, Villanueva GA, et al.Hepatitis B vs. hepatitis C infection on viral hep-atitis-associated hepatocellular carcinoma. BMCGastroenterol. 2012;12(64).2. Armed Forces Health Surveillance Center. Viral hepatitis C, active component, U.S. Armed Forces,2000–2010. MSMR. 2011;18(8):10–14.3. Kim WR. Epidemiology of hepatitis B in theUnited States. Hepatology. 2009;49(5 Suppl):S28–S34.4. Armstrong GL, Wasley A., Simard EP, et al.The prevalence of hepatitis C virus infection in theUnited States, 1999 through 2002. Ann Intern Med.2006;144(10):705–714.5. Alter MJ. Hepatitis C virus infection in the Unit-ed States. J Hepatol. 1999;31(Suppl 1):88–91.6. Hyams KC, Riddle J, Rubertone M, et al. Prev-alence and incidence of hepatitis C virus infectionin the US military: a seroepidemiologic survey of21,000 troops. Am J Epidemiol. 2001;153(8):764–770.7. Briggs ME, Baker C, Hall R, et al. Prevalenceand risk factors for hepatitis C virus infection atan urban Veterans Administration medical center.Hepatology. 2001;34(6):1200–1205.8. Scott PT, Niebuhr DW, McGready JB, GaydosJC. Hepatitis B immunity in United States militaryrecruits. J Infect Dis. 2005;191(11):1835–1841.9. Eckman MH, Kaiser TE, Sherman KE. Thecost-effectiveness of screening for chronic hepati-tis B infection in the United States. Clin Infect Dis.2011; 52(11):1294–1306.10. Brett-Major DM, Frick KD, Malia JA, et al. Costs and consequences: Hepatitis C seroprevalence inthe military and its impact on potential screeningstrategies. Hepatology. 2016; 63(2):398–407.

December 2017 Vol. 24 No. 12 MSMR Page 23
Fatigue is a common complaint in the civilian population and may be a pre-senting symptom of more serious physical and mental disorders. Data from the Defense Medical Surveillance System (DMSS) were utilized to character-ize the incidence and burden of fatigue in active component military mem-bers from 1 January 2007 through 31 December 2016. A subanalysis of 3 years within this surveillance period (2012–2014) was also conducted to assess the burden of comorbidities related to incident fatigue and the strength of the association between fatigue and selected comorbidities. The study identi-fied 211,213 incident cases of fatigue with an overall incidence rate of 18.1 per 1,000 person-years between 2007 and 2016. Mental disorders and mus-culoskeletal disease accounted for about 35% of all medical encounters and about 40% of all hospital days within a year for those diagnosed with fatigue in 2013. The adjusted odds ratio for fatigue was highest in those with male hypogonadism, thyroid disorder, and sleep problems. These results show that fatigue is a common diagnosis with high incidence and burden among active component U.S. military. By focusing on the conditions that frequently occur and are highly associated with fatigue, more rapid diagnosis and treatment of the underlying cause of service member fatigue is possible.
Fatigue and Related Comorbidities, Active Component, U.S. Armed Forces, 2007–2016Robert M. Guido, MD, MPH (CPT, USA); Shauna Stahlman, PhD, MPH; Saixia Ying, PhD
Fatigue is a term that describes exhaus-tion, tiredness, or a lack of energy to complete tasks, and can be the pre-
senting symptom for underlying medical or psychological illnesses, such as depres-sion, hypothyroidism, or anemia.1 Fatigue is a common complaint at medical vis-its. In the U.S., 21%–33% of adult patients report a history of significant fatigue to their primary care physicians,2-8 utilizing 7 million office visits per year.9 The 2-week self-reported prevalence of fatigue among the U.S. workforce is 38%, costing employ-ers more than $136 billion in lost produc-tive work time annually.10 Large burdens of fatigue in the U.S. military would likely equate to significant numbers of medical encounters and productivity loss as well.
Population-based surveys in the U.S. and U.K. have estimated a prevalence of fatigue between 6.0% and 7.5%.1-5,11 The prevalence in women is generally higher than in men, and women comprise 75% of patients with Chronic Fatigue Syndrome (CFS).1-5 Fatigue has also been reported to increase with age.12
With regard to both acute and persis-tent or chronic fatigue, one study found that acute fatigue (fatigue of less than 1 month duration) was more likely to be associated with a physical problem, most commonly a prolonged viral illness, while persistent fatigue (fatigue of 1–6 months duration) and chronic fatigue (fatigue of greater than 6 months duration) were more likely to be associated with psychological problems.8
In a study of an adult primary care popu-lation, among patients who presented with a new diagnosis of fatigue, the most com-mon diagnoses identified during follow-up were musculoskeletal disorders, followed by psychological or social causes (including depression and anxiety).6, 13 Other relatively common diagnoses associated with fatigue were digestive symptoms (including irri-table bowel syndrome), asthma or chronic obstructive pulmonary disease, sleep prob-lems (including somnolence and insom-nia), headache/dizziness, anemia, cough, hypothyroidism and diabetes. No medi-cal or psychiatric explanation is found for fatigue in 8.5%–34% of patients who pres-ent with fatigue.1-5
The incidences of many of the fatigue-associated diagnoses noted above have been reported for service members in the active component of the U.S. military. Among these diagnoses, musculoskeletal disease and mental health disorders occur most frequently, followed by headache, obstructive sleep apnea, thyroid disease, asthma, insomnia, iron-deficient anemia, and diabetes.14-15 Malignancy and HIV or hepatitis infections were reported less fre-quently as potential causes of fatigue.16-30 At the time of this report, no recent studies of the prevalence or incidence of fatigue in the U.S. military were available in the pub-lished literature.
Quantification of the incidence and burden of fatigue in U.S. military service members will inform efforts to prevent and investigate causes of fatigue. Further-more, classification of the diseases most commonly associated with fatigue in the military would assist in more rapid diag-nosis and treatment of underlying causes, which could improve readiness of service members.
MSMR Vol. 24 No. 12 December 2017 Page 24
M E T H O D S
All data used to determine incident cases of fatigue, the morbidity burden of fatigue, and associated comorbidities and their burdens were derived from the Defense Medical Surveillance System (DMSS). DMSS records document both ambulatory encounters and hospitaliza-tions of active component members of the U.S. Armed Forces in fixed military and civilian (if reimbursed through the Mili-tary Health System) treatment facilities. The surveillance population included all individuals who served at any time during the surveillance period in the active com-ponent of the Army, Navy, Air Force, or Marine Corps.
For determining the incidence of fatigue and the burden of fatigue, the surveillance period was 1 January 2007 through 31 December 2016. The study design used to determine incidence of fatigue was a retrospective cohort study. An incident case of fatigue was defined by a record of one ambulatory visit or one hos-pitalization with a diagnosis of fatigue in any diagnostic position. The ICD-9/ICD-10 codes used to define a case of fatigue were 780.7 and R53 (malaise and fatigue); 780.79 and R53.8 (other malaise and fatigue); R53.81 (other malaise); R53.82 (chronic fatigue unspecified); and R53.83 (other fatigue). An individual could be an incident case only once during his or her lifetime. Diagnoses of fatigue that were recorded in a theater of operations were not included. Follow-up time was censored during periods of deployment and at the time of service members’ incident fatigue diagnoses or departures from military ser-vice, whichever came first.
The morbidity burden attributable to fatigue was based on the number of medi-cal encounters attributable to fatigue (i.e., encounters in which fatigue was listed in the primary diagnostic position). The mea-sures of burden included total encounters (both hospital and ambulatory encounters) for fatigue with a limit of one encounter per individual with a diagnosis of fatigue per day; number of service members affected by fatigue (i.e., individuals with at least one medical encounter for fatigue during the
year); and total bed days during hospital-izations for fatigue.
To determine which comorbid diagno-ses may be associated with fatigue, a burden of comorbidities analysis was conducted among those with incident fatigue in 2013. The diseases with the highest burdens, as well as those that appeared to be more common in those with fatigue compared to prior MSMR reports for the entire active component,14 were then used as exposure variables for a case-control study of fatigue cases versus non-fatigue cases. For both the burden analysis and the case-control study, a narrower surveillance period (1 January 2012 through 31 December 2014) was used, as this period was assumed to be fairly representative of the entire study period and allowed for simpler summari-zation of comorbidities using ICD-9 codes only. Diagnoses from all inpatient and out-patient medical encounters up to 365 days before or after incident fatigue cases occur-ring in 2013 were summarized accord-ing to the primary (first-listed non-V or non-E code) diagnosis (if reported with an ICD-9 code between 001 and 999 exclud-ing the ICD-9 codes used to define fatigue). Numbers of service members affected and numbers of bed days were also summarized for each primary diagnosis. All diagnos-tic comorbidities were summarized using ICD-9 codes at the four-digit level, and were additionally grouped according to the categories of disease used in prior burden issues of the MSMR.14 The 365-day before-and-after window was selected because it was deemed wide enough to capture many comorbidities but narrow enough to exclude comorbidities that are less likely to be connected with the diagnosis of fatigue. The window also allowed for the possibil-ity of a patient presenting with fatigue and being diagnosed with a potential cause of the fatigue at a follow-up encounter, as well as the possibility of a diagnosed disease being associated with a fatigue diagnosis at a later time. The authors also investi-gated the burden of comorbidities stratified by those diagnosed before, after, or on the day of fatigue diagnoses, but there was little variation among these groups and so those results are not reported here.
The case-control subanalysis was con-ducted on the subset of incident fatigue
cases that occurred during 2013. Fatigue cases were matched 1:1 to controls based on age and sex. All inpatient and outpa-tient medical encounters up to 365 days before or after incident diagnoses of fatigue (for both cases and matched controls) were included in the analysis. Cases or controls who were deployed within 365 days of the date of the case’s incident fatigue diagno-sis were excluded. Pearson chi-square tests were used to compare demographic char-acteristics between cases and controls. In addition, a multivariable logistic regres-sion analysis was used to determine the odds ratios (ORs) and confidence intervals (CIs) for the relationships between investi-gator-selected comorbid diagnoses (in any diagnostic position), which were the expo-sures of interest (Table 1), and fatigue, the outcome of interest. Potential confounding factors, including race/ethnicity, branch of military service, rank/grade, and occu-pation, were adjusted for in the analysis. All analyses were performed using SAS/STAT© software, version 9.4 (2014, SAS Institute, Cary, NC).
R E S U L T S
During the surveillance period 1 Jan-uary 2007 through 31 December 2016, a total of 211,213 active component service members were diagnosed with incident fatigue. The surveillance period consisted of 11,642,948 person-years, and the over-all incidence rate during the surveillance period was 18.1 cases (according to the case definition) of fatigue per 1,000 person-years (p-yrs) (Table 2).
During 2007–2012, rates of fatigue increased by about 50% (2007: rate = 13.8 cases per 1,000 p-yrs; 2012: rate = 21.0 cases per 1,000 p-yrs) before leveling off for a few years and then declining during 2015–2016. The rate in 2016 was approxi-mately 30% higher than in 2007 (2016: rate = 17.7 cases per 1,000 p-yrs) (Figure 1). Sim-ilar patterns of time trends were observed for the annual incidence rates according to service branch and history of deployments (Figures 2 and 3).
The overall incidence rate during the surveillance period was highest among

December 2017 Vol. 24 No. 12 MSMR Page 25
women, who had more than double the rates of fatigue compared to men (women: rate = 35.5 cases per 1,000 p-yrs; men: rate = 15.3 cases per 1,000 p-yrs) (Table 2, Fig-ure 1). The incidence rates increased with age and higher rank, with service members in the oldest age category having a rate of fatigue more than three times that of ser-vice members in the youngest age cate-gory (less than 20 years old: 11.0 cases per 1,000 p-yrs; 40 years or older: 35.2 cases per 1,000 p-yrs). Senior enlisted service mem-bers had a 59% higher rate of fatigue than junior enlisted service members over the surveillance period (junior enlisted: 14.1 cases per 1,000 p-yrs; senior enlisted: 22.4 cases per 1,000 p-yrs), while senior officers had a 40% higher rate of fatigue than junior officers (junior officer: 17.5 cases per 1,000 p-yrs; senior officer: 24.6 cases per 1,000 p-yrs) (Table 2). The rates of fatigue among Army and Air Force members were roughly double the rates among Navy and Marine Corps service members; non-Hispanic
blacks had higher rates of fatigue than those in other race/ethnicity groups, and healthcare workers had the highest rates of fatigue among the occupations considered, while pilots/air crew and combat personnel had the lowest rates (Table 2). During the early years of the surveillance period (up to 2009), annual incidence rates were similar for service members with different deploy-ment histories. However, by 2016, those with two or more deployments had approx-imately double the rate of fatigue compared to those with no prior deployments (no deployments: 12.9 cases per 1,000 p-yrs; two or more deployments: 26.3 cases per 1,000 p-yrs) (Figure 3). Burden of fatigue, 2007–2016
From 1 January 2007 through 31 December 2016, a total of 112,014 service members received medical care for fatigue (Table 3) over 11,642,948 p-yrs (data not shown). The care of these service members
entailed 162,796 medical encounters for which a fatigue diagnosis was recorded in the first diagnostic position of the associ-ated records, and included a total of 708 bed days among hospitalized patients (Table 3). Broadly similar to the trend for the incidence of fatigue, the num-ber of medical encounters and individu-als affected increased until 2013, then decreased during 2014–2016 (Figure 4).
Comorbidity burden, 2012–2014
From 1 January 2012 through 31 December 2014, among service mem-bers diagnosed with fatigue during 2013, the most medical encounters within 365 days before or after the incident diagno-sis were for pain in a joint (n=97,058; 8.9% of all encounters), followed by other ill-defined conditions (n=69,970, 6.4% of all encounters), lumbago (n=51,995, 4.7% of all encounters), other specified adjustment reactions (n=42,815, 3.9% of all encoun-ters) and organic sleep apnea (n = 41,894, 3.8% of all encounters) (Table 4). Pain in a joint also accounted for the most individu-als affected (n=12,585, 3.5% of all individ-uals affected). Other specified adjustment reactions accounted for the most bed days (n=5,179, 9% of all hospital bed days) (Table 4). The distribution of burden indicators for all categories of diseases (which combines related conditions) can be seen in Figure 5. Together, mental disorders and musculo-skeletal diseases accounted for about 35% of all medical encounters and about 44% of all hospital days (Figures 5 and 6).
In the case-control analysis, there was a sample size of roughly 34,000 matched cases and controls. The distribution of demographic characteristics was broadly similar between cases and controls (Table 5). However, the differences that emerged warranted inclusion of these characteristics in the multivariable model used to calcu-late adjusted ORs (AORs) (Table 6).
The adjusted odds of fatigue were greater for males with hypogonadism, compared to those without hypogonad-ism (AOR: 6.79: CI: 5.24–8.82), followed by service members with thyroid disorders (AOR=2.68; 95% CI: 2.24–3.20) or sleep problems (AOR=2.15; 95% CI: 2.00–2.32), compared to those without these respective
T A B L E 1 . Selected diagnoses and diagnosis groups used as exposures in logistic re-gression model to determine odds of fatigue versus no fatigue in a case-control study of those with incident fatigue in 2013 (cases) and age/sex-matched controls who did not have fatigue through the end of the study period, active component, U.S. Armed Forces, 2012–2014
Diagnoses ICD-9 codes
Musculoskeletal diseases 719.4, 724.2, 723.1, 729.5, 724.5, 728.8, 724.1, 722.5, 722.1
Mental health disorders 309.8, 300.0, 309.2, 311, 296.3, 296.2, 309.0, 309.9
Organic sleep apnea 327.2
Abdominal/digestive symptoms 789.0, 787.0, 558.9, 530.8, 564.0, 564.1
Headache or dizziness 784.0, 346.9, 339.8, 780.4, 346.0, 346.1, 339.1
Cardiovascular sysmptoms 786.5, 780.2, 785.1, 796.2Hypertension 401.9Sleep disturbance 780.5, 307.4Alcohol dependence 303.9Tobacco use disorder 305.1Asthma 493.9Respiratory symptoms 786.0, 786.2Overweight/obese 278Hyperlipidemia 272.4Malignancy 186.9, 204.0, 174.9, 239.2, 201.9, 193, 202.8, 205.0Male hypogonadism 257.2Thyroid disease 244.9, 242.9Diabetes 250Anemia 285.9, 280.9
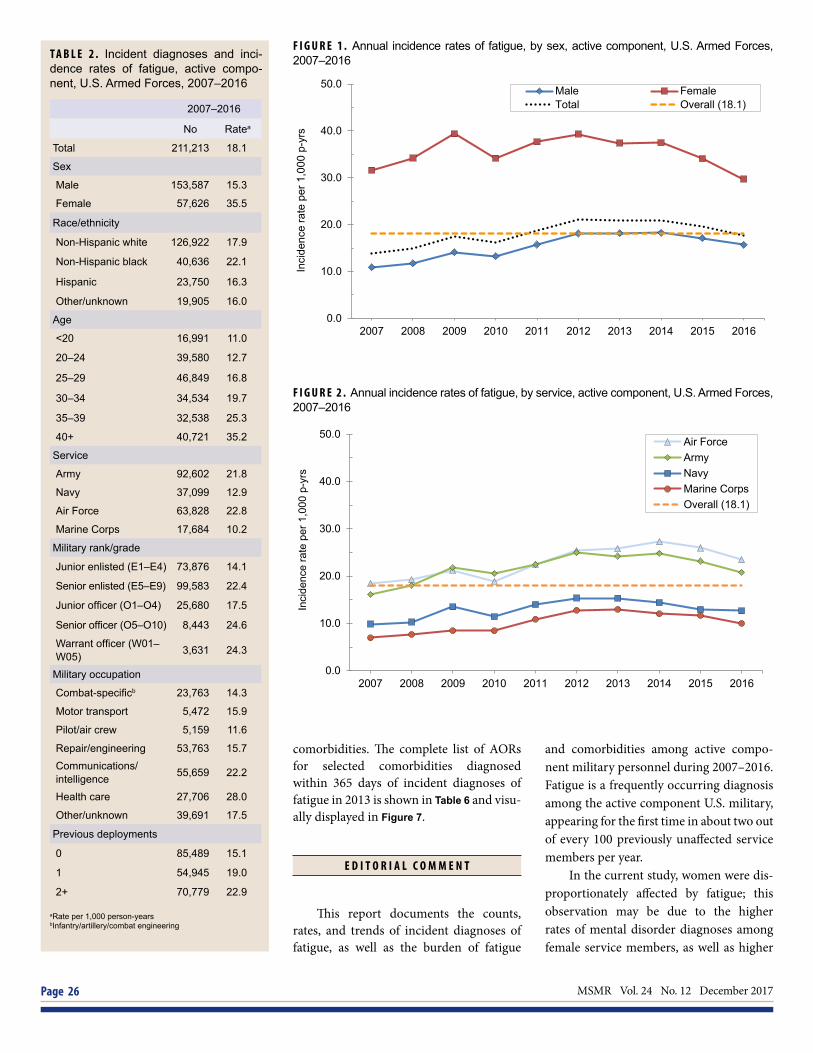
MSMR Vol. 24 No. 12 December 2017 Page 26
and comorbidities among active compo-nent military personnel during 2007–2016. Fatigue is a frequently occurring diagnosis among the active component U.S. military, appearing for the first time in about two out of every 100 previously unaffected service members per year.
In the current study, women were dis-proportionately affected by fatigue; this observation may be due to the higher rates of mental disorder diagnoses among female service members, as well as higher
T A B L E 2 . Incident diagnoses and inci-dence rates of fatigue, active compo-nent, U.S. Armed Forces, 2007–2016
2007–2016
No Ratea
Total 211,213 18.1
Sex
Male 153,587 15.3
Female 57,626 35.5
Race/ethnicity
Non-Hispanic white 126,922 17.9
Non-Hispanic black 40,636 22.1
Hispanic 23,750 16.3
Other/unknown 19,905 16.0
Age
<20 16,991 11.0
20–24 39,580 12.7
25–29 46,849 16.8
30–34 34,534 19.7
35–39 32,538 25.3
40+ 40,721 35.2
Service
Army 92,602 21.8
Navy 37,099 12.9
Air Force 63,828 22.8
Marine Corps 17,684 10.2
Military rank/grade
Junior enlisted (E1–E4) 73,876 14.1
Senior enlisted (E5–E9) 99,583 22.4
Junior officer (O1–O4) 25,680 17.5
Senior officer (O5–O10) 8,443 24.6
Warrant officer (W01–W05) 3,631 24.3
Military occupation
Combat-specificb 23,763 14.3
Motor transport 5,472 15.9
Pilot/air crew 5,159 11.6
Repair/engineering 53,763 15.7Communications/ intelligence 55,659 22.2
Health care 27,706 28.0
Other/unknown 39,691 17.5
Previous deployments
0 85,489 15.1
1 54,945 19.0
2+ 70,779 22.9
aRate per 1,000 person-yearsbInfantry/artillery/combat engineering
comorbidities. The complete list of AORs for selected comorbidities diagnosed within 365 days of incident diagnoses of fatigue in 2013 is shown in Table 6 and visu-ally displayed in Figure 7.
E D I T O R I A L C O M M E N T
This report documents the counts, rates, and trends of incident diagnoses of fatigue, as well as the burden of fatigue
F I G U R E 1 . Annual incidence rates of fatigue, by sex, active component, U.S. Armed Forces, 2007–2016
F I G U R E 2 . Annual incidence rates of fatigue, by service, active component, U.S. Armed Forces, 2007–2016
0.0
10.0
20.0
30.0
40.0
50.0
2007 2008 2009 2010 2011 2012 2013 2014 2015 2016
Inci
denc
e ra
te p
er 1
,000
p-y
rs
Male FemaleTotal Overall (18.1)
0.0
10.0
20.0
30.0
40.0
50.0
2007 2008 2009 2010 2011 2012 2013 2014 2015 2016
Inci
denc
e ra
te p
er 1
000
p-yr
s
Air ForceArmyNavyMarine CorpsOverall (18.1)
Inci
denc
e ra
te p
er 1
,000
p-y
rs

December 2017 Vol. 24 No. 12 MSMR Page 27
incidences of headaches, thyroid disor-ders, anemia and even low back pain.16-
20,23 This finding is consistent with studies in civilian populations that show women are at increased risk for fatigue.1-5 Fatigue increased with age among service mem-bers, a trend that is also consistent with studies among civilians.12 This observation could reflect increased incidence of under-lying diseases among older service mem-bers, rather than a simple consequence of
older age, and the presence of such condi-tions should be considered in older patients with fatigue. For example, depression, pain, respiratory symptoms, urinary inconti-nence, hearing difficulty and social isola-tion have all been shown to be independent risk factors for fatigue in older adults.12
The trend showing an increased annual incidence of fatigue among active compo-nent service members from 2007 through 2012 coincides with military engagements
Operation Enduring Freedom–Afghani-stan (OEF-A) from 2001 through 2014 and Operation Iraqi Freedom (OIF) from 2003 through 2011, and similar increases can be seen in the incidence rates of other disor-ders, especially mental disorders.18 These increases could reflect increased stress-ors that accompanied engagement-related deployments, an interpretation that is fur-ther supported by the decrease in incident rates from 2015 through 2016, after both
F I G U R E 3 . Annual incidence rates of fatigue, by number of deployments, active component, U.S. Armed Forces, 2007–2016
F I G U R E 4 . Numbers of medical encounters, individuals affected, and hospital bed days for fatigue, by calendar year, active component, U.S. Armed Forces, 2007–2016
0.0
10.0
20.0
30.0
40.0
50.0
2007 2008 2009 2010 2011 2012 2013 2014 2015 2016
Inci
denc
e ra
te p
er 1
000
p-yr
s
2+10Overall (18.1)
T A B L E 3 . Healthcare burdens attribut-able to fatigue, active component, U.S. Armed Forces, 2007–2016
Year Medical encounters
Individuals affected Bed days
2007 12,059 9,730 40
2008 13,604 10,820 110
2009 16,483 12,951 53
2010 18,324 14,254 66
2011 19,839 14,994 106
2012 20,979 15,857 103
2013 21,106 16,420 48
2014 20,690 16,239 83
2015 18,945 14,789 64
2016 16,861 13,289 51
Total 162,796 112,014 708
12,059
13,604
16,483
18,324
19,839 20,979 21,106 20,690
18,945
16,861
9,730 10,820
12,951 14,254
14,994 15,857 16,420 16,239
14,789
13,289
40
110 53 66
106 103 48 83 64 51
0
100
200
300
400
500
600
700
800
900
1,000
0
5,000
10,000
15,000
20,000
25,000
2007 2008 2009 2010 2011 2012 2013 2014 2015 2016
Hos
pita
l bed
day
s
Med
ical
enc
ount
ers/
indi
vidu
als
affe
cted
Medical encountersIndividuals affectedHospital bed days
Inci
denc
e ra
te p
er 1
,000
p-y
rsM
edic
al e
ncou
nter
s/in
divi
dual
s af
fect
ed
Hos
pita
l bed
day
s

MSMR Vol. 24 No. 12 December 2017 Page 28
T A B L E 4 . Burden of most frequent comorbidities among 2013 incident fatigue cases within 365 days of incident fatigue diagnosis (inclusive), active component, U.S. Armed Forces, 2012–2014
Condition No. encountersa Rank % of all
encounters
No. service
members affectedb
Rank
% service
members affected
Bed days Rank Burden
categoryc
Joint pain 97,058 1 8.86 12,585 1 3.49 75 109 Injury and poisoning
Other ill-defined conditions 69,970 2 6.39 11,026 2 3.06 1 180 Signs and symptoms
Lumbago 51,995 3 4.75 7,823 3 2.17 77 107 Musculoskeletal diseases
Other specified adjustment reactions 42,815 4 3.91 2,230 25 0.62 5,179 1 Mental disorders
Organic sleep apnea 41,894 5 3.83 6,325 5 1.76 71 113 Neurologic conditions
Anxiety states 22,834 6 2.09 3,759 11 1.04 503 16 Mental disorders
Adjustment reaction with predominant distur-bance of other emotions 20,942 7 1.91 3,440 14 0.95 643 10 Mental disorders
Sleep disturbances 16,595 8 1.52 7,392 4 2.05 11 170 Signs and symptoms
Cervicalgia 15,990 9 1.46 3,119 16 0.87 3 178 Musculoskeletal diseases
Depressive disorder, not elsewhere classified 15,517 10 1.42 2,972 18 0.82 971 5 Mental disorders
Major depressive disorder, recurrent episode 14,230 11 1.30 1,157 57 0.32 2,758 3 Mental disorders
Other and unspecified alcohol dependence 13,627 12 1.24 574 120 0.16 2,847 2 Mental disorders
Pain in limb 12,740 13 1.16 4,909 9 1.36 13 168 Musculoskeletal diseases
Abdominal pain 10,922 14 1.00 4,432 10 1.23 243 38 Signs and symptoms
Myopia 9,290 15 0.85 5,868 6 1.63 0 - Sense organ diseases
Dyspnea and respiratory abnormalities 9,099 16 0.83 5,007 8 1.39 21 160 Signs and symptoms
Chest pain 7,994 17 0.73 3,522 13 0.98 280 33 Signs and symptoms
Major depressive disorder, single episode 7,854 18 0.72 955 74 0.27 1,518 4 Mental disorders
Adjustment disorder with depressed mood 7,622 19 0.70 1,724 37 0.48 619 12 Mental disorders
Acute upper respiratory infections of unspecified site 7,378 20 0.67 5,334 7 1.48 5 176 Respiratory infections
Backache, unspecified 7,293 21 0.67 2,774 21 0.77 26 155 Musculoskeletal diseases
Headache 6,925 22 0.63 3,629 12 1.01 98 89 Headache
Other disorders of muscle ligament and fascia 6,919 23 0.63 1,945 30 0.54 623 11 Musculoskeletal diseases
Pain in thoracic spine 6,717 24 0.61 2,056 27 0.57 1 180 Musculoskeletal diseases
Other general symptoms 6,666 25 0.61 1,591 43 0.44 48 133 Signs and symptoms
Unspecified adjustment reaction 6,492 26 0.59 1,945 30 0.54 192 50 Mental disorders
Unspecified essential hypertension 6,129 27 0.56 2,398 23 0.67 81 104 Cardiovascular diseases
Degeneration of thoracic or lumbar intervertebral disc 6,123 28 0.56 1,686 39 0.47 177 57 Musculoskeletal
diseasesDisplacement of thoracic or lumbar intervertebral disc without myelopathy 5,871 29 0.54 1,492 47 0.41 391 20 Musculoskeletal
diseases
Overweight/obese 5,677 30 0.52 2,880 19 0.80 0 - Nutritional disorders
aMedical encounters: total hospitalizations and ambulatory visits for the condition (with no more than one encounter per individual per day per condition) bIndividuals with at least one hospitalization or ambulatory visit for the conditioncMajor categories and conditions defined in the Global Burden of Disease Study, The global burden of disease: a comprehensive assessment of mortality and disability from diseases, injuries, and risk factors in 1990 and projected to 2020. Murray, CJ and Lopez, AD, eds. Harvard School of Public Health (on behalf of the World Health Organization and The World Bank), 1996:120–122.

December 2017 Vol. 24 No. 12 MSMR Page 29
F I G U R E 5 . Numbers of medical encounters,a individuals affected,b and hospital bed days during 2012–2014, by burden of disease category,c active component service members with incident fatigue in 2013, U.S. Armed Forces
aMedical encounters: total hospitalizations and ambulatory visits for the condition (with no more than one encounter per individual per day per condition) bIndividuals with at least one hospitalization or ambulatory visit for the conditioncMajor categories and conditions defined in the Global Burden of Disease Study34
0
5000
10000
15000
20000
25000
30000
0
50,000
100,000
150,000
200,000
250,000
Men
tal d
isor
ders
Mus
culo
skel
etal
dis
ease
s
Inju
ry/p
oiso
ning
Sig
ns/s
ympt
oms
Neu
rolo
gic
cond
ition
s
Sen
se o
rgan
dis
ease
s
Res
pira
tory
dis
ease
s
Car
diov
ascu
lar d
isea
ses
Ski
n di
seas
es
Gen
itour
inar
y di
seas
es
Dig
estiv
e di
seas
es
Res
pira
tory
infe
ctio
ns
Hea
dach
e
Infe
ctio
us/p
aras
itic
dise
ases
Mat
erna
l con
ditio
ns
Mal
igna
nt n
eopl
asm
s
End
ocrin
e di
sord
ers
Nut
ritio
nal d
isor
ders
Oth
er n
eopl
asm
s
Met
abol
ic/im
mun
ity d
isor
ders
Blo
od d
isor
ders
Con
geni
tal a
nom
alie
s
Dia
bete
s m
ellit
us
Hos
pita
l bed
day
s
Med
ical
enc
ount
ers/
indi
vidu
als
affe
cted
Burden of disease categories
Medical encountersIndividuals affectedHospital bed days
operations had ended. Alternatively, this decrease from 2015 through 2016 could be the result of changes in coding patterns with the introduction of ICD-10 codes in late 2015.
Fatigue accounts for a large healthcare burden in the active component military. For instance, in 2016, about 13,000 unique service members had at least one health-care encounter during which a diagnosis of fatigue was recorded in the first diagnostic position. Those service members had about 17,000 such encounters during the year (average of 46 per day) and the encounters were associated with 51 hospital bed days (average of 4 per month). The relatively low number of bed days reflects the fact that fatigue is mostly diagnosed and treated in the outpatient setting. Comparing these bur-den data to prior MSMR data, the burden of fatigue in 2016 among the active component U.S. military was on par with the burden of benign skin neoplasms and kidney stones, and would rank No. 60 overall (out of nearly 4,000 conditions) on the list of most burden-some conditions reported in 2016.15
F I G U R E 6 . Percentage of medical encounters, attributable to burden of disease categories, active component, U.S. Armed Forces, 2013, and for active component service members with incident fatigue in 2013, during 2012–2014
20.7
19.1
16.8
9.4
4.2 4.1 3.8 3.7 2.6 2.5 2.4
3.6
0.0%
10.0%
20.0%
30.0%
40.0%
50.0%
60.0%
70.0%
80.0%
90.0%
100.0%
All
% o
f tot
al
All other
Headache
Cardiovascular diseases
Maternal conditions
Infectious/parasitic diseases
Digestive diseases
Genitourinary diseases
Respiratory diseases
Respiratory infections
Skin diseases
Sense organ diseases
Neurologic conditions
Signs/symptoms
Musculoskeletal diseases
Mental disorders
Injury/poisoning
0
5.0
2.33.3
16.6
5.1
17.1
17.4
18.2
Fatigue cases
30,000
25,000
20,000
15,000
10,000
5,000

MSMR Vol. 24 No. 12 December 2017 Page 30
In the comorbidity analysis, men-tal disorders and musculoskeletal diseases accounted for the highest disease-related burdens among those with incident fatigue (each found in greater than 5% of patients with fatigue), and they were both indepen-dently associated with fatigue in the case-control study. These categories of disease have been reported to be the top two causes of fatigue in civilians.6
Sleep problems, obstructive sleep apnea, headache, respiratory, abdomi-nal and cardiovascular symptoms, and tobacco use disorder were each found in about 1%–5% of patients with fatigue and were also independently associated with
fatigue in the case-control study. Male hypogonadism, thyroid disorders, ane-mia, malignancy, and hyperlipidemia were found in less than 1% of those with fatigue (data not shown) but were independently associated with fatigue. Based on these findings, clinicians might be able to bet-ter diagnose underlying causes of fatigue by asking questions about the diseases and symptom groups for all of these aforemen-tioned conditions.
Highly-associated conditions like thy-roid disorder, sleep problems and anemia, should always be a part of a clinician’s dif-ferential diagnosis (though they may not occur commonly), as should malignancy,
which is a diagnosis that can cause sub-stantially greater morbidity and mortality if undetected.31
Study limitations include the defini-tion for fatigue, which allowed only one incident case of fatigue per service mem-ber in a lifetime. In reality, individuals may have multiple incident cases of fatigue due to disparate etiologies, but such informa-tion was not captured. There was also the potential for differential misclassification of fatigue by providers. For example, pro-viders may be more likely to document fatigue in a patient with a disease known to cause fatigue, such as hypothyroidism, than in a patient without such a disease.
In addition, there may have been con-founding by time in service or low socio-economic status (shown to be associated with greater levels of fatigue32), which were not controlled for in these analyses. Finally, the comorbidities assessed may or may not have been the causes of fatigue. Moreover, because this analysis did not attempt to distinguish between causes and effects of fatigue, it was not possible to clar-ify the issue of whether or not an associ-ated comorbidity such as depression was the cause or effect of fatigue or if they had a common cause.33
In summary, fatigue is a common diagnosis with high incidence and burden among service members in the active com-ponent of the U.S. military. Several comor-bid diagnoses are associated with fatigue, providing a list of potential causes of fatigue when its origin is unclear. This list could be used to guide investigations of the cause of fatigue. By focusing on the most frequent and highly associated conditions, clinicians have the opportunity to more rapidly diag-nose and treat the underlying cause of ser-vice member fatigue, which would likely lead to fewer lost work days and improved readiness.
Author affiliations: Preventive Medicine Resident, Walter Reed Army Institute of Research, Bethesda, MD (Dr. Guido); Armed Forces Health Surveillance Branch, Silver Spring, MD, (Dr. Stahlman, Dr. Ying)
Disclaimer: Material has been reviewed by the Walter Reed Army Institute of Research. There is no objection to its presentation and/
T A B L E 5 . Characteristics of nested case-control study population, active component, U.S. Armed Forces, 2012–2014
Fatigue No fatigue Overall
N % N % N % p-value
Total 16,969 100 16,969 100 33,938 100
Race/ethnicity
Non-Hispanic white 10,221 60 10,031 59 20,252 60 <.0001
Non-Hispanic black 3,081 18 2,954 17 6,035 18
Hispanic 1,947 11 2,018 12 3,965 12
Other/unknown 1,720 10 1,966 12 3,686 11
Service
Army 7,053 42 6,497 38 13,550 40 <.0001
Air Force 3,078 18 4,045 24 7,123 21
Navy 5,179 31 4,374 26 9,553 28
Marine Corps 1,659 10 2,053 12 3,712 11
Military rank/grade
Junior enlisted (E1–E4) 5,472 32 5,412 32 10,884 32 <.0001
Senior enlisted (E5–E9) 8,516 50 7,498 44 16,014 47
Junior officer (O1–O4) 1,974 12 2,716 16 4,690 14
Senior officer (O5–O10) 730 4 1,036 6 1,766 5
Warrant officer (W01–W05) 277 2 307 2 584 2
Military occupation
Combat-specifica 1,812 11 2,006 12 3,818 11 <.0001
Motor transport 432 3 417 2 849 3
Pilot/air crew 408 2 774 5 1,182 3
Repair/engineering 4,335 26 4,506 27 8,841 26
Communications/intelligence 4,355 26 4,028 24 8,383 25
Health care 2,434 14 2,046 12 4,480 13
Other/unknown 3,193 19 3,192 19 6,385 19
Note: Covariates are the values at time of fatigue diagnosis.aInfantry/artillery/combat engineeringbInfantry/artillery/combat engineering

December 2017 Vol. 24 No. 12 MSMR Page 31
T A B L E 6 . Crude and adjusted odds ratios (AORs) for fatigue among age- and sex-matched cases and controls, by subgroup, active component, U.S. Armed Forces, 2012–2014
Variable Crude OR 95% CI p-value AOR 95% CI p-valueTotalRace/ethnicityWhite, non-Hispanic ref - - ref - -Black, non-Hispanic 1.02 0.97–1.09 .431 0.89 0.82–0.96 .002Hispanic 0.95 0.89–1.01 .120 0.96 0.88–1.04 .321Other 0.86 0.80–0.92 <.0001 0.92 0.84–1.00 .062
ServiceArmy ref - - ref - -Navy 0.70 0.66–0.74 .009 1.11 1.03–1.21 .008Air Force 1.09 1.04–1.15 <.0001 1.49 1.38–1.60 <.0001Marine Corps 0.74 0.69–0.80 <.0001 1.07 0.97–1.18 .174
Military rank/gradeJunior enlisted (E1–E4) ref - - ref - -Senior enlisted (E5–E9) 1.09 1.02–1.17 .043 1.29 1.18–1.41 <.0001Junior officer (O1–O4) 0.70 0.64–0.76 <.0001 1.29 1.15–1.44 <.0001Senior officer (O5–O10) 0.60 0.53–0.69 .001 1.37 1.15–1.63 <.001Warrant officer (W01–W05) 0.83 0.69–0.99 <.0001 1.30 1.03–1.66 .030
Military occupationCombat-specifica ref - - ref - -Motor transport 1.16 1.00–1.35 .049 0.96 0.79–1.17 .711Pilot/air crew 0.58 0.50–0.66 <.0001 0.73 0.60–0.87 .001Repair/engineering 1.08 1.00–1.16 .061 1.04 0.94–1.16 .451Communications/intelligence 1.23 1.13–1.33 <.0001 1.08 0.97–1.20 .144Health care 1.37 1.25–1.50 <.0001 1.26 1.11–1.42 <.001Other/unknown 1.12 1.04–1.22 .005 1.09 0.98–1.22 .113
Musculoskeletal disordersNo ref - - ref - -Yes 2.96 2.81–3.12 <.0001 1.74 1.64–1.86 <.0001
Mental disordersNo ref - - ref - -Yes 3.23 3.06–3.41 <.0001 1.50 1.40–1.61 <.0001
Obstructive sleep apneaNo ref - - ref - -Yes 4.86 4.51–5.24 <.0001 1.96 1.78–2.15 <.0001
Abdominal/digestive symptomsNo ref - - ref - -Yes 2.76 2.63–2.90 <.0001 1.66 1.56–1.76 <.0001
HeadacheNo ref - - ref - -Yes 3.40 3.21–3.61 <.0001 1.83 1.71–1.97 <.0001
Cardiovascular symptomsNo ref - - ref - -Yes 2.50 2.36–2.63 <.0001 1.37 1.28–1.47 <.0001
HypertensionNo ref - - ref - -Yes 1.89 1.75–2.03 <.0001 0.93 0.84–1.03 .155
Sleep disturbanceNo ref - - ref - -Yes 4.83 4.55–5.13 <.0001 2.15 2.00–2.32 <.0001
Alcohol dependenceNo ref - - ref - -Yes 1.94 1.67–2.26 <.0001 0.93 0.76–1.13 .448
Tobacco use disorderNo ref - - ref - -Yes 1.69 1.59–1.79 <.0001 1.11 1.03–1.20 .005
AsthmaNo ref - - ref - -Yes 2.30 2.03–2.60 <.0001 0.95 0.81–1.12 .534
Respiratory symptomsNo ref - - ref - -Yes 3.94 3.71–4.19 <.0001 2.00 1.86–2.16 <.0001
Overweight/obeseNo ref - - ref - -Yes 1.98 1.87–2.11 <.0001 1.09 1.00–1.17 .044
HyperlipidemiaNo ref - - ref - -Yes 1.79 1.67–1.93 <.0001 1.24 1.12–1.36 <.0001
Malignant neoplasmsNo ref - - ref - -Yes 1.76 1.52–2.04 <.0001 1.26 1.04–1.53 .018
Male hypogonadismNo ref - - ref - -Yes 9.98 7.95–12.52 <.0001 6.79 5.24–8.82 <.0001
Thyroid diseaseNo ref - - ref - -Yes 3.62 3.13–4.18 <.0001 2.68 2.24–3.20 <.0001
Blood disordersNo ref - - ref - -Yes 2.75 2.44–3.11 <.0001 2.09 1.79–2.44 <.0001
DiabetesNo ref - - ref - -Yes 2.17 1.75–2.69 <.0001 1.02 0.77–1.35 .896
aInfantry/artillery/combat engineering
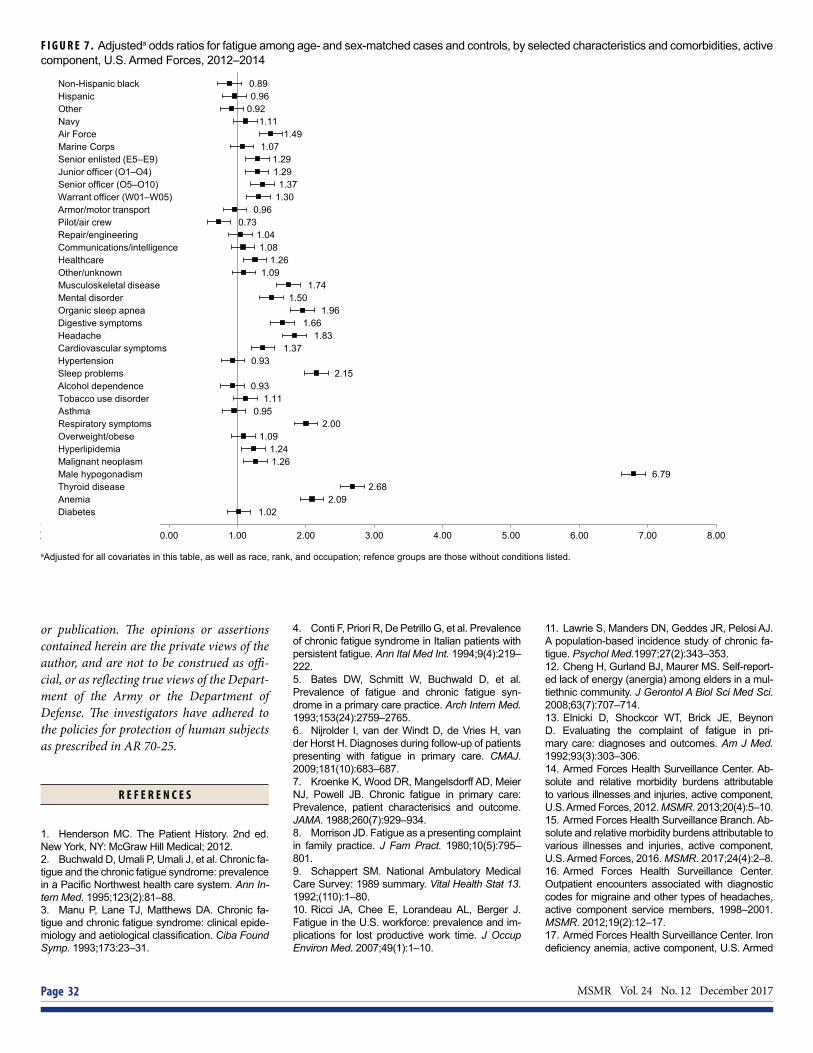
MSMR Vol. 24 No. 12 December 2017 Page 32
F I G U R E 7 . Adjusteda odds ratios for fatigue among age- and sex-matched cases and controls, by selected characteristics and comorbidities, active component, U.S. Armed Forces, 2012–2014
aAdjusted for all covariates in this table, as well as race, rank, and occupation; refence groups are those without conditions listed.
0.890.96
0.921.11
1.491.07
1.291.29
1.371.30
0.960.73
1.041.08
1.261.09
1.741.50
1.961.66
1.831.37
0.932.15
0.931.11
0.952.00
1.091.241.26
6.792.68
2.091.02
Non-Hispanic black Hispanic Other Navy Air Force Marine Corps Senior enlisted (E5–E9) Junior officer (O1–O4) Senior officer (O5–O10) Warrant officer (W01–W05) Armor/motor transportPilot/air crew Repair/engineering Communications/intelligence Healthcare Other/unknown Musculoskeletal disease Mental disorder Organic sleep apnea Digestive symptoms Headache Cardiovascular symptoms Hypertension Sleep problems Alcohol dependence Tobacco use disorder Asthma Respiratory symptoms Overweight/obese Hyperlipidemia Malignant neoplasm Male hypogonadism Thyroid disease Anemia Diabetes
-2.00 -1.00 0.00 1.00 2.00 3.00 4.00 5.00 6.00 7.00 8.00
or publication. The opinions or assertions contained herein are the private views of the author, and are not to be construed as offi-cial, or as reflecting true views of the Depart-ment of the Army or the Department of Defense. The investigators have adhered to the policies for protection of human subjects as prescribed in AR 70-25.
R E F E R E N C E S
1. Henderson MC. The Patient History. 2nd ed. New York, NY: McGraw Hill Medical; 2012.2. Buchwald D, Umali P, Umali J, et al. Chronic fa-tigue and the chronic fatigue syndrome: prevalence in a Pacific Northwest health care system. Ann In-tern Med. 1995;123(2):81–88.3. Manu P, Lane TJ, Matthews DA. Chronic fa-tigue and chronic fatigue syndrome: clinical epide-miology and aetiological classification. Ciba Found Symp. 1993;173:23–31.
4. Conti F, Priori R, De Petrillo G, et al. Prevalence of chronic fatigue syndrome in Italian patients with persistent fatigue. Ann Ital Med Int. 1994;9(4):219–222.5. Bates DW, Schmitt W, Buchwald D, et al. Prevalence of fatigue and chronic fatigue syn-drome in a primary care practice. Arch Intern Med. 1993;153(24):2759–2765.6. Nijrolder I, van der Windt D, de Vries H, van der Horst H. Diagnoses during follow-up of patients presenting with fatigue in primary care. CMAJ. 2009;181(10):683–687.7. Kroenke K, Wood DR, Mangelsdorff AD, Meier NJ, Powell JB. Chronic fatigue in primary care: Prevalence, patient characterisics and outcome. JAMA. 1988;260(7):929–934.8. Morrison JD. Fatigue as a presenting complaint in family practice. J Fam Pract. 1980;10(5):795–801.9. Schappert SM. National Ambulatory Medical Care Survey: 1989 summary. Vital Health Stat 13. 1992;(110):1–80.10. Ricci JA, Chee E, Lorandeau AL, Berger J. Fatigue in the U.S. workforce: prevalence and im-plications for lost productive work time. J Occup Environ Med. 2007;49(1):1–10.
11. Lawrie S, Manders DN, Geddes JR, Pelosi AJ. A population-based incidence study of chronic fa-tigue. Psychol Med.1997;27(2):343–353.12. Cheng H, Gurland BJ, Maurer MS. Self-report-ed lack of energy (anergia) among elders in a mul-tiethnic community. J Gerontol A Biol Sci Med Sci. 2008;63(7):707–714. 13. Elnicki D, Shockcor WT, Brick JE, Beynon D. Evaluating the complaint of fatigue in pri-mary care: diagnoses and outcomes. Am J Med. 1992;93(3):303–306.14. Armed Forces Health Surveillance Center. Ab-solute and relative morbidity burdens attributable to various illnesses and injuries, active component, U.S. Armed Forces, 2012. MSMR. 2013;20(4):5–10.15. Armed Forces Health Surveillance Branch. Ab-solute and relative morbidity burdens attributable to various illnesses and injuries, active component, U.S. Armed Forces, 2016. MSMR. 2017;24(4):2–8.16. Armed Forces Health Surveillance Center. Outpatient encounters associated with diagnostic codes for migraine and other types of headaches, active component service members, 1998–2001. MSMR. 2012;19(2):12–17.17. Armed Forces Health Surveillance Center. Iron deficiency anemia, active component, U.S. Armed

December 2017 Vol. 24 No. 12 MSMR Page 33
Forces, 2002–2011. MSMR. 2012;19(7):17–21.18. Armed Forces Health Surveillance Center.Mental disorders and mental health problems, ac-tive component, U.S. Armed Forces, 2000–2011.MSMR. 2012;19(6):11–17.19. Armed Forces Health Surveillance Center.Anxiety disorders, active component, U.S. ArmedForces, 2000–2012. MSMR. 2013;20(10):2–6.20. Armed Forces Health Surveillance Cen-ter. Diagnoses of low back pain, active compo-nent, U.S. Armed Forces, 2010–2014. MSMR.2015;22(12):8–11.21. Armed Forces Health Surveillance Cen-ter. Insomnia, active component, U.S. ArmedForces, January 2000–December 2009. MSMR.2010;17(5):12–15.22. Armed Forces Health Surveillance Center.Asthma, active component, U.S. Armed Forces,1999–2008. MSMR. 2009;16(7):5–9.23. Armed Forces Health Surveillance Center.Thyroid disorders among active component military
members, U.S. Armed Forces, 2002–2011. MSMR. 2012;19(10):7–10.24. Lee T, Williams VF, Clark LL. Incident diagno-ses of cancers in the active component and can-cer-related deaths in the active and reserve com-ponents, U.S. Armed Forces, 2005–2014. MSMR.2016;23(7):23–31.25. Lee T, Taubman SB, Williams VF. Incident diag-noses of non-melanoma skin cancer, active com-ponent, U.S. Armed Forces, 2005–2014. MSMR.2016;23(12):2–6.26. Rogers A, Stahlman S, Hunt DJ, Oh GT, ClarkLL. Obstructive sleep apnea and associated attri-tion, active component, U.S. Armed Forces, Janu-ary 2004–May 2016. MSMR. 2016;23(10):2–11.27. Stahlman S, Williams VF, Oetting AA. Viralhepatitis A, active component, U.S. Armed Forces,2007–2016. MSMR. 2017;24(5):2–5.28. Stahlman S, Williams VF, Oetting AA. Viralhepatitis B, active component, U.S. Armed Forces,2007–2016. MSMR. 2017;24(5):6–11.
29. Stahlman S, Williams VF, Hunt DJ, Kwon PO.Viral hepatitis C, U.S. military service members andbeneficiaries, 2008–2016. MSMR. 2017;24(5):12–18.30. Williams V, Stahlman S, Hu Z. Diabetes mel-litus, active component, U.S. Armed Forces, 2008–2015. MSMR. 2017;24(1):8–11.31. National Cancer Institute. Surveillance, Epi-demiology, and End Results (SEER) Data, 1973–2014. www.seer.cancer.gov. Accessed on 9 Octo-ber 2017.32. Watt T, Groenvoid M, Bjorner JB, NoerholmV, Rasmussen NA, Bech P. Fatigue in the Danishgeneral population. Influence of sociodemograph-ic factors and disease. J Epidemiol CommunityHealth. 2000;54(11):827–833.33. Skapinakis P, Lewis G, Mavreas V. Temporalrelations between unexplained fatigue and depres-sion: longitudinal data from an international studyin primary care. Psychosom Med. 2004;66(3):330–335.
MSMR’s Invitation to ReadersMedical Surveillance Monthly Report (MSMR) invites readers to submit topics for consideration as the basis for future MSMR reports. The
MSMR editorial staff will review suggested topics for feasibility and compatibility with the journal’s health surveillance goals. As is the case with most of the analyses and reports produced by Armed Forces Health Surveillance Branch staff, studies that would take advantage of the healthcare and personnel data contained in the Defense Medical Surveillance System (DMSS) would be the most plausible types. For each promising topic, Armed Forces Health Surveillance Branch staff members will design and carry out the data analysis, interpret the results, and write a manuscript to report on the study. This invitation represents a willingness to consider good ideas from anyone who shares the MSMR’s objective to publish evidence-based reports on subjects relevant to the health, safety, and well-being of military service members and other beneficiaries of the Military Health System (MHS).
In addition, MSMR encourages the submission for publication of reports on evidence-based estimates of the incidence, distribution, impact, or trends of illness and injuries among members of the U.S. Armed Forces and other beneficiaries of the MHS. Information about manuscript submissions is available at www.health.mil/MSMRInstructions.
Please email your article ideas and suggestions to the MSMR Editors at: [email protected].

MSMR Vol. 24 No. 12 December 2017 Page 34
The MSMR thanks the following individuals for reviewing manuscript submissions during 2017. We value their expertise and constructive comments.
John F. Brundage, MD, MPH (COL, USA, Ret)Leslie L. Clark, PhD, MPHMichael J. Cooper, PhD (CAPT, USPHS)Angelia A. Eick-Cost, PhD, ScMRichard G. Jarman III, PhD (LTC, USA)James D. Mancuso, MD, MPH, DrPH (LTC, USA)Jose L. Sanchez, MD, MPH (COL, USA, Ret.)Catherine Witkop, MD, MPH (COL, USAF)
Reviewer Acknowledgment 2017

December 2017 Vol. 24 No. 12 MSMR Page 35

Medical Surveillance Monthly Report (MSMR)Armed Forces Health Surveillance Branch11800 Tech Road, Suite 220 Silver Spring, MD 20904
MEDICAL SURVEILLANCE MONTHLY REPORT (MSMR), in continuous publication since 1995, is produced by the Armed Forces Health Surveillance Branch (AFHSB). The MSMR provides evidence-based estimates of the incidence, distribution, impact and trends of illness and injuries among U.S. military members and associated populations. Most reports in the MSMR are based on summaries of medical administrative data that are routinely provided to the AFHSB and integrated into the Defense Medical Surveillance System for health surveillance purposes.
Archive: Past issues of the MSMR are available as downloadable PDF files at www.health.mil/MSMRArchives.
Online Subscriptions: Submit subscription requests at www.health.mil/MSMRSubscribe.
Editorial Inquiries: Call (301) 319-3240 or send email to: [email protected].
Instructions for Authors: Information about article submissions is provided at www.health.mil/MSMRInstructions.
All material in the MSMR is in the public domain and may be used and reprinted without permission. Citation formats are available at www.health.mil/MSMR.
Opinions and assertions expressed in the MSMR should not be construed as reflecting official views, policies, or positions of the Department of Defense or the United States Government.
Follow us: www.facebook.com/AFHSBPAGE
http://twitter.com/AFHSBPAGE
ISSN 2158-0111 (print) ISSN 2152-8217 (online)
Chief, Armed Forces Health Surveillance Branch COL Douglas A. Badzik, MD, MPH (USA)
EditorFrancis L. O’Donnell, MD, MPH
Contributing EditorsLeslie L. Clark, PhD, MSShauna Stahlman, PhD, MPH
Writer/EditorValerie F. Williams, MA, MS
Managing/Production EditorElizabeth J. Lohr, MA
Layout/DesignDarrell Olson
Data AnalysisStephen B. Taubman, PhD
Editorial OversightCol Dana J. Dane, DVM, MPH (USAF) COL P. Ann Loveless, MD, MS (USA)CDR Shawn S. Clausen, MD, MPH (USN)Mark V. Rubertone, MD, MPH