· web viewchangewave research: consumer restaurant spending. changewave research: consumer...
TRANSCRIPT
ChangeWave Research: Consumer Restaurant Spending
Restaurant Spending ReportConsumers Pulling Back on Restaurant Spending
Jean Crumrine and Lusy Lisyanova
Overview: ChangeWave’s October Consumer Survey shows a decline in overall U.S. consumer spending, including a pullback for restaurants.
This report presents the results of two recent surveys on consumer dining habits – with a look at the restaurant chains showing the most and least momentum, and coffee buying trends. ChangeWave Research is a service of 451 Research.
Restaurant Spending Tightens
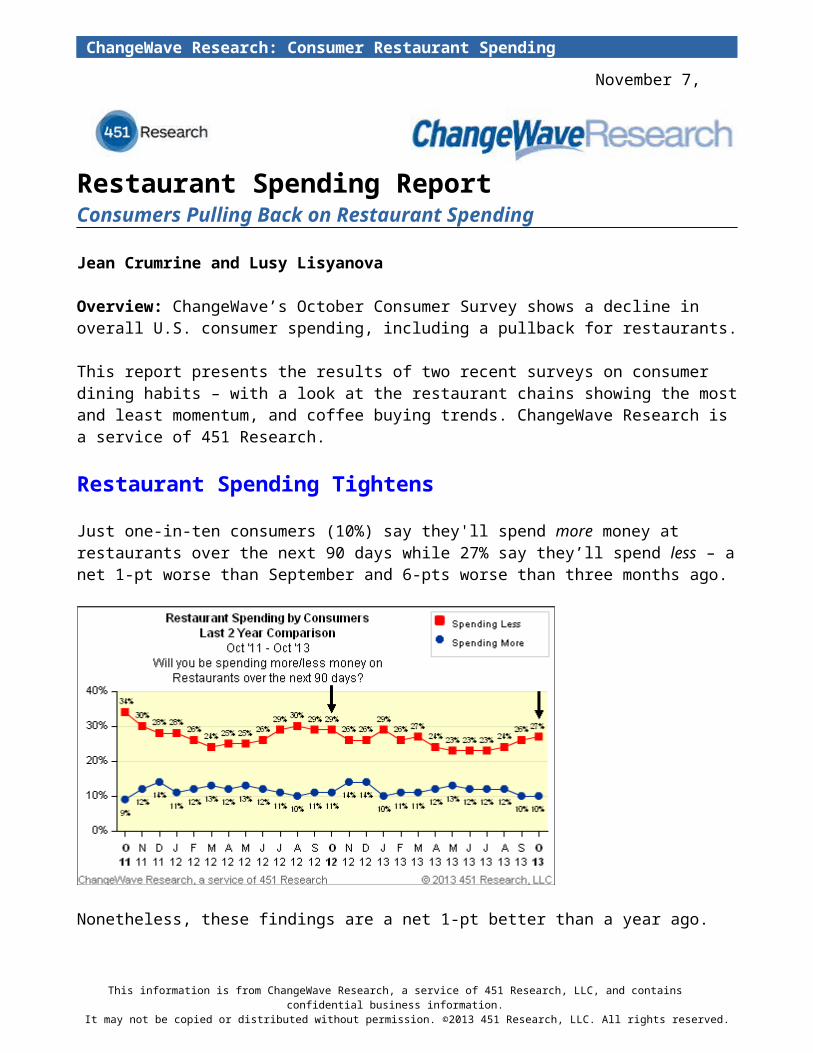
Just one-in-ten consumers (10%) say they'll spend more money at restaurants over the next 90 days while 27% say they’ll spend less – a net 1-pt worse than September and 6-pts worse than three months ago.
Nonetheless, these findings are a net 1-pt better than a year ago.
Frequency of Dining Out. Nearly a quarter of respondents (22%) say they expect to dine at restaurants Less Frequently over the next 90 days, while 18% report they’ll dine out More Frequently.
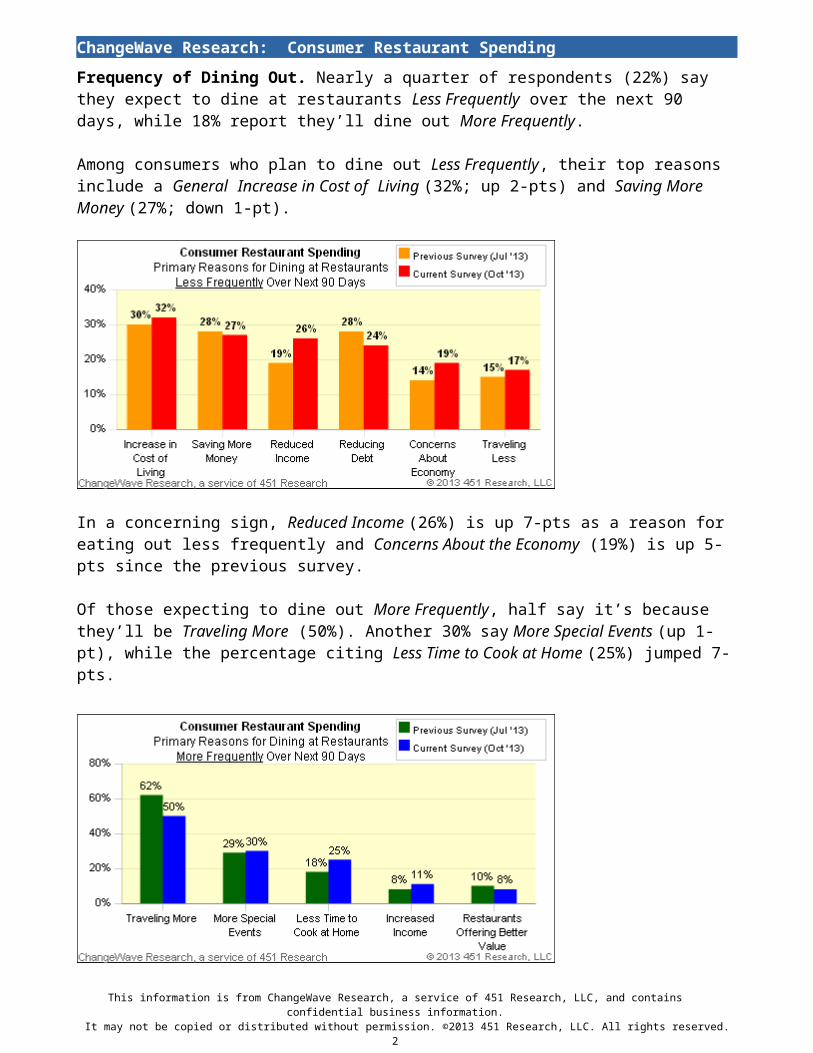
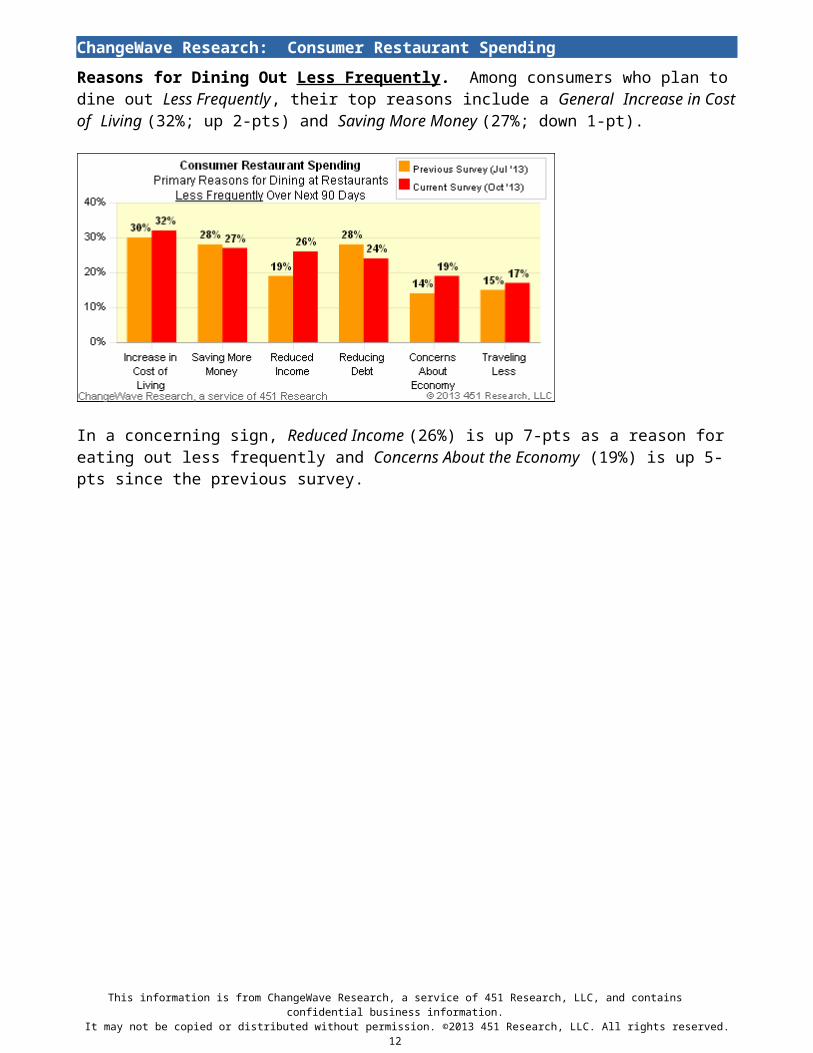
Among consumers who plan to dine out Less Frequently, their top reasons include a General Increase in Cost of Living (32%; up 2-pts) and Saving More Money (27%; down 1-pt).
This information is from ChangeWave Research, a service of 451 Research, LLC, and contains confidential business information.It may not be copied or distributed without permission. ©2013 451 Research, LLC. All rights reserved.
November 7, 2013
ChangeWave Research: Consumer Restaurant Spending
In a concerning sign, Reduced Income (26%) is up 7-pts as a reason for eating out less frequently and Concerns About the Economy (19%) is up 5-pts since the previous survey.
Of those expecting to dine out More Frequently, half say it’s because they’ll be Traveling More (50%). Another 30% say More Special Events (up 1-pt), while the percentage citing Less Time to Cook at Home (25%) jumped 7-pts.
Restaurant Categories
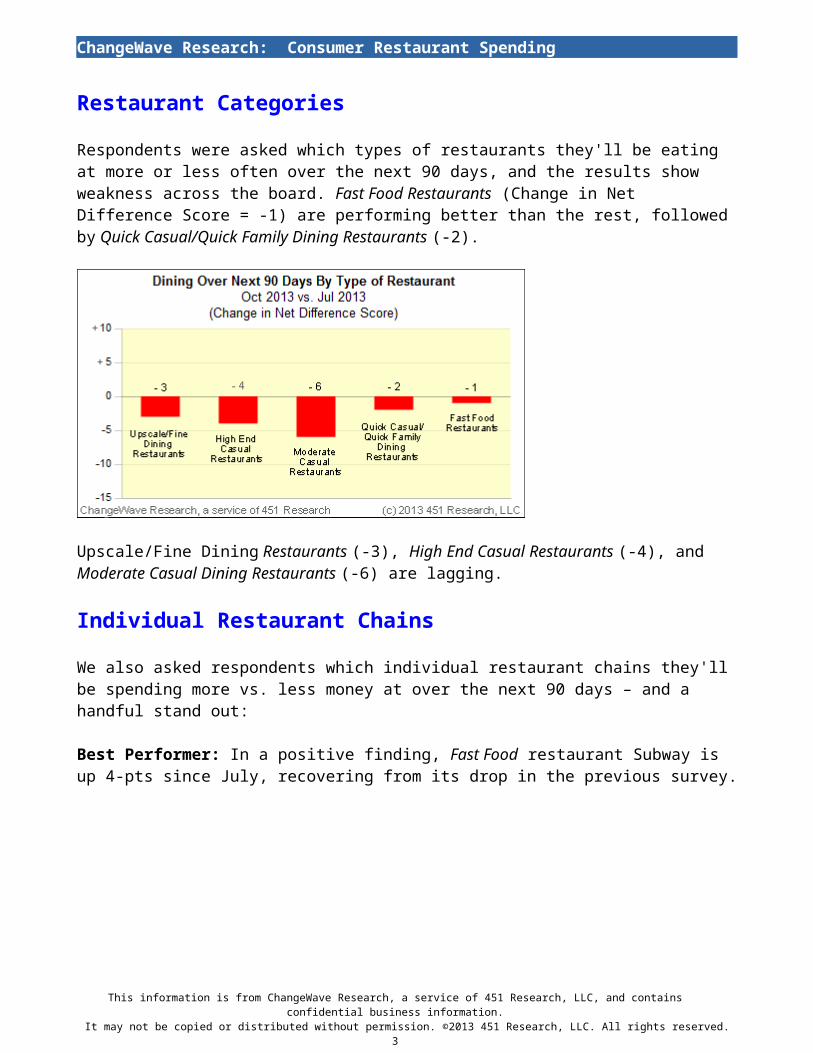
Respondents were asked which types of restaurants they'll be eating at more or less often over the next 90 days, and the results show weakness across the board. Fast Food Restaurants (Change in Net Difference Score = -1) are performing better than the rest, followed by Quick Casual/Quick Family Dining Restaurants (-2).
This information is from ChangeWave Research, a service of 451 Research, LLC, and contains confidential business information.It may not be copied or distributed without permission. ©2013 451 Research, LLC. All rights reserved.
2
ChangeWave Research: Consumer Restaurant Spending
Upscale/Fine Dining Restaurants (-3), High End Casual Restaurants (-4), and Moderate Casual Dining Restaurants (-6) are lagging.
Individual Restaurant Chains
We also asked respondents which individual restaurant chains they'll be spending more vs. less money at over the next 90 days – and a handful stand out:
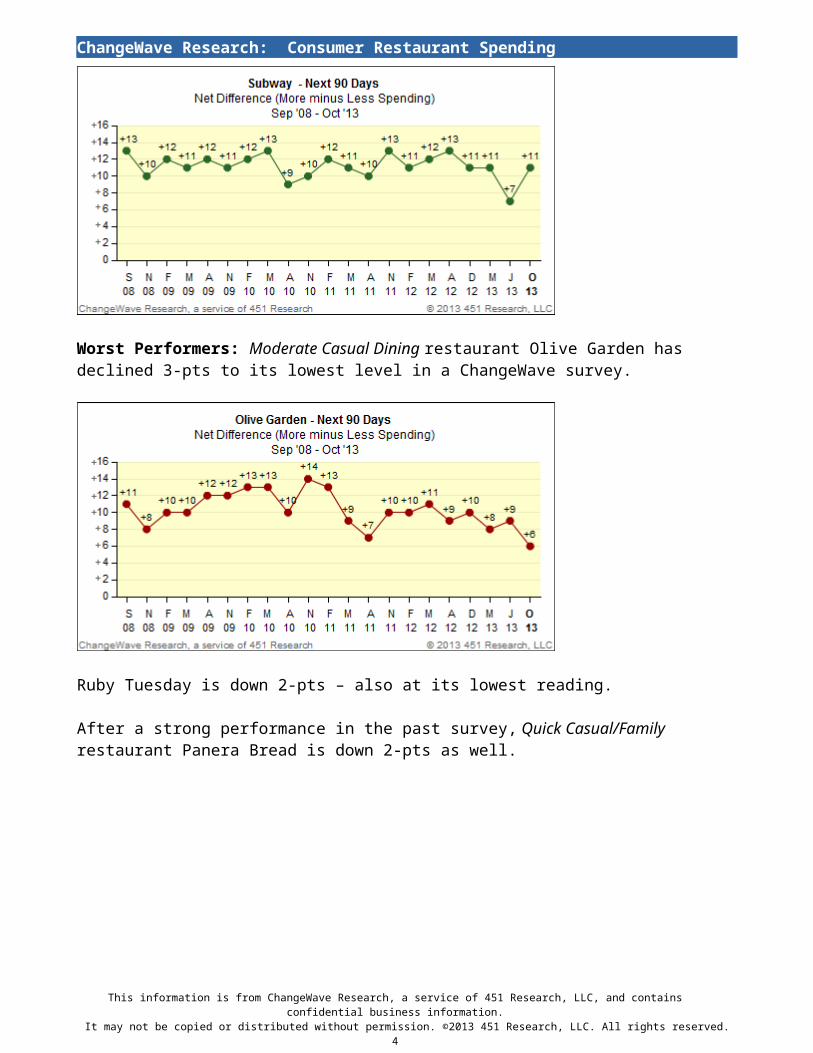
Best Performer: In a positive finding, Fast Food restaurant Subway is up 4-pts since July, recovering from its drop in the previous survey.
Worst Performers: Moderate Casual Dining restaurant Olive Garden has declined 3-pts to its lowest level in a ChangeWave survey.
This information is from ChangeWave Research, a service of 451 Research, LLC, and contains confidential business information.It may not be copied or distributed without permission. ©2013 451 Research, LLC. All rights reserved.
3
ChangeWave Research: Consumer Restaurant Spending
Ruby Tuesday is down 2-pts – also at its lowest reading.
After a strong performance in the past survey, Quick Casual/Family restaurant Panera Bread is down 2-pts as well.
Coffee Buying Trends
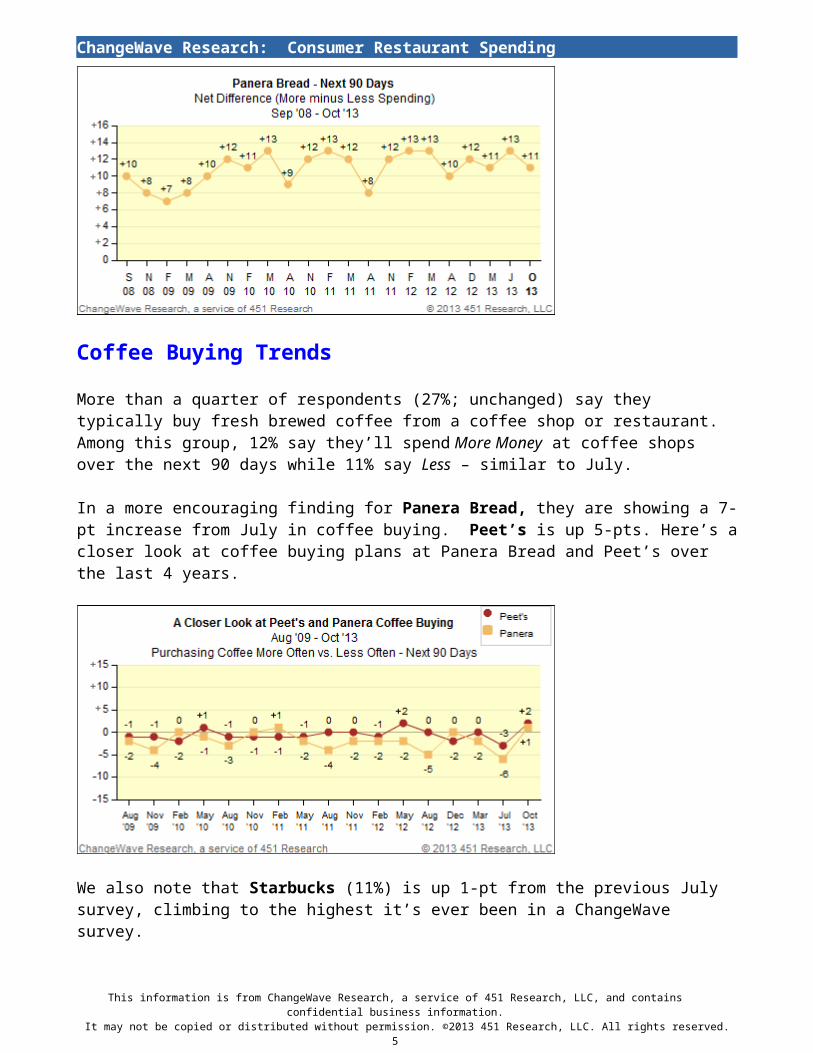
More than a quarter of respondents (27%; unchanged) say they typically buy fresh brewed coffee from a coffee shop or restaurant. Among this group, 12% say they’ll spend More Money at coffee shops over the next 90 days while 11% say Less – similar to July.
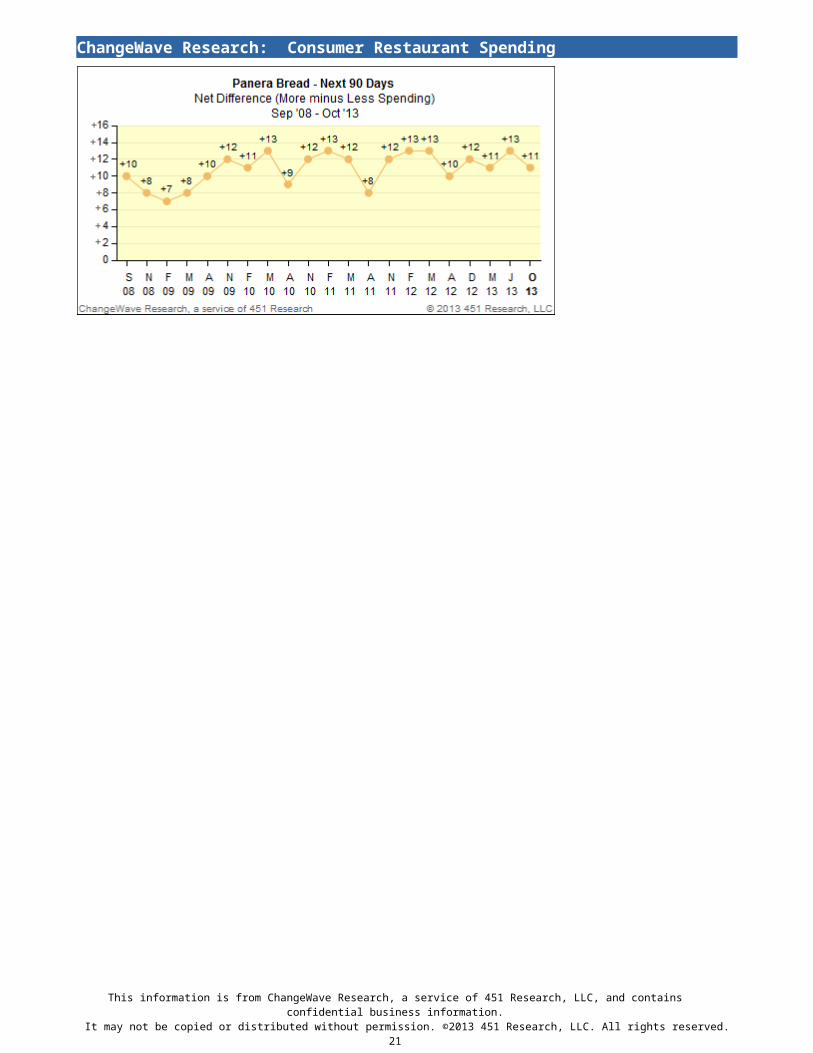
In a more encouraging finding for Panera Bread, they are showing a 7-pt increase from July in coffee buying. Peet’s is up 5-pts. Here’s a closer look at coffee buying plans at Panera Bread and Peet’s over the last 4 years.
This information is from ChangeWave Research, a service of 451 Research, LLC, and contains confidential business information.It may not be copied or distributed without permission. ©2013 451 Research, LLC. All rights reserved.
4
ChangeWave Research: Consumer Restaurant Spending
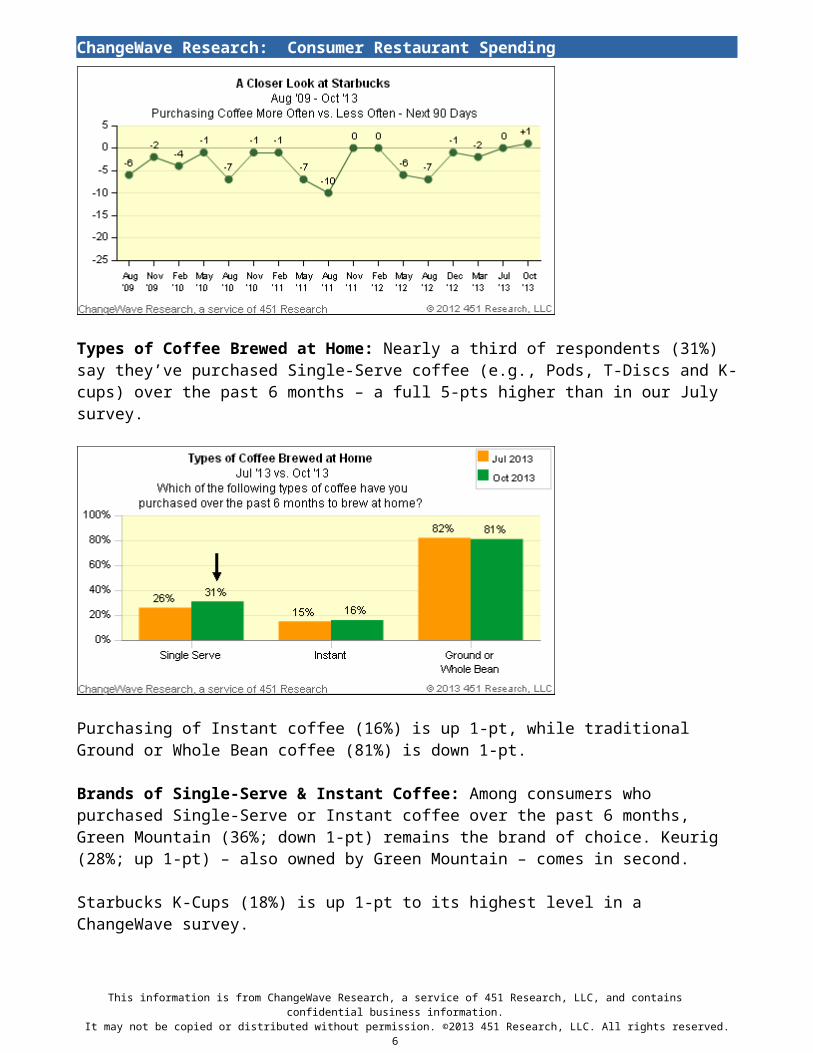
We also note that Starbucks (11%) is up 1-pt from the previous July survey, climbing to the highest it’s ever been in a ChangeWave survey.
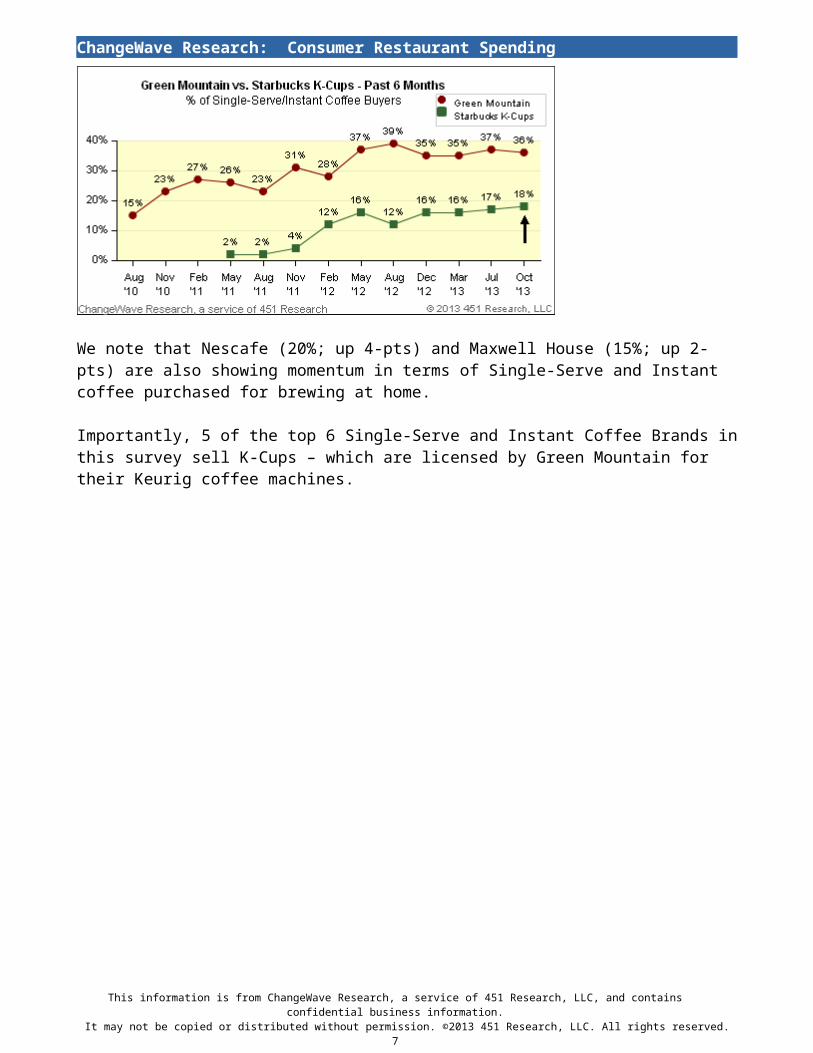
Types of Coffee Brewed at Home: Nearly a third of respondents (31%) say they’ve purchased Single-Serve coffee (e.g., Pods, T-Discs and K-cups) over the past 6 months – a full 5-pts higher than in our July survey.
This information is from ChangeWave Research, a service of 451 Research, LLC, and contains confidential business information.It may not be copied or distributed without permission. ©2013 451 Research, LLC. All rights reserved.
5
ChangeWave Research: Consumer Restaurant SpendingPurchasing of Instant coffee (16%) is up 1-pt, while traditional Ground or Whole Bean coffee (81%) is down 1-pt.
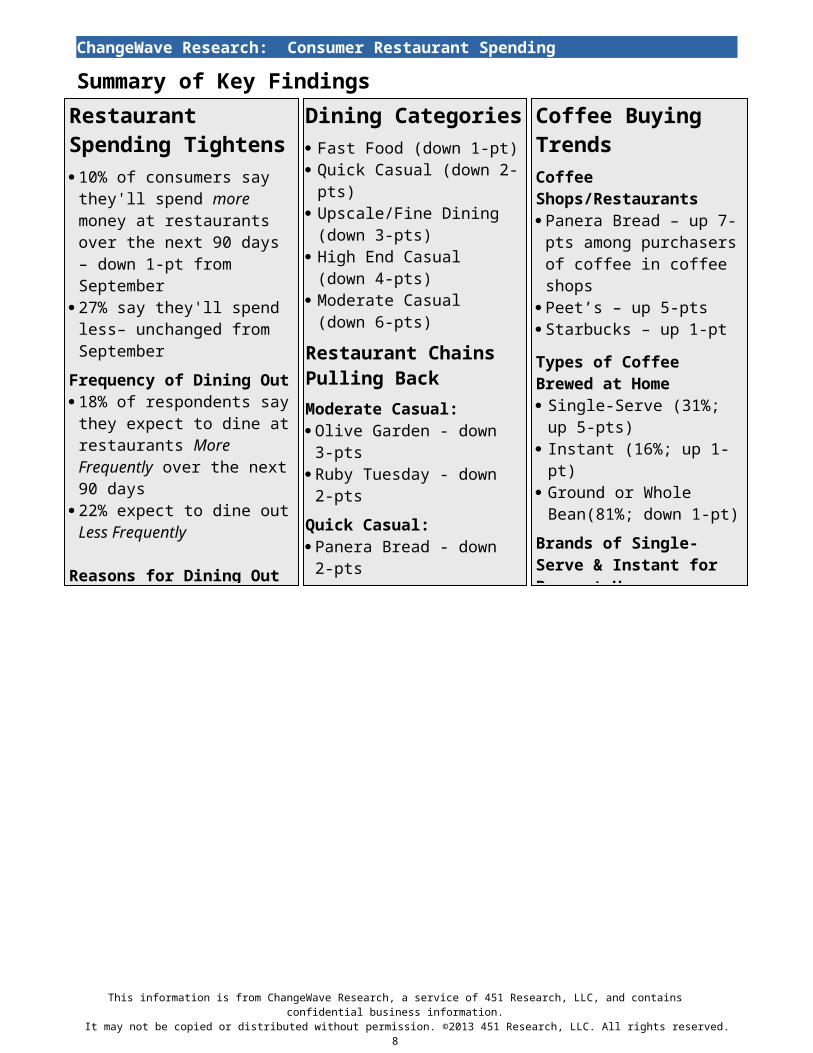
Brands of Single-Serve & Instant Coffee: Among consumers who purchased Single-Serve or Instant coffee over the past 6 months, Green Mountain (36%; down 1-pt) remains the brand of choice. Keurig (28%; up 1-pt) – also owned by Green Mountain – comes in second.
Starbucks K-Cups (18%) is up 1-pt to its highest level in a ChangeWave survey.
We note that Nescafe (20%; up 4-pts) and Maxwell House (15%; up 2-pts) are also showing momentum in terms of Single-Serve and Instant coffee purchased for brewing at home.
Importantly, 5 of the top 6 Single-Serve and Instant Coffee Brands in this survey sell K-Cups – which are licensed by Green Mountain for their Keurig coffee machines.
This information is from ChangeWave Research, a service of 451 Research, LLC, and contains confidential business information.It may not be copied or distributed without permission. ©2013 451 Research, LLC. All rights reserved.
6
ChangeWave Research: Consumer Restaurant Spending
Summary of Key Findings
The ChangeWave Research Network is a group of 25,000 highly qualified business, technology, and medical professionals in leading companies of select industries—credentialed professionals who spend their everyday lives working on the frontline of technological change. ChangeWave surveys its Alliance members on a range of business and investment research and intelligence topics, collects feedback from them electronically, and converts the information into proprietary quantitative and qualitative reports.
This information is from ChangeWave Research, a service of 451 Research, LLC, and contains confidential business information.It may not be copied or distributed without permission. ©2013 451 Research, LLC. All rights reserved.
7
Dining Categories Fast Food (down 1-pt) Quick Casual (down 2-pts) Upscale/Fine Dining
(down 3-pts) High End Casual
(down 4-pts) Moderate Casual
(down 6-pts)
Restaurant Chains Pulling BackModerate Casual: Olive Garden - down 3-pts Ruby Tuesday - down 2-ptsQuick Casual: Panera Bread - down 2-pts
Most Improved Restaurant Chain Fast Food: Subway is recovering from
it’s drop in previous survey –up 4-pts
Coffee Buying TrendsCoffee Shops/Restaurants Panera Bread – up 7-pts
among purchasers of coffee in coffee shops
Peet’s – up 5-pts Starbucks – up 1-pt
Types of Coffee Brewed at Home Single-Serve (31%; up 5-
pts) Instant (16%; up 1-pt) Ground or Whole
Bean(81%; down 1-pt)Brands of Single-Serve & Instant for Brew at Home Green Mountain (36%;
down 1-pt) is top brand Keurig (28%; up 1-pt) Starbucks K-Cups (18%)
up 1-pt to all-time high in a ChangeWave survey
Restaurant Spending Tightens 10% of consumers say they'll
spend more money at restaurants over the next 90 days – down 1-pt from September
27% say they'll spend less– unchanged from September
Frequency of Dining Out 18% of respondents say they
expect to dine at restaurants More Frequently over the next 90 days
22% expect to dine out Less Frequently
Reasons for Dining Out Less Frequently – Next 90 Days Increase in Cost of Living
(32%) Saving More Money (27%) Reduced Income (26%)
ChangeWave Research: Consumer Restaurant Spending
Table of Contents
Summary of Key Findings.............................................................................................7
The Findings...................................................................................................................9
(A) Overall Restaurant Spending Trends..................................................................9
(B) Restaurant Categories ......................................................................................14
(C) Individual Restaurant Chains............................................................................15
(D) Coffee Buying Trends........................................................................................17
ChangeWave Research Methodology........................................................................21
About ChangeWave Research....................................................................................21
About 451 Research.....................................................................................................21
This information is from ChangeWave Research, a service of 451 Research, LLC, and contains confidential business information.It may not be copied or distributed without permission. ©2013 451 Research, LLC. All rights reserved.
8
ChangeWave Research: Consumer Restaurant Spending
I. The FindingsIntroduction: ChangeWave’s October Consumer Survey shows a decline in overall U.S. consumer spending, including a pullback for restaurants.
This report presents the results of two recent surveys on consumer dining habits – with a look at the restaurant chains showing the most and least momentum, and coffee buying trends. ChangeWave Research is a service of 451 Research.
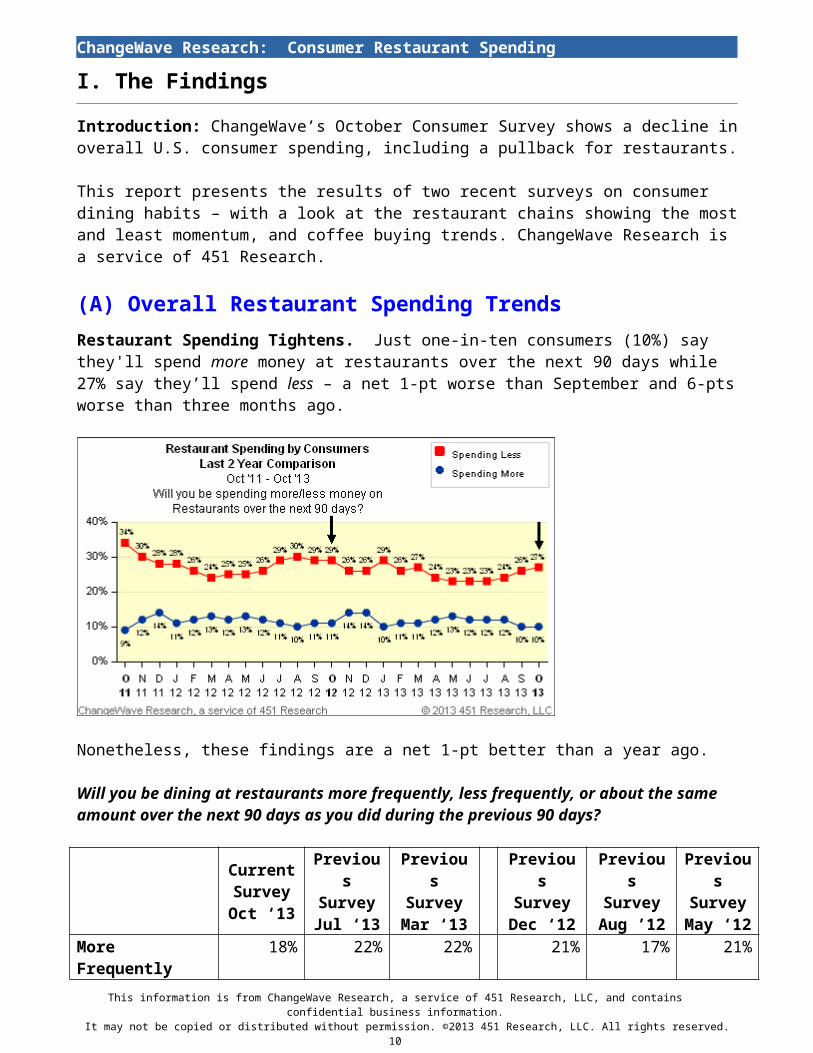
(A) Overall Restaurant Spending TrendsRestaurant Spending Tightens. Just one-in-ten consumers (10%) say they'll spend more money at restaurants over the next 90 days while 27% say they’ll spend less – a net 1-pt worse than September and 6-pts worse than three months ago.
Nonetheless, these findings are a net 1-pt better than a year ago.
Will you be dining at restaurants more frequently, less frequently, or about the same amount over the next 90 days as you did during the previous 90 days?
CurrentSurveyOct ‘13
PreviousSurveyJul ‘13
Previous SurveyMar ‘13
Previous SurveyDec ‘12
Previous SurveyAug ’12
Previous Survey May ‘12
More Frequently Than Previous 90 Days
18% 22% 22% 21% 17% 21%
Less Frequently Than Previous 90 Days
22% 19% 19% 22% 23% 17%
Same Amount as Previous 90 Days
58% 57% 57% 55% 58% 60%
Don't Know 2% 2% 2% 2% 2% 1%
This information is from ChangeWave Research, a service of 451 Research, LLC, and contains confidential business information.It may not be copied or distributed without permission. ©2013 451 Research, LLC. All rights reserved.
9
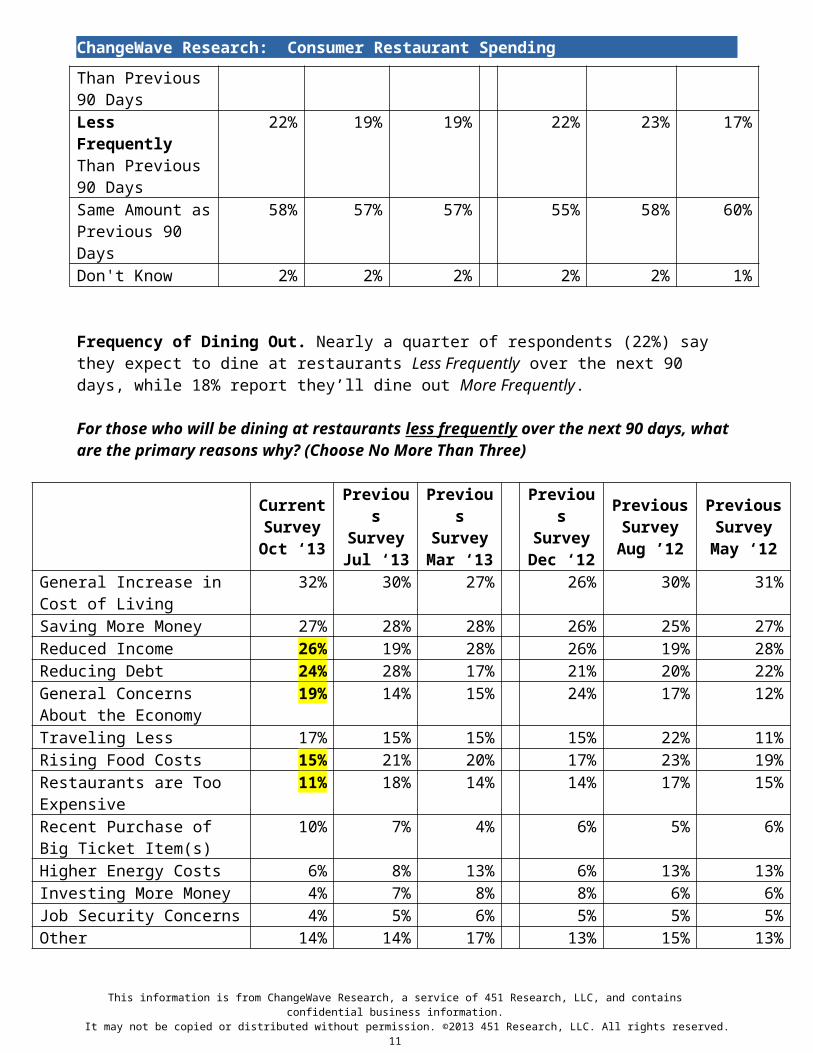
ChangeWave Research: Consumer Restaurant SpendingFrequency of Dining Out. Nearly a quarter of respondents (22%) say they expect to dine at restaurants Less Frequently over the next 90 days, while 18% report they’ll dine out More Frequently.
For those who will be dining at restaurants less frequently over the next 90 days, what are the primary reasons why? (Choose No More Than Three)
Current Survey Oct ‘13
PreviousSurveyJul ‘13
Previous Survey Mar ‘13
Previous Survey Dec ‘12
Previous Survey Aug ’12
Previous Survey May ‘12
General Increase in Cost of Living
32% 30% 27% 26% 30% 31%
Saving More Money 27% 28% 28% 26% 25% 27%Reduced Income 26% 19% 28% 26% 19% 28%Reducing Debt 24% 28% 17% 21% 20% 22%General Concerns About the Economy
19% 14% 15% 24% 17% 12%
Traveling Less 17% 15% 15% 15% 22% 11%Rising Food Costs 15% 21% 20% 17% 23% 19%Restaurants are Too Expensive
11% 18% 14% 14% 17% 15%
Recent Purchase of Big Ticket Item(s)
10% 7% 4% 6% 5% 6%
Higher Energy Costs 6% 8% 13% 6% 13% 13%Investing More Money 4% 7% 8% 8% 6% 6%Job Security Concerns 4% 5% 6% 5% 5% 5%Other 14% 14% 17% 13% 15% 13%
Reasons for Dining Out Less Frequently. Among consumers who plan to dine out Less Frequently, their top reasons include a General Increase in Cost of Living (32%; up 2-pts) and Saving More Money (27%; down 1-pt).
In a concerning sign, Reduced Income (26%) is up 7-pts as a reason for eating out less frequently and Concerns About the Economy (19%) is up 5-pts since the previous survey.
This information is from ChangeWave Research, a service of 451 Research, LLC, and contains confidential business information.It may not be copied or distributed without permission. ©2013 451 Research, LLC. All rights reserved.
10
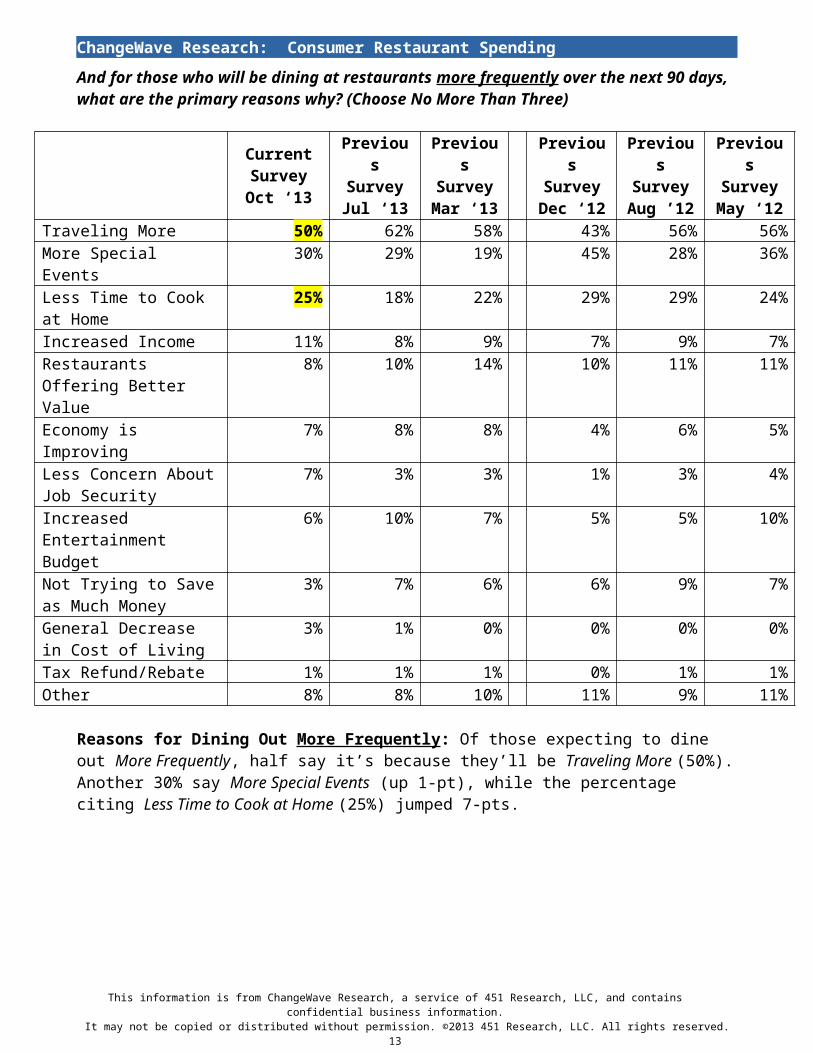
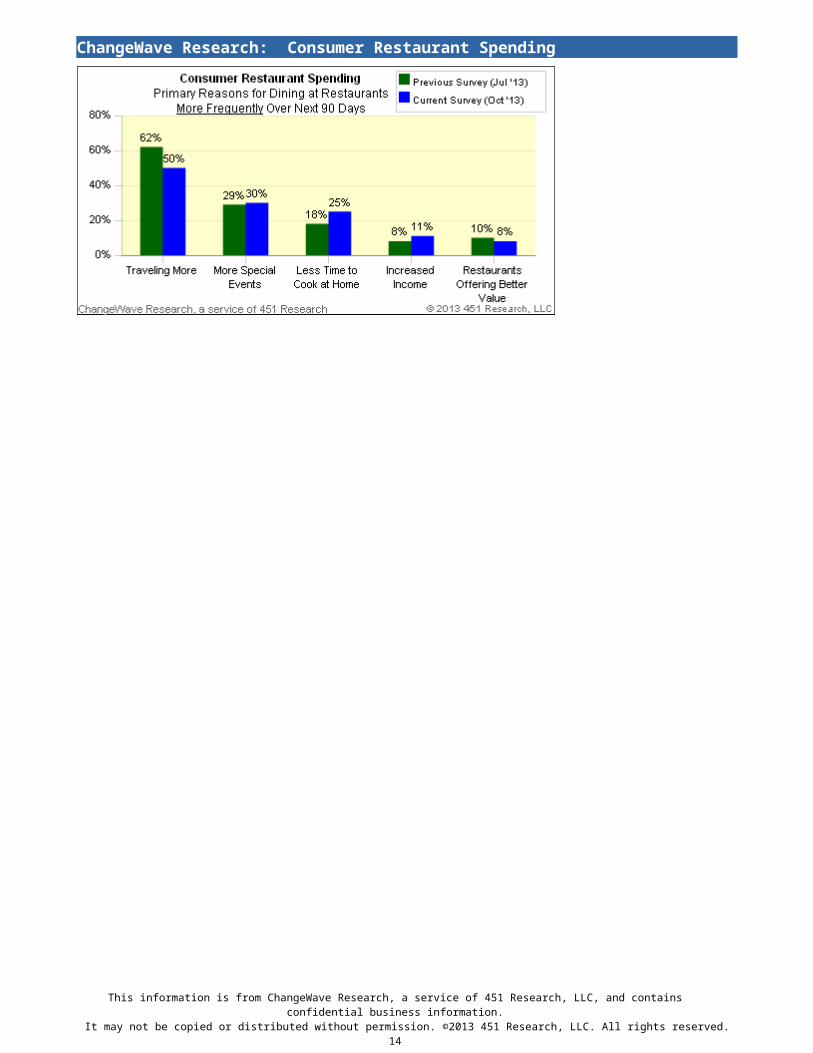
ChangeWave Research: Consumer Restaurant SpendingAnd for those who will be dining at restaurants more frequently over the next 90 days, what are the primary reasons why? (Choose No More Than Three)
CurrentSurveyOct ‘13
PreviousSurveyJul ‘13
Previous SurveyMar ‘13
Previous SurveyDec ‘12
Previous Survey Aug ’12
Previous Survey May ‘12
Traveling More 50% 62% 58% 43% 56% 56%More Special Events 30% 29% 19% 45% 28% 36%Less Time to Cook at Home
25% 18% 22% 29% 29% 24%
Increased Income 11% 8% 9% 7% 9% 7%Restaurants Offering Better Value
8% 10% 14% 10% 11% 11%
Economy is Improving 7% 8% 8% 4% 6% 5%Less Concern About Job Security
7% 3% 3% 1% 3% 4%
Increased Entertainment Budget
6% 10% 7% 5% 5% 10%
Not Trying to Save as Much Money
3% 7% 6% 6% 9% 7%
General Decrease in Cost of Living
3% 1% 0% 0% 0% 0%
Tax Refund/Rebate 1% 1% 1% 0% 1% 1%Other 8% 8% 10% 11% 9% 11%
Reasons for Dining Out More Frequently: Of those expecting to dine out More Frequently, half say it’s because they’ll be Traveling More (50%). Another 30% say More Special Events (up 1-pt), while the percentage citing Less Time to Cook at Home (25%) jumped 7-pts.
This information is from ChangeWave Research, a service of 451 Research, LLC, and contains confidential business information.It may not be copied or distributed without permission. ©2013 451 Research, LLC. All rights reserved.
11
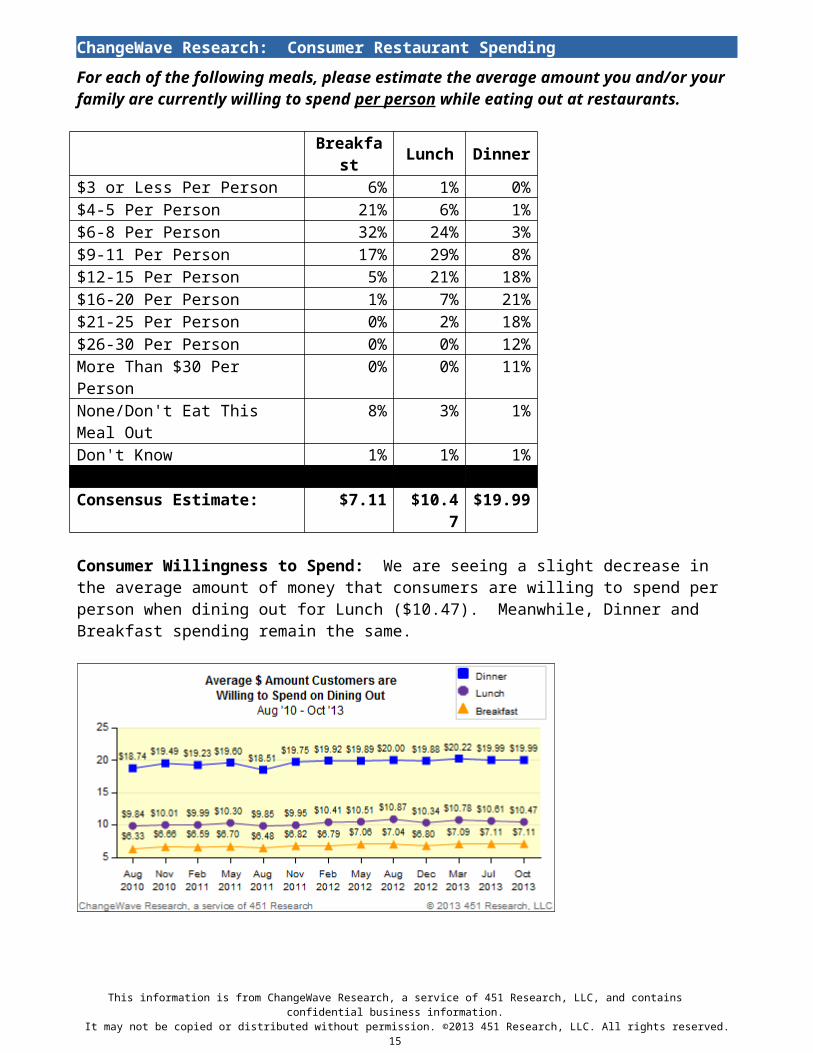
ChangeWave Research: Consumer Restaurant SpendingFor each of the following meals, please estimate the average amount you and/or your family are currently willing to spend per person while eating out at restaurants.
Breakfast Lunch Dinner$3 or Less Per Person 6% 1% 0%$4-5 Per Person 21% 6% 1%$6-8 Per Person 32% 24% 3%$9-11 Per Person 17% 29% 8%$12-15 Per Person 5% 21% 18%$16-20 Per Person 1% 7% 21%$21-25 Per Person 0% 2% 18%$26-30 Per Person 0% 0% 12%More Than $30 Per Person 0% 0% 11%None/Don't Eat This Meal Out 8% 3% 1%Don't Know 1% 1% 1%
Consensus Estimate: $7.11 $10.47 $19.99
Consumer Willingness to Spend: We are seeing a slight decrease in the average amount of money that consumers are willing to spend per person when dining out for Lunch ($10.47). Meanwhile, Dinner and Breakfast spending remain the same.
This information is from ChangeWave Research, a service of 451 Research, LLC, and contains confidential business information.It may not be copied or distributed without permission. ©2013 451 Research, LLC. All rights reserved.
12
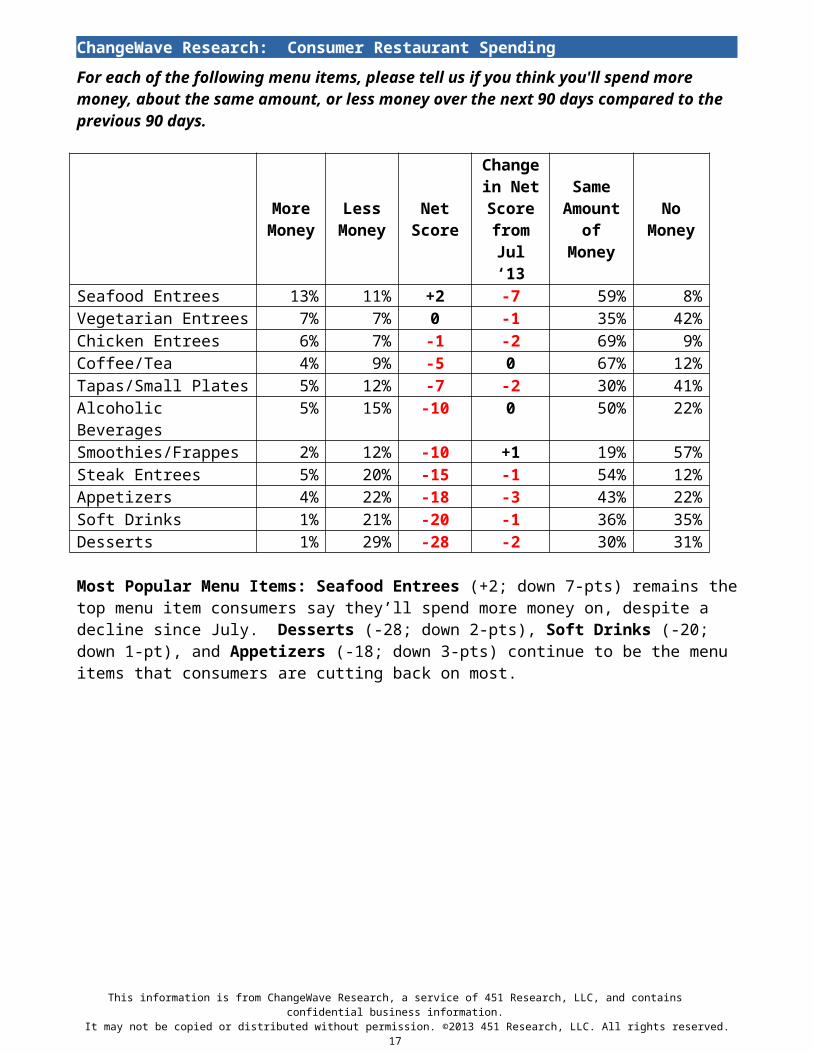
ChangeWave Research: Consumer Restaurant SpendingFor each of the following menu items, please tell us if you think you'll spend more money, about the same amount, or less money over the next 90 days compared to the previous 90 days.
More Money
Less Money
NetScore
Changein Net Scorefrom
Jul ‘13
Same Amount
of Money
No Money
Seafood Entrees 13% 11% +2 -7 59% 8%Vegetarian Entrees 7% 7% 0 -1 35% 42%Chicken Entrees 6% 7% -1 -2 69% 9%Coffee/Tea 4% 9% -5 0 67% 12%Tapas/Small Plates 5% 12% -7 -2 30% 41%Alcoholic Beverages 5% 15% -10 0 50% 22%Smoothies/Frappes 2% 12% -10 +1 19% 57%Steak Entrees 5% 20% -15 -1 54% 12%Appetizers 4% 22% -18 -3 43% 22%Soft Drinks 1% 21% -20 -1 36% 35%Desserts 1% 29% -28 -2 30% 31%
Most Popular Menu Items: Seafood Entrees (+2; down 7-pts) remains the top menu item consumers say they’ll spend more money on, despite a decline since July. Desserts (-28; down 2-pts), Soft Drinks (-20; down 1-pt), and Appetizers (-18; down 3-pts) continue to be the menu items that consumers are cutting back on most.
This information is from ChangeWave Research, a service of 451 Research, LLC, and contains confidential business information.It may not be copied or distributed without permission. ©2013 451 Research, LLC. All rights reserved.
13
ChangeWave Research: Consumer Restaurant Spending
(B) Restaurants Categories
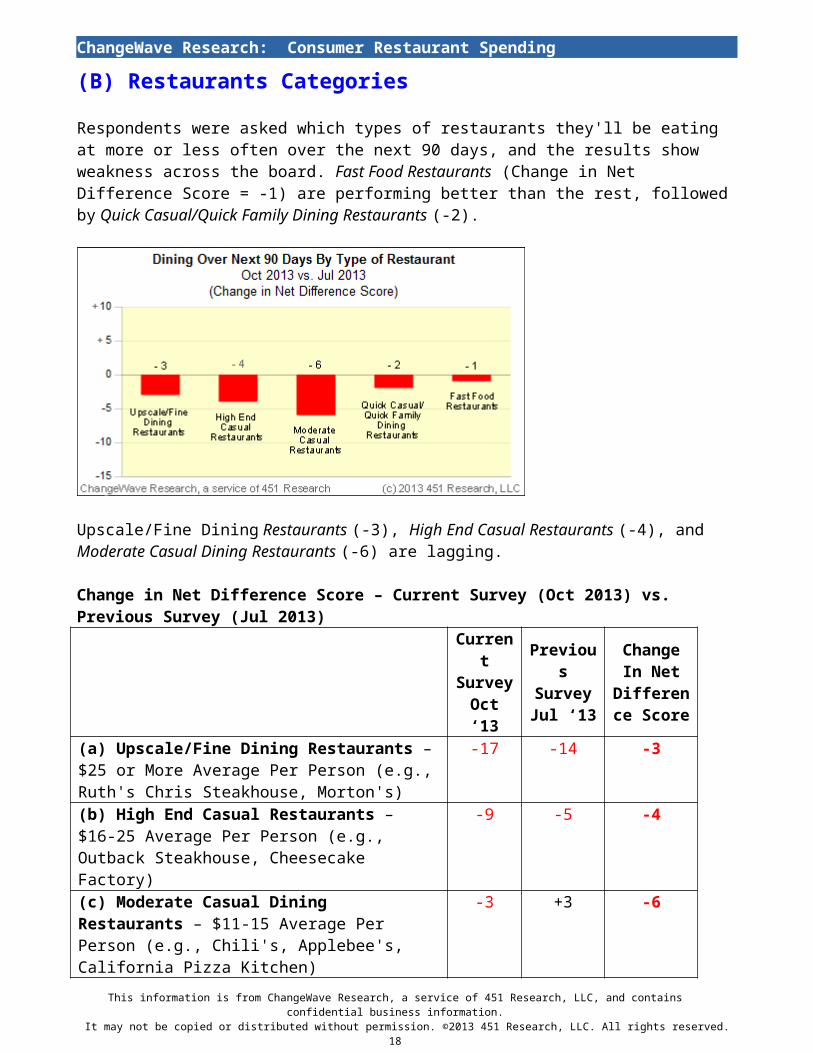
Respondents were asked which types of restaurants they'll be eating at more or less often over the next 90 days, and the results show weakness across the board. Fast Food Restaurants (Change in Net Difference Score = -1) are performing better than the rest, followed by Quick Casual/Quick Family Dining Restaurants (-2).
Upscale/Fine Dining Restaurants (-3), High End Casual Restaurants (-4), and Moderate Casual Dining Restaurants (-6) are lagging.
Change in Net Difference Score – Current Survey (Oct 2013) vs. Previous Survey (Jul 2013)
Current Survey Oct ‘13
Previous Survey Jul ‘13
ChangeIn Net
Difference Score
(a) Upscale/Fine Dining Restaurants – $25 or More Average Per Person (e.g., Ruth's Chris Steakhouse, Morton's)
-17 -14 -3
(b) High End Casual Restaurants – $16-25 Average Per Person (e.g., Outback Steakhouse, Cheesecake Factory)
-9 -5 -4
(c) Moderate Casual Dining Restaurants – $11-15 Average Per Person (e.g., Chili's, Applebee's, California Pizza Kitchen)
-3 +3 -6
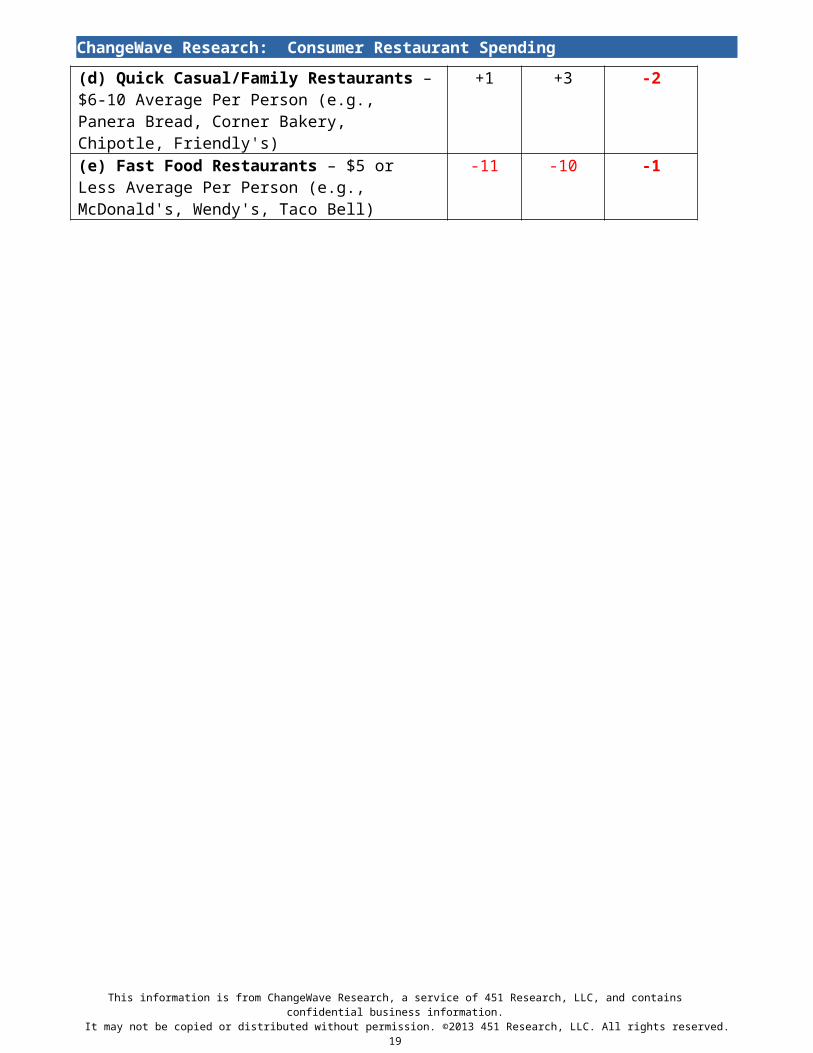
(d) Quick Casual/Family Restaurants – $6-10 Average Per Person (e.g., Panera Bread, Corner Bakery, Chipotle, Friendly's)
+1 +3 -2
(e) Fast Food Restaurants – $5 or Less Average Per Person (e.g., McDonald's, Wendy's, Taco Bell)
-11 -10 -1
This information is from ChangeWave Research, a service of 451 Research, LLC, and contains confidential business information.It may not be copied or distributed without permission. ©2013 451 Research, LLC. All rights reserved.
14
ChangeWave Research: Consumer Restaurant Spending
(C) Individual Restaurant Chains
We also asked respondents which individual restaurant chains they'll be spending more vs. less money at over the next 90 days – and a handful stand out:
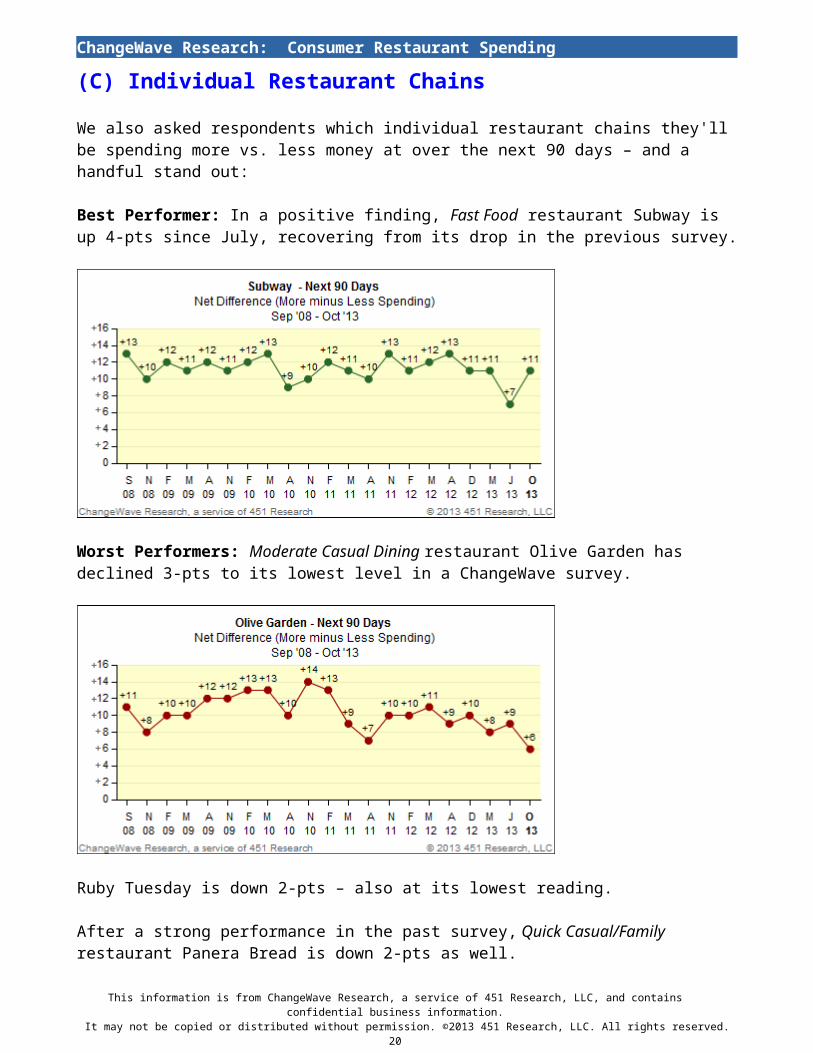
Best Performer: In a positive finding, Fast Food restaurant Subway is up 4-pts since July, recovering from its drop in the previous survey.
Worst Performers: Moderate Casual Dining restaurant Olive Garden has declined 3-pts to its lowest level in a ChangeWave survey.
Ruby Tuesday is down 2-pts – also at its lowest reading.
After a strong performance in the past survey, Quick Casual/Family restaurant Panera Bread is down 2-pts as well.
This information is from ChangeWave Research, a service of 451 Research, LLC, and contains confidential business information.It may not be copied or distributed without permission. ©2013 451 Research, LLC. All rights reserved.
15
ChangeWave Research: Consumer Restaurant Spending
This information is from ChangeWave Research, a service of 451 Research, LLC, and contains confidential business information.It may not be copied or distributed without permission. ©2013 451 Research, LLC. All rights reserved.
16
ChangeWave Research: Consumer Restaurant Spending
(D) Coffee Buying Trends
Do you typically buy fresh brewed coffee from a restaurant or coffee shop (including cappuccinos, frappuccinos, lattes, and/or iced coffees)?
CurrentSurveyOct ‘13
PreviousSurveyJul ‘13
PreviousSurveyMar ‘13
Previous SurveyDec ‘12
Previous SurveyAug ’12
Previous Survey May ‘12
Yes 27% 27% 28% 25% 32% 26%No 73% 72% 72% 75% 69% 74%
More than a quarter of respondents (27%; unchanged) say they typically buy fresh brewed coffee from a coffee shop or restaurant.
Overall, do you think you'll spend more money at coffee shops over the next 90 days, less money, or about the same amount compared to the previous 90 days?
CurrentSurveyOct ‘13
PreviousSurveyJul ‘13
PreviousSurveyMar ‘13
Previous SurveyDec ‘12
Previous SurveyAug ’12
Previous Survey May ‘12
More Money 12% 13% 12% 12% 9% 11%Less Money 11% 12% 14% 15% 14% 17%About the Same 76% 71% 70% 69% 74% 66%Don't Know /NA 1% 4% 1% 3% 3% 5%
Among this group, 12% say they’ll spend More Money at coffee shops over the next 90 days while 11% say Less – similar to July.
This information is from ChangeWave Research, a service of 451 Research, LLC, and contains confidential business information.It may not be copied or distributed without permission. ©2013 451 Research, LLC. All rights reserved.
17
ChangeWave Research: Consumer Restaurant SpendingWe want to learn more about where you will be purchasing fresh brewed coffee over the next 90 days. For each of the following places, please tell us if you plan to purchase coffee more often, about the same amount, or less often over the next 90 days compared with the previous 90 days.
More Often
Less Often
About the
Same
Current Survey
Net Difference
Score(Oct ’13)
Changein Net
Difference Score
Will Not Purchase
Coffee Here
Panera Bread 3% 2% 24% +1 +7 54%Peet's 3% 1% 12% +2 +5 64%Tim Hortons 4% 0% 14% +4 +4 64%Local Coffee Shops 11% 4% 45% +7 +4 28%Seattle's Best 1% 1% 12% 0 +3 65%Krispy Kreme 1% 2% 4% -1 +3 74%Barnes & Noble 0% 5% 13% -5 +2 65%Starbucks 11% 10% 54% +1 +1 21%Caribou Coffee 0% 2% 4% -2 0 72%The Coffee Bean 0% 1% 8% -1 0 69%Dunkin' Donuts 5% 6% 24% -1 -1 49%Brewing Coffee at Home 22% 1% 63% +21 -1 5%McDonald's 5% 8% 37% -3 -2 38%Local Convenience Stores (e.g., Wa-Wa, 7-Eleven)
3% 8% 22% -5 -4 51%
Other 1% 0% 3% +1 +1 10%
In a more encouraging finding for Panera Bread, they are showing a 7-pt increase from July in coffee buying. Peet’s is up 5-pts. Here’s a closer look at coffee buying plans at Panera Bread and Peet’s over the last 4 years.
We also note that Starbucks (11%) is up 1-pt from the previous July survey, climbing to the highest it’s ever been in a ChangeWave survey.
This information is from ChangeWave Research, a service of 451 Research, LLC, and contains confidential business information.It may not be copied or distributed without permission. ©2013 451 Research, LLC. All rights reserved.
18
ChangeWave Research: Consumer Restaurant Spending
Coffee Brewed at Home
Which of the following types of coffee have you purchased over the past 6 months to brew at home? (Check All That Apply)
CurrentSurveyOct ‘13
PreviousSurveyJul ‘13
Previous Survey Mar ‘13
Previous SurveyDec ‘12
Previous Survey Aug ’12
Previous Survey May ‘12
Single-Serve (e.g., Pods, T-Discs, K-Cups)
31% 26% 28% 26% 25% 26%
Instant (e.g., VIA, Nescafé)
16% 15% 14% 12% 13% 13%
Ground or Whole Bean (e.g., canned, bagged)
81% 82% 82% 72% 72% 71%
Other 1% 1% 2% 2% 3% 1%
Types of Coffee Brewed at Home: Nearly a third of respondents (31%) say they’ve purchased Single-Serve coffee (e.g., Pods, T-Discs and K-cups) over the past 6 months – a full 5-pts higher than in our July survey.
Purchasing of Instant coffee (16%) is up 1-pt, while traditional Ground or Whole Bean coffee (81%) is down 1-pt.
This information is from ChangeWave Research, a service of 451 Research, LLC, and contains confidential business information.It may not be copied or distributed without permission. ©2013 451 Research, LLC. All rights reserved.
19
ChangeWave Research: Consumer Restaurant SpendingAnd for those who have purchased single-serve or instant coffee, which brand of coffee did you choose? (Check All That Apply)
CurrentSurveyOct ‘13
PreviousSurveyJul ‘13
Previous Survey Mar ‘13
PreviousSurveyDec ‘12
PreviousSurveyAug ’12
Previous Survey May ‘12
Green Mountain 36% 37% 35% 35% 39% 37%Keurig 28% 27% 26% 26% 29% 26%Folgers 27% 31% 18% 15% 19% 20%Nescafe (Taster’s Choice)
20% 16% 13% 16% 16% 16%
Newman’s Own 18% 22% 18% 19% 18% 17%Starbucks K-Cups 18% 17% 16% 16% 12% 16%Maxwell House 15% 13% 10% 8% 10% 7%Nesspresso 9% 6% 6% 9% 6% 10%Tassimo 8% 4% 3% 6% 3% 3%Starbucks VIA 7% 6% 7% 8% 6% 9%Emeril’s 5% 5% 5% 3% 6% 5%Peet’s 5% 3% 1% 0% 2% 1%Senseo 2% 3% 1% 2% 3% 2%Starbuck Verismo 2% 2% NA NA NA NAOther 16% 10% 13% 7% 10% 8%
Brands of Single-Serve & Instant Coffee: Among consumers who purchased Single-Serve or Instant coffee over the past 6 months, Green Mountain (36%; down 1-pt) remains the brand of choice. Keurig (28%; up 1-pt) – also owned by Green Mountain – comes in second.
Starbucks K-Cups (18%) is up 1-pt to its highest level in a ChangeWave survey.
We note that Nescafe (20%; up 4-pts) and Maxwell House (15%; up 2-pts) are also showing momentum in terms of Single-Serve and Instant coffee purchased for brewing at home.
Folgers (27%) is down 4-pts after the burst of momentum it experienced in July.
Importantly, 5 of the top 6 Single-Serve and Instant Coffee Brands in this survey sell K-Cups – which are licensed by Green Mountain for their Keurig coffee machines.
This information is from ChangeWave Research, a service of 451 Research, LLC, and contains confidential business information.It may not be copied or distributed without permission. ©2013 451 Research, LLC. All rights reserved.
20
ChangeWave Research: Consumer Restaurant Spending
ChangeWave Research MethodologyThis report presents the findings of two ChangeWave consumer surveys. The first survey was conducted September 30 - October 21, 2013 and a total of 1,009 consumer respondents participated. The second was conducted October 1-16 and had 2,074 consumer respondents.
ChangeWave's proprietary research and business intelligence gathering system is based upon the systematic gathering of valuable business and investment information directly over the Internet from accredited members of its research network.
The business and investment intelligence provided by ChangeWave provides a real-time view of companies, technologies, and consumer and business trends in key market sectors, along with an in-depth perspective of the macro economy – well in advance of other available sources.
About ChangeWave ResearchChangeWave Research, a service of 451 Research, is a survey research firm that identifies and quantifies change in corporate buying & business trends, telecom trends, and consumer spending & electronics trends.
The ChangeWave Research Network is a group of 25,000 highly qualified business, technology, and medical professionals – as well as early adopter consumers – who work in leading companies of select industries. ChangeWave surveys its Network members weekly on a range of business and consumer topics, and converts the information into a series of proprietary quantitative and qualitative reports. ChangeWave delivers its products and services on the Web at www.ChangeWaveResearch.com.
451 Research, LLC, including its ChangeWave Research service, does not make any warranties, express or implied, as to results to be obtained from using the information in this report. Investors should obtain individual financial advice based on their own particular circumstances before making any investment decisions based upon information in this report.
About 451 Research451 Research, a division of The 451 Group, is a leading global analyst and data company focused on the business of enterprise IT innovation. Clients of 451 Research – at end-user, service-provider, vendor, and investor organizations – rely on 451 Research’s insight through a range of syndicated research and advisory services to support both strategic and tactical decision-making. For additional information on 451 Research, go to: 451research.com.
For More Information:ChangeWave Research Telephone: 301-250-23637101 Wisconsin Ave. Fax: 240-200-3988Suite 1301 www.ChangeWaveResearch.comBethesda, MD 20814 [email protected]
This information is from ChangeWave Research, a service of 451 Research, LLC, and contains confidential business information.It may not be copied or distributed without permission. ©2013 451 Research, LLC. All rights reserved.
21