vice president, marketing & client service - ladwpretirement.ladwp.com/agendaitems/agenda -...
TRANSCRIPT


0
James A. ColganCo-Portfolio Manager
Leigh Anne Yoo Vice President, Marketing & Client Service
Small Cap Growth Portfolios
June 8, 2011

1
TABLE OF CONTENTS
A.
Company Overview. . . . . . . . . . . . . . . . . .
2-8
B.
Investment Process and Discipline. . . . . . . . .
9 -12
C.
Market Overview. . . . . . . . . . . . . . . . .
.
13 -16
D.
Performance Review. . . . . . . . . . . . . . . .
17-20
E.
Portfolio Review and Characteristics. . . . . . . 21-37
F.
Fee Schedule. . . . . . . . . . . . . . . . . .
. . . . . 38
G.
Additional Information and Disclosures. . . . . 39-50
H.
Glossary of Investment Terms. . . . . . . . . . . . . 51

2
INTRODUCTION
FRONTIER CAPITAL MANAGEMENT COMPANY, LLC99 Summer StreetBoston, MA 02110Main: (617) 261-0777
James A. ColganCo-Portfolio Manager, Frontier Small Cap Growth Portfolio• 13 years with Frontier• 19 years experiencePrior ExperienceManager, Digital Equipment CorporationProgram Manager, United Technologies Corporation EducationB.S. University of ConnecticutM.S. University of MassachusettsM.S., M.B.A. MIT Sloan School of Management
Leigh Anne YooVice President, Institutional Marketing and Client Service• 3 years with Frontier• 11 years experiencePrior ExperienceVice President, Lazard Asset ManagementEducationB.B.A. University of Georgia

3
WHAT DISTINGUISHES FRONTIER?Proven discipline in bottom-up, fundamental investing
FocusAsset management is our only business 30-year expertise in managing long-only U.S. equity portfolios for institutional investorsCommitment to clients and strong long-term performance results
Collaborative ProcessFirm of analysts focused on deep researchIdea generation and due diligence conducted by entire investment teamAnalysts specialize by industry across all market caps
PeoplePassionate, experienced professionalsContinuity among investment teamBroad distribution of equity ownership across the firm

4
FRONTIER PORTFOLIOS
LENGTH OF RECORDUNIVERSE QUARTILE RANKING*
SINCE INCEPTIONFRONTIER STRATEGY
Small Growth Small 26¼ Years FIRST QUARTILE
Capital Appreciation Smid 24¼ Years FIRST QUARTILE
Mid Growth Mid 19¼ Years FIRST QUARTILE
Small Value Small 12¼ Years FIRST QUARTILE
Smid Research Smid 11 Years FIRST QUARTILE
CAPITALIZATION EMPHASIS
$11.2 Billion in assets under management firmwide as of April 30, 2011$3.9 Billion in assets under management for Small Cap Growth as of April 30, 2011All of Frontier’s small, smid, and mid products are first quartile since inception
*Universe rankings were for periods ending 3/31/11 using eVestment Alliance universes. The eVestment Alliance small cap growth universe was used to rank the Frontier Small Growth strategy. The eVestment Alliance small mid cap growth universe was used to rank the Frontier Capital Appreciation strategy and Smid Research strategy. The eVestment Alliance mid cap growth universe was used to rank the Frontier Mid Growth strategy. The eVestment Alliance small cap value universe was used to rank the Frontier Small Value strategy.
Proven experience in U.S. small and mid cap equity investing

5
FRONTIER ORGANIZATIONAL CHART
WILLIAM J. BALLOUCHIEF OPERATING OFFICERGENERAL COUNSEL & CCO
Administrative Staff
HALLIE BROXKRISTINA CATINAZZOMEREDITH KENNEDYSARAH NEILYANGELA POWERS-NAPOLITANO
SARAH J. JANKOWSKICHIEF ADMINISTRATIVE OFFICER
Operations
FORREST H. LETARTEOPERATIONS MANAGER
CYNTHIA A. TREGGIARIASSISTANT VICE PRESIDENT
STEVEN P. TRICCOASSISTANT VICE PRESIDENT
EDWARD VASQUEZOPERATIONS ASSOCIATE
Employee owners
Marketing
LEIGH ANNE YOOVICE PRESIDENT
CHRISTOPHER W. PREMOCKVICE PRESIDENT
Financial
RICHARD H. BINDER, CPACHIEF FINANCIAL OFFICER
CHRISTINA ABADIERASSISTANT VICE PRESIDENT
Trading
CAROLYN C. SHEAVICE PRESIDENT
LISA A. TURLEYVICE PRESIDENT
Investment Team
JAMES A. COLGANPortfolio Manager – Small Cap Growth
G. MICHAEL NOVAK, JR.Portfolio Manager – Small Cap Growth
WILLIAM A. TEICHNER, CFAPortfolio Manager – Small Cap Value
THOMAS (T.J.) W. DUNCAN, JR.Portfolio Manager – Small Cap Value
CHRISTOPHER J. SCARPAAnalyst – EnergyAsst. Portfolio Manager – Mid Cap Growth
ANDREW B. BENNETT, CFAAnalyst – Media / Telecom / LeisureAsst. Portfolio Manager – Capital Appreciation
PETER G. KUECHLEAnalyst – Financial Services / SoftwareTeam Leader – Research Portfolios
JONATHAN M. LEVIN, MDAnalyst – Health Care
RUSHAN (GREG) JIANG, CFAAnalyst – Industrials / Business Services
RAVI DABASAnalyst – Computer Services / Technology
NATHAN A. HAYMANAnalyst – Aerospace / Transportation / Housing
KRISTIN S. KINGAnalyst – Consumer
MICHAEL E. GARGANOAnalyst – Health Care Services / Technology Hardware
Information Technology
WILLIAM (SKIP) A. CARINONETWORK / IT MANAGER
DAVID OKEREKEASSISTANT SYSTEMS ADMINISTRATOR
AMY L. JANEZICVICE PRESIDENT
KIMBERLY J. WITTOCKCLIENT SERVICE ASSOCIATE
EMMA ZACKMARKETING ASSOCIATE
Client Service
STEPHEN M. KNIGHTLY, CFAPRESIDENTPortfolio Manager – Mid Cap Growth
MICHAEL A. CAVARRETTA, CFACHAIRMANPortfolio Manager – Capital Appreciation Team Leader – Research Portfolios

6
INVESTMENT TEAM
Employee owners
WILLIAM A. TEICHNER, CFAPortfolio Manager – Small Cap ValueBA – Columbia UniversityMBA – Harvard University
19 years with Frontier21 years experience
STEPHEN M. KNIGHTLY, CFAPRESIDENTPortfolio Manager – Mid Cap GrowthBS – Lehigh UniversityMBA – University of Pennsylvania
19 years with Frontier21 years experience
ANDREW B. BENNETT, CFAAnalyst – Media / Telecom / LeisureAsst. Portfolio Manager – Capital AppreciationBA – Wheaton College
10 years with Frontier15 years experience
PETER G. KUECHLEAnalyst – Financial Services / SoftwareTeam Leader – Research PortfoliosBA – Dartmouth CollegeMBA – Harvard University
9 years with Frontier15 years experience
JONATHAN M. LEVIN, MDAnalyst – Health Care BA – Yale UniversityMD – Emory University School of MedicineMPH – Harvard School of Public HealthMBA – MIT
7 years with Frontier8 years experience
RUSHAN (GREG) JIANG, CFAAnalyst – Industrials / Business ServicesBS – The University of Texas at AustinMS – Stanford UniversityMBA – MIT
6 years with Frontier8 years experience
CHRISTOPHER J. SCARPAAnalyst – EnergyAsst. Portfolio Manager – Mid Cap GrowthBA – Tufts UniversityMBA – Harvard University
10 years with Frontier12 years experience
RAVI DABASAnalyst – Computer Services / Technology BE – University of New DelhiMS – University of HoustonMBA – University of Pennsylvania
4 years with Frontier12 years experience
KRISTIN S. KINGAnalyst – ConsumerBS – University of Notre DameMBA – University of Pennsylvania
2 years with Frontier6 years experience
NATHAN A. HAYMANAnalyst – Aerospace / Transport. / HousingLLB – Hebrew University Law SchoolMBA – Dartmouth College
3 years with Frontier3 years experience
MICHAEL A. CAVARRETTA, CFACHAIRMANPortfolio Manager – Capital AppreciationTeam Leader – Research PortfoliosBA – University of MaineMBA – Harvard University
23 years with Frontier27 years experience
MICHAEL E. GARGANOAnalyst – Health Care Services /
Technology HardwareBS – Boston College
1 year with Frontier13 years experience
THOMAS W. DUNCAN, JR.Portfolio Manager – Small Cap ValueBA – Skidmore CollegeMBA – Cornell University
18 years with Frontier20 years experience
CAROLYN C. SHEASenior TraderBA – St. Lawrence University
10 years with Frontier20 years experience
LISA A. TURLEYSenior TraderBA – University of Massachusetts
20 years with Frontier20 years experience
G. MICHAEL NOVAK, JR.Portfolio Manager – Small Cap GrowthBS – US Military AcademyMBA – Harvard University
13 years with Frontier13 years experience
JAMES A. COLGANPortfolio Manager – Small Cap GrowthBS – University of ConnecticutMS – University of MassachusettsMS, MBA – MIT
13 years with Frontier19 years experience

7
REPRESENTATIVE CLIENT LIST
Endowments and Foundations
The Academy of American PoetsAkron Community FoundationThe Andrew W. Mellon FoundationArchdiocese of BostonArchdiocese of WashingtonBaptist Hospitals and Health SystemsBoston CollegeBowdoin CollegeButler HospitalCatholic Schools FoundationCatholic Society of Religious
& Literary Education
Crotched Mountain FoundationElyria Memorial HospitalGettysburg CollegeHampton University
Hillside Family of AgenciesLehigh UniversityLibrary of CongressLos Angeles Orthopedic Foundation
Michigan State UniversityMotion Picture and Television FundMusic Academy of the West
National Gallery of ArtThe New York Community TrustNorwich UniversityProMedica Health System
QueensCareRegenstrief Foundation Richard Nixon LibrarySan Diego Museum of Art
Santa Barbara Museum of ArtSearle Family TrustsSegerstrom Center for the ArtsSisters of Mercy Health System
Society of Jesus, New EnglandSouthcoast Health SystemThe Texas A&M University SystemTulane UniversityUnited States Tennis AssociationUniversity of Nebraska FoundationUniversity of RedlandsUniversity of San Diego
University of San FranciscoUniversity of ScrantonUniversity of the Pacific
Corporate
BIMCOR Inc.Bristol Myers SquibbCareGroupThe Church Pension FundComprehensive Healthcare of OhioCooley Dickinson HospitalCPS EnergyErie InsuranceThe First Church of Christ, ScientistGeneral MotorsGoodyear Tire & Rubber CompanyJicarilla Apache NationMarsh & McLennan Companies Inc.Mary Kay Inc.Massachusetts Eye & Ear InfirmaryMomentive Specialty Chemicals Inc.NV EnergyPension Plan for Insurance OrganizationsRPM Inc.R.R. Donnelley & Sons CompanySouth County HospitalSusquehanna Health SystemTufts Associated Health Maintenance
Organization Inc.University of Pittsburgh Medical CenterVerizon CommunicationsWindstream CorporationWorld Kitchen Inc.
Public Funds
City of PittsburghCounty Employees’ and Officers’ Annuity and Benefit
Fund of Cook County Illinois Municipal Retirement FundL.A. County Employee Retirement AssociationL.A. Fire & PoliceTeachers’ Retirement System of IllinoisTeachers’ Retirement System of Oklahoma
Multi-Employer
Airconditioning and Refrigeration IndustryInternational Association of MachinistsIron Workers Local No. 25
Iron Workers of New EnglandNorthwest Ohio Carpenters, Millwrights and Pile
Drivers Supplemental Pension PlanSteelworkers Pension Trust
Sub Advisory
Diversified Alpha Small Cap Equity FundHirtle Callaghan TrustJohn Hancock
Morgan Stanley Smith Barney Select UMAPrudential RetirementSchwab Managed Account Select The Northern Trust Company
The Vanguard Group
Long-term client relationships
The representative client list is a partial list of Frontier's institutional clients regardless of investment product utilized and without regard to performance criteria. Inclusion on such a list is not intended as an endorsement by any such client of Frontier or the advisory services provided to such client and is intended to provide a meaningful distribution of Frontier's clients.
Highlighted names indicate Frontier Small Cap Growth clients

8
KEY CONTACTS
FRONTIER CAPITAL MANAGEMENT COMPANY, LLC99 Summer StreetBoston, MA 02110Main: (617) 261-0777
CLIENT SERVICESarah J. Jankowski, Chief Administrative Officer(617) 261-0777 [email protected] Anne Yoo, Vice President(617) 261-0777 [email protected]
OPERATIONSGroup Email: [email protected] Actions/Tender Offers/Trades Operations: Primary ContactEdward Vasquez, Operations Representative(617) 261-0670 (direct)Operations: Secondary & Escalation ContactsForrest LeTarte, Operations Manager(617) 261-0777 x112Cynthia Treggiari, Assistant Vice President(617) 261-7570 (direct)Steven Tricco, Operations Assistant Vice President(617) 261-0680 (direct)
ACCOUNTINGRichard Binder, Chief Financial Officer(617) 261-0777 [email protected] Abadier, Assistant Vice President(617) 261-0777 [email protected]
INFORMATION TECHNOLOGYSkip Carino, Network / IT Manager(617) 261-0777 [email protected]
LEGAL / COMPLIANCEWilliam J. Ballou, Chief Operating/Compliance Officer(617) 261-0777 [email protected]

9
FRONTIER SMALL CAP GROWTH SUMMARY
Small Cap Growth Product Highlights:Strong consistent 26¼ year track record (since 1985)
- 16.0% composite annualized returns vs. 8.2% for Russell 2000 Growth since inception (as of 4/30/11)
- Beat Russell 2000 Growth in 21 of 26 years
- Outperformed the Russell 2000 Growth in every down market year since inception
Closed to new accounts
- Assets under management $3.9 billion (as of 4/30/11)
- Accept flows from existing clients
Style: Growth at Reasonable Prices (GARP)Bottom-up research intensive process
Long term orientation with relatively low turnover (typically 35 - 45% per year)
Focus on “good” businesses, i.e. those with potential to generate above average returns on capital over a business cycle

10
BUY
SOLIDBUSINESS MODEL
UNRECOGNIZEDEARNINGS
POWER
ATTRACTIVE VALUATION
We believe there are three key drivers of long-term consistent performance
INVESTMENT PHILOSOPHY – WHAT WE BUY

11
INITIAL UNIVERSE
2,000Stocks
TARGET MARKET
~500Stocks
INVESTABLE
~250Stocks
PORTFOLIO
90-110Stocks
Market Cap Appropriate
•
2,000 stocks (within the range of the Russell 2000 Index)
Quantitative Assessment
•
Reasonable EV/Sales
•
Good balance sheets
•
Underlying growth
Investable Criteria
•
Sound business model
•
Solid management
•
Competitive advantage
•
Appealing revenue growth
•
Potential margin expansion
•
Attractive ROC opportunity
Winning Qualities
•
Unrecognized EPS power
•
Value creating catalysts
•
Attractive valuations
•
Multiple ways to win
80% of investment effort focusedon 15% of the universe
Frontier Value Added
CONTINUOUS
RESEARCH
PROCESS
Ongoing Assessment
•
Traction toward projected EPS power
•
Price target realization
•
Change in thesis
•
Portfolio optimization
INVESTMENT PROCESS – HOW WE BUY

12
INVESTMENT GUIDELINESPortfolio Guidelines
The Portfolio shall be equity securities of companies doing business in the United States. It is expected that the Portfolio will be fully invested (<5% cash) at all times. Equity securities shall be restricted to those issues listed on the New York, American, NASDAQ, or other nationally recognized United States stock exchanges.
The Board recognizes Managers are active managers investing in a universe of securities that resembles the Russell 2000 Growth Index. Managers will adjust their Portfolio on an ongoing basis to attempt to outperform the investment results of the Russell 2000 Growth Index.
Managers shall not use derivatives within the Portfolio without the expressed written consent of the Plan. If Managers elect to use derivatives as part of their investment strategy, the Plan requires that Managers provide written documentation of the rationale for using such instruments. Use of derivatives for speculation is prohibited. Only exchange-traded derivatives will be utilized.
For prudent diversification, no more than 5% of the lesser of cost or market value of the Portfolio shall be invested in any one issue, unless that issue represents more than 5% of the Russell 2000 Growth Index. No issue shall be purchased in the Portfolio if more than 10% of the outstanding shares of that company are held by Managers in the total of all of its accounts.
The Manager shall invest in securities specifically authorized in these written guidelines. Unauthorized investments include foreign securities listed and traded on U.S. exchanges, including American Depository Receipts (ADRs). Securities of all foreign companies, except for Benefit Driven Incorporations (BDIs) included in the Russell Indexes, are unauthorized. Additional unauthorized investments include short sales, futures, direct investment in raw commodities, and the use of non-approved derivative securities (i.e. equity futures and forward contracts), and/or the purchase of securities on margin.
Portfolio Characteristics
It is expected that the Portfolio's weighted average price/earnings ratio on a 12-month trailing basis in general will be no less than 2/3rds of the market as represented by Russell 2000 Growth Index.
It is expected that the Portfolio’s weighted average dividend yield on a quarterly basis will be no greater than 1.5x of the market as represented by the Russell 2000 Growth Index.
It is expected that the Portfolio's market sensitivity (beta) should be no less than 0.80 and no greater than 1.3 versus the Russell 2000 Growth Index on a rolling 24-month basis, using monthly holdings data.
It is expected that the Portfolio’s weighted average market capitalization should be no less than $400 million.
It is expected that the Portfolio’s performance correlation (R-Squared) to the Russell 2000 Growth Index should not be less than 0.70.
Yes No
�
�
�
�
�
�
�
�
��

13
EQUITY MARKET OVERVIEW As of April 30, 2011
Economic Cycle Backdrop
The Fed has maintained an accommodative stance since the financial crisis. Money supply has grown significantly but the velocity of money has remained low as households have paid down debt and increased their savings rate. While the unemployment level remains high, the worst of the layoffs are behind the U.S. and new jobless claims have improved significantly. The stock market has responded to the improvements, economic leading indicators have followed historic recovery patterns, and corporate earnings have rebounded sharply. While the rebound in economic growth is below the past few recoveries, U.S. companies continue to control cost and are benefiting from growth in opportunities abroad. We expect further increases in corporate earnings to drive higher equity prices.
Current Economic Conditions
U.S. GDP growth slowed to a 1.8% annual rate in the first quarter, well below the fourth quarter’s 3.1% pace, as exports expanded less rapidly, consumer purchasing slowed in the wake of higher gas and food prices, and budget troubles crimped state and local government spending. Manufacturing remains a bright spot as March durable goods orders rose 2.5% and exceeded views. Core capital goods orders, a proxy for business investment, climbed 3.7% during the month. While the ISM manufacturing index slipped to 60.4 in April from 61.2 in March, it remains at a very strong level. The decline in the dollar is clearly helping U.S. exports in general, and manufacturing in particular. Interesting to note, U.S. manufacturing has become quite competitive outside this benefit. According to analysis by ISI Group, U.S. manufacturing industrial production has risen 120% since 1978 while manufacturing employment has declined 40%. There has, however, been a slowing in the rate of growth in other areas of the economy, and this is reflected in the ISM service index’s sharp drop in April from March. Most economists expect this slowdown to be transitory, and we hope they are correct.
Equities versus Bonds
The Fed’s actions have started to increase the rate of inflation, however core inflation still remains low which favors equities. Equity yields remain favorable relative to high yield bonds and investors are responding by allocating more towards equities than bonds for the first time in three years.
Please refer to charts in Section G for additional information.

14
Small Cap vs Large Cap
Small cap equities have out performed large cap equities off the bottom of March 2009, however, valuations of small caps are not excessive by any metric. Additionally, net margins remain below peaks levels for small cap companies while large cap companies are operating near peak margin levels.
Most expensive stocks are outperforming
The most expensive stocks based upon trailing PE ratios are leading the market higher. For the Russell 2000 Growth, the most expensive 20% of stocks were up 38.7% in Year 2010 versus the benchmark’s rise of 29.1% and are up 17.8% YTD 2011 through April 30th versus the benchmark up 13.2%.
Frontier Small Cap Growth Portfolio YTD
As of April 30, the portfolio slightly lags the Russell 2000 Growth. Producer durables, a sector we are overweight, was the strongest contributor to relative performance in our portfolios. Our return of 17% exceeded the 9% gain of the index. The sector’s positive results were led by the 55% advance in MasTec, a diversified specialty contracting company. This gain built on the 41% return the stock posted in the fourth quarter of 2010. The company again reported very strong earnings results that exceeded consensus expectations and its newest division, EC Source, won a $230 million electrical transmission contract. Filtration company, Pall, rose 18% and was also a strong contributor to sector outperformance. Our second highest contributing sector was financial services, where we are also overweight relative to the Russell 2000 Growth. Our 13% return in financials exceeded the 12% return of the benchmark. Our long term holdings in brokerage firm Raymond James, up 15%, and asset manager Waddell & Reed, up 16%, were the two most significant contributors within the sector.
Although four of our top ten contributing stocks were technology related, this sector was one of our worst relative performing sector with our 13% return trailing the 17% rise in the index. The top ten weighted technology stocks in the Russell 2000 Growth had a weighted return of 31% during the first quarter, yet trade at eight times revenues and fifty five times consensus 2012 earnings expectations. Ariba, a business commerce software company, is our best technology stock YTD, up 48%, while VeriFone was our second best stock, up 42%. The largest drag in the sector was Tessera Technologies down 11%. While Tessera posted strong fourth quarter results, the stock dropped sharply after management announced that two smaller customers stopped paying royalties for Tessera's intellectual property in semiconductor manufacturing. Tessera has filed lawsuits against both companies as it believes they are in violation of their contracts. We remain very constructive on the stock due to its extremely low valuation and future growth drivers. The company has over half of its market capitalization in net cash and should grow its cash balance by 30% over the next twenty four months without payments from the two aforementioned customers. Additionally, our 3% return in consumer discretionary, a sector we remain underweight, lagged the 4% gain of the Russell 2000 Growth. Consumer electronics retailer Hhgregg, down 36%, had disappointing holiday sales and was our largest detractor in the sector. Commercial truck axle manufacturer Meritor, down 21%, lowered earnings guidance, despite higher sales projections, due to elevated steel costs and was the second worst performer within consumer discretionary. Lastly, health care detracted from results relative to the Russell 2000 Growth, but solely because we are underweight compared to the index. Our 11% return exceeded the 7% gain of the benchmark.
Please refer to charts in Section G for additional information.
SMALL CAP GROWTH PORTFOLIO COMMENTARY As of April 30, 2011

15
26.2%
33.5%
27.1%29.1%
38.7%
0%
5%
10%
15%
20%
25%
30%
35%
40%
45%
7.0%
13.3%
7.2%
23.9%24.8%
0%
5%
10%
15%
20%
25%
30%
12 - 16 16 - 21 21 - 31PE: <12Least Expensive
>31Most Expensive
10.1%
13.2%
9.9%
13.8%
17.8%
0%
5%
10%
15%
20%
25%
*Price to FTM Earnings as of 12/31/09*Performance for full year 2010Source: FactSet Fundamentals
Rate
of Re
turn (
%)
12 - 16 16 - 20 20 - 28PE: <12Least Expensive
>28Most Expensive
MOST EXPENSIVE STOCKS HAVE OUTPERFORMED
Rate
of Re
turn (
%)
12 - 15 15 - 19 19 - 27Least Expensive
PE: <12 >27Most Expensive
RUSSELL 2000 GROWTH PERFORMANCE YTD 2011**
43.8%
38.2%
22.3%
45.9%
57.8%
0%
10%
20%
30%
40%
50%
60%
70%
14 - 18 18 - 22 22 - 32 >32PE: <14Least Expensive Most Expensive
RUSSELL 2000 GROWTH TECH SECTOR PERFORMANCE 2010*
Rate
of Re
turn (
%)
RUSSELL 2000 GROWTH TECH SECTOR PERFORMANCE YTD 2011**
RUSSELL 2000 GROWTH PERFORMANCE 2010*
**Price to FTM Earnings as of 12/31/10**Performance YTD as of 4/30/11Source: FactSet Fundamentals
Rate
of Re
turn (
%)

16
PATTERN OF PERFORMANCE
* Source: eVestment Alliance as (time period: 1/1/85 – 3/31/11)
Cumulative Over/Under Performance +44.3% -4.6% +11.2% +7.5% -0.8% +1.8%
In up quarters, Frontier captured 113% of Russell 2000 Growth returns.*
In down quarters, Frontier declined 25% less than Russell 2000 Growth returns.*
Performance Objectives:
• Seeks to generate consistent returns over a full market cycle
• Outperform in fundamentally-driven markets
• Keep pace in speculative markets
• Preserve capital in down markets
PERFORMANCE OVER VARIOUS MARKET CYCLES: 2000 – 2011
Information herein refers to the composite portfolio and is provided for illustrative purposes only. Characteristics and performance of individual client accounts will vary, and no assurances are provided regarding future performance or results. Returns are shown gross of fees. A client’s returns will be reduced by any management fees, as well as any other expenses incurred in the management of their account. Please refer to the net returns and important disclosure at the end of this presentation. Past performance is no guarantee of future results.
-60.0
-40.0
-20.0
0.0
20.0
40.0
60.0
80.0
2000-2002 2003 2004-2007 2008- 1Q09 2Q09-1Q10 2Q10-1Q11
Frontier Small Cap Growth Russell 2000 Growth
Rate
of R
etur
n (%
)
Down Market
Speculative MarketFundamental Market
Down Market
Speculative Market
Fundamental Market

17
SMALL CAP GROWTH PORTFOLIO COMPLIANCE
During the period May 1, 2010 through April 30, 2011, Frontier Capital Management Company, LLC verifies that the WPERP has been in compliance with the Investment Management Agreement and Guidelines including the Investment and Legal/Compliance Guidelines.
Signature: ________________________ Date: 04/30/2011William J. BallouChief Compliance Officer & General Counsel

18
PERFORMANCE – LA DEPARTMENT OF WATER & POWER
Periods Ending April 30 2011. Source: Thomson Reuters PORTIA.
YTDRETURNS (%) – RETIREMENT PLAN
*Inception: 4/19/10
YTDRETURNS (%) – HEALTH PLAN
Gross of Fees 11.8% 27.9%
Net of Fees 11.4% 27.5%
Russell 2000 Growth 13.2% 28.3%*Inception: 4/19/10
INCEPTION*(Annualized)
INCEPTION*(Annualized)
Gross of Fees 11.8% 28.0%
Net of Fees 11.4% 27.6%
Russell 2000 Growth 13.2% 28.3%
INCEPTION*MARKET VALUE
NET CASH FLOWSContributions / (Withdrawals)
CURRENTMARKET VALUE
Retirement Plan $100M $928K $130M
Health Plan $13M $1M $19M*Inception: 4/19/10
As of April 30, 2011

19
COMPOSITE PERFORMANCE
GROSS RETURNS (%) 1 YEAR 3 YEAR 5 YEAR 10 YEAR1Q11 SINCEINCEPTION*
For Annualized Periods Ending March 31, 2011
Frontier Small Cap Growth Composite 9.1% 32.8% 13.7% 7.6% 10.9% 16.0%
Russell 2000 Growth 9.2% 31.0% 10.2% 4.3% 6.4% 8.1%
Excess Return -0.1% +1.8% +3.5% +3.3% +4.5% +7.9%*Inception: 1/1/85
Source: Thomson Reuters PORTIA
Rate
of R
etur
n (%
)
Info
rmat
ion
Ratio
PERFORMANCE RANKINGS
-5
0
5
10
15
20
3 Year 5 Year 10 Year 26¼ YearInception
-2
-1
0
1
2
3 Year 5 Year 10 Year 26¼ YearInception
INFORMATION RATIO VS. RUSSELL 2000 GROWTH
Frontier Small Cap Growth CompositeSource: eVestment Alliance Universe: Small Cap growth (216 products in universe: 94% updated). Period: Ending March 31, 2011

20
EQUITY ATTRIBUTION – TRAILING 12 MONTHS
Source: FactSet Fundamentals
OVER/UNDER
FRONTIERPORTFOLIO
STOCKSELECTION
SECTORSELECTION
RUSSELL2000G
OVER/UNDER
FRONTIERPORTFOLIO
TOTALEFFECT
SECTOR WEIGHTINGS SECTOR RETURNS ATTRIBUTION ANALYSIS
RUSSELL GLOBAL SECTORS
Corinthian Colleges Inc. Consumer Disc. - 74.6% - 0.7%hhgegg Inc. Consumer Disc. - 56.8% - 0.6%VCA Antech Inc. Health Care - 13.4% - 0.6%Monolithic Power Systems Inc. Technology - 31.1% - 0.5%WMS Industries Inc. Consumer Disc. - 34.4% - 0.5%Equinix Inc. Technology - 0.0% - 0.4%Chico’s FAS Inc. Consumer Disc. - 0.3% - 0.4%Catalyst Health Solutions Inc. Health Care - 11.4% - 0.3%Premiere Global Services Inc. Utilities - 15.6% - 0.3%Beckman Coulter Inc. Health Care +33.8% - 0.3%
BOTTOM TEN DETRACTORS Contributionto Return
Ariba Inc. Technology +143.7% + 2.2%Wabco Holdings Inc. Consumer Disc. +122.5% + 2.2%MasTec Inc. Technology + 81.3% + 1.4%SM Energy Co. Energy + 88.9% + 1.3%RightNow Technologies Inc. Technology +120.6% + 1.3%Carrizo Oil & Gas Inc. Energy + 81.6% + 1.2%Dollar Tree Inc. Consumer Disc. + 42.0% + 1.1%Jabil Circuit Inc. Technology + 31.9% + 1.0%ON Semiconductor Corp. Technology + 69.0% + 1.0%Pall Corp. Producer Durables + 52.2% + 0.9%
TOP TEN CONTRIBUTORS Contributionto Return
PortfolioReturn
PortfolioReturn
RUSSELL2000G
CONTRIB. TO RETURN
Energy 7.7 4.9 2.9 51.0 53.0 -2.0 0.8 -0.2 0.6 4.3 2.7 1.6Producer Durables 16.8 13.1 3.7 30.9 26.8 4.1 -0.1 0.4 0.3 5.2 3.8 1.4Consumer Discretionary 18.4 19.6 -1.2 19.1 16.3 2.8 0.2 0.9 1.1 4.0 3.2 0.8Technology 26.8 24.8 2.0 45.1 51.8 -6.7 0.2 -1.6 -1.4 13.3 13.2 0.0Utilities 1.3 1.1 0.2 8.8 12.0 -3.2 0.0 -0.1 -0.1 0.1 0.1 0.0Consumer Staples 0.0 2.8 -2.8 0.0 13.4 -13.4 0.5 0.0 0.5 0.0 0.3 -0.3Financial Services 8.5 6.3 2.2 18.1 24.2 -6.1 -0.1 -0.9 -1.0 0.7 1.3 -0.6Health Care 13.1 20.1 -7.1 28.9 20.6 8.3 0.6 1.0 1.6 1.6 2.4 -0.8Materials & Processing 7.4 7.4 0.1 25.1 37.8 -12.7 0.1 -0.9 -0.8 2.0 3.3 -1.4Total 31.1 30.3 0.8 2.2 -1.5 0.8 31.1 30.3 0.8
RUSSELL2000G
FRONTIERPORTFOLIO
TOTALCONTRIB.
As of April 30, 2011

21
PORTFOLIO STRUCTURE – TOP 10 HOLDINGS
Source: FactSet Fundamentals / Thomson Reuters PORTIA.
Jabil Circuit Inc. Technology 2.9% + 31.9% + 1.0%
Raymond James Financial Inc. Financial Services 2.9% + 24.4% + 0.6%
ON Semiconductor Corp. Technology 2.9% + 69.0% + 1.0%
Mednax Inc. Health Care 2.8% + 29.1% + 0.7%
MasTec Inc. Producer Durables 2.5% + 81.3% + 1.4%
Wabco Holdings Inc. Consumer Discretionary 2.4% +122.5% + 2.2%
Ariba Inc. Technology 2.3% +143.7% + 2.2%
Carrizo Oil & Gas Inc. Energy 2.2% + 81.6% + 1.2%
RF Micro Devices Inc. Technology 2.0% + 59.0% + 0.7%
Chico's FAS Inc. Consumer Discretionary 2.0% - 0.3% - 0.4%
Total 24.9%
Security Name Russell Global Sectors
Percentageof Portfolio
As of 4/30/11
Portfolio Return5/1/10-4/30/11
ContributionReturn5/1/10-4/30/11
As of April 30, 2011

22
PORTFOLIO HOLDINGS
Source: Thomson Reuters PORTIA
Technology 27.3% Health Care 10.3% Producer Durables 19.2% Consumer Discretionary 16.8%Advanced Analogic Technologies Inc. 0.3% Accretive Health Inc. 1.2% A.O. Smith Corp. 0.7% Cheesecake Factory Inc. 0.9%Ariba Inc. 2.3% CONMED Corp. 1.1% Advisory Board Co. 0.7% Chico's FAS Inc. 2.0%Brightpoint Inc. 0.6% Cumberland Pharmaceuticals Inc. 0.2% Brady Corp. 1.2% Constant Contact Inc. 0.5%comScore Inc. 0.7% DexCom Inc. 1.1% Carlisle Companies Inc. 1.0% Dollar Tree Inc. 1.9%Cymer Inc. 0.6% HMS Holdings Corp. 0.4% Hub Group Inc. 1.1% Hanesbrands Inc. 0.8%DemandTec Inc. 0.4% Insulet Corp. 0.9% Insperity Inc. 0.7% Harman International Industries Inc. 1.6%Equinix Inc. 0.7% MAKO Surgical Corp. 0.7% Kaman Corp. 0.9% HHGregg Inc. 0.4%Fairchild Semiconductor International 0.2% Medidata Solutions Inc. 0.5% Landstar System Inc. 1.3% K12 Inc. 0.4%Fortinet Inc. 0.1% Mednax Inc. 2.8% MasTec Inc. 2.5% LKQ Corp. 1.4%Ingram Micro Inc. 0.6% NPS Pharmaceuticals Inc. 0.2% Mine Safety Appliances Co. 1.0% Meritor Inc. 1.5%Integrated Device Technology Inc. 0.2% PSS World Medical Inc. 0.2% Monster Worldwide Inc. 1.1% Nu Skin Enterprises Inc. 0.2%Intevac Inc. 0.4% United Therapeutics Corp. 1.0% Navistar International Corp. 1.4% P.F. Chang's China Bistro Inc. 0.3%IntraLinks Holdings Inc. 0.4% Pall Corp. 1.8% QuinStreet Inc. 1.5%Jabil Circuit Inc. 2.9% Utilities 1.4% Quanta Services Inc. 0.9% Tractor Supply Co. 0.6%Monolithic Power Systems Inc. 0.2% Cogent Communications Group Inc. 0.8% UTi Worldwide Inc. 1.0% WABCO Holdings Inc. 2.4%Motricity Inc. 0.6% Premiere Global Services Inc. 0.6% Waste Connections Inc. 1.0% WMS Industries Inc. 0.6%ON Semiconductor Corp. 2.9% Wesco International Inc. 0.9%QLogic Corp. 0.6% Materials & Processing 6.0% Financial Services 8.1%Responsys Inc. 0.1% Albemarle Corp. 0.8% Energy 9.2% FactSet Research Systems Inc. 0.4%RF Micro Devices Inc. 2.0% Belden Inc. 1.1% Abraxas Petroleum Corp. 0.3% Jefferies Group Inc. 1.7%RightNow Technologies Inc. 1.6% CLARCOR Inc. 0.9% Ameresco Inc. 0.4% Penson Worldwide Inc. 0.2%Rogers Corp. 0.3% Comfort Systems USA Inc. 0.4% Carrizo Oil & Gas Inc. 2.2% Raymond James Financial Inc. 2.9%Sanmina-SCI Corp. 0.6% Eagle Materials Inc. 0.5% Comstock Resources Inc. 0.4% W.R. Berkley Corp. 1.0%Semtech Corp. 1.3% RTI International Metals Inc. 0.4% GT Solar International Inc. 0.2% Waddell & Reed Financial Inc. 1.9%Tech Data Corp. 1.2% Watsco Inc. 1.9% Magnum Hunter Resources Corp. 0.6%Tessera Technologies Inc. 1.8% Northern Oil & Gas Inc. 0.5% Cash 1.7%TriQuint Semiconductor Inc. 0.3% Oasis Petroleum Inc. 0.4%Veeco Instruments Inc. 0.9% Rex Energy Corp. 0.4%VeriFone Systems Inc. 0.7% SM Energy Co. 1.9%Verint Systems Inc. 0.5% World Fuel Services Corp. 1.9%Virtusa Corp 0.9%Web.com Group Inc. 0.4%
As of April 30, 2011

23
Number of Holdings 103 1,263
Capitalization Weighted Average $2.7B $1.7BWeighted Median $2.3B $1.5B
P/E Ratio Trailing 1 Year 25.1x 28.2xForward 1 Year 21.5x 23.4xForward 2 Year 16.9x 18.5x
EPS Growth Next 5 Year 16.7% 17.9%
Price/Book Ratio 3.6x 4.4x
Price/Cash Flow Ratio 15.6x 17.5x
Price/Sales Ratio 2.5x 3.4x
Dividend Yield 0.4% 0.5%
ROE 12.8% 12.8%
Beta Trailing 2 Year 0.89 1.0
R-Squared Trailing 1 Year 0.97 1.0
Turnover Trailing 1 Year 48% n/a
PORTFOLIO CHARACTERISTICS & SECTOR WEIGHTS
Frontier SmallCap Growth
Russell2000 Growth
CHARACTERISTICS RUSSELL GLOBAL SECTOR WEIGHTS
0%
2%
1%
8%
6%
6%
19%
19%
13%
26%
2%
0%
1%
6%
8%
9%
10%
17%
19%
27%
0% 5% 10% 15% 20% 25% 30%
Cash
Consumer Staples
Utilit ies
Materials & Processing
Financial Services
Energy
Health Care
Consumer Discretionary
Producer Durables
Technology
Frontier Small Cap Growth Russell 2000 Growth
Source: FactSet Fundamentals / Thomson Reuters PORTIA.
As of April 30, 2011

24
RISK CONTROLS
RISK MANAGEMENT
Stages and Descriptions
FIRMCulture of Risk Management
PORTFOLIOStructural Risk Controls*
STOCK Stylistic Risk Controls
Management committee oversight
Senior chief compliance officer
Annual compliance review
Firm-wide compliance training
Automated testing systems
State-of-the-industry policies
Periodic capacity assessment
Sector weight limits
No stock greater than 5%
No more than 90 – 110 holdings
Performance analytics
Monthly attribution review
Valuation discipline
Price target assessment: risk/reward
Balance sheet and accounting reviews
Multiple ways to win
Avoid binary events
Liquidity analysis
Client guidelines assessment
Risk management is embedded in our culture and investment approach
*This is a brief summary of certain investment guidelines by which the strategy is managed. Actual investment guidelines for any client account may differ.

25
5 Year22.9%
10 Year23.9%
PORTFOLIO RISK MEASURES
0%
25%
Median
75%
100% 5 Year3.4%
10 Year4.6%
0%
25%
Median
75%
100%
STANDARD DEVIATIONANNUALIZED ALPHA VS. RUSSELL 2000 GROWTH
Frontier Small Cap Growth CompositeSource: eVestment Alliance Universe: Small Cap Growth (216 products in universe: 95% updated)Period: Ending March 31, 2011
STYLE ANALYSIS – CUMULATIVE AVERAGE SINCE INCEPTION
Frontier Small Cap Growth
Russell 2000 Growth
EXCESS RETURN VS. TRACKING ERRORROLLING 3 YEAR PERIODS FOR LAST 5 YEARS
Russell 2000 Growth
Frontier Small Cap Growth

26
PORTFOLIO RISK MEASURESANNUAL RETURNS
Since Inception
The Frontier Small Cap Growth composite has never underperformed in a down market year.
Source: eVestment Alliance Benchmark: Russell 2000 GrowthPeriod: 26 years ending December 31, 2010Returns are shown gross of fees. A client’s returns will be reduced by any investment advisory fees, as well as any other expenses incurred in the management of their account.
Frontier Small Cap Growth Russell 2000 GrowthYear Return (%) Return (%)1985 42.5% 31.0%1986 33.8% 3.6%1987 -3.5% -10.5%1988 43.1% 20.4%1989 25.3% 20.2%1990 -15.7% -17.4%1991 51.5% 51.2%1992 18.9% 7.8%1993 23.5% 13.4%1994 1.4% -2.4%1995 27.1% 31.0%1996 23.0% 11.3%1997 25.5% 12.9%1998 8.5% 1.2%1999 31.4% 43.1%2000 13.0% -22.4%2001 3.0% -9.2%2002 -19.8% -30.3%2003 43.9% 48.5%2004 12.7% 14.3%2005 12.2% 4.2%2006 10.4% 13.4%2007 11.4% 7.1%2008 -35.9% -38.5%2009 45.5% 34.5%2010 31.1% 29.1%
-$540
$0
$540
$1080
$1620
$2160
$2700
$3240
$3780
$4320
$4860
$5400
12/85
12/86
12/87
12/88
12/89
12/90
12/91
12/92
12/93
12/94
12/95
12/96
12/97
12/98
12/99
12/00
12/01
12/02
12/03
12/04
12/05
12/06
12/07
12/08
12/09
12/10
Frontier Small Cap Growth
Russell 2000 Growth
$4,485
$701

27
STATEMENT OF ASSETS & TRANSACTION SUMMARY LA DEPARTMENT OF WATER & POWER
RETIREMENT PLAN & HEALTH PLAN As of April 30, 2011

28
PORTFOLIO ACTIVITY – PURCHASES
Source: Thomson Reuters PORTIA.
Trailing 12 Months Ending April 30, 2011Quantity Security Total Quantity Security Total Quantity Security Total(Units) Description Price Amount (Units) Description Price Amount (Units) Description Price Amount72,200 Abraxas Petroleum Corp. $4.42 $319,390.86 33,700 Fortinet Inc. $25.87 $871,784.70 7,300 Pall Corp. $45.09 $329,184.4655,100 Accretive Health Inc. $25.04 $1,379,927.27 2,300 Fresh Market Inc. $22.00 $50,600.00 200 PAREXEL International Corp. $21.29 $4,258.00400 Advanced Analogic Technologies Inc. $3.67 $1,467.96 23,900 GT Solar International Inc. $11.27 $269,295.64 600 Penson Worldwide Inc. $5.36 $3,215.10600 AECOM Technology Corp. $25.70 $15,420.00 33,200 Hanesbrands Inc. $27.55 $914,753.11 17,400 Premiere Global Services Inc. $8.86 $154,209.9832,300 Ameresco Inc. $10.78 $348,178.99 13,900 Harman Int'l Industries Inc. $30.78 $427,876.51 25,500 QLogic Corp. $18.23 $464,965.05100 American Medical Systems Hlgs Inc. $20.33 $2,033.00 13,600 hhgregg Inc. $20.87 $283,882.06 700 Quanta Services Inc. $20.42 $14,293.9335,400 Ariba Inc. $16.57 $586,679.20 9,800 HMS Holdings Corp. $63.59 $623,189.38 106,600 QuinStreet Inc. $14.24 $1,517,505.4993,800 ARVINMERITOR INC $20.43 $1,916,283.07 200 Hub Group Inc. $29.24 $5,847.98 600 Raymond James Financial Inc. $27.79 $16,673.9412,100 athenahealth Inc. $27.19 $328,963.45 30,100 iGATE Corp. $13.74 $413,705.94 3,600 Responsys Inc. $12.00 $43,200.00400 bebe Stores Inc. $6.80 $2,719.92 44,400 Ingram Micro Inc. $19.18 $851,411.21 17,400 Rex Energy Corp. $11.22 $195,209.3816,700 Beckman Coulter Inc. $68.00 $1,135,556.86 100 Insight Enterprises Inc. $16.68 $1,667.99 416,872 RF Micro Devices Inc. $5.85 $2,436,891.2420,900 Belden Inc. $24.05 $502,687.92 51,900 Insulet Corp. $15.61 $810,014.68 18,900 RightNow Technologies Inc. $22.13 $418,311.298,000 Blackboard Inc. $36.43 $291,411.34 120,400 Integrated Device Technology Inc. $5.78 $696,391.55 400 RTI International Metals Inc. $30.57 $12,226.00600 Brady Corp. $30.45 $18,269.94 23,200 Intevac Inc. $12.55 $291,088.18 67,500 Sanmina-SCI Corp. $14.60 $985,408.74100,500 Brightpoint Inc. $7.50 $754,134.87 15,600 IntraLinks Holdings Inc. $28.85 $450,057.27 31,100 Semtech Corp. $23.18 $721,030.78200 Cabot Corp. $34.28 $6,855.98 112,600 Jabil Circuit Inc. $14.64 $1,648,976.14 300 Skyworks Solutions Inc. $21.31 $6,392.9725,300 Carlisle Cos. $32.71 $827,642.92 53,000 Jefferies Group Inc. $23.58 $1,249,604.55 300 SM Energy Co. $41.67 $12,500.9454,700 Carrizo Oil & Gas Inc. $28.37 $1,552,093.59 12,700 K12 Inc. $32.36 $410,909.46 43,900 Sonic Solutions Inc. $9.86 $432,680.52200 Cheesecake Factory Inc. $27.83 $5,566.00 30,100 Kaman Corp. $29.34 $883,217.81 20,100 Tech Data Corp. $39.79 $799,728.681,400 Chico's FAS Inc. $11.20 $15,679.86 300 Littelfuse Inc. $44.32 $13,295.97 72,600 Tessera Technologies Inc. $17.79 $1,291,242.58500 CLARCOR Inc. $40.29 $20,143.95 700 LKQ Corp. $21.65 $15,154.93 30,400 TriQuint Semiconductor Inc. $14.70 $446,739.3367,000 Cogent Communications Group Inc. $9.50 $636,221.92 300 LoopNet Inc. $12.02 $3,605.91 13,500 United Therapeutics Corp. $59.21 $799,324.2636,800 Comfort Systems USA Inc. $11.91 $438,169.36 101,400 Magnum Hunter Resources Corp. $6.78 $687,104.03 55,100 UTi Worldwide Inc. $19.75 $1,088,215.3232,128 comScore Inc. $25.45 $817,665.94 43,988 MAKO Surgical Corp. $14.79 $650,591.14 200 VCA Antech Inc. $21.36 $4,272.0015,900 Comstock Resources Inc. $30.04 $477,628.88 20,000 MasTec Inc. $9.89 $197,878.00 28,300 Veeco Instruments Inc. $45.07 $1,275,420.9117,500 CONMED Corp. $21.78 $381,186.13 22,600 Medidata Solutions Inc. $22.60 $510,821.15 1,300 Vera Bradley Inc. $16.00 $20,800.0012,600 Constant Contact Inc. $21.25 $267,751.40 5,900 Mednax Inc. $61.88 $365,104.04 38,100 VeriFone Systems Inc. $35.20 $1,341,072.96600 Corinthian Colleges Inc. $6.07 $3,642.00 18,000 Meritor Inc. $17.24 $310,334.49 300 Verint Systems Inc. $31.51 $9,452.9719,800 Cumberland Pharmaceuticals Inc. $6.41 $126,903.80 15,000 Mine Safety Appliances Co. $29.60 $443,938.01 67,700 Virtusa Corp $10.51 $711,232.1221,900 Cymer Inc. $34.12 $747,144.58 43,027 Momenta Pharmaceuticals Inc. $15.70 $675,385.87 4,400 W.R. Berkley Corp. $27.07 $119,090.8044,700 DemandTec Inc. $11.96 $534,685.69 18,700 Monolithic Power Systems Inc. $18.00 $336,680.98 700 Wabco Holdings Inc. $43.41 $30,385.4615,900 Denbury Resources Inc. $18.67 $296,902.18 83,900 Monster Worldwide Inc. $15.53 $1,303,018.19 500 Waddell & Reed Financial Inc. $28.39 $14,194.9536,900 DexCom Inc. $11.84 $436,802.60 75,000 Motricity Inc. $14.25 $1,069,076.18 3,300 Watsco Inc. $55.39 $182,800.62100 Dollar Tree Inc. $50.63 $5,062.99 500 Navistar International Corp. $49.72 $24,859.95 39,400 Web.com Group Inc. $7.98 $314,325.3921,000 Eagle Materials Inc. $28.05 $589,113.25 38,200 Northern Oil & Gas Inc. $16.98 $648,696.45 200 Wesco International Inc. $39.65 $7,929.988,100 Eclipsys Corp $19.13 $154,939.23 28,100 NPS Pharmaceuticals Inc. $9.21 $258,847.96 400 West Pharmaceutical Services Inc. $36.12 $14,447.92100 EnPro Industries Inc. $33.96 $3,395.97 400 Nu Skin Enterprises Inc. $31.86 $12,744.00 100 WMS Industries Inc. $40.99 $4,098.98360 Epocrates Inc. $16.00 $5,760.00 18,500 Oasis Petroleum Inc. $31.87 $589,657.27 12,900 World Fuel Services Corp. $25.53 $329,385.817,900 Equinix Inc. $86.76 $685,393.73 375,500 ON Semiconductor Corp. $8.27 $3,107,195.61100 FactSet Research Systems Inc. $86.26 $8,626.00 10,400 optionsXpress Holdings Inc. $15.34 $159,498.00 Total Purchases $56,071,027.4027,100 Fairchild Semiconductor Int'l $11.37 $308,162.66 100 P.F. Chang's China Bistro Inc. $46.81 $4,681.00

29
PORTFOLIO ACTIVITY – SALES
Source: Thomson Reuters PORTIA.
Trailing 12 Months Ending April 30, 2011Quantity Security Total Quantity Security Total Quantity Security Total(Units) Description Price Amount (Units) Description Price Amount (Units) Description Price Amount17,100 A.O. Smith Corp. $49.69 $849,617.23 107,947 iGATE Corp. $17.71 $1,911,263.21 21,200 Tech Data Corp. $46.22 $979,868.8114,800 Adtran Inc. $29.29 $433,458.62 43,300 Insight Enterprises Inc. $13.39 $579,951.86 11,800 Tessera Technologies Inc. $15.29 $180,416.785,900 Advanced Analogic Technologies Inc. $3.32 $19,590.61 207,419 Integrated Device Technology Inc. $6.75 $1,399,244.85 94 Teton Advisors Inc. $8.47 $795.6937,000 AECOM Technology Corp. $28.80 $1,065,439.89 25,300 Investment Technology Group Inc. $15.09 $381,748.06 32,100 Tractor Supply Co. $57.65 $1,850,592.227,000 Albemarle Corp. $40.45 $283,156.40 9,000 Jabil Circuit Inc. $20.94 $188,466.27 30,600 United Therapeutics Corp. $66.59 $2,037,699.6345,500 American Medical Systems Hldgs Inc. $22.45 $1,021,679.32 23,800 Kaydon Corp. $36.16 $860,501.71 52,100 VCA Antech Inc. $22.13 $1,153,174.7424,000 Ariba Inc. $28.81 $691,527.83 11,900 Ladish Co. Inc. $45.14 $537,203.32 4,800 Veeco Instruments Inc. $49.12 $235,779.7329,500 athenahealth Inc. $33.17 $978,398.43 11,200 Littelfuse Inc. $45.55 $510,190.97 1,300 Vera Bradley Inc. $23.90 $31,065.4427,200 bebe Stores Inc. $5.52 $150,255.92 50,300 LoopNet Inc. $18.36 $923,470.11 21,300 VeriFone Systems Inc. $50.59 $1,077,569.0641,900 Beckman Coulter Inc. $61.91 $2,594,111.51 13,300 MAKO Surgical Corp. $23.38 $310,904.55 13,200 Verint Systems Inc. $29.85 $393,963.8214,000 Blackboard Inc. $38.38 $537,302.97 4,600 Mednax Inc. $52.71 $242,457.90 1,800 Virtusa Corp $8.26 $14,873.15100,800 Brightpoint Inc. $8.92 $898,624.82 43,027 Momenta Pharmaceuticals Inc. $13.99 $601,748.51 16,400 Volterra Semiconductor Corp. $22.82 $374,205.3817,500 Cabot Corp. $45.68 $799,362.20 35,000 Monolithic Power Systems Inc. $15.64 $547,466.91 15,200 WabcoHoldings Inc. $41.32 $628,114.6514,500 Carrizo Oil & Gas Inc. $31.16 $451,854.72 18,700 Motricity Inc. $25.68 $480,278.16 28,200 West Pharmaceutical Services Inc. $36.07 $1,017,146.7544,700 Catalyst Health Solutions Inc. $37.30 $1,667,253.91 30,500 Northern Oil & Gas Inc. $25.08 $764,827.87 22,300 Wright Medical Group Inc. $17.79 $396,714.0343,000 Cogent $10.59 $455,217.17 49,500 Nu Skin Enterprises Inc. $29.89 $1,479,615.365,200 Comfort Systems USA Inc. $13.28 $69,059.74 20,500 ON Semiconductor Corp. $10.96 $224,603.19 Total Sales $53,205,785.541,600 CONMED Corp. $25.93 $41,482.47 39,700 optionsXpress Holdings Inc. $17.63 $699,893.567,200 Constant Contact Inc. $33.01 $237,644.39 16,700 Pall Corp. $39.46 $658,935.5737,700 Corinthian Colleges Inc. $4.02 $151,437.36 11,000 PAREXEL International Corp. $21.10 $232,051.48600 Cumberland Pharmaceuticals Inc. $4.99 $2,994.26 1,783 Premiere Global Services Inc. $6.65 $11,859.034,900 Cymer Inc. $52.03 $254,944.60 39,700 PSS World Medical Inc. $22.00 $873,436.3899,500 Denbury Resources Inc. $20.45 $2,035,182.89 31,200 QLogic Corp. $16.55 $516,245.3334,900 Eclipsys Corp $18.21 $635,598.67 28,300 Regis Corp. $17.98 $508,914.6214,700 EnPro Industries Inc. $39.61 $582,246.63 2,600 Rex Energy Corp. $11.48 $29,856.00360 Epocrates Inc. $22.43 $8,075.11 28,400 RF Micro Devices Inc. $7.37 $209,272.3414,800 Equinix Inc. $76.29 $1,129,038.32 10,700 RightNow Technologies Inc. $27.28 $291,856.8449,700 ev3 Inc. $22.23 $1,104,628.40 5,600 Rogers Corp. $37.87 $212,048.7820,400 FactSet Research Systems Inc. $70.47 $1,437,518.19 35,600 SAVVIS Inc. $19.20 $683,480.9915,100 Fairchild Semiconductor Int'l $17.95 $270,978.68 22,500 Semtech Corp. $23.39 $526,291.8430,600 Fortinet Inc. $41.41 $1,267,207.49 99,700 Skyworks Solutions Inc. $21.23 $2,116,743.112,300 Fresh Market Inc. $31.96 $73,510.89 2,900 SM Energy Co. $73.25 $212,425.003,700 HMS Holdings Corp. $78.06 $288,820.30 43,900 SONIC SOLUTIONS $14.11 $619,332.04

30
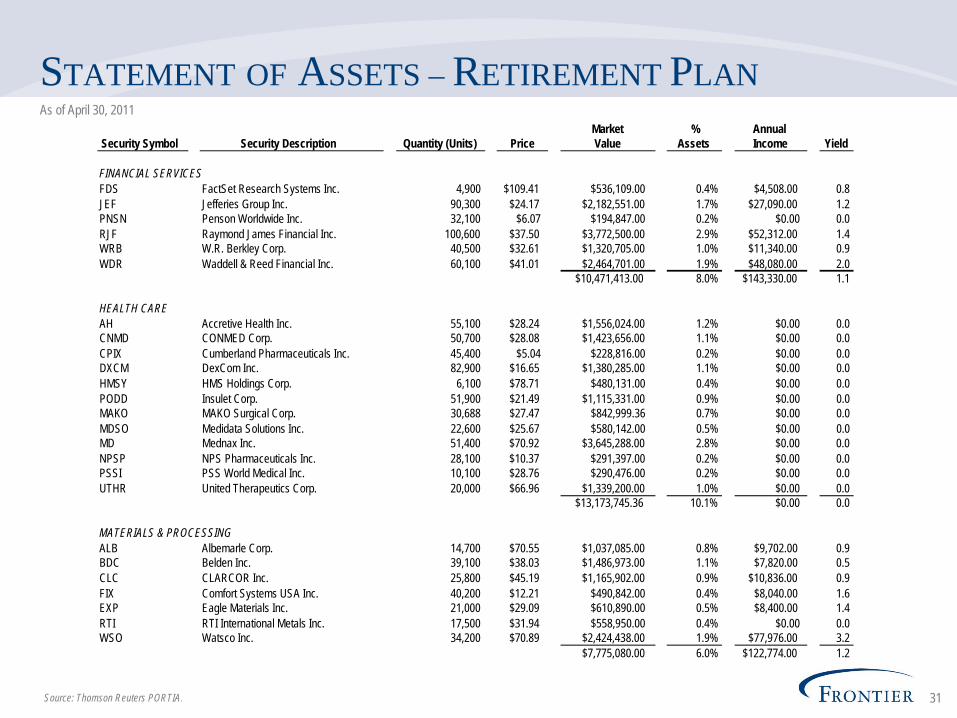
STATEMENT OF ASSETS – RETIREMENT PLAN
Source: Thomson Reuters PORTIA.
As of April 30, 2011Market % Annual
Security Symbol Security Description Quantity (Units) Price Value Assets Income Yield
CONSUMER DISCRETIONARYCAKE Cheesecake Factory Inc. 40,500 $29.43 $1,191,915.00 0.9% $0.00 0.0CHS Chico's FAS Inc. 173,200 $14.62 $2,532,184.00 1.9% $34,640.00 1.4CTCT Constant Contact Inc. 21,500 $27.71 $595,765.00 0.5% $0.00 0.0DLTR Dollar Tree Inc. 43,300 $57.50 $2,489,750.00 1.9% $0.00 0.0HBI Hanesbrands Inc. 33,200 $32.51 $1,079,332.00 0.8% $0.00 0.0HAR Harman International Industries Inc. 44,000 $48.53 $2,135,320.00 1.6% $4,400.00 0.2HGG HHGregg Inc. 39,100 $12.36 $483,276.00 0.4% $0.00 0.0LRN K12 Inc. 12,700 $39.37 $499,999.00 0.4% $0.00 0.0LKQX LKQ Corp. 70,500 $25.22 $1,778,010.00 1.4% $0.00 0.0MTOR Meritor Inc. 111,800 $17.21 $1,924,078.00 1.5% $0.00 0.0NUS Nu Skin Enterprises Inc. 7,800 $32.09 $250,302.00 0.2% $4,212.00 1.7PFCB P.F. Chang's China Bistro Inc. 9,800 $40.10 $392,980.00 0.3% $8,232.00 2.1QNST QuinStreet Inc. 106,600 $18.08 $1,927,328.00 1.5% $0.00 0.0TSCO Tractor Supply Co. 12,900 $61.87 $798,123.00 0.6% $6,192.00 0.8WBC WABCO Holdings Inc. 41,600 $73.85 $3,072,160.00 2.4% $0.00 0.0WMS WMS Industries Inc. 22,400 $32.80 $734,720.00 0.6% $0.00 0.0
$21,885,242.00 16.8% $57,676.00 0.4
ENERGYAXAS Abraxas Petroleum Corp. 72,200 $5.08 $366,776.00 0.3% $0.00 0.0AMRC Ameresco Inc. Cl A 32,300 $16.11 $520,353.00 0.4% $0.00 0.0CRZO Carrizo Oil & Gas Inc. 72,900 $39.84 $2,904,336.00 2.2% $0.00 0.0CRK Comstock Resources Inc. 15,900 $32.06 $509,754.00 0.4% $0.00 0.0SOLR GT Solar International Inc. 23,900 $11.17 $266,963.00 0.2% $0.00 0.0MHR Magnum Hunter Resources Corp. 101,400 $8.16 $827,424.00 0.6% $0.00 0.0NOG Northern Oil & Gas Inc. 25,600 $23.76 $608,256.00 0.5% $0.00 0.0OAS Oasis Petroleum Inc. 18,500 $30.73 $568,505.00 0.4% $0.00 0.0REXX Rex Energy Corp. 41,400 $12.83 $531,162.00 0.4% $0.00 0.0SM SM Energy Co. 32,000 $75.86 $2,427,520.00 1.9% $3,200.00 0.1INT World Fuel Services Corp. 60,800 $39.58 $2,406,464.00 1.9% $9,120.00 0.4
$11,937,513.00 9.2% $12,320.00 0.1
31
STATEMENT OF ASSETS – RETIREMENT PLAN
Source: Thomson Reuters PORTIA.
As of April 30, 2011Market % Annual
Security Symbol Security Description Quantity (Units) Price Value Assets Income Yield
FINANCIAL SERVICESFDS FactSet Research Systems Inc. 4,900 $109.41 $536,109.00 0.4% $4,508.00 0.8JEF Jefferies Group Inc. 90,300 $24.17 $2,182,551.00 1.7% $27,090.00 1.2PNSN Penson Worldwide Inc. 32,100 $6.07 $194,847.00 0.2% $0.00 0.0RJF Raymond James Financial Inc. 100,600 $37.50 $3,772,500.00 2.9% $52,312.00 1.4WRB W.R. Berkley Corp. 40,500 $32.61 $1,320,705.00 1.0% $11,340.00 0.9WDR Waddell & Reed Financial Inc. 60,100 $41.01 $2,464,701.00 1.9% $48,080.00 2.0
$10,471,413.00 8.0% $143,330.00 1.1
HEALTH CAREAH Accretive Health Inc. 55,100 $28.24 $1,556,024.00 1.2% $0.00 0.0CNMD CONMED Corp. 50,700 $28.08 $1,423,656.00 1.1% $0.00 0.0CPIX Cumberland Pharmaceuticals Inc. 45,400 $5.04 $228,816.00 0.2% $0.00 0.0DXCM DexCom Inc. 82,900 $16.65 $1,380,285.00 1.1% $0.00 0.0HMSY HMS Holdings Corp. 6,100 $78.71 $480,131.00 0.4% $0.00 0.0PODD Insulet Corp. 51,900 $21.49 $1,115,331.00 0.9% $0.00 0.0MAKO MAKO Surgical Corp. 30,688 $27.47 $842,999.36 0.7% $0.00 0.0MDSO Medidata Solutions Inc. 22,600 $25.67 $580,142.00 0.5% $0.00 0.0MD Mednax Inc. 51,400 $70.92 $3,645,288.00 2.8% $0.00 0.0NPSP NPS Pharmaceuticals Inc. 28,100 $10.37 $291,397.00 0.2% $0.00 0.0PSSI PSS World Medical Inc. 10,100 $28.76 $290,476.00 0.2% $0.00 0.0UTHR United Therapeutics Corp. 20,000 $66.96 $1,339,200.00 1.0% $0.00 0.0
$13,173,745.36 10.1% $0.00 0.0
MATERIALS & PROCESSINGALB Albemarle Corp. 14,700 $70.55 $1,037,085.00 0.8% $9,702.00 0.9BDC Belden Inc. 39,100 $38.03 $1,486,973.00 1.1% $7,820.00 0.5CLC CLARCOR Inc. 25,800 $45.19 $1,165,902.00 0.9% $10,836.00 0.9FIX Comfort Systems USA Inc. 40,200 $12.21 $490,842.00 0.4% $8,040.00 1.6EXP Eagle Materials Inc. 21,000 $29.09 $610,890.00 0.5% $8,400.00 1.4RTI RTI International Metals Inc. 17,500 $31.94 $558,950.00 0.4% $0.00 0.0WSO Watsco Inc. 34,200 $70.89 $2,424,438.00 1.9% $77,976.00 3.2
$7,775,080.00 6.0% $122,774.00 1.2

32
STATEMENT OF ASSETS – RETIREMENT PLAN
Source: Thomson Reuters PORTIA.
As of April 30, 2011Market % Annual
Security Symbol Security Description Quantity (Units) Price Value Assets Income Yield
PRODUCER DURABLESAOS A.O. Smith Corp. 21,100 $43.97 $927,767.00 0.7% $11,816.00 1.3ABCO Advisory Board Co. 19,600 $46.72 $915,712.00 0.7% $0.00 0.0BRC Brady Corp. 40,500 $37.71 $1,527,255.00 1.2% $29,160.00 1.9CSL Carlisle Cos. 25,300 $49.54 $1,253,362.00 1.0% $17,204.00 1.4HUBG Hub Group Inc. 37,000 $40.28 $1,490,360.00 1.1% $0.00 0.0NSP Insperity Inc. 29,300 $30.29 $887,497.00 0.7% $17,580.00 2.0KAMN Kaman Corp. 30,100 $37.20 $1,119,720.00 0.9% $16,856.00 1.5LSTR Landstar System Inc. 35,600 $47.40 $1,687,440.00 1.3% $7,120.00 0.4MTZ MasTec Inc. 140,400 $22.68 $3,184,272.00 2.5% $0.00 0.0MSA Mine Safety Appliances Co. 33,300 $39.68 $1,321,344.00 1.0% $34,632.00 2.6MWW Monster Worldwide Inc. 83,900 $16.41 $1,376,799.00 1.1% $0.00 0.0NAV Navistar International Corp. 25,800 $69.52 $1,793,616.00 1.4% $0.00 0.0PLL Pall Corp. 40,700 $58.44 $2,378,508.00 1.8% $28,490.00 1.2PWR Quanta Services Inc. 55,900 $21.68 $1,211,912.00 0.9% $0.00 0.0UTIW UTi Worldwide Inc. 55,100 $22.41 $1,234,791.00 1.0% $3,306.00 0.3WCN Waste Connections Inc. 43,950 $30.77 $1,352,341.50 1.0% $13,185.00 1.0WCC Wesco International Inc. 18,900 $61.95 $1,170,855.00 0.9% $0.00 0.0
$24,833,551.50 19.1% $179,349.00 0.8
TECHNOLOGYAATI Advanced Analogic Technologies Inc. 76,100 $4.26 $324,186.00 0.3% $0.00 0.0ARBA Ariba Inc. 84,300 $34.77 $2,931,111.00 2.3% $0.00 0.0CELL Brightpoint Inc. 82,300 $10.12 $832,876.00 0.6% $0.00 0.0SCOR comScore Inc. 32,128 $29.81 $957,735.68 0.7% $0.00 0.0CYMI Cymer Inc. 17,000 $48.10 $817,700.00 0.6% $0.00 0.0DMAN DemandTec Inc. 44,700 $11.07 $494,829.00 0.4% $0.00 0.0EQIX Equinix Inc. 8,500 $100.66 $855,610.00 0.7% $0.00 0.0FCS Fairchild Semiconductor Internati 12,000 $20.97 $251,640.00 0.2% $0.00 0.0FTNT Fortinet Inc. 3,100 $48.70 $150,970.00 0.1% $0.00 0.0IM Ingram Micro Inc. 44,400 $18.73 $831,612.00 0.6% $0.00 0.0IDTI Integrated Device Technology Inc. 37,281 $8.14 $303,280.94 0.2% $0.00 0.0IVAC Intevac Inc. 40,100 $12.23 $490,423.00 0.4% $0.00 0.0IL IntraLinks Holdings Inc. 15,600 $31.76 $495,456.00 0.4% $0.00 0.0JBL Jabil Circuit Inc. 190,700 $19.84 $3,783,488.00 2.9% $53,396.00 1.4

33
STATEMENT OF ASSETS – RETIREMENT PLAN
Source: Thomson Reuters PORTIA.
As of April 30, 2011Market % Annual
Security Symbol Security Description Quantity (Units) Price Value Assets Income Yield
TECHNOLOGYMPWR Monolithic Power Systems Inc. 13,900 $16.98 $236,022.00 0.2% $0.00 0.0MOTR Motricity Inc. 56,300 $13.35 $751,605.00 0.6% $0.00 0.0ONNN ON Semiconductor Corp. 355,000 $10.50 $3,727,500.00 2.9% $0.00 0.0QLGC QLogic Corp. 42,300 $17.98 $760,554.00 0.6% $0.00 0.0MKTG Responsys Inc. 3,600 $15.98 $57,528.00 0.0% $0.00 0.0RFMD RF Micro Devices Inc. 388,472 $6.66 $2,587,223.52 2.0% $0.00 0.0RNOW RightNow Technologies Inc. 55,800 $36.18 $2,018,844.00 1.6% $0.00 0.0ROG Rogers Corp. 9,100 $41.52 $377,832.00 0.3% $0.00 0.0SANM Sanmina-SCI Corp. 67,500 $11.72 $791,100.00 0.6% $0.00 0.0SMTC Semtech Corp. 61,000 $28.07 $1,712,270.00 1.3% $0.00 0.0TECD Tech Data Corp. 29,100 $53.13 $1,546,083.00 1.2% $0.00 0.0TSRA Tessera Technologies Inc. 115,100 $19.76 $2,274,376.00 1.8% $0.00 0.0TQNT TriQuint Semiconductor Inc. 30,400 $13.76 $418,304.00 0.3% $0.00 0.0VECO Veeco Instruments Inc. 23,500 $51.13 $1,201,555.00 0.9% $0.00 0.0PAY VeriFone Systems Inc. 16,800 $54.82 $920,976.00 0.7% $0.00 0.0VRTU Virtusa Corp 65,900 $18.66 $1,229,694.00 0.9% $0.00 0.0WWWW Web.com Group Inc. 39,400 $15.78 $621,732.00 0.5% $0.00 0.0VRNT Verint Systems Inc. 18,813 $34.23 $643,968.99 0.5% $0.00 0.0
$35,398,085.13 27.2% $53,396.00 0.0
UTILITIESCCOI Cogent Communications Group Inc. 67,000 $14.51 $972,170.00 0.8% $0.00 0.0PGI Premiere Global Services Inc. 96,500 $7.91 $763,315.00 0.6% $0.00 0.0
$1,735,485.00 1.3% $0.00 0.0
CASH & CASH EQUIVALENTS $3,004,364.79 2.3% $0.00 0.0
COMMON STOCKS $127,210,114.99 97.7% $568,845.00 0.4
TOTAL PORTFOLIO $130,214,479.78 100.0% $568,845.00 0.4

34
STATEMENT OF ASSETS – HEALTH PLAN
Source: Thomson Reuters PORTIA.
As of April 30, 2011Market % Annual
Security Symbol Security Description Quantity (Units) Price Value Assets Income Yield
CONSUMER DISCRETIONARYCAKE Cheesecake Factory Inc. 5,800 $29.43 $170,694.00 0.9% $0.00 0.0CHS Chico's FAS Inc. 24,800 $14.62 $362,576.00 2.0% $4,960.00 1.4CTCT Constant Contact Inc. 3,100 $27.71 $85,901.00 0.5% $0.00 0.0DLTR Dollar Tree Inc. 6,200 $57.50 $356,500.00 1.9% $0.00 0.0HBI Hanesbrands Inc. 4,700 $32.51 $152,797.00 0.8% $0.00 0.0HAR Harman International Industries Inc. 6,300 $48.53 $305,739.00 1.6% $630.00 0.2HGG HHGregg Inc. 5,600 $12.36 $69,216.00 0.4% $0.00 0.0LRN K12 Inc. 1,800 $39.37 $70,866.00 0.4% $0.00 0.0LKQX LKQ Corp. 10,100 $25.22 $254,722.00 1.4% $0.00 0.0MTOR Meritor Inc. 16,000 $17.21 $275,360.00 1.5% $0.00 0.0NUS Nu Skin Enterprises Inc. 1,100 $32.09 $35,299.00 0.2% $594.00 1.7PFCB P.F. Chang's China Bistro Inc. 1,400 $40.10 $56,140.00 0.3% $1,176.00 2.1QNST QuinStreet Inc. 15,300 $18.08 $276,624.00 1.5% $0.00 0.0TSCO Tractor Supply Co. 1,800 $61.87 $111,366.00 0.6% $864.00 0.8WBC WABCO Holdings Inc. 5,900 $73.85 $435,715.00 2.3% $0.00 0.0WMS WMS Industries Inc. 3,200 $32.80 $104,960.00 0.6% $0.00 0.0
$3,124,475.00 16.8% $8,224.00 0.4
ENERGYAXAS Abraxas Petroleum Corp. 10,300 $5.08 $52,324.00 0.3% $0.00 0.0AMRC Ameresco Inc. 4,600 $16.11 $74,106.00 0.4% $0.00 0.0CRZO Carrizo Oil & Gas Inc. 10,500 $39.84 $418,320.00 2.2% $0.00 0.0CRK Comstock Resources Inc. 2,300 $32.06 $73,738.00 0.4% $0.00 0.0SOLR GT Solar International Inc. 3,400 $11.17 $37,978.00 0.2% $0.00 0.0MHR Magnum Hunter Resources Corp. 14,500 $8.16 $118,320.00 0.6% $0.00 0.0NOG Northern Oil & Gas Inc. 3,700 $23.76 $87,912.00 0.5% $0.00 0.0OAS Oasis Petroleum Inc. 2,600 $30.73 $79,898.00 0.4% $0.00 0.0REXX Rex Energy Corp. 5,900 $12.83 $75,697.00 0.4% $0.00 0.0SM SM Energy Co. 4,600 $75.86 $348,956.00 1.9% $460.00 0.1INT World Fuel Services Corp. 8,700 $39.58 $344,346.00 1.9% $1,305.00 0.4
$1,711,595.00 9.2% $1,765.00 0.1

35
STATEMENT OF ASSETS – HEALTH PLAN
Source: Thomson Reuters PORTIA.
As of April 30, 2011Market % Annual
Security Symbol Security Description Quantity (Units) Price Value Assets Income Yield
FINANCIAL SERVICESFDS FactSet Research Systems Inc. 700 $109.41 $76,587.00 0.4% $644.00 0.8JEF Jefferies Group Inc. 12,900 $24.17 $311,793.00 1.7% $3,870.00 1.2PNSN Penson Worldwide Inc. 4,600 $6.07 $27,922.00 0.2% $0.00 0.0RJF Raymond James Financial Inc. 14,400 $37.50 $540,000.00 2.9% $7,488.00 1.4WRB W.R. Berkley Corp. 5,800 $32.61 $189,138.00 1.0% $1,624.00 0.9WDR Waddell & Reed Financial Inc. 8,600 $41.01 $352,686.00 1.9% $6,880.00 2.0
$1,498,126.00 8.0% $20,506.00 1.1
HEALTH CAREAH Accretive Health Inc. 7,900 $28.24 $223,096.00 1.2% $0.00 0.0CNMD CONMED Corp. 7,300 $28.08 $204,984.00 1.1% $0.00 0.0CPIX Cumberland Pharmaceuticals Inc. 6,500 $5.04 $32,760.00 0.2% $0.00 0.0DXCM DexCom Inc. 11,900 $16.65 $198,135.00 1.1% $0.00 0.0HMSY HMS Holdings Corp. 900 $78.71 $70,839.00 0.4% $0.00 0.0PODD Insulet Corp. 7,400 $21.49 $159,026.00 0.9% $0.00 0.0MAKO MAKO Surgical Corp. 4,422 $27.47 $121,472.34 0.7% $0.00 0.0MDSO Medidata Solutions Inc. 3,200 $25.67 $82,144.00 0.4% $0.00 0.0MD Mednax Inc. 7,400 $70.92 $524,808.00 2.8% $0.00 0.0NPSP NPS Pharmaceuticals Inc. 4,000 $10.37 $41,480.00 0.2% $0.00 0.0PSSI PSS World Medical Inc. 1,400 $28.76 $40,264.00 0.2% $0.00 0.0UTHR United Therapeutics Corp. 2,900 $66.96 $194,184.00 1.0% $0.00 0.0
$1,893,192.34 10.2% $0.00 0.0
MATERIALS & PROCESSINGALB Albemarle Corp. 2,100 $70.55 $148,155.00 0.8% $1,386.00 0.9BDC Belden Inc. 5,600 $38.03 $212,968.00 1.1% $1,120.00 0.5CLC CLARCOR Inc. 3,700 $45.19 $167,203.00 0.9% $1,554.00 0.9FIX Comfort Systems USA Inc. 5,800 $12.21 $70,818.00 0.4% $1,160.00 1.6EXP Eagle Materials Inc. 3,000 $29.09 $87,270.00 0.5% $1,200.00 1.4RTI RTI International Metals Inc. 2,500 $31.94 $79,850.00 0.4% $0.00 0.0WSO Watsco Inc. 4,900 $70.89 $347,361.00 1.9% $11,172.00 3.2
$1,113,625.00 6.0% $17,592.00 1.2

36
STATEMENT OF ASSETS – HEALTH PLAN
Source: Thomson Reuters PORTIA.
As of April 30, 2011Market % Annual
Security Symbol Security Description Quantity (Units) Price Value Assets Income Yield
PRODUCER DURABLESAOS A.O. Smith Corp. 3,150 $43.97 $138,505.50 0.7% $1,764.00 1.3ABCO Advisory Board Co. 2,800 $46.72 $130,816.00 0.7% $0.00 0.0BRC Brady Corp. 5,800 $37.71 $218,718.00 1.2% $4,176.00 1.9CSL Carlisle Cos. 3,600 $49.54 $178,344.00 1.0% $2,448.00 1.4HUBG Hub Group Inc. 5,300 $40.28 $213,484.00 1.2% $0.00 0.0NSP Insperity Inc. 4,200 $30.29 $127,218.00 0.7% $2,520.00 2.0KAMN Kaman Corp. 4,300 $37.20 $159,960.00 0.9% $2,408.00 1.5LSTR Landstar System Inc. 5,100 $47.40 $241,740.00 1.3% $1,020.00 0.4MTZ MasTec Inc. 20,100 $22.68 $455,868.00 2.5% $0.00 0.0MSA Mine Safety Appliances Co. 4,800 $39.68 $190,464.00 1.0% $4,992.00 2.6MWW Monster Worldwide Inc. 12,000 $16.41 $196,920.00 1.1% $0.00 0.0NAV Navistar International Corp. 3,700 $69.52 $257,224.00 1.4% $0.00 0.0PLL Pall Corp. 5,800 $58.44 $338,952.00 1.8% $4,060.00 1.2PWR Quanta Services Inc. 8,000 $21.68 $173,440.00 0.9% $0.00 0.0UTIW UTi Worldwide Inc. 7,900 $22.41 $177,039.00 1.0% $474.00 0.3WCN Waste Connections Inc. 6,300 $30.77 $193,851.00 1.0% $1,890.00 1.0WCC Wesco International Inc. 2,700 $61.95 $167,265.00 0.9% $0.00 0.0
$3,559,808.50 19.1% $25,752.00 0.8
TECHNOLOGYAATI Advanced Analogic Technologies In 10,900 $4.26 $46,434.00 0.3% $0.00 0.0ARBA Ariba Inc. 12,100 $34.77 $420,717.00 2.3% $0.00 0.0CELL Brightpoint Inc. 11,800 $10.12 $119,416.00 0.6% $0.00 0.0SCOR comScore Inc. 4,607 $29.81 $137,334.67 0.7% $0.00 0.0CYMI Cymer Inc. 2,400 $48.10 $115,440.00 0.6% $0.00 0.0DMAN DemandTec Inc. 6,400 $11.07 $70,848.00 0.4% $0.00 0.0EQIX Equinix Inc. 1,200 $100.66 $120,792.00 0.7% $0.00 0.0FCS Fairchild Semiconductor Internati 1,700 $20.97 $35,649.00 0.2% $0.00 0.0FTNT Fortinet Inc. 400 $48.70 $19,480.00 0.1% $0.00 0.0IM Ingram Micro Inc. 6,400 $18.73 $119,872.00 0.6% $0.00 0.0IDTI Integrated Device Technology Inc. 5,348 $8.14 $43,505.98 0.2% $0.00 0.0IVAC Intevac Inc. 5,700 $12.23 $69,711.00 0.4% $0.00 0.0IL IntraLinks Holdings Inc. 2,200 $31.76 $69,872.00 0.4% $0.00 0.0JBL Jabil Circuit Inc. 27,300 $19.84 $541,632.00 2.9% $7,644.00 1.4

37
STATEMENT OF ASSETS – HEALTH PLAN
Source: Thomson Reuters PORTIA.
As of April 30, 2011Market % Annual
Security Symbol Security Description Quantity (Units) Price Value Assets Income Yield
TECHNOLOGYMPWR Monolithic Power Systems Inc. 2,000 $16.98 $33,960.00 0.2% $0.00 0.0MOTR Motricity Inc. 8,100 $13.35 $108,135.00 0.6% $0.00 0.0ONNN ON Semiconductor Corp. 50,800 $10.50 $533,400.00 2.9% $0.00 0.0QLGC QLogic Corp. 6,100 $17.98 $109,678.00 0.6% $0.00 0.0MKTG Responsys Inc. 500 $15.98 $7,990.00 0.0% $0.00 0.0RFMD RF Micro Devices Inc. 55,564 $6.66 $370,056.24 2.0% $0.00 0.0RNOW RightNow Technologies Inc. 8,000 $36.18 $289,440.00 1.6% $0.00 0.0ROG Rogers Corp. 1,300 $41.52 $53,976.00 0.3% $0.00 0.0SANM Sanmina-SCI Corp. 9,700 $11.72 $113,684.00 0.6% $0.00 0.0SMTC Semtech Corp. 8,700 $28.07 $244,209.00 1.3% $0.00 0.0TECD Tech Data Corp. 4,200 $53.13 $223,146.00 1.2% $0.00 0.0TSRA Tessera Technologies Inc. 16,500 $19.76 $326,040.00 1.8% $0.00 0.0TQNT TriQuint Semiconductor Inc. 4,300 $13.76 $59,168.00 0.3% $0.00 0.0VECO Veeco Instruments Inc. 3,400 $51.13 $173,842.00 0.9% $0.00 0.0PAY VeriFone Systems Inc. 2,400 $54.82 $131,568.00 0.7% $0.00 0.0VRNT Verint Systems Inc. 2,700 $34.23 $92,421.00 0.5% $0.00 0.0VRTU Virtusa Corp 9,400 $18.66 $175,404.00 0.9% $0.00 0.0WWWW Web.com Group Inc. 5,600 $15.78 $88,368.00 0.5% $0.00 0.0
$5,065,188.89 27.2% $7,644.00 0.0
UTILITIESCCOI Cogent Communications Group Inc. 9,600 $14.51 $139,296.00 0.8% $0.00 0.0PGI Premiere Global Services Inc. 13,811 $7.91 $109,245.01 0.6% $0.00 0.0
$248,541.01 1.3% $0.00 0.0
CASH & CASH EQUIVALENTS $421,698.80 2.2% $0.00 0.0
COMMON STOCKS $18,214,552.00 97.8% $81,483.00 0.4
TOTAL PORTFOLIO $18,636,250.54 100.0% $81,483.00 0.4

38
LA DEPARTMENT OF WATER & POWER FEE SCHEDULE
1.0% per annum on Total Assets, payable quarterly in arrears
(Frontier waived the first three months of investment management fees)

39
-5
0
5
10
M2 growth, velocity of money still very lowM2 money supply, 12-m % change and velocity of money
E-US-00219
M2 growth, % y/y
65 69 73 77 81 85 89 93 97 01 05 09
Velocity of money, index
1.6
1.8
2.0
2.2M2 growth (left)Velocity of money (right)
Brockhouse Cooper (Federal Reserve data via Datastream)Shaded areas = U.S. recessions
0
5
10
15
20
25
6% savings rate was sufficient after the Great DepressionU.S. Personal saving as a % of personal disposable income
E-US-00229
%
29 35 41 47 53 59 65 71 77 83 89 95 01 07
5.7
Brockhouse Cooper (BEA data via Datastream)Shaded areas = U.S. recessions
800
1000
1200
1400
U.S.: Stock market closely tied to jobless claimsS&P 500 vs. Jobless claims 4-w moving average
E-US-00047
Index
07 08 09 10 1107 09 11
Thousands, Inverted scale
650
600
550
500
450
400
350
300S&P 500 (L)Initial jobless claims, 4-w average (R)
Brockhouse Cooper (data via Datastream)Shaded areas = U.S. recessions
50000
100000
150000
200000
250000
Layoffs on the waneChallenger US job cut announcements
E-US-00030
Total layoffs
99 01 03 05 07 09 11
36,490
Brockhouse Cooper (Challenger, Gray & Christmas data via Bloomberg)Shaded areas = U.S. recessions

40
95
100
105
110
115
120
125
U.S. leading indicator follows normal recovery patternU.S. leading indicator, rebased, recession end = 100
E-US-00068
1975-761982-831992-932001Current
Brockhouse Cooper (The Conf. Board data via Datastream)-12 -9 -7 -5 -3 -1 1 3 5 7 9 11 14 17 20 23
Months from recession end
50
100
200
500
1000
U.S. profits rebound sharplyCorporate profits
E-US-00023
Bill ions USD (log scale)
50 54 58 62 66 70 74 78 82 86 90 94 98 02 06 10
% ch. YoY
-40
-20
0
20
40
Corporate profits (L)Quarterly change (R)
Brockhouse Cooper (BEA data via Datastream)Shaded areas = U.S. recessions
20
40
60
80
100
S&P 500 earnings expected to grow 15.3% over the next 12 monthsS&P 500 Composite 12-m forw. EPS
E-US-00212
Index EPS (log scale)
85 87 89 91 93 95 97 99 01 03 05 07 09 11
103
Brockhouse Cooper (data via Datastream)Shaded areas = U.S. recessions
100
110
120
130
140
150
Japanese equities did not fall in 2006 as a result of ending QEBoJ balance sheet and Topix
E-JP-00026
BoJ balance sheet, JPY tri l l ions
01 03 05 07
Topix, index
800
1000
1200
1400
1600
1800
BoJ balance sheet (left)Topix (right)
Brockhouse Cooper (Bank of Japan data via Datastream)Shaded areas = U.S. recessions

41
Proprietary ISM New Orders/Inventory Indicator Not Signaling Recession
Proprietary ISM New Orders/Inventory Indicator Suggest 2.5-4.0% GDP
A Ratio Below 1.12 Would be Cause for Concern

42
Relative Performance from a bond holders perspective.
We were here.
Bernanke is
moving us to
here.
Stocks cheap vs. high yield bonds
Stocks expensive vs. high yield bonds
May-2011
Low But Rising Inflation Environments Favor Equities
If Bernanke gets his wish and inflation begins to rise, stocks will massively outperform bonds
Bond Fund Flows Finally Waning
Equities Likely To Enjoy a Long Run of Positive Fund Flows
Low Interest Rates Make Stocks Attractive
Fed Forces Investors to Stocks. Earnings grow but bond coupons don’t.
U.S.: Below 10Y Treasury yields of 5%
‘Fed model’ does not work
2 3 4 5 6 7 8 9
10
12
14
16
18
20
U.S.: Below 10Y Treas. yields of 5%, 'Fed model' does not work
10-year Treasury bond yield (%)
MS
CI U
.S.A
. 12-
m fw
d P
/E
May-2011
Brockhouse Cooper (MSCI data via Datastream)
E-WD-00179
Actual fitted curveFed model

43
Small Cap Valuation Premium Distorted By Low ROIC Stocks
Low or No Earnings Stocks Account for Virtually all the Small Cap PE Premium to LargeMargin Upside a Key Driver to Earnings
While Large Caps are at or Near Peak Margins, Small Caps have Ample Headroom
High Quality and High Beta Have Assume Leadership A Return of Growth Investing?

44
Russell 2000Relative to
S&P 500
44
NOMINAL: Interest rates are low and above average PEs are to be expected. Earnings are also growing at above average rates, justifying higher valuation.
RELATIVE: The Internet Bubble, which drove S&P 500 valuation to over 30X is skewing this ’89 to present chart. So long as real rates are low, small-caps will have upward relative valuation pressure. This is a neutral factor in small vs. large.
PEs
–
Not Cheap, but Rates Low
The Bear Case’s Best Ammunition
Russell 2000Relative to
S&P 500
EV/EBITDA –
Healthy, Improving, Below Peak This Data doesn’t Make Us Happy but it is not a bear knell
NOMINAL: Roughly 10% below ‘03 – ’06 period and still below ‘96. Not cheap but well off the highs.
RELATIVE: Much like the nominal levels, neither cheap nor dear. This is a neutral factor in small vs. large.
Small Cap Margin Opportunity vs. Large Exists
If Small Caps can tame their SG&A expenses, they will enjoy the secular margin improvement Large has seen
0.51.01.52.02.53.03.54.04.5
1Q79 1Q83 1Q87 1Q91 1Q95 1Q99 1Q03 1Q07 1Q11
0.0
0.5
1.0
1.5
2.0
1Q79 1Q83 1Q87 1Q91 1Q95 1Q99 1Q03 1Q07 1Q11
0.0
0.5
1.0
1.5
2.0
1Q79 1Q83 1Q87 1Q91 1Q95 1Q99 1Q03 1Q07 1Q110.0
0.5
1.0
1.5
1Q79 1Q83 1Q87 1Q91 1Q95 1Q99 1Q03 1Q07 1Q11
Russell 2000 Growth vs. Russell 1000 Growth Relative Valuations
Relative Trailing P/E Relative Forecast P/E
Relative P/B Relative P/S
Source: Bank of America Merrill Lynch Small Cap Research Merrill Lynch, Pierce, Fenner & Smith Incorporated

45
Michael A. Cavarretta, CFAChairmanResponsibilityPortfolio Manager, Frontier Capital Appreciation PortfoliosTeam Leader, Frontier Research PortfoliosPrior ExperienceFinancial Analyst, General Electric CompanyEducationB.S. University of MaineM.B.A. Harvard Business School
Stephen M. Knightly, CFAPresidentResponsibilityPortfolio Manager, Frontier Mid Cap Growth PortfoliosPrior ExperienceAcquisitions Analyst, Glenthorne Capital, Inc.Financial Analyst, Neuberger & BermanAnalyst and Account Manager, Bankers Trust CompanyEducationB.S. Lehigh UniversityM.B.A. The Wharton School, University of Pennsylvania
William A. Teichner, CFASenior Vice PresidentResponsibilityPortfolio Manager, Frontier Small Cap Value PortfoliosPrior ExperiencePresident's Council of Economic Advisers, The White HouseCharles M. Williams Fellow, Harvard Business SchoolCorporate Finance Analyst, Shearson Lehman Brothers Inc.EducationB.A. Columbia UniversityM.B.A. Harvard Business School
Thomas W. Duncan, Jr.Senior Vice PresidentResponsibilityPortfolio Manager, Frontier Small Cap Value PortfoliosPrior ExperienceEquity Trader, Cowen & CompanyEconomic Analyst, First Albany Corp.EducationB.A. Skidmore CollegeM.B.A. Cornell University
James A. ColganSenior Vice PresidentResponsibilityPortfolio Manager, Frontier Small Cap Growth PortfoliosPrior ExperienceManager, Digital Equipment CorporationProgram Manager, United Technologies Corporation EducationB.S. University of ConnecticutM.S. University of MassachusettsM.S., M.B.A. MIT Sloan School of Management
G. Michael Novak, Jr.Senior Vice PresidentResponsibilityPortfolio Manager, Frontier Small Cap Growth PortfoliosPrior ExperienceSummer Associate, Bain & Company and Morgan Stanley Dean WitterCaptain, United States ArmyEducationB.S. United States Military AcademyM.B.A. Harvard Business School
BIOGRAPHIES – INVESTMENT TEAM

46
Andrew B. Bennett, CFAVice PresidentResponsibilityAssistant Portfolio Manager, Frontier Capital Appreciation PortfoliosResearch AnalystPrior ExperienceAssistant Portfolio Manager, Wellington Management Company, LLPResearch Associate, Frontier Capital Management Company, LLCAssociate Analyst, Alex. Brown & SonsEducationB.A. Wheaton College
Rushan (Greg) Jiang, CFAVice PresidentResponsibilityResearch AnalystPrior ExperienceSummer Associate, Global Investment Research, Goldman SachsAssociate, Equity Research, India Capital FundProject Leader and Senior Engineer, Oracle CorporationEducationB.S. The University of Texas at AustinM.S. Stanford UniversityM.B.A. MIT Sloan School of Management
Peter G. KuechleVice PresidentResponsibilityTeam Leader, Frontier Research PortfoliosResearch AnalystPrior ExperienceAssociate, Bain Capital VenturesManager, Corporate Development, SupplierMarket/AribaPrincipal, Advent InternationalBusiness Analyst, McKinsey & Company, Inc.EducationB.A. Dartmouth CollegeM.B.A. Harvard Business School
Jonathan M. Levin, MDVice PresidentResponsibilityResearch AnalystPrior ExperienceEquity Analyst, State Street Research and ManagementClinical Director, Brain Imaging Center and Director, Laboratory for Cerebral Blood Flow, Harvard Medical School/McLean HospitalNeurology Resident, Brigham and Women’s HospitalEducationB.A. Yale UniversityM.D. Emory University School of MedicineM.P.H. Harvard School of Public HealthM.B.A. MIT Sloan School of Management
Christopher J. ScarpaVice PresidentResponsibilityAssistant Portfolio Manager, Frontier Mid Cap Growth PortfoliosResearch AnalystPrior ExperienceAssociate, Institutional Research Equity Sales, Merrill Lynch & Co.Summer Associate, Merrill Lynch & Co.Area Director, Public Employees Benefit Services CorporationFinancial Analyst, Drexel Burnham Lambert, Inc.EducationB.A. Tufts UniversityM.B.A. Harvard Business School
Ravi DabasVice PresidentResponsibilityResearch AnalystPrior ExperienceDirector, Information Technology, Agere Systems Inc.Senior Manager, Information Technology, EMC CorporationSenior Consultant, Deloitte Consulting/CGI Group Inc.Systems Analyst, BP/Amoco CorporationEducationB.E. Delhi College of Engineering, University of New DelhiM.S. University of HoustonM.B.A. The Wharton School, University of Pennsylvania
BIOGRAPHIES – INVESTMENT TEAM
47
Nathan A. HaymanVice PresidentResponsibilityResearch AnalystPrior ExperienceSummer Associate, The Weitz FundsSenior Associate, Yigal Arnon & Co.EducationL.L.B. Hebrew University Law SchoolM.B.A. Tuck School of Business at Dartmouth
Kristin S. KingResearch AnalystResponsibilityResearch AnalystPrior ExperienceFixed Income Corporate Credit Analyst, Emerging Market Debt, Wellington Management CompanyAssociate and Business Analyst, Global Investment Research, Goldman, Sachs & Co.EducationB.S. University of Notre DameM.B.A. The Wharton School, University of Pennsylvania
Michael E. GarganoResearch AnalystResponsibilityResearch AnalystPrior ExperienceSenior Research Analyst, Copper Rock Capital Partners, LLCVice President, Analyst, BlackRock, Inc./State Street Research & ManagementEquity Research Associate, Bear, Stearns & Company, Inc.Equity Research Associate, Loomis, Sayles & Company, L.P.Financial Analyst, Charterhouse, Inc.EducationB.S. Boston College
William J. BallouChief Operating OfficerResponsibilityAdministrative and LegalPrior ExperienceSenior Vice President and Senior Counsel, Liberty Financial Companies, Inc.Vice President and Associate Counsel, MFS Investment ManagementAssociate, Ropes & GrayEducationB.S. Union CollegeJ.D. Duke University School of Law
Richard H. Binder, CPASenior Vice PresidentResponsibilityChief Financial OfficerPrior ExperienceManager, Wolf & CompanyEducationB.A. University of Massachusetts
Carolyn C. SheaVice PresidentResponsibilityInstitutional TraderPrior ExperienceSenior Equity Trader, Principal, Arlington Capital ManagementSenior Equity Trader, Assistant Vice President, ING Pilgrim InvestmentsSenior Equity Trader, Vice President, Frontier Capital Management Company, LLCEquity Trader, Harbor Capital ManagementResearch Analyst/Assistant, Franklin Research & DevelopmentEducationB.A. St. Lawrence University
Lisa A. TurleyVice PresidentResponsibilityInstitutional TraderEducationB.S. University of Massachusetts
BIOGRAPHIES – INVESTMENT TEAM

48
Sarah J. JankowskiChief Administrative OfficerResponsibilityInstitutional Marketing and Client ServicePrior ExperienceAssociate Director, Investment Counsel Association of America, Inc. (now Investment Adviser Association)EducationB.A. Wells College
Amy L. JanezicVice PresidentResponsibilityInstitutional Marketing and Client ServicePrior Experience Custody Accountant, Investors Bank & Trust CompanyEducationB.S. Boston CollegeM.B.A. Babson College
BIOGRAPHIES – MARKETING & CLIENT SERVICE Christopher W. PremockVice PresidentResponsibilityInstitutional Marketing and Client ServicePrior ExperienceVice President, Lehman Brothers Asset ManagementVice President, Neuberger Berman, LLCFounder, Premier Travel BagsEducationA.A.S. Vermont Technical CollegeB.S. Arizona State UniversityM.S. Baruch College
Leigh Anne YooVice PresidentResponsibilityInstitutional Marketing and Client ServicePrior ExperienceVice President, Lazard Asset ManagementEducationB.B.A. University of Georgia

49
DISCLOSURE
Frontier has prepared and presented this report in compliance with the Global Investment Performance Standards (GIPS®).
a. Frontier refers to Frontier Capital Management Company, LLC and includes all fee- paying, discretionary individually managed accounts, wrap-fee accounts and mutual funds sub-advised by Frontier. Frontier is an affiliate of Affiliated Managers Group, Inc.
b. Frontier has been verified for the periods January 1, 1993 to December 31, 2007 by Wolf & Company, P.C. A copy of the verification report is available upon request. Returns prior to 1993 are not in compliance with GIPS® standards because they may not meet all of GIPS® calculation requirements. A complete list and description of the firm’s composites and performance results are available upon request.
c. Inception date and composite creation date: Frontier Small Cap Growth: January 1, 1985. Benchmark: Russell 2000 Growth. Russell indices are unmanaged and their results include income, but do not include fees, commissions or other expenses.
d. Frontier Small Cap Growth composite portfolios include investments in companies with earnings growth expectations in excess of that of the broad market over a several year period and with a market capitalization within the range of companies in the Russell 2000® Index at the time of initial purchase. The Russell 2000® Growth Index measures the performance of the Russell 2000 companies with higher price-to- book ratios and higher forecasted growth values.
e. Securities transactions are accounted for on trade date and accrual accounting is utilized.
f. Valuations and performance results are computed and stated in U.S. Dollars.g. Gross returns were calculated on a total return basis, including all dividends and
interest, accrued income, realized and unrealized gains or losses, and are net of all brokerage commissions, execution costs, without provision for federal or state income taxes. Gross-of-fees returns are presented before management fees. Cash and equivalents are included in performance returns. Actual fees are negotiable and may vary depending on account type and portfolio size.
h. The monthly returns of the composite combine the individual accounts’ returns (calculated on a time-weighted rate of return which is revaluated whenever cash flows exceed 10% of the account's value) by asset-weighting each account’s asset value as of the beginning of the month. Quarterly and yearly returns are calculated by geometrically linking the monthly and quarterly returns, respectively. Additional information regarding policies for calculating and reporting returns is available upon request.
i. The composite includes all actual, fee-paying, discretionary accounts, with comparable investment objectives and risks.
j. Composite dispersion is computed using the asset-weighted standard deviation of all accounts that were included in the composite for the entire year. Dispersion is not considered meaningful and is not presented when there are less than five accounts included in the composite for the entire year.
k. The results for individual accounts or for different periods may vary. Other performance calculation methods might produce different results. Investors should not rely on prior performance as a reliable indication of future performance.
Frontier Small Cap Growth CompositePerformance Results: January 1, 1985, through March 31, 2011
Total Assets Percentage Percentage TotalGross Number Composite at End of of Non- Firm
of Fees Benchmark of Dispersion of Period Firm Fee-Paying AssetsYear Return (%) Return (%) Portfolios (%) (USD millions) Assets Portfolios (USD millions)
1985 42.5% 31.0% 1 * $1 <1 100 $7581986 33.8% 3.6% 6 * $109 14 0 $8061987 -3.5% -10.5% 12 * $155 22 0 $6991988 43.1% 20.4% 18 * $307 40 0 $7651989 25.3% 20.2% 20 * $432 48 0 $8971990 -15.7% -17.4% 20 * $414 44 0 $9431991 51.5% 51.2% 20 * $628 50 0 $1,2631992 18.8% 7.8% 20 1.45% $623 46 0 $1,3441993 23.5% 13.4% 20 1.64% $709 46 0 $1,5271994 1.4% -2.4% 20 0.85% $786 50 0 $1,5731995 27.1% 31.0% 20 1.21% $971 44 0 $2,1831996 23.0% 11.3% 20 1.15% $1,209 46 0 $2,6271997 25.5% 12.9% 19 0.61% $1,598 49 0 $3,2901998 8.5% 1.2% 19 0.53% $1,898 49 0 $3,8451999 31.4% 43.1% 19 0.92% $2,462 49 0 $4,9872000 13.0% -22.4% 18 1.12% $2,118 44 0 $4,8482001 3.0% -9.2% 19 0.56% $2,030 46 0 $4,3962002 -19.8% -30.3% 23 0.85% $1,521 39 0 $3,8522003 43.9% 48.5% 23 0.65% $2,254 40 0 $5,6612004 12.7% 14.3% 24 0.37% $2,475 44 0 $5,6292005 12.2% 4.2% 24 0.22% $2,485 46 0 $5,4112006 10.4% 13.4% 23 0.24% $2,573 42 0 $6,0762007 11.4% 7.1% 20 0.24% $2,362 37 0 $6,3052008 -35.9% -38.5% 20 0.59% $1,326 30 0 $4,3972009 45.5% 34.5% 24 0.55% $2,130 31 0 $6,7762010 31.1% 29.1% 28 0.33% $3,447 35 0 $9,9502011 9.1% 9.2% 29 0.14% $3,780 38 0 $11,006

5050
ADDITIONAL
DISCLOSURES
The holdings of the strategy may differ significantly from the securities that comprise the indexes and universes shown. The index and universe has been selected to represent what Frontier believes are appropriate benchmarks to compare the strategy’s performance to. The index is unmanaged and cannot be invested in directly. The returns of the index do not include any transaction costs, management fees, or other costs.
The actual performance achieved by a client portfolio may be affected by a variety of factors, including the initial balance of the account, the timing and amount of any additions to or withdrawals from the portfolio, changes made to the account to reflect the specific investment needs or preferences of the client, duration and timing of participation as a Frontier client, and a client portfolio’s risk tolerance, investment objectives, and investment time horizon.
Charts and graphs included in this presentation are not meant as investment tools or to assist with investment decisions.
There is no guarantee that the investment objective will be met.
The product composite represents the investment results of a group of accounts with similar investment philosophies and objectives, managed by Frontier. The composite is an asset-weighted average of each account’s time-weighted return, and includes reinvestment of income. Composite returns have the potential to be adjusted until reviewed and finalized following calendar quarter ends, and changes to monthly data will be made without any notification to institutional clients, prospects, or consultants.
Information contained in this presentation has been obtained from sources believed to be reliable, but not guaranteed. Furthermore, there can be no assurance that any trends described in this presentation will continue because economic and market conditions change frequently.
Any sectors, industries or securities discussed should not be perceived as investment recommendations.

51
GLOSSARY OF INVESTMENT TERMS
Current Dividend Yield – The yield is determined by dividing the amount of the annual dividends per share by the market price per share of the stock.
Current P/E (12-month Trailing) – Trailing P/E is determined by using the stock price per share on the last day of the most recent quarter as the numerator and dividing by the earnings per share for the past four quarters.
Current P/E (12-month Forward) – Forward P/E is found by using the stock price per share on the last day of the most recent quarter as the numerator and dividing by the earnings per share estimates for the next four quarters.
Current P/B – Calculated by using the stock price per share on the last day of the most recent quarter as the numerator and dividing by the book value per share for the past four quarters.
Current P/S (12-month Trailing) – Measure is calculated by using the stock price per share on the last day of the most recent quarter as the numerator and dividing by its per-share sales.
Current P/CF (12-month Trailing) – P/CF is determined by using the stock price per share on the last day of the most recent quarter as the numerator and dividing by the cash flow per share for the past four quarters.
5 Year ROE – A trailing five year average of the product’s return on equity. ROE is calculated by dividing net income by shareholder’s equity. It is a measure of a corporation’s profitability that reveals how much profit a company generates with the money shareholders have invested.
Earnings Growth (Past 5 Years) – This measure represents the growth in earnings experienced by the portfolio over the most recent five-year time period. It is calculated as a percentage of growth.
Earnings Growth (Next 5 Years) – This measure represents the forecasted growth in earnings to be experienced by the portfolio over the next five-year time period. It is calculated as a percentage of growth.
Weighted Avg. Mkt. Cap ($Mil) – Compute this measure by multiplying the market capitalization of each security times the security’s corresponding portfolio weight and then summing the results from all securities. This should be calculated using US dollars and expressed in millions of US dollars.