investment manager summary - ladwpretirement.ladwp.com/agendaitems/20161109 item 19.pdfinvestment...
TRANSCRIPT

19
Item No. 19: Annual Presentation by GAM – Hedge Fund of Funds Manager (November 9, 2016, Regular Retirement Board Meeting)
____________________________________________________________________________
INVESTMENT MANAGER SUMMARY
MANAGEMENT Firm Name GAM Manager Tenure with Fund 2.8 years Investment Strategy/Vehicle Absolute Return / Hedge Fund of Funds Contract Expiration N/A
ASSETS* Total Firm AUM $123 Billion Total Firm Assets in Strategy N/A** Total Assets Managed for WPERP (as of 9/30/16)
RP - $85.2 Million HP - $13.9 Million
PERFORMANCE (net of fees)* as of 9/30/16 QTD YTD 1-Year Inception
GAM -0.44% -1.57% -0.17% 2.26% Index: T-Bills + 3% 0.82% 2.46% 3.26% 3.11% Difference -1.26% -4.03% -3.43% -0.85% Inception Date: Dec. 1, 2013
FEES Schedule Annual Management Fee 0.65% Annual Administration Fee 0.10%
WATCH STATUS Not Applicable
* Per GAM ** WPERP portfolio is a customized fund of one.

This document is confidential and intended solely for the use of the person to whom it is given or sent and may not be reproduced, copied or given, in whole or in part, to any other person.
Water and Power Employees’ Retirement PlanYTD 2016 ReviewNovember 2016
Arvin Soh – Portfolio Manager, GAM Alternative Investments SolutionsJim Ha – Portfolio Manager, GAM Alternative Investments SolutionsKristin Hovencamp – Director, Institutional Sales

2
Arvin Soh – Portfolio Manager
Arvin Soh is a Portfolio Manager in GAM’s Alternative Investments Solutions team, responsible for theirglobal macro and managed futures investments. Prior to joining GAM in 2005, Arvin was a managerwithin the pension group at Pfizer, with primary responsibility for manager selection in internationalequity, global macro and currency funds. Before that, he was an assistant Portfolio manager with aquantitatively based fundamental hedge fund and a vice president with Bankers Trust AssetManagement focused on global markets. He holds a BA in Economics from Cornell University and anMBA from the Wharton School of the University of Pennsylvania. He is based in New York.
Jim Ha - Portfolio Manager
Jim Ha is a Portfolio Manager in GAM's Alternative Investments Solutions team, with a specific focuson trading strategies. Prior to joining GAM in May 2007, he worked as a senior manager coveringhedge funds and fixed income investments for the Avaya Inc. corporate pension plans. Jim holds a BAin Economics from Northwestern University in Evanston, Illinois, an MBA in Finance and Managementfrom New York University – Stern School of Business, and is a CFA charterholder. He is based in NewYork.
Kristin Hovencamp – Director, Institutional Sales
Kristin Hovencamp is a Director of Institutional Sales in North America. Prior to joining GAM in 2005,Ms. Hovencamp was Vice President of Sales at Information Management Network in New York. Thisfollowed two years as a senior marketing consultant at the Institute for International Research. Prior tothis, she was a regional sales manager at CertCo, Inc., a division of Bankers Trust. Ms. Hovencampholds a BA in Communications from the University of Arizona. She is based in New York.
GAM Attendee Bios

3
Company overview
WPERP Portfolio review
Holdings
Outlook
Investment Process
Appendix
Table of contents

COMPANYOVERVIEW

GAM Founded in 1983 with a sole focus on asset
management USD 116.5 bn in assets under management, of which
Investment management business is USD 67.2 bn Private label business is USD 49.3 bn
SIX Swiss Exchange Public Company Distinctive offering covering the full spectrum of asset
classes and strategies Over 1,000 employees* globally in
Bermuda – London – Singapore Dublin – New York – Zurich Hong Kong – Tokyo
Aligned interests through long-term equity incentives for key personnel
SEC registered investment advisers and GIPS compliant firm
Acquired $1.2bn European CRE private debt team Renshaw Bay***
Acquired Cantab Capital Partners, a $4.1bn UK-based multi-strategy systematic manager***
GAM’s Alternative Investments Team Over 25 years’ experience in hedge fund investing AIS has 30** professionals working out of offices
located in New York, London, Hong Kong and Zurich Approximately $3.2 billion in assets under
management in hedge fund of fund assets; $1.1 billion in Trading assets
Specialty research teams review over 300 managers and risk premia per year
Qualitative judgment on approximately 90%*** of the universe by number of funds
5
Bringing experience, resources and institutional discipline to traditional and alternative investmentsAbout GAM
Source: GAM. Assets under management figures as of June 30, 2016. Staff information as of June 30, 2016 for the GAM Holding Group. *In 2013, the Group changed its operating model, moving it from a pure financial holding company with two largely autonomous operating entities to a more integrated functional organizational structure. Throughout 2013 and 2014, many functions were combined and as a result, personnel figures for GAM and Swiss & Global Asset Management are no longer reported separately – the figures provided from Dec 31, 2014 onwards are consolidated for the whole GAM group, and are given in place of the GAM operating entity only, which was given in previous years. **As of Sep 30, 2016. Includes employees who are on leave. ***As of Sep 30, 2016.

Deep and experienced teams
6
GAM’s substantial global resources
Source: GAM. Firm information as of June 30, 2016, team information as of Sep 30, 2016. Latest data available at time of production. Number of staff include permanent and investment consultant professionals. Number in parenthesis indicate years’ of investment experience, Investment experience includes relevant experience for investment managers and analysts.
Group CEO
No of staff
Function
Distribution, Marketing and
Product Development
190
Distribution & Marketing
Portfolio Management
& Private ClientsInvestment Solutions
Fixed Income, Equity & AbsoluteReturn Investment
Teams
204
Investment
Operations & Technology
465
Operations
L&C, Internal Audit,Finance, HR,
Brand & Comms, General Management
152
Control Functions
GAM Operational Risk team
3
Investment Research Analysts 10
Quant Team 6
Operations & Client Reporting Analysts 4
Group Head GAM Investment Solutions
and Chief Economist
Larry Hatheway*
Portfolio Manager
ArvinSoh*
Portfolio Risk
Ken Liew
Portfolio Manager
Amir Madden*
Portfolio Manager
Jim Ha*
Portfolio Manager
Julian Howard
Portfolio Manager
Charles Hepworth
Portfolio Manager
Andrea Quapp
Portfolio Manager
Reto Hintemann
Portfolio Manager
Anthony Lawler*
Portfolio Manager
Kier Boley*
* Member AIS Investment Management Committee
Systematic

Operational risk and investment risk each assessed by dedicated teams
7
Independent risk oversight
Source: GAM as at Sep 30, 2016.
● Monitor, collect and report on risk across asset classes and strategies
● Report on and analyse risk premia Portfolios through
– Daily risk reports– Daily leverage reports– Monthly performance contribution– Monthly VaR
● Regularly validate VaR modelling methodology and results
● Highlight risk hotspots, engage with Portfolio managers and escalate issues if relevant
GAM Head of Operations
Head of Operational Due Diligence
Deputy Head of Operational Due Diligence1
Operational Due Diligence Managers1
Quantitative Analysis Co-Managers
Senior Quantitative Analysts2
Quantitative Analysts4
Exclusive focus on mitigating non-investment risks
Qualifications include accountants/auditors and lawyer
Benefit from considerable industry experience across– Investment banking– Risk management
Hold veto authority over appointing managers due to operational concerns
– Auditing– Trading
GAM Head of Risk & Governance

WPERPPortfolioREVIEW

9
Asset GrowthWater and Power Employees’ Retirement Plan
Source: GAMPast performance is not indicative of future returns. Please see "Disclaimer" at the end of this material for important disclosures regarding the information contained herein.
Portfolio Changes(Retirement Fund)
Amount
Initial Value Invested as of 11/29/13 $80,000,000
Net Additions/(Withdrawals) $0
Income Received $0
Market Appreciation $5,232,000
Market Value as of 9/30/16 $85,232,000
Portfolio Changes(Retiree Health Benefits Fund)
Amount
Initial Value Invested as of 11/29/13 $13,000,000
Net Additions/(Withdrawals) $0
Income Received $0
Market Appreciation $850,200
Market Value as of 9/30/16 $13,850,200

Portfolio strategy ranges & objectives
Investment guidelines*
Objective of long-term capital appreciation with diversification of risk
Long-term over a 3-5 year rolling market cycle:
Return Objective: 90 day T-Bills +3%
Average Annual Volatility Objective: 4-7%
Correlation Objective to Russell 3000 index and MSCI AWCI ex US index: ≤0.2
Divergent Portfolio
Targeted Diversification: Investment concentration ≤14% at market value and ≤ 10% at cost
Fee Schedule
Flat management fee – 65 bps
Fund Administration fee - 10 bps
Water and Power Employees’ Retirement Plan
Source: GAM as of Sep 30, 2016. *Based upon guidelines provided by the investor. There can be no assurance that these objectives will be realized. Investment objectives do not represent a prediction of returns, volatility or a promise to deliver any particular investment goal. Actual performance and volatility may be greater or less than these objectives.
10
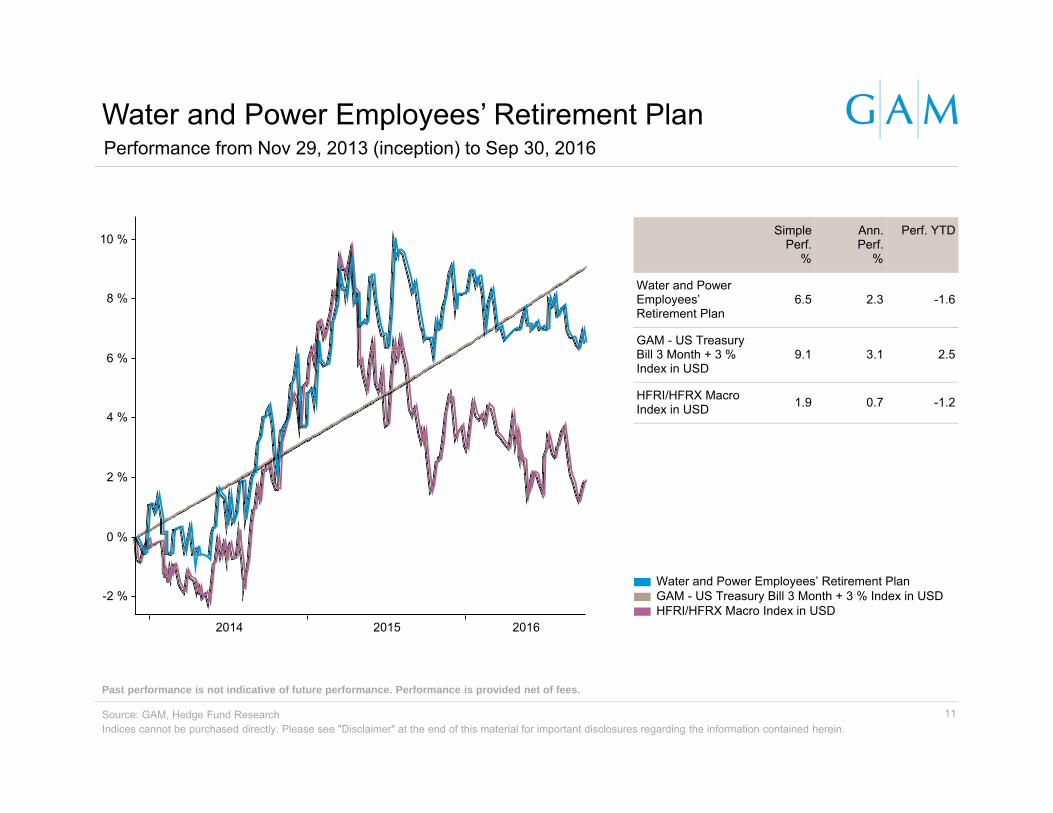
-2 %
0 %
2 %
4 %
6 %
8 %
10 %
2014 2015 2016
Simple Perf.
%
Ann. Perf.
%
Perf. YTD
Water and Power Employees’ Retirement Plan
6.5 2.3 -1.6
GAM - US Treasury Bill 3 Month + 3 % Index in USD
9.1 3.1 2.5
HFRI/HFRX Macro Index in USD 1.9 0.7 -1.2
Water and Power Employees’ Retirement PlanGAM - US Treasury Bill 3 Month + 3 % Index in USDHFRI/HFRX Macro Index in USD
Water and Power Employees’ Retirement PlanPerformance from Nov 29, 2013 (inception) to Sep 30, 2016
Indices cannot be purchased directly. Please see "Disclaimer" at the end of this material for important disclosures regarding the information contained herein.
Past performance is not indicative of future performance. Performance is provided net of fees.
Source: GAM, Hedge Fund Research 11

12
2016 quarterly performance (%)Water and Power Employees’ Retirement Plan
Source: GAM, Hedge Fund Research.Past performance is not indicative of future returns. Indices cannot be purchased directly.Please see "Disclaimer" at the end of this material for important disclosures regarding the information contained herein.
(-1.29)
0.55
(-0.25)
(-1.00)
3.05
(-1.48)
0.35
-(0.44)
(-1.57)
2.26
0.81 0.80 0.82
2.46
3.11
(2.00)
(1.00)
0.00
1.00
2.00
3.00
4.00
Q1 Q2 Q3 YTD Since inception
WPERP - gross WPERP - net GAM - US Treasury Bill 3 Month + 3 % Index

2016 (%) Jan Feb Mar Apr May Jun Jul Aug Sep Oct Nov Dec Year
Water and Power Employees’ Retirement Plan - net
0.51 -0.40 -1.59 0.35 -0.03 0.03 0.41 -0.65 -0.20 -1.57
Water and Power Employees’ Retirement Plan - gross
0.58 -0.33 -1.52 0.41 0.04 0.09 0.48 -0.59 -0.14 -1.00
US Treasury Bill 3 Month + 3 % Index in USD 0.25 0.28 0.28 0.25 0.28 0.27 0.26 0.29 0.27 2.46
13
Performance detail for 2015 and 2016Water and Power Employees’ Retirement Plan
Source: GAM as of Sep 30, 2016.Past performance is not indicative of future returns. Indices cannot be purchased directly.Please see "Disclaimer" at the end of this material for important disclosures regarding the information contained herein.
2015 (%) Jan Feb Mar Apr May Jun Jul Aug Sep Oct Nov Dec Year
Water and Power Employees’ Retirement Plan - net
1.00 1.27 0.72 -0.86 1.56 -2.22 3.05 -1.27 -1.40 0.27 2.03 -0.86 3.19
Water and Power Employees’ Retirement Plan - gross
1.07 1.33 0.78 -0.80 1.62 -2.15 3.11 -1.20 -1.34 0.34 2.10 -0.80 3.99
US Treasury Bill 3 Month + 3 % Index in USD 0.24 0.23 0.26 0.25 0.23 0.27 0.25 0.26 0.25 0.24 0.26 0.27 3.05

2014 (%) Jan Feb Mar Apr May Jun Jul Aug Sep Oct Nov Dec Year
Water and Power Employees’ Retirement Plan - net
-0.94 0.12 -0.39 -0.53 0.97 0.05 1.50 0.26 2.05 -0.62 1.61 -0.37 3.71
Water and Power Employees’ Retirement Plan - gross
-0.87 0.18 -0.33 -0.47 1.03 0.11 1.57 0.32 2.12 -0.56 1.67 -0.30 4.51
US Treasury Bill 3 Month + 3 % Index in USD 0.25 0.23 0.26 0.25 0.24 0.27 0.25 0.24 0.26 0.25 0.23 0.27 3.03
14
Performance detail for 2013 and 2014 (inception Nov 29, 2013)Water and Power Employees’ Retirement Plan
Source: GAM.Past performance is not indicative of future returns. Indices cannot be purchased directly.Please see "Disclaimer" at the end of this material for important disclosures regarding the information contained herein.
2013 (%) Jan Feb Mar Apr May Jun Jul Aug Sep Oct Nov Dec Year
Water and Power Employees’ Retirement Plan - net
1.14 1.14
Water and Power Employees’ Retirement Plan - gross
1.22 1.22
US Treasury Bill 3 Month + 3 % Index in USD 0.27 0.27

15
Return statisticsWater and Power Employees’ Retirement Plan
Source: GAM., Thomson Reuters, MSCI. *From Nov 29, 2013 to Sep 30, 2016. Please see "Disclaimer" at the end of this material for important disclosures regarding the information contained herein.
Relative statistics (since inception)* Fund vs Russell 3000 Index in USD
Fund vs MSCI AC World Index in USD
Beta 0.06 0.04
Correlation 0.15 0.10
Return statistics (since Inception)*
Water and Power Employees’ Retirement
Plan
Russell 3000 Index in USD
MSCI AC World Index in USD
Cumulative return (%) 6.54 25.58 12.00
Return YTD (%) -1.57 8.18 7.09
Max drawdown (%) -2.82 -8.80 -13.07
Past performance is not indicative of future performance. Performance is provided net of fees. Indices cannot be purchased directly.
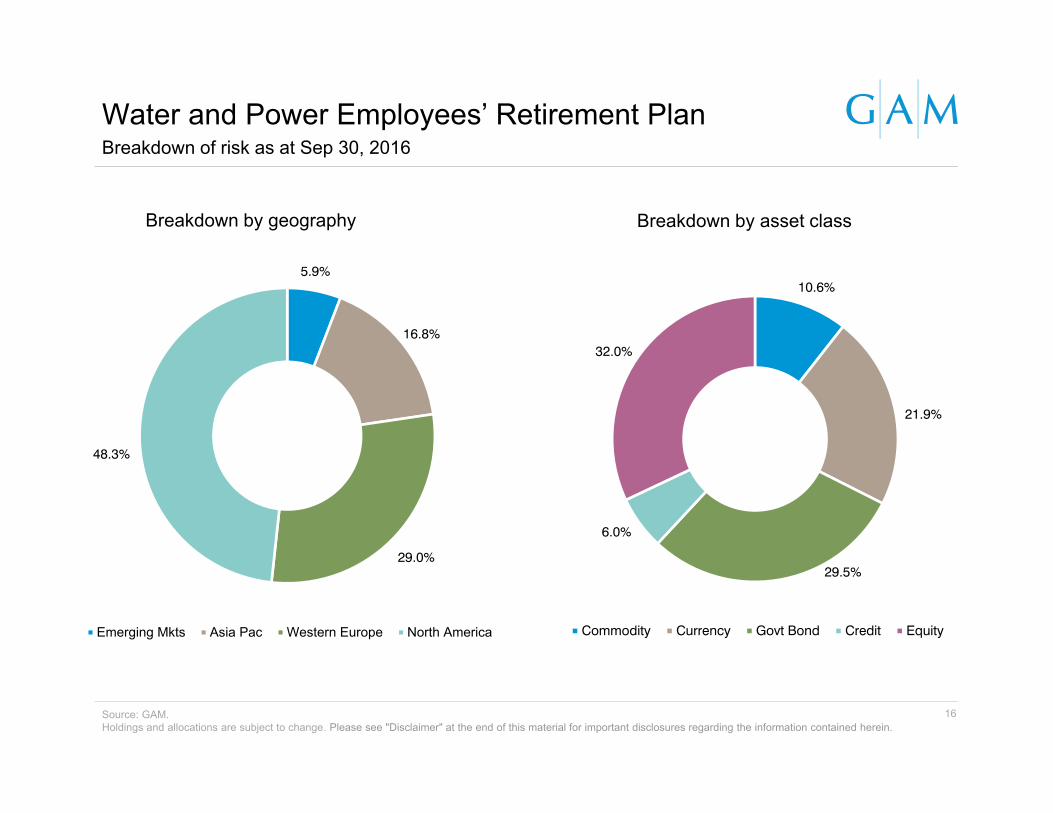
Breakdown of risk as at Sep 30, 2016Water and Power Employees’ Retirement Plan
Source: GAM.Holdings and allocations are subject to change. Please see "Disclaimer" at the end of this material for important disclosures regarding the information contained herein.
Breakdown by geography Breakdown by asset class
5.9%
16.8%
29.0%
48.3%
Emerging Mkts Asia Pac Western Europe North America
10.6%
21.9%
29.5%
6.0%
32.0%
Commodity Currency Govt Bond Credit Equity
16

17
24 months ended Sep 30, 2016Portfolio Cluster Map*
Source: GAM. For illustrative purposes only. *The cluster map is calculated using GAM proprietary cluster mapping system along with actual historic index information. The distances between any two points on the map is proportional to the correlation between the indices represented by those points. Circles indicate correlation to the indices shown. Analysis using 24 months data to Sep 30, 2016. Past performance is not indicative of future performance. Please see “Disclaimer” at the end of this material for important disclosures regarding the information contained herein.
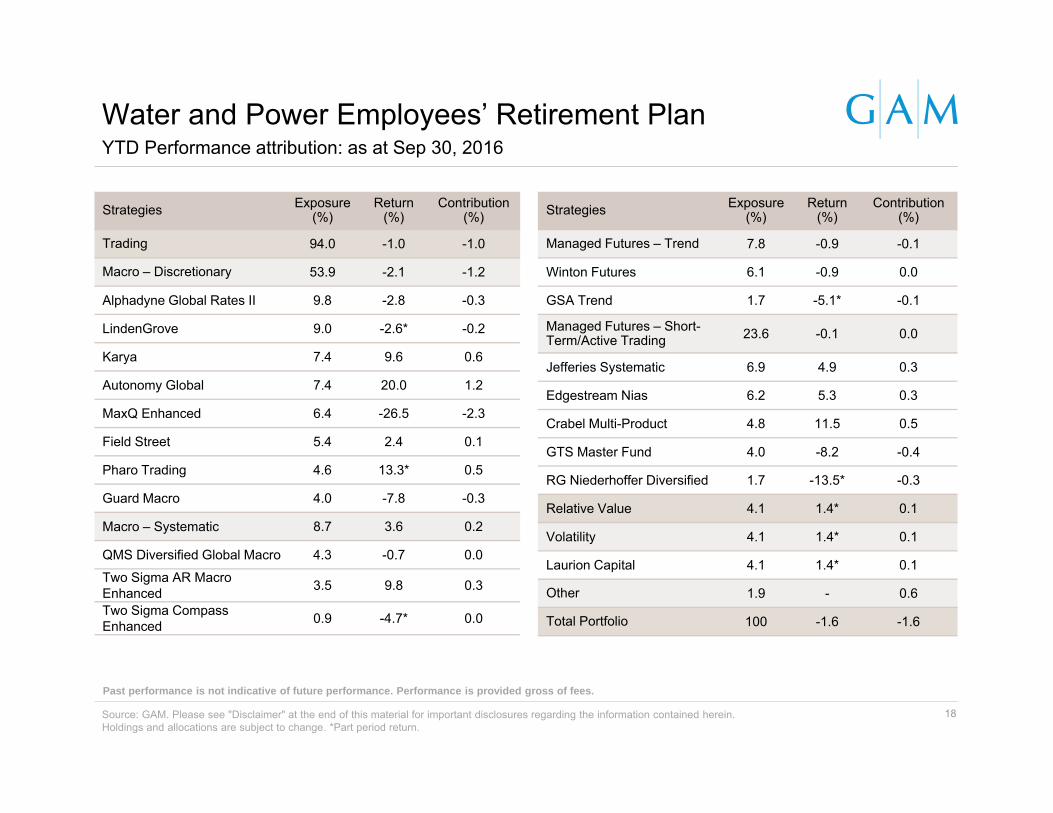
Strategies Exposure (%)
Return (%)
Contribution (%)
Trading 94.0 -1.0 -1.0
Macro – Discretionary 53.9 -2.1 -1.2
Alphadyne Global Rates II 9.8 -2.8 -0.3
LindenGrove 9.0 -2.6* -0.2
Karya 7.4 9.6 0.6
Autonomy Global 7.4 20.0 1.2
MaxQ Enhanced 6.4 -26.5 -2.3
Field Street 5.4 2.4 0.1
Pharo Trading 4.6 13.3* 0.5
Guard Macro 4.0 -7.8 -0.3
Macro – Systematic 8.7 3.6 0.2
QMS Diversified Global Macro 4.3 -0.7 0.0
Two Sigma AR Macro Enhanced 3.5 9.8 0.3
Two Sigma Compass Enhanced 0.9 -4.7* 0.0
Strategies Exposure (%)
Return (%)
Contribution (%)
Managed Futures – Trend 7.8 -0.9 -0.1
Winton Futures 6.1 -0.9 0.0
GSA Trend 1.7 -5.1* -0.1
Managed Futures – Short-Term/Active Trading 23.6 -0.1 0.0
Jefferies Systematic 6.9 4.9 0.3
Edgestream Nias 6.2 5.3 0.3
Crabel Multi-Product 4.8 11.5 0.5
GTS Master Fund 4.0 -8.2 -0.4
RG Niederhoffer Diversified 1.7 -13.5* -0.3
Relative Value 4.1 1.4* 0.1
Volatility 4.1 1.4* 0.1
Laurion Capital 4.1 1.4* 0.1
Other 1.9 - 0.6
Total Portfolio 100 -1.6 -1.6
18
YTD Performance attribution: as at Sep 30, 2016Water and Power Employees’ Retirement Plan
Source: GAM. Please see "Disclaimer" at the end of this material for important disclosures regarding the information contained herein.Holdings and allocations are subject to change. *Part period return.
Past performance is not indicative of future performance. Performance is provided gross of fees.

19
Q3 2016 top underlying fund gross contributorsWater and Power Employees’ Retirement Plan
Source: GAMPast performance is not indicative of future performance. Allocations and holdings are subject to change.Please see "Disclaimer" at the end of this material for important disclosures regarding the information contained herein.
Top contributors Contribution (%) Comment
Alphadyne Global Rates II 0.5Alphadyne had a strong Q3, almost entirely driven by rates trading. The main exposures included cash-futures basis trading, a short duration bias in the US, and a curve steepening bias in Japan.
Karya 0.4Karya continued to perform well in the third quarter, largely maintaining a similar Portfolio construction. ABS trading continued to generated consistent returns, and duration trading in the US and Europe also contributed to performance.
Autonomy Global 0.4FX losses in July resulted in flat overall performance for the month, however long positions in Latin American credit (particularly Venezuela and Brazil) and the rouble generated strong returns for the remainder of the quarter.

20
Q3 2016 bottom underlying fund gross contributorsWater and Power Employees’ Retirement Plan
Bottom contributors Contribution (%) Comment
MaxQ Enhanced -0.7 MaxQ had a challenging Q3, underperforming on short GBP and short FTSE 250 positions, which continued to drag on performance post-Brexit. Short NZD exposures also detracted.
Crabel Multi-Product -0.3
The Crabel Multi-Product was down in Q3 as short term momentum and trend following models suffered when major financial markets saw tight ranges with generally low volatility in the latter part of the quarter. Mean reversion strategies continued to contribute to performance as has been the case during each month of 2016 but not enough to offset the losses from elsewhere. Currencies and fixed income were the worst performing sectors on the quarter followed by commodities. Equity indices made a small positive contribution.
RG NiederhofferDiversified -0.3
RG Niederhoffer Diversified was down in Q3 as the fund saw losses in all asset classes led by equity indices and fixed income. Momentum models fared the worst as very low volatility and range-bound markets combined to make very poor conditions for these approaches. Record low volatility in many markets did not lead to the trends which the momentum systems were expecting. August saw day after day of small intra-day reversals which the models predicted would break out in the low volatility environment but did not. The contrarian models suffered as there were no reversals large enough for them to latch on to. The models reacted to August's poor performance by cutting risk by about one half.
Source: GAMPast performance is not indicative of future performance. Allocations and holdings are subject to change.Please see "Disclaimer" at the end of this material for important disclosures regarding the information contained herein.

HOLDINGS

22
Portfolio adjustments: Sep 30, 2015 vs. Sep 30, 2016Water and Power Employees’ Retirement Plan
Source: GAM. Allocations and holdings are subject to change. Totals may not sum due to rounding.
As at Sep 30, 2016 Strategy Weight (%)
Alphadyne Global Rates II Macro - Discretionary 9.8
LindenGrove Macro - Discretionary 9.0
Karya Macro - Discretionary 7.4
Autonomy Global Macro - Discretionary 7.4
Jefferies Systematic Managed Futures - Short-Term/Active Trading 6.9
MaxQ Enhanced Macro - Discretionary 6.4
Edgestream Nias Managed Futures - Short-Term/Active Trading 6.2
Winton Futures Managed Futures - Trend 6.1
Field Street Macro - Discretionary 5.4
Crabel Multi-Product Managed Futures - Short-Term/Active Trading 4.8
% held in top 10 69.3
% held in holdings 11-19 28.8
Total no of holdings 19
Average size of a top 10 position 6.9
Average size of a top 19 position 5.2
As at Sep 30, 2015 Strategy Weight (%)
Alphadyne Global Rates II Macro - Discretionary 9.9
Laurion Global Markets Managed Futures - Short-Term/Active Trading 8.6
Winton Futures Managed Futures - Trend 8.2
MaxQ Enhanced Macro - Discretionary 8.1
Tudor DM Macro - Discretionary 7.9
Karya Macro - Discretionary 6.8
Autonomy Global Macro - Discretionary 5.9
LindenGrove Macro - Discretionary 5.7
Edgestream Nias Managed Futures - Short-Term/Active Trading 5.6
Field Street Macro - Discretionary 5.2
% held in top 10 71.8
% held in holdings 11-16 24.6
Total no of holdings 16
Average size of a top 10 position 7.2
Average size of a top 16 position 6.0
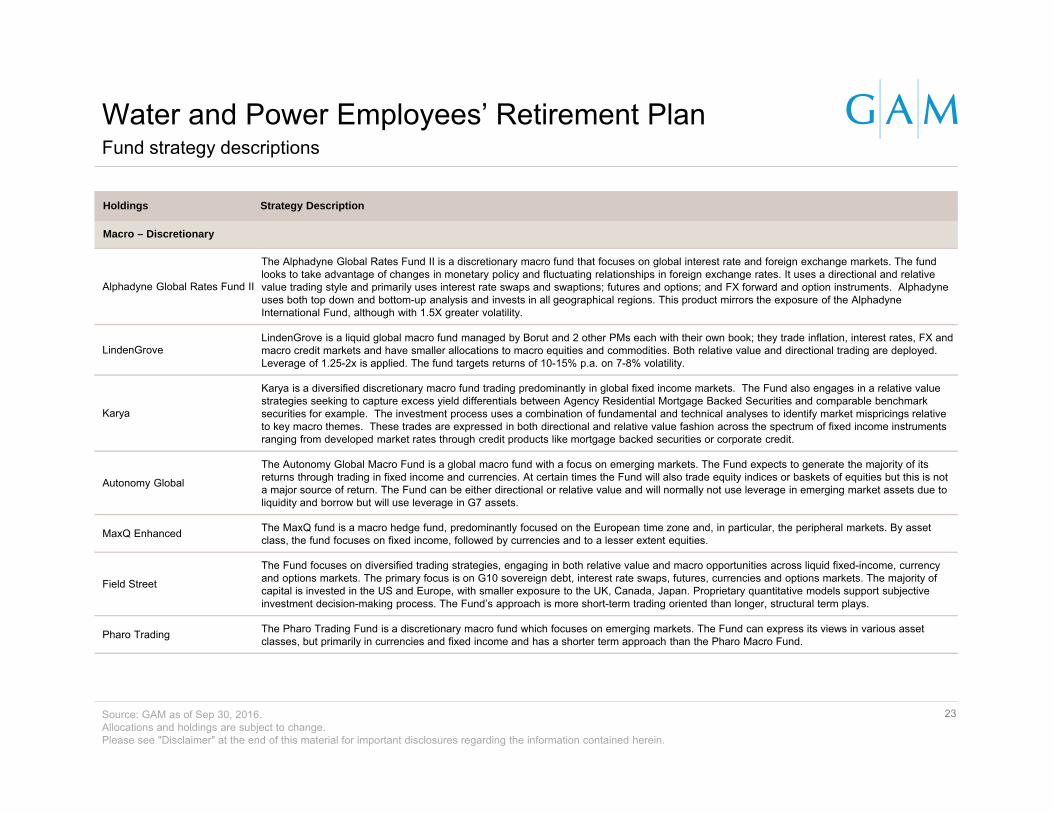
Fund strategy descriptions
23
Holdings Strategy Description
Macro – Discretionary
Alphadyne Global Rates Fund II
The Alphadyne Global Rates Fund II is a discretionary macro fund that focuses on global interest rate and foreign exchange markets. The fund looks to take advantage of changes in monetary policy and fluctuating relationships in foreign exchange rates. It uses a directional and relative value trading style and primarily uses interest rate swaps and swaptions; futures and options; and FX forward and option instruments. Alphadyne uses both top down and bottom-up analysis and invests in all geographical regions. This product mirrors the exposure of the Alphadyne International Fund, although with 1.5X greater volatility.
LindenGroveLindenGrove is a liquid global macro fund managed by Borut and 2 other PMs each with their own book; they trade inflation, interest rates, FX and macro credit markets and have smaller allocations to macro equities and commodities. Both relative value and directional trading are deployed. Leverage of 1.25-2x is applied. The fund targets returns of 10-15% p.a. on 7-8% volatility.
Karya
Karya is a diversified discretionary macro fund trading predominantly in global fixed income markets. The Fund also engages in a relative value strategies seeking to capture excess yield differentials between Agency Residential Mortgage Backed Securities and comparable benchmark securities for example. The investment process uses a combination of fundamental and technical analyses to identify market mispricings relative to key macro themes. These trades are expressed in both directional and relative value fashion across the spectrum of fixed income instruments ranging from developed market rates through credit products like mortgage backed securities or corporate credit.
Autonomy Global
The Autonomy Global Macro Fund is a global macro fund with a focus on emerging markets. The Fund expects to generate the majority of its returns through trading in fixed income and currencies. At certain times the Fund will also trade equity indices or baskets of equities but this is not a major source of return. The Fund can be either directional or relative value and will normally not use leverage in emerging market assets due to liquidity and borrow but will use leverage in G7 assets.
MaxQ Enhanced The MaxQ fund is a macro hedge fund, predominantly focused on the European time zone and, in particular, the peripheral markets. By asset class, the fund focuses on fixed income, followed by currencies and to a lesser extent equities.
Field Street
The Fund focuses on diversified trading strategies, engaging in both relative value and macro opportunities across liquid fixed-income, currency and options markets. The primary focus is on G10 sovereign debt, interest rate swaps, futures, currencies and options markets. The majority of capital is invested in the US and Europe, with smaller exposure to the UK, Canada, Japan. Proprietary quantitative models support subjective investment decision-making process. The Fund’s approach is more short-term trading oriented than longer, structural term plays.
Pharo Trading The Pharo Trading Fund is a discretionary macro fund which focuses on emerging markets. The Fund can express its views in various assetclasses, but primarily in currencies and fixed income and has a shorter term approach than the Pharo Macro Fund.
Water and Power Employees’ Retirement Plan
Source: GAM as of Sep 30, 2016.Allocations and holdings are subject to change.Please see "Disclaimer" at the end of this material for important disclosures regarding the information contained herein.

Fund strategy descriptions
24
Holdings Strategy Description
Macro – Discretionary
Guard Macro
This is a fundamental global macro fund with a focus on Asia. The approach tends to be more directional in nature, and performance attribution tends to be driven by 2-4 medium-term themes per year. Themes are based on macroeconomic fundamentals, although tactical trades are regularly implemented with shorter holding periods. The fund expresses themes primarily in FX and rates instruments using predominantly futures, forwards, swaps, or options. The Fund tends to be more active in FX than it is in rates, although this is wholly dependent on the opportunity set at a given point in time.
Macro - Systematic
QMS Diversified Global Macro
The QMS Diversified Global Macro strategy is a systematic macro program which trades about 70 equity index, sovereign rate/bond, commodity and currency markets. It trades models applying lower-frequency fundamental economic views and higher frequency models driven by market-based signals. The long-term risk allocation is about half to each of macro and technical approaches and a similar split between directional and RV models although both allocations are tactically adjusted based on the opportunity set. The longer-term fundamental models hold positions from one month to one quarter and shorter-term models hold a few days to one month resulting in an overall average holding period of one month.
Two Sigma AR Macro Enhanced
Two Sigma Absolute Return Macro Enhanced Fund is a systematic program which employs numerous technical and fundamental inputs to invest in over 230 markets in all four asset classes. Its models are taken from those used in the Two Sigma Compass program. It primarily trades in futures, FX and G-10 interest rate swaps but also includes smaller allocations to credit indices, equity index ETFs and options on futures and currencies. It has an average holding period of three to four weeks. Technical systems including trend following and mean reversion make up about 60% of the fund's risk. Fundamental systems make up the balance of the risk and focus on inputs which are updated more frequently than traditional quarterly economic data releases. Macro PICS is the firm's macro alpha capture system and has a less than 5% weight. The majority of the models are directional and the Portfolio is optimized on a daily basis. The Absolute Return Macro Enhanced Fund runs at 1.5x the base program's targeted net volatility of around 10% annualized.
Two Sigma Compass Enhanced
Two Sigma Compass is a systematic program which employs numerous technical and fundamental inputs to invest in over 230 markets in all four asset classes. It primarily trades in futures, FX and G-10 interest rate swaps but also includes smaller allocations to credit indices, equity index ETFs and options on futures and currencies. It has an average holding period of one to two weeks within a range of intra-day to several months. Technical systems including trend following and mean reversion make up about 60% of the fund's risk. Fundamental systems make up the balance of the risk and focus on inputs which are updated more frequently than traditional quarterly economic data releases. Macro PICS is the firm's macro alpha capture system and has a less than 5% weight. The majority of the models are directional and the Portfolio is optimized continuously. The Compass Enhanced product runs at twice the base program's targeted net volatility of around 11% annualized.
Water and Power Employees’ Retirement Plan
Source: GAM as of Sep 30, 2016.Allocations and holdings are subject to change.Please see "Disclaimer" at the end of this material for important disclosures regarding the information contained herein.

Fund strategy descriptions
25
Holdings Strategy Description
Managed Futures - Trend
Winton Futures
The Winton Diversified Program systematically trades over 120 futures and FX markets across all four asset classes by employing primarily a trend following approach. The program's average holding period is about four months and it takes advantage of the firm's ability to predict returns and volatility based on explanatory variables which are optimized for each market via statistical analysis. The majority of the directional approaches use technical inputs while non-directional approaches such as relative value and carry primarily use fundamental inputs. There is also a meaningful risk weight to single stock systems which are hedged to be beta neutral. This allocation uses approaches such as value, momentum and others such as seasonality. Deutsche Bank have wrapped the Winton Diversified Program to create a UCITS compliant fund which is run at the same leverage as Winton's base program. The Cavendish Systematic fund is a GAM-specific vehicle which trades the Winton Diversified Program at 2x.
GSA TrendThe GSA Trend Fund is a systematic managed futures program offering alternative beta access to medium term trend following. Six types of equally-weighted trend signals are employed which combine for an average holding period of about 120 business days (5 1/2 months). More than 85 futures contracts are traded in all four asset classes along with 20 FX forwards. Commodities have the largest risk allocation.
Managed Futures – Short-Term/Active Trading
Jefferies Systematic
The Jefferies Structured Alpha Fund consists of quantitative strategies applied to the largest 3,000 US and global equities and 55 global futures markets across all four asset classes. Single stocks have about two thirds of the fund's risk. The fund utilizes primarily technical data to trade a variety of strategies with an average holding period of about 4 days within a range of hours to weeks. Approaches include momentum, counter-trend/mean reversion/stat arb, fundamental (in equities only) and events/special situations. Strategies traded in the futures book have one third of the fund's risk and include mean reversion, momentum and event driven. Non-price based approaches have about a 20% risk weight.
Edgestream Nias
The Edgestream Nias Fund uses a single core model with an average holding period of one to two days to systematically trade more than 65 futures markets and currency crosses. The trading decisions are based on technical factors which identify price patterns rather than fundamental data. Instruments traded include stock index futures, currency futures, fixed income futures and commodity futures (agriculturals, metals and energy). Because the core model is adaptive, the impact of actual price series analysis makes the model traded for each instrument different. A risk allocation of 13% trades large cap US, UK, Australia and Japanese individual equities using a similar approach.
Crabel Multi-Product
The Crabel Multi-Product is a multi-strategy approach that mixes all of the major systematic investment programs at Crabel, the vast majority of which are short-term futures programs evenly split between mean reversion and short-term momentum. The average holding period of the preponderance of trades is under 2 days. The fund allocates to Crabel Diversified Futures, Buethe Crabel Futures, WPD Crabel Futures, Advanced Trend, Crabel Gemini and Hansen Crabel. Trading is systematic, although the allocation of weights among the programs is discretionary. More than 200 markets are traded in all four asset classes as well as a small allocation to individual equities. A key differentiator of Crabel's approach is that about 85% of position exits are via time based stops. The Crabel Fund SPC, Ltd-Segregated Portfolio A runs at 9% annualized volatility and the Crabel Fund SPC and Ltd-Segregated Portfolio AA at 14%.
Water and Power Employees’ Retirement Plan
Source: GAM as of Sep 30, 2016.Allocations and holdings are subject to change.Please see "Disclaimer" at the end of this material for important disclosures regarding the information contained herein.

Fund strategy descriptions
26
Holdings Strategy Description
Managed Futures – Short-Term/Active Trading
GTS Master Fund
The GTS Master Fund employs a liquid, developed markets discretionary global macro strategy with a focus on currencies and interest rates. Equity exposure is via major listed index futures only and commodities exposure is only via major listed futures contracts. The strategy uses medium term thematics as a framework within which to execute shorter term trading and the approach is a combination of fundamental and technical trading. GTS has a target volatility of 8-10%.
RG Niederhoffer Diversified
The R. G. Niederhoffer Diversified program employs a short-term systematic approach to trade a Portfolio of about 60 futures and OTC FX markets across all four asset classes as well as large cap US individual equities. The fund uses a mix of about 60 models across 9 groups with about 55% of the risk in contrarian and 45% of the risk in momentum approaches. The average holding period is about one and a half days and the holding periods of the fund's various systems can range from minutes to about 10 days. One system also trades options on futures seeking to capture the option premia when volatility in the markets is low.
Volatility
Laurion Capital
The Laurion Capital fund is a market neutral relative value fund that seeks to quantitatively analyze common sense structural and behavioural inefficiencies in the markets and then employ both model-based and discretionary trading strategies to profit. Approximately 70% of the capital is allocated to discretionary volatility arbitrage trading which is based on a combination of quantitative screens to identify opportunities and recommendations from the Portfolio management and trading group. The balance of the capital is allocated to systematic strategies, the vast majority of which trades single stocks with a minority in machine learning futures trading approaches. Assets traded include global currencies, fixed income, commodities and equities and their derivatives. Geographical allocation is across North America, Western Europe, Asia Pacific and Emerging Markets. Capital is allocated based on expected risk/return of each strategy and its contribution to the Portfolio as a whole. The fund's strategy does not rely on favourable conditions in any particular market or on general appreciation of assets. The Portfolio is constrained by a wide variety of limits that cover stock, option, factor and scenario effects. Historically, the fund has had no correlation to traditional equity markets.
Water and Power Employees’ Retirement Plan
Source: GAM as of Sep 30, 2016.Allocations and holdings are subject to change.Please see "Disclaimer" at the end of this material for important disclosures regarding the information contained herein.

OUTLOOK

28
Central bank policy divergence has finally arrived, impacts will be both positive and negative
Market volatility is likely to increase relative to that experienced in past few years, which should be positive
Liquidation risk will continue to be an issue for markets, making it more difficult for larger firms
Key to adding value will remain via expression, specialization, and time horizon
Less directional approaches should continue to offer consistent opportunities
Directional approaches will require ability to withstand significant reversals or be very tactical
Emerging markets continue to be attractively priced but recent rally requires greater selectivity
Commodity outlook has improved due to fewer market participants and improved balances
Opportunities in fixed income and currency markets will arise but non-directional expressions will be important
Trading outlook
Views expressed are those of the manager at the time and are subject to change.

INVESTMENT PROCESS

Periodic Table of Hedge Fund*
30
Strategy Returns as of Dec 31, 2015
Source: *Prepared by GAM based upon performance (net of fees) data from the applicable Dow Jones Credit Suisse hedge fund indices. GAM has not independently verified the information from other sources and no assurance can be given as to whether such information is accurate, true or complete and GAM makes no warranty, expressed or implied, regarding such information. Every effort has been made to ensure the accuracy of the information provided, but GAM cannot be held responsible for any errors or omissions. Past performance is not indicative of future returns.
0%
2005 2006 2007 2008 2009 2010 2011 2012 2013 2014 2015
Emg Mkts20.2%
Emg Mkts20.5%
Global Macro17.4%
Emg Mkts17.4%
Distr Secs15.6%
L/S Equity13.7%
Conv Arb47.3%
Global Macro13.5%
Distr Secs11.8%
L/S Equity17.7%
Short Bias17.0%
Multi Strat14.5%
Multi Strat10.1%
Emg Mkts30.0%
Fxd Inc Arb12.5%
Multi Strat11.2%
Distr Secs16.0%
Multi Strat3.8%
Distr Secs11.7%
L/S Equity14.4%
Eq Mkt Neutral9.3%
Fxd Inc Arb27.4%
Mgd Futures12.2%
Global Macro6.4%
Fxd Inc Arb11.0%
Multi Strat11.2%
Mgd Futures18.4%
L/S Equity3.6%
L/S Equity9.7%
Conv Arb14.3%
Risk Arb8.8%
Multi Strat24.6%
Emg Mkts11.3%
Fxd Inc Arb4.7%
Emg Mkts10.3%
Eq Mkt Neutral9.3%
Multi Strat6.1%
Short Bias2.4%
Global Macro9.2%
Global Macro13.5%
Distr Secs8.4%
Distr Secs21.0%
Conv Arb11.0%
Eq Mkt Neutral4.5%
L/S Equity8.2%
Emg Mkts8.8%
L/S Equity5.5%
Eq Mkt Neutral1.7%
Multi Strat7.5%
Eq Mkt Neutral11.2%
Short Bias6.0%
L/S Equity19.5%
Distr Secs10.3%
Short Bias3.9%
Conv Arb7.8%
Conv Arb6.0%
Fxd Inc Arb4.4%
Conv Arb0.8%
Eq Mkt Neutral6.1%
Fxd Inc Arb8.7%
Mgd Futures6.0%
Risk Arb12.0%
Multi Strat9.3%
Multi Strat1.8%
Global Macro4.6%
Risk Arb4.9%
Global Macro3.1%
Fxd Inc Arb0.6%
Risk Arb3.1%
Risk Arb8.1%
Conv Arb5.2%
Mgd Futures18.3%
Global Macro11.5%
L/S Equity9.3%
Conv Arb1.1%
Risk Arb2.8%
Global Macro4.3%
Distr Secs2.6%
Risk Arb0.4%
Fxd Inc Arb0.6%
Mgd Futures8.1%
Fxd Inc Arb3.8%
Short Bias14.9%
Eq Mkt Neutral4.1%
Risk Arb3.2%
Risk Arb0.8%
Eq Mkt Neutral0.9%
Fxd Inc Arb3.8%
Emg Mkts1.5%
Global Macro0.2%
Mgd Futures-0.1%
Short Bias-6.6%
Risk Arb-3.3%
Mgd Futures-6.6%
Eq Mkt Neutral-0.8%
Mgd Futures-4.2%
Mgd Futures-2.9%
Mgd Futures-2.6%
Eq Mkt Neutral-1.2%
Emg Mkts-0.2%
Conv Arb-2.5%
Global Macro-4.6%
Short Bias-25.0%
Short Bias-22.5%
Distr Secs-4.2%
Short Bias-20.4%
Short Bias-24.9%
Risk Arb-1.3%
Mgd Futures-0.9%
L/S Equity-19.7%
Emg Mkts-6.7%
Conv. Arb-1.7%
Distr Secs-5.3%
Distr Secs-20.5%
L/S Equity-7.3%
Short Bias-5.6%
Multi Strat-23.6%
Fxd Inc Arb-28.8%
Emg Mkts-30.4%
Conv Arb-31.6%
Eq Mkt Neutral-40.3%
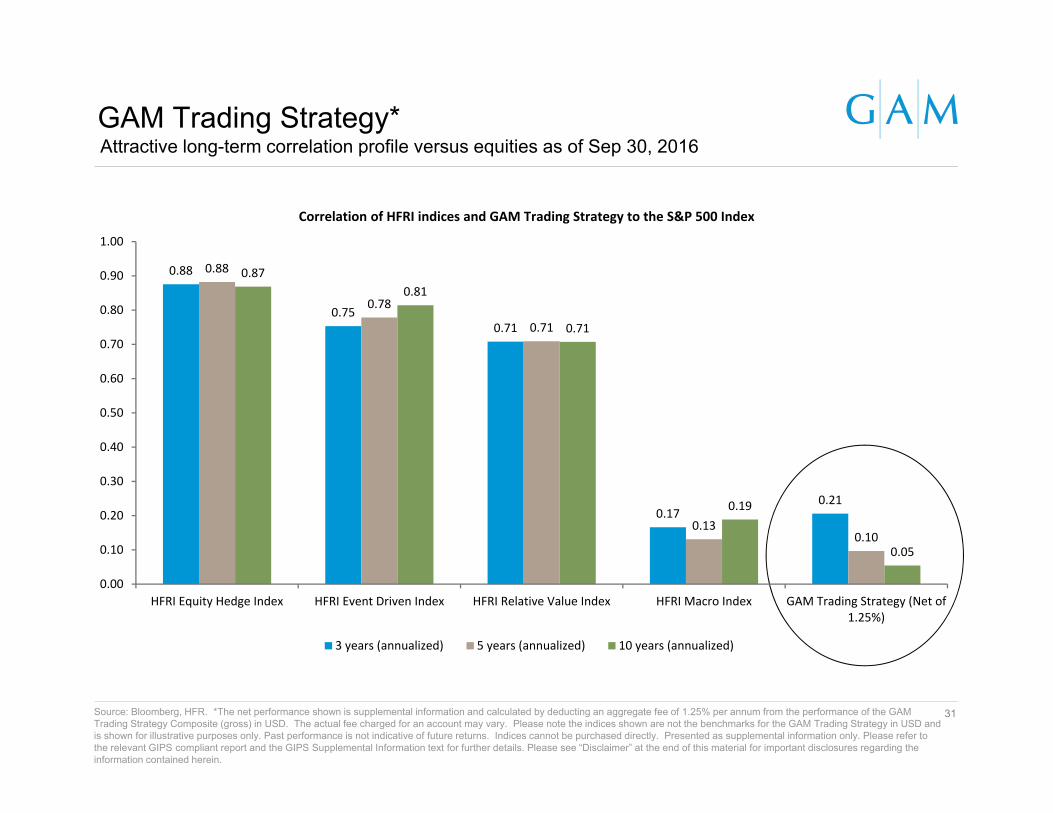
GAM Trading Strategy*
31
Attractive long-term correlation profile versus equities as of Sep 30, 2016
Source: Bloomberg, HFR. *The net performance shown is supplemental information and calculated by deducting an aggregate fee of 1.25% per annum from the performance of the GAM Trading Strategy Composite (gross) in USD. The actual fee charged for an account may vary. Please note the indices shown are not the benchmarks for the GAM Trading Strategy in USD and is shown for illustrative purposes only. Past performance is not indicative of future returns. Indices cannot be purchased directly. Presented as supplemental information only. Please refer to the relevant GIPS compliant report and the GIPS Supplemental Information text for further details. Please see “Disclaimer” at the end of this material for important disclosures regarding the information contained herein.
0.88
0.750.71
0.170.21
0.88
0.78
0.71
0.130.10
0.870.81
0.71
0.19
0.05
0.00
0.10
0.20
0.30
0.40
0.50
0.60
0.70
0.80
0.90
1.00
HFRI Equity Hedge Index HFRI Event Driven Index HFRI Relative Value Index HFRI Macro Index GAM Trading Strategy (Net of1.25%)
Correlation of HFRI indices and GAM Trading Strategy to the S&P 500 Index
3 years (annualized) 5 years (annualized) 10 years (annualized)

-15 %
-10 %
-5 %
0 %
Jul 98 Aug 98
Russian Debt Crisis - 30 Jun 1998 to 31 Aug 1998
-15.4 %
3.1 %
-40 %
-20 %
0 %
20 %
40 %
Dec 00 Dec 01 Sep 02
Tech Bubble - 31 Mar 2000 to 30 Sep 2002
-43.8 %
41.1 %
-50 %-40 %-30 %-20 %-10 %
0 %10 %20 %
Dec 07 Dec 08
Credit Crisis - 31 Aug 2007 to 28 Feb 2009
-48.3 %
16.1 %
-1 %
0 %
1 %
2 %
3 %
4 %
Jul 14 Aug 14 Sep 14
30 Jun 2014 to 30 Sep 2014
1.1 %
4.3 %
GAM Trading Strategy (Net of 1.25%) S&P 500 in USD
GAM Trading Strategy*Performance during down equity markets
*The net performance shown is supplemental information and calculated by deducting an aggregate fee of 1.25% per annum from the performance of the GAM Trading Strategy Composite (gross) in USD. The actual fee charged for an account may vary. Indices cannot be purchased directly. Please refer to the relevant GIPS compliant report and the GIPS supplemental text for further details. Please see "Disclaimer" at the end of this material for important disclosures regarding the information contained herein.
Past performance is not indicative of future performance.
Source: GAM, Thomson Reuters. 32

Performance is driven by consistent application of our process
33
Investment Process – Overview
Source: GAM
Asset allocation
Operational due diligence
Risk management
Investment research
Operations & back office
Portfolio management

Identification of talent
34
Investment research
Source: GAM* As at 30 June 2016.
● Dedicated research team conducts ongoing search for new managers– Maps approximately 6,000* hedge funds on proprietary databases
● Quantitative screening of:– Returns and risk, both absolute and relative to hedge fund indices– Fee levels, liquidity and asset size
● Qualitative view and action agreed– Reviewed ~300 hedge funds in 2015
● Quantitative and qualitative analysis linked to prioritise research
● Emphasis on finding talent: willingness to invest in new managers / strategies
InvestmentResearch
Universe mapping
Quantitative and qualitative analysis
Prioritisation –focus on talent
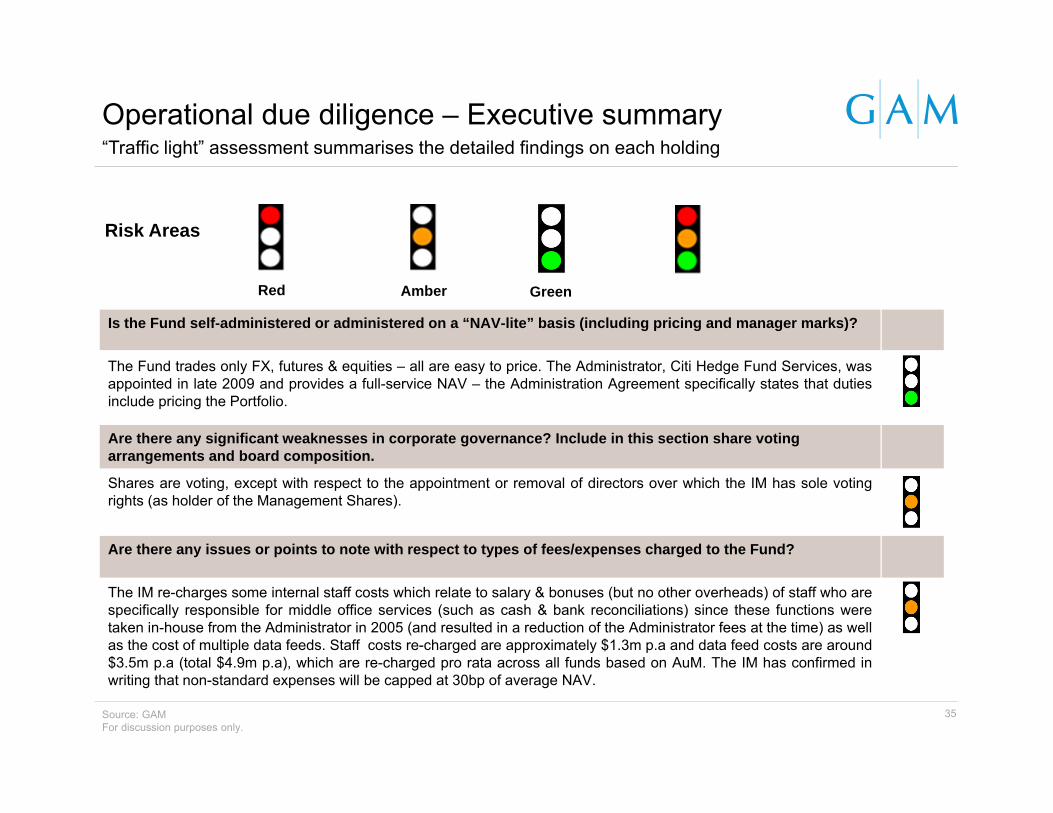
“Traffic light” assessment summarises the detailed findings on each holding
35
Operational due diligence – Executive summary
Source: GAMFor discussion purposes only.
Red Amber Green
Risk Areas
Is the Fund self-administered or administered on a “NAV-lite” basis (including pricing and manager marks)?
The Fund trades only FX, futures & equities – all are easy to price. The Administrator, Citi Hedge Fund Services, wasappointed in late 2009 and provides a full-service NAV – the Administration Agreement specifically states that dutiesinclude pricing the Portfolio.
Are there any significant weaknesses in corporate governance? Include in this section share voting arrangements and board composition.
Shares are voting, except with respect to the appointment or removal of directors over which the IM has sole votingrights (as holder of the Management Shares).
Are there any issues or points to note with respect to types of fees/expenses charged to the Fund?
The IM re-charges some internal staff costs which relate to salary & bonuses (but no other overheads) of staff who arespecifically responsible for middle office services (such as cash & bank reconciliations) since these functions weretaken in-house from the Administrator in 2005 (and resulted in a reduction of the Administrator fees at the time) as wellas the cost of multiple data feeds. Staff costs re-charged are approximately $1.3m p.a and data feed costs are around$3.5m p.a (total $4.9m p.a), which are re-charged pro rata across all funds based on AuM. The IM has confirmed inwriting that non-standard expenses will be capped at 30bp of average NAV.

Bottom-up views drive Portfolio construction
36
Manager sizing is determined by combination of:
Proprietary Portfolio modelling and liquidity tools support judgment
Investment Management Committee meets monthly to:
Revalidate each manager’s investment case
Consolidate bottom-up views
Discuss target strategy weights
Portfolio management – Overview
Source: GAM
Strong, bottom-up analysis of managers
Forward-looking return and risk metrics
Actual strategy weights influenced by IMC views and tactical allocation guidelines
+
+
Portfolio management
Manager sizing
Intra-Portfolio correlation analysis
Portfolio risk exposures
Investment and risk meetings

Proprietary tools utilised to monitor Portfolios at multiple levels
37
Risk management – Overview
Source: GAM
● AIS Quantitative Research Team oversees on-going risk analysis – Aggregate and analyse Portfolio level risks, including risk exposures and holdings– “Risk Dashboard” tool collates information – Structured quarterly risk review process
● Structured performance monitoring conducted by Investment Management Committee
– Monthly performance analysis– Contribution and attribution analysis
Riskmanagement
Manager and Portfolio monitoring
Transparency analysis
Scenario stress testing
Factor analysis

Collating key risk metrics into one report
38
● Invested managers provide detailed Portfolio data
● GAM’s risk systems check and analyse data
● Aggregate data into risk dashboard quarterly
● Triangulate with information from quant reports
Risk management – Quantitative risk aggregation
Source: GAM
Risk Dashboard
Risk Factor Analysis (RFA)
Full Transparency Stress Testing Valuation
MonitoringLiquidity
Monitoring
GAM’s Invested Managers
Confirmed exposure data Positional data Pricing data FAS157
accounting Liquidity profile
Tool
Inpu
t

APPENDIX

Key Contacts
GAM USA Inc.One Rockefeller Plaza, 21st FloorNew York, NY 10020
Relationship Management:
Kristin Hovencamp Dir : 212-407-4651Director, Institutional Email: [email protected] Fax: 917-267-7105
Peter Mostarac Dir : 212-407-4754Client Manager Email: [email protected] Fax: 917-267-7105
Portfolio Management:
Arvin Soh Dir : 212-407-4660Portfolio Manager Email: [email protected] Fax: 917-267-7105
Jim Ha Dir : 212-407-4622Portfolio Manager Email: [email protected] Fax: 917-267-7105
Water and Power Employees’ Retirement Plan
40
Members of the Investment Management Committee
41
GAM Alternative Investments Solutions
Larry Hatheway – Group Head of MAPS and Group Economist
Larry Hatheway is GAM's Group Head of Multi Asset Portfolio Solutions and Group ChiefEconomist. He oversees GAM's multi asset and alternative investment solutions teams. He is also amember of the GAM Group Management Board. Prior to joining GAM in September 2015 he wasmanaging director and chief economist at UBS Investment Bank. Larry Hatheway also served asUBS’s global head of macro strategy from 2008 to 2012 and global head of asset allocation from2000 to 2012. Earlier in his career he held roles at Citibank and Manufacturers Hanover Trust. LarryHatheway holds a PhD in Economics from the University of Texas, a MA from the Johns HopkinsUniversity, and a BA from Whitman College. He is based in London.
Anthony Lawler – Head of Portfolio Management
Anthony Lawler is Head of Portfolio Management for GAM Alternative Investments Solutions (AIS).He is a member of the AIS Investment Management Committee, which is responsible for managingall AIS client Portfolios. Prior to joining GAM in November 2011, Mr Lawler spent eight years withMan Group based in London and Chicago, latterly as head of Portfolio management, leading aglobal team covering all of Man Investments’ multi-manager mandates. Prior to this, he was head ofhedge fund research at Man Glenwood, the US alternative investment firm. Before that, Mr Lawlerwas an equity research analyst at Prudential Securities. Prior to this, he was a manager at venturecapital firm, Castling Group. He began his career as an M&A analyst at Merrill Lynch in SanFrancisco. Mr Lawler holds an MBA in Finance and Economics from the University of ChicagoBooth School of Business, and a BS (highest Honours) in Finance from the University of Illinois. Heis based in London.

Members of the Investment Management Committee
42
GAM Alternative Investments Solutions
Kier Boley – Portfolio Manager
Kier Boley is a Portfolio Manager and Investment Committee member of GAM’s AlternativeInvestments Solutions team. He is responsible for non-US equity investments. Prior to joining GAMin April 2000, Kier spent six years with City of London Investment Management, where, as a director,he was responsible for its London investment team dealing in non-US traded emerging market andAsian funds. Before that, Kier worked in Asia for two years. He holds a BA (Hons) in Economics fromPortsmouth University, an MSc in Economics from Southampton University and is a member of theCFA Society of the UK. He is based in London.
Amir Madden – Portfolio Manager
Amir Madden is a Portfolio Manager and Investment Committee Member of GAM’s AlternativeInvestments Solutions team, responsible for event driven and US equity investments. Prior to joiningGAM in August 2002, he spent two years at JP Morgan Private Bank in the multi-managerinvestment advisory group performing manager due diligence, having previously worked at JennisonAssociates. Amir holds an MBA in Banking and Finance from Hofstra University and a BBA inInternational Finance and Marketing from the University of Miami. He is based in New York.

Members of the Investment Management Committee
43
GAM Alternative Investments Solutions
Arvin Soh – Portfolio Manager
Arvin Soh is a Portfolio Manager and Investment Committee Member of GAM’s AlternativeInvestments Solutions team, responsible for trading investments. Prior to joining GAM in February2005, Arvin was a manager within the pension group at Pfizer, with primary responsibility for managerselection in international equity, global macro and currency funds. Before that, he was an assistantPortfolio manager with a quantitatively based fundamental hedge fund and a vice president withBankers Trust Asset Management focused on global markets. He holds a BA in Economics fromCornell University and an MBA from the Wharton School of the University of Pennsylvania. He isbased in New York.
Jim Ha – Portfolio Manager
Jim Ha is a Portfolio Manager in GAM's Alternative Investments Solutions (AIS) team, with a specificfocus on trading strategies. Prior to joining GAM in May 2007, he worked as a senior managercovering hedge funds and fixed income investments for the Avaya Inc. corporate pension plans. MrHa holds a BA in Economics from Northwestern University in Evanston, Illinois, an MBA in Financeand Management from New York University – Stern School of Business, and is a CFA charterholder.He is based in New York.

44
Investment Research AnalystsGAM Alternative Investments Solutions
Carl Hunermund - Senior Investment AnalystCarl Hunermund is a Senior Investment Analyst in GAM’s Alternative Investments Solutions (AIS) team, with a specific focus onsystematic trading strategies. Before joining GAM in May 2005, he was a vice president of investment banking with Bear, Stearns &Co in New York. Mr Hunermund holds an MBA from the University of Michigan, where his studies focused on finance and accounting,a BSc in Materials Science and Engineering from the Massachusetts Institute of Technology, and is a CFA charterholder. He is basedin New York.
Susanna King – Senior Investment AnalystSusanna King is a Senior Investment Analyst in GAM's Alternative Investments Solutions (AIS) team, with a specific focus on creditand relative value credit strategies. Ms King began her career at GAM in August 2008 as an Investment Support Assistant. Prior tothis, she was an intern - research assistant at State Street Bank & Trust. Ms King holds a BSc in Economics from the University ofSurrey and the Investment Management Certificate. She is based in London
Anthony Murphy – Senior Investment AnalystAnthony Murphy is a Senior Investment Analyst in GAM’s Alternative Investments Solutions (AIS) team, with a focus on fixed income,macro and relative value strategies. Prior to joining GAM in January 2012, he was an investment analyst at Mercer and before that, hewas a mergers and acquisitions analyst at Stamford Partners. Anthony Murphy holds a MA in Economics from Cambridge University,is a CFA charterholder and holds the Investment Management Certificate. He is based in London.
Ellie Clapton - Investment AnalystEllie Clapton is an Investment Analyst in GAM’s Alternative Investment Solutions (AIS) team, with a specific focus on European andUK equity strategies. Prior to joining GAM in June 2014, she worked as a Junior Analyst at Wellian Investment Solutions, focusing oninternational equity strategies. Ellie Clapton holds a BA (Hons) in Economics and Social Studies, specialising in DevelopmentEconomics; she holds the Diploma in Regulated Financial Planning, the IMC and is a 2016 Level II Candidate in the CFA Program.She is based in London.
Robert White - Investment AnalystRobert White is an Investment Analyst in GAM’s Alternative Investment Solutions (AIS) team, with a specific focus on Asia andEmerging Market strategies. Prior to joining GAM in December 2014, he worked in the investment team at GHC Capital Markets.Robert White holds a BA (Hons) in Politics and Philosophy from The University of York, is a CFA charterholder and an Associatemember of the CISI. He is based in London.

45
Investment Support AnalystsGAM Alternative Investments Solutions
Misha PatelInvestment Support Assistant
Sarah Jackson-Koufie Investment Support Assistant
Alexandra GormleyInvestment Support Analyst
Lauren Villano Investment Support Analyst
James Daly Investment Support Analyst

46
Gary Droscoski – Senior Director, Institutional SalesGary Droscoski is a Director of Business Development at GAM, where he heads up business development and client services inNorth America. Gary joined GAM following its acquisition of the fixed income and foreign exchange specialist, Augustus, in May2009. Gary joined Augustus in June 2007 from Atlantic Asset Management where he was vice president of businessdevelopment. Prior to this he held the same role at Conning Asset Management. Gary holds a BBA in Marketing from HofstraUniversity and an MBA in Finance from the University of Connecticut. He is based in New York.
Kristin Hovencamp – Director, Institutional SalesKristin Hovencamp is a Director of Institutional Sales in North America. Prior to joining GAM in 2005, Ms. Hovencamp was VicePresident of Sales at Information Management Network in New York. This followed two years as a senior marketing consultant atthe Institute for International Research. Prior to this, she was a regional sales manager at CertCo, Inc., a division of Bankers Trust.Ms. Hovencamp holds a BA in Communications from the University of Arizona. She is based in New York.
Christopher Todisco – Director, Institutional SalesChristopher Todisco is an Institutional Sales Director for North America at GAM. Prior to joining GAM in 2005, he held marketingsupport and client service positions at Royal Alliance Associates in New York and Sun Life Financial in Boston. Mr. Todisco holdsa BA in Sociology from the University of Connecticut. He is based in New York.
Andrew Higginson – Director, Institutional SalesAndrew Higginson is a Director – Institutional Sales for North America, responsible for business development and client services.Before joining the sales team, Mr. Higginson was the business manager in GAM’s institutional and fund distribution team. Prior to2006, he was an assistant manager in GAM's operational risk team responsible for GAM's Alternative Investments Solutionsstrategies and third party managers. Before joining GAM in April 2005, he was a risk manager at Perpetual, Australia. Mr. Higginsonis a Chartered Accountant and holds a BEc and a Masters in Accounting from Macquarie University, Sydney. He is based in NewYork.
GAM Marketing and Client Service Team
47
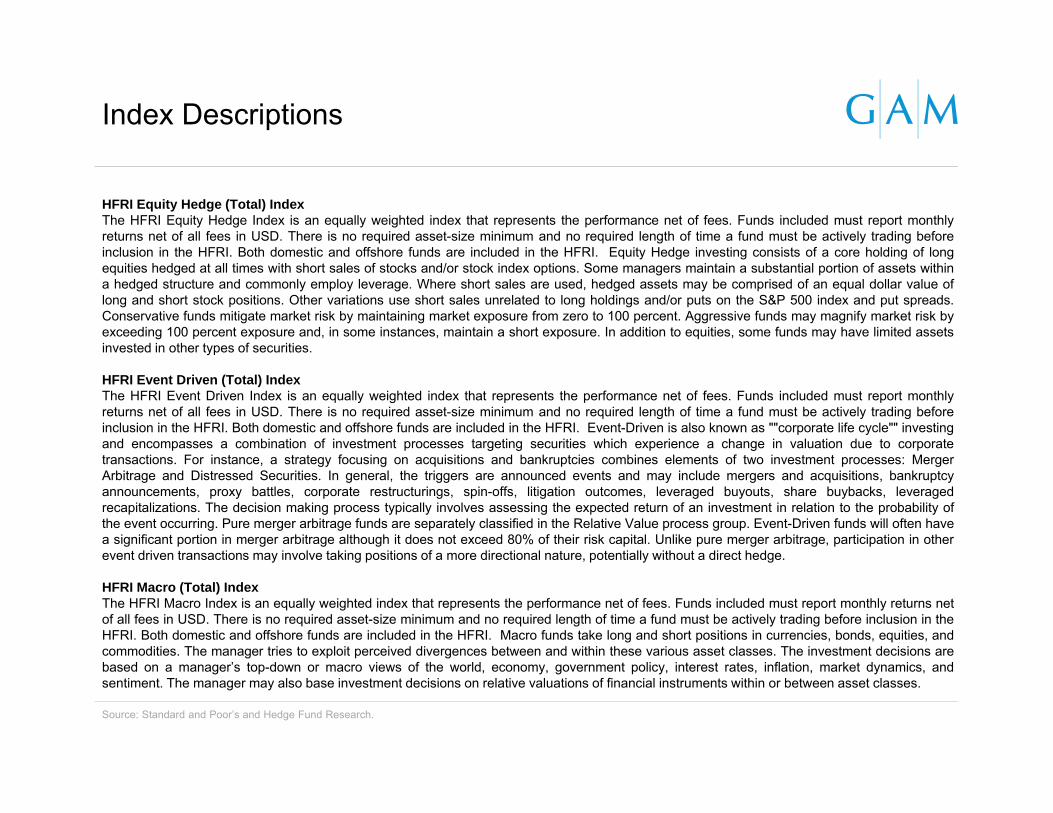
HFRI Equity Hedge (Total) IndexThe HFRI Equity Hedge Index is an equally weighted index that represents the performance net of fees. Funds included must report monthlyreturns net of all fees in USD. There is no required asset-size minimum and no required length of time a fund must be actively trading beforeinclusion in the HFRI. Both domestic and offshore funds are included in the HFRI. Equity Hedge investing consists of a core holding of longequities hedged at all times with short sales of stocks and/or stock index options. Some managers maintain a substantial portion of assets withina hedged structure and commonly employ leverage. Where short sales are used, hedged assets may be comprised of an equal dollar value oflong and short stock positions. Other variations use short sales unrelated to long holdings and/or puts on the S&P 500 index and put spreads.Conservative funds mitigate market risk by maintaining market exposure from zero to 100 percent. Aggressive funds may magnify market risk byexceeding 100 percent exposure and, in some instances, maintain a short exposure. In addition to equities, some funds may have limited assetsinvested in other types of securities.
HFRI Event Driven (Total) IndexThe HFRI Event Driven Index is an equally weighted index that represents the performance net of fees. Funds included must report monthlyreturns net of all fees in USD. There is no required asset-size minimum and no required length of time a fund must be actively trading beforeinclusion in the HFRI. Both domestic and offshore funds are included in the HFRI. Event-Driven is also known as ""corporate life cycle"" investingand encompasses a combination of investment processes targeting securities which experience a change in valuation due to corporatetransactions. For instance, a strategy focusing on acquisitions and bankruptcies combines elements of two investment processes: MergerArbitrage and Distressed Securities. In general, the triggers are announced events and may include mergers and acquisitions, bankruptcyannouncements, proxy battles, corporate restructurings, spin-offs, litigation outcomes, leveraged buyouts, share buybacks, leveragedrecapitalizations. The decision making process typically involves assessing the expected return of an investment in relation to the probability ofthe event occurring. Pure merger arbitrage funds are separately classified in the Relative Value process group. Event-Driven funds will often havea significant portion in merger arbitrage although it does not exceed 80% of their risk capital. Unlike pure merger arbitrage, participation in otherevent driven transactions may involve taking positions of a more directional nature, potentially without a direct hedge.
HFRI Macro (Total) IndexThe HFRI Macro Index is an equally weighted index that represents the performance net of fees. Funds included must report monthly returns netof all fees in USD. There is no required asset-size minimum and no required length of time a fund must be actively trading before inclusion in theHFRI. Both domestic and offshore funds are included in the HFRI. Macro funds take long and short positions in currencies, bonds, equities, andcommodities. The manager tries to exploit perceived divergences between and within these various asset classes. The investment decisions arebased on a manager’s top-down or macro views of the world, economy, government policy, interest rates, inflation, market dynamics, andsentiment. The manager may also base investment decisions on relative valuations of financial instruments within or between asset classes.
Index Descriptions
Source: Standard and Poor’s and Hedge Fund Research.

48
HFRI Relative Value (Total) IndexThe HFRI Relative Value Arbitrage Index is an equally weighted index that represents the performance net of fees. Funds included must reportmonthly returns net of all fees in USD. There is no required asset-size minimum and no required length of time a fund must be actively tradingbefore inclusion in the HFRI. Both domestic and offshore funds are included in the HFRI. Statistical Arbitrage is a model-based investmentprocess, which aims to build long and short Portfolios whose relative value is currently different from a theoretically or quantitatively predictedvalue. The investment process is systematized, but implementation may differ substantially in terms of the underlying models and the frequencyof trading. The models are central to Statistical Arbitrage and serve two purposes. First to identify securities (individually or in baskets) that aremispriced against an internal benchmark, and second to construct a Portfolio which is market neutral. All models assume that the time seriesinvolved (representing an individual security's price or fundamental data, or other market data, or a group of similar securities)contain informationrelevant to the future performance of the security that has not been discounted in the current market price. The methodologies used to identify thisinformation are quantitative and trading is generally automated. The Portfolio performance depends on future security prices converging to modelequilibrium prices. A hedge fund investment approach is considered to be Statistical Arbitrage if positions are entered into on the basis ofsystematic models designed to find opportunities where the relative value of two or more assets is currently different from a theoretically orquantitatively predicted value.
HFRI/HFRX Macro IndexMacro strategy managers which trade a broad range of strategies in which the investment process is predicated on movements in underlyingeconomic variables and the impact these have on equity, fixed income, hard currency and commodity markets. Managers employ a variety oftechniques, both discretionary and systematic analysis, combinations of top down and bottom up theses, quantitative and fundamentalapproaches and long and short term holding periods. Although some strategies employ RV techniques, Macro strategies are distinct from RVstrategies in that the primary investment thesis is predicated on predicted or future movements in the underlying instruments, rather thanrealization of a valuation discrepancy between securities. In a similar way, while both Macro and equity hedge managers may hold equitysecurities, the overriding investment thesis is predicated on the impact movements in underlying macroeconomic variables may have on securityprices, as opposes to EH, in which the fundamental characteristics on the company are the most significant and integral to investment thesis
S&P 500 IndexThe S&P 500 Index is a free-float adjusted market-capitalization-weighted index designed to measure the performance of 500 leading companiesin leading industries of the U.S. economy. The stocks included have a market capitalization in excess of USD 4 billion and cover over 75% of U.S.equities. A balance for the S&P 500 in line with the sector balance of the universe of eligible companies is maintained.
Index Descriptions
Source: Standard and Poor’s and Hedge Fund Research.

49
Barclays US Aggregate Bond IndexThe BarCap US Aggregate Bond Index is a market-capitalization weighted index that measures the performance of the US investment gradefixed-rate bond market. The index covers nonconvertible government and corporate bonds, agency mortgage pass-through securities, asset-backed issues and ERISA-qualified CMBS denominated in USD with a remaining maturity of at least one year and a rating of Baa3 or better byMoody's.
Russell 3000 IndexThe Russell 3000 Index consists of the 3000 largest publicly listed U.S. companies, representing about 98% of the total capitalization of theentire U.S. stock market.
MSCI AC World IndexThe MSCI AC World Index is a free float-adjusted market capitalization weighted index that is designed to measure the equity marketperformance of developed and emerging markets. The MSCI AC World Index consists of 46 country indexes comprising 23 developed and 23emerging market country indexes. The developed market country indexes included are: Australia, Austria, Belgium, Canada, Denmark, Finland,France, Germany, Hong Kong, Ireland, Israel, Italy, Japan, Netherlands, New Zealand, Norway, Portugal, Singapore, Spain, Sweden,Switzerland, the United Kingdom and the United States. The emerging market country indexes included are: Brazil, Chile, China, Colombia,Czech Republic, Egypt, Greece, Hungary, India, Indonesia, Korea, Malaysia, Mexico, Peru, Philippines, Poland, Qatar, Russia, South Africa,Taiwan, Thailand, Turkey* and United Arab Emirates.
Index Descriptions
Source: Standard and Poor’s and Hedge Fund Research.
GIPS Supplemental Information
All GAM's discretionary assets have been allocated to appropriate GIPScomposites. GAM's funds often are structured as investment pools withunderlying currency classes and it is at the investment pool level that GIPScomposite allocations have been made. Supplemental information shown inGAM's materials, including performance, geographic/industrial assetallocations, attribution details and other statistical analyses are based on asample account of the relevant composite that represents the managementstyle. Other accounts in the composite may have slightly different Portfoliocharacteristics. In some cases sample accounts have history that pre-datesGAM's compliance with GIPS of 30 June 1996. Indices other than thebenchmark are sometimes used in presentations for illustrative purposes.Please refer to the relevant GIPS compliant report.
50

GAM Trading Composite
Composite Performance 2005 2006 2007 2008 2009 2010 2011 2012 2013 2014 2015
Composite Returns % 4.97 8.68 9.48 7.58 8.32 7.8 -2.4 4.72 1.46 6.21 2.27
Benchmark Returns % 3.53 5.28 5.44 3.13 0.76 0.34 0.33 0.44 0.27 0.23 0.3
Composite Standard Dev 3Yr % 5.58 4.86 5.5 6.6 6.09 5.39 4.12 4.39 4.75 4.56 5.26
Benchmark Standard Dev 3Yr % 0.31 0.45 0.27 0.32 0.55 0.37 0.09 0.03 0.03 0.03 0.01
Number of Portfolios in Composite 6 < 6 < 6 < 6 < 6 < 6 < 6 < 6 < 6 < 6 < 6
High Return % 10.36 N/A N/A N/A N/A N/A N/A N/A N/A N/A N/A
Low Return % 2.32 N/A N/A N/A N/A N/A N/A N/A N/A N/A N/A
Composite Asset Value (USDm) 4,624 4,406 4,484 3,757 3,317 3,909 3,571 2,713 1,688 1,144 556
Total Firm Assets (USDm) 55,299 68,177 75,783 39,207 49,372 56,725 47,246 50,683 54,616 47,925 41,816
1: Established in 1983, GAM delivers active investment management to private clients, institutions and intermediaries. All GAM's assets are included in the GIPS definition of the firm, except for clients who set up separately-managed accounts which are administered by an independent third party for their fixed income hedge strategy and/or currency hedge strategy.
2: GAM claims compliance with the Global Investment Performance Standards (GIPS®) and has prepared and presented this report in compliance with the GIPS standards. GAM has been independently verified from 1 January 1996 through 31 December 2014. In June 2014 GAM acquired Singleterry Mansley Asset Management Inc. Having determined that the GIPS portability criteria were satisfied, the pre and post acquisition performance records of Singleterry Mansley Asset Management were linked, and the combined business was verified in 2015. The verification reports are available upon request. Verification assesses whether (1) the firm has complied with all the composite construction requirements of the GIPS standards on a firm-wide basis and (2) the firm's policies and procedures are designed to calculate and present performance in compliance with the GIPS standards. Verification does not ensure the accuracy of any specific composite presentation.
3: The composite consists of trading funds of hedge funds. Rigorous and structured analysis of underlying managers identifies those with the strongest competitive edge. 4: The composite was created in Nov 2002 and applied retrospectively. 5: At the Portfolio level currency hedging may be employed to cover against exchange rate risk. Within a Portfolio's underlying funds, derivative instruments and leverage may play a significant part in
investment strategy. Leverage may be used as part of the underlying funds investment philosophy, as well as for the purposes of efficient Portfolio management. Further detail can be found in the relevant product documentation which is available on request.
6: Composite results are presented gross of investment management fees and net of trading expenses and net of withholding taxes on dividends, capital gains and interest. For some of the constituent accounts the presented gross of fee returns are also net of administrative expenses. Benchmarks are gross of withholding taxes on dividends.
7: The maximum investment management fee for accounts is 1.7625% per annum. Management fees may vary by product and jurisdiction. 8: High and low returns (for those constituents present in the composite throughout each period) are presented above to demonstrate dispersion within the composite. Dispersion information is only required by
GIPS where there are 6 or more Portfolios in the composite. 9: As of 1 Apr 2010 the CISDM benchmark was changed to show 1. the 3 Month Libor Index and 2. the HFRI/HFRX Macro Index. These benchmarks are a better representation of this investment strategy. The
HFRI/HFRX Macro Index comprises the returns of the HFR Investable Index since launch in Mar 2003 and the returns of the HFR Non-Investable Index prior to this. The current month and the prior 3 months are based on estimated month end performance and are subject to change. All other performance values prior to that are locked.
10: The WM 4pm (GMT) FX rates are used for valuation of funds and Portfolios within the composite and for benchmark and composite calculation. 11: Policies for valuing Portfolios, calculating performance and preparing compliant presentations are available on request. 12: Where there are fewer than 36 monthly returns for the Composite, Standard Deviation 3Yr% is shown as ‘N/A’ for both the Composite and the Benchmark.
Past performance is not indicative of future performance.
GAM has prepared and presented this report in compliance with the Global Investment Performance Standards (GIPS®). A complete list and description of composites is available on request.
Source: GAM as at 31 Dec 2015
*The benchmark shown is for comparative purposes only. The composite is not managed to a specific benchmark.
There is no guarantee that targets will be achieved.
51

Disclaimer
52
FOR SOPHISTICATED INVESTORS ONLY.
This material has not been filed with FINRA and cannot be used as sales literature with members of the public. This presentation has been preparedfor sophisticated investors and the funds, strategies and views described may not be suitable for all investors.
The performance information shown in this presentation is supplemental to, and should be read in conjunction with, the applicable GIPS-compliant compositefound in this presentation.
Source of data: GAM (unless otherwise stated). GAM has not independently verified the information from other sources and no assurance can be given as towhether such information is accurate, true or complete and GAM makes no warranty, expressed or implied, regarding such information. Every effort has beenmade to ensure the accuracy of the information provided, but GAM cannot be held responsible for any errors or omissions. While every effort has been made toensure the accuracy of the financial information herein, you should note that some of the information may be based on unaudited or otherwise unverifiedinformation. The client is urged to compare information provided herein with the statements sent by the client’s custodian.
This presentation is for information only and the information contained in this presentation is confidential to GAM and has been produced solely for the use of theperson to whom it is given or sent. It may not be used for any other purpose and may not be reproduced, copied, given, distributed or disclosed, in whole or inpart, to any other person. This is not an invitation to invest in any GAM product or strategy and subscriptions will only be received on the basis of the relevantoffering document or investment management agreement.
Nothing contained herein constitutes investment, legal, tax or other advice nor is it to be relied on in making an investment or other decision. Nothing in thispresentation should be construed as a solicitation, offer or recommendation to acquire or dispose of any investment or to engage in any other transaction.
Not all products mentioned in this presentation are registered for public sale in all jurisdictions. Therefore, no public marketing must be carried out for them. GAMproducts are not available for sale in any state or jurisdiction in which such sale would be prohibited and are not aimed at persons in those jurisdictions and inthose cases where the law prohibits this type of information from being provided.
None of the shares, units or interests of the products mentioned in this presentation have been registered under the US Securities Act of 1933, as amended (the“Securities Act”), and none of the products mentioned in this presentation are registered under the US Investment Company Act of 1940, as amended (the“Company Act”). Accordingly, unless an exemption is available, such shares, units or interests may not be offered, sold or distributed in the United States or to USpersons. However, pursuant to an exemption from registration under the Securities Act and the Company Act, such shares, units or interests may be sold orresold in the United States or to certain qualified US investors in transactions that do not constitute a public offering. In addition, certain GAM products are closedto all US investors.

Disclaimer
53
Unless otherwise noted, where shown, performance figures are net of fees and reflect reinvestment of dividends. However, taxes and sales charges are nottaken into account; therefore, the figures do not give a true measure of return to the investor. Products and services may vary from country to country. Pleaseconsult your financial professional for more information on GAM products. Past performance is not an indication of future performance. An investor may not getback the amount invested. Historic data may be subject to restatement from time to time. Investors may not purchase indices directly. Holdings and allocationsare subject to change. There is no guarantee that the strategies or objectives presented will be achieved and the value of the Portfolio may go down as well asup and may be affected by changes in rates of exchange.
The views contained herein are as of the date of this presentation and may not reflect the views any time thereafter. These views are aimed to help the reader inunderstanding the investment manager’s investment process and should not be construed as investment advice.
Important Information on hedge funds:Hedge fund strategies are speculative and are not suitable for all investors, nor do they represent a complete investment program. GAM hedge fund products areonly available to qualified investors who are comfortable with the substantial risks associated with investing in hedge funds. Many of the investment programs arespeculative and entail substantial risks. An investment in hedge fund strategies includes the risks inherent in an investment in securities, as well as specific risksassociated with limited liquidity, the use of leverage, short sales, options, futures, derivative instruments, investments in non-US securities, “junk” bonds andilliquid investments. Investors should recognize that they will bear asset-based fees and expenses at the fund of hedge fund level, and indirectly, fees, expensesand performance-based compensation of the investment funds in which these funds of hedge funds invest. In addition, the overall performance of fund of hedgefund products is dependent not only on the investment performance of individual managers, but also on the ability of a GAM investment manager to allocateassets amongst such managers on an ongoing basis. There can be no assurances that an investment strategy (hedging or otherwise) will be successful or that amanager will employ such strategies with respect to all or any portion of a Portfolio.
Hedge fund strategies may be highly leveraged and the volatility of the price of their interests may be great. Investors could lose some or all of their investments.Investing in securities of foreign issuers involves special risks including currency rate fluctuations, political and economic instability, foreign taxes and differentauditing and reporting standards. These risks are greater in emerging market countries. The investment funds in which GAM fund of hedge fund products investcan be highly illiquid, are not required to provide periodic reporting or valuation information to investors and may involve complex tax strategies. GAM makes norepresentation that an investment in any GAM fund of hedge fund product will provide transparency as GAM cannot fully monitor the leverage of underlying fundsand their day-to-day activity. The use of leverage may cause an underlying Portfolio to liquidate positions when it may not be advantageous to do so in order tosatisfy its obligations or to meet segregation requirements. Leverage, including borrowing, may cause an underlying Portfolio to be more volatile than if thePortfolio had not been leveraged.

Communication of gross only performance figures must be on a one-on-one basis, private and of a confidential nature.They may not be disseminated to the public in any print, electronic or other medium, to include a web-site or anydatabase of general circulation. The following disclosures must be provided in writing when communicating gross onlyperformance figures.
• Performance figures do not reflect the deduction of investment advisory fees.
• Returns will be reduced by investment advisory fees and any other expenses that may be incurred in themanagement of an account.
• The investment advisory fees are described in Part 2A of the applicable Form ADV.
• As an example of the effect of investment advisory fees on the total value of an account, a three year compoundreturn of 8.83% before the deduction of investment advisory fees would be 7.74% after deduction of investmentadvisory fees of 1.00% per annum accrued monthly and payable quarterly.
• GAM composites may include funds not registered under the Company Act and shares, units or interests notregistered under the Securities Act. Accordingly, such funds may only be offered, sold or distributed in the UnitedStates or to US persons under limited circumstances.
54
Notes to PerformanceCompliance Statement for US Investment Consultants