5. presentation by the boston company emerging markets ...retirement.ladwp.com/agendaitems/agenda -...
TRANSCRIPT

5. Presentation by The Boston Company Emerging Markets - Annual Performance Review as of December 31 , 2010
5
Emerging Markets ValueEquity ManagementMarch 9, 2011
P R E S E N T S
C. Warren SkillmanSenior Portfolio Manager(617) 722-7351
John D. HavensSenior Relationship Manager(617) 722-7031
Los Angeles Water and Power Employees’ Retirement Plan

LADWP3/9/11
2
Table of Contents
Section A: Company Overview 3
Section B: Investment Process and Discipline 12
Section C: Market Overview 20
Section D: Performance Review 27
Section E: Country Weights and Portfolio Structure 37
Section F: Portfolio Holdings, Fees & Disclosures 40

LADWP3/9/11
3
Company Overview
LADWP3/9/11
4
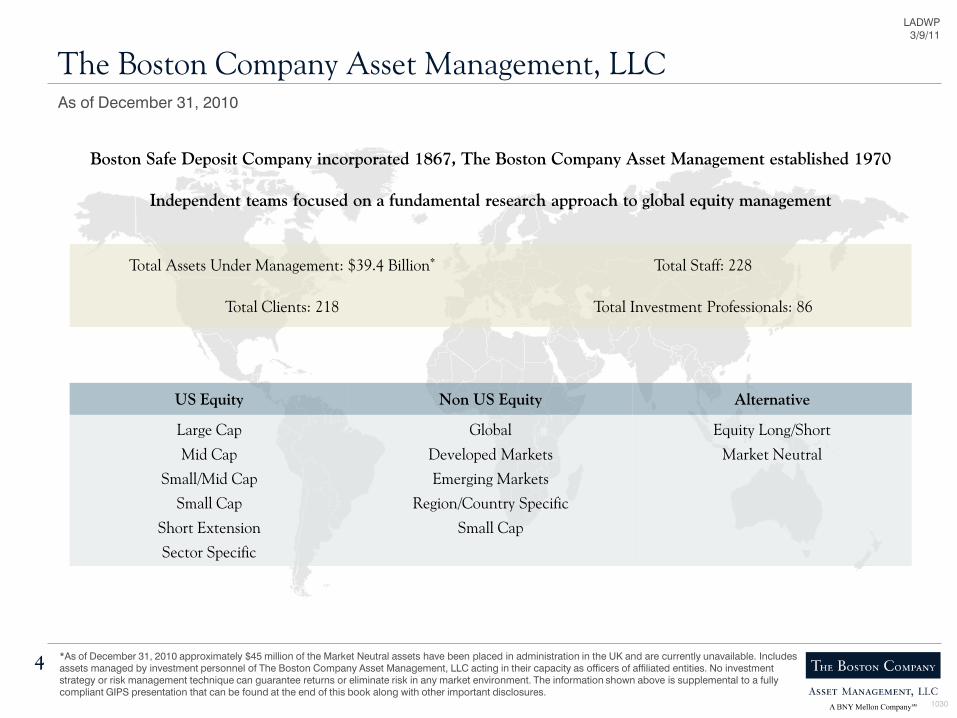
The Boston Company Asset Management, LLCAs of December 31, 2010
*As of December 31, 2010 approximately $45 million of the Market Neutral assets have been placed in administration in the UK and are currently unavailable. Includes assets managed by investment personnel of The Boston Company Asset Management, LLC acting in their capacity as officers of affiliated entities. No investment strategy or risk management technique can guarantee returns or eliminate risk in any market environment. The information shown above is supplemental to a fully compliant GIPS presentation that can be found at the end of this book along with other important disclosures.
Total Assets Under Management: $39.4 Billion* Total Staff: 228
Total Clients: 218 Total Investment Professionals: 86
1030
Boston Safe Deposit Company incorporated 1867, The Boston Company Asset Management established 1970
Independent teams focused on a fundamental research approach to global equity management
US Equity Non US Equity Alternative
Large Cap
Mid Cap
Small/Mid Cap
Small Cap
Short Extension
Sector Specific
Global
Developed Markets
Emerging Markets
Region/Country Specific
Small Cap
Equity Long/Short
Market Neutral
LADWP3/9/11
5
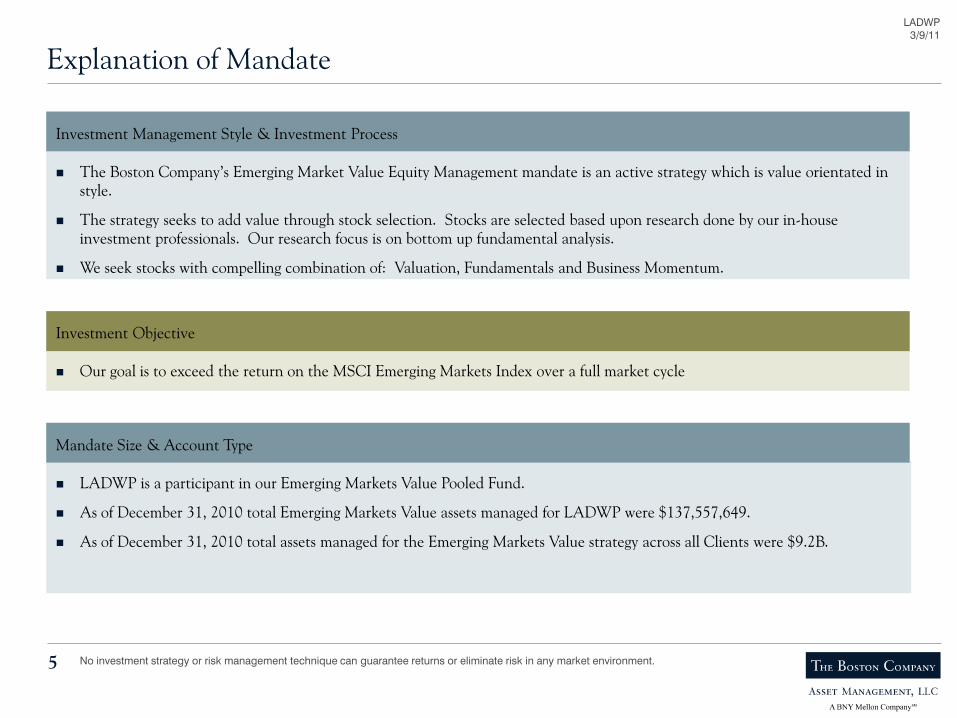
Explanation of Mandate
Investment Management Style & Investment Process
Investment Objective
Mandate Size & Account Type
The Boston Company’s Emerging Market Value Equity Management mandate is an active strategy which is value orientated in style.
The strategy seeks to add value through stock selection. Stocks are selected based upon research done by our in-house investment professionals. Our research focus is on bottom up fundamental analysis.
We seek stocks with compelling combination of: Valuation, Fundamentals and Business Momentum.
Our goal is to exceed the return on the MSCI Emerging Markets Index over a full market cycle
LADWP is a participant in our Emerging Markets Value Pooled Fund.
As of December 31, 2010 total Emerging Markets Value assets managed for LADWP were $137,557,649.
As of December 31, 2010 total assets managed for the Emerging Markets Value strategy across all Clients were $9.2B.
No investment strategy or risk management technique can guarantee returns or eliminate risk in any market environment.
LADWP3/9/11
6
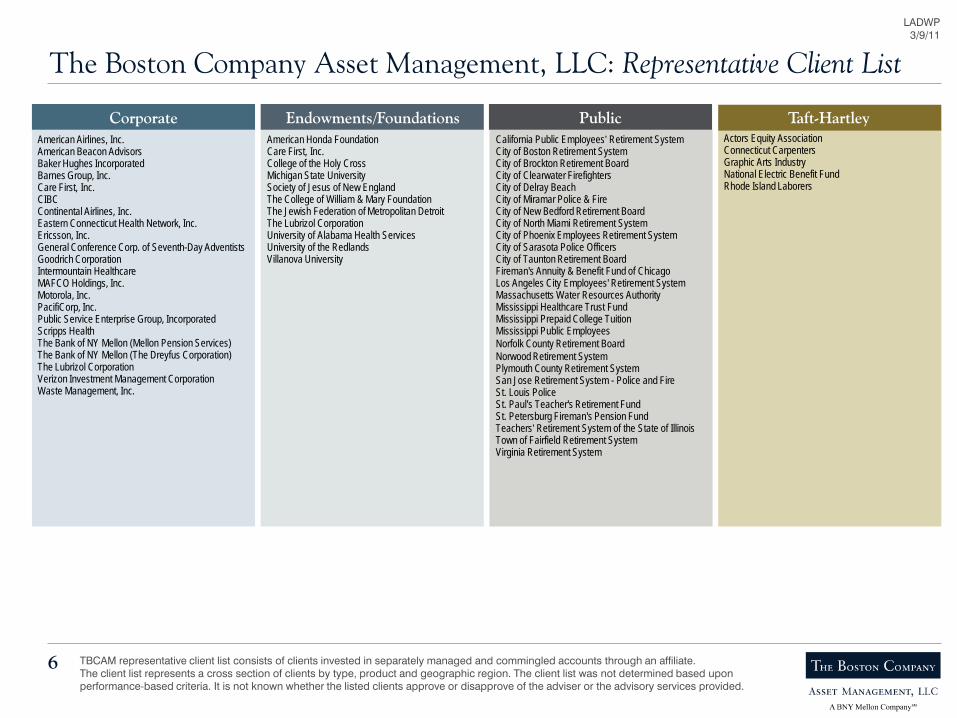
American Airlines, Inc.American Beacon AdvisorsBaker Hughes IncorporatedBarnes Group, Inc.Care First, Inc.CIBCContinental Airlines, Inc.Eastern Connecticut Health Network, Inc.Ericsson, Inc.General Conference Corp. of Seventh-Day AdventistsGoodrich CorporationIntermountain HealthcareMAFCO Holdings, Inc.Motorola, Inc.PacifiCorp, Inc.Public Service Enterprise Group, IncorporatedScripps HealthThe Bank of NY Mellon (Mellon Pension Services)The Bank of NY Mellon (The Dreyfus Corporation)The Lubrizol CorporationVerizon Investment Management CorporationWaste Management, Inc.
TBCAM representative client list consists of clients invested in separately managed and commingled accounts through an affiliate.The client list represents a cross section of clients by type, product and geographic region. The client list was not determined based uponperformance-based criteria. It is not known whether the listed clients approve or disapprove of the adviser or the advisory services provided.
American Honda FoundationCare First, Inc.College of the Holy CrossMichigan State UniversitySociety of Jesus of New EnglandThe College of William & Mary FoundationThe Jewish Federation of Metropolitan DetroitThe Lubrizol CorporationUniversity of Alabama Health ServicesUniversity of the RedlandsVillanova University
California Public Employees’ Retirement SystemCity of Boston Retirement SystemCity of Brockton Retirement BoardCity of Clearwater FirefightersCity of Delray BeachCity of Miramar Police & FireCity of New Bedford Retirement BoardCity of North Miami Retirement SystemCity of Phoenix Employees Retirement SystemCity of Sarasota Police OfficersCity of Taunton Retirement BoardFireman's Annuity & Benefit Fund of ChicagoLos Angeles City Employees' Retirement SystemMassachusetts Water Resources Authority Mississippi Healthcare Trust FundMississippi Prepaid College TuitionMississippi Public EmployeesNorfolk County Retirement BoardNorwood Retirement SystemPlymouth County Retirement SystemSan Jose Retirement System - Police and FireSt. Louis PoliceSt. Paul's Teacher's Retirement FundSt. Petersburg Fireman's Pension FundTeachers’ Retirement System of the State of IllinoisTown of Fairfield Retirement SystemVirginia Retirement System
Taft-HartleyActors Equity AssociationConnecticut CarpentersGraphic Arts IndustryNational Electric Benefit FundRhode Island Laborers
The Boston Company Asset Management, LLC: Representative Client List
Corporate PublicEndowments/Foundations

LADWP3/9/11
Richard K. Watson, Jr.Executive Vice President &
Head of Distribution
Product Development and
Management
Relationship Management
Marketing and Communications
Distribution Support
The Boston Company Asset Management, LLCOrganizational Chart
David H. Cameron, CFAChairman, President & Chief Executive Officer
Joseph P. GennacoExecutive Vice President &
Chief Operating Officer
John Truschel, CFAExecutive Vice President &Chief Investment Officer
Portfolio Teams
Quantitative Research
Core Research
Global Equity Trading Administration
OperationsCompliance
Portfolio Implementation
Portfolio Strategy
Investment Systems and
Data
7
Vendor and Commission Management
Finance
LADWP3/9/11
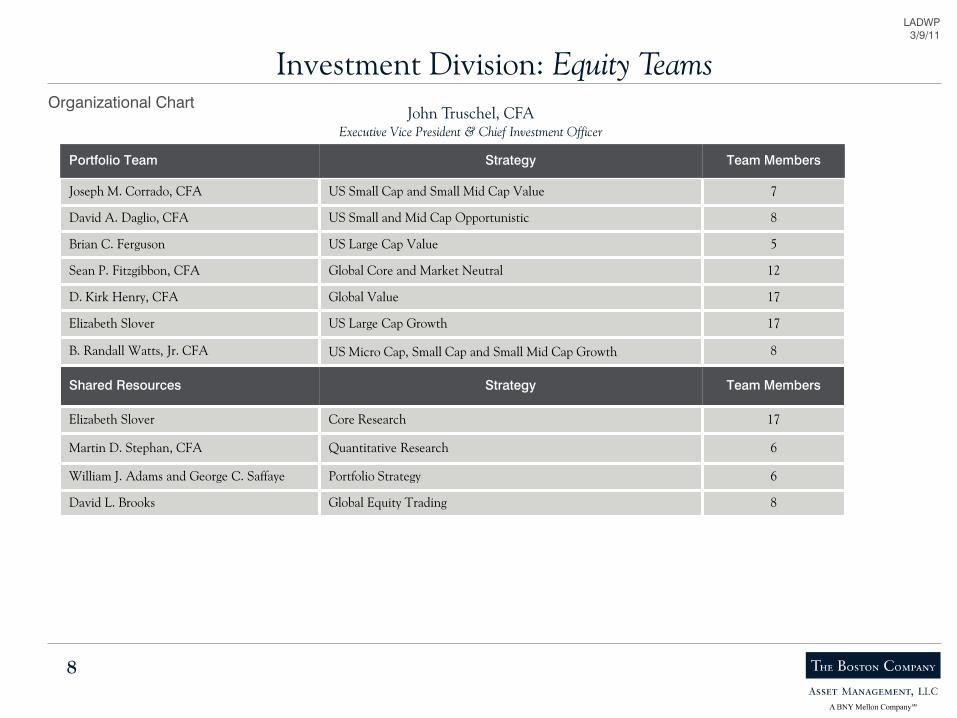
Investment Division: Equity TeamsOrganizational Chart
John Truschel, CFAExecutive Vice President & Chief Investment Officer
Portfolio Team Strategy Team Members
Joseph M. Corrado, CFA US Small Cap and Small Mid Cap Value 7
David A. Daglio, CFA US Small and Mid Cap Opportunistic 8
Brian C. Ferguson US Large Cap Value 5
Sean P. Fitzgibbon, CFA Global Core and Market Neutral 12
D. Kirk Henry, CFA Global Value 17
Elizabeth Slover US Large Cap Growth 17
B. Randall Watts, Jr. CFA US Micro Cap, Small Cap and Small Mid Cap Growth 8
Shared Resources Strategy Team Members
Elizabeth Slover Core Research 17
Martin D. Stephan, CFA Quantitative Research 6
William J. Adams and George C. Saffaye Portfolio Strategy 6
David L. Brooks Global Equity Trading 8
8

LADWP3/9/11
*Includes tenure at The Bank of New York Mellon Corporation affiliates.9
Emerging Markets Value Equity: Investment Team
Research and ManagementIndustry
ExperienceYears at Firm* Title Country/Sector Coverage
D. Kirk Henry, CFABA, Stanford University;MBA, University of Chicago
29 16 Senior Managing Director, Senior Portfolio Manager, Director of International Value Equity
Europe, Asia ex-Japan
Clifford A. Smith, CFABS, Pennsylvania State University;MS, Princeton University;MBA, Carnegie Mellon University
15 15 Senior Managing Director, Senior Portfolio Manager Japan, Australia, US
C. Warren SkillmanBA, Boston College;MSc, London Business School
17 5 Managing Director, Senior Portfolio Manager Latin America, EMEA, Emerging Asia
Carolyn M. Kedersha, CFA, CPABA, George Washington University; MBA, Rutgers University
29 22 Managing Director, Senior Portfolio Manager Emerging Small Cap, Latin America
Andrea M. Clark, CFABS & MBA, Suffolk University 24 11 Director, Senior International Research Analyst Europe, US
William J. AdamsBA, Boston CollegeMBA, University of Maryland
15 5 Director, Portfolio Strategist
William C. Jurik, CFABS & MBA, Carnegie Mellon University 16 16 Managing Director, Senior Portfolio Manager Europe, US/Global Financials
Parameswari Roychoudhury, CFABSc, St. Xavier’s College, Kolkata, India;MA, Tufts University
19 19 Director, Senior International Research Analyst Europe, India
Michelle Y. Chan, CFA BA, University of Hong Kong;MS, Purdue University
19 9 Director, Senior International Research Analyst Asia ex-Japan
Alain L. Chinca, CFABS, Université de Nice; MS, Université de Paris IX;MBA, Babson Graduate School of Business
19 10 Director, Senior Quantitative Analyst
Takamune Fujikawa, CFABS, NYU Stern School of Business 16 2 Director, Senior International Research Analyst Japan

LADWP3/9/11
*Includes tenure at The Bank of New York Mellon Corporation affiliates.10
Emerging Markets Value Equity: Investment Team continued
Research and ManagementIndustry
ExperienceYears at Firm* Title Country/Sector Coverage
Frank J. Goguen, CFABS, Boston College;MBA, Bentley College
15 15 Director, Senior International Research Analyst Japan, Europe, Australia/Global Pharmaceuticals
Derek M. ThiemeBA, Assumption College;MBA, FW Olin Graduate School
12 10 Director, Senior International Research Analyst Emerging Asia, EMEA
Ranjit RajamaniB.Com., Loyola College, Madras, India;M.Com., Loyola College, Madras, India;MBA, University of Texas
15 3 Director, Senior International Research Analyst Emerging Asia, Europe/Global Materials & Industrials
Thomas D. Grant, CFABA, Williams College;MBA, MIT Sloan School of Management
10 4 Vice President, International Research Analyst EMEA, Emerging Small Cap
Anthony J. Ryan, CFABSc, University of Sheffield, UK;MSc, Imperial College, London;MBA, Boston College
8 5 Director, Senior International Research Analyst Canada/Global Energy & Technology
Lawrence R. Curran, Jr.BA, Middlebury College 9 9 Vice President, International Research Analyst Latin America, Japan
Trading
David L. Brooks 19 12 Managing Director, Head of Trading
Cecelia L. Mead 18 6 Vice President, Senior Trader
Elisabeth P. Thayer 12 13 Vice President, Trader
Christopher Dorin 9 2 Vice President , Trader
Aykut Terzioglu 11 11 Senior Associate, Portfolio Coordinator
Ian Johnston, CFA 9 7 Senior Associate, Portfolio Coordinator
Lou Raffetto, CFA 7 <1 Senior Associate, Portfolio Coordinator

LADWP3/9/11
11
Key Contacts
D. Kirk Henry, CFADirector of Non-US Value EquityBNY Mellon Center, Suite 024-0146201 Washington St.Boston, MA 02108-4408(617) [email protected]
C. Warren SkillmanPortfolio ManagementBNY Mellon Center, Suite 024-0146201 Washington St.Boston, MA 02108-4408(617) [email protected]
William J. AdamsPortfolio StrategistBNY Mellon Center, Suite 024-0146201 Washington St.Boston, MA 02108-4408(617) [email protected]
David H. Cameron, CFAPresident & Chief Executive OfficerBNY Mellon Center, Suite 024-0146201 Washington St.Boston, MA 02108-4408(617) [email protected]
John Truschel, CFAChief Investment OfficerBNY Mellon Center, Suite 024-0146201 Washington St.Boston, MA 02108-4408(617) [email protected]
John D. HavensSenior Relationship ManagerBNY Mellon Center, Suite 024-0146201 Washington St.Boston, MA 02108-4408(617) [email protected]
Portfolio Management Relationship ManagementExecutive Management
LADWP3/9/11
12
Investment Process and Discipline

LADWP3/9/11
Emerging Markets Value Equity: Key Features
Apply active stock selection– Uncover overlooked investment opportunities, limit index overlap
Invest early in business cycle/sell ahead of peak– Capture initial performance recovery, avoid crowding out impact
Look across all market caps– Gain exposure to local trends, tomorrow’s leaders
Remain Diversified– Control risk without performance dilution
13 No investment strategy or risk management technique can guarantee returns or eliminate risk in any market environment.
Features
We seek to:
Potential Benefits
Above-average risk adjusted performance over a full market cycle
LADWP3/9/11
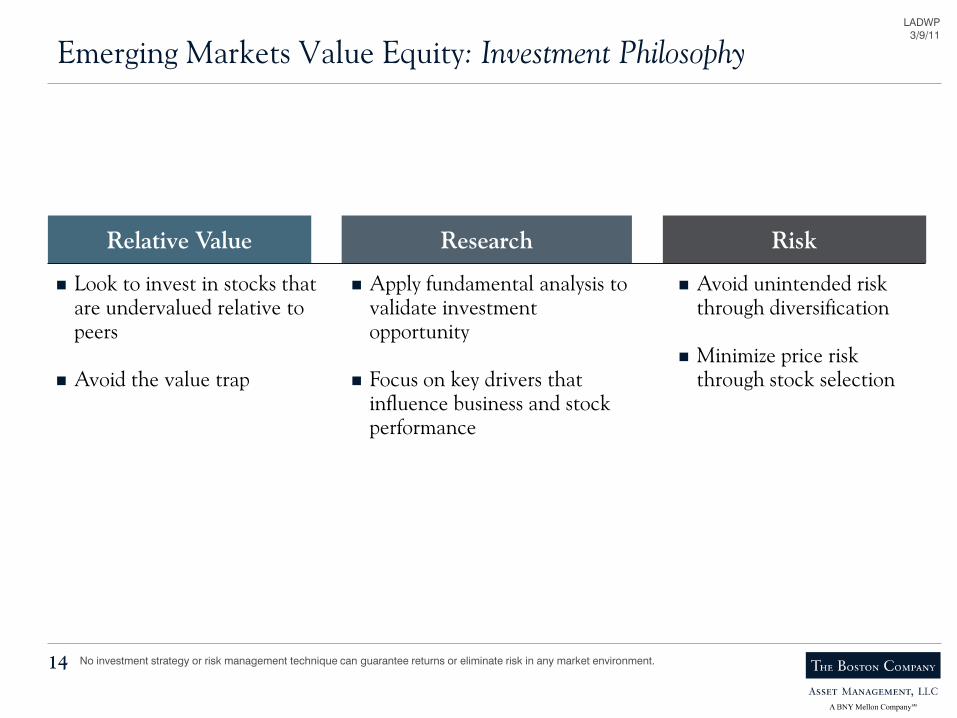
Emerging Markets Value Equity: Investment Philosophy
14
RiskResearchRelative Value
Look to invest in stocks that are undervalued relative to peers
Avoid the value trap
Apply fundamental analysis to validate investment opportunity
Focus on key drivers that influence business and stock performance
Avoid unintended risk through diversification
Minimize price risk through stock selection
No investment strategy or risk management technique can guarantee returns or eliminate risk in any market environment.

LADWP3/9/11
Emerging Markets Value Equity: Opportunity Cycle
15 Source: TBCAMNo investment strategy or risk management technique can guarantee returns or eliminate risk in any market environment.Hypothetical example and for illustrative purposes only. The chart reflects TBCAMs analysis of the main phases in the price of a stock.
Peak Decline Bottom Recovery Peak
Stock Price
Time Period: 3 - 5 Years
EarningsCycle

LADWP3/9/11
Emerging Markets Value Equity: Investment Process
16
Fundamental Analysis
Input:
– Highly ranked value stocks
– Bottom 40% of universe
Portfolio Construction
Input:
– Analysts’ research
– Client guidelines
– Internal risk controls
Idea Generation
Input:
– FactSet Emerging Markets Database
– 1800 stocks
– > $500 M market cap
No investment strategy or risk management technique can guarantee returns or eliminate risk in any market environment.
Action:
– Identify investment candidates
– Value
– Fundamentals
– Momentum
Action:
– Analyze financials
– Local research data
– Discussion with company management
– Estimate earnings/price target range
– Make recommendation
Action:
– Portfolio management team makes buy & sell decisions
– Maintain industry & country diversification

LADWP3/9/11
How We Select Stocks
17
We seek to buy stocks that exhibit:
Good value characteristics
– Traditional multiples
– P/E, P/B, P/CF
Strong business fundamentals
– Sound capital structure
– Product position
– Management strategy
Improving business momentum
– Cyclical recovery
– New market/product launch
– Restructuring
ValueHow much are we paying?
Prime Candidates
BusinessMomentumCan profitability improve?
FundamentalsHow sound is the business?
No investment strategy or risk management technique can guarantee returns or eliminate risk in any market environment.

LADWP3/9/11
Sell Decision
18
We sell stocks that violate any one of the circles:
ValueHas the company met its price target?
Business MomentumIs business getting worse?
FundamentalsAre fundamentals deteriorating?
Full valuation
Deterioration of business fundamentals
Negative business momentum
No investment strategy or risk management technique can guarantee returns or eliminate risk in any market environment.
LADWP3/9/11
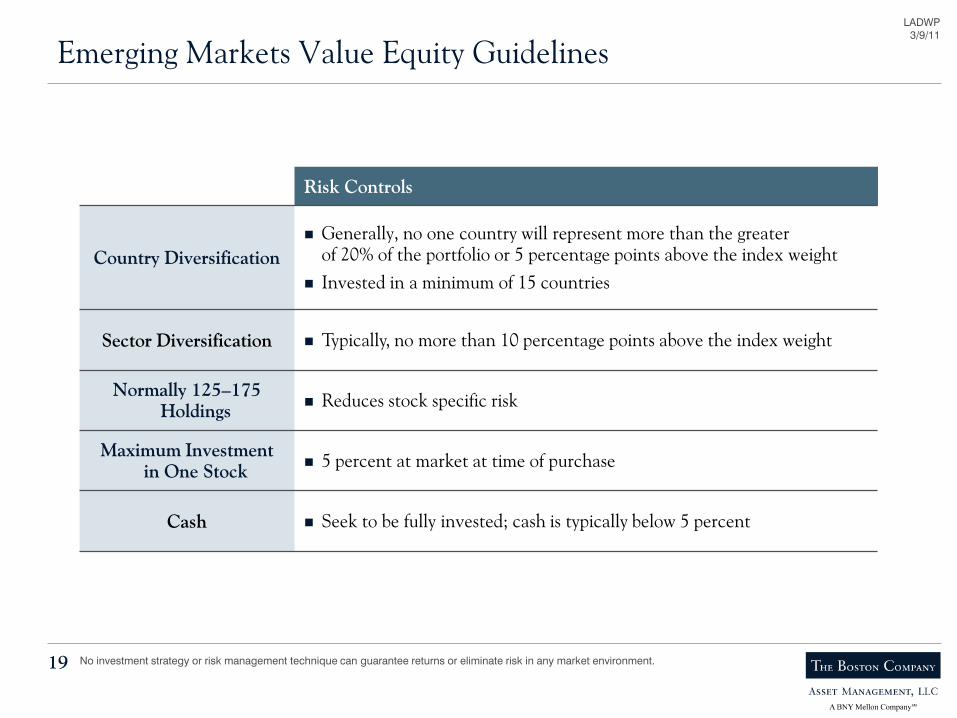
Emerging Markets Value Equity Guidelines
19 No investment strategy or risk management technique can guarantee returns or eliminate risk in any market environment.
Risk Controls
Country Diversification Generally, no one country will represent more than the greater
of 20% of the portfolio or 5 percentage points above the index weight Invested in a minimum of 15 countries
Sector Diversification Typically, no more than 10 percentage points above the index weight
Normally 125–175 Holdings Reduces stock specific risk
Maximum Investmentin One Stock 5 percent at market at time of purchase
Cash Seek to be fully invested; cash is typically below 5 percent

LADWP3/9/11
20
Market Overview
LADWP3/9/11
21
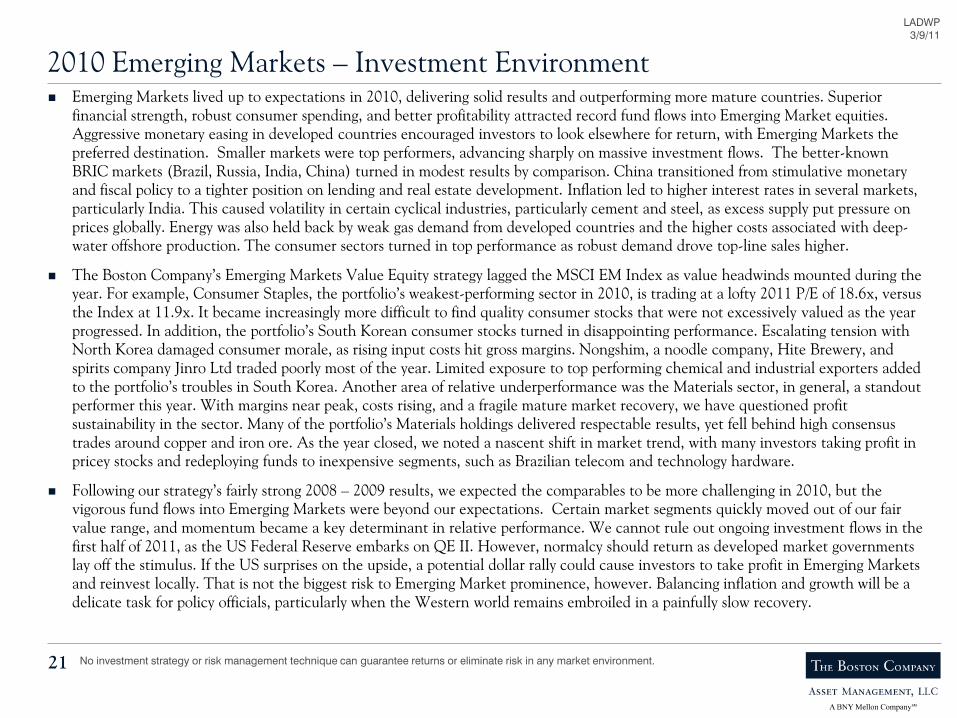
2010 Emerging Markets – Investment Environment Emerging Markets lived up to expectations in 2010, delivering solid results and outperforming more mature countries. Superior
financial strength, robust consumer spending, and better profitability attracted record fund flows into Emerging Market equities. Aggressive monetary easing in developed countries encouraged investors to look elsewhere for return, with Emerging Markets the preferred destination. Smaller markets were top performers, advancing sharply on massive investment flows. The better-known BRIC markets (Brazil, Russia, India, China) turned in modest results by comparison. China transitioned from stimulative monetary and fiscal policy to a tighter position on lending and real estate development. Inflation led to higher interest rates in several markets, particularly India. This caused volatility in certain cyclical industries, particularly cement and steel, as excess supply put pressure on prices globally. Energy was also held back by weak gas demand from developed countries and the higher costs associated with deep-water offshore production. The consumer sectors turned in top performance as robust demand drove top-line sales higher.
The Boston Company’s Emerging Markets Value Equity strategy lagged the MSCI EM Index as value headwinds mounted during the year. For example, Consumer Staples, the portfolio’s weakest-performing sector in 2010, is trading at a lofty 2011 P/E of 18.6x, versus the Index at 11.9x. It became increasingly more difficult to find quality consumer stocks that were not excessively valued as the year progressed. In addition, the portfolio’s South Korean consumer stocks turned in disappointing performance. Escalating tension with North Korea damaged consumer morale, as rising input costs hit gross margins. Nongshim, a noodle company, Hite Brewery, and spirits company Jinro Ltd traded poorly most of the year. Limited exposure to top performing chemical and industrial exporters added to the portfolio’s troubles in South Korea. Another area of relative underperformance was the Materials sector, in general, a standout performer this year. With margins near peak, costs rising, and a fragile mature market recovery, we have questioned profit sustainability in the sector. Many of the portfolio’s Materials holdings delivered respectable results, yet fell behind high consensus trades around copper and iron ore. As the year closed, we noted a nascent shift in market trend, with many investors taking profit in pricey stocks and redeploying funds to inexpensive segments, such as Brazilian telecom and technology hardware.
Following our strategy’s fairly strong 2008 – 2009 results, we expected the comparables to be more challenging in 2010, but the vigorous fund flows into Emerging Markets were beyond our expectations. Certain market segments quickly moved out of our fair value range, and momentum became a key determinant in relative performance. We cannot rule out ongoing investment flows in the first half of 2011, as the US Federal Reserve embarks on QE II. However, normalcy should return as developed market governments lay off the stimulus. If the US surprises on the upside, a potential dollar rally could cause investors to take profit in Emerging Markets and reinvest locally. That is not the biggest risk to Emerging Market prominence, however. Balancing inflation and growth will be a delicate task for policy officials, particularly when the Western world remains embroiled in a painfully slow recovery.
No investment strategy or risk management technique can guarantee returns or eliminate risk in any market environment.
LADWP3/9/11
22
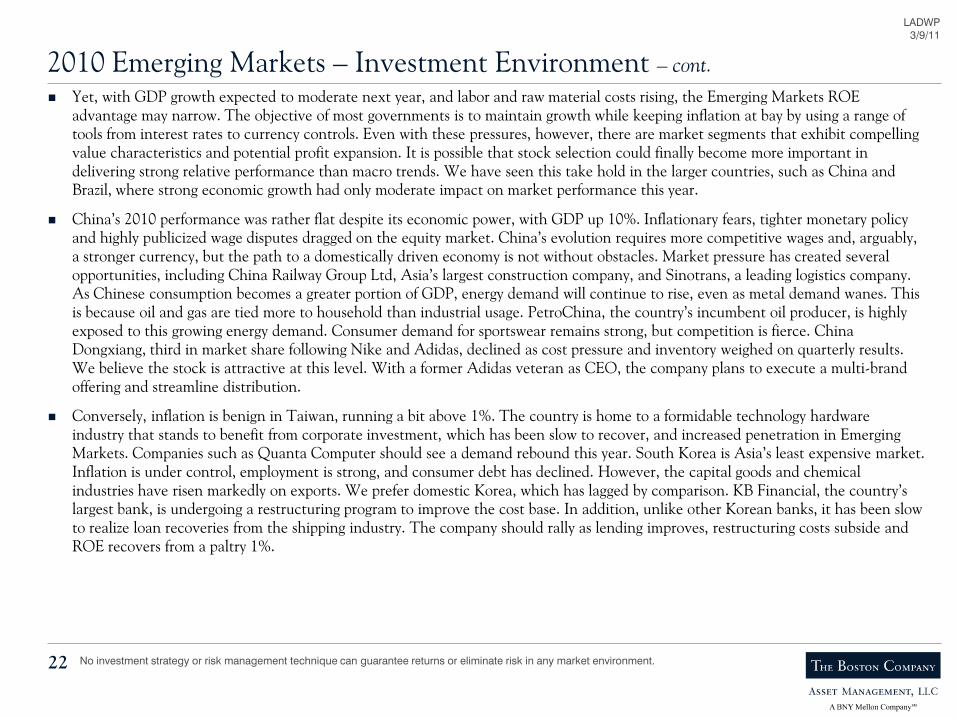
2010 Emerging Markets – Investment Environment – cont. Yet, with GDP growth expected to moderate next year, and labor and raw material costs rising, the Emerging Markets ROE
advantage may narrow. The objective of most governments is to maintain growth while keeping inflation at bay by using a range oftools from interest rates to currency controls. Even with these pressures, however, there are market segments that exhibit compelling value characteristics and potential profit expansion. It is possible that stock selection could finally become more important indelivering strong relative performance than macro trends. We have seen this take hold in the larger countries, such as China andBrazil, where strong economic growth had only moderate impact on market performance this year.
China’s 2010 performance was rather flat despite its economic power, with GDP up 10%. Inflationary fears, tighter monetary policy and highly publicized wage disputes dragged on the equity market. China’s evolution requires more competitive wages and, arguably, a stronger currency, but the path to a domestically driven economy is not without obstacles. Market pressure has created severalopportunities, including China Railway Group Ltd, Asia’s largest construction company, and Sinotrans, a leading logistics company. As Chinese consumption becomes a greater portion of GDP, energy demand will continue to rise, even as metal demand wanes. This is because oil and gas are tied more to household than industrial usage. PetroChina, the country’s incumbent oil producer, is highly exposed to this growing energy demand. Consumer demand for sportswear remains strong, but competition is fierce. China Dongxiang, third in market share following Nike and Adidas, declined as cost pressure and inventory weighed on quarterly results. We believe the stock is attractive at this level. With a former Adidas veteran as CEO, the company plans to execute a multi-brand offering and streamline distribution.
Conversely, inflation is benign in Taiwan, running a bit above 1%. The country is home to a formidable technology hardware industry that stands to benefit from corporate investment, which has been slow to recover, and increased penetration in EmergingMarkets. Companies such as Quanta Computer should see a demand rebound this year. South Korea is Asia’s least expensive market. Inflation is under control, employment is strong, and consumer debt has declined. However, the capital goods and chemical industries have risen markedly on exports. We prefer domestic Korea, which has lagged by comparison. KB Financial, the country’slargest bank, is undergoing a restructuring program to improve the cost base. In addition, unlike other Korean banks, it has been slow to realize loan recoveries from the shipping industry. The company should rally as lending improves, restructuring costs subside and ROE recovers from a paltry 1%.
No investment strategy or risk management technique can guarantee returns or eliminate risk in any market environment.
LADWP3/9/11
23
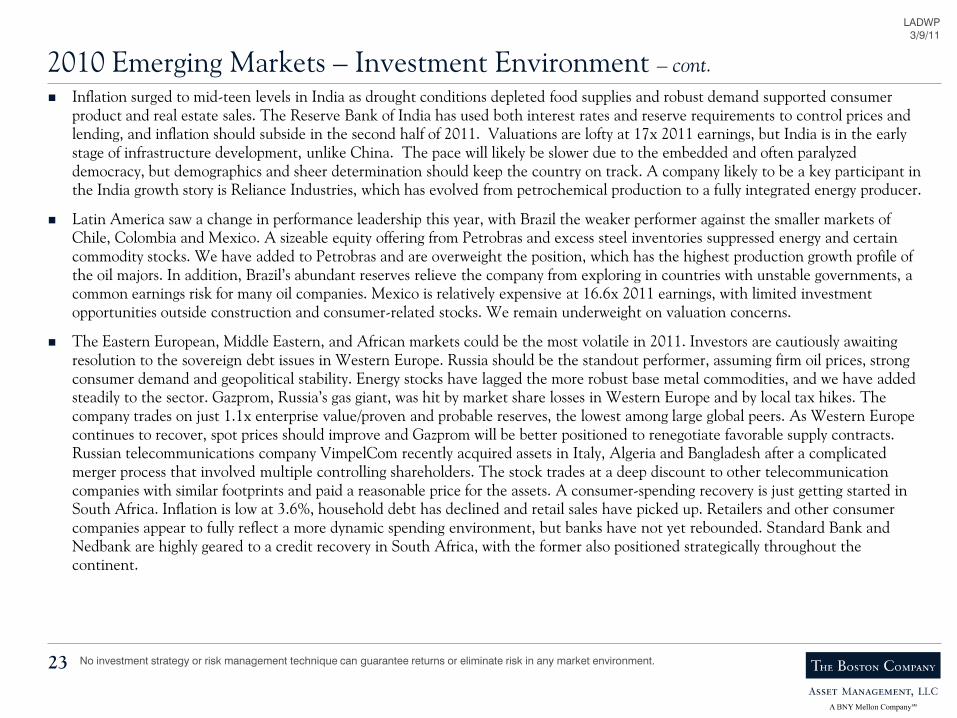
2010 Emerging Markets – Investment Environment – cont. Inflation surged to mid-teen levels in India as drought conditions depleted food supplies and robust demand supported consumer
product and real estate sales. The Reserve Bank of India has used both interest rates and reserve requirements to control prices and lending, and inflation should subside in the second half of 2011. Valuations are lofty at 17x 2011 earnings, but India is in the early stage of infrastructure development, unlike China. The pace will likely be slower due to the embedded and often paralyzed democracy, but demographics and sheer determination should keep the country on track. A company likely to be a key participant in the India growth story is Reliance Industries, which has evolved from petrochemical production to a fully integrated energy producer.
Latin America saw a change in performance leadership this year, with Brazil the weaker performer against the smaller markets of Chile, Colombia and Mexico. A sizeable equity offering from Petrobras and excess steel inventories suppressed energy and certain commodity stocks. We have added to Petrobras and are overweight the position, which has the highest production growth profile of the oil majors. In addition, Brazil’s abundant reserves relieve the company from exploring in countries with unstable governments, a common earnings risk for many oil companies. Mexico is relatively expensive at 16.6x 2011 earnings, with limited investment opportunities outside construction and consumer-related stocks. We remain underweight on valuation concerns.
The Eastern European, Middle Eastern, and African markets could be the most volatile in 2011. Investors are cautiously awaiting resolution to the sovereign debt issues in Western Europe. Russia should be the standout performer, assuming firm oil prices, strong consumer demand and geopolitical stability. Energy stocks have lagged the more robust base metal commodities, and we have added steadily to the sector. Gazprom, Russia’s gas giant, was hit by market share losses in Western Europe and by local tax hikes. The company trades on just 1.1x enterprise value/proven and probable reserves, the lowest among large global peers. As Western Europe continues to recover, spot prices should improve and Gazprom will be better positioned to renegotiate favorable supply contracts. Russian telecommunications company VimpelCom recently acquired assets in Italy, Algeria and Bangladesh after a complicated merger process that involved multiple controlling shareholders. The stock trades at a deep discount to other telecommunication companies with similar footprints and paid a reasonable price for the assets. A consumer-spending recovery is just getting started in South Africa. Inflation is low at 3.6%, household debt has declined and retail sales have picked up. Retailers and other consumer companies appear to fully reflect a more dynamic spending environment, but banks have not yet rebounded. Standard Bank and Nedbank are highly geared to a credit recovery in South Africa, with the former also positioned strategically throughout the continent.
No investment strategy or risk management technique can guarantee returns or eliminate risk in any market environment.
LADWP3/9/11
24
Investment Outlook Investors should expect a more complicated outlook for Emerging Markets as economies develop and advance to a higher
underlying base. Although there will be exploitative inefficiencies, they will likely be on a stock level, versus country or sector. Healthy volatility and discriminating markets favor our investment approach, which tends to avoid the trappings of trend investing. Instead, we look to invest at the company level, paying close attention to valuation, the quality of a business franchise and the prospects for margin expansion. We are optimistic that Emerging Market companies will become global leaders and look forward to participating in that journey on your behalf. As always, we greatly appreciate your support and wish you a healthy and prosperous 2011.
No investment strategy or risk management technique can guarantee returns or eliminate risk in any market environment.

LADWP3/9/11
Advanced87%
Emerging13%
Advanced54%
Emerging46%
Emerging Markets: A Growing Impact on Global Economy
25
Advanced15%
Emerging85%
Population Density Share of GDP Share of World Market Cap
Sources: *IMF World Economic Outlook Database, 2009 data, MSCI; **MS Asia Banks team, Morgan Stanley Research estimates (2010E, 2011E)Some information contained herein has been obtained from third party sources that are believed to be reliable, but the information has not beenindependently verified by TBCAM. TBCAM makes no representations as to the accuracy or the completeness of such information. See other importantdisclosures at the end of this presentation.
Industrialized Economies
Emerging Markets
10
8
6
4
2
0
-2
-4
1990
1991
1992
1993
1994
1995
1996
1997
1998
1999
2000
2001
2002
2003
2004
2005
2006
2007
2008
2009
2010
E**
2011
E**
Real GDP Growth**
Emerging Markets' position in the world*%
GD
P G
row
th

LADWP3/9/11
Emerging Markets Value Equity: Current Bottom Up Themes
26
Underweight Chinese Financials Rapid loan growth in past 18 months = rising NPLs? Property developers at risk due to rising supply &
falling demand
Overweight South Korea
Relative valuations at wider discount than normal vs. MSCI EM Broad array of attractive ideas – Consumer Staples,
Financials, Information Technology
Overweight Small Cap More opportunities in domestic demand oriented
sectors Less efficient with higher growth potential
No investment strategy or risk management technique can guarantee returns or eliminate risk in any market environment. Statements of opinion constitute only current opinions of TBCAM, which are subject to change.
971

LADWP3/9/11
27
Performance Review

LADWP3/9/11
28
Compliance Certification
To the best of our knowledge, for the year ending December 31, 2010, The Pooled Employee Emerging Markets Value Equity Fund, in which Los Angeles Water & Power Employees' Retirement Plan is a participant, was in compliance with its investment guidelines.
John D. HavensDirectorSenior Relationship Manager

LADWP3/9/11
29
Investment Objective
The Boston Company Asset Management, LLC’s investment objective for the LADWP portfolio is to outperform the MSCI EM Index over a full market cycle.

LADWP3/9/11
30
Investment Performance
-5.0
0.0
5.0
10.0
15.0
20.0
25.0
Quarter One Year Three Years Five YearsSince Inception (3/2/05)
Total Portfolio(Gross of fees) 7.22 17.37 5.10 13.93 15.49
MSCI EM 7.36 19.20 -0.03 13.11 15.25
Percent
As of December 31, 2010
Returns for periods greater than one year are annualized.Past performance is not a guarantee for future performance. The information shown above is supplemental to a fully compliant GIPS presentation that can be found at the end of this book along with other important disclosures.
Portfolio MarketValue:$137,557,649

LADWP3/9/11
Emerging Markets Value Equity: Annualized Composite Returns
31
-5.0
0.0
5.0
10.0
15.0
20.0
25.0
Quarter One Year Three Years Five Years Ten YearsSince Inception (7/1/95)
Emerging Markets Value(Gross of fees) 7.29 17.71 4.80 13.82 18.60 14.14
MSCI EM 7.36 19.20 -0.03 13.11 16.23 8.55
Percent
As of December 31, 2010
Returns for periods greater than one year are annualized. Past performance is not a guarantee for future performance. The information shown above issupplemental to a fully compliant GIPS presentation that can be found at the end of this book along with other important disclosures.

LADWP3/9/11
Emerging Markets Value Equity: Annual Composite Returns
32
-60.0
-40.0
-20.0
0.0
20.0
40.0
60.0
80.0
100.0
2010 2009 2008 2007 2006 2005 2004 2003 2002 2001 2000 1999 1998 1997 1996
Emerging Markets Value(Gross of fees) 17.71 79.47 -45.52 28.24 29.43 27.73 29.35 57.30 1.35 9.42 -19.00 77.75 -16.52 0.51 19.15
MSCI EM 19.20 79.02 -53.18 39.78 32.59 34.54 25.95 56.27 -6.00 -2.37 -30.61 66.41 -25.34 -11.58 6.03
Percent
Past performance is not a guarantee for future performance. The information shown above is supplemental to a fully compliant GIPS presentation thatcan be found at the end of this book along with other important disclosures.

LADWP3/9/11
1.75%
1.01%
0.00%
0.20%
0.40%
0.60%
0.80%
1.00%
1.20%
1.40%
1.60%
1.80%
2.00%
TBCAM Average Return MSCI EM Average Return
17.99% 18.08%
0.00%2.00%4.00%6.00%8.00%
10.00%12.00%14.00%16.00%18.00%
TBCAM Average Return MSCI EM Average Return
33
Emerging Markets Value Equity*: Returns in Various Market Conditions
June 1996 – December 2010
*Representative institutional account Source: InterSec Research, December 2010Data shown above is gross-of-fees performance. Past performance is not a guarantee for future performance. The information shown above issupplemental to a fully compliant GIPS presentation that can be found at the end of this book along with other important disclosures. Someinformation contained herein has been obtained from third party sources that are believed to be reliable, but the information has not beenindependently verified by TBCAM. TBCAM makes no representations as to the accuracy or the completeness of such information.
Qrtly Return: > -10% & < +10% 29 Observations
Average Performance Period
Annualized Alpha: +2.95%
-14.43%
-18.69%
-20.00%-18.00%-16.00%-14.00%-12.00%-10.00%
-8.00%-6.00%-4.00%-2.00%0.00%
TBCAM Average Return MSCI EM Average Return
Qrtly Return: < -10% 11 Observations
Below Average Performance Period
Annualized Alpha: +17.03%
Qrtly Return: > +10% 19 Observations
Above Average Performance Period
Annualized Alpha: -0.36%
1232

LADWP3/9/11
Emerging Markets Value Equity: Country Attribution*
34
Brazil 15.2% 4.7% 1.6% 16.0% 6.8% 1.7% -0.9% -2.1% -0.1% 0.3% -0.5% 0.0% -0.2%Chile 0.0 0.0 0.0 1.6 44.8 0.7 -1.6 -44.8 -0.7 -0.4 0.0 0.0 -0.4China 17.7 10.4 2.1 18.1 4.8 1.1 -0.4 5.6 1.0 0.1 1.0 0.0 1.2Colombia 0.0 0.0 0.0 0.8 43.4 0.4 -0.8 -43.4 -0.4 -0.2 0.0 0.0 -0.2Czech Republic 0.0 0.0 0.0 0.4 -1.7 0.0 -0.4 1.7 0.0 0.1 0.0 0.0 0.1Egypt 0.0 7.7 0.0 0.5 12.4 0.0 -0.5 -4.7 0.0 0.1 0.0 0.0 0.1Hong Kong 0.7 30.9 0.3 0.0 -4.8 0.0 0.7 35.7 0.3 0.1 0.0 0.0 0.1Hungary 0.4 11.0 0.1 0.5 -9.6 -0.1 -0.1 20.6 0.2 0.1 0.1 0.0 0.2India 8.8 17.0 1.7 7.9 20.9 1.7 1.0 -3.9 0.0 0.1 -0.2 0.0 -0.1Indonesia 1.4 30.5 0.5 2.2 34.6 0.8 -0.8 -4.1 -0.3 -0.1 -0.1 0.0 -0.2Israel 0.8 0.3 0.0 1.1 -6.0 -0.2 -0.4 6.3 0.2 -0.1 -0.3 0.2 -0.2Malaysia 3.1 46.6 1.3 2.9 37.0 1.0 0.2 9.6 0.3 0.2 0.3 0.0 0.5Mexico 2.7 21.4 0.7 4.4 27.6 1.2 -1.7 -6.2 -0.6 -0.1 -0.2 0.1 -0.2Morocco 0.0 0.0 0.0 0.2 15.3 0.0 -0.2 -15.3 0.0 0.0 0.0 0.0 0.0Peru 0.0 0.0 0.0 0.6 53.3 0.3 -0.6 -53.3 -0.3 -0.2 0.0 0.0 -0.2Philippines 0.4 48.3 0.2 0.5 35.5 0.2 0.0 12.8 0.0 0.0 0.1 0.0 0.1Poland 1.4 1.6 0.1 1.4 15.9 0.3 0.0 -14.2 -0.2 0.0 -0.2 0.0 -0.2Russia 4.6 7.2 0.5 6.4 19.4 1.1 -1.8 -12.2 -0.6 0.2 -0.6 0.1 -0.4South Africa 9.4 27.6 2.6 7.2 34.2 2.5 2.1 -6.6 0.0 0.3 -0.4 -0.2 -0.2South Korea 17.2 16.5 2.4 13.3 27.2 3.1 4.0 -10.7 -0.7 0.4 -1.3 -0.5 -1.4Taiwan 11.4 21.0 1.9 10.9 22.7 2.0 0.5 -1.8 -0.2 0.0 -0.2 0.0 -0.1Tanzania 0.5 11.1 0.1 0.0 0.0 0.0 0.5 11.1 0.1 0.0 0.0 0.0 0.0Thailand 2.5 67.8 1.5 1.5 56.3 0.8 1.0 11.5 0.8 0.4 0.1 0.1 0.7Turkey 1.5 23.0 0.6 1.7 21.2 0.4 -0.2 1.7 0.2 0.2 0.0 0.0 0.3Ukraine 0.2 9.9 0.1 0.0 0.0 0.0 0.2 9.9 0.1 0.0 0.0 0.0 0.0UAE 0.1 -7.3 0.0 0.0 0.0 0.0 0.1 -7.3 0.0 0.0 0.0 0.0 0.0
Total 100.0% 18.2% 18.2% 100.0% 19.2% 19.2% 0.0% -1.0% -1.0% 1.5% -2.5% 0.0% -1.0%
January 1, 2010 – December 31, 2010
CountrySelection
EffectTotalEffect
InteractionEffect
PercentContribution
vs. IndexAllocation
Effect
RelativeWeight
vs. IndexExcessReturn
Return byCountry
PercentContribution
AverageCountryWeight
Return byCountry
PercentContribution
AverageCountryWeight
Attribution AnalysisEmerging Markets Value MSCI EM Variance
*Representative institutional account - Where applicable, excludes cash, ETFs and futuresPerformance history of less than two years may not provide an adequate basis from which to determine the performance of a strategy. Past performance of such astrategy is not a guarantee of any future results. The information shown above is supplemental to a fully compliant GIPS presentation that can be found at the end ofthis book along with other important disclosures. There may be material differences between the representative account and other accounts managed with thesame strategy. Because of these differences, the information based on the representative account should not necessarily be relied upon. No investment strategy orrisk management technique can guarantee returns or eliminate risk in any market environment. Country weights are subject to change without notice.

LADWP3/9/11
Emerging Markets Value Equity: Sector Attribution*
35
Consumer Discretionary 6.4% 27.7% 1.3% 6.1% 32.9% 2.1% 0.3% -5.1% -0.8% 0.1% -0.3% -0.4% -0.5%Consumer Staples 4.1 18.5 0.7 6.5 29.7 2.1 -2.5 -11.2 -1.4 -0.2 -0.7 0.2 -0.8Energy 15.3 9.9 1.8 14.2 10.5 1.4 1.1 -0.6 0.4 0.0 0.0 -0.1 -0.1Financials 22.8 28.6 6.5 25.1 17.3 4.8 -2.2 11.3 1.6 0.0 2.5 -0.2 2.4Health Care 1.8 17.0 0.3 1.4 27.0 0.2 0.4 -9.9 0.1 0.0 -0.3 0.1 -0.2Industrials 6.8 26.2 1.8 6.8 29.8 2.0 0.0 -3.6 -0.1 0.1 -0.2 0.0 -0.1Information Technology 14.0 11.4 1.8 13.2 16.6 1.5 0.7 -5.2 0.2 0.3 -0.6 -0.1 -0.5Materials 12.3 13.9 1.7 14.7 23.1 3.3 -2.4 -9.2 -1.6 0.0 -1.3 0.2 -1.1Telecomm. Services 11.9 15.4 2.0 8.3 15.0 1.4 3.5 0.4 0.6 -0.1 0.0 0.0 -0.1Utilities 4.6 7.3 0.2 3.6 8.4 0.3 1.0 -1.1 -0.1 -0.1 0.0 0.0 -0.1
Total 100.0% 18.2% 18.2% 100.0% 19.2% 19.2% 0.0% -1.0% -1.0% 0.1% -0.8% -0.2% -1.0%
SectorSelection
EffectTotalEffect
InteractionEffect
PercentContribution
vs. IndexAllocation
Effect
RelativeWeight
vs. IndexExcessReturn
Return bySector
PercentContribution
AverageSectorWeight
Return bySector
PercentContribution
AverageSectorWeight
Attribution AnalysisMSCI EM VarianceEmerging Markets Value
*Representative institutional account - Where applicable, excludes cash, ETFs and futuresPerformance history of less than two years may not provide an adequate basis from which to determine the performance of a strategy. Past performance of such astrategy is not a guarantee of any future results. The information shown above is supplemental to a fully compliant GIPS presentation that can be found at the end ofthis book along with other important disclosures. There may be material differences between the representative account and other accounts managed with thesame strategy. Because of these differences, the information based on the representative account should not necessarily be relied upon. No investment strategyor risk management technique can guarantee returns or eliminate risk in any market environment. Sector weights are subject to change without notice.
January 1, 2010 – December 31, 2010

LADWP3/9/11
Emerging Markets Value Equity: Performance Attribution Analysis*
36
Individual Stock Contributors to Equity Return — January 1, 2010 – December 31, 2010
Emerging Markets Value
Added Value
Cia Vale do Rio Doce Ord Sh 0.7% 19.4% 1.4%Malayan Banking Bhd 0.7 44.4 0.8State Bank of India 0.6 30.8 1.5Samsung Electronics Co. Ltd. 0.6 23.8 2.2Kasikornbank PCL 0.5 67.9 0.7Gazprom OAO 0.5 6.5 2.9Cosco Pacific Ltd. 0.5 40.5 0.2Itau Unibanco Banco Multiplo SA 0.4 10.7 1.4Bank of India 0.4 24.4 0.6PTT PCL 0.4 49.0 0.5
5.3% 12.2%
Ending Weight
PercentContribution
StockReturn
Subtracted Value
Petrobras Petroleo Brasileiro -0.4% -19.1% 4.3%Fuqi International Inc. -0.4 -61.9 0.0Renhe Commercial Holdings Co. -0.2 -17.9 0.9Tong Yang Life Insurance Co. Ltd. -0.2 -12.6 0.7Redecard S/A -0.1 -17.7 0.9Global Bio-Chem Tech. Group -0.1 -28.8 0.5Nongshim Co. Ltd. -0.1 -14.7 0.8POSCO -0.1 -17.8 1.3China Power International Devel. -0.1 -16.1 0.4Mahanagar Telephone Nigam Ltd. -0.1 -22.3 0.3
-1.8% 10.1%
Ending Weight
PercentContribution
StockReturn
Added Value
Novolipetsk Steel OJSC 2.4% 66.3% 0.0%Novatek 0.6 80.2 0.0CNOOC Ltd. 0.5 55.5 1.1HTC Corp. 0.5 196.0 0.5Cia Vale do Rio Doce Pfd Sh -A- 0.4 23.1 1.5America Movil S.A.B. de C.V. 0.4 23.2 1.5Samsung Electronics Co. Ltd. 0.4 23.8 2.4Taiwan Semiconductor Manuf. 0.3 26.8 1.5Infosys Technologies Ltd. 0.3 40.4 0.9MTN Group Ltd. 0.3 30.6 0.9
6.1% 10.3%
Ending Weight
PercentContribution
StockReturn
Subtracted Value
Petrobras Petroleo Brasileiro -0.4% -19.1% 3.2%POSCO -0.3 -17.8 0.7China Life Insurance Co. (China) -0.2 -15.6 0.8Hon Hai Precision Industry Co. Ltd. -0.2 -3.3 0.9MediaTek Inc. -0.1 -12.9 0.3China Shenhua Energy Co. Ltd. -0.1 -12.7 0.4Rosneft -0.1 -12.9 0.3AU Optronics Corp. -0.1 -14.3 0.2Gerdau S.A. -0.1 -17.0 0.2Industrial & Comm. Bank of China -0.1 -5.4 1.2
-1.7% 8.2%
Ending Weight
PercentContribution
StockReturn
MSCI EM
*Representative institutional account - Where applicable, excludes cash, ETFs and futuresStock returns represent in-portfolio holdings. Performance history of less than two years may not provide an adequate basis from which to determine the performanceof a strategy. Past performance of such a strategy is not a guarantee of any future results. The information shown above is supplemental to a fully compliant GIPSpresentation that can be found at the end of this book along with other important disclosures. There may be material differences between the representative accountand other accounts managed with the same strategy. Because of these differences, the information based on the representative account should not necessarily berelied upon. It should not be assumed that securities identified were or will be profitable or that decisions we make in the future will be profitable. Certain securitiesmay not remain in the portfolio at the time that you receive this report. A full list of holdings is available upon request. No investment strategy or risk managementtechnique can guarantee returns or eliminate risk in any market environment.

LADWP3/9/11
37
Country Weights and Portfolio Structure
LADWP3/9/11
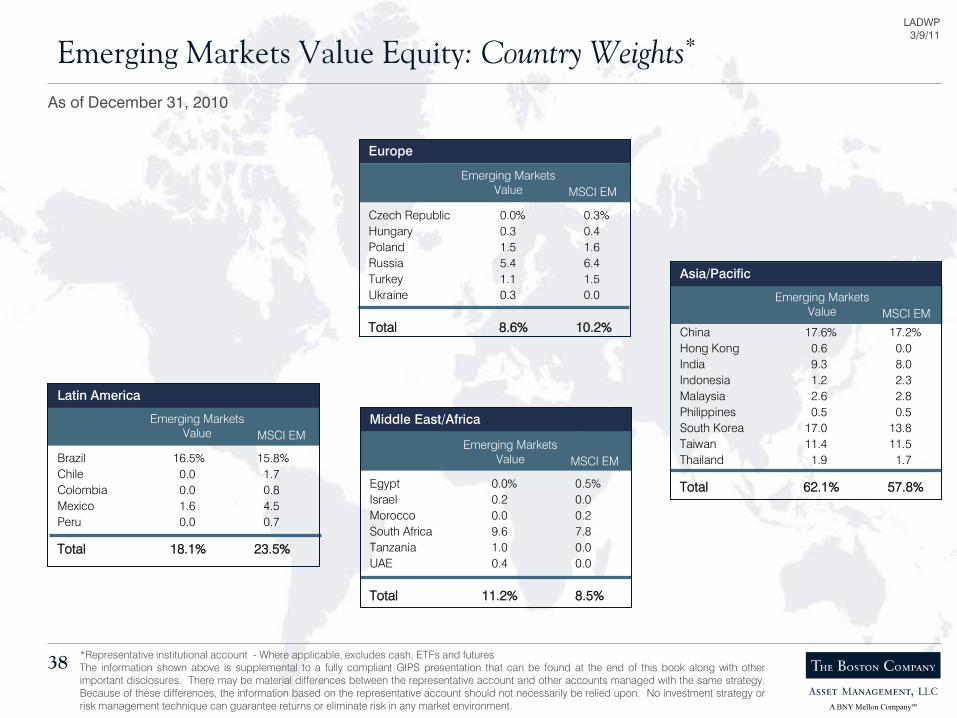
Czech Republic 0.0% 0.3%Hungary 0.3 0.4Poland 1.5 1.6Russia 5.4 6.4Turkey 1.1 1.5Ukraine 0.3 0.0
Total 8.6% 10.2%
Brazil 16.5% 15.8%Chile 0.0 1.7Colombia 0.0 0.8Mexico 1.6 4.5Peru 0.0 0.7
Total 18.1% 23.5%
China 17.6% 17.2%Hong Kong 0.6 0.0India 9.3 8.0Indonesia 1.2 2.3Malaysia 2.6 2.8Philippines 0.5 0.5South Korea 17.0 13.8Taiwan 11.4 11.5Thailand 1.9 1.7
Total 62.1% 57.8%Egypt 0.0% 0.5%Israel 0.2 0.0Morocco 0.0 0.2South Africa 9.6 7.8Tanzania 1.0 0.0UAE 0.4 0.0
Total 11.2% 8.5%
Emerging Markets Value Equity: Country Weights*
38
As of December 31, 2010
Latin America
Europe
Emerging MarketsValue MSCI EM
Asia/Pacific
Middle East/AfricaEmerging MarketsValue MSCI EM
Emerging MarketsValue MSCI EM
Emerging MarketsValue MSCI EM
*Representative institutional account - Where applicable, excludes cash, ETFs and futuresThe information shown above is supplemental to a fully compliant GIPS presentation that can be found at the end of this book along with otherimportant disclosures. There may be material differences between the representative account and other accounts managed with the same strategy.Because of these differences, the information based on the representative account should not necessarily be relied upon. No investment strategy orrisk management technique can guarantee returns or eliminate risk in any market environment.

LADWP3/9/11
Emerging Markets Value Equity: Portfolio Structure*
39
3
7
15
13
7
1
25
14
7
7
5
11
11
15
5
2
24
17
5
6
0 5 10 15 20 25 30
Emerging Markets Value
MSCI EM
Characteristics
Emerging Markets Value
Price/Earnings Ratio 9.8x 11.7x
Price/Book Value Ratio 1.4x 2.1x
Dividend Yield 2.5% 2.1%
Wtd. Avg. Market Cap $40.1B $61.5B
Number of Holdings 148 802
MSCI EM
Economic Sector Weights (%)
Consumer Discretionary
Consumer Staples
Energy
Financials
Health Care
Industrials
Information Technology
Materials
TelecommunicationServices
Utilities
As of December 31, 2010
*Representative institutional account - Where applicable, excludes cash, ETFs and futuresThe information shown above is supplemental to a fully compliant GIPS presentation that can be found at the end of this book along with other importantdisclosures. There may be material differences between the representative account and other accounts managed with the same strategy. Because of thesedifferences, the information based on the representative account should not necessarily be relied upon. It should not be assumed that securities identified were orwill be profitable or that decisions we make in the future will be profitable. Certain securities may not remain in the portfolio at the time that you receive this report. Afull list of holdings is available upon request. No investment strategy or risk management technique can guarantee returns or eliminate risk in any marketenvironment.
Top Ten Active Weights
Company EM ValueCountry Sector MSCI EM
Standard Bank Group Ltd. South Africa Financials 2.2 0.5State Bank of India India Financials 1.5 0.1Bharti Airtel Ltd. India Telecomm. Services 1.3 0.0KB Financial Group Inc. South Korea Financials 1.6 0.4PetroChina Co. Ltd. China Energy 1.9 0.7Gazprom OAO Russia Energy 2.9 1.7Quanta Computer Inc. Taiwan Info. Technology 1.3 0.1Petrobras Petroleo Brasileiro Brazil Energy 4.3 3.2Reliance Industries Ltd. India Energy 1.8 0.8VimpelCom Ltd. ADS Russia Telecomm. Services 1.0 0.0
Total 19.8% 7.5%
LADWP3/9/11
40
Portfolio Holdings, Fees & Disclosures
LADWP3/9/11
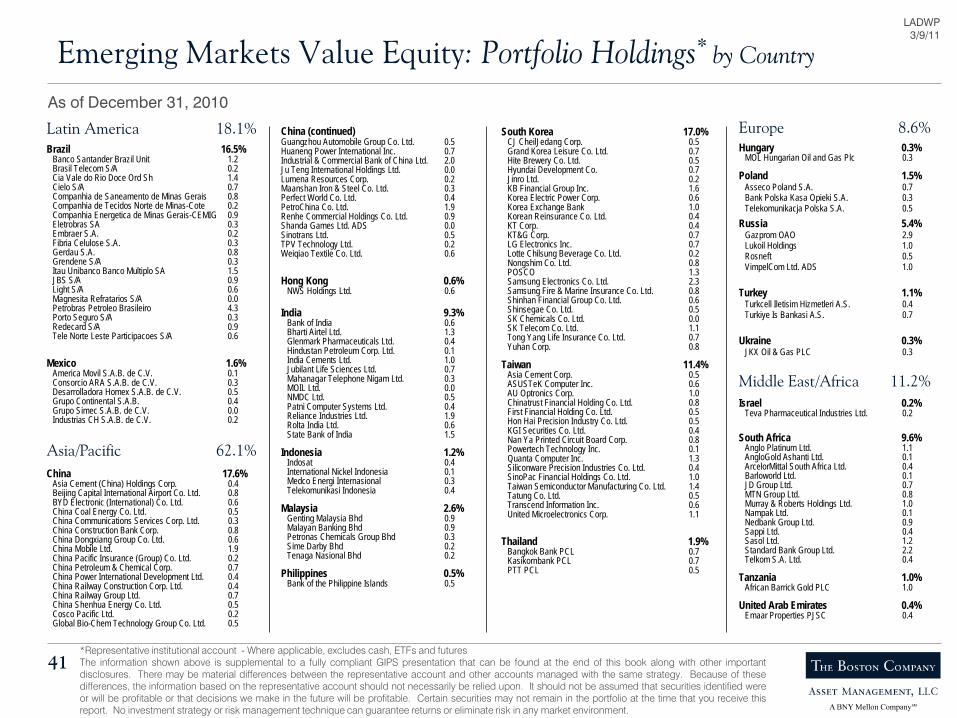
Emerging Markets Value Equity: Portfolio Holdings* by Country
41
Latin America 18.1%Brazil 16.5%
Banco Santander Brazil Unit 1.2Brasil Telecom S/A 0.2Cia Vale do Rio Doce Ord Sh 1.4Cielo S/A 0.7Companhia de Saneamento de Minas Gerais 0.8Companhia de Tecidos Norte de Minas-Cote 0.2Companhia Energetica de Minas Gerais-CEMIG 0.9Eletrobras SA 0.3Embraer S.A. 0.2Fibria Celulose S.A. 0.3Gerdau S.A. 0.8Grendene S/A 0.3Itau Unibanco Banco Multiplo SA 1.5JBS S/A 0.9Light S/A 0.6Magnesita Refratarios S/A 0.0Petrobras Petroleo Brasileiro 4.3Porto Seguro S/A 0.3Redecard S/A 0.9Tele Norte Leste Participacoes S/A 0.6
Mexico 1.6%America Movil S.A.B. de C.V. 0.1Consorcio ARA S.A.B. de C.V. 0.3Desarrolladora Homex S.A.B. de C.V. 0.5Grupo Continental S.A.B. 0.4Grupo Simec S.A.B. de C.V. 0.0Industrias CH S.A.B. de C.V. 0.2
Asia/Pacific 62.1%China 17.6%
Asia Cement (China) Holdings Corp. 0.4Beijing Capital International Airport Co. Ltd. 0.8BYD Electronic (International) Co. Ltd. 0.6China Coal Energy Co. Ltd. 0.5China Communications Services Corp. Ltd. 0.3China Construction Bank Corp. 0.8China Dongxiang Group Co. Ltd. 0.6China Mobile Ltd. 1.9China Pacific Insurance (Group) Co. Ltd. 0.2China Petroleum & Chemical Corp. 0.7China Power International Development Ltd. 0.4China Railway Construction Corp. Ltd. 0.4China Railway Group Ltd. 0.7China Shenhua Energy Co. Ltd. 0.5Cosco Pacific Ltd. 0.2Global Bio-Chem Technology Group Co. Ltd. 0.5
China (continued)Guangzhou Automobile Group Co. Ltd. 0.5Huaneng Power International Inc. 0.7Industrial & Commercial Bank of China Ltd. 2.0Ju Teng International Holdings Ltd. 0.0Lumena Resources Corp. 0.2Maanshan Iron & Steel Co. Ltd. 0.3Perfect World Co. Ltd. 0.4PetroChina Co. Ltd. 1.9Renhe Commercial Holdings Co. Ltd. 0.9Shanda Games Ltd. ADS 0.0Sinotrans Ltd. 0.5TPV Technology Ltd. 0.2Weiqiao Textile Co. Ltd. 0.6
Hong Kong 0.6%NWS Holdings Ltd. 0.6
India 9.3%Bank of India 0.6Bharti Airtel Ltd. 1.3Glenmark Pharmaceuticals Ltd. 0.4Hindustan Petroleum Corp. Ltd. 0.1India Cements Ltd. 1.0Jubilant Life Sciences Ltd. 0.7Mahanagar Telephone Nigam Ltd. 0.3MOIL Ltd. 0.0NMDC Ltd. 0.5Patni Computer Systems Ltd. 0.4Reliance Industries Ltd. 1.9Rolta India Ltd. 0.6State Bank of India 1.5
Indonesia 1.2%Indosat 0.4International Nickel Indonesia 0.1Medco Energi Internasional 0.3Telekomunikasi Indonesia 0.4
Malaysia 2.6%Genting Malaysia Bhd 0.9Malayan Banking Bhd 0.9Petronas Chemicals Group Bhd 0.3Sime Darby Bhd 0.2Tenaga Nasional Bhd 0.2
Philippines 0.5%Bank of the Philippine Islands 0.5
South Korea 17.0%CJ CheilJedang Corp. 0.5Grand Korea Leisure Co. Ltd. 0.7Hite Brewery Co. Ltd. 0.5Hyundai Development Co. 0.7Jinro Ltd. 0.2KB Financial Group Inc. 1.6Korea Electric Power Corp. 0.6Korea Exchange Bank 1.0Korean Reinsurance Co. Ltd. 0.4KT Corp. 0.4KT&G Corp. 0.7LG Electronics Inc. 0.7Lotte Chilsung Beverage Co. Ltd. 0.2Nongshim Co. Ltd. 0.8POSCO 1.3Samsung Electronics Co. Ltd. 2.3Samsung Fire & Marine Insurance Co. Ltd. 0.8Shinhan Financial Group Co. Ltd. 0.6Shinsegae Co. Ltd. 0.5SK Chemicals Co. Ltd. 0.0SK Telecom Co. Ltd. 1.1Tong Yang Life Insurance Co. Ltd. 0.7Yuhan Corp. 0.8
Taiwan 11.4%Asia Cement Corp. 0.5ASUSTeK Computer Inc. 0.6AU Optronics Corp. 1.0Chinatrust Financial Holding Co. Ltd. 0.8First Financial Holding Co. Ltd. 0.5Hon Hai Precision Industry Co. Ltd. 0.5KGI Securities Co. Ltd. 0.4Nan Ya Printed Circuit Board Corp. 0.8Powertech Technology Inc. 0.1Quanta Computer Inc. 1.3Siliconware Precision Industries Co. Ltd. 0.4SinoPac Financial Holdings Co. Ltd. 1.0Taiwan Semiconductor Manufacturing Co. Ltd. 1.4Tatung Co. Ltd. 0.5Transcend Information Inc. 0.6United Microelectronics Corp. 1.1
Thailand 1.9%Bangkok Bank PCL 0.7Kasikornbank PCL 0.7PTT PCL 0.5
Europe 8.6%Hungary 0.3%
MOL Hungarian Oil and Gas Plc 0.3
Poland 1.5%Asseco Poland S.A. 0.7Bank Polska Kasa Opieki S.A. 0.3Telekomunikacja Polska S.A. 0.5
Russia 5.4%Gazprom OAO 2.9Lukoil Holdings 1.0Rosneft 0.5VimpelCom Ltd. ADS 1.0
Turkey 1.1%Turkcell Iletisim Hizmetleri A.S. 0.4Turkiye Is Bankasi A.S. 0.7
Ukraine 0.3%JKX Oil & Gas PLC 0.3
Middle East/Africa 11.2%Israel 0.2%
Teva Pharmaceutical Industries Ltd. 0.2
South Africa 9.6%Anglo Platinum Ltd. 1.1AngloGold Ashanti Ltd. 0.1ArcelorMittal South Africa Ltd. 0.4Barloworld Ltd. 0.1JD Group Ltd. 0.7MTN Group Ltd. 0.8Murray & Roberts Holdings Ltd. 1.0Nampak Ltd. 0.1Nedbank Group Ltd. 0.9Sappi Ltd. 0.4Sasol Ltd. 1.2Standard Bank Group Ltd. 2.2Telkom S.A. Ltd. 0.4
Tanzania 1.0%African Barrick Gold PLC 1.0
United Arab Emirates 0.4%Emaar Properties PJSC 0.4
As of December 31, 2010
*Representative institutional account - Where applicable, excludes cash, ETFs and futuresThe information shown above is supplemental to a fully compliant GIPS presentation that can be found at the end of this book along with other importantdisclosures. There may be material differences between the representative account and other accounts managed with the same strategy. Because of thesedifferences, the information based on the representative account should not necessarily be relied upon. It should not be assumed that securities identified wereor will be profitable or that decisions we make in the future will be profitable. Certain securities may not remain in the portfolio at the time that you receive thisreport. No investment strategy or risk management technique can guarantee returns or eliminate risk in any market environment.

LADWP3/9/11
Emerging Markets Value Equity: Portfolio Holdings* by Sector
42
As of December 31, 2010Consumer Discretionary 5.6%
China Dongxiang Group Co. Ltd. 0.6Companhia de Tecidos Norte de Minas-Cote 0.2Consorcio ARA S.A.B. de C.V. 0.3Desarrolladora Homex S.A.B. de C.V. 0.5Genting Malaysia Bhd 0.9Grand Korea Leisure Co. Ltd. 0.7Grendene S/A 0.3Guangzhou Automobile Group Co. Ltd. 0.5JD Group Ltd. 0.7Weiqiao Textile Co. Ltd. 0.6
Consumer Staples 4.6%CJ CheilJedang Corp. 0.5Grupo Continental S.A.B. 0.4Hite Brewery Co. Ltd. 0.5JBS S/A 0.9Jinro Ltd. 0.2KT&G Corp. 0.7Lotte Chilsung Beverage Co. Ltd. 0.2Nongshim Co. Ltd. 0.8Shinsegae Co. Ltd. 0.5
Energy 16.7%China Coal Energy Co. Ltd. 0.5China Petroleum & Chemical Corp. 0.7China Shenhua Energy Co. Ltd. 0.5Gazprom OAO 2.9Hindustan Petroleum Corp. Ltd. 0.1JKX Oil & Gas PLC 0.3Lukoil Holdings 1.0Medco Energi Internasional 0.3MOL Hungarian Oil and Gas Plc 0.3Petrobras Petroleo Brasileiro 4.3PetroChina Co. Ltd. 1.9PTT PCL 0.5Reliance Industries Ltd. 1.9Rosneft 0.5Sasol Ltd. 1.2
Financials 23.9%Banco Santander Brazil Unit 1.2Bangkok Bank PCL 0.7Bank of India 0.6Bank of the Philippine Islands 0.5Bank Polska Kasa Opieki S.A. 0.3China Construction Bank Corp. 0.8China Pacific Insurance (Group) Co. Ltd. 0.2Chinatrust Financial Holding Co. Ltd. 0.8Emaar Properties PJSC 0.4First Financial Holding Co. Ltd. 0.5Industrial & Commercial Bank of China Ltd. 2.0Itau Unibanco Banco Multiplo SA 1.5Kasikornbank PCL 0.7KB Financial Group Inc. 1.6KGI Securities Co. Ltd. 0.4Korea Exchange Bank 1.0Korean Reinsurance Co. Ltd. 0.4Malayan Banking Bhd 0.9Nedbank Group Ltd. 0.9Porto Seguro S/A 0.3Renhe Commercial Holdings Co. Ltd. 0.9Samsung Fire & Marine Insurance Co. Ltd. 0.8Shinhan Financial Group Co. Ltd. 0.6SinoPac Financial Holdings Co. Ltd. 1.0Standard Bank Group Ltd. 2.2State Bank of India 1.5Tong Yang Life Insurance Co. Ltd. 0.7Turkiye Is Bankasi A.S. 0.7
Health Care 2.0%Glenmark Pharmaceuticals Ltd. 0.4Jubilant Life Sciences Ltd. 0.7Teva Pharmaceutical Industries Ltd. 0.2Yuhan Corp. 0.8
Industrials 5.4%Barloworld Ltd. 0.1Beijing Capital International Airport Co. Ltd. 0.8China Railway Construction Corp. Ltd. 0.4China Railway Group Ltd. 0.7Cosco Pacific Ltd. 0.2Embraer S.A. 0.2Hyundai Development Co. 0.7Murray & Roberts Holdings Ltd. 1.0NWS Holdings Ltd 0.6Sime Darby Bhd 0.2Sinotrans Ltd. 0.5
Information Technology 15.3%Asseco Poland S.A. 0.7ASUSTeK Computer Inc. 0.6AU Optronics Corp. 1.0BYD Electronic (International) Co. Ltd. 0.6Cielo S/A 0.7Hon Hai Precision Industry Co. Ltd. 0.5Ju Teng International Holdings Ltd. 0.0LG Electronics Inc. 0.7Nan Ya Printed Circuit Board Corp. 0.8Patni Computer Systems Ltd. 0.4Perfect World Co. Ltd. 0.4Powertech Technology Inc. 0.1Quanta Computer Inc. 1.3Redecard S/A 0.9Rolta India Ltd. 0.6Samsung Electronics Co. Ltd. 2.3Shanda Games Ltd. ADS 0.0Siliconware Precision Industries Co. Ltd. 0.4Taiwan Semiconductor Manufacturing Co. Ltd. 1.4TPV Technology Ltd. 0.2Transcend Information Inc. 0.6United Microelectronics Corp. 1.1
Materials 11.1%African Barrick Gold PLC 1.0Anglo Platinum Ltd. 1.1AngloGold Ashanti Ltd. 0.1ArcelorMittal South Africa Ltd. 0.4Asia Cement (China) Holdings Corp. 0.4Asia Cement Corp. 0.5Cia Vale do Rio Doce Ord Sh 1.4Fibria Celulose S.A. 0.3Gerdau S.A. 0.8Global Bio-Chem Technology Group Co. Ltd. 0.5
Materials (continued)Grupo Simec S.A.B. de C.V. 0.0%India Cements Ltd. 1.0Industrias CH S.A.B. de C.V. 0.2International Nickel Indonesia 0.1Lumena Resources Corp. 0.2Maanshan Iron & Steel Co. Ltd. 0.3Magnesita Refratarios S/A 0.0MOIL Ltd. 0.0Nampak Ltd. 0.1NMDC Ltd. 0.5Petronas Chemicals Group Bhd 0.3POSCO 1.3Sappi Ltd. 0.4SK Chemicals Co. Ltd. 0.0
Telecommunication Services 10.9%
America Movil S.A.B. de C.V. 0.1Bharti Airtel Ltd. 1.3Brasil Telecom S/A 0.2China Communications Services Corp. Ltd. 0.3China Mobile Ltd. 1.9Indosat 0.4KT Corp. 0.4Mahanagar Telephone Nigam Ltd. 0.3MTN Group Ltd. 0.8SK Telecom Co. Ltd. 1.1Tatung Co. Ltd. 0.5Tele Norte Leste Participacoes S/A 0.6Telekomunikacja Polska S.A. 0.5Telekomunikasi Indonesia 0.4Telkom S.A. Ltd. 0.4Turkcell Iletisim Hizmetleri A.S. 0.4VimpelCom Ltd. ADS 1.0
Utilities 4.5%China Power International Development Ltd. 0.4Companhia de Saneamento de Minas Gerais 0.8Companhia Energetica de Minas Gerais 0.9Eletrobras SA 0.3Huaneng Power International Inc. 0.7Korea Electric Power Corp. 0.5Light S/A 0.6Tenaga Nasional Bhd 0.2
*Representative institutional account - Where applicable, excludes cash, ETFs and futuresThe information shown above is supplemental to a fully compliant GIPS presentation that can be found at the end of this book along with other importantdisclosures. There may be material differences between the representative account and other accounts managed with the same strategy. Because of thesedifferences, the information based on the representative account should not necessarily be relied upon. It should not be assumed that securities identified wereor will be profitable or that decisions we make in the future will be profitable. Certain securities may not remain in the portfolio at the time that you receive thisreport. No investment strategy or risk management technique can guarantee returns or eliminate risk in any market environment.

LADWP3/9/11
LADWP Fee Schedule
43
90 Basis Points on the First $25 Million
80 Basis Points Thereafter

LADWP3/9/11
Emerging Markets Value Equity: Disclosure
44

LADWP3/9/11
Emerging Markets Value Equity: Disclosure
45

LADWP3/9/11
Emerging Markets Value Equity: Disclosure
46
1000