van alstyne independent school district ... van alstyne independent school district annual financial...
TRANSCRIPT

1
VAN ALSTYNE INDEPENDENT SCHOOL DISTRICT
ANNUAL FINANCIAL REPORT
FOR THE YEAR ENDED AUGUST 31, 2016

2
VAN ALSTYNE INDEPENDENT SCHOOL DISTRICT ANNUAL FINANCIAL REPORT
FOR THE YEAR ENDED AUGUST 31, 2016
TABLE OF CONTENTS Exhibit Page Certificate of Board 3 Independent Auditors' Report 4 Management's Discussion and Analysis 6 Basic Financial Statements Government Wide Statements: A-1 Statement of Net Position 12 B-1 Statement of Activities 13 Governmental Fund Financial Statements: C-1 Balance Sheet 14 C-2 Reconciliation for C-1 15 C-3 Statement of Revenues, Expenditures, and Changes in Fund Balance 16 C-4 Reconciliation for C-3 17 Proprietary Fund Financial Statements: D-1 Statement of Net Position 18 D-2 Statement of Revenues, Expenses, and Changes in Fund Net Position 19 D-3 Statement of Cash Flows 20 Fiduciary Fund Financial Statements: E-1 Statement of Fiduciary Net Position 21 Notes to the Financial Statements 22 Required Supplementary Information G-1 Budgetary Comparison Schedule - General Fund 46 G-2 Schedule of the District’s Proportionate Share of the Net Pension Liability (TRS) 47 G-3 Schedule of District Contributions to Teacher Retirement System of Texas 48 Notes to Required Supplemental Information 49 Other Information-Combining Statements Nonmajor Governmental Funds: H-1 Combining Balance Sheet 52 H-2 Combining Statement of Revenues, Expenditures, and Changes in Fund Balances 56 Other Information-Required Texas Education Agency Schedules J-1 Schedule of Delinquent Taxes Receivable 60 J-2 Budgetary Comparison Schedule - Child Nutrition Fund 62 J-3 Budgetary Comparison Schedule - Debt Service Fund 63 Reports on Compliance & Internal Control Report on Internal Control Over Financial Reporting and on Compliance and Other Matters Based on an audit of Financial Statements Performed In Accordance with Government Auditing Standards 66 Schedule of Findings and Questioned Costs 68 Schedule of Status of Prior Findings 69 Corrective Action Plan 70

3
CERTIFICATE OF BOARD Van Alstyne Independent School District Grayson 091-908 Name of School District County Co.-Dist. Number
We, the undersigned, certify that the attached annual financial reports of the above-named school district were
reviewed and (check one) _________ approved _______ disapproved for the year ended August 31, 2016 at a
meeting of the Board of Trustees of such school district on the __12th__ day of ____December____ , 2016.
_______________________________________ ___________________________________ Signature of Board Secretary Signature of Board President If the Board of Trustees disapproved of the auditors' report, the reason(s) for disapproving it is(are): (attach list as necessary)

4
Morgan, Davis, & Company, P.C. Post Office Box 8158
Greenville, Texas 75404
Unmodified Opinions on Basic Financial Statements Accompanied by Required Supplementary Information and Other Information
Independent Auditor's Report
Van Alstyne Independent School District 549 Miller Lane Van Alstyne, Texas 75495 Report on the Financial Statements We have audited the accompanying financial statements of the governmental activities, each major fund, and the aggregate remaining fund information of Van Alstyne Independent School District as of and for the year ended August 31, 2016 and the related notes to the financial statements, which collectively comprise the District's basic financial statements as listed in the table of contents. Management's Responsibility for the Financial Statements Management is responsible for the preparation and fair presentation of these financial statements in accordance with accounting principles generally accepted in the United States of America; this includes the design, implementation, and maintenance of internal control relevant to the preparation and fair presentation of financial statements that are free from material misstatement, whether due to fraud or error.
Auditor's Responsibility Our responsibility is to express opinions on these financial statements based on our audit. We conducted our audit in accordance with auditing standards generally accepted in the United States of America and the standards applicable to financial audits contained in Government Auditing Standards, issued by the Comptroller General of the United States. Those standards require that we plan and perform the audit to obtain reasonable assurance about whether the financial statements are free from material misstatement. An audit involves performing procedures to obtain audit evidence about the amounts and disclosures in the financial statements. The procedures selected depend on the auditor's judgment, including the assessment of the risks of material misstatement of the financial statements, whether due to fraud or error. In making those risk assessments, the auditor considers internal control relevant to the entity's preparation and fair presentation of the financial statements in order to design audit procedures that are appropriate in the circumstances, but not for the purpose of expressing an opinion on the effectiveness of the entity's internal control. Accordingly, we express no such opinion. An audit also includes evaluating the appropriateness of accounting policies used and the reasonableness of significant accounting estimates made by management, as well as evaluating the overall presentation of the financial statements. We believe that the audit evidence we have obtained is sufficient and appropriate to provide a basis for our audit opinions. Opinions In our opinion, the financial statements referred to above present fairly, in all material respects, the respective financial position of the governmental activities, each major fund, and the aggregate remaining fund information of Van Alstyne Independent School District as of August 31, 2016 and the respective changes in financial position and, where applicable, cash flows thereof for the year then ended in accordance with accounting principles generally accepted in the United States of America. Other Matters Required Supplementary Information: Accounting principles generally accepted in the United States of America require that the Management's Discussion and Analysis on pages 6-10 and the Schedules contained in Exhibits G-1, G-2, & G-3 on pages 46-49 be presented to supplement the basic financial statements. Such information, although not a part of the basic financial statements, is required by the Governmental Accounting Standards Board who considers it to be an essential part of financial

5
reporting for placing the basic financial statements in an appropriate operational, economic, or historical context. We have applied certain limited procedures to the required supplementary information in accordance with auditing standards generally accepted in the United States of America, which consisted of inquiries of management about the methods of preparing the information and comparing the information for consistency with management's responses to our inquiries, the basic financial statements, and other knowledge we obtained during our audit of the basic financial statements. We do not express an opinion or provide any assurance on the information because the limited procedures do not provide us with sufficient evidence to express an opinion or provide any assurance. Other Information: Our audit was conducted for the purpose of forming opinions on the financial statements that collectively comprise Van Alstyne Independent School District's basic financial statements. The Combining Statements for Nonmajor Governmental Funds contained in Exhibits H-1 & H-2 on pages 52-58 are presented for purposes of additional analysis and are not a required part of the basic financial statements. The Combining Statements for Nonmajor Governmental Funds are the responsibility of management and were derived from and relates directly to the underlying accounting and other records used to prepare the basic financial statements. Such information has been subjected to the auditing procedures applied in the audit of the basic financial statements and certain additional procedures, including comparing and reconciling such information directly to the underlying accounting and other records used to prepare the basic financial statements or to the basic financial statements themselves, and other additional procedures in accordance with auditing standards generally accepted in the United States of America. In our opinion, the Combining Statements for Nonmajor Governmental Funds are fairly stated, in all material respects, in relation to the basic financial statements as a whole. The Texas Education Agency requires school districts to include certain information in the Annual Financial and Compliance Report in conformity with laws and regulations of the State of Texas. This information is in Exhibits identified in the Table of Contents as J-1, J-2, & J-3. We have applied certain limited procedures to this supplementary information in accordance with auditing standards generally accepted in the United States of America, which consisted on inquiries of management about methods of preparing the information and comparing the information for consistency with management’s responses to our inquiries, the basic financial statements, and other knowledge we obtained during our audit of the basic financial statements. We do not express an opinion or provide any assurance on the information because the limited procedures do not provide us with sufficient evidence to express an opinion or provide any assurance. Other Reporting Required by Government Auditing Standard In accordance with Government Auditing Standards, we have also issued our report dated November 22, 2016 on our consideration of Van Alstyne Independent School District's internal control over financial reporting and on our tests of its compliance with certain provisions of laws, regulations, contracts, and grant agreements and other matters. The purpose of that report is to describe the scope of our testing of internal control over financial reporting and compliance and the results of that testing, and not to provide an opinion on internal control over financial reporting or on compliance. That report is an integral part of an audit performed in accordance with Government Auditing Standards in considering Van Alstyne Independent School District's internal control over financial reporting and compliance. /s/ Morgan, Davis, & Company, P.C. ________________________________ Morgan, Davis, & Company, P.C. Greenville, Texas November 22, 2016

6
VAN ALSTYNE INDEPENDENT SCHOOL DISTRICT MANAGEMENT'S DISCUSSION AND ANALYSIS
FOR THE YEAR ENDED AUGUST 31, 2016 In this section of the Annual Financial and Compliance Report, we, the administrators of Van Alstyne Independent School District, discuss and analyze the District's financial performance for the fiscal year ended August 31, 2016. Please read it in conjunction with the District's Basic Financial Statements which follow this section. FINANCIAL HIGHLIGHTS · The District's total combined net position increased by $819,039 as a result of this year's operations. · The District’s assets exceeded its liabilities at the close of the most recent fiscal year by $3,603,234 which
represents the District’s total combined net position. Of this amount, $3,905,463 (unrestricted net position) may be used to meet the District’s ongoing obligations.
· As of August 31, 2016, the District’s governmental funds reported a combined fund balance of $5,062,258
compared to $5,426,484 for the last fiscal year. The General Fund reported a fund balance of $4,801,835 this fiscal year compared to $3,266,920 the last fiscal year.
· The District’s total tax rate for the 2015-2016 school year was $ 1.52 with $ 1.12 for maintenance & operation
and $ 0.40 for debt service. USING THIS ANNUAL REPORT This annual report consists of a series of financial statements. The government-wide financial statements include the Statement of Net Position and the Statement of Activities (on pages 12 and 13). These provide information about the activities of the District as a whole and present a longer-term view of the District's property and debt obligations and other financial matters. They reflect the flow of total economic resources in a manner similar to the financial reports of a business enterprise. Fund financial statements (starting on page 14) report the District's operations in more detail than the government-wide statements by providing information about the District's most significant funds. For governmental activities, these statements tell how services were financed in the short term as well as what resources remain for future spending. They reflect the flow of current financial resources, and supply the basis for tax levies and the appropriations budget. For proprietary activities, fund financial statements tell how goods or services of the District were sold to departments within the District or to external customers and how the sales revenues covered the expenses of the goods or services. The remaining statements, fiduciary statements, provide financial information about activities for which the District acts solely as a trustee or agent for the benefit of those outside of the district. The notes to the financial statements (starting on page 22) provide narrative explanations or additional data needed for full disclosure in the government-wide statements or the fund financial statements. The combining statements for nonmajor funds contain even more information about the District's individual funds. These are not required by T.E.A. The section labeled Required Texas Education Agency Schedules contains data used by monitoring or regulatory agencies for assurance that the District is using funds supplied in compliance with the terms of grants.

7
Reporting the District as a Whole The Statement of Net Position and the Statement of Activities The analysis of the District's overall financial condition and operations begins on page 12. Its primary purpose is to show whether the District is better off or worse off as a result of the year's activities. The Statement of Net Position includes all the District's assets and liabilities at the end of the year while the Statement of Activities includes all the revenues and expenses generated by the District's operations during the year. These apply the accrual basis of accounting which is the basis used by private sector companies. All of the current year's revenues and expenses are taken into account regardless of when cash is received or paid. The District's revenues are divided into those provided by outside parties who share the costs of some programs, such as tuition received from students from outside the district and grants provided by the U.S. Department of Education to assist children with disabilities of from disadvantaged backgrounds (program revenues), and revenues provided by the taxpayers or by TEA in equalization funding processes (general revenues). All the District's assets are reported whether they serve the current year or future years. Liabilities are considered regardless of whether they must be paid in the current or future years. These two statements report the District's net position and changes in them. The District's net position (the difference between assets and liabilities) provide one measure of the District's financial health, or financial position. Over time, increases or decreases in the District's net position are one indicator of whether its financial health is improving or deteriorating. To fully assess the overall health of the District, however, you should consider non-financial factors as well, such as changes in the District's average daily attendance or its property tax base and the condition of the District's facilities. In the Statement of Net Position and the Statement of Activities, the District has one kind of activity: · Governmental activities–All of the District's basic services are reported here, including the instruction,
counseling, co-curricular activities, food services, transportation, maintenance, community services, and general administration. Property taxes, tuition, fees, and state and federal grants finance most of these activities.
Reporting the District's Most Significant Funds Fund Financial Statements The fund financial statements begin on page 14 and provide detailed information about the most significant funds–not the District as a whole. Laws and contracts require the District to establish some funds, such as grants received under the ESEA Title 1 Part A from the U.S. Department of Education. The District's administration establishes many other funds to help it control and manage money for particular purposes. The District's two kinds of funds–governmental and proprietary–use different accounting approaches. · Governmental funds–Most of the District's basic services are reported in governmental funds. These use modified accrual accounting (a method that measures the receipt and disbursement of cash and all other financial assets that can be readily converted to cash) and report balances that are available for future spending. The governmental fund statements provide a detailed short-term view of the District's general operations and the basic services it provides. We describe the differences between governmental activities (reported in the Statement of Net Position and the Statement of Activities) and governmental funds in reconciliation schedules following each of the fund financial statements. · Proprietary funds–The District reports the activities for which it charges users (whether outside customers or other units of the District) in proprietary funds using the same accounting methods employed in the Statement of Net Position and the Statement of Activities. The internal service funds (a category of proprietary funds) report activities that provide services for the District's other programs and activities–such as the District's self-insurance programs.

8
The District as Trustee Reporting the District's Fiduciary Responsibilities The District is the trustee, or fiduciary, for money raised by student activities. All of the District's fiduciary activities are reported in separate Statements of Fiduciary Net Position on page 25. We exclude these resources from the District's other financial statements because the District cannot use these assets to finance its operations. The District is only responsible for ensuring that the assets reported in these funds are used for their intended purposes. GOVERNMENT-WIDE FINANCIAL ANALYSIS The District is presenting government-wide financial analysis in the form of current year data and prior year data and the changes in these accounts. Our analysis focuses on the net position (Table I) and changes in net position (Table II) of the District's governmental activities. Net position of the District's governmental activities increased from $2,784,195 last year to $3,603,234 at August 31, 2016. Unrestricted net position – the part of net position that can be used to finance day-to-day operations without constraints established by debt covenants, enabling legislation, or other legal requirements – increased from $2,531,047 last year to $3,905,463 at August 31, 2016. Changes in net position of the District's governmental activities were a $748,267 increase last year compared to a $819,039 increase at August 31, 2016.
Governmental GovernmentalActivities Activities Net Change8/31/2016 8/31/2015
Current and other assets $5,957,357 $6,405,787 ($448,430)Capital assets 36,587,402 36,058,007 529,395Total assets $42,544,759 $42,463,794 $80,965Deferred Outflows $1,267,997 $298,351 $969,646
Current and other liabilities $629,112 $746,766 ($117,654)Long-term liabilities 37,220,341 38,040,645 (820,304)Net Pension Liability (District's Share) 2,196,637 911,660 1,284,977Total liabilities $40,046,090 $39,699,071 $347,019Deferred Inflows $163,432 $278,879 ($115,447)
Net Position:Net Investment in Capital Assets ($632,939) ($164,701) ($468,238)Restricted 330,710 417,849 (87,139)Unrestricted 3,905,463 2,531,047 1,374,416Total net position $3,603,234 $2,784,195 $819,039
Table IVan Alstyne Independent School District
NET POSITION

9
Governmental GovernmentalActivities Activities Net Change
Yr Ended 8/31/2016 Yr Ended 8/31/2015Revenues:Program Revenues: Charges for Services $986,292 $803,387 $182,905 Operating grants and contributions 1,247,401 1,002,062 245,339General Revenues:Maintenance and operations taxes 5,792,951 5,564,696 228,255Debt service taxes 2,069,361 1,987,823 81,538State aid - formula grants 6,132,133 5,432,356 699,777Grants & Contributions not restricted to specific functions 86,153 57,209 28,944Investment Earnings 35,005 49,783 (14,778)Miscellaneous 92,096 106,259 (14,163)Total Revenue $16,441,392 $15,003,575 $1,437,817
Expenses:Instruction, curriculum and media services $7,732,268 $7,359,165 $373,103Instructional and school leadership 765,629 643,343 122,286Student support services 627,349 516,683 110,666Child nutrition 620,094 517,787 102,307Co curricular activities 1,217,565 1,094,677 122,888General administration 635,898 390,041 245,857Plant maintenance, security & data processing 1,896,490 1,892,286 4,204Community services 45,933 35,848 10,085Debt services 1,719,102 1,425,796 293,306Payments to fiscal agents 227,664 250,245 (22,581)Other intergovernmental charges 134,361 129,437 4,924 Total Expenses $15,622,353 $14,255,308 $1,367,045
Increase in net position before transfers and special items $819,039 $748,267 $70,772
Transfers 0 0 0Special Items 0 0 0Net Position at Beginning of Fiscal Year 2,784,195 3,068,841 (284,646)Prior Period Adjustment-Required by GASB 68 0 (1,032,913) 1,032,913Net Position at End of Fiscal Year $3,603,234 $2,784,195 $819,039
Table IIVan Alstyne Independent School District
CHANGES IN NET POSITION
THE DISTRICT'S FUNDS As the District completed the year, its governmental funds (as presented in Exhibit C-3 on page 18) reported a combined fund balance of $5,062,258 compared to $5,426,484 for the last fiscal year. The District’s General Fund reported a fund balance increase of $1,534,915, ending the year with $4,801,835. The District’s Special Revenue Funds reported a fund balance increase of $46,701, ending the year with $238,212. The District’s Debt Service Fund reported a fund balance decrease of $127,905, ending the year with $22,211. The District’s Capital Projects Fund reported a fund balance decrease of $1,817,937, ending the year with $0.

10
Over the course of the year, the Board of Trustees revised the District's budget several times. These budget amendments included amendments and supplemental appropriations that were approved shortly after the beginning of the year and reflect the actual beginning balances (versus the amounts we estimated in August 2015) and amendments moving funds from programs that did not need all the resources originally appropriated to them to programs with resource needs. CAPITAL ASSET AND DEBT ADMINISTRATION Capital Assets: During the year ended August 31, 2016, the District invested $1,796,903 in capital assets, consisting of land purchased, the completion of the elementary & high school additions, various facility improvements, a greenhouse, various equipment, a ford escape, and a school bus. Capital asset activity for the year ended August 31, 2016 was as follows:
Beginning Balance Additions Retirements
Ending Balance
Land $800,450 $18,336 $0 $818,786Buildings & Improvements 43,870,533 6,688,849 0 50,559,382Equipment 1,949,642 188,414 0 2,138,056Vehicles 1,010,192 111,586 1,121,778Construction in Progress 5,210,282 (5,210,282) 0 0Totals at Historical Cost 52,841,099 1,796,903 0 54,638,002Less accumulated depreciation for:Buildings & Improvements (14,836,290) (1,078,476) 0 (15,914,766)Equipment (1,511,907) (88,502) 0 (1,600,409)Vehicles (434,895) (100,530) 0 (535,425)Total accumulated depreciation (16,783,092) (1,267,508) 0 (18,050,600)
Capital Assets, Net $36,058,007 $529,395 $0 $36,587,402
Debt: At year-end August 31, 2016, the District had $37,220,341 outstanding in bonds compared to $37,994,871 last year. The District also had $0 outstanding in loans compared to $45,774 last year. During the year, the District issued Series 2016 refunding bonds of $6,295,000 to early redeem Series 2007 bonds of $6,625,000. The net present value of savings on the transaction was $860,904. ECONOMIC FACTORS AND NEXT YEAR'S BUDGETS AND RATES The District's elected and appointed officials considered many factors when setting the fiscal-year 2016 budget, and tax rates. Several of those factors were the economy, the District’s population growth, and unemployment. These factors were taken into account when adopting the General Fund budget for 2016. Amounts available for appropriation in the General Fund budget are $2,301,835. The District has added no major new programs or initiatives to the 2016 budget. CONTACTING THE DISTRICT'S FINANCIAL MANAGEMENT This financial report is designed to provide our citizens, taxpayers, customers, and investors and creditors with a general overview of the District's finances and to show the District's accountability for the money it receives. If you have questions about this report or need additional financial information, contact the District's business office, at Van Alstyne Independent School District, 549 Miller Lane, Van Alstyne, Texas.

11
BASIC FINANCIAL STATEMENTS

EXHIBIT A-1VAN ALSTYNE INDEPENDENT SCHOOL DISTRICT
STATEMENT OF NET POSITIONAUGUST 31, 2016
Control
Data
Codes
Governmental
Activities
Primary Government
ASSETS422,438 Cash and Cash Equivalents $1110
4,600,927 Current Investments1120
316,867 Property Taxes Receivable (Delinquent)1220
(4,088)Allowance for Uncollectible Taxes1230
621,213 Due from Other Governments1240
Capital Assets:
818,786 Land1510
34,644,616 Buildings, Net1520
537,647 Equipment, Net1530
586,353 Vehicles, Net1540
Total Assets1000 42,544,759
DEFERRED OUTFLOWS OF RESOURCES1,267,997 Deferred Outflow Related to TRS1705
Total Deferred Outflows of Resources1700 1,267,997
LIABILITIES36,928 Accounts Payable2110
52,107 Interest Payable2140
68,824 Payroll Deductions & Withholdings2150
406,082 Accrued Wages Payable2160
11,119 Due to Other Governments2180
8,319 Accrued Expenses2200
45,733 Unearned Revenue2300
Noncurrent Liabilities
1,050,000 Due Within One Year2501
36,170,341 Due in More Than One Year2502
2,196,637 Net Pension Liability (District's Share)2540
Total Liabilities2000 40,046,090
DEFERRED INFLOWS OF RESOURCES163,432 Deferred Inflow Related to TRS2605
Total Deferred Inflows of Resources2600 163,432
NET POSITION(632,939)Net Investment in Capital Assets3200
92,498 Restricted for Debt Service3850
140,057 Restricted for Campus Activities3870
7,955 Restricted for Scholarships3880
90,200 Restricted for Other Purposes3890
3,905,463 Unrestricted3900
Total Net Position3000 3,603,234 $
12The notes to the financial statements are an integral part of this statement.

EXHIBIT B-1VAN ALSTYNE INDEPENDENT SCHOOL DISTRICT
STATEMENT OF ACTIVITIESFOR THE YEAR ENDED AUGUST 31, 2016
Net (Expense)
Revenue and
Changes in Net
PositionProgram RevenuesData
Control
Codes
1 3 4 6
Operating
Grants and
Contributions
Charges for
ServicesExpenses
Governmental
Activities
Primary Gov.
Primary Government:
GOVERNMENTAL ACTIVITIES:214,563 7,422,068 984,454 (6,223,051)Instruction $ $ $ $11
- 148,259 - (148,259)Instructional Resources and Media Services12
- 161,941 - (161,941)Curriculum and Staff Development13
- 765,629 - (765,629)School Leadership23
- 230,585 - (230,585)Guidance, Counseling and Evaluation Services31
- 153,631 - (153,631)Health Services33
- 243,133 - (243,133)Student (Pupil) Transportation34
248,478 620,094 262,947 (108,669)Food Services35
513,278 1,217,565 - (704,287)Extracurricular Activities36
- 635,898 - (635,898)General Administration41
9,973 1,546,520 - (1,536,547)Facilities Maintenance and Operations51
- 12,356 - (12,356)Security and Monitoring Services52
- 337,614 - (337,614)Data Processing Services53
- 45,933 - (45,933)Community Services61
- 1,626,937 - (1,626,937)Debt Service - Interest on Long Term Debt72
- 92,165 - (92,165)Debt Service - Bond Issuance Cost and Fees73
- 227,664 - (227,664)Payments related to Shared Services Arrangements93
- 134,361 - (134,361)Other Intergovernmental Charges99
[TP] TOTAL PRIMARY GOVERNMENT: 15,622,353 986,292 1,247,401 (13,388,660)$ $ $
DataControlCodes General Revenues:
Taxes:5,792,951 Property Taxes, Levied for General PurposesMT
2,069,361 Property Taxes, Levied for Debt ServiceDT
6,132,133 State Aid - Formula GrantsSF
86,153 Grants and Contributions not RestrictedGC
35,005 Investment EarningsIE
92,096 Miscellaneous Local and Intermediate RevenueMI
14,207,699 Total General RevenuesTR
Net Position - Beginning
Change in Net Position
Net Position--Ending
CN
NB
NE
819,039
2,784,195
3,603,234 $
13The notes to the financial statements are an integral part of this statement.

EXHIBIT C-1VAN ALSTYNE INDEPENDENT SCHOOL DISTRICT
BALANCE SHEET
GOVERNMENTAL FUNDS
AUGUST 31, 2016
Control
Data
Codes
General
Fund Fund
Debt Service
50
Funds
Governmental
Other
Funds
Governmental
Total10
ASSETS12,935 112,130 245,708 370,773 Cash and Cash Equivalents $ $ $ $1110
273 4,600,654 - 4,600,927 Investments - Current1120
80,868 235,999 - 316,867 Property Taxes - Delinquent1220
(1,043)(3,045) - (4,088)Allowance for Uncollectible Taxes (Credit)1230
9,493 595,971 15,749 621,213 Receivables from Other Governments1240
Total Assets1000 5,541,709 102,526 261,457 5,905,692 $ $ $ $
LIABILITIES - 68,824 - 68,824 Payroll Deductions and Withholdings Payable $ $ $ $2150
- 383,847 22,235 406,082 Accrued Wages Payable2160
- 36,311 - 36,311 Due to Other Funds2170
490 10,629 - 11,119 Due to Other Governments2180
- 7,309 1,010 8,319 Accrued Expenditures2200
12,037 33,696 - 45,733 Unearned Revenues2300
Total Liabilities2000 540,616 12,527 23,245 576,388
DEFERRED INFLOWS OF RESOURCES67,788 199,258 - 267,046 Unavailable Revenue - Property Taxes2601
Total Deferred Inflows of Resources2600 199,258 67,788 - 267,046
FUND BALANCESRestricted Fund Balance:
22,211 - - 22,211 Retirement of Long-Term Debt3480
- - 7,955 7,955 Other Restricted Fund Balance3490
Committed Fund Balance: - 2,500,000 - 2,500,000 Construction3510
- - 230,257 230,257 Other Committed Fund Balance3545
- 2,301,835 - 2,301,835 Unassigned Fund Balance3600
Total Fund Balances3000 4,801,835 22,211 238,212 5,062,258
Total Liabilities, Deferred Inflows & Fund Balances4000 5,541,709 102,526 261,457 5,905,692 $ $ $ $
14
The notes to the financial statements are an integral part of this statement.

EXHIBIT C-2VAN ALSTYNE INDEPENDENT SCHOOL DISTRICT
RECONCILIATION OF THE GOVERNMENTAL FUNDS BALANCE SHEET TO THESTATEMENT OF NET POSITION
AUGUST 31, 2016
5,062,258 $Total Fund Balances - Governmental Funds
51,048 1 The District uses internal service funds to charge the costs of certain activities, such as self-insurance, to appropriate functions in other funds. The assets and liabilities of the internal service funds are included in governmental activities in the statement of net assets. The net effect of this consolidation is to increase(decrease) net position.
(2,931,885)2 Capital assets used in governmental activities are not financial resources and therefore are not reported in governmental funds. At the beginning of the year, the cost of these assets was $52,841,099 and the accumulated depreciation was $16,783,092. In addition, long-term liabilities, including bonds payable of $37,994,871, and loans payable of $45,774, are not due and payable in the current period, and, therefore are not reported as liabilities in the funds. Accrued interest payable on long term debt of $57,059 is not reflected in the fund financial statements, but is shown in the government-wide financialstatements. In addition, Deferred Outflows of $298,351, Deferred Inflows of $278,879, and Net Pension Liability of $911,660 related to TRS are not shown in the fund financial statements, but are shown in the government-wide financial statements.The net effect of including the beginning balances for capital assets (net of depreciation), long-term debt in the governmental activities, and deferred inflows, deferred outflows, & net pension liability related to TRS, is to increase (decrease) net position.
3,078,102 3 Current year capital outlays of $1,796,903 and long-term debt principal payments of $1,015,774 are expenditures in the fund financial statements,but they should be shown as increases in capital assets and reductions in long-term debt in the government-wide financial statements. Accretion on capital appreciation bonds of $22,328, amortization of bond premiums of $238,145, and interest payable of $4,952 are recorded in the government-wide financial statements. The net effect of including the current year capital outlays and debt principal payments is to increase (decrease) net position.
(199,884)4 Included in the items related to debt is the recognition of the District's proportionate share of the net pension liability required by GASB 68 in the amount of $1,284,977, a Deferred Resource Inflow related to TRS in the amount of $115,447 and a Deferred Resource Outflow related to TRS in the amount of $969,646. The net effect of these TRS amounts is to increase (decrease) net position.
(1,267,508)5 The current year depreciation expense increases accumulated depreciation. The net effect of the current year's depreciation is to decrease net position.
(188,897)6 Various other reclassifications and eliminations are necessary to convert from the modified accrual basis of accounting to accrual basis of accounting. These include recognizing unavailable revenue from property taxes of $267,046 as revenue, eliminating interfund transactions, reclassifying bond proceeds of $330,000 and bond premiums of $785,943, and recognizing the liabilities associated with maturing long-term debt and interest. The net effect of these reclassifications and recognitions is to increase (decrease) net position.
3,603,234 $19 Net Position of Governmental Activities
15
The notes to the financial statements are an integral part of this statement.

EXHIBIT C-3VAN ALSTYNE INDEPENDENT SCHOOL DISTRICT
STATEMENT OF REVENUES, EXPENDITURES, AND CHANGES IN FUND BALANCE
GOVERNMENTAL FUNDS
FOR THE YEAR ENDED AUGUST 31, 2016
Control
Data
Codes
10
General
Fund Fund
Debt Service
50
Funds
Governmental
Other
Funds
Governmental
Total
REVENUES:2,090,992 6,199,177 690,979 8,981,148 Total Local and Intermediate Sources $ $ $ $5700
94,021 6,527,056 124,537 6,745,614 State Program Revenues5800
- 85,134 388,924 474,058 Federal Program Revenues5900
Total Revenues5020 12,811,367 2,185,013 1,204,440 16,200,820
EXPENDITURES:Current:
- 6,323,387 250,514 6,573,901 Instruction0011
- 134,649 - 134,649 Instructional Resources and Media Services0012
- 147,093 - 147,093 Curriculum and Instructional Staff Development0013
- 680,119 - 680,119 School Leadership0023
- 202,768 - 202,768 Guidance, Counseling and Evaluation Services0031
- 139,003 - 139,003 Health Services0033
- 240,820 - 240,820 Student (Pupil) Transportation0034
- - 558,187 558,187 Food Services0035
- 826,444 307,141 1,133,585 Extracurricular Activities0036
- 564,077 - 564,077 General Administration0041
- 1,404,847 - 1,404,847 Facilities Maintenance and Operations0051
- 35,476 - 35,476 Security and Monitoring Services0052
- 298,568 - 298,568 Data Processing Services0053
- - 45,512 45,512 Community Services0061
Debt Service:970,000 45,774 - 1,015,774 Principal on Long Term Debt0071
1,523,045 1,290 - 1,524,335 Interest on Long Term Debt0072
92,165 - - 92,165 Bond Issuance Cost and Fees0073
Capital Outlay: - 59,738 1,457,427 1,517,165 Facilities Acquisition and Construction0081
Intergovernmental: - 227,664 - 227,664 Payments to Fiscal Agent/Member Districts of SSA0093
- 134,361 - 134,361 Other Intergovernmental Charges0099
Total Expenditures6030 11,466,078 2,585,210 2,618,781 16,670,069
1100 Excess (Deficiency) of Revenues Over (Under) Expenditures
1,345,289 (400,197) (1,414,341) (469,249)
OTHER FINANCING SOURCES (USES): 6,312,107 - - 6,312,107 Refunding Bonds Issued7901
167,269 403,658 46,763 617,690 Transfers In7915
785,943 - - 785,943 Premium or Discount on Issuance of Bonds7916
- (214,032) (403,658) (617,690)Transfers Out (Use)8911
(6,993,027) - - (6,993,027)Payment to Bond Refunding Escrow Agent (Use)8940
Total Other Financing Sources (Uses) 7080 189,626 272,292 (356,895) 105,023
1200 Net Change in Fund Balances 1,534,915 (127,905) (1,771,236) (364,226)
0100 Fund Balance - September 1 (Beginning) 3,266,920 150,116 2,009,448 5,426,484
3000 Fund Balance - August 31 (Ending) $ 4,801,835 $ 22,211 $ 238,212 $ 5,062,258
16
The notes to the financial statements are an integral part of this statement.

EXHIBIT C-4VAN ALSTYNE INDEPENDENT SCHOOL DISTRICT
RECONCILIATION OF THE GOVERNMENTAL FUNDS STATEMENT OF REVENUES, EXPENDITURES,AND CHANGES IN FUND BALANCES TO THE STATEMENT OF ACTIVITIES
FOR THE YEAR ENDED AUGUST 31, 2016
(364,226)$Total Net Change in Fund Balances - Governmental Funds
51,048 The District uses internal service funds to charge the costs of certain activities, such as self-insurance, to appropriate functions in other funds. The net income (loss) of internal service funds are reported with governmental activities. The net effect of this consolidation is to increase (decrease) net position.
3,078,102 Current year capital outlays of $1,796,903 and long-term debt principal payments of $1,015,774 are expenditures in the fund financial statements,but they should be shown as increases in capital assets and reductions in long-term debt in the government-wide financial statements. Accretion on capital appreciation bonds of $22,328, amortization of bond premiums of $238,145, and interest payable of $4,952 are recorded in the government-wide financial statements. The net effect of including the current year capital outlays and debt principal payments is to increase (decrease) net position.
(199,884)The implementation of GASB 68 required that certain expenditures be de-expended and recorded as deferred resource outflows. These contributions made after the measurement date of 8/31/2015 but during the current fiscal year caused the change in the ending net position to increase in the amount of $234,851. Contributions made before the measurement date of 8/31/2015 but during the current fiscal year also caused a increase in the change in net position in the amount of $0. The District's proportionate share of TRS pension expense on the plan as a whole had to be recorded. The net pension expense, which includes the District's share, adjustments & differences, and amortization of inflows & outflows, decreased the change in net position by $434,735. The impact of all these is to increase (decrease) the change in net position.
(1,267,508)Depreciation is not recognized as an expense in governmental funds since it does not require the use of current financial resources. The net effect of the current year's depreciation is to decrease net position.
(478,493)Various other reclassifications and eliminations are necessary to convert from the modified accrual basis of accounting to accrual basis of accounting. These include recognizing unavailable revenue as revenue, adjusting current year revenue by $22,550 toshow the revenue earned from the current year's tax levy, eliminating interfund transactions, reclassifying bond proceeds of $330,000 and Bond premiums of $785,943, and recognizing the liabilities associated with maturing long-term debt and interest. The net effect of these reclassifications and recognitions is to increase (decrease) net position.
819,039 $ Change in Net Position of Governmental Activities
17
The notes to the financial statements are an integral part of this statement.
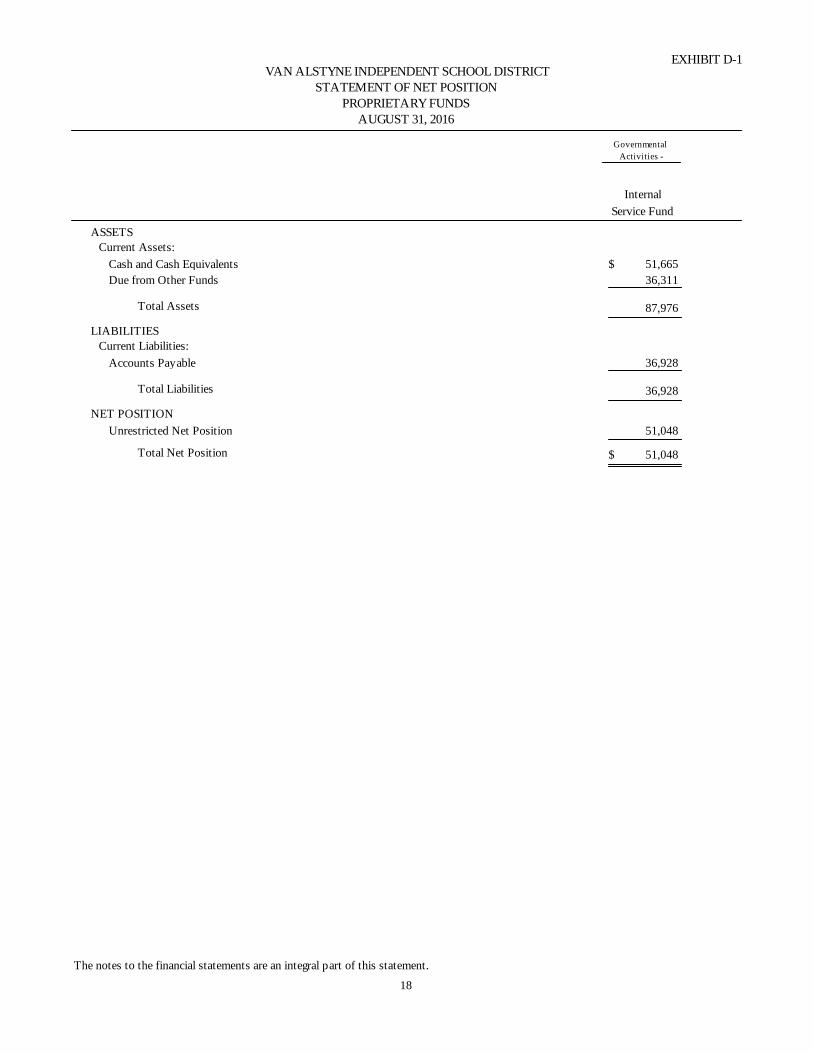
EXHIBIT D-1VAN ALSTYNE INDEPENDENT SCHOOL DISTRICT
STATEMENT OF NET POSITIONPROPRIETARY FUNDS
AUGUST 31, 2016
Internal
Service Fund
Governmental
Activities -
ASSETSCurrent Assets:
51,665 Cash and Cash Equivalents $
36,311 Due from Other Funds
Total Assets 87,976
LIABILITIESCurrent Liabilities:
36,928 Accounts Payable
Total Liabilities 36,928
NET POSITION
51,048 Unrestricted Net Position
Total Net Position 51,048 $
18
The notes to the financial statements are an integral part of this statement.

EXHIBIT D-2VAN ALSTYNE INDEPENDENT SCHOOL DISTRICT
STATEMENT OF REVENUES, EXPENSES, AND CHANGES IN FUND NET POSITION
PROPRIETARY FUNDS
FOR THE YEAR ENDED AUGUST 31, 2016
Internal
Service Fund
Governmental
Activities -
OPERATING REVENUES:
81,924 Local and Intermediate Sources $
Total Operating Revenues 81,924
OPERATING EXPENSES:
30,876 Other Operating Costs
Total Operating Expenses 30,876
Operating Income
Total Net Position - September 1 (Beginning)
Total Net Position - August 31 (Ending)
51,048
-
$ 51,048
19
The notes to the financial statements are an integral part of this statement.

EXHIBIT D-3VAN ALSTYNE INDEPENDENT SCHOOL DISTRICT
STATEMENT OF CASH FLOWS
FOR THE YEAR ENDED AUGUST 31, 2016PROPRIETARY FUNDS
Internal
Service Fund
Governmental
Activities -
Cash Flows from Operating Activities:
81,116 Cash Received from User Charges $
(45,309)Cash Payments for Insurance Claims
35,807 Net Cash Provided by OperatingActivities
Net Increase in Cash and Cash Equivalents 35,807
Cash and Cash Equivalents at Beginning of Year 15,858
Cash and Cash Equivalents at End of Year 51,665 $
Operating Income:$
Reconciliation of Operating Income to Net Cash
Provided by Operating Activities:51,048
Assets and Liabilities:Effect of Increases and Decreases in Current
(808)Decrease (increase) in Receivables(14,433)Increase (decrease) in Accounts Payable
Net Cash Provided by OperatingActivities 35,807 $
20
The notes to the financial statements are an integral part of this statement.

EXHIBIT E-1VAN ALSTYNE INDEPENDENT SCHOOL DISTRICT
STATEMENT OF FIDUCIARY NET POSITIONFIDUCIARY FUNDSAUGUST 31, 2016
Agency
Fund
ASSETS
33,028 Cash and Cash Equivalents $
Total Assets 33,028 $
LIABILITIES
33,028 Due to Student Groups $
Total Liabilities 33,028 $
21
The notes to the financial statements are an integral part of this statement.

22
VAN ALSTYNE INDEPENDENT SCHOOL DISTRICT NOTES TO THE FINANCIAL STATEMENTS FOR THE YEAR ENDED AUGUST 31, 2016
Note A. Summary of Significant Accounting Policies Van Alstyne Independent School District (the "District") is a public educational agency operating under the applicable laws and regulations of the State of Texas. It is governed by a seven member Board of Trustees (the "Board") elected by registered voters of the District. The District prepares its basic financial statements in conformity with generally accepted accounting principles promulgated by the Governmental Accounting Standards Board and other authoritative sources identified in Statement on Auditing Standards No. 69 of the American Institute of Certified Public Accountants; and it complies with the requirements of the appropriate version of Texas Education Agency's Financial Accountability System Resource Guide (the "Resource Guide") and the requirements of contracts and grants of agencies from which it receives funds. Pensions. The fiduciary net position of the Teacher Retirement System of Texas (TRS) has been determined using the flow of economic resources measurement focus and full accrual basis of accounting. This includes for purposes of measuring the net pension liability, deferred outflows of resources and deferred inflows of resources related to pensions, pension expense, and information about assets, liabilities and additions to/deductions from TRS's fiduciary net position. Benefit payments (including refunds of employee contributions) are recognized when due and payable in accordance with the benefit terms. Investments are reported at fair value. As of August 31, 2016, Van Alstyne Independent School District retrospectively and prospectively applied Governmental Accounting Standards Board (“GASB”) Statement No. 72, Fair Value Measurement and Application. GASB Statement No. 72 provides guidance for determining a fair value measurement for reporting purposes and applying fair value to certain investments and disclosures related to all fair value measurements.
1. Reporting Entity The Board of Trustees has governance responsibilities over all activities related to public elementary and secondary public education within the jurisdiction of Van Alstyne Independent School District. The members of the Board of Trustees are elected by the public, have the authority to make decisions, appoint administrators and managers, and significantly influence operations. It also has the primary accountability for fiscal matters. The District is not included in any other “governmental entity” as defined by the Governmental Accounting Standards Board ("GASB") in its Statement No. 14, "The Financial Reporting Entity." There are no component units included within the reporting entity. The District receives funding from local, state, and federal governmental sources and must comply with the requirements of these funding source entities.
2. Government-Wide and Fund Financial Statements The Statement of Net Position and the Statement of Activities are government-wide financial statements. They report information on all of the Van Alstyne Independent School District’s nonfiduciary activities with most of the interfund activities removed. Governmental activities include programs supported primarily by taxes, state foundation funds, grants and other intergovernmental revenues. Business-type activities include operations that rely to a significant extent on fees and charges for support. The Statement of Activities demonstrates how other people or entities that participate in programs the District operates have shared in the payment of the direct costs. The "charges for services" column includes payments made by parties that purchase, use, or directly benefit from goods or services provided by a given function or segment of the District. Examples include tuition paid by students not residing in the district, school lunch charges, etc. The "grants and contributions" column includes amounts paid by organizations outside the District to help meet the operational or capital requirements of a given function. Examples include grants under the Elementary and Secondary Education Act Title I. If revenue is not program revenue, it is general revenue used to support all of the District's functions. Property taxes are always general revenues.

23
Interfund activities between governmental funds, and between governmental funds and proprietary funds, appear as “due to & due from” on the Governmental Fund Balance Sheet and Proprietary Fund Statement of Net Position, and as “other resources & other uses” on the Governmental Fund Statement of Revenues, Expenditures and Changes in Fund Balance and on the Proprietary Fund Statement of Revenues, Expenses and Changes in Fund Net Position. All interfund transactions between governmental funds and between governmental funds and internal service funds are eliminated on the government-wide statements. Interfund activities between governmental funds and fiduciary funds remain as “due to & due from” on the government-wide Statement of Activities. The fund financial statements provide reports on the financial condition and results of operations for three fund categories - governmental, proprietary, and fiduciary. Since the resources in the fiduciary funds cannot be used for District operations, they are not included in the government-wide statements. The District considers some governmental funds major and reports their financial condition and results of operations in a separate column. Proprietary funds distinguish operating revenues and expenses from nonoperating items. Operating revenues and expenses result from providing services and producing and delivering goods in connection with a proprietary fund's principal ongoing operations. All other revenues and expenses are nonoperating. 3. Measurement Focus, Basis of Accounting, and Financial Statement Presentation The government-wide financial statements use the economic resources measurement focus and the accrual basis of accounting, as do the proprietary fund and fiduciary fund financial statements. Revenues are recorded when earned and expenses are recorded when a liability is incurred, regardless of the timing of the related cash flows. Property taxes are recognized as revenues in the year for which they are levied. Grants and similar items are recognized as revenue as soon as all eligibility requirements imposed by the provider have been met. Governmental fund financial statements use the current financial resources measurement focus and the modified accrual basis of accounting. With this measurement focus, only current assets, current liabilities and fund balances are included on the balance sheet. Operating statements of these funds present net increases and decreases in current assets (i.e., revenues and other financing sources and expenditures and other financing uses). The modified accrual basis of accounting recognizes revenues in the accounting period in which they become both measurable and available, and it recognizes expenditures in the accounting period in which the fund liability is incurred, if measurable, except for unmatured interest and principal on long-term debt, which is recognized when due. The expenditures related to certain compensated absences and claims and judgments are recognized when the obligations are expected to be liquidated with expendable available financial resources. Revenues are considered to be available when they are collectible within 60 days after year-end. Revenues from local sources consist primarily of property taxes. Property tax revenues and revenues received from the State are recognized under the susceptible-to-accrual concept, that is, when they are both measurable and available. The District considers them available if they will be collected within 60 days of the end of the fiscal year. Miscellaneous revenues are recorded as revenue when received in cash because they are generally not measurable until actually received. Investment earnings are recorded as earned, since they are both measurable and available. Grant funds are considered to be earned to the extent of expenditures made under the provisions of the grant. Accordingly, when such funds are received, they are recorded as deferred revenues until related and authorized expenditures have been made. If balances have not been expended by the end of the project period, grantors sometimes require the District to refund all or part of the unused amount. The Proprietary Fund Types and Fiduciary Funds are accounted for on a flow of economic resources measurement focus and utilize the accrual basis of accounting. This basis of accounting recognizes revenues in the accounting period in which they are earned and become measurable and expenses in the accounting period in which they are incurred and become measurable. Agency Funds apply the accrual basis of accounting, but do not have a measurement focus. The District applies all GASB pronouncements as well as the Financial Accounting Standards Board pronouncements issued on or before November 30, 1989, unless these pronouncements conflict or contradict GASB pronouncements. With this measurement focus, all assets and all liabilities associated with the operation of

24
these funds are included on the Statement of Net Position. The fund equity is segregated into net investment in capital assets, restricted net position, and unrestricted net position
4. Fund Accounting
The District’s accounts are organized on the basis of funds, each of which is considered to be a separate accounting entity. The operations of each fund are accounted for by providing a separate set of self-balancing accounts which
are comprised of each fund’s assets, liabilities, equity, revenues and expenditures. The District reports the following major governmental funds: General Fund – This governmental fund is established to account for resources financing the fundamental operations of the District, in partnership with the community, in enabling and motivating students to reach their full potential. All revenues and expenditures not required to be accounted for in other funds are included here. This is a budgeted fund and any fund balances are considered resources available for current operations. Fund balances may be appropriated by the Board of Trustees to implement its responsibilities Debt Service Fund – This governmental fund is established to account for payment of principal and interest on long-term general obligation debt and other long-term debts for which a tax has been dedicated. This is a budgeted fund and a separate bank account is maintained for this fund. Any unused sinking fund balances are transferred to the General Fund after all of the related debt obligations have been met. It is considered major because its resources exceed 10% of the District’s total resources.
Additionally, the District reports the following nonmajor fund types: Governmental Fund Types:
Special Revenue Funds – These governmental funds are established to account for resources restricted to, or designated for, specific purposes by the District or a grantor in a Special Revenue Fund. Most federal and some state financial assistance is accounted for in a Special Revenue Fund and sometimes unused balances must be returned to the grantor at the close of specified project periods. Project accounting is employed to maintain integrity of the various sources of funds.
The District’s Food Service Fund is considered a special revenue fund since it meets the following criteria: (1) User fees are charged to supplement the National School Lunch Program, (2) The General Fund subsidizes the Food Service Program for all expenditures in excess of the National School Lunch Program, and (3) The District does not consider the Food Service Program completely self-supporting. Food Service fund balances are used exclusively for child nutrition program purposes. Capital Projects Fund – This governmental fund is established to account for proceeds from the sale of bonds and other resources to be used for Board authorized acquisition, construction, or renovation, as well as, furnishing and equipping of major capital facilities.
Proprietary Funds: Internal Service Fund – This fund is established to account for revenues and expenses related to services provided
to organizations inside the District on a cost reimbursement basis. The District's Internal Service Fund is for Workers Compensation Self-Insurance.
Fiduciary Funds: Agency Funds – These funds are established to account for resources held for others in a custodial capacity.
Financial resources for the Agency funds are recorded as assets and liabilities; therefore, these funds do not include revenues and expenditures and have no fund equity. The District's Agency Funds are for Student Activity Funds.

25
5. Cash and Cash Equivalents For purposes of the statement of cash flows for proprietary funds, highly liquid investments are considered to be cash equivalents if they have a maturity of three months or less when purchased. Cash and cash equivalents in the Internal Service fund was $51,665 as of August 31, 2016. 6. Investments Investments are recorded at fair value. Fair value is the amount at which a financial instrument could be exchanged in a current transaction between willing parties, other than in a forced or liquidation sale. 7. Inventories All inventories are valued at cost using the first in/first out (FIFO) method. The District purchases of supplies as expenditures. If any supplies are on hand at the end of the year, their cost is recorded as inventory and fund balance is reserved for the same amount. 8. Asset Capitalization and Useful Lives Capital assets, which include land, buildings, furniture and equipment, are reported in the applicable governmental or business-type activities columns in the government-wide financial statements. Capital assets are defined by the District as assets with an initial, individual unit cost of more than $5,000 and an estimated useful life in excess of two years. Such assets are recorded at historical cost or estimated historical cost if purchased or constructed. Donated capital assets are recorded at estimated fair market value at the date of donation.
The costs of normal maintenance and repairs that do not add to the value of the asset or materially extend assets lives are not capitalized. Major outlays for capital assets and improvements are capitalized as projects are constructed.
Buildings, furniture, and equipment of the District are depreciated using the straight line method over the following estimated useful lives:
Assets YearsBuildings 39-50Building Improvements 15-40Vehicles & Buses 5-10Equipment 5-7
9. Compensated Absences It is the District's policy to permit some employees to accumulate earned but unused vacation and sick pay benefits. There is no liability for unpaid accumulated sick leave since the District does not have a policy to pay any amounts when employees separate from service with the government. All vacation pay is accrued when incurred in the government-wide, proprietary, and fiduciary fund financial statements. A liability for these amounts is reported in governmental funds only if they have matured, for example, as a result of employee resignations and retirements. 10. Long-Term Debt In the government-wide financial statements, and proprietary fund types in the fund financial statements, long-term debt and other long-term obligations are reported as liabilities in the applicable governmental activities, or proprietary fund type statement of net assets. Bond premiums and discounts are deferred and amortized over the life of the bonds using the effective interest method. Bonds payable are reported net of the applicable bond premium or discount. Bond issuance costs are expenses when incurred.

26
In the fund financial statements, governmental fund types recognized bond premiums and discounts, as well as bond issuance costs, during the current period. The face amount of bonded debt issued plus the premiums/discounts received on the issuance of bonds are reported as other financing sources. The amounts of issuance costs are reported as expenditures. 11. Fund Balance In accordance with GASB 54 and school board policy, the District is reporting its fund balances in the governmental fund financial statements in each of the following categories: Non-spendable fund balance – represents amounts that cannot be spent because they are either not in spendable form (such as inventory or prepaids) or legally required to remain intact (such as notes receivable or principal of a permanent fund). Restricted fund balance – represents amounts with external constraints placed on the use of these resources (such as debt covenants, grantors, other governments, etc.) or imposed by enabling legislation. Restrictions may be changed or lifted only with the consent of resource providers. Committed fund balance – represents amounts that can only be used for specific purposes imposed by a formal action of the District’s highest level of decision-making authority, the School Board. Committed resources cannot be used for any other purposes unless the Board removes or changes the specific use by taking the same formal action that imposed the constraint originally. Assigned fund balance – represents amounts the District intends to use for specific purposes as expressed by the Board or an official delegated with the authority. The Board has delegated the authority to assign fund balances to the Superintendent. Unassigned fund balance – represents the residual classification for the general fund or deficit balances in other funds. In circumstances where an expenditure is to be made for a purpose for which amounts are available in multiple fund balance classifications, the order in which resources will be expended is as follows: restricted fund balance, committed fund balance, assigned fund balance, and then unassigned fund balance.
As of August 31, 2016, the District’s fund balances are classified as follows:
General FundDebt Service Fund
Other Governmental Funds Totals
Restricted for:Debt Service $22,211 $22,211Scholarships 7,955 7,955Committed to:Construction 2,500,000 2,500,000Campus Activity 230,257 230,257Unassigned 2,301,835 2,301,835Total Fund Balances $4,801,835 $22,211 $238,212 $5,062,258
12. Functions School Districts are required to report all expenses by function, except certain indirect expenses. General administration, data processing services, and other intergovernmental charges functions (data control codes 41, 53, and 99 respectively) include expenses that are indirect expenses of other functions. These indirect expenses are not allocated to other functions.

27
13. Restricted Assets When the District incurs an expense for which it may use either restricted or unrestricted assets, it uses the restricted assets first whenever they will have to be returned if they are not used. 14. Data Control Codes The Data Control Codes refer to the account code structure prescribed by TEA in the Financial Accountability System Resource Guide. Texas Education Agency requires school districts to display these codes in the financial statements filed with the Agency in order to insure accuracy in building a statewide data base for policy development and funding plans. 15. Risk Management – Claims and Judgments In the normal course of operations, the District is exposed to risks of loss from a number of sources including fire and casualty losses, errors or omissions by board members and employees, and injuries to employees during the course of performing their duties. The District attempts to cover these losses by the purchase of insurance. Significant losses are covered by commercial insurance for property and liability programs. For insured programs, there have been no significant reductions in coverage. Settlement amounts have not exceeded insurance coverage for the current year or the past three years. Health Care Coverage During the year ended August 31, 2016, employees of the District were covered by a uniform statewide health care program for public education employees. The District contributed $266 per month, which includes $75 per month which is reimbursed by the State of Texas, per employee to the Plan. Employees, at their option, may authorize payroll withholdings to pay the remaining balance of the premium for employee coverage and/or dependents. All contributions/premiums were paid to the statewide health care program. The Plan was authorized by House Bill 3343 and is administered by the Teacher Retirement System of Texas (TRS). Workers Compensation Coverage The District has entered into an agreement with the Texas Educational Insurance Association to self-fund their workers compensation plan. The latter agreement is administered by Claims Administrative Services, Inc. Transactions related to the plan are accounted for in the Workers Compensation Insurance Fund (the "Fund"), an internal service fund of the District. The District makes all contributions to the fund. Claims Administrative Services, Inc. obtained excess loss insurance, which limited annual claims paid from the entire fund for the year ended August 31, 2016, to $225,000 for any individual participant. Estimates of claims payable and of claims incurred, but not reported at August 31, 2016, are reflected as accounts and claims payable of the Fund. The plan is funded to discharge liabilities of the Fund as they become due. Changes in the balances of claims liabilities during the past two years are as follows:
Year Ended August 31, 2016 Year Ended August 31, 2015Unpaid claims, beginning of fiscal year $51,361 $52,275Incurred claims (including IBNR's) 30,876 56,387Claim payments (45,309) (57,301)Unpaid claims, end of fiscal year $36,928 $51,361
16. Estimates and Assumptions The preparation of financial statements in conformity with generally accepted accounting principles requires management to make estimates and assumptions that affect the reported amounts of assets and liabilities and

28
disclosure of contingent assets and liabilities at the date of the financial statements and the reported amounts of revenues and expenses during the reporting period. Actual results could differ from those estimates.
Note B. Reconciliation of Government-Wide and Fund Financial Statements
Explanation of certain differences between the governmental fund balance sheet and the government-wide statement of net assets: Exhibit C-2 provides the reconciliation between the fund balance for total governmental funds on the governmental fund balance sheet and the net assets for governmental activities as reported in the government-wide statement of net position. One element of that reconciliation explains that capital assets are not financial resources and are therefore not reported in governmental funds. In addition, long-term liabilities, including bonds payable, are not due and payable in the current period and are not reported as liabilities in the funds. Another element of the reconciliation on Exhibit C-2 is the inclusion of deferred outflows, deferred inflows, and net pension liability related to TRS at the beginning of the year. The details for these elements are as follows:
Capital Assets at the Beginning of the year Historic Cost
Accumulated Depreciation
Net Value at the Beginning of the Year
Change in Net Position
Land $800,450 $800,450Buildings 43,870,533 (14,836,290) 29,034,243Equipment 1,949,642 (1,511,907) 437,735Vehicles 1,010,192 (434,895) 575,297Construction in Progress 5,210,282 0 5,210,282Change in Net Position $36,058,007Deferred Outflow related to TRS $298,351
Long-term Liabilities at the Beginning of the year
Payable at the Beginning of the year
Bonds Payable $37,994,871Bond Interest Payable 57,009Loans Payable 45,774Change in Net Assets ($38,097,654)Net Pension Liability ($911,660)Deferred Inflow related to TRS ($278,879)
Net Adjustment to Net Position ($2,931,835)
Explanation of certain differences between the governmental fund statement of revenues, expenditures, and
changes in fund balances and the government-wide statement of activities: Exhibit C-4 provides reconciliation between the net changes in fund balance as shown on the governmental fund statement of revenues, expenditures, and changes in fund balances and the changes in net position of governmental activities as reported on the government-wide statement of activities.

29
One element of that reconciliation explains that current year capital outlays and debt principal payments are expenditures in the fund financial statements, but should be shown as increases in capital assets and decreases in long-term debt in the government-wide statements. Another element of the reconciliation on Exhibit C-4 is the current year adjustments to deferred outflows, deferred inflows, and net pension liability related to TRS. These adjustments affect both the net position balance and the change in net assets. The details of these adjustments are as follows:
AmountAdjustments to Changes in Net Position
Adjustments to Net Position
Current Year Capital OutlayLand $18,336Buildings & Improvements 6,688,849Equipment 188,414Vehicles 111,586Construction in Progress (5,210,282)Total Capital Outlay $1,796,903 $1,796,903 $1,796,903Deferred Ouflow related to TRS $969,646 $969,646 $969,646
Debt Service PaymentsBond Principal $970,000Bond Interest Payable 4,952Accretion on Capital Appreciation Bonds 22,328Amortization of Bond Premiums 238,145Loan Principal 45,774Total Principal Payments $1,281,199 $1,281,199 $1,281,199Net Pension Liability ($1,284,977) ($1,284,977) ($1,284,977)Deferred Inflow related to TRS $115,447 $115,447 $115,447
Total Adjustment to Net Position $2,878,218 $2,878,218
Another element of the reconciliation on Exhibit C-4 is described as various other reclassifications and eliminations necessary to convert from the modified accrual basis of accounting to accrual basis of accounting. This adjustment is the result of several items. The details for this element are as follows:
AmountAdjustments to Changes in Net Position
Adjustments to Net Position
Adjustments to Revenue and Unavailable RevenueNet Property Tax Revenue Adjustment ($22,550) ($22,550) $267,046Reclassify Bond ProceedsReclassify Bond Proceeds & Bond Premiums ($455,943) ($455,943) ($455,943)Totals ($478,493) ($188,897)
Note C. Stewardship, Compliance, and Accountability Budgetary Data The Board of Trustees adopts an "appropriated budget" for the General Fund, Debt Service Fund and the Food Service Fund (which is included in the Special Revenue Funds). The District is required to present the adopted and final amended budgeted revenues and expenditures for each of these funds. The District compares the final amended budget to actual revenues and expenditures. The General Fund Budget report appears in Exhibit G-1 and the other two reports are in Exhibit J-2 and J-3.
30
The following procedures are followed in establishing the budgetary data reflected in the governmental fund financial statements:
1. Prior to August 20, the District prepares a budget for the next succeeding fiscal year beginning September 1. The operating budget includes proposed expenditures and the means of financing them.
2. A meeting of the Board is then called for the purpose of adopting the proposed budget. At least ten days' public notice of the meeting must be given.
3. Prior to September 1, the budget is legally enacted through passage of a resolution by the Board.
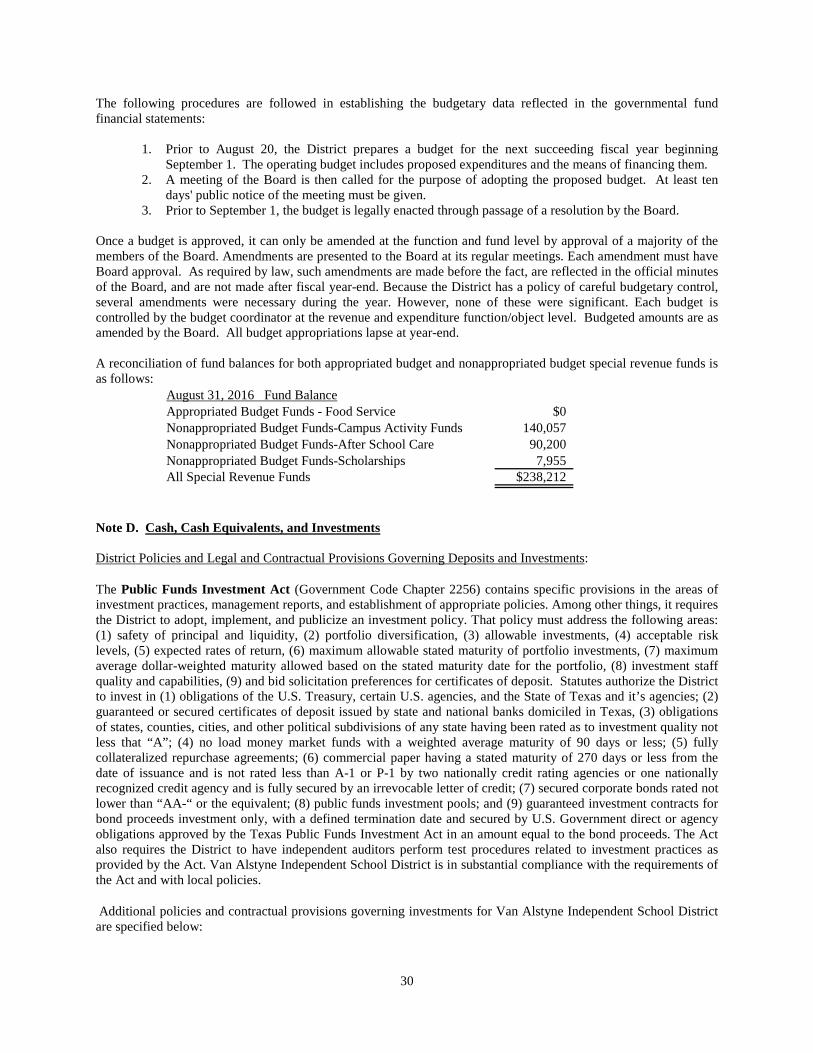
Once a budget is approved, it can only be amended at the function and fund level by approval of a majority of the members of the Board. Amendments are presented to the Board at its regular meetings. Each amendment must have Board approval. As required by law, such amendments are made before the fact, are reflected in the official minutes of the Board, and are not made after fiscal year-end. Because the District has a policy of careful budgetary control, several amendments were necessary during the year. However, none of these were significant. Each budget is controlled by the budget coordinator at the revenue and expenditure function/object level. Budgeted amounts are as amended by the Board. All budget appropriations lapse at year-end. A reconciliation of fund balances for both appropriated budget and nonappropriated budget special revenue funds is as follows:
August 31, 2016 Fund BalanceAppropriated Budget Funds - Food Service $0Nonappropriated Budget Funds-Campus Activity Funds 140,057Nonappropriated Budget Funds-After School Care 90,200Nonappropriated Budget Funds-Scholarships 7,955All Special Revenue Funds $238,212
Note D. Cash, Cash Equivalents, and Investments District Policies and Legal and Contractual Provisions Governing Deposits and Investments:
The Public Funds Investment Act (Government Code Chapter 2256) contains specific provisions in the areas of investment practices, management reports, and establishment of appropriate policies. Among other things, it requires the District to adopt, implement, and publicize an investment policy. That policy must address the following areas: (1) safety of principal and liquidity, (2) portfolio diversification, (3) allowable investments, (4) acceptable risk levels, (5) expected rates of return, (6) maximum allowable stated maturity of portfolio investments, (7) maximum average dollar-weighted maturity allowed based on the stated maturity date for the portfolio, (8) investment staff quality and capabilities, (9) and bid solicitation preferences for certificates of deposit. Statutes authorize the District to invest in (1) obligations of the U.S. Treasury, certain U.S. agencies, and the State of Texas and it’s agencies; (2) guaranteed or secured certificates of deposit issued by state and national banks domiciled in Texas, (3) obligations of states, counties, cities, and other political subdivisions of any state having been rated as to investment quality not less that “A”; (4) no load money market funds with a weighted average maturity of 90 days or less; (5) fully collateralized repurchase agreements; (6) commercial paper having a stated maturity of 270 days or less from the date of issuance and is not rated less than A-1 or P-1 by two nationally credit rating agencies or one nationally recognized credit agency and is fully secured by an irrevocable letter of credit; (7) secured corporate bonds rated not lower than “AA-“ or the equivalent; (8) public funds investment pools; and (9) guaranteed investment contracts for bond proceeds investment only, with a defined termination date and secured by U.S. Government direct or agency obligations approved by the Texas Public Funds Investment Act in an amount equal to the bond proceeds. The Act also requires the District to have independent auditors perform test procedures related to investment practices as provided by the Act. Van Alstyne Independent School District is in substantial compliance with the requirements of the Act and with local policies.
Additional policies and contractual provisions governing investments for Van Alstyne Independent School District are specified below:

31
Credit Risk – To limit the risk that an issuer or other counterparty to an investment will not fulfill its obligations, the District limits investments in certificates of deposits, no-load money market accounts, and public investment pools. As of August 31, 2016, the District’s investments in public funds investment pools were rated AAAm by Standard & Poor’s.
Custodial Credit Risk for Deposits – State law requires the District to contract with financial institutions in which funds will be deposited to secure those deposits with insurance or pledged securities with a fair value equaling or exceeding the amount on deposit at the end of each business day. The pledged securities must be in the name of the
District and held by the entity or its agent. Since the District complies with this law, it has no custodial risk for deposits
Custodial Credit Risk for Investments – To limit the risk that, in the event of the failure of the counterparty to a transaction, the District will not be able to recover the value of investment or collateral securities that are in possession of an outside party the District requires counterparties to register the securities in the name of the District and hand them over to the District or its designated agent. This includes securities lending transactions. All of the securities are in the District’s name and held by the District or its agent.
Concentration of Credit Risk – To limit the risk of loss attributed to the magnitude of the District’s investment in a single issuer, the District diversifies in terms of investment instruments, maturity scheduling, and financial institutions to reduce the risk of loss resulting from over concentration of assets in a specific class of investments, specific maturity, or specific issuer.
Interest Rate Risk – To limit the risk of changes in interest rates will adversely affect the fair value of investments, the District requires invested instruments maturities do not exceed one year from the time of purchase except when a longer maturity may be specifically authorized by the Board for a given investment provided legal limits are not exceeded
Foreign Currency Risk – The District limits the risk that changes in exchange rates will adversely affect the fair value of an investment or a deposit by not investing in foreign currency.
Fair Value Measurements:
The District categorizes its fair value measurements with the fair value hierarchy established by generally accepted accounting principles. The hierarchy is based on the valuation inputs used to measure the fair value of the asset. Level 1 inputs are quoted prices in active markets for identical assets; Level 2 inputs are significant other observable inputs; Level 3 inputs are significant unobservable inputs. Investments that are measured at fair value using the net asset value per share (or its equivalent) as a practical expedient are not classified in the fair value hierarchy below.
In instances where inputs used to measure fair value fall into different levels in the below hierarchy, fair value measurements in their entirety are categorized based on the lowest level input that is significant to the valuation. The District’s assessment of the significance of particular inputs to these fair value measurements requires judgement and considers factors specific to each asset.
Van Alstyne Independent School District has the following recurring fair value measurements as of August 31, 2016:
Cash & Cash Equivalents of $5,056,393 are valued using quoted market prices (Level 1 inputs)
The District has no investments measured at the Net Asset Value (NAV) per Share or its equivalent.

32
Deposit Collateral Information At August 31, 2016, the carrying amount of the District’s deposits (cash, certificates of deposit, and interest bearing savings accounts) was $5,056,393. The District’s cash deposits at August 31, 2016 and during the year ended August 31, 2016 were entirely covered by FDIC insurance or by pledged deposit collateral held by the District’s agent bank in the District’s name, or by letters of credit. In addition, the following is disclosed regarding coverage of combined balances on the date of highest deposit: a. Depository: Independent Bank, Van Alstyne, Texas b. The highest combined balance of cash, savings, and time deposits accounts amounted to $8,318,952 and occurred during the month of February 2016. c. The market value of securities pledged as of the date of the highest combined balance on deposit was $11,000,000. d. Total amount of FDIC coverage at the time of the highest combined balance was $500,000. Note E. Property Taxes Property taxes are levied by October 1 on the assessed value listed as of the prior January 1 for all real and business personal property located in the District in conformity with Subtitle E, Texas Property Tax Code. Taxes are due on receipt of the tax bill and are delinquent if not paid before February 1 of the year following the year in which imposed. On January 31 of each year, a tax lien attaches to property to secure the payment of all taxes, penalties, and interest ultimately imposed. Property tax revenues are considered available when collected. The assessed value of the tax roll on January 1, 2015, upon which the tax levy for the 2016 fiscal year was based, was $517,257,359. The tax rates assessed for the year ended August 31, 2016 to finance general fund operations and the payment of principal & interest on general obligation bonds were $ 1.12 and $ 0.40 per $ 100 valuation, respectively, for a total of $ 1.52 per $ 100 valuation. Current year (including prior year delinquent) tax collections for the year ended August 31, 2016 were 99.90% of the tax levy. Note F. Delinquent Taxes Receivable Delinquent taxes are prorated between maintenance and debt service based on rates adopted for the year of the levy. Allowances for uncollectible tax receivables within the General and Debt Service Funds are based on historical experience in collecting property taxes. Uncollectible personal property taxes are periodically reviewed and written off, but the District is prohibited from writing off real property taxes without specific statutory authority from the Texas Legislature.
Note G. Disaggregation of Receivables and Payables
Receivables at August 31, 2016, were as follows:

33
Property Taxes
Due from Other Governments
Due from Other Funds Other
Total Receivables
Governmental Activities:General Fund $235,999 $595,971 $0 $0 $831,970Debt Service Fund 80,868 9,493 0 0 90,361Nonmajor Governmental Funds 0 15,749 0 0 15,749Total Governmental Activities $316,867 $621,213 $0 $0 $938,080Amounts not scheduled for collection during the subsequent year $4,088 $0 $0 $0 $4,088
Payables at August 31, 2016, were as follows:
AccountsSalaries & Benefits
Due to Other Funds
Due to Other Governments Other
Total Payables
Governmental Activities:General Fund $68,824 $383,847 $36,311 $10,629 $7,309 $506,920 Debt Service Fund 0 0 0 490 0 490 Nonmajor Governmental Funds 0 22,235 0 0 1,010 23,245 Total Governmental Activities $68,824 $406,082 $36,311 $11,119 $8,319 $530,655Amounts not scheduled for collection during the subsequent year $0 $0 $0 $0 $0 $0
Note H. Capital Asset Activity Capital asset activity for the year ended August 31, 2016 was as follows:
Beginning Balance Additions Retirements
Ending Balance
Land $800,450 $18,336 $0 $818,786Buildings & Improvements 43,870,533 6,688,849 0 50,559,382Equipment 1,949,642 188,414 0 2,138,056Vehicles 1,010,192 111,586 1,121,778Construction in Progress 5,210,282 (5,210,282) 0 0Totals at Historical Cost 52,841,099 1,796,903 0 54,638,002Less accumulated depreciation for:Buildings & Improvements (14,836,290) (1,078,476) 0 (15,914,766)Equipment (1,511,907) (88,502) 0 (1,600,409)Vehicles (434,895) (100,530) 0 (535,425)Total accumulated depreciation (16,783,092) (1,267,508) 0 (18,050,600)
Capital Assets, Net $36,058,007 $529,395 $0 $36,587,402
Depreciation expense for the current year was charged to governmental functions as follows:

34
11 Instruction $630,16712 Instructional Resources & Media Services 11,67013 Curriculum & Instructional Staff Development 11,67023 School Leadership 70,01931 Guidance, Counseling, & Evaluation Services 23,34033 Health Services 11,67034 Student (Pupil) Transporation 112,20035 Food Services 58,34936 Cocurricular/Extracurricular Activities 105,02841 General Administration 58,34951 Plant Maintenance & Operations 140,03753 Data Processing Services 35,009
Total Depreciation Expense $1,267,508
Note I. Changes in Long-Term Liabilities Long-term liability activity for the year ended August 31, 2016, was as follows:
Beginning Balance Additions Reductions
Ending Balance
Amounts Due within One Year
Governmental Activities:General Obligation Bonds $36,985,000 $6,295,000 ($7,595,000) $35,685,000 $915,000Accumulated Accretion on CABs 39,293 4,983 (27,311) 16,965Unamortized Bond Premiums 970,578 785,943 (238,145) 1,518,376Total Bonds Payable, Government-Wide $37,994,871 $7,085,926 ($7,860,456) $37,220,341Loans 45,774 0 (45,774) 0 45,774
Total Governmental Activities $38,040,645 $7,085,926 ($7,906,230) $37,220,341 $960,774
Note J. Bonds Payable & Debt Service Requirements The District has entered into a continuing disclosure undertaking to provide annual reports and material event notices to the State Information Depository of Texas (SID), which is the Municipal Advisory Council. This information is required under SEC Rule 15c2-12 to enable investors to analyze the financial condition and operations of the District. There are a number of limitations and restrictions contained in the general obligation bond indenture. Management has indicated that the District is in compliance with all significant limitations and restrictions at August 31, 2016. In the governmental fund financial statements, current requirements for principal and interest expenditures are accounted for in the Debt Service Fund. The proceeds from the sale of bonds are shown in the governmental fund financial statements as Other Resources and principal payments are shown as expenditures. A summary of changes in general obligation bonds for the year ended August 31, 2016 is as follows:

35
Description
Interest Rates Payable
Amounts of Original Issue
Interest Current Year
Beginning Amounts Outstanding 9/01/15 Issued Retired
Ending Amounts Outstanding 8/31/16
Unlimited Tax Bldg Bonds-Series 2007 4.00-4.50% $9,090,000 $217,243 $8,400,000 $0 ($6,940,000) $1,460,000Unlimited Tax Bldg Bonds-Series 2008 4.00-5.50% 8,900,000 326,000 7,835,000 0 (195,000) 7,640,000Unlimited Tax Refunding Bonds-Series 2011 2.00-3.00% 6,745,000 212,700 6,365,000 0 (220,000) 6,145,000Unlimited Tax Refunding Bonds-Series 2012 1.00-3.20% 4,065,000 123,950 3,975,000 0 0 3,975,000Capital Appreciation Bonds-Series 2012 0.78-1.33% 165,000 110,000 45,000 0 (45,000) 0Unlimited Tax Refunding Bonds-Series 2012A 1.00-3.00% 3,955,000 91,210 3,805,000 0 0 3,805,000Capital Appreciation Bonds-Series 2012A 0.70-0.90% 145,000 130,000 80,000 0 (45,000) 35,000Unlimited Tax Bldg Bonds-Series 2015 2.00-4.00% 6,480,000 227,038 6,480,000 0 (95,000) 6,385,000Unlimited Tax Refunding Bonds-Series 2016 2.00-4.00% 6,295,000 84,904 0 6,295,000 (55,000) 6,240,000Total General Obligation Bonds $1,523,045 $36,985,000 $6,295,000 ($7,595,000) $35,685,000Accumulated Accretion on CABs 39,293 4,983 (27,311) 16,965
Unamortized Bond Premiums 970,578 785,943 (238,145) 1,518,376
Total Bonds Payable, Government-Wide Financials $37,994,871 $7,085,926 ($7,860,456) $37,220,341 During the year, the District issued Series 2016 refunding bonds of $6,295,000 to early redeem Series 2007 bonds of $6,625,000. The net present value of savings on the transaction was $860,904. A portion of the above bonds were capital appreciation bonds, commonly referred to as “premium compound interest bonds”. These bonds were issued at a discount to their par or maturity value and will accrete interest until maturity. Summary information for the capital appreciation bonds is as follows:
Series Stated Value Accreted Value, 8/31/162012-A $35,000 $173,435
Capital Appreciation Bonds
Debt service requirements for bonds are as follows:

36
Year Ending August 31, Principal Interest Total Requirements2017 $1,050,000 $1,390,554 $2,440,5542018 1,230,000 1,214,179 2,444,1792019 1,270,000 1,174,929 2,444,9292020 1,310,000 1,134,254 2,444,2542021 1,350,000 1,094,774 2,444,7742022-2026 7,395,000 4,817,044 12,212,0442027-2031 8,755,000 3,455,694 12,210,6942032-2036 9,140,000 1,779,935 10,919,9352037-Maturity 4,185,000 424,187 4,609,187Total General Obligation Bonds $35,685,000 $16,485,550 $52,170,550
General Obligation Bonds
Note K. Long Term Notes and Capital Leases Payable Long-Term Notes: A summary of changes in long-term notes for the year ended August 31, 2016 is as follows:
Date of Issue/Maturity
Purpose/Lawful Authority
Fund Payable From/Interest Rate
Current Year Interest
Beginning Balance
Amount Issued
Amount Retired
Ending Balance
03/13-09/15School Bus Loan/ TEC 34.005 General/2.82% $1,290 $45,774 $0 ($45,774) $0
Totals $1,290 $45,774 $0 ($45,774) $0
Debt service requirements for long-term notes are as follows: None Capital Leases: There are no capital leases outstanding during the year ended August 31, 2016. Note L. Accumulated Unpaid Vacation and Sick Leave Benefits District employees are entitled to certain compensated absences based upon their length of employment. Sick leave accrues at various rates established by the State of Texas and adopted by the Board of Trustees. Sick leave does not vest, but accumulates and is recorded as an expenditure as it is used and paid. A summary of changes in the accumulated sick leave and vacation leave liability follows:
Sick Leave Vacation LeaveBalance, September 1, 2015 $0 $0Additions - New Entrants and Salary Increments 0 0Deductions - Payments to Participants 0 0Balance, August 31, 2016 $0 $0

37
Note M. Defined Benefit Pension Plan (TRS) Plan Description. Van Alstyne Independent School District participates in a cost-sharing multiple-employer defined benefit pension that has a special funding situation. The plan is administered by the Teacher Retirement System of Texas (TRS). It is a defined benefit pension plan is established and administered in accordance with the Texas Constitution, Article XVI, Section 67 and Texas Government Code, Title 8, Subtitle C. The pension trust fund is a qualified pension trust under Section 401(a) of the Internal Revenue Code. The Texas Legislature establishes benefits and contribution rates within the guidelines of the Texas Constitution. The pension's Board of Trustees does not have the authority to establish or amend benefit terms. All employees of public, state-supported educational institutions in Texas who are employed for one-half or more of the standard work load and who are not exempted from membership under Texas Government Code, Title 8, Section 822.002 are covered by the system. Pension Plan Fiduciary Net Position. Detailed information about the Teacher Retirement System's fiduciary net position is available in a separately-issued Comprehensive Annual Financial Report that includes financial statements and required supplementary information. That report may be obtained on the Internet at http://www.trs.state.tx.us/about/documents/cafr.pdf#CAFR; by writing to TRS at 1000 Red River Street, Austin, TX, 78701-2698; or by calling (512) 542-6592. The information provided in the Notes to the Financial Statements in the 2015 Comprehensive Annual Financial Report for TRS provides the following information regarding the Pension Plan fiduciary net position as of August 31, 2015.
Net Pension Liability Total
Total Pension Liability 163,887,375,172Less: Plan Fiduciary Position (128,538,706,212)Net Pension Liability $35,348,668,960
Net Position as a percentage of Total Pension Liability 78.43%
Benefits Provided. TRS provides service and disability retirement, as well as death and survivor benefits, to eligible employees (and their beneficiaries) of public and higher education in Texas. The pension formula is calculated using 2.3 percent (multiplier) times the average of the five highest annual creditable salaries times years of credited service to arrive at the annual standard annuity except for members who are grandfathered, the three highest annual salaries are used. The normal service retirement is at age 65 with 5 years of credited service or when the sum of the member's age and years of credited service equals 80 or more years. Early retirement is at age 55 with 5 years of service credit or earlier than 55 with 30 years of service credit. There are additional provisions for early retirement if the sum of the member's age and years of service credit total at least 80, but the member is less than age 60 or 62 depending on date of employment, or if the member was grandfathered in under a previous rule. There are no automatic post-employment benefit changes; including automatic COLAs. Ad hoc post-employment benefit changes, including ad hoc COLAs can be granted by the Texas Legislature as noted in the Plan Description above. Contributions. Contribution requirements are established or amended pursuant to Article 16, section 67 of the Texas Constitution which requires the Texas legislature to establish a member contribution rate of not less than 6% of the member's annual compensation and a state contribution rate of not less than 6% and not more than 10% of the aggregate annual compensation paid to members of the system during the fiscal year. Texas Government Code section 821.006 prohibits benefit improvements, if as a result of the particular action, the time required to amortize TRS' unfunded actuarial liabilities would be increased to a period that exceeds 31 years, or, if the amortization period already exceeds 31 years, the period would be increased by such action. Employee contribution rates are set in state statute, Texas Government Code 825.402. Senate Bill 1458 of the 83rd Texas Legislature amended Texas Government Code 825.402 for member contributions and established employee contribution rates for fiscal years 2014 thru 2017. The 83rd Texas Legislature, General Appropriations Act (GAA)

38
established the employer contribution rates for fiscal years 2014 and 2015. The 84th Texas Legislature, General Appropriations Act (GAA) established the employer contribution rates for fiscal years 2016 and 2017.
Contribution Rates
2015 2016 Member 6.7% 7.2% Non-Employer Contributing Entity (State) 6.8% 6.8% Employers 6.8% 6.8%
Van Alstyne ISD FY2016 Employer Contributions $234,851 Van Alstyne ISD FY2016 Member Contributions $536,891 Van Alstyne ISD FY2015 NECE On-Behalf Contributions $394,827
Contributors to the plan include members, employers and the State of Texas as the only non-employer contributing entity. The State contributes to the plan in accordance with state statutes and the General Appropriations Act (GAA). As the non-employer contributing entity for public education, the State of Texas contributes to the retirement system an amount equal to the current employer contribution rate times the aggregate annual compensation of all participating members of the pension trust fund during that fiscal year reduced by the amounts described below which are paid by the employers. Employers including public schools are required to pay the employer contribution rate in the following instances:
On the portion of the member's salary that exceeds the statutory minimum for members entitled to the statutory minimum under Section 21.402 of the Texas Education Code.
During a new member's first 90 days of employment When any part or all of an employee's salary is paid by federal funding source or a privately
sponsored source. In addition to the employer contributions listed above, there are two additional surcharges an employer is subject to.
When employing a retiree of the Teacher Retirement System, the employer shall pay both the member contribution and the state contribution as an employment after retirement surcharge.
When a school district does not contribute to the Federal Old-Age, Survivors and Disability Insurance (OASDI) Program for certain employees, they must contribute 1.5% of the state contribution rate for certain instructional or administrative employees, and 100% of the state contribution rate for all other employees.
Actuarial Assumptions. The total pension liability in the August 31, 2015 actuarial valuation was determined using the following actuarial assumptions:
Valuation Date August 31, 2015 Actuarial Cost Method Individual Entry Age Normal Asset Valuation Method Market Value Single Discount Rate 8.00% Long-term expected Investment Rate of Return 8.00% Inflation 2.5% Salary Increases Including Inflation 3.5% to 9.5% Payroll Growth Rate 2.5% Benefit Changes During the Year None Ad hoc Employment Benefit Changes None
The actuarial methods and assumptions are primarily based on a study of actual experience for the four year period ending August 31, 2014 and adopted on September 24, 2015.

39
Discount Rate. The discount rate used to measure the total pension liability was 8.0%. There was no change in the discount rate since the previous year. The projection of cash flows used to determine the discount rate assumed that contributions from plan members and those of the contributing employers and the non-employer contributing entity are made at the statutorily required rates. Based on those assumptions, the pension plan's fiduciary net position was projected to be available to make all future benefit payments of current plan members. Therefore, the long-term expected rate of return on pension plan investments was applied to all periods of projected benefit payments to determine the total pension liability. The long-term rate of return on pension plan investments is 8%. The long-term expected rate of return on pension plan investments was determined using a building-block method in which best-estimates ranges of expected future real rates of return (expected returns, net of pension plan investment expense and inflation) are developed for each major asset class. These ranges are combined to produce the long-term expected rate of return by weighting the expected future real rates of return by the target asset allocation percentage and by adding expected inflation. Best estimates of geometric real rates of return for each major asset class included in the Systems target asset allocation as of August 31, 2015 are summarized below:
Asset Class
Target
Allocation
Real Return Geometric
Basis
Long-Term Expected Portfolio Real Rate of
Return* Global Equity
U.S. 18% 4.6% 1.0% Non-U.S. Developed 13% 5.1% 0.8% Emerging Markets 9% 5.9% 0.7% Directional Hedge Funds 4% 3.2% 0.1% Private Equity 13% 7.0% 1.1%
Stable Value U.S. Treasuries 11% 0.7% 0.1% Absolute Return 0% 1.8% 0.0% Hedge Funds (Stable Value) 4% 3.0% 0.1% Cash 1% -0.2% 0.0%
Real Return Global Inflation Linked Bonds 3% 0.9% 0.0% Real Assets 16% 5.1% 1.1% Energy and Natural Resources 3% 6.6% 0.2% Commodities 0% 1.2% 0.0%
Risk Parity Risk Parity 5% 6.7% 0.3% Inflation Expectations Alpha
2.2% 1.0%
Total 100% 8.7% * The Expected Contribution to Returns incorporates the volatility drag resulting from the conversion between
Arithmetic and Geometric mean returns. Discount Rate Sensitivity Analysis. The following schedule shows the impact of the Net Pension Liability if the discount rate used was 1% less than and 1% greater than the discount rate that was used (8%) in measuring the 2015 Net Pension Liability.
1% Decrease in Discount Rate
(7.0%) Discount Rate
(8.0%)
1% Increase in Discount Rate
(9.0%) District’s proportionate share of the net pension liability:
$ 3,441,716
$ 2,196,637 $ 1,159,563
Pension Liabilities, Pension Expense, and Deferred Outflows of Resources and Deferred Inflows of Resources Related to Pensions. At August 31, 2016, Van Alstyne Independent School District reported a liability of $2,196,637 for its proportionate share of the TRS's net pension liability. This liability reflects a reduction for State pension support provided to Van Alstyne Independent School District. The amount recognized by Van Alstyne Independent School District as its proportionate share of the net pension liability, the related State support, and the

40
total portion of the net pension liability that was associated with Van Alstyne Independent School District were as follows:
District's Proportionate share of the collective net pension liability $ 2,196,637 State's proportionate share that is associated with the District 4,712,011 Total $ 6,908,648
The net pension liability was measured as of August 31, 2015 and the total pension liability used to calculate the net pension liability was determined by an actuarial valuation as of that date. The employer's proportion of the net pension liability was based on the employer's contributions to the pension plan relative to the contributions of all employers to the plan for the period September 1, 2014 thru August 31, 2015. At August 31, 2015 the employer's proportion of the collective net pension liability was 0.000062142% which was an increase of 0.000028012% from its proportion measured as of August 31, 2014. Changes Since the Prior Actuarial Valuation – The following are changes to the actuarial assumptions or other inputs that affected measurement of the total pension liability since the prior measurement period: Economic Assumptions
1. The inflation assumption was decreased from 3.00% to 2.50%. 2. The ultimate merit assumption for long-service employees was decreased from 1.25% to 1.00%. 3. In accordance with the observed experience, there were small adjustments in the service-based promotional/longevity component of the salary scale. 4. The payroll growth assumption was lowered from 3.50% to 2.50%.
Mortality Assumptions
5. The post-retirement mortality tables for non-disabled retirees were updated to reflect recent TRS member experience. Mortality rates will be assumed to continue to improve in the future using a fully generational approach and Scale BB. 6. The post-retirement mortality tables for disabled retirees were updated to reflect recent TRS member experience. Mortality rates will be assumed to continue to improve in the future using a fully generational approach and Scale BB. 7. The pre-retirement mortality tables for active employees were updated to use 90% of the recently published RP-2014 mortality table for active employees. Mortality rates will be assumed to continue to improve in the future using a fully generational approach and Scale BB.
Other Demographic Assumptions
8. Previously, it was assumed 10% of all members who had contributed in the past 5 years to be an active member. This was an implicit rehire assumption because teachers have historically had a high incidence of terminating employment for a time and then returning to the workforce at a later date. This methodology was modified to add a more explicit valuation of the rehire incidence in the termination liabilities, and therefore these 10% are no longer being counted as active members. 9. There were adjustments to the termination patterns for members consistent with experience and future expectations. The termination patterns were adjusted to reflect the rehire assumption. The timing of the termination decrement was also changed from the middle of the year to the beginning to match the actual pattern in the data. 10. Small adjustments were made to the retirement patterns for members consistent with experience and future expectations. 11. Small adjustments to the disability patterns were made for members consistent with experience and future expectations. Two separate patterns were created based on whether the member has 10 years of service or more. 12. For members that become disabled in the future, it is assumed 20% of them will choose a 100% joint and survivor annuity option.
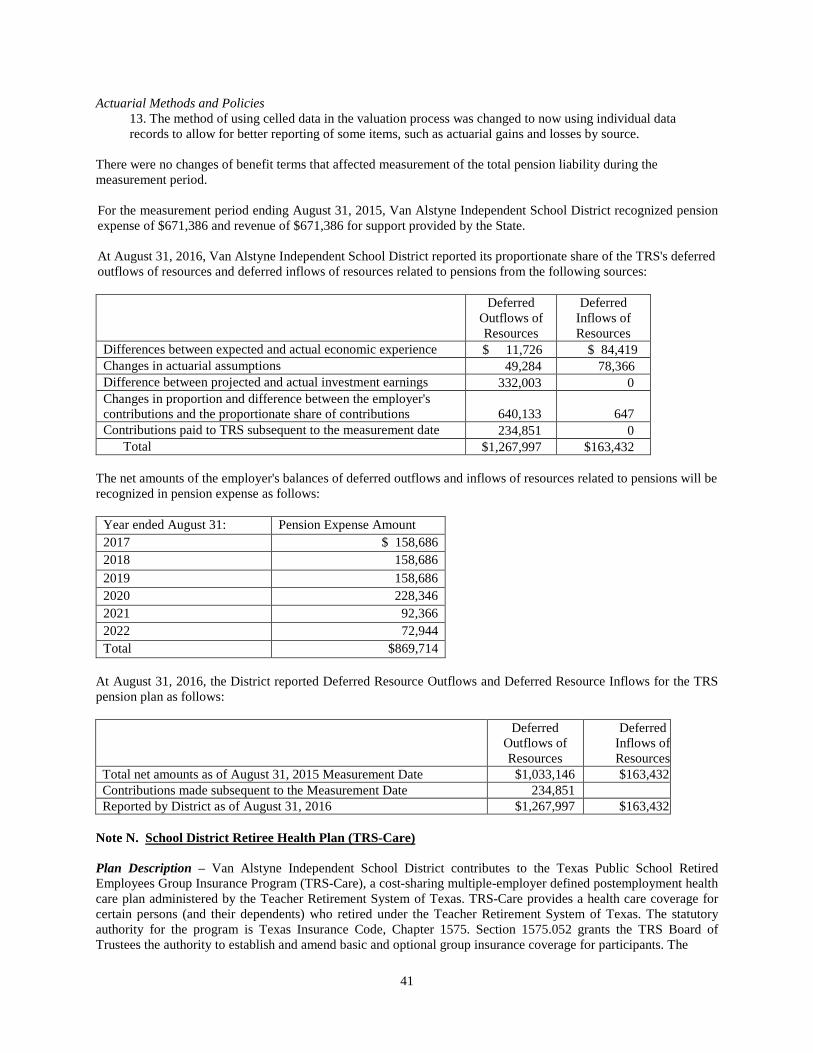
41
Actuarial Methods and Policies 13. The method of using celled data in the valuation process was changed to now using individual data records to allow for better reporting of some items, such as actuarial gains and losses by source.
There were no changes of benefit terms that affected measurement of the total pension liability during the measurement period. For the measurement period ending August 31, 2015, Van Alstyne Independent School District recognized pension expense of $671,386 and revenue of $671,386 for support provided by the State. At August 31, 2016, Van Alstyne Independent School District reported its proportionate share of the TRS's deferred outflows of resources and deferred inflows of resources related to pensions from the following sources: Deferred
Outflows of Resources
Deferred Inflows of Resources
Differences between expected and actual economic experience $ 11,726 $ 84,419 Changes in actuarial assumptions 49,284 78,366 Difference between projected and actual investment earnings 332,003 0 Changes in proportion and difference between the employer's contributions and the proportionate share of contributions 640,133 647 Contributions paid to TRS subsequent to the measurement date 234,851 0 Total $1,267,997 $163,432
The net amounts of the employer's balances of deferred outflows and inflows of resources related to pensions will be recognized in pension expense as follows:
Year ended August 31: Pension Expense Amount 2017 $ 158,686 2018 158,686 2019 158,686 2020 228,346 2021 92,366 2022 72,944 Total $869,714
At August 31, 2016, the District reported Deferred Resource Outflows and Deferred Resource Inflows for the TRS pension plan as follows: Deferred
Outflows of Resources
Deferred Inflows of Resources
Total net amounts as of August 31, 2015 Measurement Date $1,033,146 $163,432, Contributions made subsequent to the Measurement Date 234,851 Reported by District as of August 31, 2016 $1,267,997 $163,432,
Note N. School District Retiree Health Plan (TRS-Care) Plan Description – Van Alstyne Independent School District contributes to the Texas Public School Retired Employees Group Insurance Program (TRS-Care), a cost-sharing multiple-employer defined postemployment health care plan administered by the Teacher Retirement System of Texas. TRS-Care provides a health care coverage for certain persons (and their dependents) who retired under the Teacher Retirement System of Texas. The statutory authority for the program is Texas Insurance Code, Chapter 1575. Section 1575.052 grants the TRS Board of Trustees the authority to establish and amend basic and optional group insurance coverage for participants. The
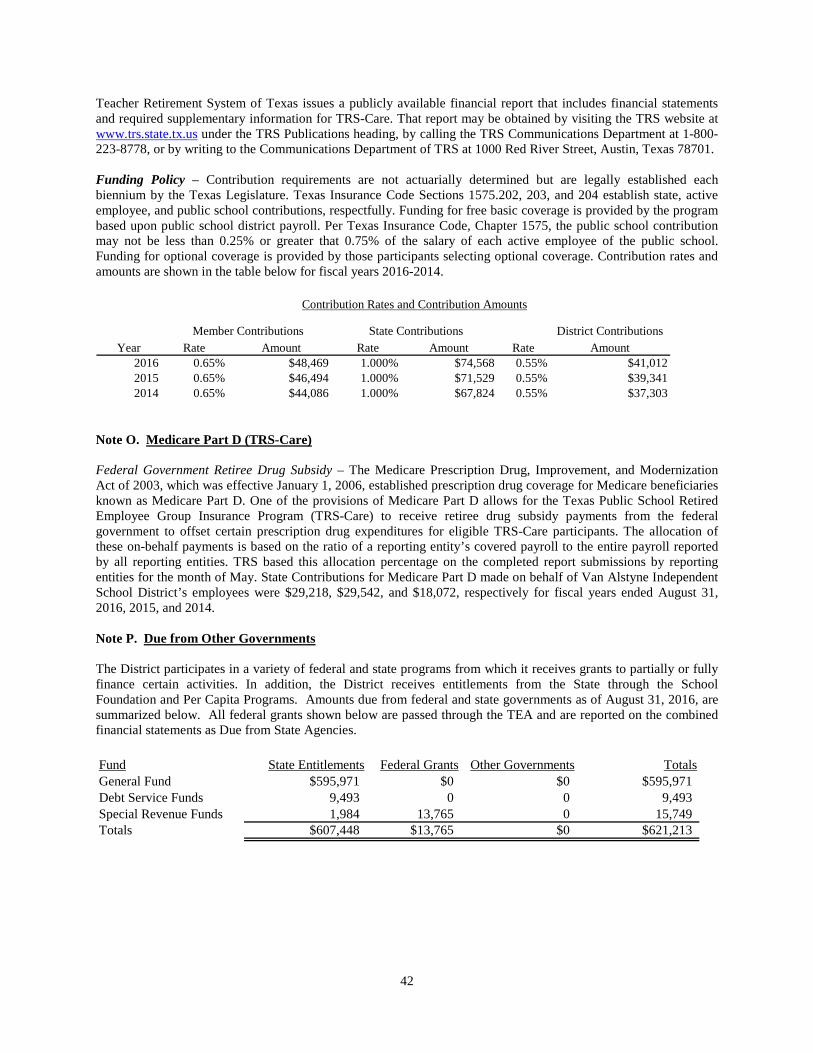
42
Teacher Retirement System of Texas issues a publicly available financial report that includes financial statements and required supplementary information for TRS-Care. That report may be obtained by visiting the TRS website at www.trs.state.tx.us under the TRS Publications heading, by calling the TRS Communications Department at 1-800-223-8778, or by writing to the Communications Department of TRS at 1000 Red River Street, Austin, Texas 78701. Funding Policy – Contribution requirements are not actuarially determined but are legally established each biennium by the Texas Legislature. Texas Insurance Code Sections 1575.202, 203, and 204 establish state, active employee, and public school contributions, respectfully. Funding for free basic coverage is provided by the program based upon public school district payroll. Per Texas Insurance Code, Chapter 1575, the public school contribution may not be less than 0.25% or greater that 0.75% of the salary of each active employee of the public school. Funding for optional coverage is provided by those participants selecting optional coverage. Contribution rates and amounts are shown in the table below for fiscal years 2016-2014.
District ContributionsYear Rate Amount Rate Amount Rate Amount
2016 0.65% $48,469 1.000% $74,568 0.55% $41,0122015 0.65% $46,494 1.000% $71,529 0.55% $39,3412014 0.65% $44,086 1.000% $67,824 0.55% $37,303
Contribution Rates and Contribution Amounts
State ContributionsMember Contributions
Note O. Medicare Part D (TRS-Care) Federal Government Retiree Drug Subsidy – The Medicare Prescription Drug, Improvement, and Modernization Act of 2003, which was effective January 1, 2006, established prescription drug coverage for Medicare beneficiaries known as Medicare Part D. One of the provisions of Medicare Part D allows for the Texas Public School Retired Employee Group Insurance Program (TRS-Care) to receive retiree drug subsidy payments from the federal government to offset certain prescription drug expenditures for eligible TRS-Care participants. The allocation of these on-behalf payments is based on the ratio of a reporting entity’s covered payroll to the entire payroll reported by all reporting entities. TRS based this allocation percentage on the completed report submissions by reporting entities for the month of May. State Contributions for Medicare Part D made on behalf of Van Alstyne Independent School District’s employees were $29,218, $29,542, and $18,072, respectively for fiscal years ended August 31, 2016, 2015, and 2014. Note P. Due from Other Governments The District participates in a variety of federal and state programs from which it receives grants to partially or fully finance certain activities. In addition, the District receives entitlements from the State through the School Foundation and Per Capita Programs. Amounts due from federal and state governments as of August 31, 2016, are summarized below. All federal grants shown below are passed through the TEA and are reported on the combined financial statements as Due from State Agencies. Fund State Entitlements Federal Grants Other Governments TotalsGeneral Fund $595,971 $0 $0 $595,971Debt Service Funds 9,493 0 0 9,493Special Revenue Funds 1,984 13,765 0 15,749Totals $607,448 $13,765 $0 $621,213

43
Note Q. Due to Other Governments As of August 31, 2016, the District had $6,880 due to Texas Education Agency for 2015-2016 state foundation overpaid. The Texas Education Agency will deduct this amount from 2016-2017 state revenue. The District also had $3,749 in the General Fund and $490 in the Debt Service Fund which was due to the county appraisal district for overpaid taxes. The county appraisal district has recovered these amounts from the District in September 2016. Note R. Unearned Revenue & Unavailable Revenue Unearned revenue is that portion of the net revenue receivable which is expected to be collected within the first 60 days following the fiscal year end. Unavailable revenue is that portion of the net revenue receivable which is not expected to be collected within the first 60 days following the fiscal year end. Unearned revenue and Unavailable revenue at August 31, 2016 consisted of the following:
General FundSpecial Revenue Fund
Debt Service Fund Totals
Unearned Revenue:Property Tax Revenue $33,696 $0 $12,037 $45,733Total Unearned Revenue $33,696 $0 $12,037 $45,733Unavailable Revenue:Property Tax Revenue $199,258 $0 $67,788 $267,046Total Unavailable Revenue $199,258 $0 $67,788 $267,046
Note S. Commitments and Contingencies Litigation – The District may be subjected to loss contingencies arising principally in the normal course of operations. In the opinion of the administration, the outcome of any lawsuits will not have a material adverse effect on the accompanying financial statements and accordingly no provision for losses has been recorded. Grant Programs – The District participates in numerous state and federal grant programs, which are governed by various rules and regulations of the grantor agencies; therefore, to the extent that the District has not complied with the rules and regulations governing the grants, refunds of any money received may be required and the collectability of any related receivable at August 31, 2016 may be impaired. In the opinion of the District, there are no significant contingent liabilities related to compliance with rules and regulations governing the respective grants; therefore, no provision has been recorded in the accompanying financial statements for such contingencies. Note T. Revenue from Local and Intermediate Sources During the current year, revenues from local and intermediate sources consisted of the following:

44
General FundSpecial Revenue Funds
Debt Service Fund
Capital Projects Fund Totals
Property Taxes $5,787,669 $0 $2,066,972 $0 $7,854,641Penalties, Interest, & Other Tax Related Income 55,276 0 18,582 0 73,858Investment Income 27,404 15 5,438 2,148 35,005Services to Other LEAs 32,432 0 0 0 32,432Tuition 22,484 94,598 0 0 117,082Gifts & Bequests 43,869 0 0 0 43,869Food Service Sales 0 248,477 0 0 248,477Athletics 50,083 0 0 0 50,083Co-Curricular 117,453 345,741 0 0 463,194Other 62,507 0 0 0 62,507Totals $6,199,177 $688,831 $2,090,992 $2,148 $8,981,148
Note U. Interfund Balances and Transfers In & Out Interfund balances at August 31, 2016, consisted of the following amounts: Due to Internal Service Fund from:General Fund $36,311Total Due to Internal Service Fund from Other Funds $36,311
Interfund transfers for the year ended August 31, 2016, consisted of the following individual amounts: Transfers to Debt Service Fund from:General Fund $167,269Total Transfered to Debt Service Fund from Other Funds $167,269Transfers to Nonmajor Governmental Funds from:General Fund $46,763Total Transfered to Nonmajor Funds from Other Funds $46,763Transfers to General Fund from:Capital Projects Fund $403,658Total Transfered to General Fund from Other Funds $403,658
Note V. Joint Ventures – Shared Service Arrangements The District participates in shared services arrangements for Special Education Services with other school districts. The District does not account for revenues or expenditures in this program and does not disclose them in these financial statements. The District neither has a joint ownership interest in fixed assets purchased by the fiscal agent, nor does the district have a net equity interest in the fiscal agent. The fiscal agent is neither accumulating significant financial resources nor fiscal exigencies that would give rise to a future additional benefit or burden to Van Alstyne Independent School District. The fiscal agent manager is responsible for all financial activities of the shared services arrangement. Note W. Subsequent Events In reviewing its financial statements, management has evaluated events subsequent to the balance sheet date through November 22, 2016, which is the date the financial statements were available to be issued.

45
REQUIRED SUPPLEMENTAL INFORMATION

EXHIBIT G-1VAN ALSTYNE INDEPENDENT SCHOOL DISTRICT
STATEMENT OF REVENUES, EXPENDITURES, AND CHANGES IN FUND BALANCE
BUDGET AND ACTUAL - GENERAL FUND
FOR THE YEAR ENDED AUGUST 31, 2016
Control
Data
CodesOriginal Final
(GAAP BASIS)
(Negative)
Positive or
Final BudgetVariance WithActual Amounts
Budgeted Amounts
REVENUES:6,269,857 5,937,554 6,199,177 (70,680)Total Local and Intermediate Sources $ $ $ $5700
6,240,226 5,739,120 6,527,056 286,830 State Program Revenues5800
76,900 40,000 85,134 8,234 Federal Program Revenues5900
Total Revenues5020 11,716,674 12,586,983 12,811,367 224,384
EXPENDITURES:
Current:6,339,581 6,042,209 6,323,387 16,194 Instruction0011
137,180 151,651 134,649 2,531 Instructional Resources and Media Services0012
148,366 153,366 147,093 1,273 Curriculum and Instructional Staff Development0013
685,905 686,831 680,119 5,786 School Leadership0023
203,834 203,834 202,768 1,066 Guidance, Counseling and Evaluation Services0031
140,617 136,817 139,003 1,614 Health Services0033
268,988 266,216 240,820 28,168 Student (Pupil) Transportation0034
888,015 621,809 826,444 61,571 Extracurricular Activities0036
569,518 552,518 564,077 5,441 General Administration0041
1,457,842 1,401,888 1,404,847 52,995 Facilities Maintenance and Operations0051
40,000 15,000 35,476 4,524 Security and Monitoring Services0052
314,323 314,323 298,568 15,755 Data Processing Services0053
Debt Service:45,774 - 45,774 - Principal on Long Term Debt0071
1,290 - 1,290 - Interest on Long Term Debt0072
Capital Outlay:566,602 350,000 59,738 506,864 Facilities Acquisition and Construction0081
Intergovernmental:
245,244 245,244 227,664 17,580 Payments to Fiscal Agent/Member Districts of SSA0093
135,000 135,000 134,361 639 Other Intergovernmental Charges0099
Total Expenditures6030 11,276,706 12,188,079 11,466,078 722,001
1100 Excess of Revenues Over Expenditures
439,968 398,904 1,345,289 946,385
OTHER FINANCING SOURCES (USES): 404,000 - 403,658 (342)Transfers In7915
(352,517)(392,903) (214,032) 138,485 Transfers Out (Use)8911
Total Other Financing Sources (Uses) 7080 (392,903) 51,483 189,626 138,143
1200 Net Change in Fund Balances 47,065 450,387 1,534,915 1,084,528
0100 Fund Balance - September 1 (Beginning) 3,266,920 3,266,920 3,266,920 -
3000 Fund Balance - August 31 (Ending) $ 3,313,985 $ 3,717,307 $ 4,801,835 $ 1,084,528
46

SCHEDULE OF THE DISTRICT'S PROPORTIONATE SHARE OF THE NET PENSION LIABILITY
FOR THE YEAR ENDED AUGUST 31, 2016
TEACHER RETIREMENT SYSTEM OF TEXAS
VAN ALSTYNE INDEPENDENT SCHOOL DISTRICT EXHIBIT G-2
20152016
0.000062142%District's Proportion of the Net Pension Liability (Asset) 0.00003413%
2,196,637 $District's Proportionate Share of Net Pension Liability (Asset) 911,660 $
4,712,011 State's Proportionate Share of the Net Pension Liability (Asset) associated with the District
3,997,177
4,908,837$Total $ 6,908,648
7,152,922 $District's Covered-Employee Payroll 6,782,441 $
30.71%District's Proportionate Share of the Net Pension Liability (Asset) as a Percentage of its Covered-Employee Payroll
13.44%
78.43%Plan Fiduciary Net Position as a Percentage of the Total Pension Liability 83.25%
Note: In accordance with GASB 68, Paragraph 138, only two years of data are presented this reporting period. "The information for all periods for the 10-year schedules that are required to be presented as required supplementary information may not be available initially. In these cases, during the transition period, that information should be presented for as many years as are available. The schedules should not include information that is not measured in accordance with the requirements of this Statement."
Note: GASB 68, Paragraph 81 requires that the information on this schedule be data from the period corresponding with the periods covered as of the measurement dates of August 31, 2015 for Year 2016 and August 31, 2014 for 2015.
47

SCHEDULE OF DISTRICT CONTRIBUTIONS
TEACHER RETIREMENT SYSTEM OF TEXAS
FOR FISCAL YEAR 2016
VAN ALSTYNE INDEPENDENT SCHOOL DISTRICT EXHIBIT G-3
20152016
Contractually Required Contribution 224,993 $$ 234,851
Contribution in Relation to the Contractually Required Contribution 224,993 234,851
Contribution Deficiency (Excess)-0-$$ -0-
District's Covered-Employee Payroll 7,152,922 $$ 7,456,811
Contributions as a Percentage of Covered-Employee Payroll 3.15%3.15%
Note: In accordance with GASB 68, Paragraph 138, only two years of data are presented this reporting period. "The information for all periods for the 10-year schedules that are required to be presented as required supplementary information may not be available initially. In these cases, during the transition period, that information should be presented for as many years as are available. The schedules should not include information that is not measured in accordance with the requirements of this Statement."
Note: GASB 68, Paragraph 81 requires that the data in this schedule be presented as of the District's respective fiscal years as opposed to the time periods covered by the measurement dates ending August 31, 2014 for Fiscal Year 2015 and August 31, 2015 for Fiscal Year 2016.
48

49
VAN ALSTYNE INDEPENDENT SCHOOL DISTRICT NOTES TO REQUIRED SUPPLEMENTARY INFORMATION
FOR THE YEAR ENDED AUGUST 31, 2016
Changes of benefit terms. There were no changes of benefit terms that affected measurement of the total pension liability during the measurement period. Changes of assumptions. The following are changes to the actuarial assumptions or other inputs that affected the measurement of the total pension liability since the prior measurement period. Economic Assumptions
1. The inflation assumption was decreased from 3.00% to 2.50%. 2. The ultimate merit assumption for long-service employees was decreased from 1.25% to 1.00%. 3. In accordance with the observed experience, there were small adjustments in the service-based
promotional/longevity component of the salary scale. 4. The payroll growth assumption was lowered from 3.50% to 2.50%.
Mortality Assumptions
5. The post-retirement mortality tables for non-disabled retirees were updated to reflect recent TRS member experience. Mortality rates will be assumed to continue to improve in the future using a fully generational approach and Scale BB.
6. The post-retirement mortality tables for disabled retirees were updated to reflect recent TRS member experience. Mortality rates will be assumed to continue to improve in the future using a fully generational approach and Scale BB.
7. The pre-retirement mortality tables for active employees were updated to use 90% of the recently published RP-2014 mortality table for active employees. Mortality rates will be assumed to continue to improve in the future using a fully generational approach and Scale BB.
Other Demographic Assumptions
8. Previously, it was assumed 10% of all members who had contributed in the past 5 years to be an active member. This was an implicit rehire assumption because teachers have historically had a high incidence of terminating employment for a time and then returning to the workforce at a later date. This methodology was modified to add a more explicit valuation of the rehire incidence in the termination liabilities, and therefore these 10% are no longer being counted as active members.
9. There were adjustments to the termination patterns for members consistent with experience and future expectations. The termination patterns were adjusted to reflect the rehire assumption. The timing of the termination decrement was also changed from the middle of the year to the beginning to match the actual pattern in the data.

50
THIS PAGE LEFT BLANK INTENTIONALLY

51
COMBINING STATEMENTS

VAN ALSTYNE INDEPENDENT SCHOOL DISTRICT
COMBINING BALANCE SHEETNONMAJOR GOVERNMENTAL FUNDS
AUGUST 31, 2016
Control
Data
Codes
ESEA I, A
Improving
Basic Program Lunch Program
Breakfast and
National
Recruiting
Training and
ESEA II, A
211 240 255
ASSETS
5,599 7,315 (3,434)Cash and Cash Equivalents $ $ $1110
9,141 - 4,624 Receivables from Other Governments1240
Total Assets1000 7,315 14,740 1,190 $ $ $
LIABILITIES
14,467 6,681 1,087 Accrued Wages Payable $ $ $2160
273 634 103 Accrued Expenditures2200
Total Liabilities2000 7,315 14,740 1,190
FUND BALANCES
Restricted Fund Balance:
- - - Other Restricted Fund Balance3490
Committed Fund Balance:
- - - Other Committed Fund Balance3545
Total Fund Balances3000 - - -
4000 Total Liabilities and Fund Balances 7,315 14,740 1,190 $ $ $
52
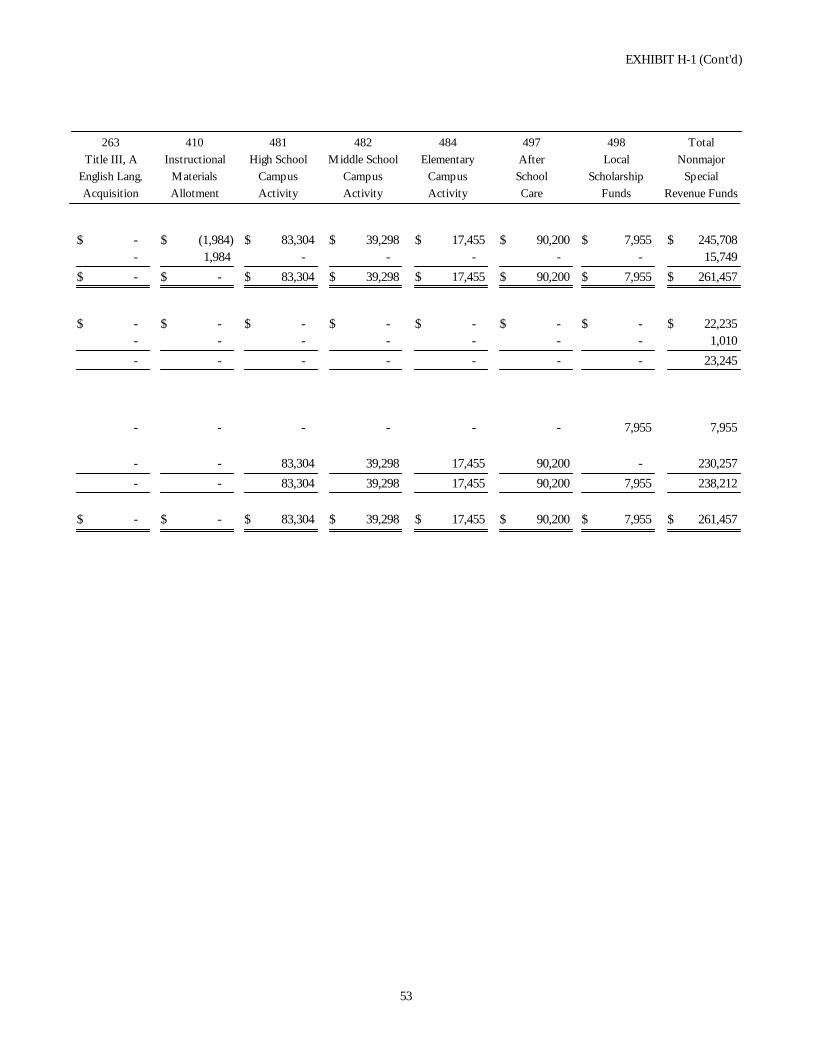
EXHIBIT H-1 (Cont'd)
Title III, A
English Lang.
Allotment
Materials
Instructional
Activity
Campus
High School
Activity
Campus
Middle School Elementary
Campus
Activity
After
School
Care
Nonmajor
Special
Revenue Funds
Local
Scholarship
Funds
263 410 481 482 484 497 498 Total
Acquisition
17,455 39,298 90,200 - (1,984) 83,304 7,955 245,708 $ $ $ $ $ $ $ $
- - - - 1,984 - - 15,749
- - 83,304 39,298 17,455 90,200 7,955 261,457 $ $ $ $ $ $ $ $
- - - - - - - 22,235 $ $ $ $ $ $ $ $
- - - - - - - 1,010
- - - - - - - 23,245
- - - - - - 7,955 7,955
17,455 39,298 90,200 - - 83,304 - 230,257
- - 83,304 39,298 17,455 90,200 7,955 238,212
- - 83,304 39,298 17,455 7,955 261,457 $ $ $ $ $ $ $ $90,200
53
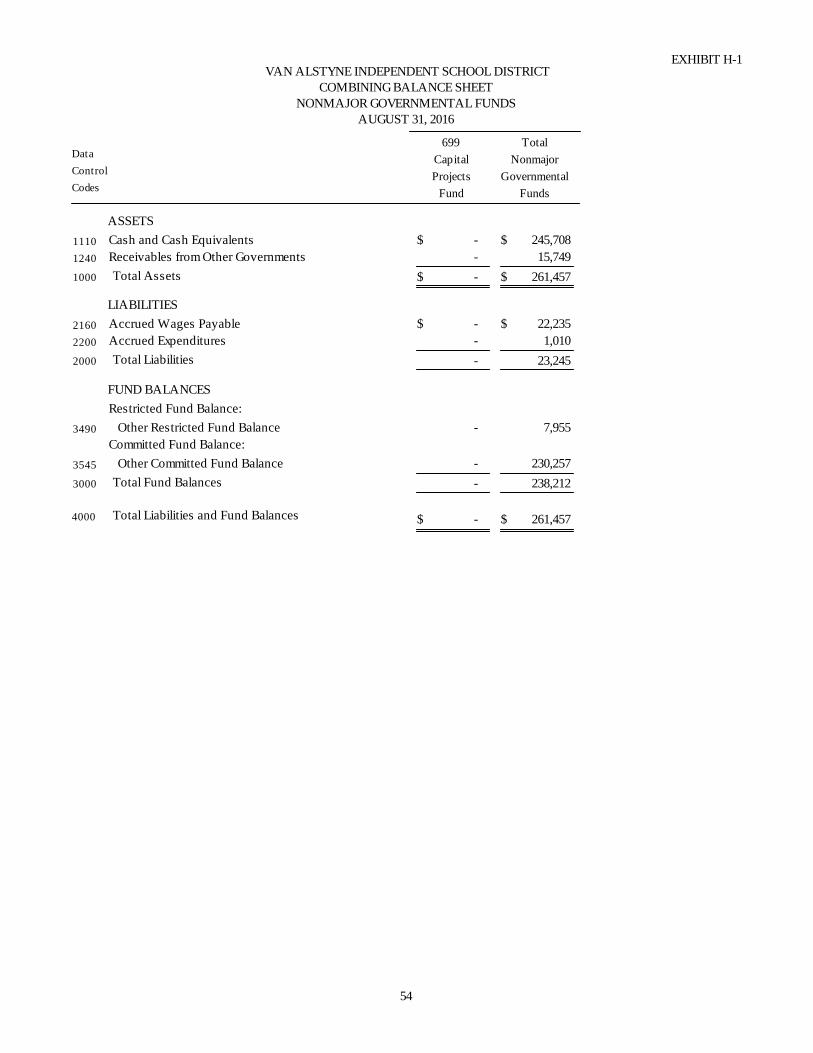
EXHIBIT H-1VAN ALSTYNE INDEPENDENT SCHOOL DISTRICT
COMBINING BALANCE SHEETNONMAJOR GOVERNMENTAL FUNDS
AUGUST 31, 2016
Control
Data
Codes
Capital
Projects
Fund Funds
Governmental
Nonmajor
699 Total
ASSETS
245,708 - Cash and Cash Equivalents $ $1110
15,749 - Receivables from Other Governments1240
Total Assets1000 - 261,457 $ $
LIABILITIES
22,235 - Accrued Wages Payable $ $2160
1,010 - Accrued Expenditures2200
Total Liabilities2000 - 23,245
FUND BALANCES
Restricted Fund Balance:
7,955 - Other Restricted Fund Balance3490
Committed Fund Balance:
230,257 - Other Committed Fund Balance3545
Total Fund Balances3000 - 238,212
4000 Total Liabilities and Fund Balances - 261,457 $ $
54
55
THIS PAGE LEFT BLANK INTENTIONALLY

VAN ALSTYNE INDEPENDENT SCHOOL DISTRICT
COMBINING STATEMENT OF REVENUES, EXPENDITURES AND CHANGES INFUND BALANCES - NONMAJOR GOVERNMENTAL FUNDS
FOR THE YEAR ENDED AUGUST 31, 2016
Control
Data
Codes
ESEA I, A
Improving
Basic Program Lunch Program
Breakfast and
National
Recruiting
Training and
ESEA II, A
211 240 255
REVENUES:248,477 - - Total Local and Intermediate Sources5700 $ $ $
2,438 - - State Program Revenues5800260,509 103,251 23,609 Federal Program Revenues5900
Total Revenues5020 103,251 511,424 23,609
EXPENDITURES:
Current: - 103,251 23,609 Instruction0011
558,187 - - Food Services0035 - - - Extracurricular Activities0036 - - - Community Services0061
Capital Outlay: - - - Facilities Acquisition and Construction0081
Total Expenditures6030 103,251 558,187 23,609
1100 Excess (Deficiency) of Revenues Over (Under) Expenditures
- (46,763) -
OTHER FINANCING SOURCES (USES): 46,763 - - Transfers In7915
- - - Transfers Out (Use)8911
Total Other Financing Sources (Uses) 7080 - 46,763 -
1200 Net Change in Fund Balance
0100 Fund Balance - September 1 (Beginning)
3000 Fund Balance - August 31 (Ending)
- - -
- - -
$ - $ - $ -
56

EXHIBIT H-2 (Cont'd)
Title III, A
English Lang.
Acquisition Allotment
Materials
Instructional
Activity
Campus
High School
Activity
Campus
Middle School
263 410 481 482 Total
Nonmajor
Special
Revenue Funds
498
Local
Scholarship
Funds
497
After
School
Care
484
Elementary
Campus
Activity
- - 129,810 131,898 688,831 15 94,598 84,033 $ $ $ $ $ $ $ $122,099 - - - 124,537 - - -
- 1,555 - - 388,924 - - -
1,555 122,099 129,810 131,898 1,202,292 15 94,598 84,033
122,099 1,555 - - 250,514 - - - - - - - 558,187 - - - - - 97,494 127,950 307,141 - - 81,697 - - - - 45,512 - 45,512 -
- - - - - - - -
1,555 122,099 97,494 127,950 1,161,354 - 45,512 81,697
- - 32,316 3,948 2,336 49,086 15 40,938
- - - - 46,763 - - - - - - - (41,000) - (41,000) -
- - - - 5,763 - (41,000) -
-
-
$ -
-
-
$ -
32,316 3,948
50,988
$ 83,304
35,350
$ 39,298
2,336 8,086 15 46,701
15,119 82,114 7,940 191,511
$ 17,455 $ 90,200 7,955 $ $ 238,212
57

EXHIBIT H-2VAN ALSTYNE INDEPENDENT SCHOOL DISTRICT
COMBINING STATEMENT OF REVENUES, EXPENDITURES AND CHANGES INFUND BALANCES - NONMAJOR GOVERNMENTAL FUNDS
FOR THE YEAR ENDED AUGUST 31, 2016
Control
Data
Codes
Capital
Projects
Fund Funds
Governmental
Nonmajor
699 Total
REVENUES:690,979 2,148 Total Local and Intermediate Sources5700 $ $124,537 - State Program Revenues5800388,924 - Federal Program Revenues5900
Total Revenues5020 2,148 1,204,440
EXPENDITURES:
Current:
250,514 - Instruction0011558,187 - Food Services0035307,141 - Extracurricular Activities003645,512 - Community Services0061
Capital Outlay:
1,457,427 1,457,427 Facilities Acquisition and Construction0081
Total Expenditures6030 1,457,427 2,618,781
Excess (Deficiency) of Revenues Over (Under) Expenditures
1100 (1,455,279) (1,414,341)
OTHER FINANCING SOURCES (USES): 46,763 - Transfers In7915
(403,658)(362,658)Transfers Out (Use)8911
Total Other Financing Sources (Uses) 7080 (362,658) (356,895)
1200 Net Change in Fund Balance
0100 Fund Balance - September 1 (Beginning)
3000 Fund Balance - August 31 (Ending)
(1,817,937) (1,771,236)
1,817,937 2,009,448
$ - $ 238,212
58

59
REQUIRED TEXAS EDUCATION AGENCY SCHEDULES

VAN ALSTYNE INDEPENDENT SCHOOL DISTRICT
SCHEDULE OF DELINQUENT TAXES RECEIVABLE
FISCAL YEAR ENDED AUGUST 31, 2016
Last 10 Years Ended
August 31
Tax Rates
Debt ServiceMaintenance Tax Purposes
Value for School
Assessed/Appraised
(1) (2) (3)
0.3200001.370000 322,510,321 and prior years2007 $$ $
0.3100001.040000 352,053,519 2008
0.4000001.120000 377,356,139 2009
0.4000001.120000 400,533,998 2010
0.4000001.120000 410,468,535 2011
0.4000001.120000 407,511,574 2012
0.4000001.120000 405,677,637 2013
0.4000001.120000 458,603,711 2014
0.4000001.120000 496,876,241 2015
0.4000001.120000 517,257,359 (School year under audit)2016
1000 TOTALS
60

EXHIBIT J-1
9/1/2015
Balance
Beginning
Total Levy
Year's
Current
(20)(10) (50)
Ending
Balance
8/31/2016
(40)
Entire
Year's
Adjustments
(31)
Maintenance
Collections
(32)
Debt Service
Collections
- 33,061 420 (3,197)$ $ $ $ $ 29,346 $ 98
- 10,664 19 (142) 10,497 6
- 13,016 26 (401) 12,580 9
- 21,469 70 (594) 20,780 25
- 23,496 713 (139) 22,389 255
- 20,976 1,136 (182) 19,252 406
- 37,244 11,827 (153) 21,040 4,224
- 54,634 14,670 (435) 34,290 5,239
- 113,749 40,254 (13,870) 45,249 14,376
7,862,312 - 5,718,534 - 101,444 2,042,334
$ 316,867 $ (19,113)$ 5,787,669 $ 7,862,312 $ 328,309 $ 2,066,972
61

EXHIBIT J-2VAN ALSTYNE INDEPENDENT SCHOOL DISTRICT
SCHEDULE OF REVENUES, EXPENDITURES, AND CHANGES IN FUND BALANCE
BUDGET AND ACTUAL - CHILD NUTRITION PROGRAM
FOR THE YEAR ENDED AUGUST 31, 2016
Control
Data
CodesOriginal Final
(GAAP BASIS)
(Negative)
Positive or
Final BudgetVariance WithActual Amounts
Budgeted Amounts
REVENUES:302,978 209,978 248,477 (54,501)Total Local and Intermediate Sources $ $ $ $5700
18,905 18,630 2,438 (16,467)State Program Revenues5800
271,809 247,000 260,509 (11,300)Federal Program Revenues5900
Total Revenues5020 475,608 593,692 511,424 (82,268)
EXPENDITURES:640,692 475,608 558,187 82,505 Food Services0035
Total Expenditures6030 475,608 640,692 558,187 82,505
1100 Excess (Deficiency) of Revenues Over (Under) Expenditures
- (47,000) (46,763) 237
OTHER FINANCING SOURCES (USES): 47,000 - 46,763 (237)Transfers In7915
1200 Net Change in Fund Balances - - - -
0100 Fund Balance - September 1 (Beginning) - - - -
3000 Fund Balance - August 31 (Ending) $ - $ - $ - $ -
62

EXHIBIT J-3VAN ALSTYNE INDEPENDENT SCHOOL DISTRICT
SCHEDULE OF REVENUES, EXPENDITURES, AND CHANGES IN FUND BALANCE
BUDGET AND ACTUAL - DEBT SERVICE FUND
FOR THE YEAR ENDED AUGUST 31, 2016
Control
Data
CodesOriginal Final
(GAAP BASIS)
(Negative)
Positive or
Final BudgetVariance WithActual Amounts
Budgeted Amounts
REVENUES:2,107,000 2,103,000 2,090,992 (16,008)Total Local and Intermediate Sources $ $ $ $5700
139,221 - 94,021 (45,200)State Program Revenues5800
Total Revenues5020 2,103,000 2,246,221 2,185,013 (61,208)
EXPENDITURES:
Debt Service:970,000 915,000 970,000 - Principal on Long Term Debt0071
1,523,045 1,580,903 1,523,045 - Interest on Long Term Debt0072
92,165 4,000 92,165 - Bond Issuance Cost and Fees0073
Total Expenditures6030 2,499,903 2,585,210 2,585,210 -
1100 Excess (Deficiency) of Revenues Over (Under) Expenditures
(396,903) (338,989) (400,197) (61,208)
OTHER FINANCING SOURCES (USES): 6,295,000 - 6,312,107 17,107 Refunding Bonds Issued7901
305,517 392,903 167,269 (138,248)Transfers In7915
785,943 - 785,943 - Premium or Discount on Issuance of Bonds7916
(6,993,027) - (6,993,027) - Payment to Bond Refunding Escrow Agent (Use)8940
Total Other Financing Sources (Uses) 7080 392,903 393,433 272,292 (121,141)
1200 Net Change in Fund Balances (4,000) 54,444 (127,905) (182,349)
0100 Fund Balance - September 1 (Beginning) 150,116 150,116 150,116 -
3000 Fund Balance - August 31 (Ending) $ 146,116 $ 204,559 $ 22,211 $ (182,348)
63

64
THIS PAGE LEFT BLANK INTENTIONALLY

65
COMPLIANCE & INTERNAL CONTROL SECTION

66
Morgan, Davis, & Company, P.C. Post Office Box 8158
Greenville, Texas 75404
Report on Internal Control Over Financial Reporting and on Compliance and Other Matters Based on an Audit of Financial Statements Performed in Accordance With Government Auditing Standards
Independent Auditor's Report
Van Alstyne Independent School District 549 Miller Lane Van Alstyne, Texas 75495 We have audited, in accordance with the auditing standards generally accepted in the United States of America and the standards applicable to financial audits contained in Government Auditing Standards issued by the Comptroller General of the United States, the financial statements of the governmental activities, each major fund, and the aggregate remaining fund information of Van Alstyne Independent School District, as of and for the year ended August 31, 2016 and the related notes to the financial statements, which collectively comprise the District's basic financial statements, and have issued our report thereon dated November 22, 2016. Internal Control Over Financial Reporting In planning and performing our audit of the financial statements, we considered Van Alstyne Independent School District's internal control over financial reporting (internal control) to determine the audit procedures that are appropriate in the circumstances for the purpose of expressing our opinions on the financial statements, but not for the purpose of expressing an opinion on the effectiveness of Van Alstyne Independent School District's internal control. Accordingly, we do not express an opinion on the effectiveness of Van Alstyne Independent School District's internal control. A deficiency in internal control exists when the design or operation of a control does not allow management or employees, in the normal course of performing their assigned functions, to prevent, or detect and correct, misstatements on a timely basis. A material weakness is a deficiency, or a combination of deficiencies, in internal control, such that there is a reasonable possibility that a material misstatement of the entity's financial statements will not be prevented, or detected and corrected on a timely basis. A significant deficiency is a deficiency, or a combination of deficiencies, in internal control that is less severe than a material weakness, yet important enough to merit attention by those charged with governance. Our consideration of internal control was for the limited purpose described in the first paragraph of this section and was not designed to identify all deficiencies in internal control that might be material weaknesses or significant deficiencies. Given these limitations, during our audit we did not identify any deficiencies in internal control that we consider to be material weaknesses. However, material weaknesses may exist that have not been identified. Compliance and Other Matters As part of obtaining reasonable assurance about whether Van Alstyne Independent School District's financial statements are free from material misstatement, we performed tests of its compliance with certain provisions of laws, regulations, contracts, and grant agreements, noncompliance with which could have a direct and material effect on the determination of financial statement amounts. However, providing an opinion on compliance with those provisions was not an objective of our audit, and accordingly, we do not express such an opinion. The results of our tests disclosed no instances of noncompliance or other matters that are required to be reported under Government Auditing Standards.

67
Purpose of this Report The purpose of this report is solely to describe the scope of our testing of internal control and compliance and the results of that testing, and not to provide an opinion on the effectiveness of the entity's internal control or on compliance. This report is an integral part of an audit performed in accordance with Government Auditing Standards in considering the entity's internal control and compliance. Accordingly, this communication is not suitable for any other purpose. /s/ Morgan, Davis, & Company, P.C. __________________________ Morgan, Davis, & Company, P.C. Greenville, Texas November 22, 2016

68
VAN ALSTYNE INDEPENDENT SCHOOL DISTRICT
SCHEDULE OF FINDINGS AND QUESTIONED COSTS FOR THE YEAR ENDED AUGUST 31, 2016
Summary of Auditor’s Results: The type of report we issued on whether the financial statements of Van Alstyne Independent School District were prepared in accordance with GAAP as an unmodified opinion. With respect to internal control over financial reporting, we identified no material weaknesses and we reported no significant deficiencies. We noted no noncompliance material to the financial statements, Financial Statements Findings: There are no findings related to financial statements which are required to be reported in accordance with Generally Accepted Auditing Standards.

69
VAN ALSTYNE INDEPENDENT SCHOOL DISTRICT SCHEDULE OF STATUS OF PRIOR AUDIT FINDINGS
FOR THE YEAR ENDED AUGUST 31, 2016
(Prepared by the District’s Administration)
There were no prior audit findings which required corrective action.

70
VAN ALSTYNE INDEPENDENT SCHOOL DISTRICT CORRECTIVE ACTION PLAN
FOR THE YEAR ENDED AUGUST 31, 2016
(Prepared by the District’s Administration)
There were no corrective actions necessary for the year ended August 31, 2016.

SCHOOLS FIRST QUESTIONNAIRE
Van Alstyne Independent School District Fiscal Year 2016
Were there any disclosures in the Annual Financial Report and/or other sources of information concerning nonpayment of any terms of any debt agreement at fiscal year end?
NoSF2
Was there an unmodified opinion in the Annual Financial Report on the financial statements as a whole?
YesSF4
Did the Annual Financial Report disclose any instances of material weaknesses in internal controls over financial reporting and compliance for local, state, or federal funds?
NoSF5
Was there any disclosure in the Annual Financial Report of material noncompliance for grants, contracts, and laws related to local, state, or federal funds?
NoSF6
Did the school district make timely payments to the Teachers Retirement System (TRS), Texas Workforce Commission (TWC), Internal Revenue Service (IRS), and other government agencies?
YesSF7
Did the school district not receive an adjusted repayment schedule for more than one fiscal year for an over allocation of Foundation School Program (FSP) funds as a result of a financial hardship?
NoSF8
Total accumulated accretion on CABs included in government-wide financial statements at fiscal year-end.
16,965SF10
Net Pension Assets (1920) at fiscal year-end. 0SF11
Net Pension Liabilities (2540) at fiscal year-end. 2,196,637SF12
Pension Expense (6147) at fiscal year-end. 199,884SF13