v. rouillard 2003 1 introduction to measurement and statistical analysis assessing experimental...
TRANSCRIPT

V. Rouillard 2003
1 Introduction to measurement and statistical analysis
ASSESSING EXPERIMENTAL DATA : ERRORS
• Remember: no measurement is perfect – errors always exist.
• Measurement error is defined as the difference between the true value and the
measured value.
• We can only estimate the size of the error or its likelihood that it exceeds a certain
value.
• Errors can be estimated statistically when large number of measurements are taken.
• However, must ensure that measurement systems are calibrated.

V. Rouillard 2003
2 Introduction to measurement and statistical analysis
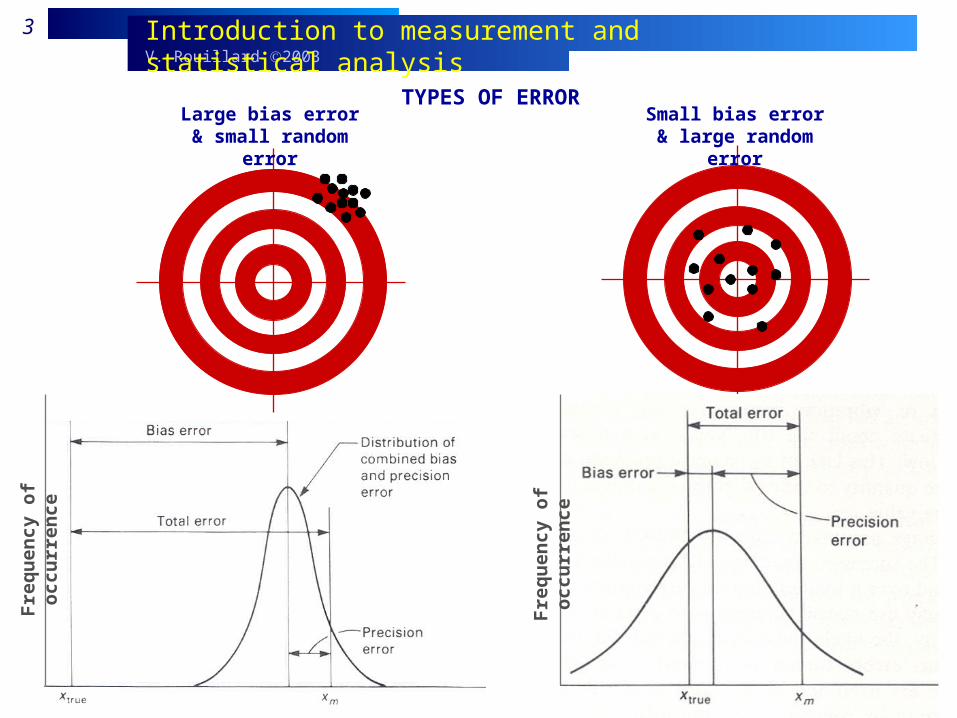
TYPES OF ERROR
• Most errors can be put into two classes: Bias errors and Precision errors.
• Bias errors are also referred to as systematic errors and remain the same for every
measurement made.
• Precision errors are also called random errors and are different for each measurement
made. However, the average value of the random error is zero.
• If enough measurements are repeated, the distribution of precision errors will be
revealed and the likely size of the error can be estimated statistically.
• Because bias errors are fixed and do not produce a statistical distribution, they cannot
be estimated using statistical techniques.
• They can only be estimated by comparison with a standard or another instrument or
even by experience and common sense.
V. Rouillard 2003
3 Introduction to measurement and statistical analysis
TYPES OF ERRORLarge bias error &
small random error
Small bias error & large random
error
Fre
qu
enc
y o
f o
ccu
rren
ce
Fre
qu
enc
y o
f o
ccu
rren
ce

V. Rouillard 2003
4 Introduction to measurement and statistical analysis
COMMON SOURCES OF ERROR
Bias errors:
• Calibration (eg: zero-offset and scale adjustments)
• Certain consistently recurring human errors (eg: parallax, poor
synchronisation)
• Certain errors caused by defective equipment (eg: poor design, fabrication
and maintenance)
• Loading errors (eg: microphone, vehicle speed gun)
• Resolution limitations (eg: lack of significant figures in digital displays)
Random errors:
• Certain human errors (eg: lack of concentration)
• Disturbances to equipment (eg: ground vibrations, atmospheric conditions)
• Fluctuating experimental conditions (eg: poor experimental design, must
account for inherent oscillations/variations of the measurand)
• System sensitivity imitations (eg: use bathroom scale to measure mass of
small animal)

V. Rouillard 2003
5 Introduction to measurement and statistical analysis
COMMON SOURCES OF ERROR
Combined errors:
• Backlash, friction and hysteresis (eg: in mechanical indicators such as
pressure gauges)
• Calibration drift or reaction to changing environmental conditions.
• Variations in procedure (eg: when short cuts are taken or personnel changes)
Illegitimate errors (mistakes):
• Blunders and mistakes (eg: forgot to switch on amplifier, write phone number
instead of reading)
• Computational errors (eg: use wrong calibration constant)

V. Rouillard 2003
6 Introduction to measurement and statistical analysis
INSTRUMENT PERFORMANCE : TERMINOLOGY
• Accuracy: (expected) closeness with which a measurement approaches the true
value.
• Precision: indication of the reproducibility of measurements. If a variable is fixed,
precision is the measure of the degree to which successive measurements differ
from one another.
• Resolution: The smallest change in the measurand that the instrument will detect.
• Sensitivity: The ratio of the instrument response to an change in the measured
quantity. Eg: and accelerometer with a sensitivity of 100 mV/g is more sensitive
than one with a sensitivity of 10 mV/g.
• Error: Difference between the true value and the measured value.

V. Rouillard 2003
7 Introduction to measurement and statistical analysis
UNCERTAINTY : ESTIMATING THE LEVEL OF MEASUREMENT ERROR.
• Total uncertainty, U, combines the bias and random uncertainties as follows:
• This method is based on the assumption that the sources of bias and random
errors are independent and they are therefore unlikely to coincide.
• Remember: The bias uncertainty is estimated from calibration checks while the
random uncertainty is estimated by statistical analysis of repeat measurements.
U B Rx x x ( )2 2

V. Rouillard 2003
8 Introduction to measurement and statistical analysis
ESTIMATING THE RANDOM (PRECISION) UNCERTAINTYStatistical Analysis
• A measurement sample is drawn from the population to make an estimate of the
measurand.
• In may be that no two samples (4 blades) will have precisely the same value.
• But each sample (and specimen) should approximate the average value for the
populationPopulation

V. Rouillard 2003
9 Introduction to measurement and statistical analysis
ESTIMATING THE RANDOM (PRECISION) UNCERTAINTYStatistical Analysis
• A measurement sample is drawn from the population to make an estimate of the
measurand.
• In may be that no two samples (4 blades) will have precisely the same value.
• But each sample (and specimen) should approximate the average value for the
populationPopulation Sample
(random selection from population)

V. Rouillard 2003
10 Introduction to measurement and statistical analysis
ESTIMATING THE RANDOM (PRECISION) UNCERTAINTYStatistical Analysis
• Manufacturing (production) uncertainty: Analyse repeat measurements from the sample
(each specimen is measured only once).
• Experimental uncertainty: Analyse repeat measurements from one individual specimen
only.

V. Rouillard 2003
11 Introduction to measurement and statistical analysis
ESTIMATING THE RANDOM (PRECISION) UNCERTAINTYStatistical Analysis
• Statistical analysis and interpretation meaningful only of a (relatively) large number of
measurements are made.
• Systematic errors should be kept small. Statistical treatment cannot remove systematic
(bias) errors.
• Arithmetic mean:
• Deviation from the mean: Difference between an individual reading and the mean of
the group of readings: (note: the algebraic sum of all deviations = zero)
xxn
d x x d x x d x xn n1 1 2 2 .......

V. Rouillard 2003
12 Introduction to measurement and statistical analysis
ESTIMATING THE RANDOM (PRECISION) UNCERTAINTYStatistical Analysis
• Average deviation: an indication of the precision of the measurements:
• Standard deviation: the root-mean-square (RMS) deviation of the measurements. For
a finite number of readings:
• Variance: mean-square deviation = 2
Dd d d d d
n
d
nn
1 2 3 4 .......
d d d d d d
nd
nn t1
222
32
42
42 2 2
1 1.......

V. Rouillard 2003
13 Introduction to measurement and statistical analysis
ESTIMATING THE RANDOM (PRECISION) UNCERTAINTYStatistical Analysis
• Case Study: Measurement of the mass of turbine blades for use in jet propulsion
systems. Blades are supplied by different manufacturers. Mass must be established
based on random sample.
V. Rouillard 2003
14 Introduction to measurement and statistical analysis
ESTIMATING THE RANDOM (PRECISION) UNCERTAINTYStatistical Analysis
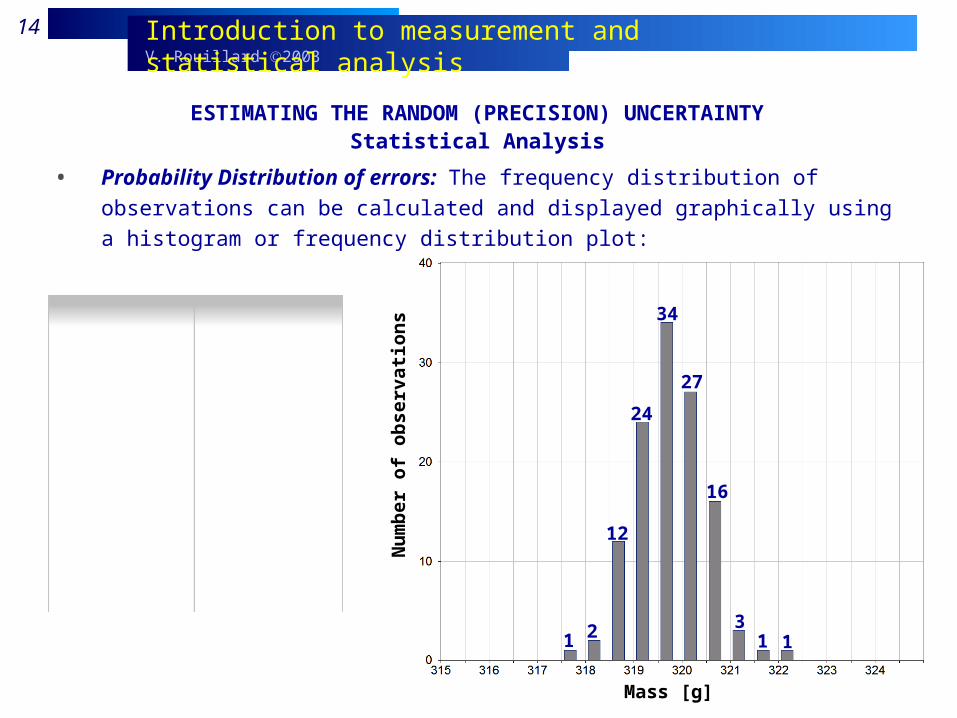
• Probability Distribution of errors: The frequency distribution of observations can
be calculated and displayed graphically using a histogram or frequency distribution
plot:
Mass [g]
Nu
mb
er o
f o
bse
rva
tio
ns
1 2
12
24
34
27
16
311

V. Rouillard 2003
15 Introduction to measurement and statistical analysis
ESTIMATING THE RANDOM (PRECISION) UNCERTAINTYStatistical Analysis
• If more observations were made it is expected that the frequency distribution of the
observations will become more defined:
Mass [g]
Nu
mb
er o
f o
bse
rva
tio
ns
V. Rouillard 2003
16 Introduction to measurement and statistical analysis
ESTIMATING THE RANDOM (PRECISION) UNCERTAINTYStatistical Analysis
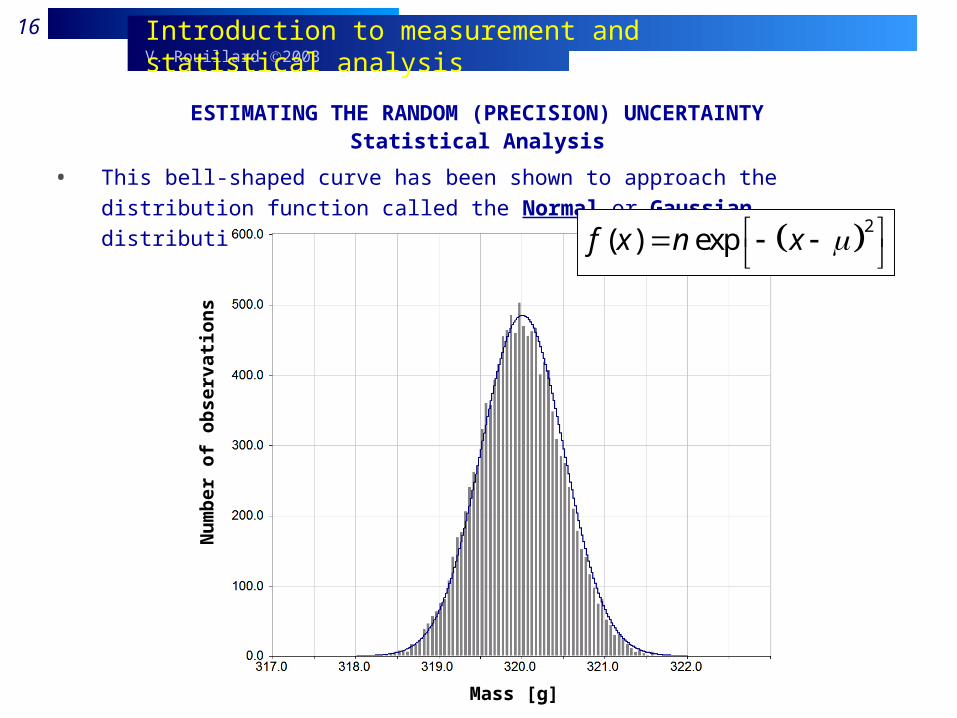
• This bell-shaped curve has been shown to approach the distribution function called
the Normal or Gaussian distribution.
Mass [g]
Nu
mb
er o
f o
bse
rva
tio
ns
2( ) expf x n x

V. Rouillard 2003
17 Introduction to measurement and statistical analysis
ESTIMATING THE RANDOM (PRECISION) UNCERTAINTYStatistical Analysis
• This bell-shaped curve has been shown to approach the distribution function called
the Normal or Gaussian distribution.
0
0.1
0.2
0.3
0.4
0.5
-4 -3 -2 -1 0 1 2 3 4
p(x)
(x-)/
21 1
( ) exp22
xp x

V. Rouillard 2003
18 Introduction to measurement and statistical analysis
ESTIMATING THE RANDOM (PRECISION) UNCERTAINTYStatistical Analysis
• The normal distribution function characteristically has few observations at the high
and low ends and many in the middle. It has been shown to be very useful in for
evaluating random errors.
Mass [g]
Nu
mb
er o
f o
bse
rva
tio
ns
1 2
12
24
34
27
16
311

V. Rouillard 2003
19 Introduction to measurement and statistical analysis
ESTIMATING THE RANDOM (PRECISION) UNCERTAINTYStatistical Analysis
Comments on the normal distribution of random errors:
• All observations include small, disturbing effects called random errors.
• Random errors can be positive or negative with equal probability.
• Small errors are more likely to occur that large errors.
• Very large errors (> 3) are very improbable
• The probability of a given error will be symmetrical about zero.

V. Rouillard 2003
20 Introduction to measurement and statistical analysis
ESTIMATING THE RANDOM (PRECISION) UNCERTAINTYStatistical Analysis
Interpretation of the normal distribution of random errors:
Error Level Probability
Terminology [%]
Probable error 0.6754 50.0
Std deviation 1 68.3
90% error 1.645 90.0
2-Sigma error 1.96 95.0
3-Sigma error 3 99.7
4-Sigma error 4 99.994
Error Level
21 1
( ) exp22
xp x

V. Rouillard 2003
21 Introduction to measurement and statistical analysis
ESTIMATING THE RANDOM (PRECISION) UNCERTAINTYStatistical Analysis
• Turbine blade mass case study:
Mass [g]
Nu
mb
er o
f o
bse
rva
tio
ns
Standard deviation:
0.75 g
Mean: 319.75 g
V. Rouillard 2003
22 Introduction to measurement and statistical analysis
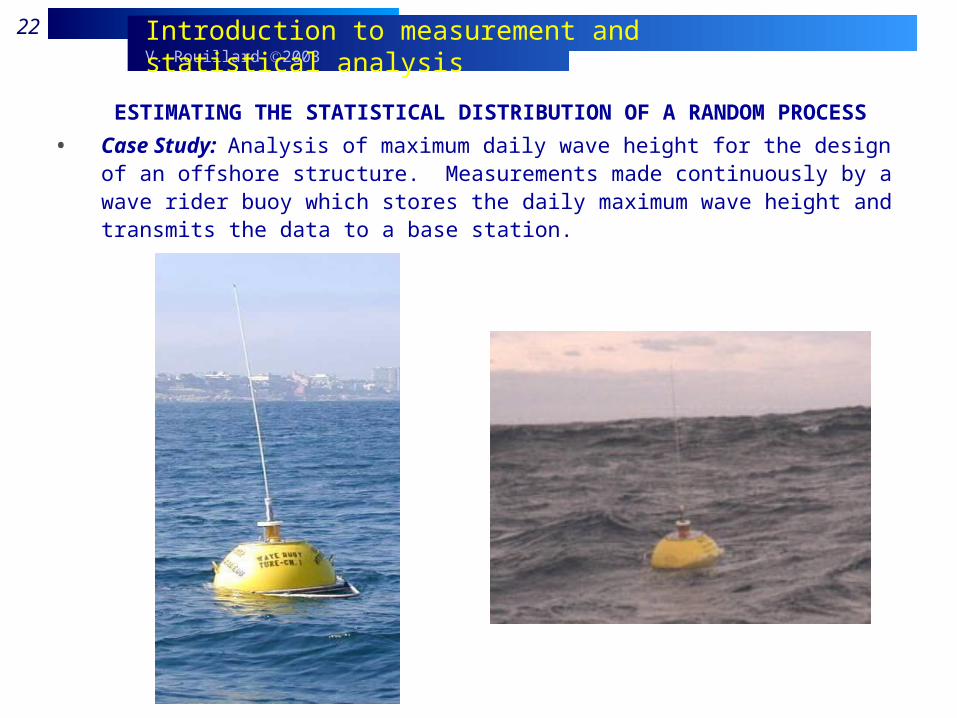
ESTIMATING THE STATISTICAL DISTRIBUTION OF A RANDOM PROCESS
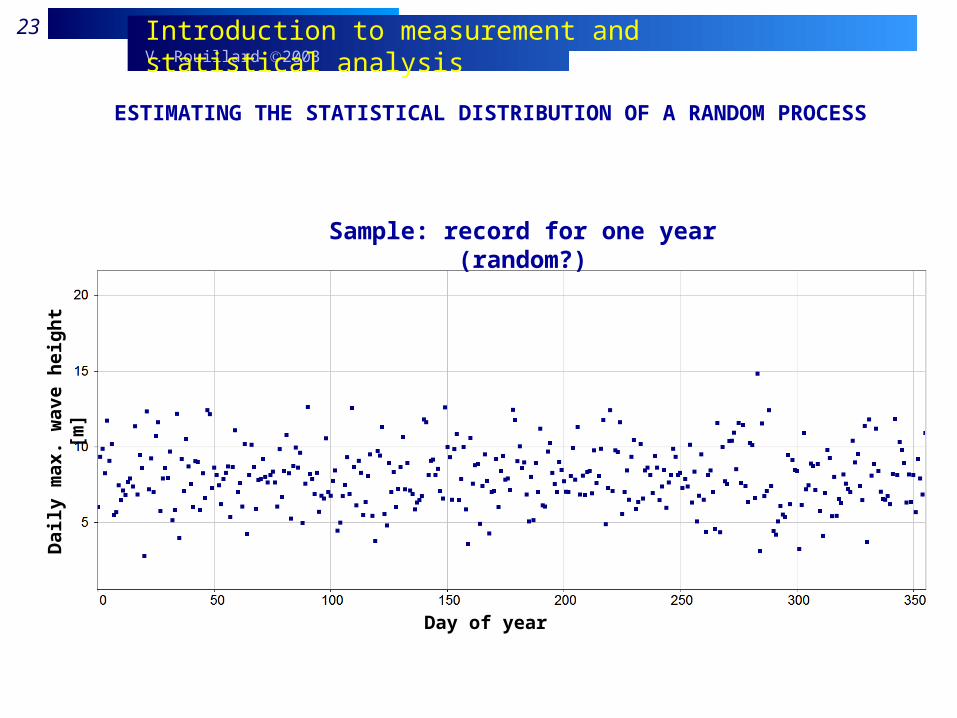
• Case Study: Analysis of maximum daily wave height for the design of an offshore structure. Measurements made continuously by a wave rider buoy which stores the daily maximum wave height and transmits the data to a base station.
V. Rouillard 2003
23 Introduction to measurement and statistical analysis
ESTIMATING THE STATISTICAL DISTRIBUTION OF A RANDOM PROCESS
Day of year
Dai
ly m
ax.
wav
e h
eig
ht
[m]
Sample: record for one year (random?)

V. Rouillard 2003
24 Introduction to measurement and statistical analysis
ESTIMATING THE STATISTICAL DISTRIBUTION OF A RANDOM PROCESS
• The frequency distribution of observations can be calculated and displayed
graphically using a histogram or frequency distribution plot:
Wave height [m]
Nu
mb
er o
f o
bse
rva
tio
ns
4
1214
46
67
72
62
38
13
24
Maximum Daily Wave Height
[m]
Number of observations
2 43 124 145 466 677 728 629 3810 2411 1312 313 014 015 1
31

V. Rouillard 2003
25 Introduction to measurement and statistical analysis
ESTIMATING THE STATISTICAL DISTRIBUTION OF A RANDOM PROCESS
• With more observations, it is expected that the frequency distribution will approach the Normal or Gaussian distribution
Wave height [m]
Nu
mb
er o
f o
bse
rva
tio
ns
V. Rouillard 2003
26 Introduction to measurement and statistical analysis
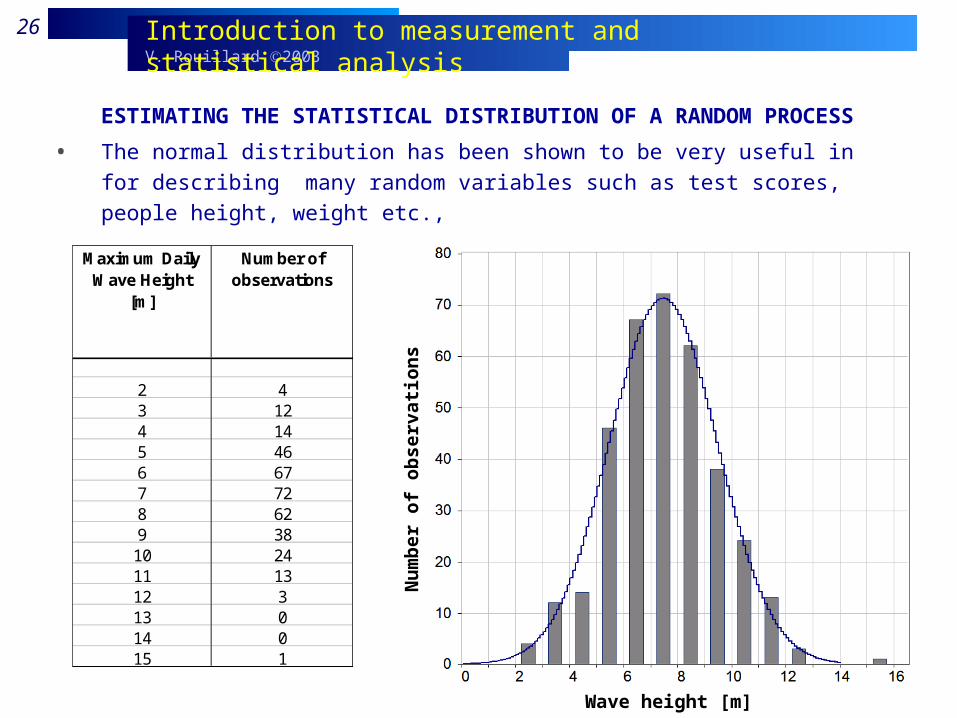
ESTIMATING THE STATISTICAL DISTRIBUTION OF A RANDOM PROCESS
• The normal distribution has been shown to be very useful in for describing many
random variables such as test scores, people height, weight etc.,
Wave height [m]
Nu
mb
er o
f o
bse
rva
tio
ns
Maximum Daily Wave Height
[m]
Number of observations
2 43 124 145 466 677 728 629 3810 2411 1312 313 014 015 1

V. Rouillard 2003
27 Introduction to measurement and statistical analysis
ESTIMATING THE RANDOM (PRECISION) UNCERTAINTYStatistical Analysis
• The normal (Gaussian) distribution is a function of the mean and standard deviation
of the sample:
• Where is the mean
And the standard deviation.
In this example:
The mean daily max. height = 7.5 m
The standard deviation is = 2.0 m
3 (99.7% 332 days per 333 days)
the expected ann. max. wave height is:
7.7 + 3(2.0) = 13.7 m
4 (99.994% all but 1 day per 45 yrs)
the expected max. wave height over
45 yrs is: 7.7 + 4(2.0) = 15.7 m
f xx
( ) exp F
HIK
LNMM
OQPP
1
2
12
2
Wave height [m]
Nu
mb
er o
f o
bse
rva
tio
ns
2.0
7.5 m