image measurement errors and missile performance -...
TRANSCRIPT
International Strategic and Security Studies Programme
Bangalore, India
NATIONAL INSTITUTE OF ADVANCED STUDIES
R2 - 09
NIAS Study - 2009
Image Measurement Errors and
Missile Performance
Lalitha Sundaresan
S. Chandrashekar
Rajaram Nagappa
N. Ramani
Image Measurement Errors andMissile Performance
NIAS Study - 2009
Lalitha Sundaresan
S. Chandrashekar
Rajaram Nagappa
N. Ramani
International Strategic and Security Studies Programme
NATIONAL INSTITUTE OF ADVANCED STUDIESBangalore, India
July 2009
© National Institute of Advanced Studies 2007
Published by
National Institute of Advanced StudiesIndian Institute of Science CampusBangalore - 560 012
ISBN 978-81-87663-83-6
Typeset & Printed by
Aditi EnterprisesBangalore - 560 023Ph.: 080-2310 7302; Mob: 92434 05168E-mail: [email protected]; [email protected]
Acknowledgement
We thank Dr. K. Kasturirangan, Director, NIAS, for
his support and encouragement for this study.
Special thanks are due to Dr. Anuradha Reddy for
providing data for this study.

CONTENTS
Page
Summary 1
Introduction 3
Motivation for this Study 4
Theoretical Framework 5
Methodology 8
Problems associated with measurements 9
Results 10
Regression Equation for estimating the Measurement Error 15
Application of the Methodology to Shaheen 2 Images 17
Conclusion 18
Annexure 1 19
Annexure 2 20
Annexure 3 21

1
Image Measurement Errors and Missile Performance
Image Measurement Errors andMissile Performance
estimated. Pixel size is the actual diameter inmeters divided by the diameter in pixels. Oncethe pixel size is known the relevant length ismeasured in terms of number of pixels and thenconverted to meters using the estimated pixelsize. Since the actual length is known themeasurement error is obtained as the differencebetween the actual length and the measuredlength.
An estimate of measurement error is useful tounderstand the changes observed in missiledimensions during the early stages of itsdevelopment. Since the actual lengths of themissiles being flown during its development phasemay not be known precisely, we would like to knowwhether the changes we are seeing in the lengthsduring different launchings of the same missileare real or whether they are the result ofmeasurement errors. If we are able to estimatethe likely measurement error for the missile thenwe could confidently group the various launchingsinto different classes based on measurementsmade from images of the missile.
The measurement error depends on the inherentcharacteristics of the imaging device (camera ordigitizer) as well as the angle at which the pictureis taken. Since these are not known a priori, westudied the dependence of the measurementerror on various parameters such as the pixelsize, the calibration diameter which is the diameterof the missile in meters and the actual length thatwas measured.
Summary
The main objective of this study is to estimatethe errors in the measurement of lengths ofmissiles or satellite launch vehicles from digitalimages available in the public domain when thescale or the pixel sizes of the images are notknown.
Under the International Strategic and SecurityStudies Programme (ISSP) of the NationalInstitute of Advanced Studies (NIAS),assessments of China’s Ballistic and Cruisemissiles as well as Pakistan’s missiles have beenmade earlier. In those studies the dimensions ofmissiles were measured using ENVI 3.5 imageprocessing software. Using these measureddimensions the propellant mass and the lift offmass were estimated using available engineeringdata and knowledge. This derived data set fromthe measurements was used to run typicaltrajectory profiles to estimate the ranges of themissiles.
The present report is an attempt to validate themethodology used in these studies by estimatingthe measurement error. We estimate the errorby making measurements on images of missileswhose dimensions are known a priori withconfidence. Images are selected carefully so thatgeometric and scale effects are minimal. In eachof the images, the diameter of the missile orlaunch vehicle is measured in pixels and sincethe actual diameter is known, the pixel size is
2
Image Measurement Errors and Missile Performance
was between 0.2% and 3.2% when the calibrationdiameter was 2.8 m.
The empirical equation obtained was used todetermine whether there are variants in theShaheen 2 missile developments of Pakistan. Theimages of Shaheen 2 launched in 2004, 2005,2006, and 2008 were analysed. The launches of2004 and 2005 had similar lengths. The missilelaunched in 2006 was longer than those launchedin 2004, 2005 and 2008. The pair of missileslaunched in 2008 was the shortest; they were atleast 30 cm shorter than the missiles of 2004 and2005.
Applying the empirical equation to thesemeasurements revealed the following:
� The difference in the lengths between thefirst two launches (2004 and 2005) whencompared to the launch of 2006 issignificantly more than the estimatedmeasurement error, suggesting that the 2006launch is a different variant of the first twolaunches.
� Similar conclusions could be drawn when thefirst two launches are compared with the pairof launches carried out in 2008.
Although no specific reasons can be given forsuch variations in lengths of these missiles, wecan infer that there are at least three variants ofmissiles of the same class suggesting that someexperimental development process is going onin Pakistan.
For this study 22 sample images were analysed.In this sample the diameter used as the basis forcalibration varied from 1 m to 2.8 m with thelengths being measured varying from 10 m to20 m. The sample size though not very large wasadequate to place bounds on the measurementerror.
We observed that the measurement errorgenerally increases with increasing pixel size. Themeasurement error also decreases as thediameter of the missile used as the basis forcalibration increases. For the same calibrationdiameter the measurement error decreaseswith decreasing pixel size. As the length of themissile increases, the measurement error alsoincreases. However, this is compensated to someextent if the image has very small pixel sizes.
After trying various combinations of the relevantparameters affecting the measurement error, abest fit equation was determined for estimatingthe error in terms of the measured length of themissile, the pixel size in centimeters and thereciprocal of the calibration diameter in meters.This equation was used to estimate themeasurement error in images of missiles ofunknown dimensions.
The average error and the standard deviation ofthe error in measuring lengths up to 13 m fromdigital images were estimated to be 0.08 m and0.36 m respectively. The analysis showed thatthe measurement error was between 3% and 6%when the calibration diameter was 1.0 m while it
3
Image Measurement Errors and Missile Performance
Introduction
Digital Image processing techniques have beenused extensively to analyze remote sensingimages as well as other photographic images. Inmany situations enhancement of the images toidentify features and objects of interest is followedby making measurements on these objects. In thecase of remote sensing images, estimates of areaare often of interest. A variety of techniques areavailable to enhance and classify an image priorto making such estimations. In all these situationsthe inherent resolution or the pixel size of theimage (which depends on theimaging or the digitizinginstrument used) plays asignificant role. The errorassociated with area estimatesdue to what are called boundarypixels have also been studiedextensively.1 In these studies theresolution of the image is knownand the errors that occur are attributed tomisclassification and inadequate spectral andspatial resolution. Measurements made on digitalimages of animal foot prints, eggs, animal sizesetc. have also been used to model other not easilymeasurable characteristics such as weight, healthof an animal etc..2,3,4
In earlier studies we have used image analysissoftware (ENVI 3.5) to make measurements onimages of various missiles.5,6. In those studies wehad used a limited set of images to calibrate andvalidate this methodology. In some of theseimages features such as vehicles with knowndimensions, humans whose heights are knownwithin some range or other objects of knowndimensions were used as calibration sources formaking measurements on the missile. If suchpossibilities exist in an image we could get anindependent assessment of the criticaldimensions of a missile such as its diameter or
length. This could help us to checkwhether these dimensions are inagreement with other sources ofinformation available in the publicdomain. More often than not suchcalibration benchmarks may notbe available in the image. In suchcases the only way we can makeinferences about the missile is to
know a priori the name of the missile. If we doknow the name of the missile we can use its mostcharacteristic feature as a basis for estimatingother dimensions of the missile. For a missile themost characteristic feature is its diameter. We canuse the publicly known value of the diameter ofthe missile as a calibration benchmark to estimate
1 Crapper P.F., “An estimate of the number of boundary cells in a mapped landscape coded to grid cells”, Photogrammetric Engineeringand Remote Sensing 50, no.10 (1984): 1497
2 Bridge E.S, Boughton R.K, Aldredge R.A,. Harrison, T.J.E, Bowman R and Schoech S.J, “Measuring egg size using digital photography:testing Hoyt’s method using Florida Scrub-Jay eggs”, J. Field Ornithol. 78, no. 1 (2007): 109
3 Tanaka S, Yamauchi A and Kono Y, “Easily accessible method for root length measurement using an image analysis system”,Japanese Journal of crop science 64, no. 1 (1995): 144
4 Tasdemir S, Yakar M, Urkmez A and Inal S, “Determination of Body Measurements of a Cow by Image Analysis in InternationalConference on Computer Systems and Technologies” CompSysTech (2008) V.8.1
5 Chandrashekar S, Arvind Kumar and Nagappa R, “An Assessment of Pakistan’s Ballistic Missile Programme,- Technical andStrategic Capability”, NIAS Study R5-06 (2006)
6 Chandrashekar S, Gupta S, Nagappa R and Arvind Kumar, 2007, “An Assessment of China’s Ballistic and Cruise Missiles”, NIASStudy, R4-07, (2007)
Changes in missile dimensions
are of interest to the researchers
in the strategic community
since they enable tracking and
monitoring developments in
the missile programmes of
countries of interest to them.
4
Image Measurement Errors and Missile Performance
various other dimensions of the missile. Changesin missile dimensions are of interest toresearchers in the strategic community since theyenable tracking and monitoring developments inthe missile programmes of countries of interestto them.
In order to validate this approach for looking atmissiles it is necessary to get an estimate of themeasurement error. Knowing the measurementerror is crucial not only for separating one typeof missile from another but is also required tolook at different variants within the same missilefamily.
In this study we try to estimate the errors inmeasurement by carrying out measurements onimages of missiles whose dimensions are knowna priori with confidence. An estimate of themeasurement error is obtained from sample setof images of missiles of known dimensions. Theseestimates are then used as a basis for groupingthe changes that we observe in other missilefamilies of interest. Such groupings of changesmay aid us in making better inferences about thedevelopment status of the missile and its potentialrole in any conflict situation.
Motivation for this Study
Studies have been carried out to independentlyassess the capabilities of Chinese and Pakistanimissiles.7,8 These studies have used thedimensions of the missiles9 to make estimates of
the propellant carried by them. From the amountof propellant we can estimate the total weight ofthe rocket or stage using procedures derived frompublished data on a number of missiles. We canuse these derived values of stage and propellantmass and run typical trajectory profiles to estimatethe range of the missile.
An evaluation of the measurement error isimportant in using such a procedure. Changesin a particular missile especially during its earlystages of development may take place becauseof several reasons. These could come aboutbecause different kinds of warheads may becarried by them or because of some developmentproblems. Once a missile is operational otherchanges may also take place to improveperformance. Since the actual length of themissile being flown during its development phasemay not be known precisely, we would like to knowwhether the changes we are seeing in the imagesof different launchings of the same missileare real or whether they are the result ofmeasurement errors. If we are able to estimatethe likely measurement error for the missile thenwe could confidently group the various launchingsinto different classes based on measurementsmade from images of the missile. Measurementerror estimates may also help us to assess thelikely errors in estimating the range of the missile.
In the studies that we have carried out earlier,the length of the missile is inferred frommeasurements made on the known diameter of
7 n.58 n.69 The diameter and the length are important to determine the cylindrical volume that can be filled by the propellant. The densities of the
propellants are known and there is enough information available from public domain data on volumetric efficiencies. This enablesthe estimation of propellant weights. The weight of the structures and other ancillary components for converting the propellantmass into a stage can also be estimated using engineering data available for a large number of rockets and missiles available in thepublic domain or through interaction with missile experts.
5
Image Measurement Errors and Missile Performance
We describe briefly how an image is created andhow these errors occur. This also helps us tochoose the appropriate images for our study.
The images that we have used as alreadymentioned are from the public domain. Theseimages are of two kinds.
� The photographs of a missile taken by aconventional camera is scanned, digitizedand converted to a digital image.
� The image of a missile is taken by a digitalcamera.
The instrument errors associatedwith each of the above cases maybe slightly different. Thedifferences arise due to thedifferences in the scanning ordigitizing devices used to converta photograph to a digital image.This feature is inbuilt in a digitalcamera. In a digital camera, the
sensors read the intensity of light that entersthrough different colour filters and this is thenconverted into digital values called grey values.A detailed description of this imaging process isavailable in Gonzalez and Woods.13
A digital image for the purpose of our study couldbe viewed as a raster14 image consisting of amatrix of grey values. The quality of a digitalimage depends on the inherent characteristics
10 n.511 n.612 Nikitaev V.G. and Pronichev A.N, “Analysis of measurement errors in metric and orientational object parameters in computerized
image processing systems”, Measurement Techniques 33, no. 12 (1990): 117713 Gonzalez R.C and R.E. woods, Digital image processing, 2nd Edition, India: Pearson Education Asia, 2002.14 A raster image is a collection of dots called pixels. Each pixel is a tiny colored square. When an image is scanned, the image is
converted to a collection of pixels called a raster image. Scanned graphics and web graphics (JPEG and GIF files) are the mostcommon forms of raster images.
the missile. Wherever possible, measurementson other components of the missile such as thewarhead, the stage lengths, the interfaceelements and the nozzle were also carried out.These inputs were then used for estimating thepropellant and lift off masses of the missile. Fromthese derived values we estimate theperformance of a missile by running simpletrajectory and range models.10,11
The present study estimates the measurementerror using images of satellite launch vehicles,rockets, and missiles whose dimensions areknown and well documented.Though the number of samples isnot very large, placing bounds onthe measurement errors arepossible. An empirical equation isobtained for estimating the errorin terms of the measured lengthof the missile in meters, the pixelsize in centimeters and thereciprocal of the calibration unit inmeters. Some specific problems involved inselecting and using images of missiles availablein the public domain for assessing theperformance are also discussed.
Theoretical Framework
Error in measuring the length (linear dimension)of an object from its digital image depends on theprecision of the system forming the digital image.12
The quality of a digital image
depends on the inherent
characteristics of the imaging
device such as lens quality, the
sensitivity of the detectors, data
format and the processing
method for the conversion of
raw data into digital values.
6
Image Measurement Errors and Missile Performance
of the imaging device such as lens quality, thesensitivity of the detectors, data format and theprocessing method for the conversion of raw datainto digital values. The spatial resolution and thedynamic range of the camera capture theessence of the above qualities.
Spatial resolution depends on the properties ofthe system forming the image. It measures howclosely spaced lines (objects) can be resolved inan image. This depends on the lens quality ofthe camera, the sensitivity of the detector andthe contrast differences between the variousobjects in the image. Finer spatial resolutions willresult in better quality images.
The conversion of the raw data toan image in a standard format isaffected by the dynamic range ofthe camera which in turn dependson the quality of the detector andthe way in which the analog inputsare sampled. The effect of this is seen in thecontrast that we see in the image. A large dynamicrange for the camera or sensor will result in abetter quality image.
In general for the purposes of measurements welook for an image that has a high spatial resolutionand large dynamic range. Since the imagingdevice is not under our control, the selection ofthe images for our study has to be made by visualinspection only.
Another aspect of image formation is the way thephotograph is taken. Pictures taken from differentangles give different perspectives. This can
happen in two ways. In one way the camera viewsthe object from top or from below. In the otherway the camera views the object from the rightor the left. In both these cases there will bedistortions in the image as far as measurementsare concerned.
If the camera is too close to the object andthe object is fairly large, there will be furtherdistortions in the image from scale effects alsoresulting in errors.
Images in the public domain will have differentcombinations of the above effects. Therefore ifwe need accurate measurements, the imageshave to be chosen for our study very carefully.
Pictures 1, 2 and 3 are examplesof images which are otherwisegood but suffer from thesegeometric distortions.
In Picture 1 the launch vehicle is atan angle that shows the missile as being tilted intothe plane of paper and therefore even though thepicture appears to be of good quality with respectto the contrast levels, the measurement of lengthsmay not be accurate. In Picture 2, we observe thatin addition to the effect of the angle, the quality ofthe image is not good. In images of this kind theedges are not clearly defined, so measurementsof the diameter could pose a problem.
In Picture 3 the image is tilted into the paper aswell as about the X – Y15 plane.
Since we do not have any knowledge about thecamera characteristics, the errors that are
15 The X-axis is the horizontal axis from left to right and the Y- axis is from the top to bottom. The Z axis is perpendicular to both of theseand is into the paper.
For the purposes of
measurements we look for an
image that has a high spatial
resolution and large dynamic
range.
7
Image Measurement Errors and Missile Performance
described above could be avoided only bychoosing the images carefully. Assuming that theimages chosen have minimum inherent errors,we still have to account for the measurementerrors.
In general the measurement error depends upon:
� Scale of the image or Pixel size.16
� The size of the calibration unit expressed innumber of pixels.
� The size of the calibration unit17 expressedin meters.
� The length of the object being measuredexpressed in meters.
The pixels size depends on the distance betweenthe camera and the object. This is not the sameas the spatial resolution mentioned earlier,though often in remote sensing literature the termis used that way. The farther away an object isfrom the camera, the coarser will be the resolutionresulting in a larger pixel size. For the samediameter, a picture with a larger number of pixelscovering the diameter would be considered to bea better picture for measurement purposes.
Picture 1 Picture 2 Picture 3
16 Pixel size refers to the size of pixel in units of length such as meters or centimeters. The pixel is a square. Thus if the pixel size is2cm, then it means that an area of 2cm X 2cm is represented by one pixel.
17 This is the diameter expressed in meters in our study
8
Image Measurement Errors and Missile Performance
The measurement error E could be consideredas a function of the above elements. Thus,E = f (p, dp, dm, L)where L is the measured lengthp is the pixel size in metersdm is the diameter in meters anddp is the diameter in pixels.
The error is bound to be very sensitive to changesin the pixel size. It is also well known that the errorincreases exponentially with increase in the pixelsize. Crapper18 has shown that theaccuracy of the area estimatesfrom remote sensing images is afunction of the logarithm of thepixel size. In the case of satelliteimages where pixel sizes from thesensor range from 1m to as muchas 100m, it has been possible toassess the error in estimating theareas of well known features such as agriculturalfields under different crops.
The second important factor is the size of thecalibration unit. In our study the calibration unitis the diameter of the missile or rocket. Themeasurement error obviously decreases with anincrease in the actual diameter say from onemetre to two metres.
The measurement error is also dependent on thediameter of the missile measured in pixels. For amissile with a given diameter, the image having alarger number of pixels for this diameter willprovide more accurate measurements than animage having a smaller number of pixels for thesame diameter.
In addition to this, one would expect that the errorwill also increase as the lengths we measurebecome larger. Given that the diameter alsoinfluences the measurement error, we shouldexpect that the Length to Diameter (L/D) ratiowould play an important role in determining themeasurement error.
Methodology
The following approach is used in this study.
� Images for assessing themeasurement error are firstselected carefully so thatgeometric and scale effects areminimal.� Since characteristics such asdiameter (D) and length are knownfor a missile, we use the known
value of the diameter to determine the pixelsize.
� We use ENVI 3.5 image processing softwareto measure the diameter. Enhancementof the image is some times necessary tomake sure that the edges are clearlydemarcated.
� With the value of the diameter in pixels andthe known value of the diameter in units ofactual length such as meters we determinethe pixel size in units of actual length.
� Once the pixel size is known, the length ofthe missile or its relevant part in pixels ismeasured.
� Using the pixel size derived from the diametermeasurement we convert this pixel lengthinto a measured length L.
18 n.1
For a missile with a given
diameter, the image having a
larger number of pixels for this
diameter will provide more
accurate measurements than an
image having a smaller number
of pixels for the same diameter.
9
Image Measurement Errors and Missile Performance
This measured length is compared with the actuallength and the error is estimated.
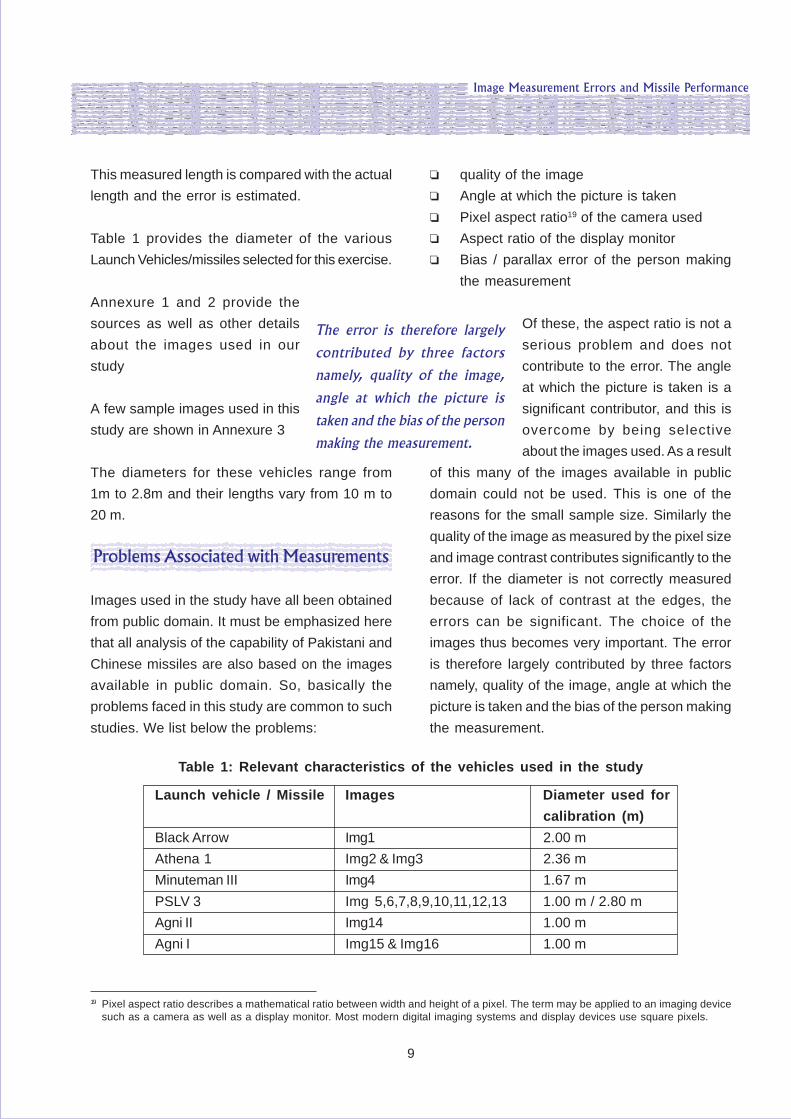
Table 1 provides the diameter of the variousLaunch Vehicles/missiles selected for this exercise.
Annexure 1 and 2 provide thesources as well as other detailsabout the images used in ourstudy
A few sample images used in thisstudy are shown in Annexure 3
The diameters for these vehicles range from1m to 2.8m and their lengths vary from 10 m to20 m.
Problems Associated with Measurements
Images used in the study have all been obtainedfrom public domain. It must be emphasized herethat all analysis of the capability of Pakistani andChinese missiles are also based on the imagesavailable in public domain. So, basically theproblems faced in this study are common to suchstudies. We list below the problems:
Launch vehicle / Missile Images Diameter used forcalibration (m)
Black Arrow Img1 2.00 mAthena 1 Img2 & Img3 2.36 mMinuteman III Img4 1.67 mPSLV 3 Img 5,6,7,8,9,10,11,12,13 1.00 m / 2.80 mAgni II Img14 1.00 mAgni I Img15 & Img16 1.00 m
Table 1: Relevant characteristics of the vehicles used in the study
� quality of the image� Angle at which the picture is taken� Pixel aspect ratio19 of the camera used� Aspect ratio of the display monitor� Bias / parallax error of the person making
the measurement
Of these, the aspect ratio is not aserious problem and does notcontribute to the error. The angleat which the picture is taken is asignificant contributor, and this isovercome by being selectiveabout the images used. As a result
of this many of the images available in publicdomain could not be used. This is one of thereasons for the small sample size. Similarly thequality of the image as measured by the pixel sizeand image contrast contributes significantly to theerror. If the diameter is not correctly measuredbecause of lack of contrast at the edges, theerrors can be significant. The choice of theimages thus becomes very important. The erroris therefore largely contributed by three factorsnamely, quality of the image, angle at which thepicture is taken and the bias of the person makingthe measurement.
19 Pixel aspect ratio describes a mathematical ratio between width and height of a pixel. The term may be applied to an imaging devicesuch as a camera as well as a display monitor. Most modern digital imaging systems and display devices use square pixels.
The error is therefore largely
contributed by three factors
namely, quality of the image,
angle at which the picture is
taken and the bias of the person
making the measurement.
10
Image Measurement Errors and Missile Performance
Results
Detailed configurations of the selected missilesand launch vehicles are available in public domain.In all these images the diameter of the first stageis used as the calibration unit. These diametersvary from 1 m to 2.8 m. The lengths measured inthe images vary depending on the vehicleconfigurations. In the case of PSLV, the length ofthe strap-on and the length of the first stage areboth measured wherever possible. In theseimages the diameter of the first stage (2.8 m) andthe diameter of the strap-on (1 m) were both used
as the calibration unit where ever possible. Thisenabled us to compare the errors for the samelength when different diameters (calibration units)were employed. In the case of the Minuteman,the first stage length was measured without thebottom shroud, using the first stage diameter asthe calibration unit. In the case of Athena, Agni IIand Black Arrow, the total length of the launchvehicle or missile was measured.
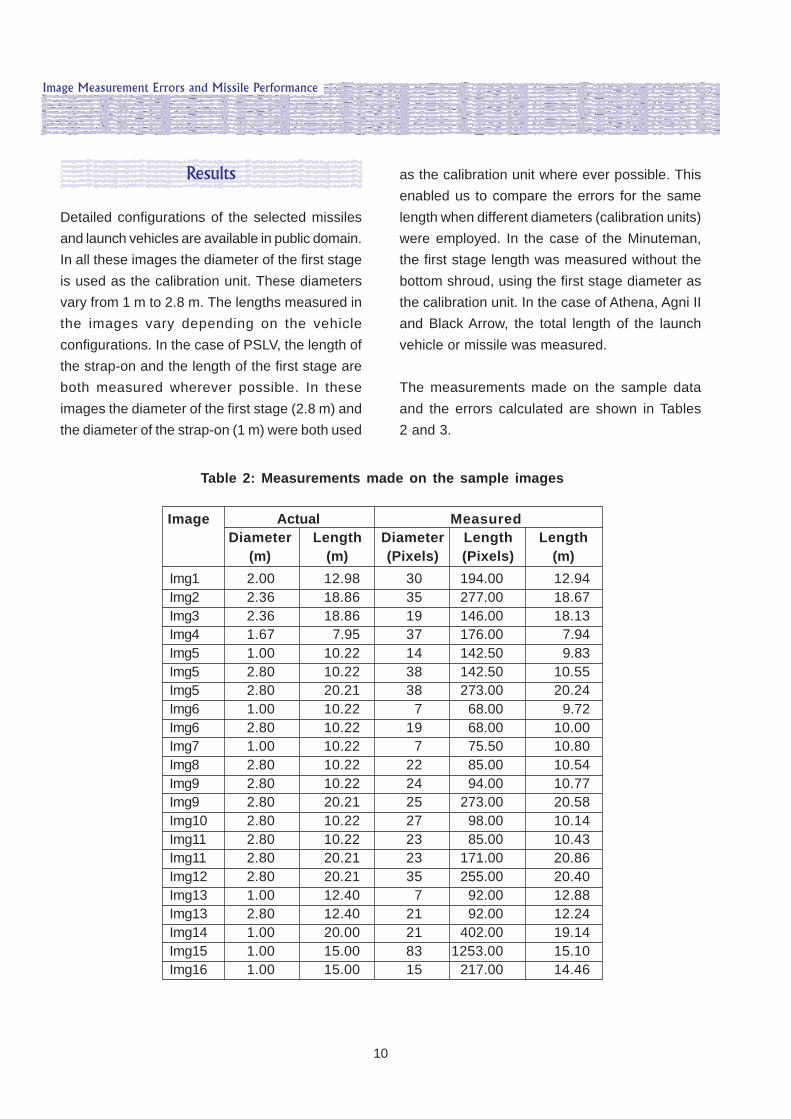
The measurements made on the sample dataand the errors calculated are shown in Tables2 and 3.
Table 2: Measurements made on the sample images
Image Actual MeasuredDiameter Length Diameter Length Length
(m) (m) (Pixels) (Pixels) (m)Img1 2.00 12.98 30 194.00 12.94Img2 2.36 18.86 35 277.00 18.67Img3 2.36 18.86 19 146.00 18.13Img4 1.67 7.95 37 176.00 7.94Img5 1.00 10.22 14 142.50 9.83Img5 2.80 10.22 38 142.50 10.55Img5 2.80 20.21 38 273.00 20.24Img6 1.00 10.22 7 68.00 9.72Img6 2.80 10.22 19 68.00 10.00Img7 1.00 10.22 7 75.50 10.80Img8 2.80 10.22 22 85.00 10.54Img9 2.80 10.22 24 94.00 10.77Img9 2.80 20.21 25 273.00 20.58Img10 2.80 10.22 27 98.00 10.14Img11 2.80 10.22 23 85.00 10.43Img11 2.80 20.21 23 171.00 20.86Img12 2.80 20.21 35 255.00 20.40Img13 1.00 12.40 7 92.00 12.88Img13 2.80 12.40 21 92.00 12.24Img14 1.00 20.00 21 402.00 19.14Img15 1.00 15.00 83 1253.00 15.10Img16 1.00 15.00 15 217.00 14.46
11
Image Measurement Errors and Missile Performance
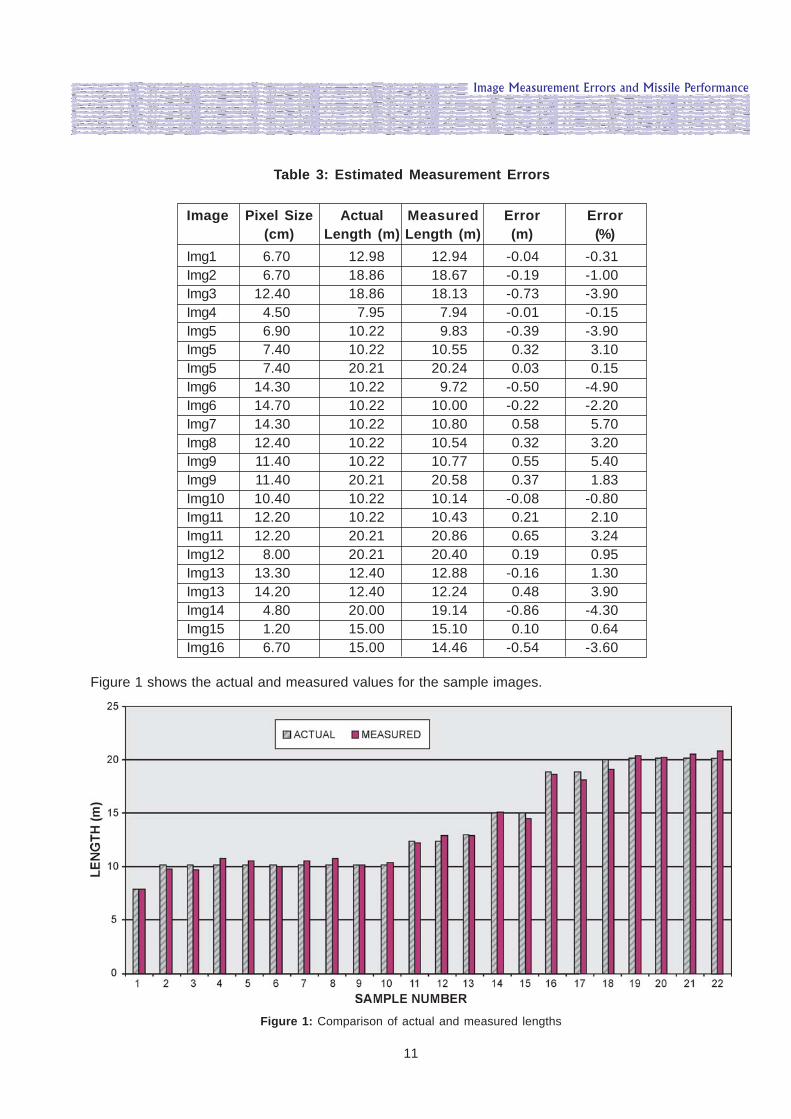
Table 3: Estimated Measurement Errors
Image Pixel Size Actual Measured Error Error(cm) Length (m) Length (m) (m) (%)
Img1 6.70 12.98 12.94 -0.04 -0.31Img2 6.70 18.86 18.67 -0.19 -1.00Img3 12.40 18.86 18.13 -0.73 -3.90Img4 4.50 7.95 7.94 -0.01 -0.15Img5 6.90 10.22 9.83 -0.39 -3.90Img5 7.40 10.22 10.55 0.32 3.10Img5 7.40 20.21 20.24 0.03 0.15Img6 14.30 10.22 9.72 -0.50 -4.90Img6 14.70 10.22 10.00 -0.22 -2.20Img7 14.30 10.22 10.80 0.58 5.70Img8 12.40 10.22 10.54 0.32 3.20Img9 11.40 10.22 10.77 0.55 5.40Img9 11.40 20.21 20.58 0.37 1.83Img10 10.40 10.22 10.14 -0.08 -0.80Img11 12.20 10.22 10.43 0.21 2.10Img11 12.20 20.21 20.86 0.65 3.24Img12 8.00 20.21 20.40 0.19 0.95Img13 13.30 12.40 12.88 -0.16 1.30Img13 14.20 12.40 12.24 0.48 3.90Img14 4.80 20.00 19.14 -0.86 -4.30Img15 1.20 15.00 15.10 0.10 0.64Img16 6.70 15.00 14.46 -0.54 -3.60
Figure 1 shows the actual and measured values for the sample images.
Figure 1: Comparison of actual and measured lengths
12
Image Measurement Errors and Missile Performance
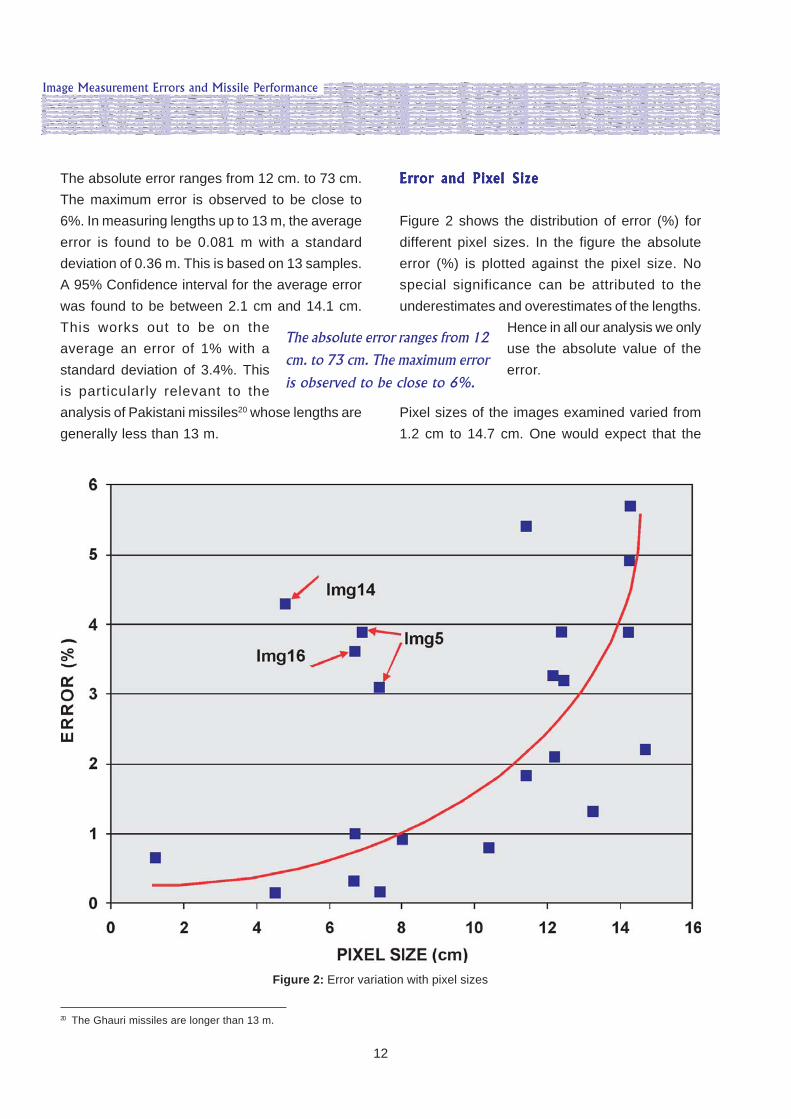
The absolute error ranges from 12 cm. to 73 cm.The maximum error is observed to be close to6%. In measuring lengths up to 13 m, the averageerror is found to be 0.081 m with a standarddeviation of 0.36 m. This is based on 13 samples.A 95% Confidence interval for the average errorwas found to be between 2.1 cm and 14.1 cm.This works out to be on theaverage an error of 1% with astandard deviation of 3.4%. Thisis particularly relevant to theanalysis of Pakistani missiles20 whose lengths aregenerally less than 13 m.
Error and Pixel SizeError and Pixel SizeError and Pixel SizeError and Pixel SizeError and Pixel Size
Figure 2 shows the distribution of error (%) fordifferent pixel sizes. In the figure the absoluteerror (%) is plotted against the pixel size. Nospecial significance can be attributed to theunderestimates and overestimates of the lengths.
Hence in all our analysis we onlyuse the absolute value of theerror.
Pixel sizes of the images examined varied from1.2 cm to 14.7 cm. One would expect that the
20 The Ghauri missiles are longer than 13 m.
The absolute error ranges from 12
cm. to 73 cm. The maximum error
is observed to be close to 6%.
Figure 2: Error variation with pixel sizes
13
Image Measurement Errors and Missile Performance
error will increase with increasing pixel sizes. Wecan see that the error increases exponentiallywith increasing pixel size. The curve drawn onthe figure is only a guide to the eye to show thistrend and has no mathematical or statistical basis.
We can also see from Figure 2 that there arefour points that are far away from the guidedcurve. These correspond to Strap-on lengths inImg5 and total lengths in Img14 and Img16.
In the case of Img5 the top end of the strap-onwas not very clear. Hence irrespective of whether1 m or 2.8 m was used as the calibration diameter,the length of the strap-on was measured withlarge error. In the same image the first stagelength was measured with less than 1% error.
In the case of Img14 even though the pixel sizewas small (less than 5 cm) the error was morethan 4%. The picture itself was quite good; andthe large error was probably due to the largelength to diameter (L/D) ratio which was 20 inthis case.
In the case of Agni1, two images were availablefor measurements - Img15 and Img16. In the casewhere the pixel size was 1.2 cm the error wasless than 1% and when the pixel size was 6.7 cm,the error was 3.6%.
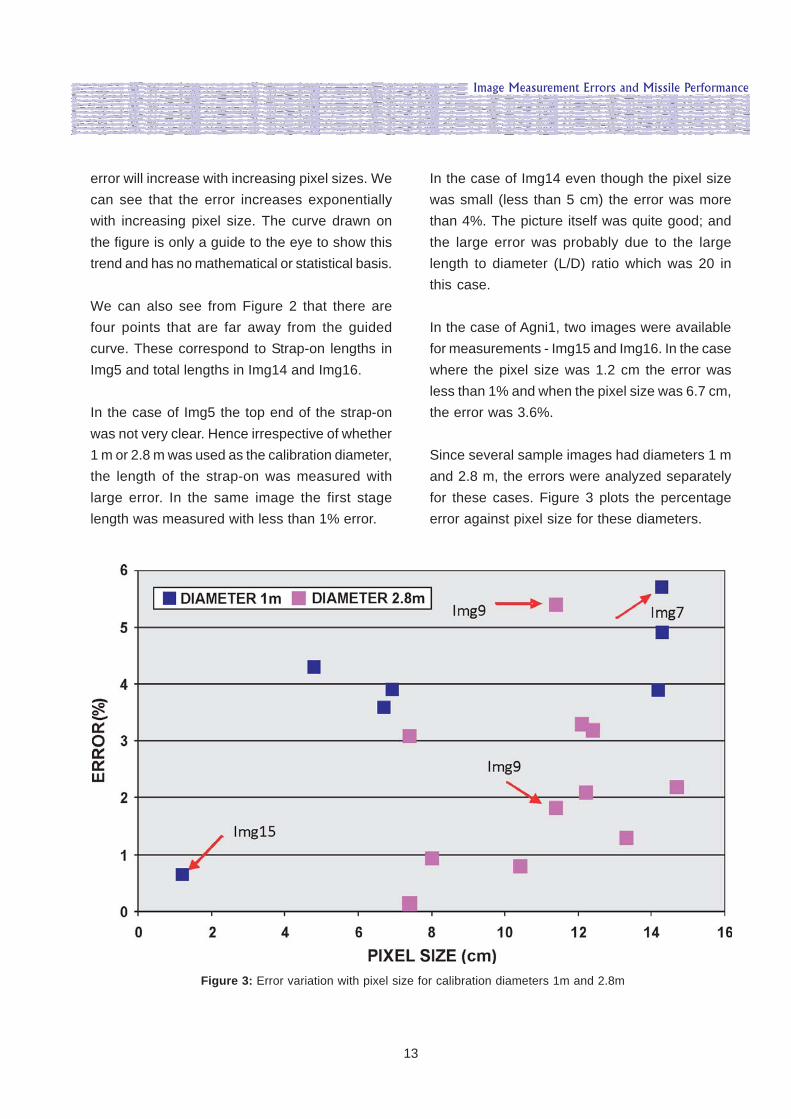
Since several sample images had diameters 1 mand 2.8 m, the errors were analyzed separatelyfor these cases. Figure 3 plots the percentageerror against pixel size for these diameters.
Figure 3: Error variation with pixel size for calibration diameters 1m and 2.8m
14
Image Measurement Errors and Missile Performance
Except for one point (Img15), where the error wasless than 1%, the error was between 3% and 6%when the calibration diameter was 1m. When thecalibration diameter was 2.8 m, the error wasbetween 0.2% and 3.2% except for one point(Img9) where the error was 5.6%. Visually Img9appears to be very good and probably the slighthaziness at the top end of the strap-on could havecaused the large error. For the same image thelength of the first stage wasmeasured with an error of 1.8%.
In the case of Img6 the errors were4.9% and 2.2% respectively forcalibration diameters of 1 m and2.8 m. The large error (4.9%) wasbecause of the undefined edges of the strap-on
diameter which could not be improved withenhancement.
Img7 has the highest error (close to 6%). Closevisual examination of the image suggests that theedges defining the diameter are not very clear.
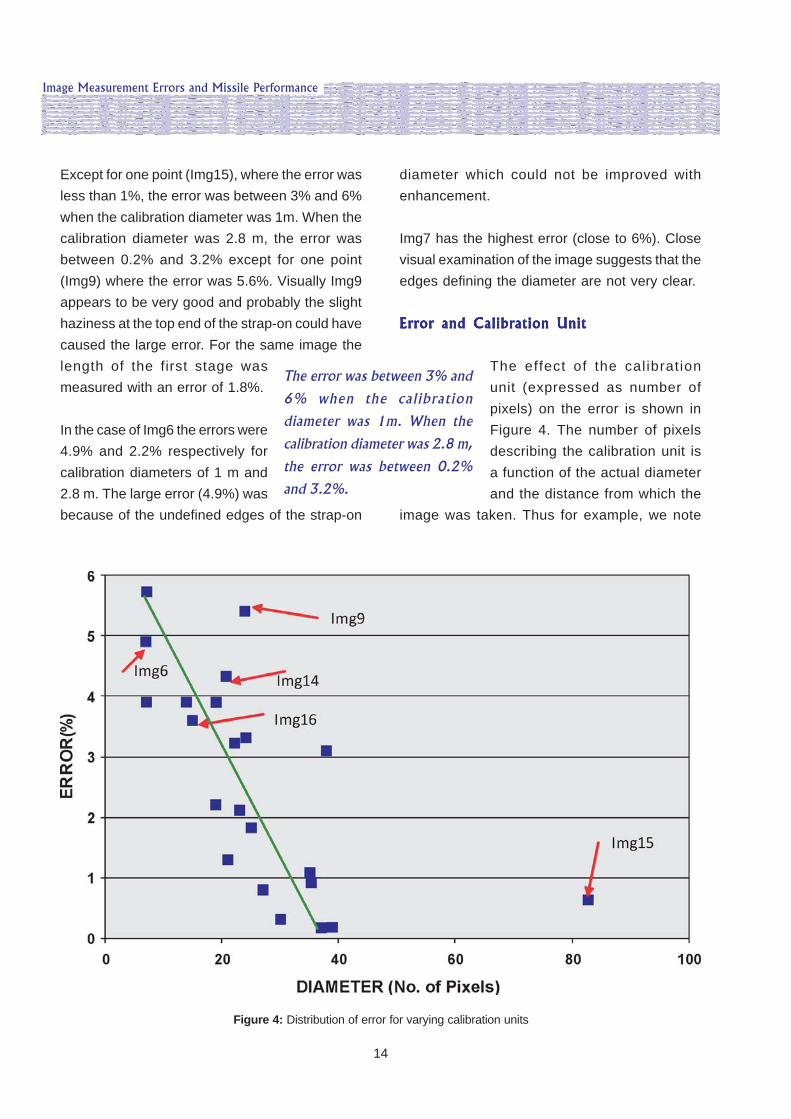
Error and Calibration UnitError and Calibration UnitError and Calibration UnitError and Calibration UnitError and Calibration Unit
The effect of the cal ibrationunit (expressed as number ofpixels) on the error is shown inFigure 4. The number of pixelsdescribing the calibration unit isa function of the actual diameterand the distance from which the
image was taken. Thus for example, we note
The error was between 3% and
6% when the calibration
diameter was 1m. When the
calibration diameter was 2.8 m,
the error was between 0.2%
and 3.2%.
Figure 4: Distribution of error for varying calibration units
15
Image Measurement Errors and Missile Performance
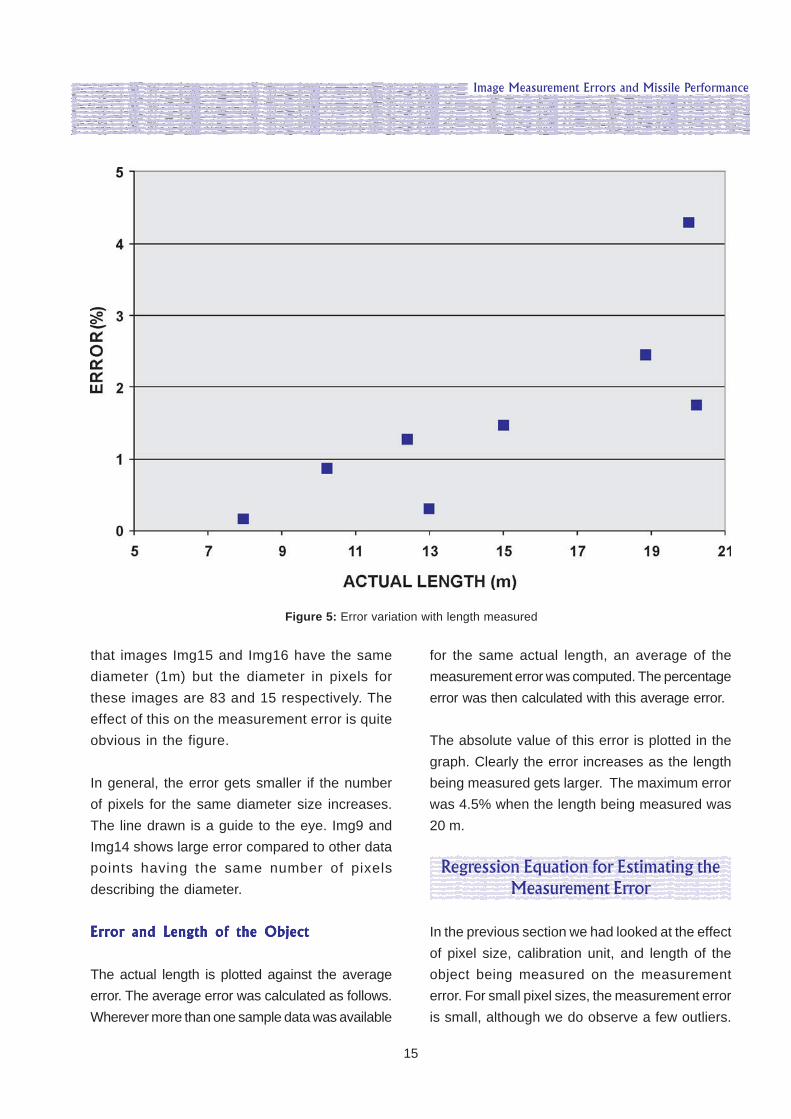
for the same actual length, an average of themeasurement error was computed. The percentageerror was then calculated with this average error.
The absolute value of this error is plotted in thegraph. Clearly the error increases as the lengthbeing measured gets larger. The maximum errorwas 4.5% when the length being measured was20 m.
Regression Equation for Estimating theMeasurement Error
In the previous section we had looked at the effectof pixel size, calibration unit, and length of theobject being measured on the measurementerror. For small pixel sizes, the measurement erroris small, although we do observe a few outliers.
that images Img15 and Img16 have the samediameter (1m) but the diameter in pixels forthese images are 83 and 15 respectively. Theeffect of this on the measurement error is quiteobvious in the figure.
In general, the error gets smaller if the numberof pixels for the same diameter size increases.The line drawn is a guide to the eye. Img9 andImg14 shows large error compared to other datapoints having the same number of pixelsdescribing the diameter.
Error and Length of the ObjectError and Length of the ObjectError and Length of the ObjectError and Length of the ObjectError and Length of the Object
The actual length is plotted against the averageerror. The average error was calculated as follows.Wherever more than one sample data was available
Figure 5: Error variation with length measured
16
Image Measurement Errors and Missile Performance
We also noted that a calibration diameter of 2.8m gave smaller measurement error compared toa calibration diameter of 1 m. Whenever theimage had a larger number of diameter pixels,the measurement errors were not very large.
In order to estimate the error involved inmeasurements made on images of missiles ofunknown dimensions, we tried to establish anempirical relationship between the absolute errorand the combined effect of these parameters. Theresults of the previous section indicate that someof the data points may be outliers and need tobe eliminated while obtaining the regressionequation. We observed that strap-on lengthmeasurements made on Img5 and Img6, as wellas total length measured in Img14 and Img16show errors incompatible with images havingsimilar pixel size, number of diameter pixels, andmeasured length. These data points weretherefore not included for obtaining theregression equation. Although Img7 and Img9show large errors, the images were of goodquality and the large error could not be attributedto any specific image related problems and weretherefore included for the regression analysis.
Stepwise regression21 of the absolute error (%)with the above parameters was performed usingMYSTAT12. The method involved a backwardselection process that included the variables -pixel size in cm, measured length in m, calibration
diameter in m, calibration diameter expressed asnumber of pixels, reciprocal of the calibrationdiameter in meters and Length to Diameter ratio.The best fit regression equation with a p value22
of 0.0004 and a coefficient of determination valueof 0.80 was found to be,
Y = -4.346 + 0.068 X1 +0.350 X2 + 3.475X3
Where,Y = Absolute Error in (%)X1 = Measured length in mX2 = Pixel Size in cmX3 = Reciprocal of calibration size in m.
The pixel size in cm, reciprocal of the actual diameterand the measured length had significant influenceon the measurement error. In the process ofobtaining the regression equation, strap-on lengthmeasurement made on Img9 was found to be anoutlier and hence was eliminated. The regressionequation was thus based on 16 data points.
If the image of a missile is available, then themethodology described here can be used todetermine the pixel size (X2), measured length (X1)and the reciprocal of the calibration diameter inmeters (X3). We can then use these values in theequation above to get an estimate of the % error.The length of the missile could then be expressedas (L-e, L+e), where e is the estimated error inmeters and L is the measured length.
21 Stepwise regression removes and adds variables to the regression model for the purpose of identifying a useful subset of theinfluencing parameters also called predictors. This can be done by either forward selection or backward selection. In the forwardselection, the predictor having the highest R squared value is introduced first and the predictor that increases the R squared valuethe most is introduced next. At each step a predictor is introduced and the process of introduction is stopped when no significantincrease in the R Squared value is noted. In the backward selection, all the predictors are included in the equation and the predictorcontributing the least to the R squared value is removed first. The predictors are removed one by one till the removal of a predictorsignificantly reduces the R squared value.
22 A p-value is a measure of how much evidence we have against the null hypothesis. The smaller the p-value, the greater theevidence we have against the null hypothesis. In this case, our null hypothesis states that the variables included in our regressionequation have zero co-efficients or in other words have no influence on the dependent variable Y. p=0.004 suggests that the threeparameters X1, X2, X3 affect the measurement error Y significantly.
17
Image Measurement Errors and Missile Performance
Application of the Methodology toShaheen 2 Images
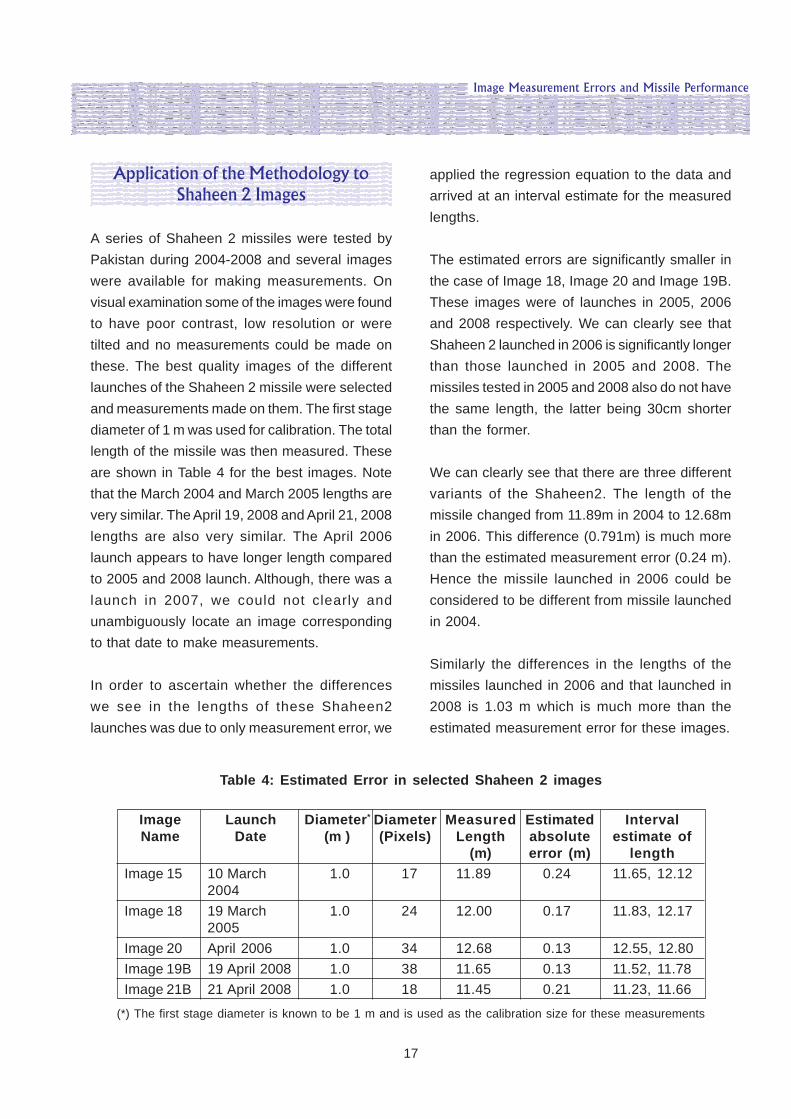
A series of Shaheen 2 missiles were tested byPakistan during 2004-2008 and several imageswere available for making measurements. Onvisual examination some of the images were foundto have poor contrast, low resolution or weretilted and no measurements could be made onthese. The best quality images of the differentlaunches of the Shaheen 2 missile were selectedand measurements made on them. The first stagediameter of 1 m was used for calibration. The totallength of the missile was then measured. Theseare shown in Table 4 for the best images. Notethat the March 2004 and March 2005 lengths arevery similar. The April 19, 2008 and April 21, 2008lengths are also very similar. The April 2006launch appears to have longer length comparedto 2005 and 2008 launch. Although, there was alaunch in 2007, we could not clearly andunambiguously locate an image correspondingto that date to make measurements.
In order to ascertain whether the differenceswe see in the lengths of these Shaheen2launches was due to only measurement error, we
applied the regression equation to the data andarrived at an interval estimate for the measuredlengths.
The estimated errors are significantly smaller inthe case of Image 18, Image 20 and Image 19B.These images were of launches in 2005, 2006and 2008 respectively. We can clearly see thatShaheen 2 launched in 2006 is significantly longerthan those launched in 2005 and 2008. Themissiles tested in 2005 and 2008 also do not havethe same length, the latter being 30cm shorterthan the former.
We can clearly see that there are three differentvariants of the Shaheen2. The length of themissile changed from 11.89m in 2004 to 12.68min 2006. This difference (0.791m) is much morethan the estimated measurement error (0.24 m).Hence the missile launched in 2006 could beconsidered to be different from missile launchedin 2004.
Similarly the differences in the lengths of themissiles launched in 2006 and that launched in2008 is 1.03 m which is much more than theestimated measurement error for these images.
Table 4: Estimated Error in selected Shaheen 2 images
Image Launch Diameter* Diameter Measured Estimated IntervalName Date (m ) (Pixels) Length absolute estimate of
(m) error (m) lengthImage 15 10 March 1.0 17 11.89 0.24 11.65, 12.12
2004Image 18 19 March 1.0 24 12.00 0.17 11.83, 12.17
2005Image 20 April 2006 1.0 34 12.68 0.13 12.55, 12.80Image 19B 19 April 2008 1.0 38 11.65 0.13 11.52, 11.78Image 21B 21 April 2008 1.0 18 11.45 0.21 11.23, 11.66
(*) The first stage diameter is known to be 1 m and is used as the calibration size for these measurements
18
Image Measurement Errors and Missile Performance
The difference between the lengths of themissiles launched in 2004 and 2008 is 0.44mwhich is also larger than theestimated measurement error(0.24 m).
Thus we clearly see that there arethree groups of missiles. Althoughno specific reason can be givenfor such variations in lengths ofmissiles of the same class, onecan infer that some experimentaldevelopment process is going on in Pakistan.
Conclusion
It is possible to estimate with reasonablestatistical confidence the dimensions of a missilesystem from its digital image using simple imageprocessing tools. Such a conclusion is supportedby the quantitative estimates given below.
The average error and the standard deviation ofthe error in measuring lengths up to 13 m from
digital images is estimated to be 0.08 m and 0.36m respectively. This leads to a 95% confidence
interval of 2 cm and 14 cm for theestimated error.
When the calibration diameter is1m, the measurement error isbetween 3% and 6% and whenthe calibration diameter is 2.8m, itis between 0.2% and 3.2%.
The pixel size in centimeters,reciprocal of the calibration diameter in meters,and the measured length in meters hadsignificant influence on the measurement error.A regression equation to estimate thismeasurement error has been derived from asample of 16 data points.
Using this equation on the measurements madeon images of Shaheen 2 missiles launchedbetween 2004 and 2008, indicate that there havebeen three versions of Shaheen 2 missiles duringthis period.
We clearly see that there are
three groups of missiles.
Although no specific reason can
be given for such variations in
lengths of missiles of the same
class, one can infer that some
experimental development
process is going on in Pakistan.
19
Image Measurement Errors and Missile Performance
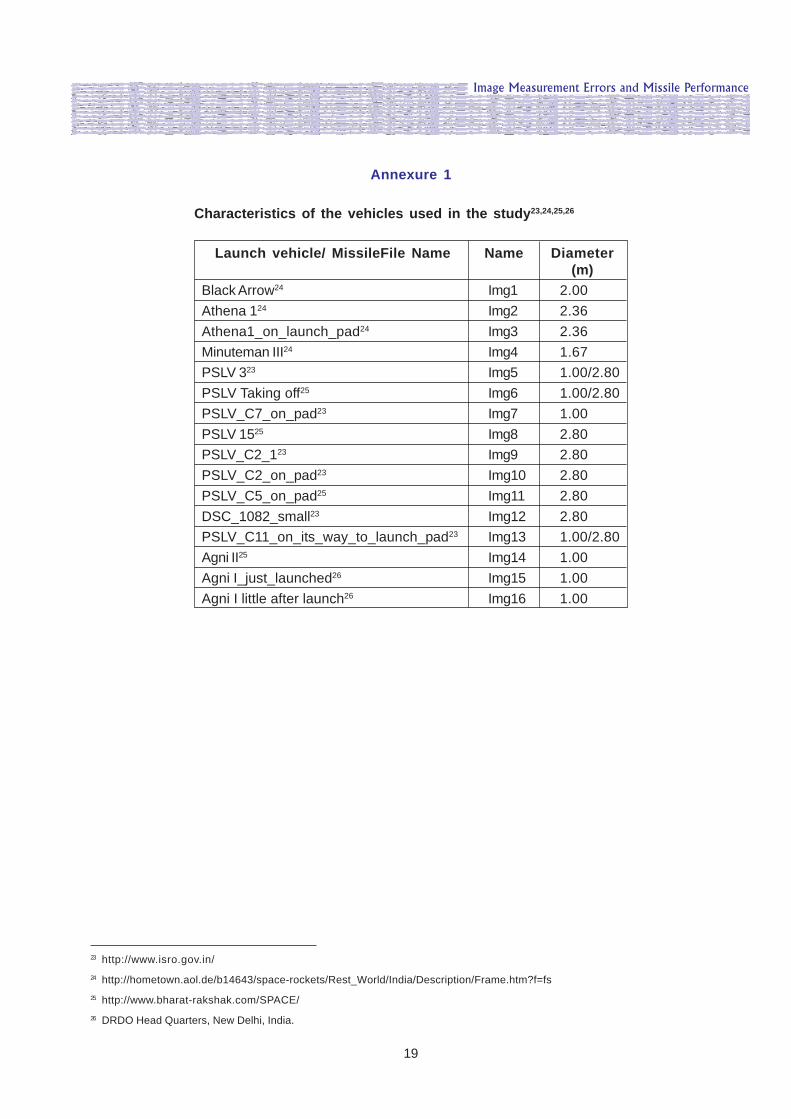
Annexure 1
Characteristics of the vehicles used in the study23,24,25,26
Launch vehicle/ MissileFile Name Name Diameter(m)
Black Arrow24 Img1 2.00Athena 124 Img2 2.36Athena1_on_launch_pad24 Img3 2.36Minuteman III24 Img4 1.67PSLV 323 Img5 1.00/2.80PSLV Taking off25 Img6 1.00/2.80PSLV_C7_on_pad23 Img7 1.00PSLV 1525 Img8 2.80PSLV_C2_123 Img9 2.80PSLV_C2_on_pad23 Img10 2.80PSLV_C5_on_pad25 Img11 2.80DSC_1082_small23 Img12 2.80PSLV_C11_on_its_way_to_launch_pad23 Img13 1.00/2.80Agni II25 Img14 1.00Agni I_just_launched26 Img15 1.00Agni I little after launch26 Img16 1.00
23 http://www.isro.gov.in/24 http://hometown.aol.de/b14643/space-rockets/Rest_World/India/Description/Frame.htm?f=fs25 http://www.bharat-rakshak.com/SPACE/26 DRDO Head Quarters, New Delhi, India.
20
Image Measurement Errors and Missile Performance
Annexure 2
Brief Description of the Missiles / LaunchVehicles Used in the Study
Black Arrow:A British Carrier rocket developed by RoyalAircraft Establishment, the Black Arrow was firstlaunched on 28 June 1969. The last Black Arrowwas launched on 28 October 1971. It was a threestage rocket weighing 18 tonnes with a LEOpayload capacity of nearly 100Kg and placed intoorbit the Prospero X-3 satellite. It was abandonedin 1971. It had a total length of 12.98 m and adiameter of 2 m.
Athena:A three stage launch vehicle developedcommercially by Lockheed Martin. Two imageswere available for the analysis. The diameterof Athena was 2.36 m and the length was18.86 m.
LGM-30F Minuteman:The Minuteman series of ICBMs have beenoperated by US Air Force from 1960. Minuteman-I and II operated til l 1997. The LGM-30FMinuteman-III was first deployed in 1970. Thetotal length is about 18m and the first stagediameter is 1.67m. For our study we have mademeasurements of only the length of the first stagewithout the nozzle.
AGNI II:It is an Intermediate Range Ballistic Missile of Indiahaving a length of 20m and a first stage diameterof 1m.
PSLV:The Polar Satellite Launch Vehicle (PSLV) is a heavylauncher designed and developed by the IndianSpace Research Organisation (ISRO) to launch itssatellites into sun synchronous orbits. The basicPSLV configuration is 44.4 m tall having four stageswith a first stage diameter of 2.8 m and length of20.203 m. There are six strap-on motors (PSOM)carrying solid propellants of which two or four areignited on the ground depending on missionrequirement. The length of these PSOMs from thenose cone tip to nozzle end base ring outer face is10.223 m. Some variants of PSLV without the strapon motors have also been tested.
PSLV C11PSLV C11 that recently launched Chandrayaan -1 spacecraft is an updated version of ISRO’sPSLV. In this case the first stage dimensions arethe same as the other PSLVs but the six strap -on motors have an increased length of 12.4m.
Agni IAgni I is a single stage Intermediate RangeBallistic Missile of India having a length of 15mand diameter of 1m.
21
Image Measurement Errors and Missile Performance
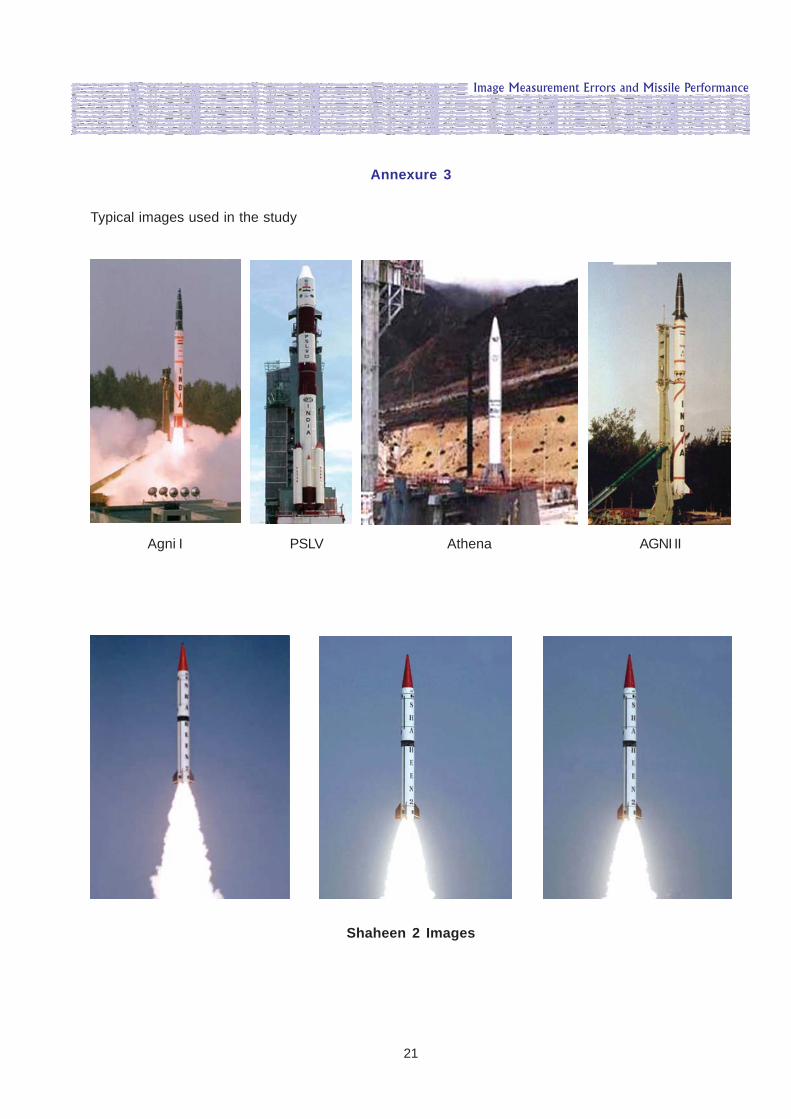
Agni I PSLV Athena AGNI II
Shaheen 2 Images
Annexure 3
Typical images used in the study

22
Image Measurement Errors and Missile Performance

International Strategic &
Security Studies Programme
The International Strategic & Security Studies Programme at NIAS promotes
and conducts research that addresses the strategic and security concerns of
India. It has over the years carried out a number of studies in technology
dominated areas of international security - nuclear weapons and missiles. NIAS
has also facilitated exchange of knowledge and views between interested groups
working around the globe on issues related to international security. The
programme focuses on the region with a special emphasis on China and Pakistan.
IISc Campus, Bangalore - 560 012, IndiaTel: 2218 5000, 2218 5087 Fax: 2218 5028Email: [email protected]
NATIONAL INSTITUTE OF ADVANCED STUDIES
International Strategic and Security Studies Programme