using&pems&and&local&vehicle& ac4vity&measurements&to
TRANSCRIPT

Using PEMs and Local Vehicle Ac4vity Measurements to Improve Inventories and Policy Development
in Developing Countries
ISSRC March 24, 2010

The Air Quality Management Process

Typical Overall Contribu4ons to Air Quality Problems
• On-‐Road Motor Vehicles 48% • Point Sources 28% • Fixed Area Sources 15% • Off-‐Road Sources 10%

On-‐Road Mobile Sources
• Most difficult to quan4fy key emission related data
• Most difficult to es4mate emissions • Most varia4on over the day

Situa4on in Most Developing Countries
• No informa4on on total driving • No informa4on on driving by 4me of day • No informa4on on on-‐road fleet technology distribu4on
• No informa4on on driving paWerns • No informa4on on on-‐road emissions per vehicle • NOW: Determine the emissions in the urban area created my on-‐road motor vehicles

On-‐Road Emission Related Data Priori4es
• 1. Total Vehicle Number/Total Amount of Driving • 2. Distribu4on of Driving Among Vehicle Types • 3. Driving PaWerns • 4. Vehicle Start Informa4on • 5. Vehicle Emission Factors

Distribution of Driving in a Region

Ge^ng Fleet Distribu4on Informa4on in India

Parking Lot Surveys for Informa4on

Los Angeles Registration, Videotape, Parking Lot

Driving Patterns: GPS / Microprocessor Unit
Battery good for 40 hours of testing. GPS/Microprocessor
Module
Unit easily carried and used to collect bus driving patterns with lid closed.
Note: This is the original style GPS used.

Start Patterns

Improved GPS for Recent Studies • Operate for two weeks collec4ng second by second data
• Collect vehicle start-‐up informa4on • Use with any type of vehicle • Pressure sensor to es4mate road grade

PEMS Gasoline
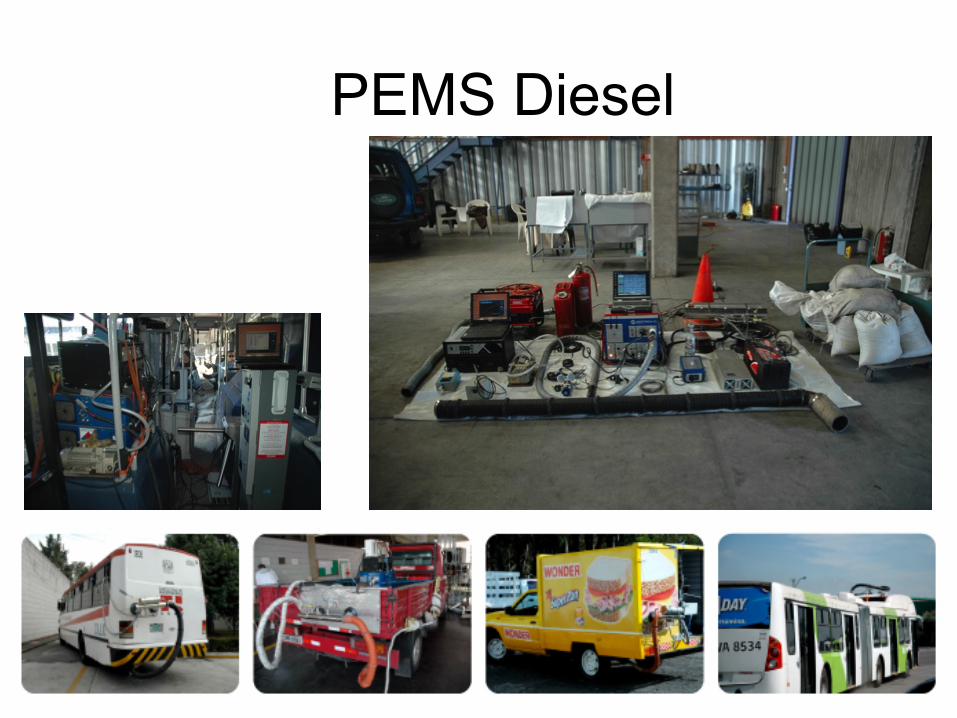
PEMS Diesel

Driving PaWerns and Emissions
• On-‐road driving paWerns cannot easily be controlled which changes emissions measured
• For comparisons of vehicles between ci4es or for development of emission factors there is value in finding a way to standardize emissions to a common cycle.
• ISSRC uses VSP binning to get emission rates by bin and then converts emissions to FTP type cycle for comparisons and crea4on of emission factors

Results of Interest from Tes4ng Program

How Many Vehicles Should Be Tested?
90%Confidence Intervals
# in Group CO CO2 NOx THC
<5 71% 15% 36% 104%
5-19 44% 11% 40% 50%
20-49 20% 6% 27% 23%
>50 23% 5% 22% 27%
Better
Tes$ng at least 20 vehicles in a technology group is important!

Fleetwide Confidence Intervals
Ave # per tech group Total # CO CO2 NOx THC
Sao Paulo 4.5 111 31% 3% 22% 34%
Nairobi 12.5 113 17% 3% 11% 15%
Mexico 19.5 234 16% 3% 12% 16%

Comparison of Emissions from Gasoline Vehicles
0 50
100 150 200 250 300 350 400
Carb SPFI MPFI ALL Carb SPFI MPFI ALL
CO CO2
Sao Paulo Mexico City Nairobi Data from Actual On-‐
Road Test
0 50
100 150 200 250 300 350 400
Carb SPFI MPFI ALL Carb SPFI MPFI ALL
CO CO2
Sao Paulo Mexico City Nairobi
Data Corrected to LA4 (FTP) Cycle

Distribu4on of Emissions (Sao Paulo)
0
5
10
15
20
25
30
35
1 3 5 7 9 11 13 15 17 19 21 23 25 27 29 31 33 35 37 68
Emission Rate (g/km)
Num
ber o
f Veh
icle
s
0
200
400
600
800
1000
1200
Vehicle NumberCummulativeEmissions
Total Vehicles Successfully Tested: 100 Eight (8) Vehicles (8% of fleet) Contributed ~43% of emissions.

Vehicle Use and Fleet Age
0
50,000
100,000
150,000
200,000
250,000
300,000
0 2 4 6 8 10 12 14
Acc
umul
ated
Odo
met
er R
eadi
ng (K
ms)
Vehicle Age (yrs)
Los Angeles
Nairobi Almaty
Lima Santiago Mexico City
Pune
3.5 4.7
6.4 6.5 6.6 7.4
11.0 11.3
13.2
0
2
4
6
8
10
12
14
16
Beijing
, Chin
a
Pune,
India
Mexico
City
, Mex
ico
Santia
go, C
hile
Los A
ngele
s, USA
Sao P
aulo,
Bra
zil
Lima,
Peru
Almaty
, Kaz
akhs
tan
Nairob
i, Ken
ya
Aver
age
Age
[yrs
]

!"#
$!"#
%!"#
&!"#
'!"#
(!"#
)!"#
*!"#
+!"#
,!"#
$!!"#
-./#012343/#
5367612# 8396:.# ;<6=.>6# 5?31./#06=3/#
@<1A<2.# @<.#B<?4.# 04C<DE# 5.2.D<# -6C<# B?13#
%F&#GH334/#
I=?:J#
5?/#
B<//#:<=#
Results: Fleet Composition

Results: Vehicle technology Passenger Cars
!"#
$!"#
%!"#
&!"#
'!"#
(!"#
)!"#
*!"#
+!"#
,!"#
$!!"#
-./012/# 3.45.61# 7/8.#
9.:/#
;<=#>?#
?14@#>?#
9A?#>?#

Sample Running Emissions
0
20
40
60
80
100
120
1000 1050 1100 1150 1200 1250 1300Time from Start (seconds)
CO E
mis
sion
s (u
g/s)
0
5
10
15
20
25
30
35
40
45
50
CO Vehicle Speed

Example of Start-Up Emissions
0
50000
100000
150000
200000
250000
300000
0 50 100 150 200 250 300 350
Time from Start (seconds)
CO
Em
issi
ons
(ug/
sec) Carbon Monoxide
LEV Vehicle

Applica4on of PEMs/Ac4vity Results to Emission Inventory Development

The Interna4onal Vehicle Emissions Model (IVE) Es4mate emissions for passenger cars, trucks, buses, three-‐ and two-‐wheel vehicles for important urban pollutants, toxics, and global warming gases
Includes gasoline, diesel, natural gas, propane, and alcohol fueled vehicles
Incorporates a straighhorward methodology to collect the needed modeling informa4on
Allow users a way to update the emission factors when local data is available and adapt to the local situa4on
28

IVE Operates in Five Languages
29

Database system to manage air quality/energy related informa4on
Calculate and project air quality emissions, energy requirements, fuel use for urban regions
Integrate policy analysis for urban air, water, solid waste, and climate change pollu4on
The IED (Interna4onal Environmental Database)
30

IED Design Requirements Allow businesses to update their own informa4on Support source enforcement
Support emission caps and credit trading
Remotely accessible
Available free
Secure & Flexible 31

Daily Emissions in Sao Paulo
CO
PM10
VOC
NOx
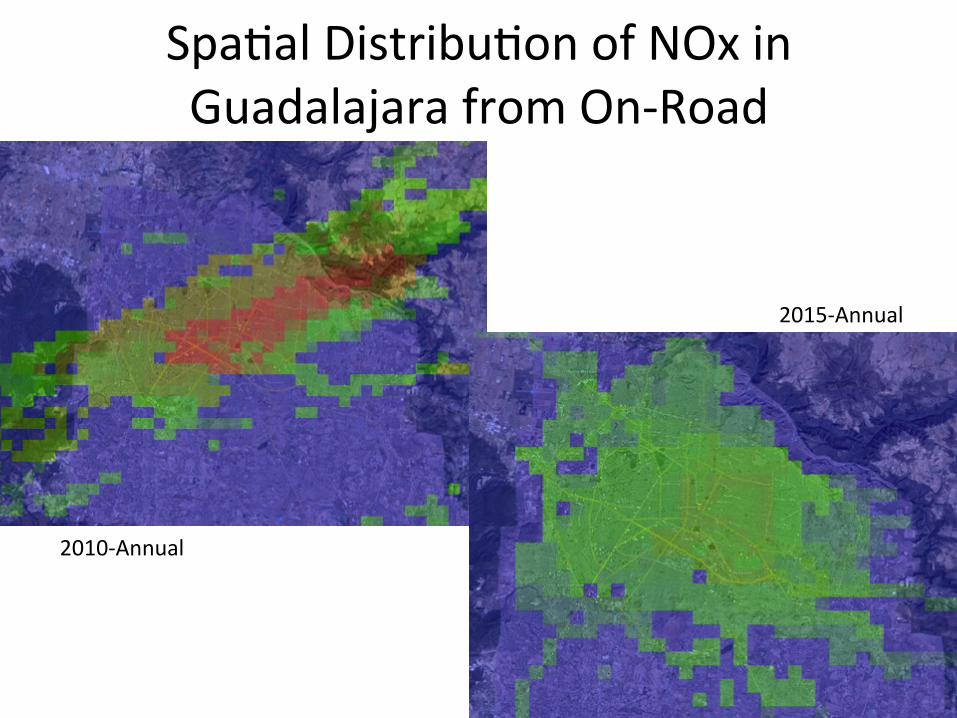
Spa4al Distribu4on of NOx in Guadalajara from On-‐Road
2010-‐Annual
2015-‐Annual

Integra4on of Data
• PEMs emission measurements combined with Vehicle Ac4vity can be integrated into an inventory result
• Can produce spa4al and temporal resolu4on of urban on-‐road emission sources
• Allows development effec4ve air quality management policy