pems measurements in hong kong · 3 april 2014 . 2 outline background and our goal on-road pems...
TRANSCRIPT
Recent Development of On-
Board Vehicle Emissions
Measurements in Hong Kong
Dr. Carol Wong
Senior Environmental Protection Officer
Environmental Protection Department
Hong Kong
3 April 2014
2
Outline
Background and our goal
On-road PEMS testing
Conclusion
3
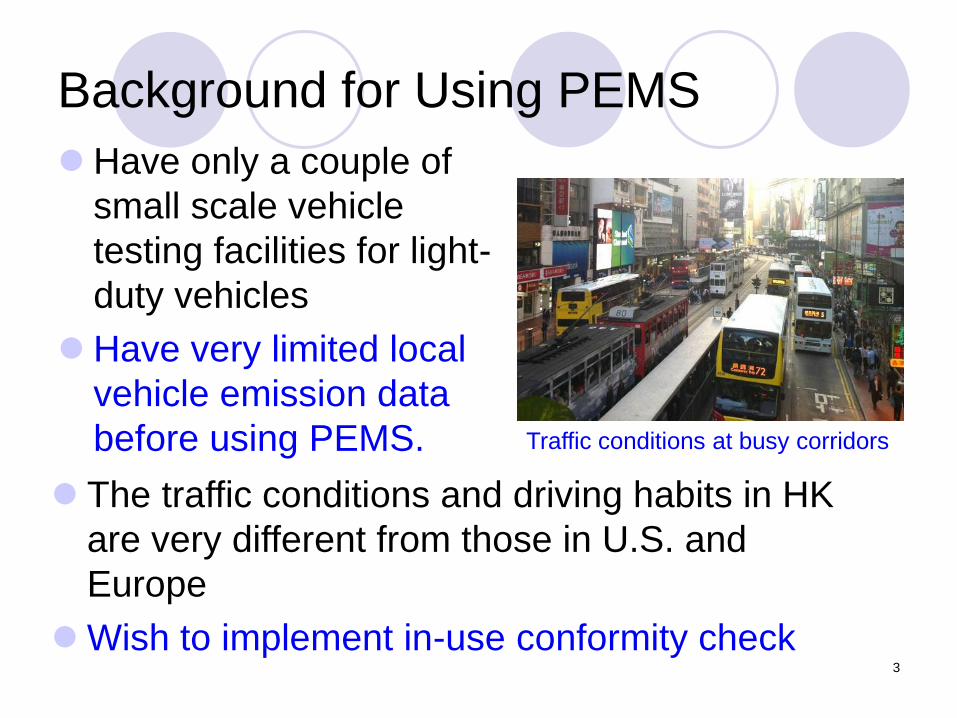
Background for Using PEMS
Have only a couple of
small scale vehicle
testing facilities for light-
duty vehicles
Have very limited local
vehicle emission data
before using PEMS.
The traffic conditions and driving habits in HK
are very different from those in U.S. and
Europe
Wish to implement in-use conformity check
Traffic conditions at busy corridors
4
Our Goal
To set up a vehicle emission database which is
segregated into groups according to --
different vehicle classes
different land use
different traffic conditions
different average speeds for trips
To use this database for zero mile emission
factors, deterioration rates and speed correction
factors for our vehicle emission model
To evaluate the performance of various after-
treat. devices, like SCR & DPF.
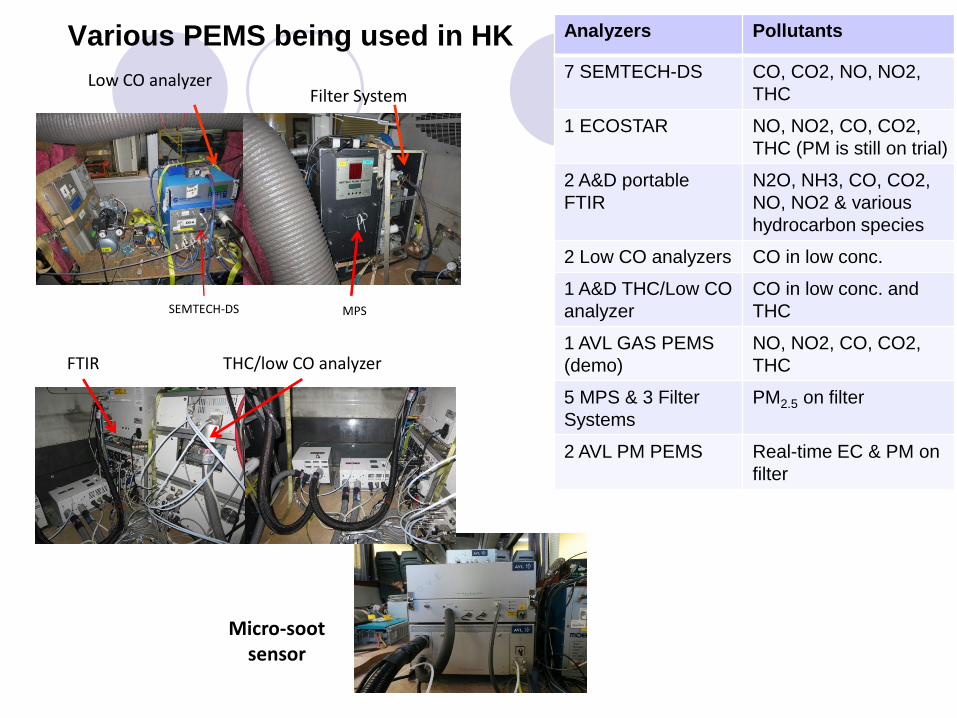
Various PEMS being used in HK
SEMTECH-DS MPS
Filter System Low CO analyzer
THC/low CO analyzer FTIR
Micro-soot sensor
Analyzers Pollutants
7 SEMTECH-DS CO, CO2, NO, NO2,
THC
1 ECOSTAR NO, NO2, CO, CO2,
THC (PM is still on trial)
2 A&D portable
FTIR
N2O, NH3, CO, CO2,
NO, NO2 & various
hydrocarbon species
2 Low CO analyzers CO in low conc.
1 A&D THC/Low CO
analyzer
CO in low conc. and
THC
1 AVL GAS PEMS
(demo)
NO, NO2, CO, CO2,
THC
5 MPS & 3 Filter
Systems
PM2.5 on filter
2 AVL PM PEMS Real-time EC & PM on
filter
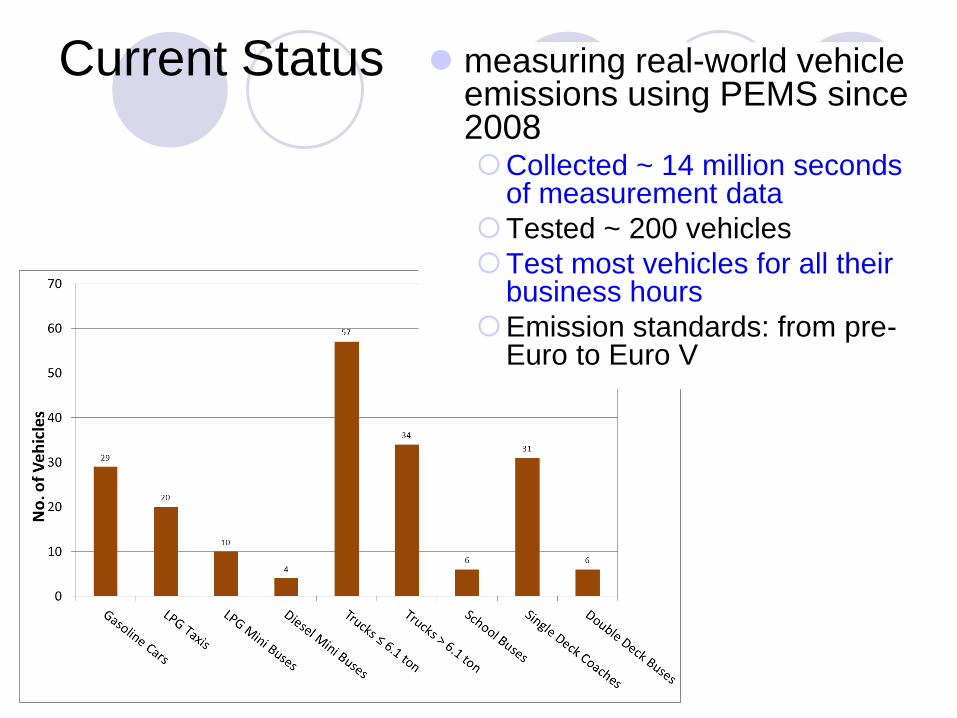
Current Status measuring real-world vehicle emissions using PEMS since 2008 Collected ~ 14 million seconds
of measurement data
Tested ~ 200 vehicles
Test most vehicles for all their business hours
Emission standards: from pre-Euro to Euro V
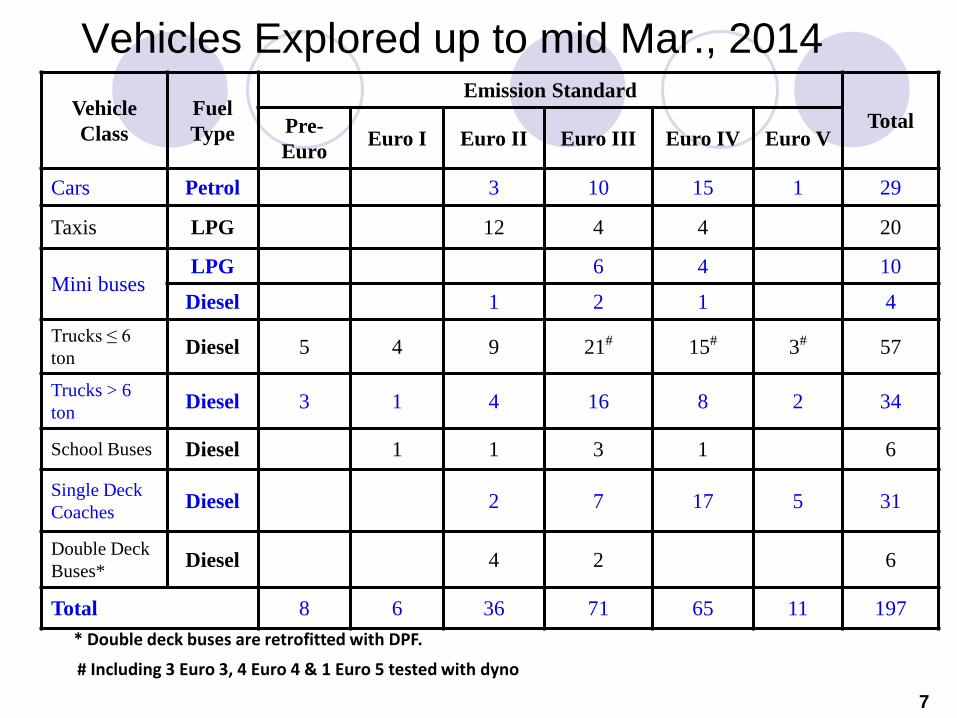
Vehicle
Class
Fuel
Type
Emission Standard
Total Pre-
Euro Euro I Euro II Euro III Euro IV Euro V
Cars Petrol 3 10 15 1 29
Taxis LPG 12 4 4 20
Mini buses LPG 6 4 10
Diesel 1 2 1 4
Trucks ≤ 6
ton Diesel 5 4 9 21# 15# 3# 57
Trucks > 6
ton Diesel 3 1 4 16 8 2 34
School Buses Diesel 1 1 3 1 6
Single Deck
Coaches Diesel 2 7 17 5 31
Double Deck
Buses* Diesel 4 2 6
Total 8 6 36 71 65 11 197
Vehicles Explored up to mid Mar., 2014
* Double deck buses are retrofitted with DPF.
7
# Including 3 Euro 3, 4 Euro 4 & 1 Euro 5 tested with dyno
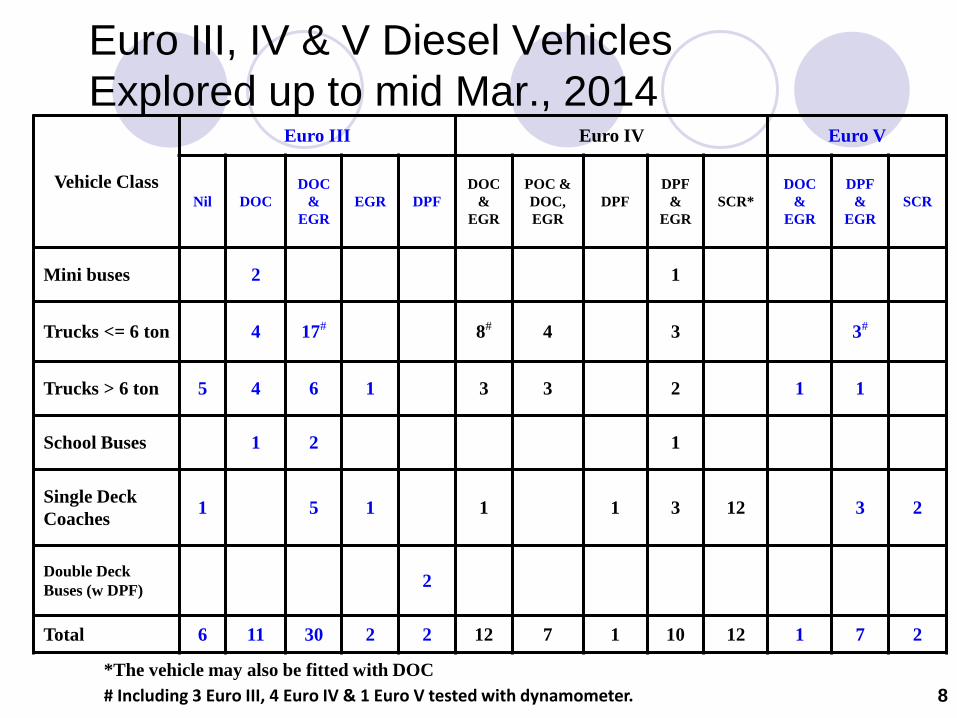
Vehicle Class
Euro III Euro IV Euro V
Nil DOC
DOC
&
EGR
EGR DPF
DOC
&
EGR
POC &
DOC,
EGR
DPF
DPF
&
EGR
SCR*
DOC
&
EGR
DPF
&
EGR
SCR
Mini buses 2 1
Trucks <= 6 ton 4 17# 8# 4 3 3#
Trucks > 6 ton 5 4 6 1 3 3 2 1 1
School Buses 1 2 1
Single Deck
Coaches 1 5 1 1 1 3 12 3 2
Double Deck
Buses (w DPF) 2
Total 6 11 30 2 2 12 7 1 10 12 1 7 2
Euro III, IV & V Diesel Vehicles
Explored up to mid Mar., 2014
8
*The vehicle may also be fitted with DOC
# Including 3 Euro III, 4 Euro IV & 1 Euro V tested with dynamometer.
9
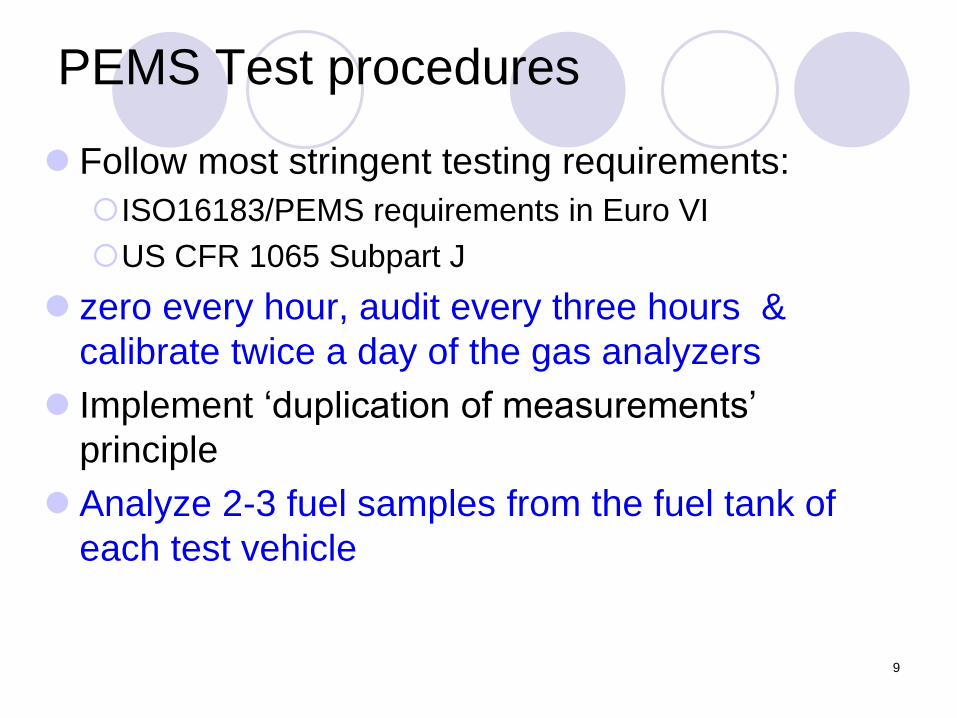
PEMS Test procedures
Follow most stringent testing requirements:
ISO16183/PEMS requirements in Euro VI
US CFR 1065 Subpart J
zero every hour, audit every three hours &
calibrate twice a day of the gas analyzers
Implement ‘duplication of measurements’
principle
Analyze 2-3 fuel samples from the fuel tank of
each test vehicle
10
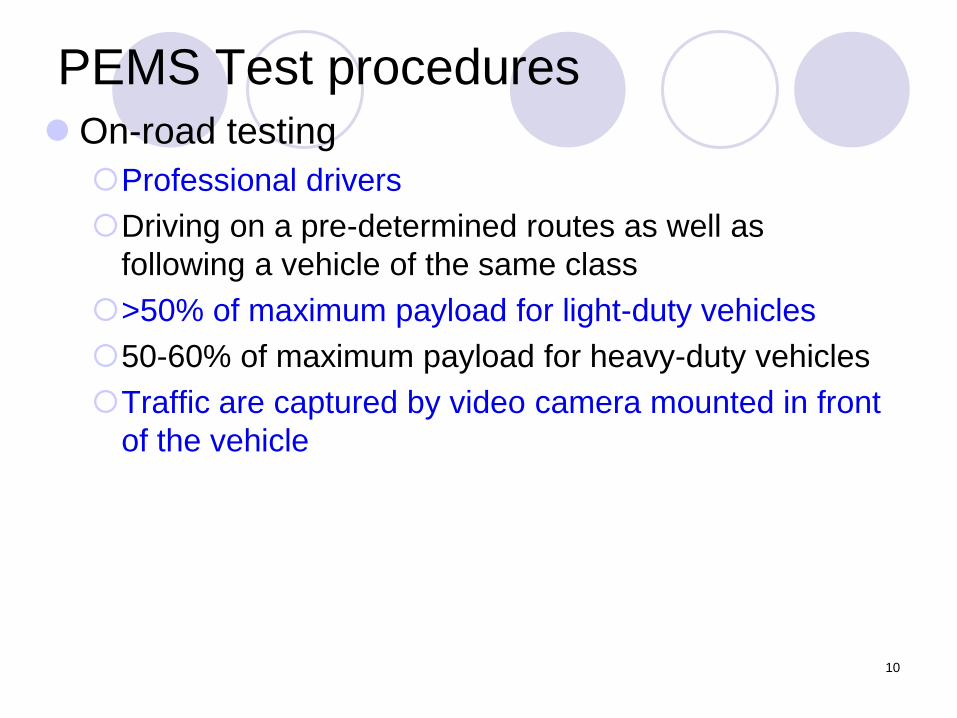
PEMS Test procedures
On-road testing
Professional drivers
Driving on a pre-determined routes as well as
following a vehicle of the same class
>50% of maximum payload for light-duty vehicles
50-60% of maximum payload for heavy-duty vehicles
Traffic are captured by video camera mounted in front
of the vehicle
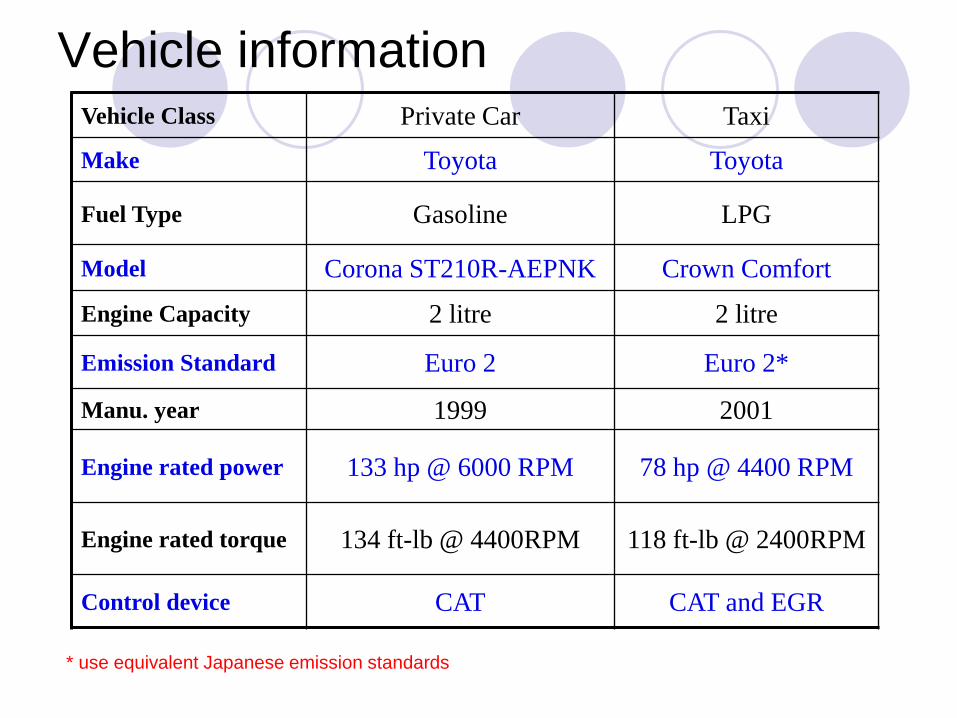
Vehicle information Vehicle Class Private Car Taxi
Make Toyota Toyota
Fuel Type Gasoline LPG
Model Corona ST210R-AEPNK Crown Comfort
Engine Capacity 2 litre 2 litre
Emission Standard Euro 2 Euro 2*
Manu. year 1999 2001
Engine rated power 133 hp @ 6000 RPM 78 hp @ 4400 RPM
Engine rated torque 134 ft-lb @ 4400RPM 118 ft-lb @ 2400RPM
Control device CAT CAT and EGR
* use equivalent Japanese emission standards

PEMS Installation on Private Car GPS, RH & temp.
sensors
Speed meter
Exhaust flow meter
SEMTECH-DS for
measuring gaseous
pollutants
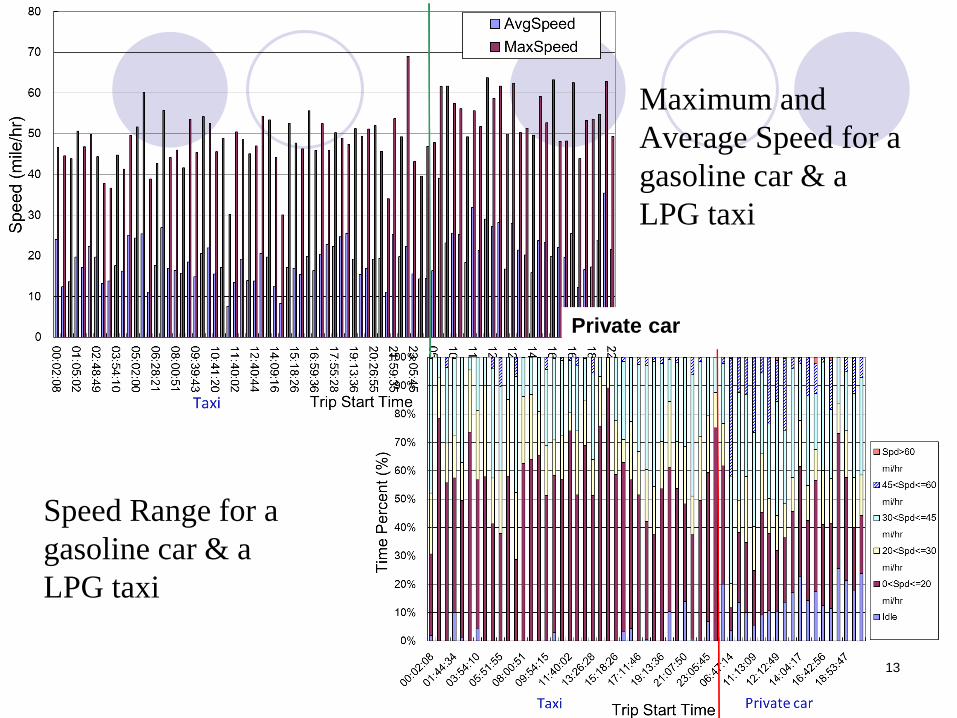
Maximum and
Average Speed for a
gasoline car & a
LPG taxi
13
Speed Range for a
gasoline car & a
LPG taxi
Private car
14
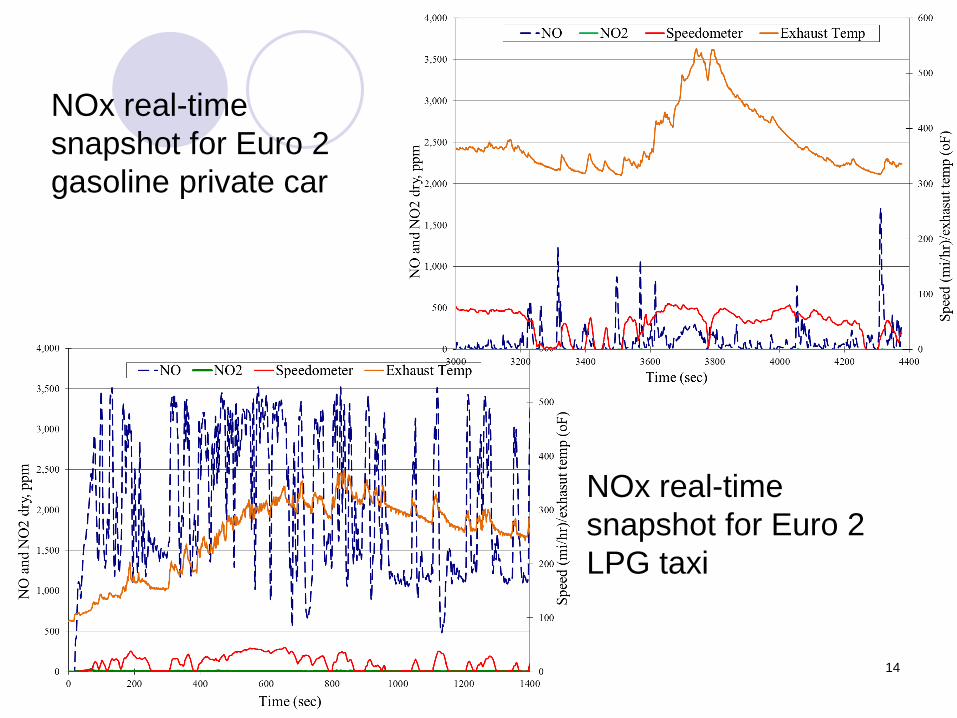
NOx real-time
snapshot for Euro 2
gasoline private car
NOx real-time
snapshot for Euro 2
LPG taxi
15
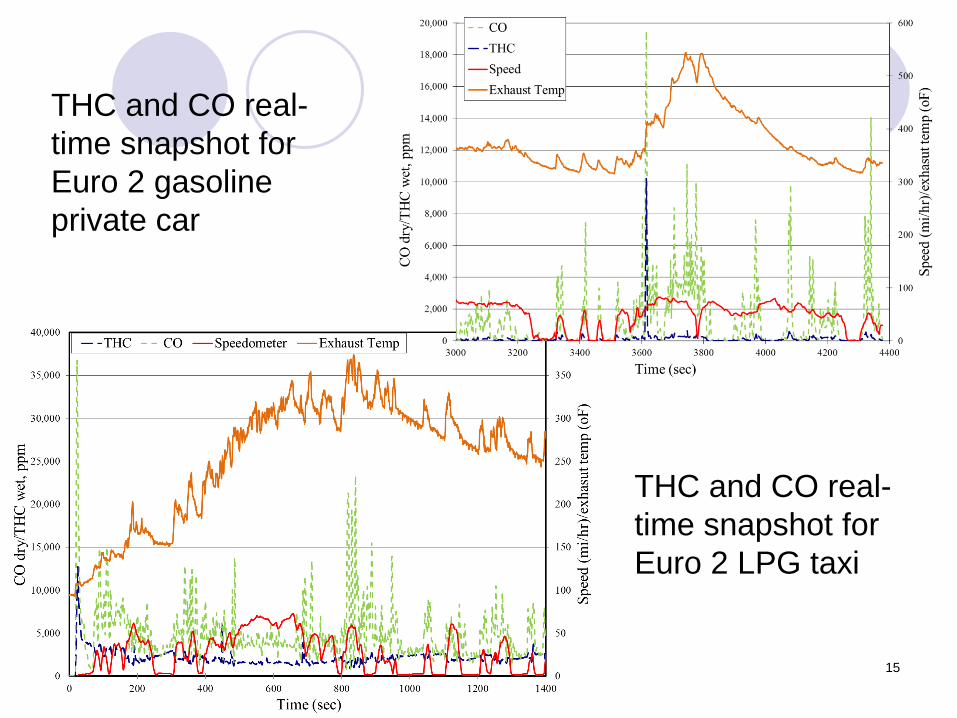
THC and CO real-
time snapshot for
Euro 2 gasoline
private car
THC and CO real-
time snapshot for
Euro 2 LPG taxi
Comparison of PEMS results with
certification data and emission standard
Identify the driving mode of PEMS data
Highway
Highway-urban
Urban
Compare the average emissions with
certification data and emission standards
16
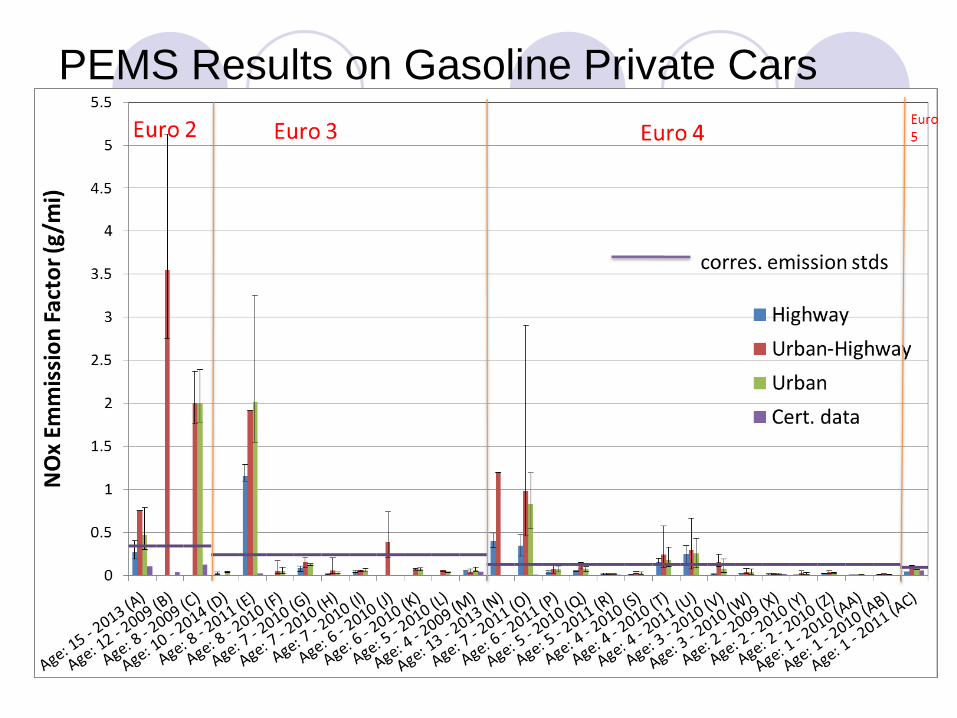
PEMS Results on Gasoline Private Cars
17

PEMS Results on LPG Taxis
18
* All LPG vehicles use equivalent Japanese emission standards
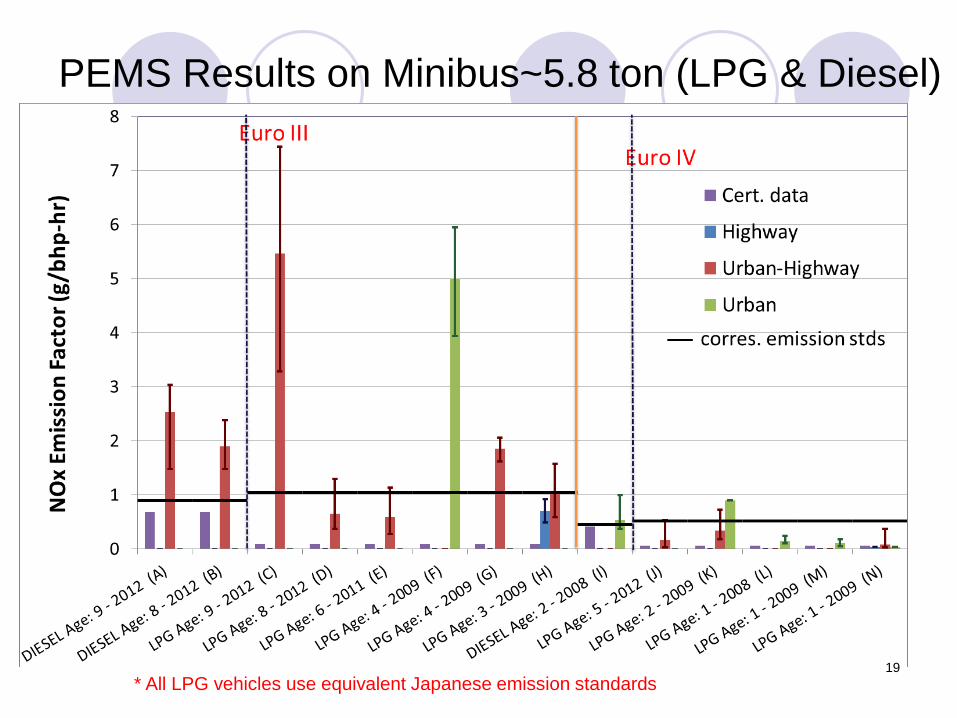
PEMS Results on Minibus~5.8 ton (LPG & Diesel)
19
* All LPG vehicles use equivalent Japanese emission standards
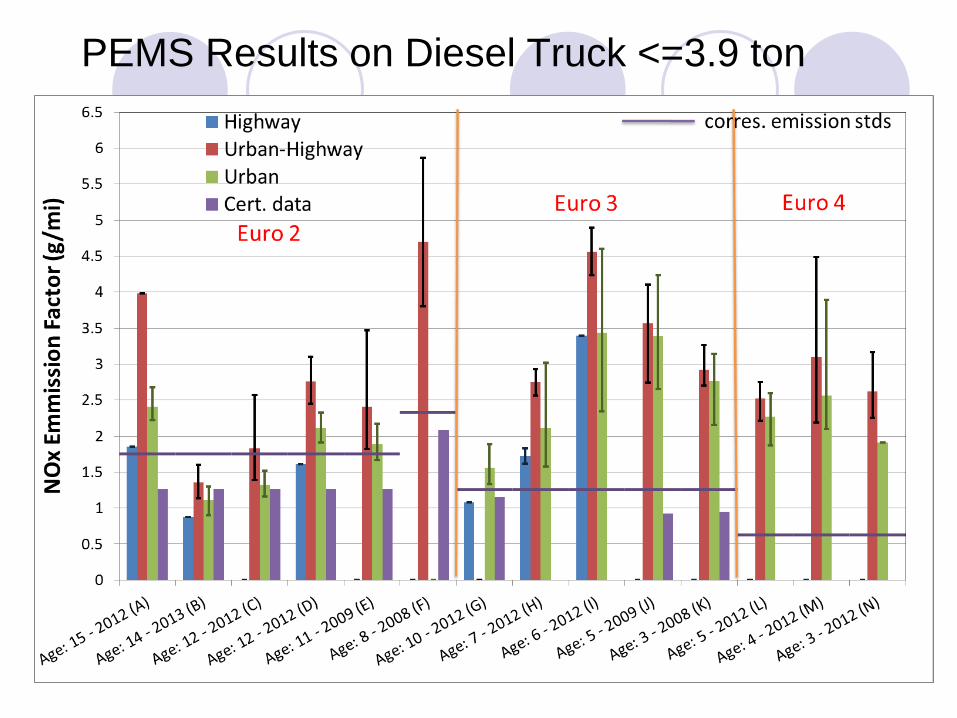
PEMS Results on Diesel Truck <=3.9 ton
20
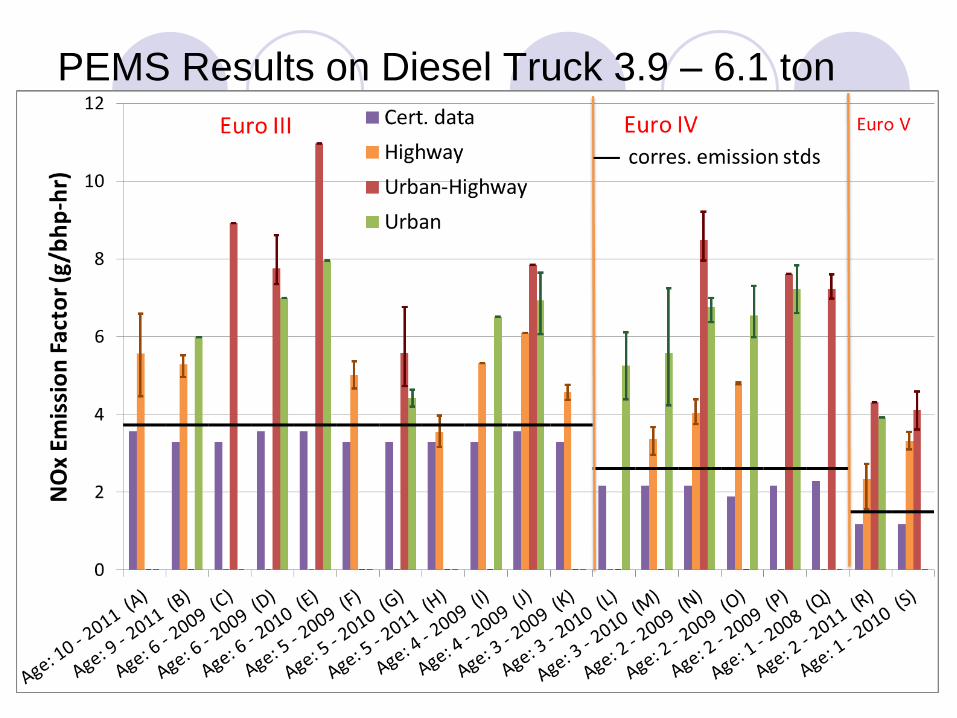
PEMS Results on Diesel Truck 3.9 – 6.1 ton
21
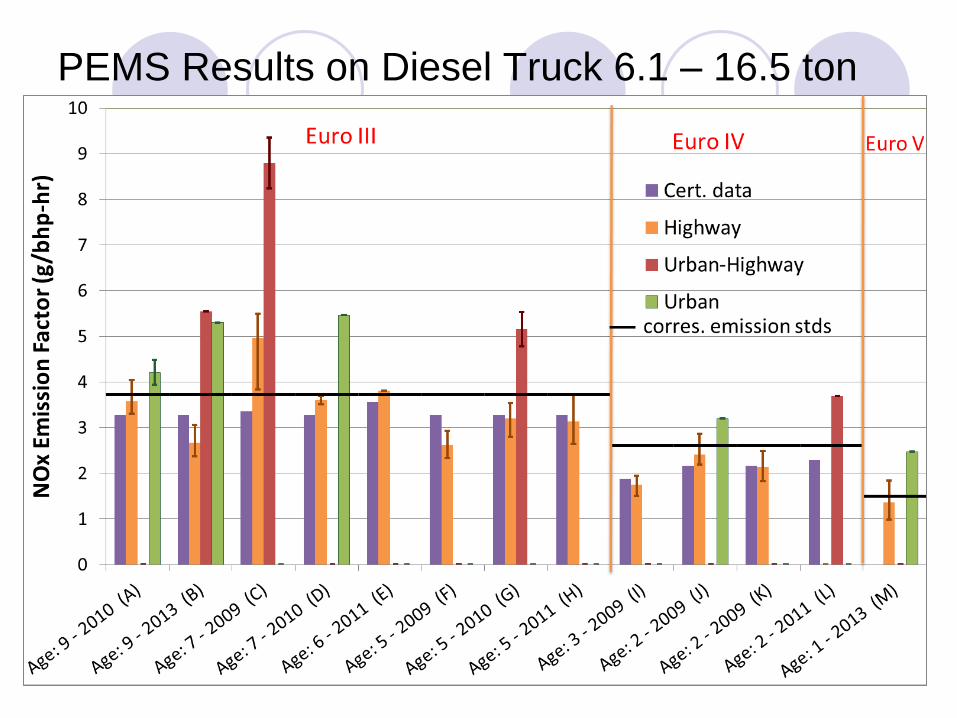
PEMS Results on Diesel Truck 6.1 – 16.5 ton
22
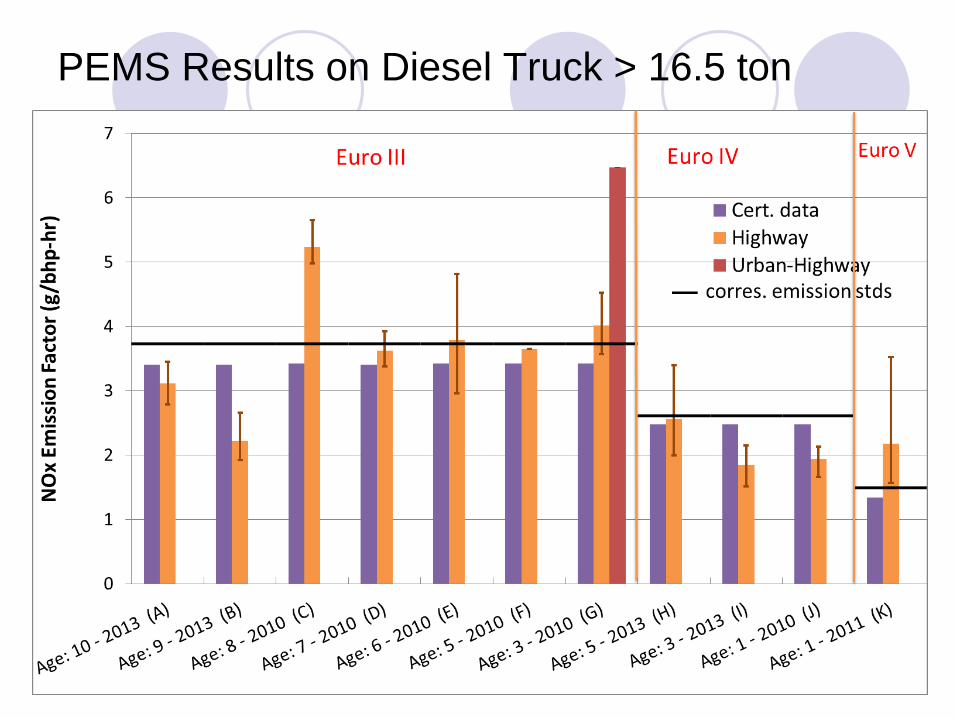
PEMS Results on Diesel Truck > 16.5 ton
23
SCR performance for different driving modes
Retrofit SCR/DPF+SCR into double deck
buses
Study the performance of SCR in highway
and urban driving
24
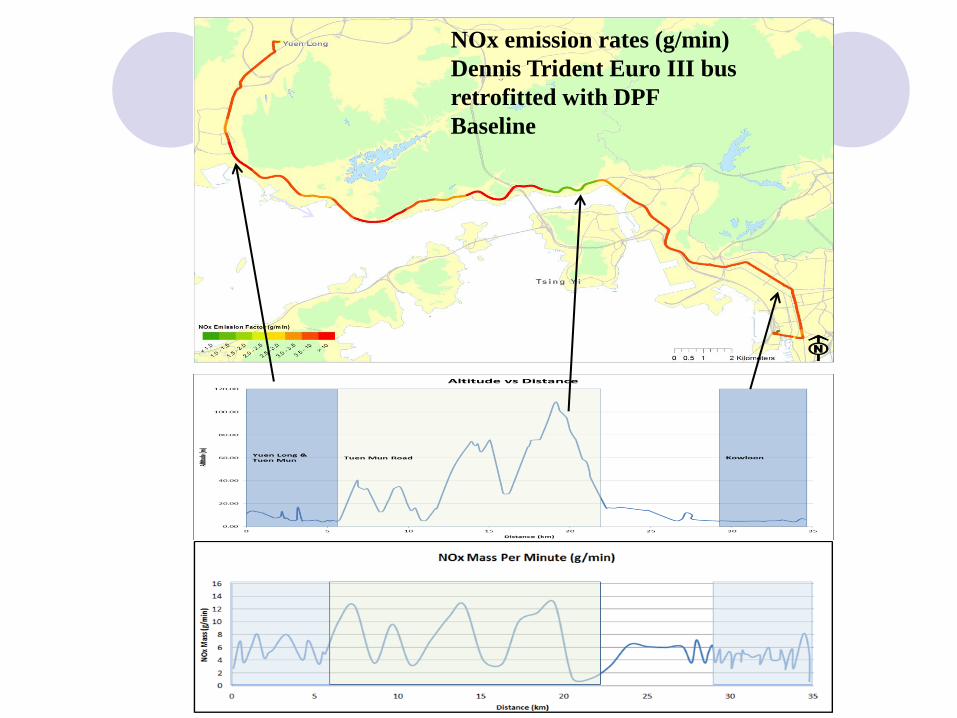
NOx emission rates (g/min)
Dennis Trident Euro III bus
retrofitted with DPF
Baseline
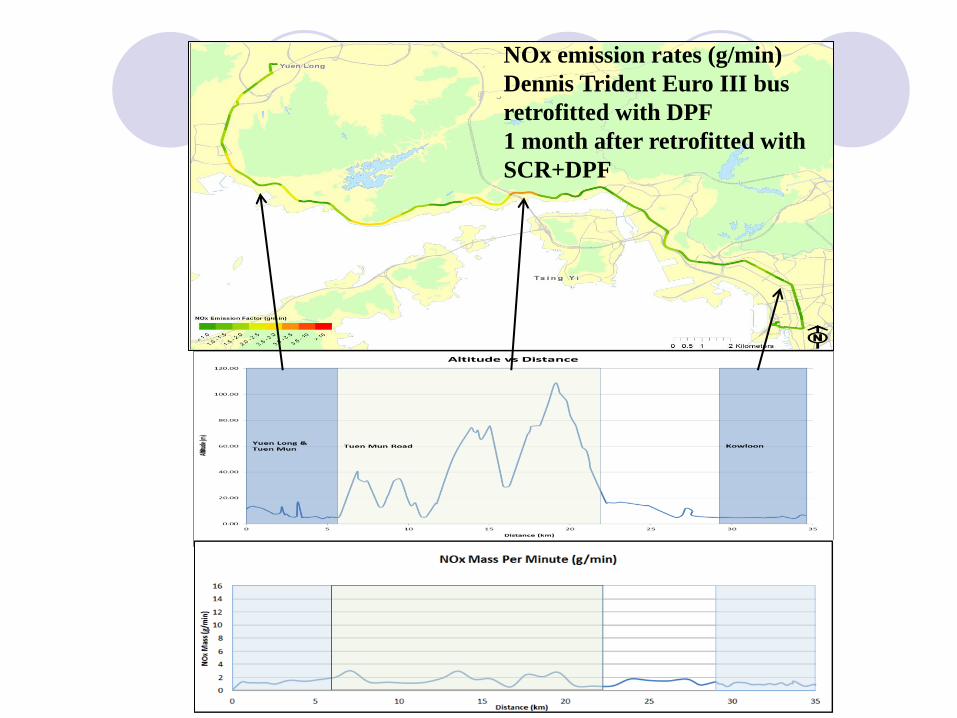
NOx emission rates (g/min)
Dennis Trident Euro III bus
retrofitted with DPF
1 month after retrofitted with
SCR+DPF
27
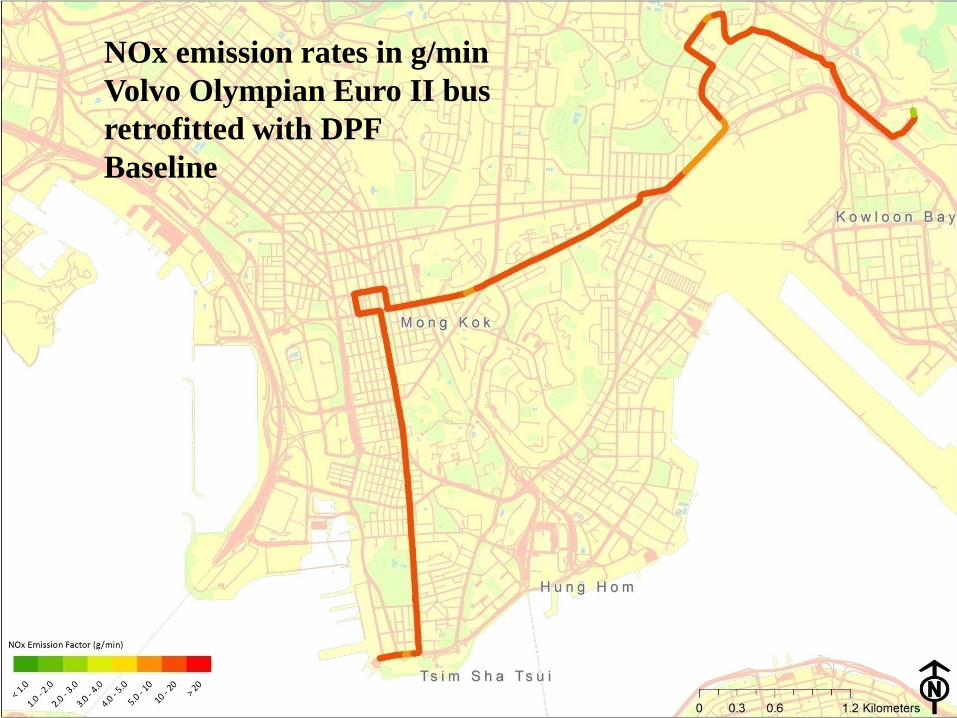
NOx emission rates in g/min
Volvo Olympian Euro II bus
retrofitted with DPF
Baseline
28
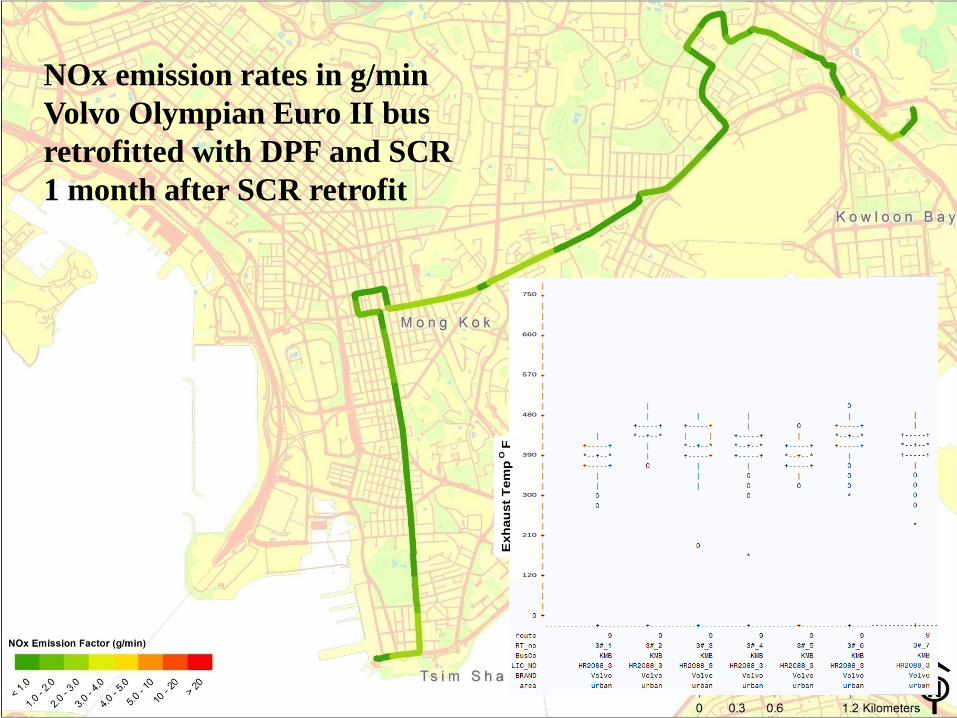
NOx emission rates in g/min
Volvo Olympian Euro II bus
retrofitted with DPF and SCR
1 month after SCR retrofit
28
Exh
au
st
tem
p o
C
750
660
570
480
390
300
210
120
Exh
au
st
Tem
p O
F
29
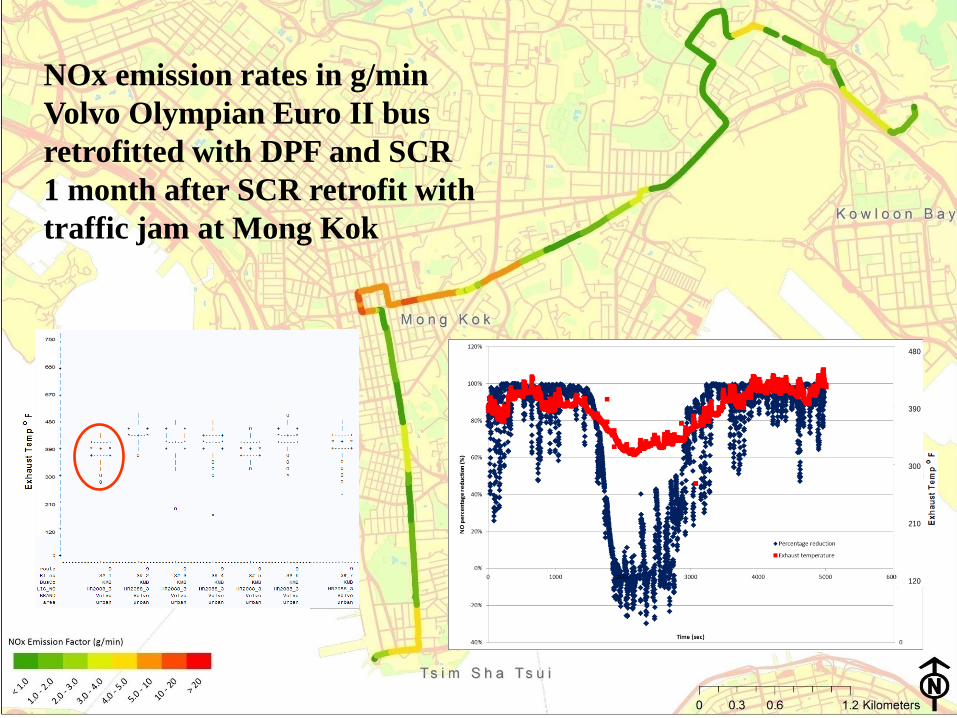
NOx emission rates in g/min
Volvo Olympian Euro II bus
retrofitted with DPF and SCR
1 month after SCR retrofit with
traffic jam at Mong Kok
Ex
ha
us
t te
mp
oC
480
390
300
210
120
30
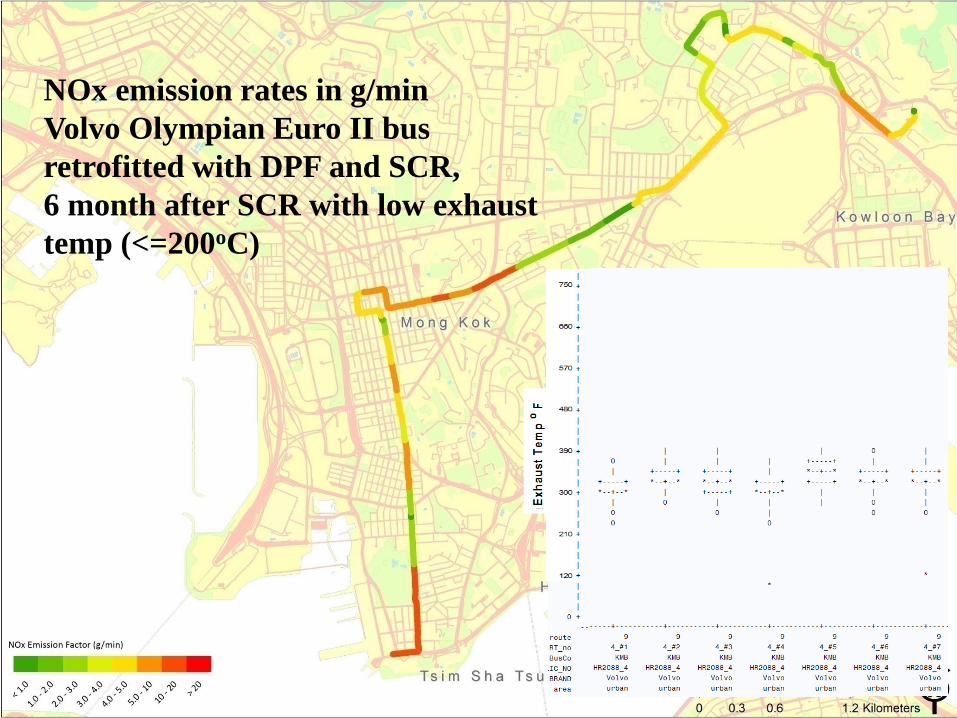
NOx emission rates in g/min
Volvo Olympian Euro II bus
retrofitted with DPF and SCR,
6 month after SCR with low exhaust
temp (<=200oC)
30
Exh
au
st
tem
p o
C
31
Conclusion
Up to Mar 2014, emissions of 200 vehicles are measured using PEMS
Except for private cars, emissions measured by PEMS are higher than the emission standard
Emission rates in highway travelling is lower than that of highway-urban and urban travelling
The performance of SCR is affected by the traffic conditions. NOx emission increases dramatically during traffic congestion

Thank you.
32