using excel in research - east carolina universitycore.ecu.edu/ofe/statisticsresearch/using excel...
TRANSCRIPT

Using Excel in Research
Hui Bian Office for Faculty Excellence
Using Excel in research
• My office is located in 1001 Joyner Library, room 1006
• Tel: 252-238-5428
• Email: [email protected]
• You can download sample data files from: http://core.ecu.edu/ofe/StatisticsResearch/

Data entry in Excel
• Data structure
–Multivariate structure
–Univariate structure
Data entry in Excel
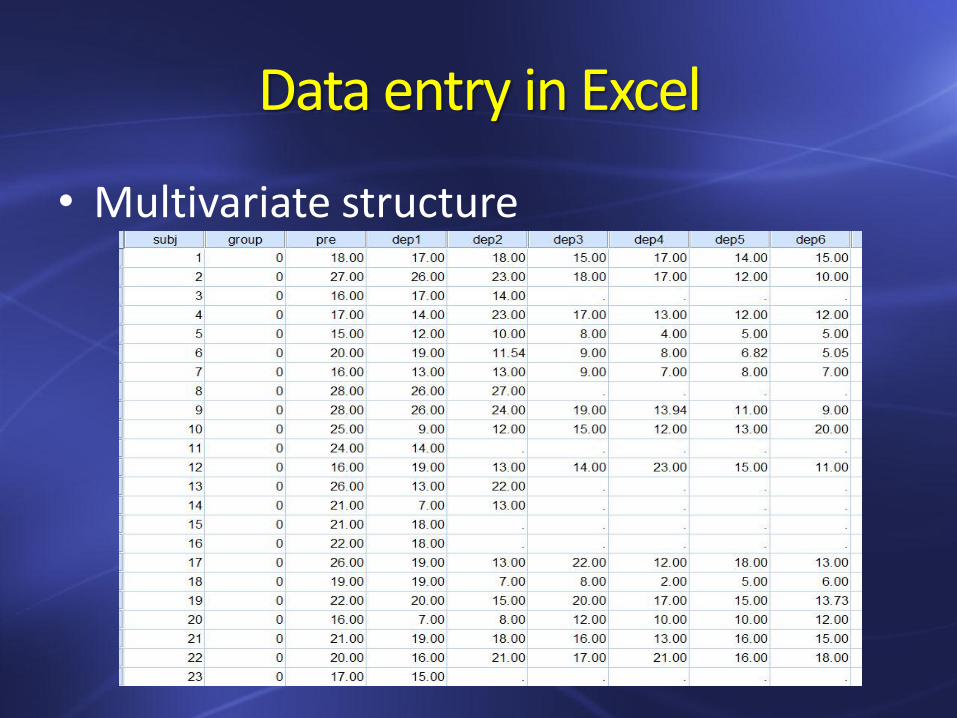
• Multivariate structure
Data entry in Excel
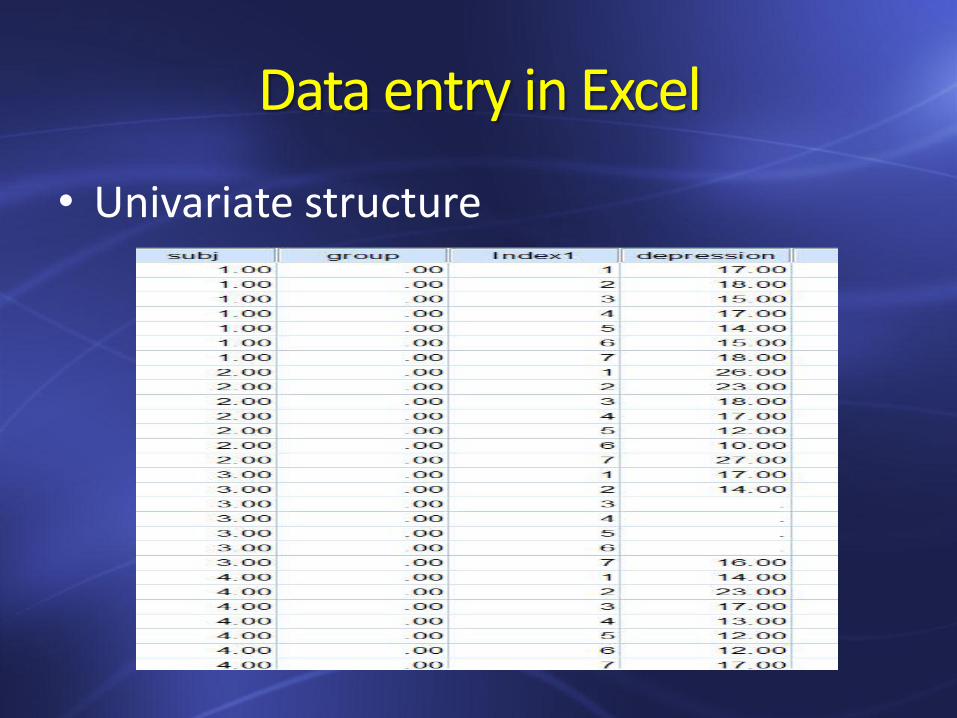
• Univariate structure
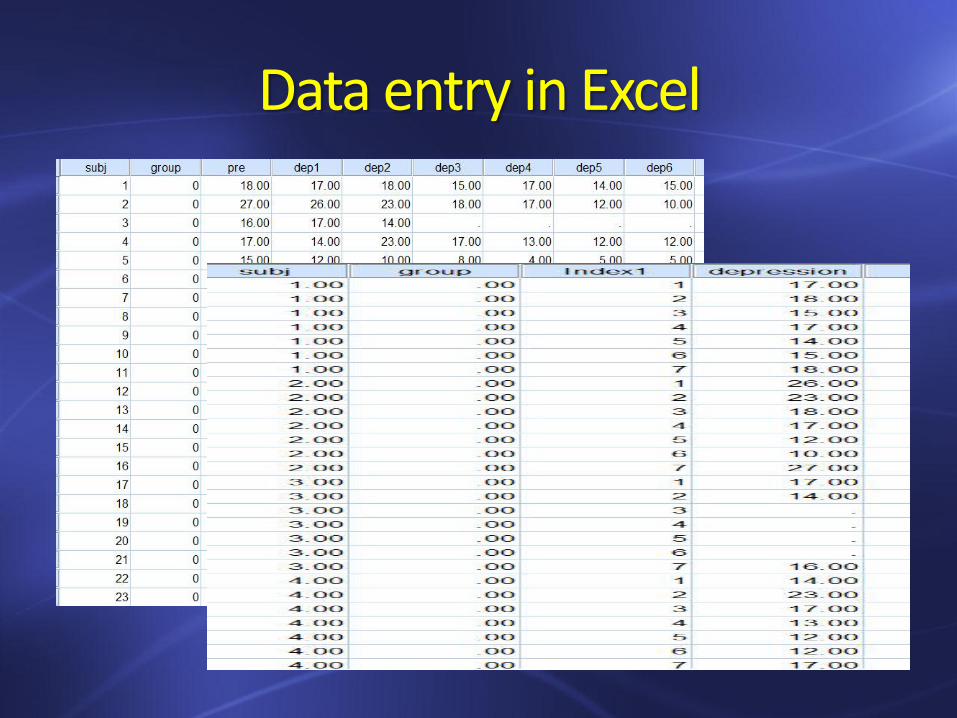
Data entry in Excel
Data entry in Excel
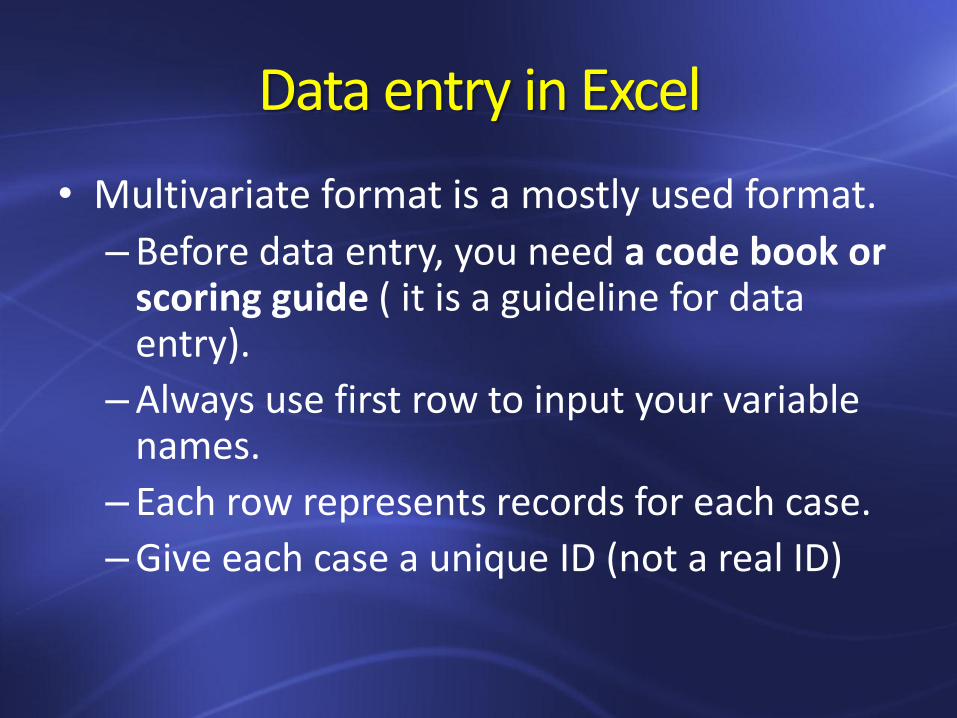
• Multivariate format is a mostly used format.
–Before data entry, you need a code book or scoring guide ( it is a guideline for data entry).
–Always use first row to input your variable names.
– Each row represents records for each case.
–Give each case a unique ID (not a real ID)
Data entry in Excel
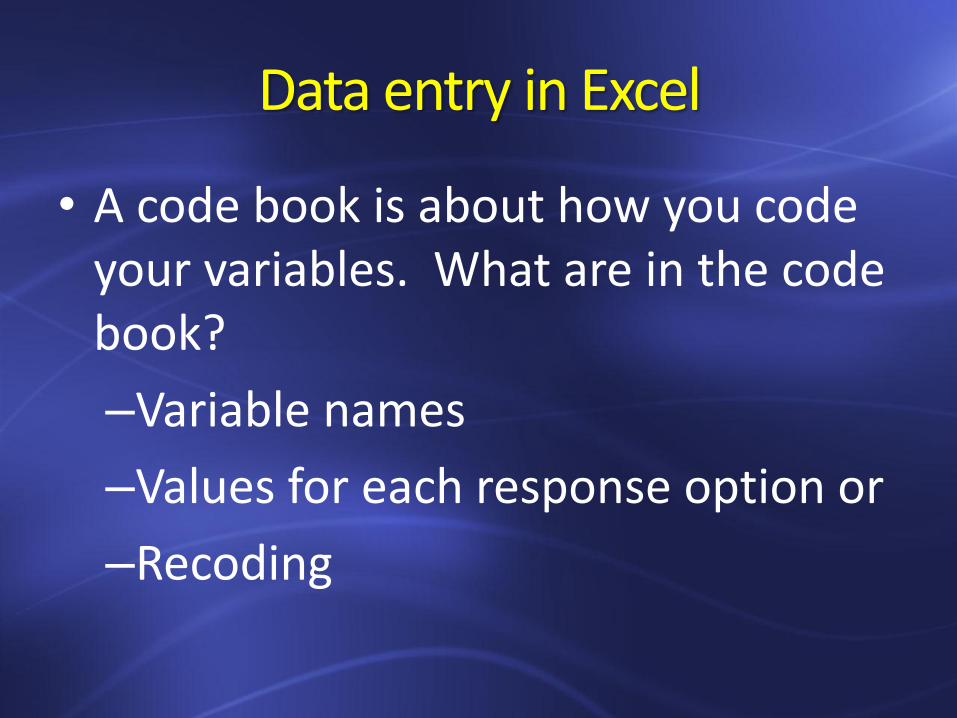
• A code book is about how you code your variables. What are in the code book?
–Variable names
–Values for each response option or
–Recoding
Data entry in Excel
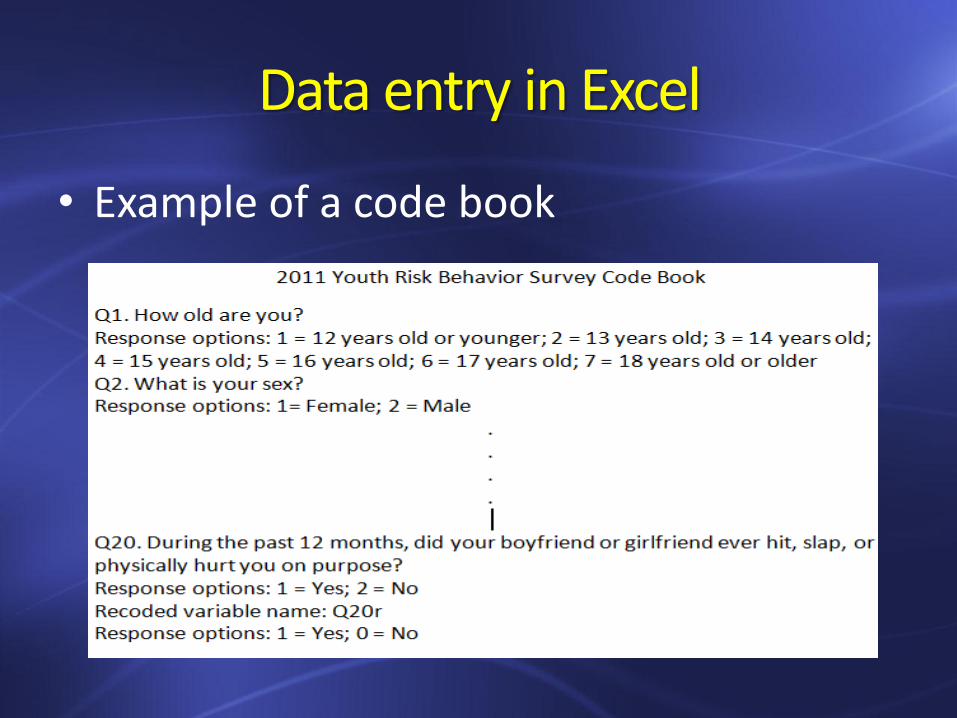
• Example of a code book
Data entry in Excel
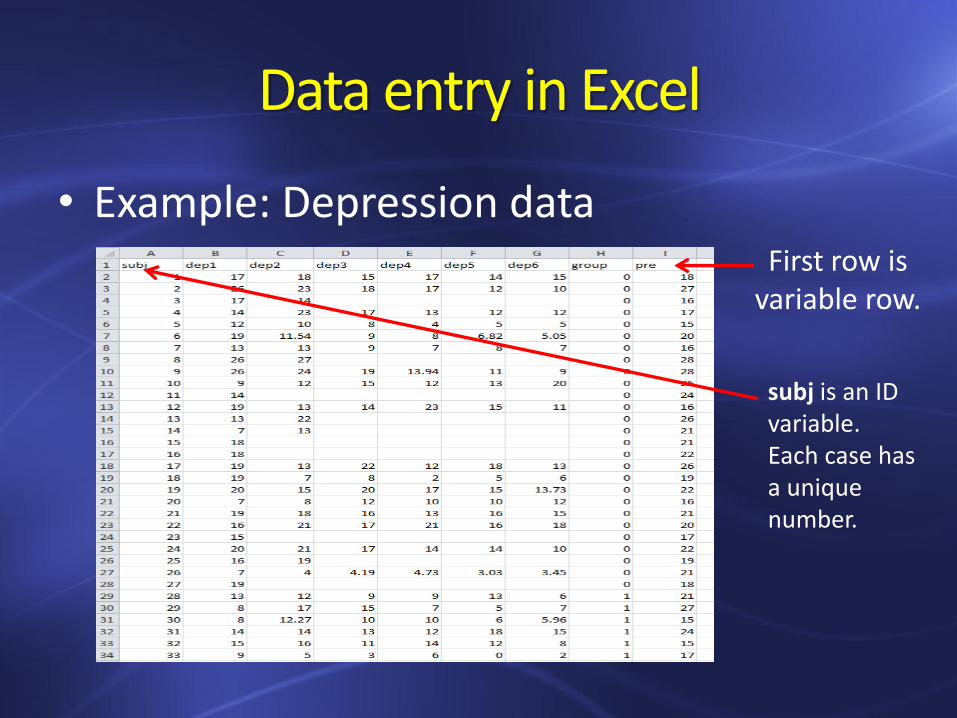
• Example: Depression data First row is
variable row.
subj is an ID variable. Each case has a unique number.
Data entry in Excel
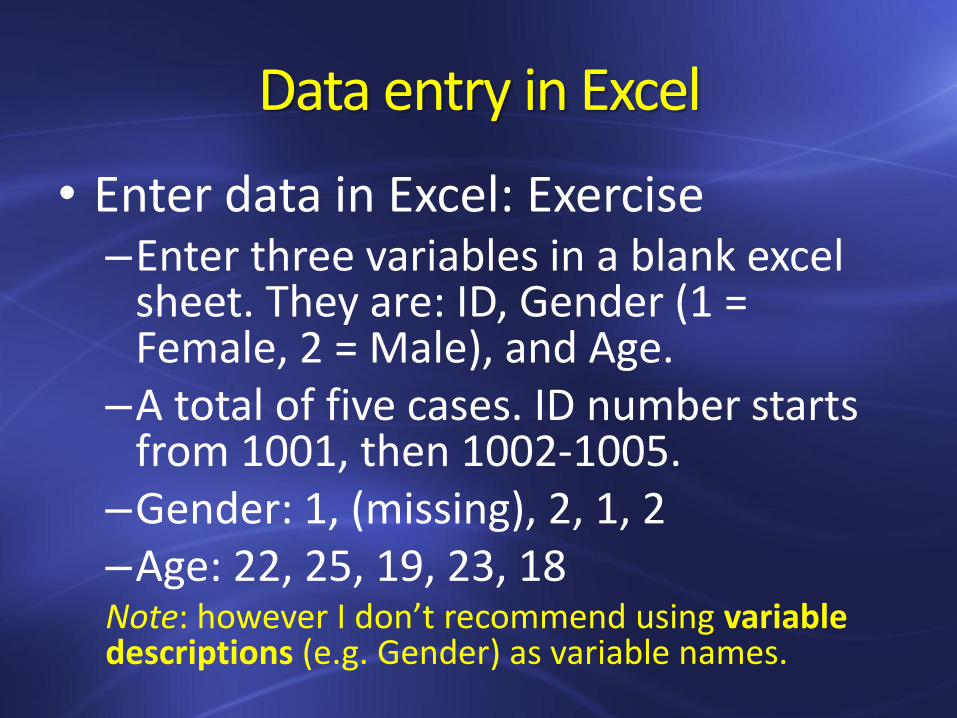
• Enter data in Excel: Exercise –Enter three variables in a blank excel
sheet. They are: ID, Gender (1 = Female, 2 = Male), and Age.
–A total of five cases. ID number starts from 1001, then 1002-1005.
–Gender: 1, (missing), 2, 1, 2 –Age: 22, 25, 19, 23, 18 Note: however I don’t recommend using variable descriptions (e.g. Gender) as variable names.
Data entry in Excel
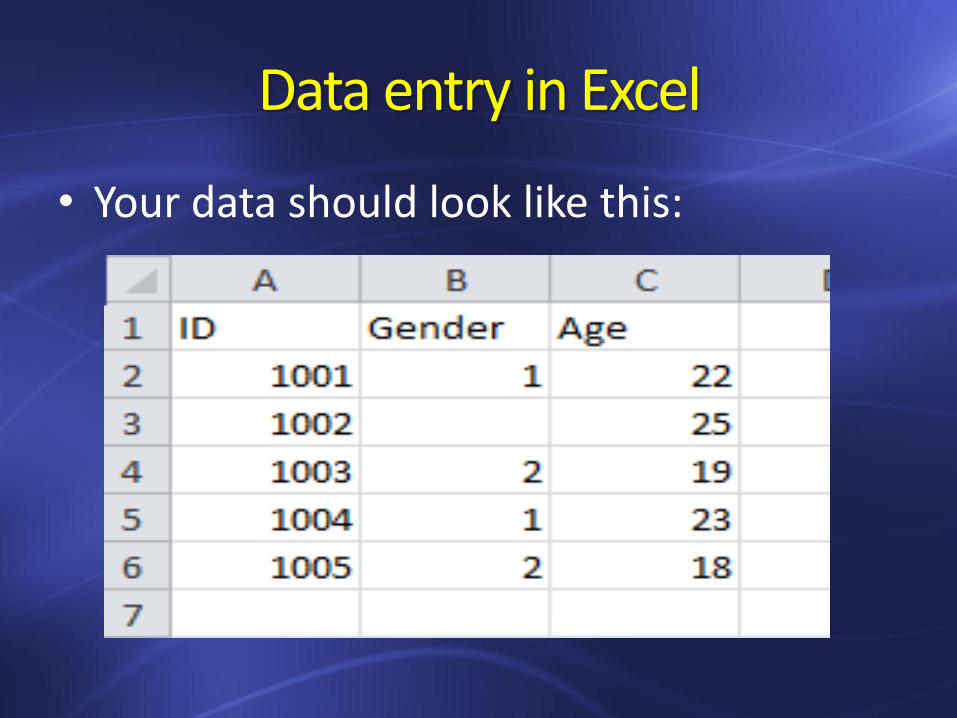
• Your data should look like this:
Data entry in Excel
• Freeze first row: View > Freeze Panes > Freeze Top Row
• Freeze first column: View > Freeze Panes > Freeze First Column
Data entry in Excel
• Freeze both first row and column: click the cell below and to the right of the rows and columns that you want to keep visible when you scroll.
• View > Freeze panes > Freeze panes
Data cleaning in Excel
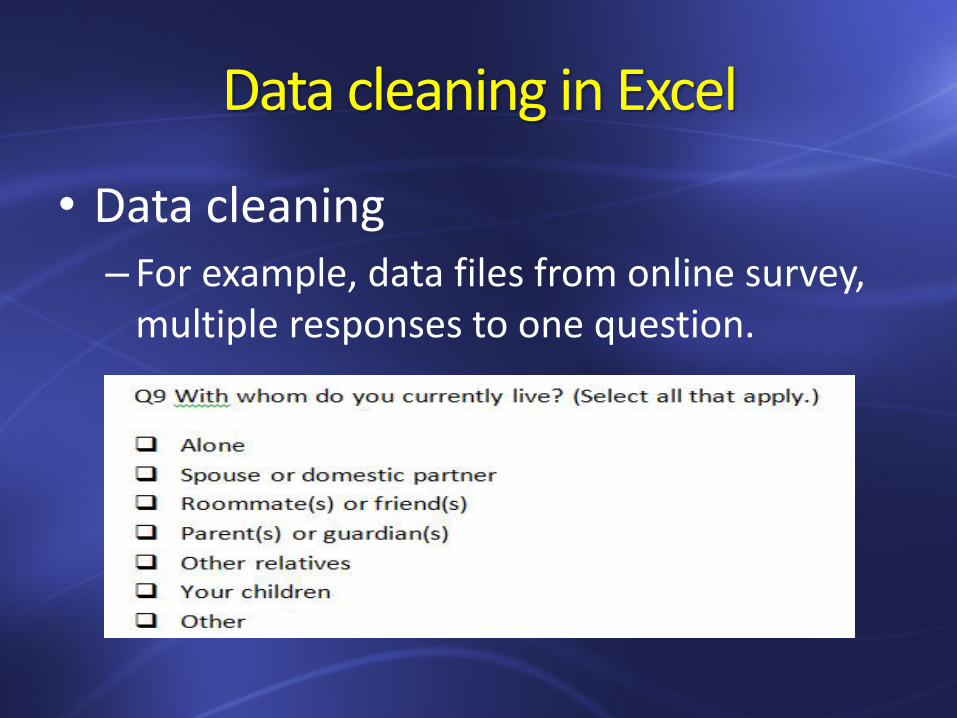
• Data cleaning – For example, data files from online survey,
multiple responses to one question.
Data entry in Excel
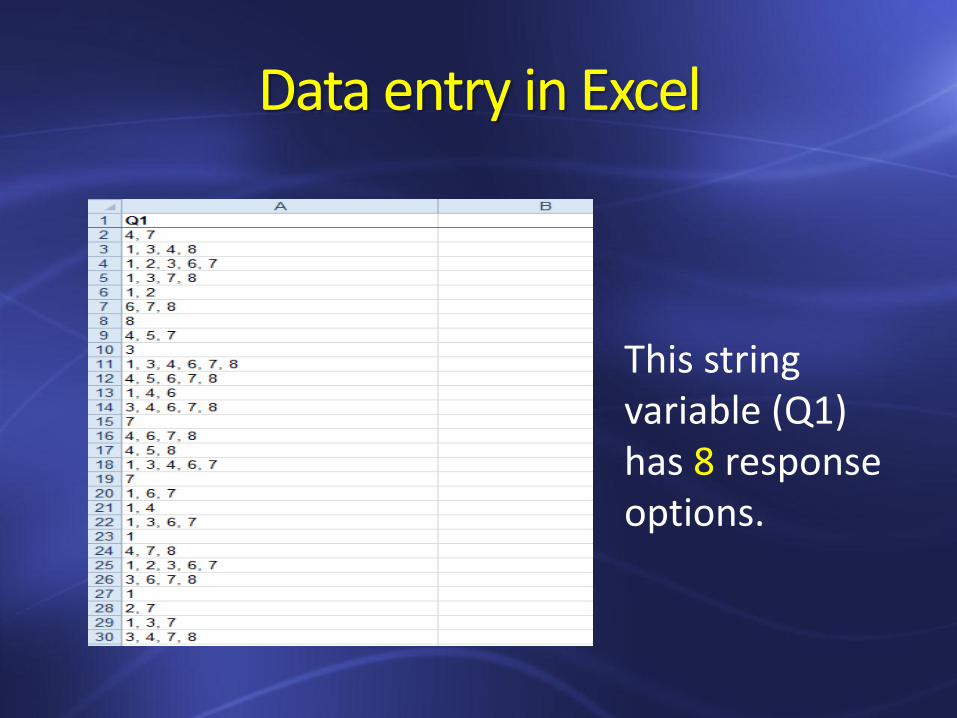
This string variable (Q1) has 8 response options.

Data cleaning in Excel
• First create 8 variables based on the number of response options.
Data cleaning in Excel
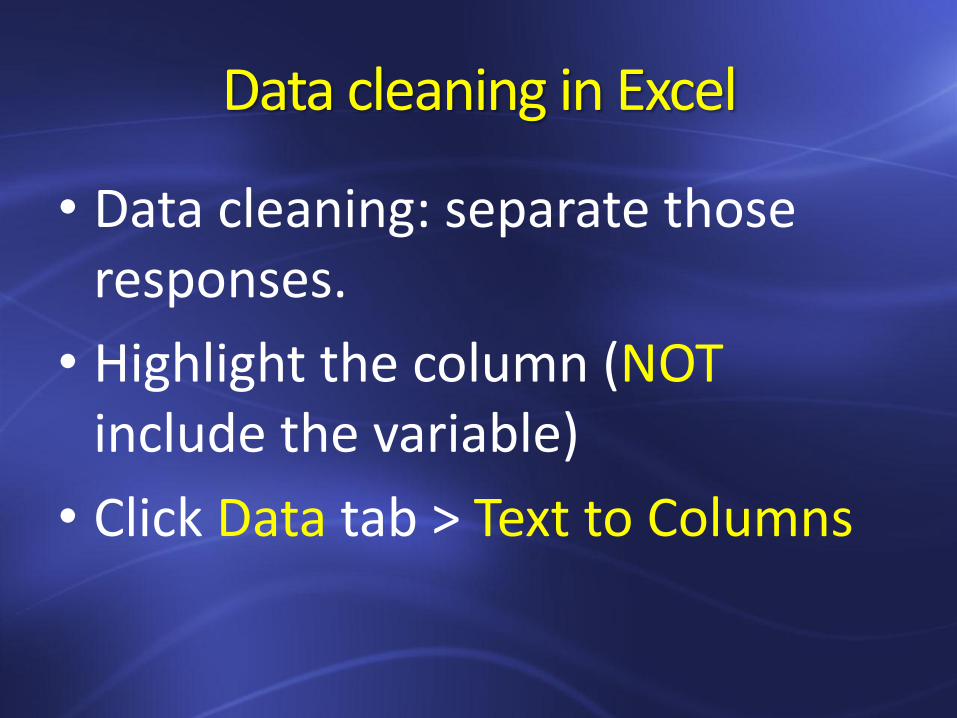
• Data cleaning: separate those responses.
• Highlight the column (NOT include the variable)
• Click Data tab > Text to Columns
Data cleaning in Excel
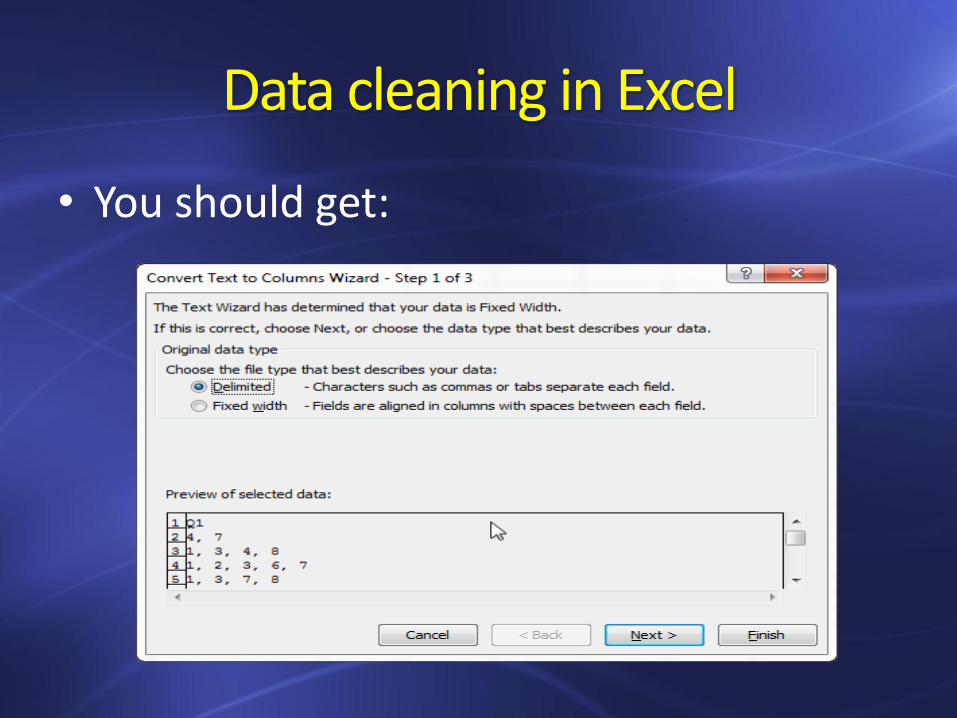
• You should get:
Data cleaning in Excel
• Fields in our data are separated by character: comma.
• So we need to choose Delimited.
Data cleaning in Excel
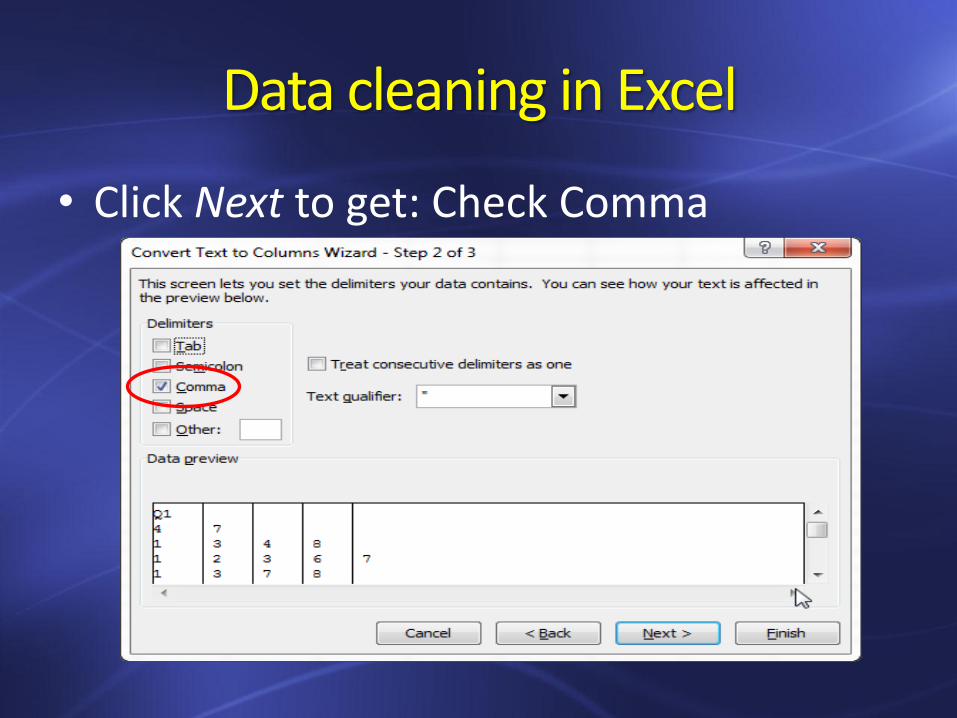
• Click Next to get: Check Comma
Data cleaning in Excel
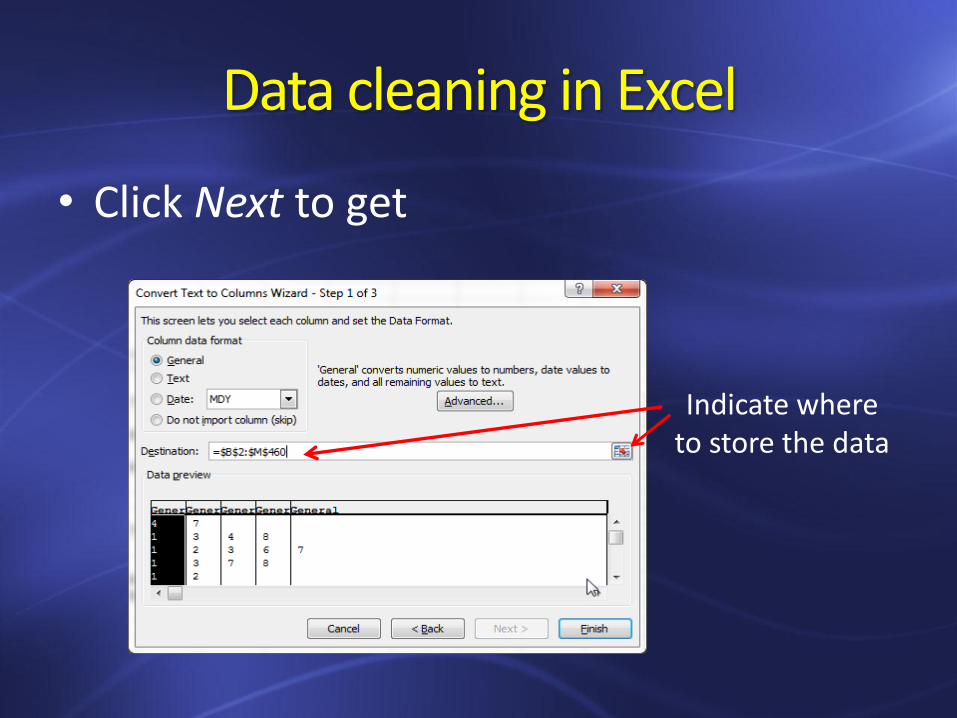
• Click Next to get
Indicate where to store the data
Data entry in Excel
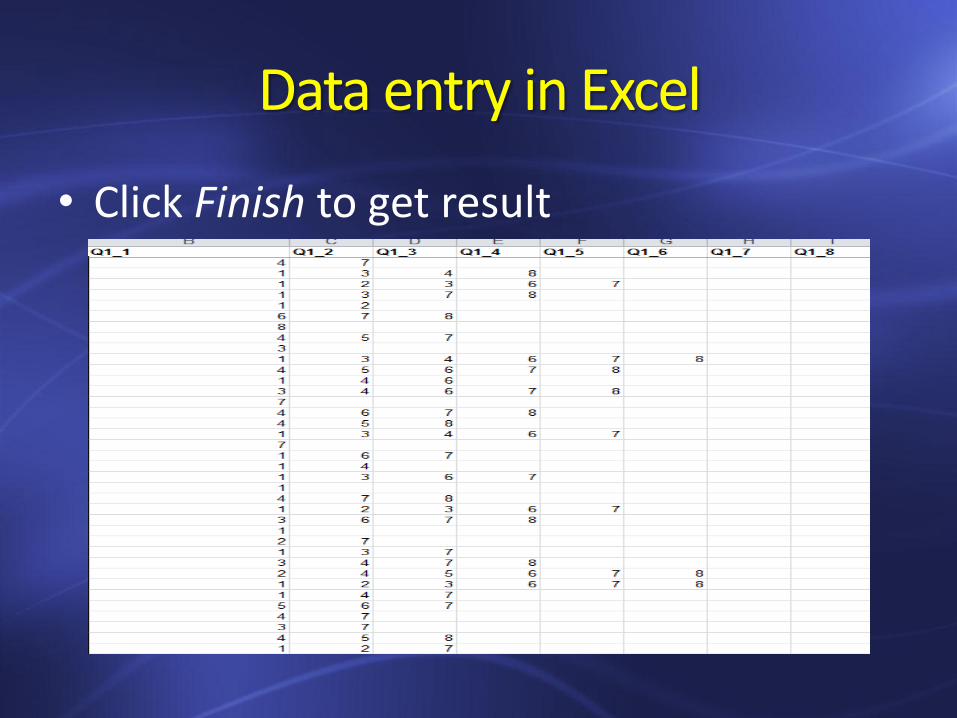
• Click Finish to get result
Data entry in Excel
• What is the problem with the separated data?
–We want all 1s under Q1_1, 2s under Q2_2, 3s under Q3_3…, so we still need to move those values to corresponding variables, how?
Data entry in Excel
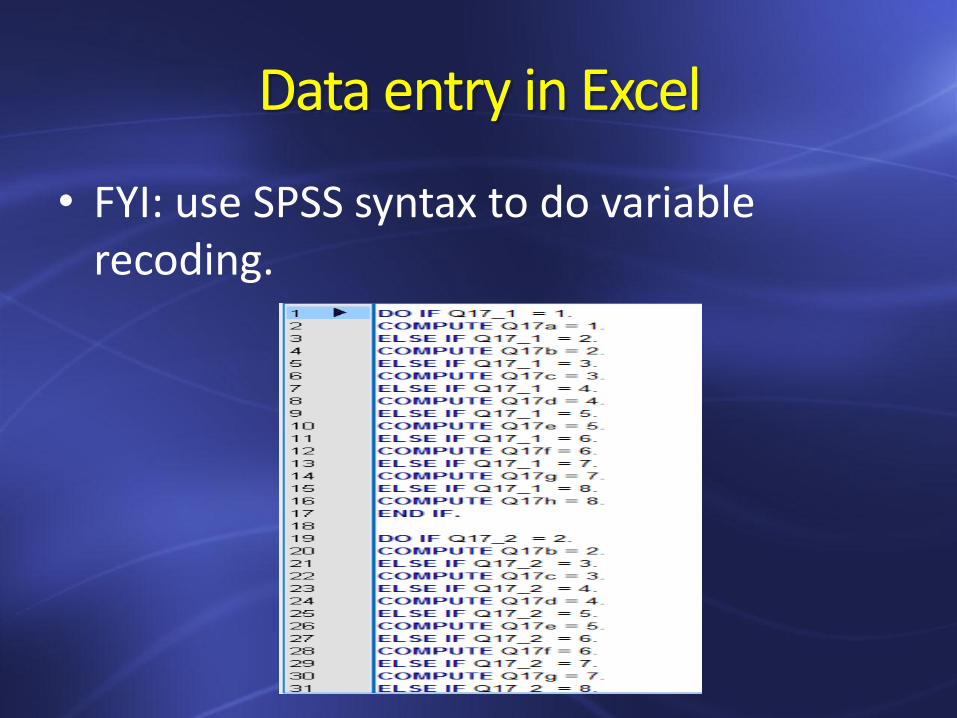
• FYI: use SPSS syntax to do variable recoding.
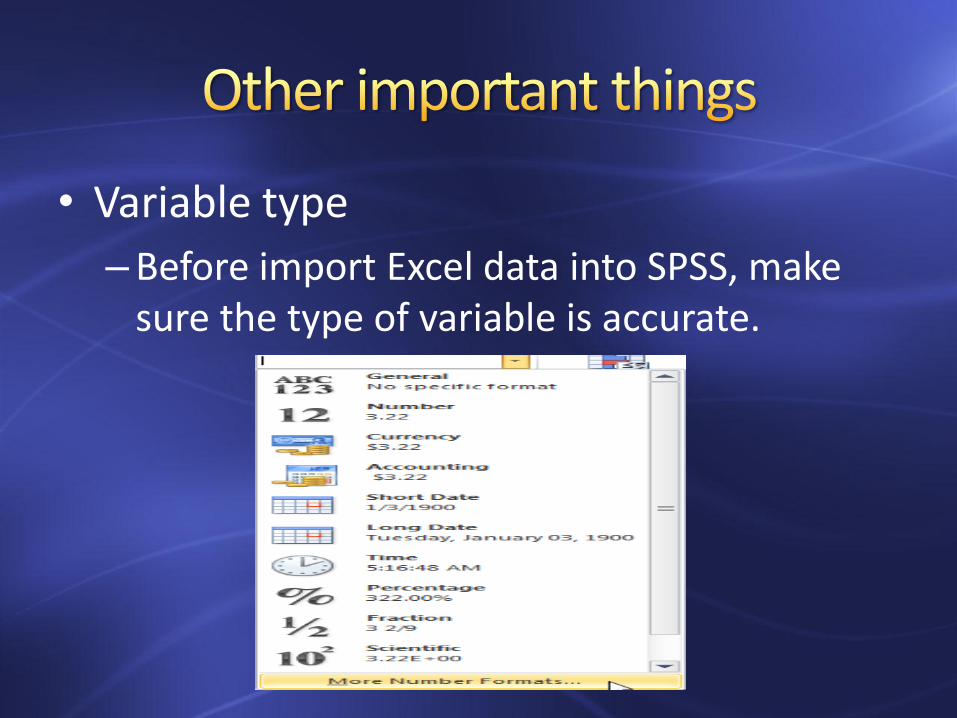
• Variable type
–Before import Excel data into SPSS, make sure the type of variable is accurate.
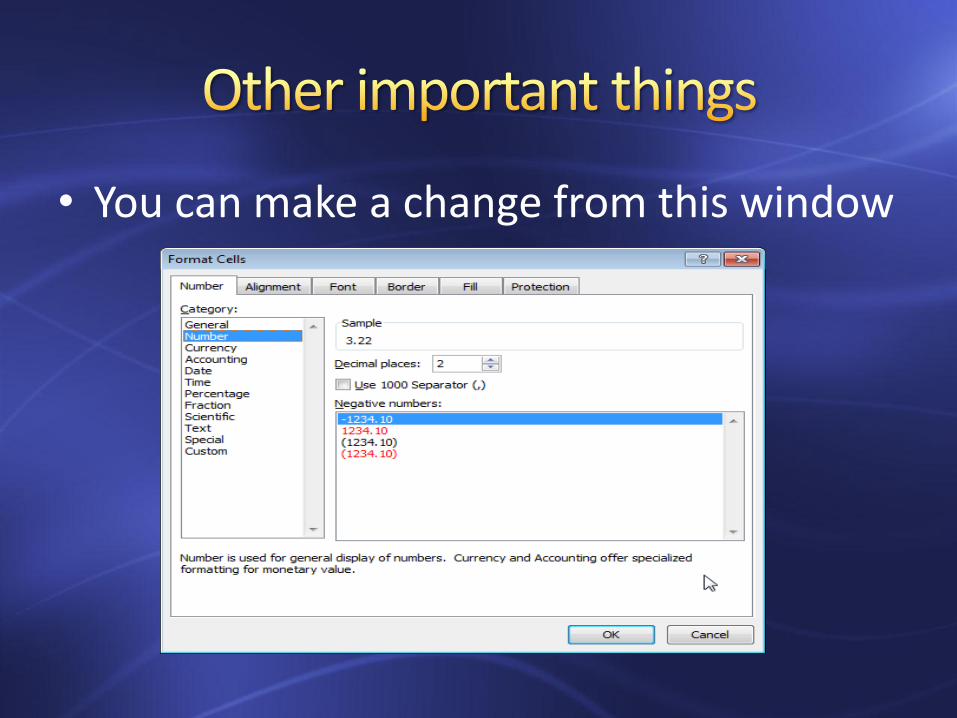
• You can make a change from this window

• Why is variable type important
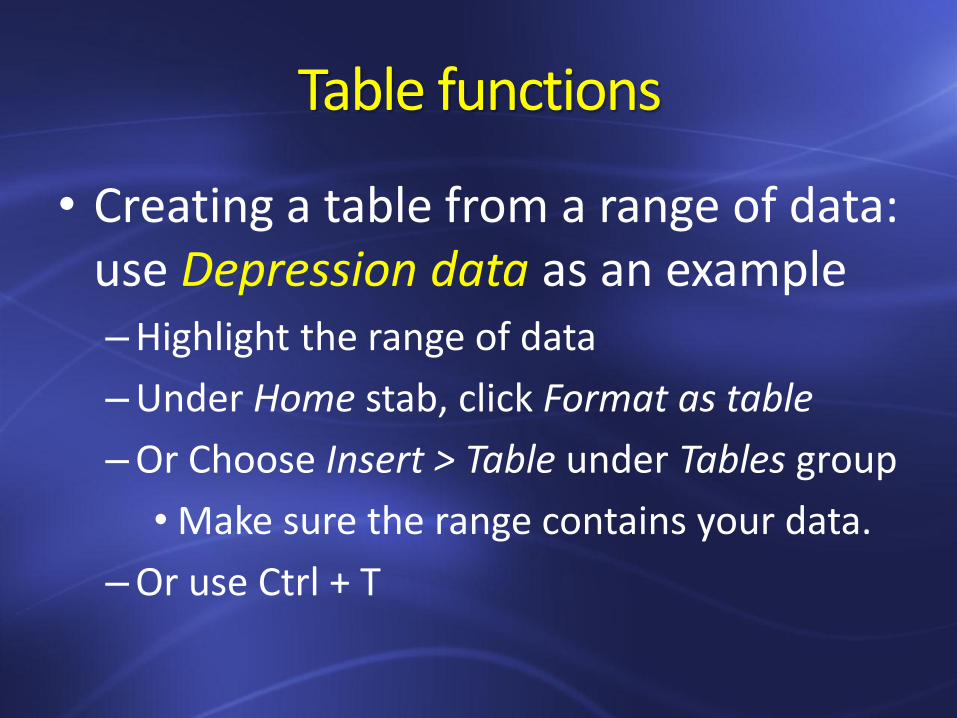
Table functions
• Creating a table from a range of data: use Depression data as an example –Highlight the range of data
–Under Home stab, click Format as table
–Or Choose Insert > Table under Tables group
• Make sure the range contains your data.
–Or use Ctrl + T
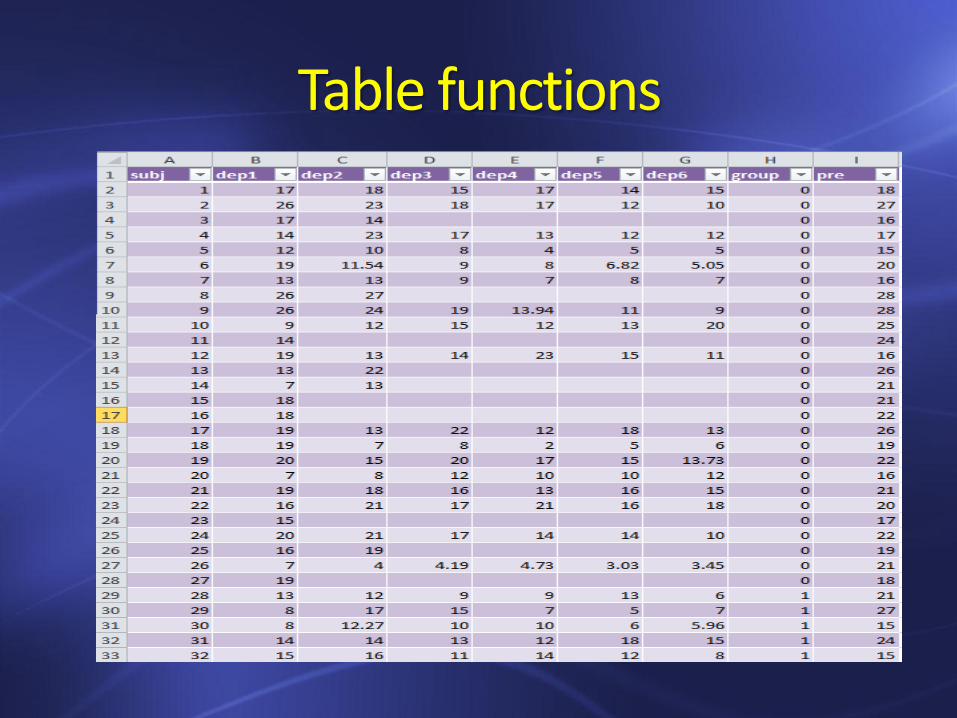
Table functions
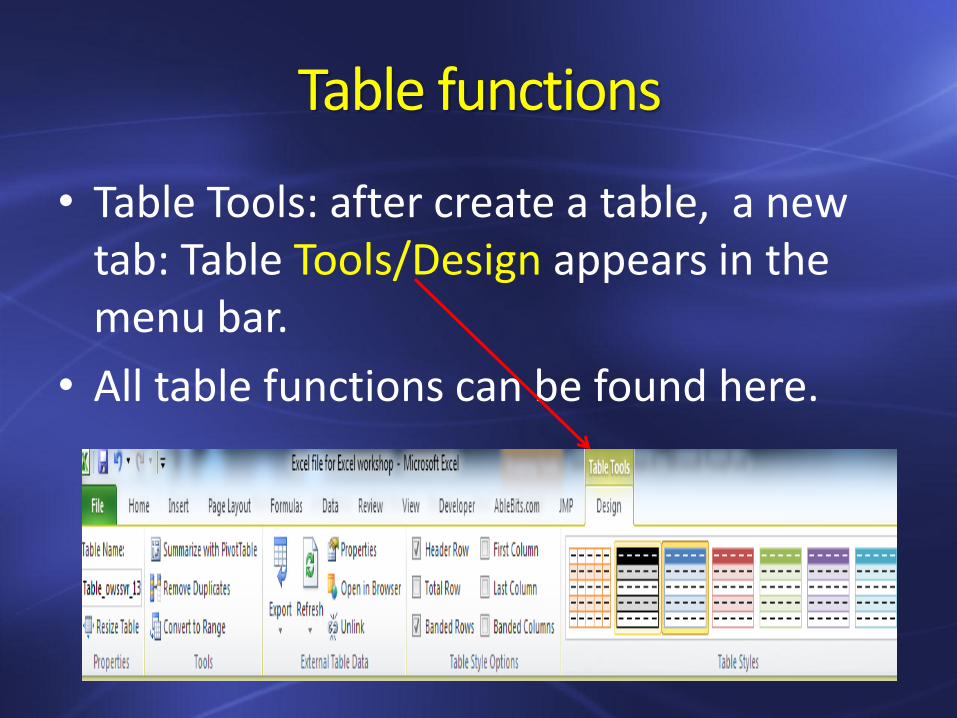
Table functions
• Table Tools: after create a table, a new tab: Table Tools/Design appears in the menu bar.
• All table functions can be found here.
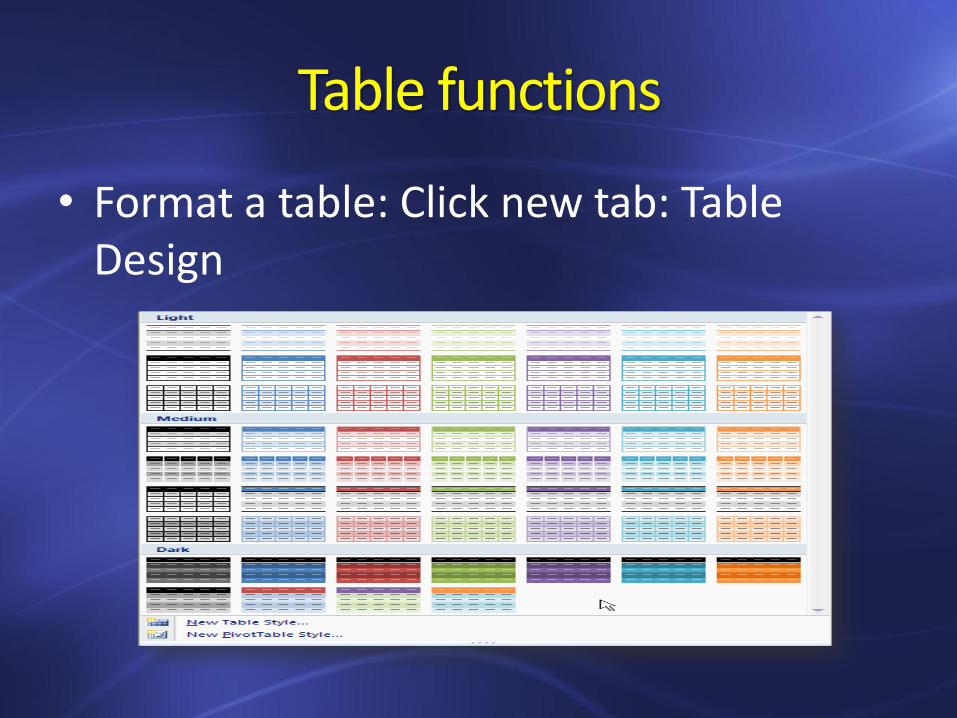
Table functions
• Format a table: Click new tab: Table Design
Table functions
• Tables allow us easily to get summary (descriptive) statistics: Average, Maximum, Minimum, Sum, Standard Deviation, variance, and more functions.
–Fist we need to add a Total Row for the table.
–Add a Total Row: under Design, check the box for Total Row.
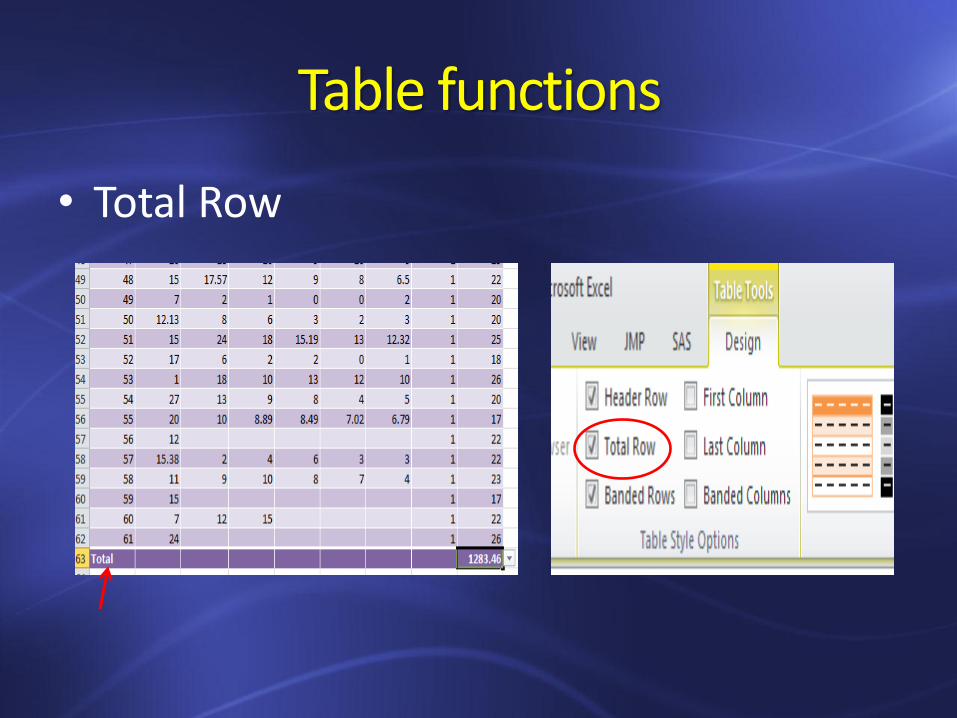
Table functions
• Total Row
Table functions
• Exercise: use Table Row to do some calculations
–Exercise 1: What is the sample size?
–Exercise 2: What is average score of variable pre?
–Exercise 3: What is standard deviation of variable dep1?
Table functions
• Answer key to the Exercise
–Sample size is 61 (use Count function)
–Average score of pre is 21.04 (use Average function)
–Standard deviation of dep1 is 5.61 (use StdDev function)
Table functions
• Use filters: first row is the header for each column.
• Exercise 1: we want to know the summary statistics among group = 1, such as sample size, average score and SD of pre, etc.
–We want to exclude group = 0 from the analysis.
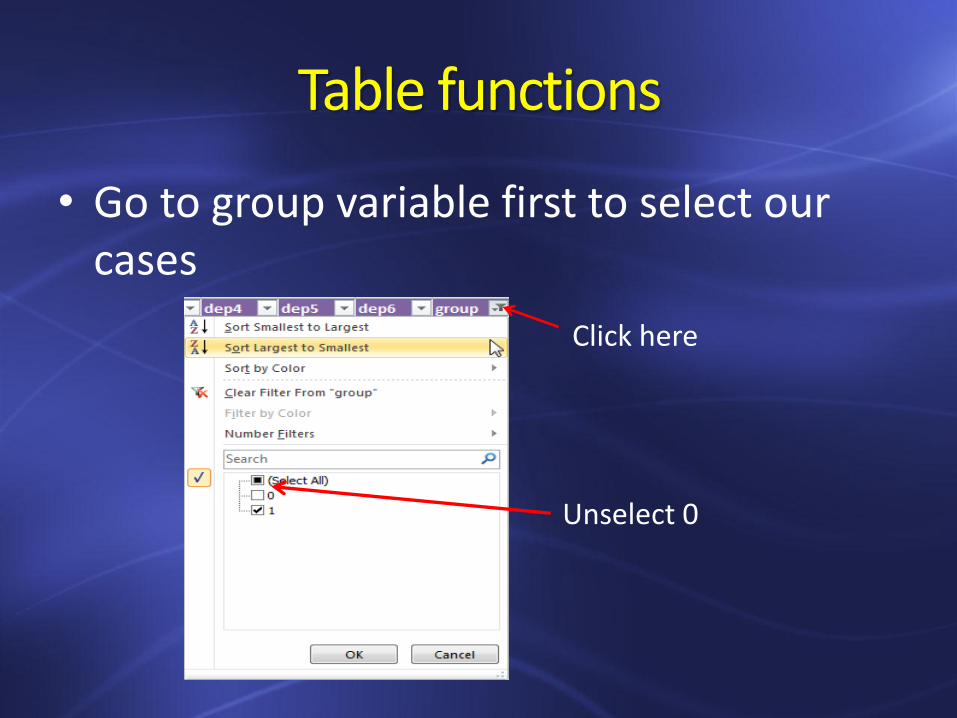
Table functions
• Go to group variable first to select our cases
Click here
Unselect 0
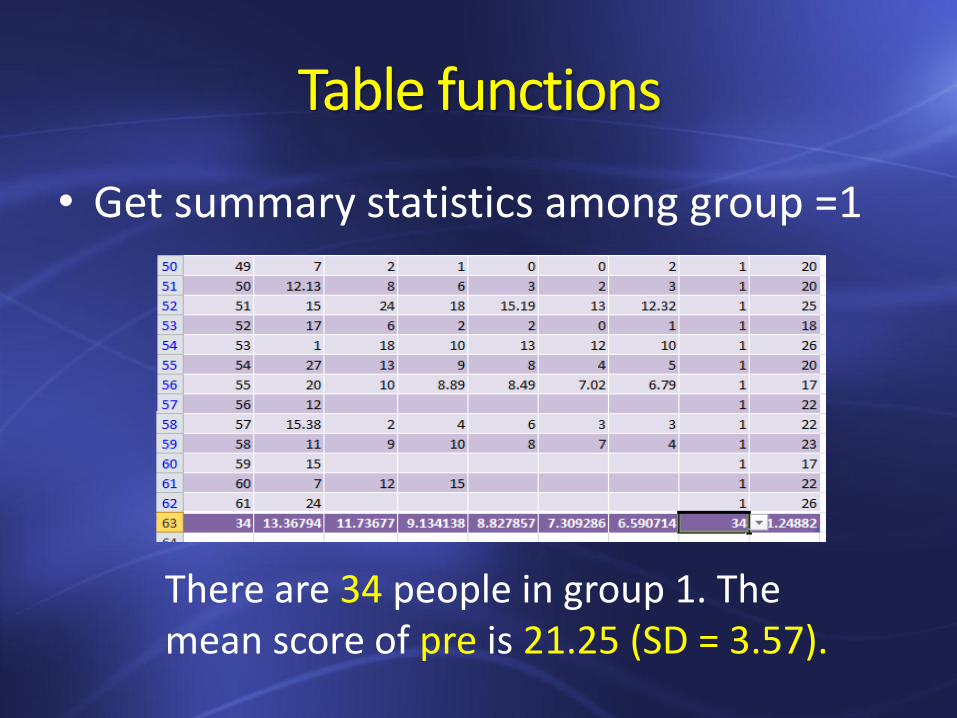
Table functions
• Get summary statistics among group =1
There are 34 people in group 1. The mean score of pre is 21.25 (SD = 3.57).
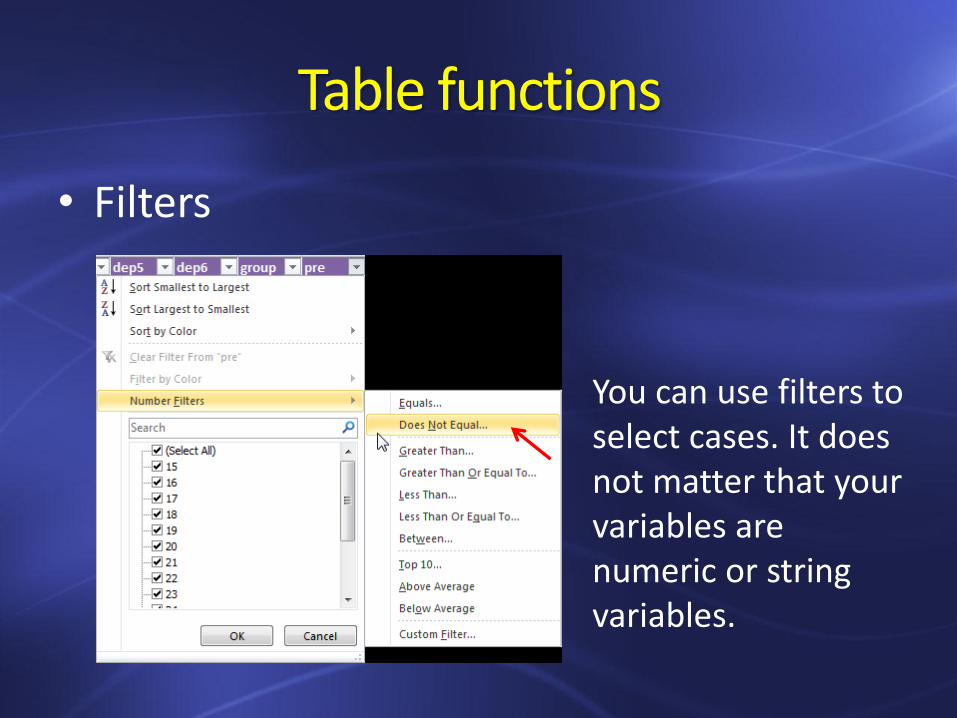
Table functions
• Filters
You can use filters to select cases. It does not matter that your variables are numeric or string variables.
Table functions
• Make a copy of original data set
–We don’t want to mess up with the original data set when try to make some changes of our data.
–We use OFE data as an example
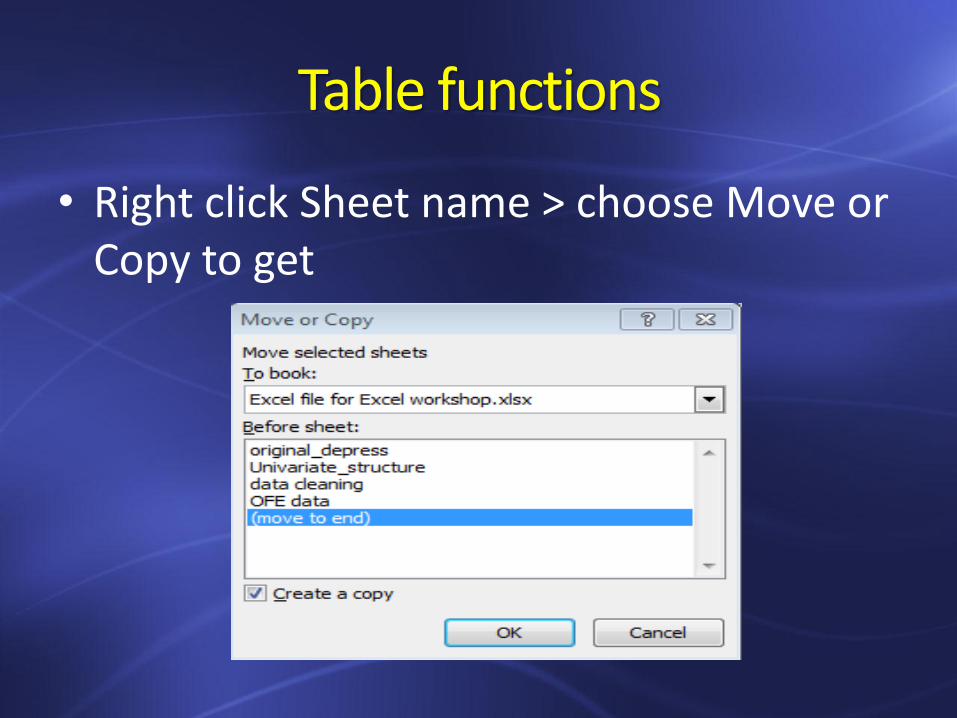
Table functions
• Right click Sheet name > choose Move or Copy to get
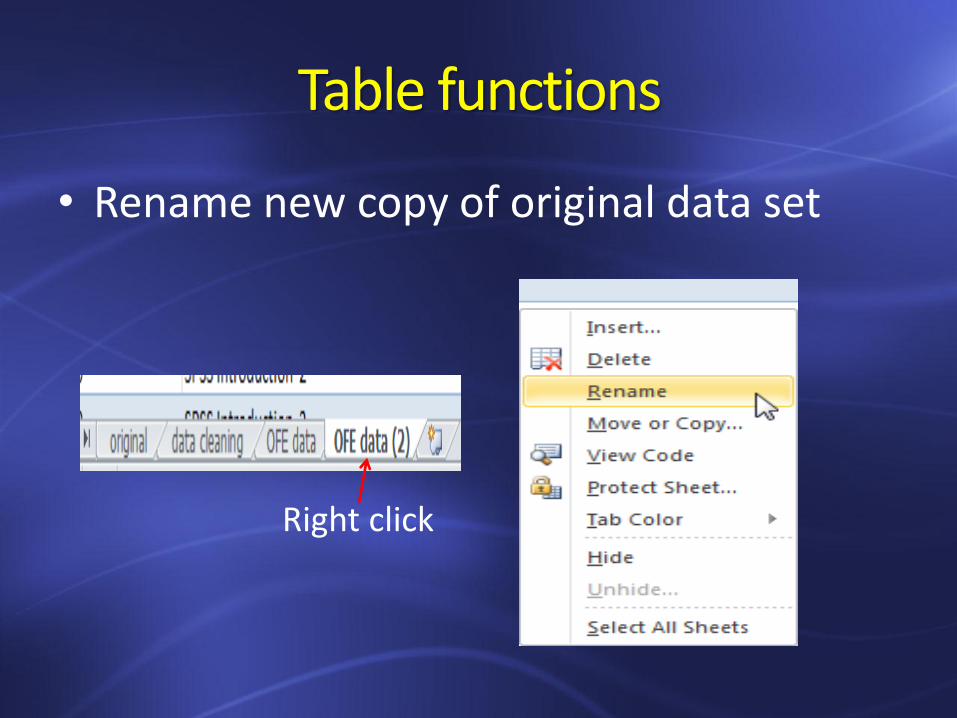
Table functions
• Rename new copy of original data set
Right click
Table functions
• Remove duplicates
–Exercise: we want to know how many workshops we provided during the reporting period.
–We use ID variable to calculate number of workshops offered.
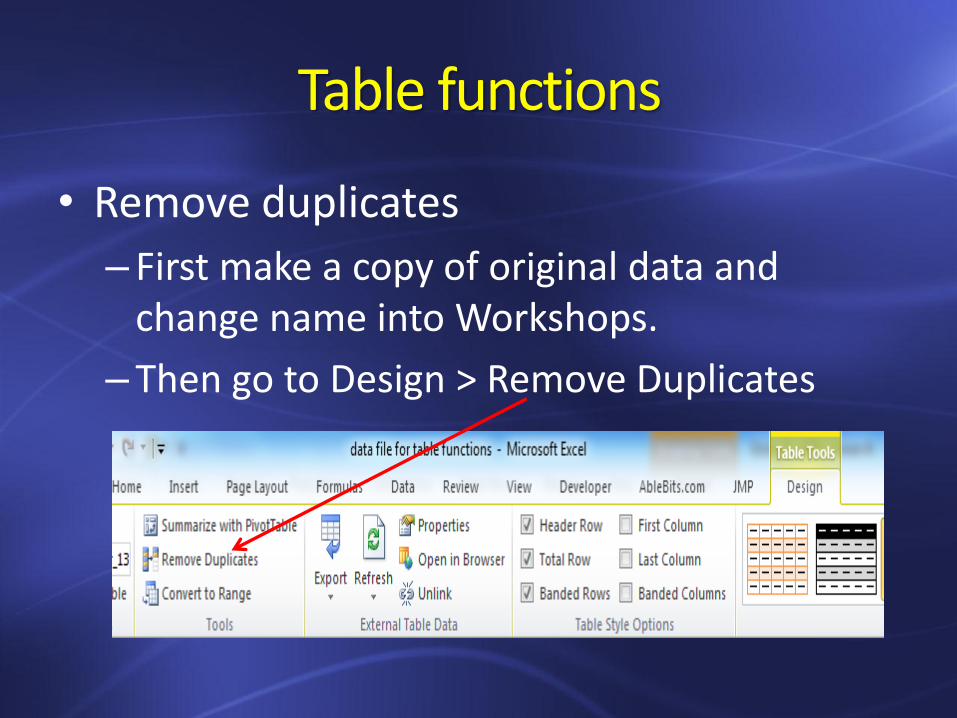
Table functions
• Remove duplicates
– First make a copy of original data and change name into Workshops.
– Then go to Design > Remove Duplicates
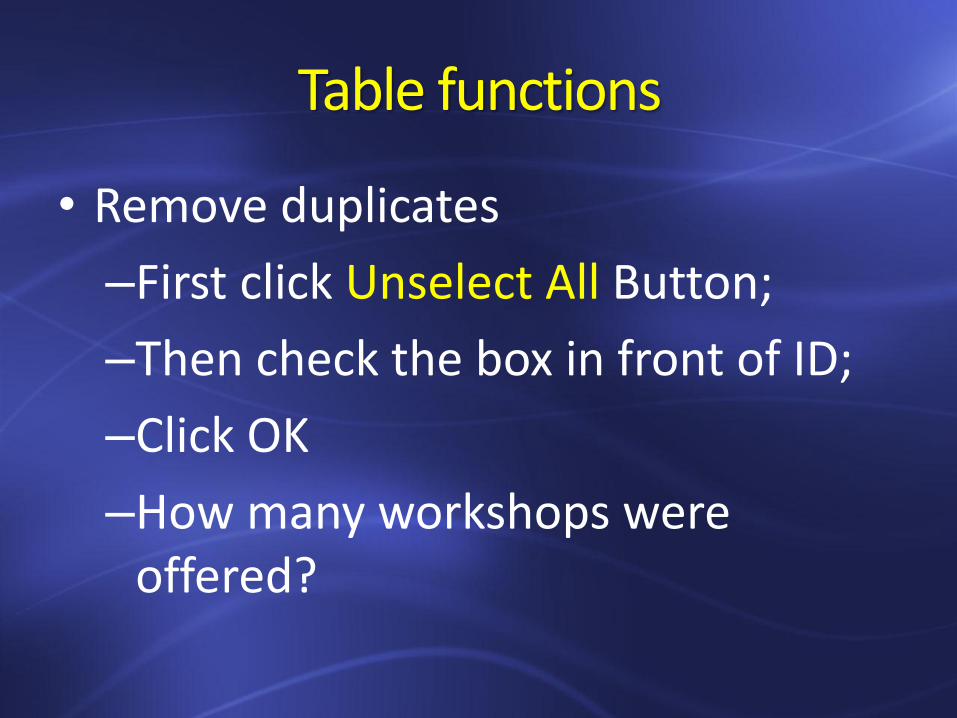
Table functions
• Remove duplicates
–First click Unselect All Button;
–Then check the box in front of ID;
–Click OK
–How many workshops were offered?
Delete tables
• Delete a table without losing the data or table formatting – Click anywhere in the table.
– On the Design tab, in the Tools group, click Convert to Range, and then click Yes.
– Table features are no longer available after you convert the table back to a range. For example, the row headers no longer include the sort and filter arrows.
Clear formats
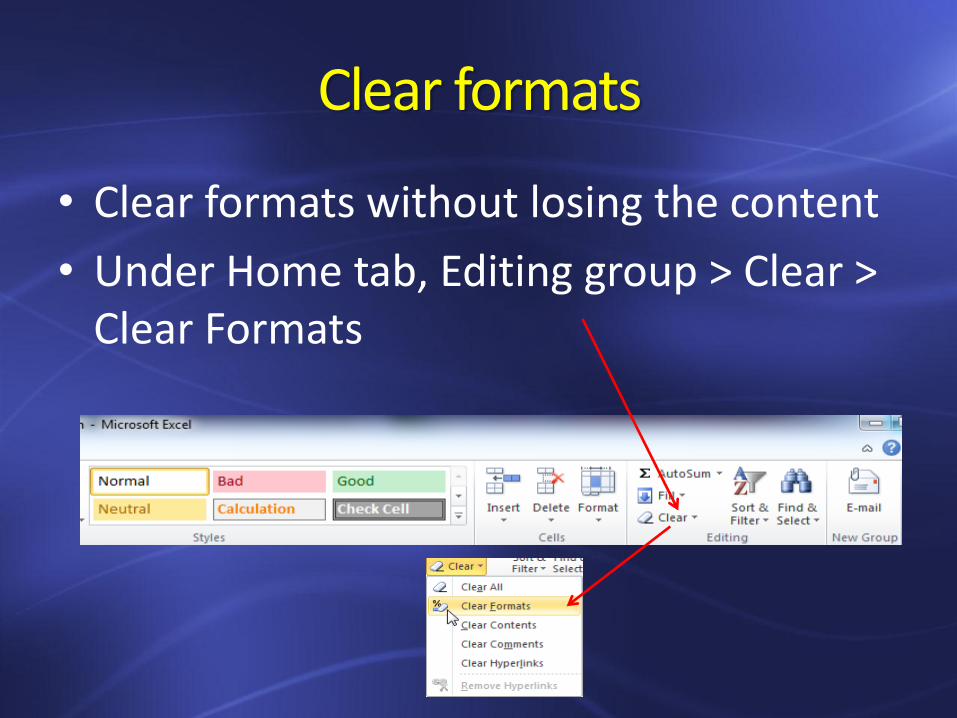
• Clear formats without losing the content
• Under Home tab, Editing group > Clear > Clear Formats
Pivot tables and charts
• The Pivot tables are used to summarize, analyze, explore and present your data.
• A Pivot table is a way to extract data from a long list of information and present it in a more meaningful format.
Pivot tables and charts
• Use sample data from OFE
• Sheet name: OFE data
• Creating a pivot table
–Insert > Pivot table under Tables group
–Or change your data into a table first, then click Summarize with Pivot Table
Pivot tables and charts
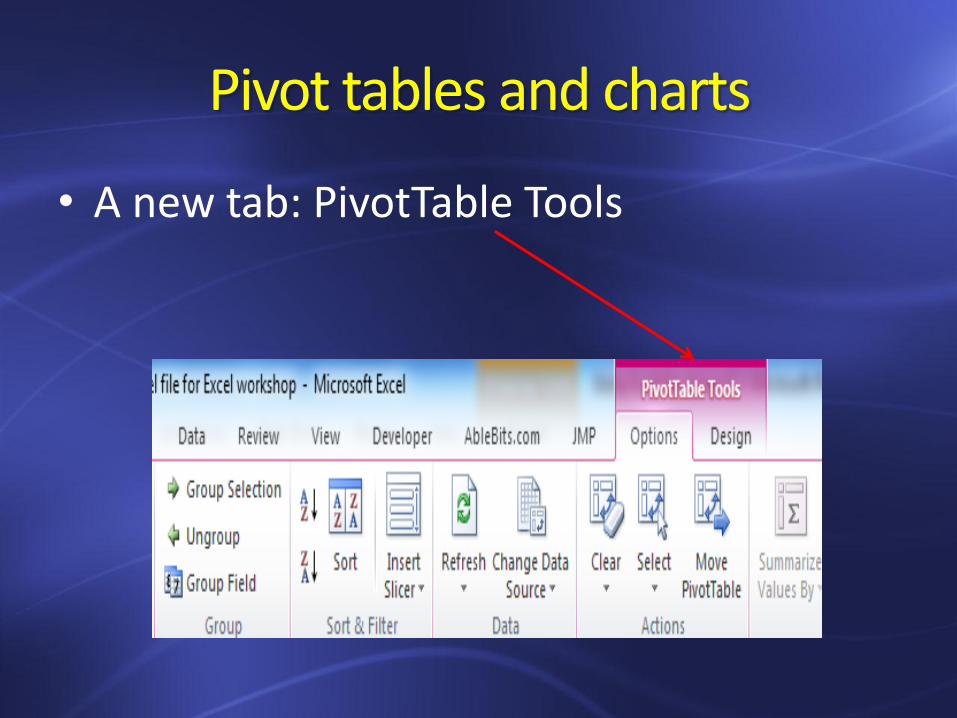
• A new tab: PivotTable Tools
Pivot tables and charts
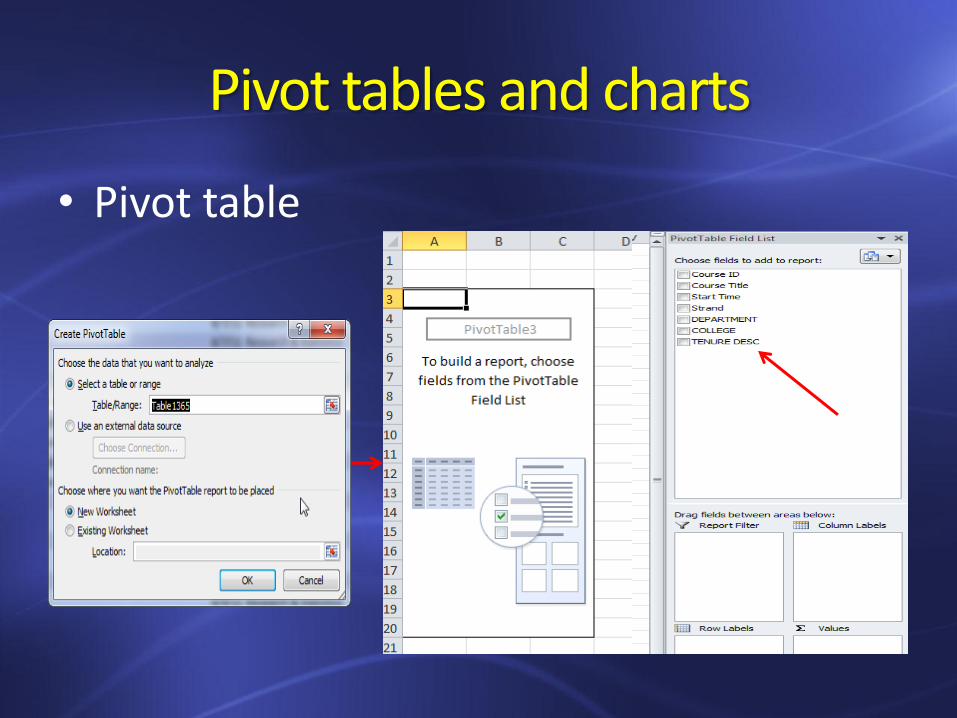
• Pivot table
Pivot tables and charts
• What kind pivot table you need depends on what kind questions you want to answer.
• Example1 –We want to know how many people (with
duplicates) participated in our workshops.
–One variable (Course ID or Course title) is enough for this task.
Pivot tables and charts
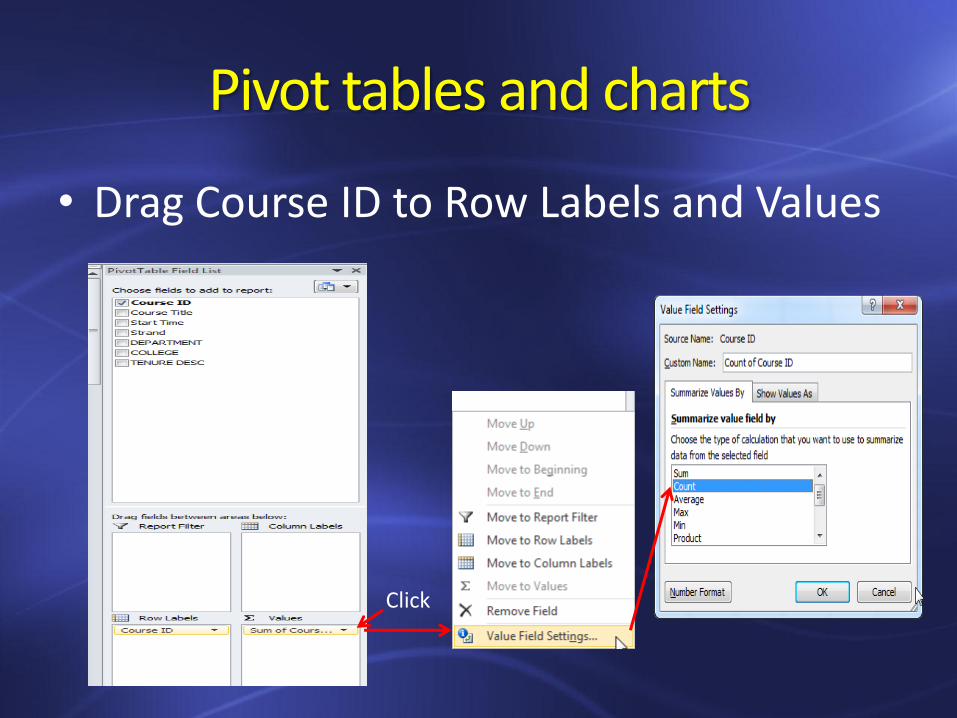
• Drag Course ID to Row Labels and Values
Click
Pivot tables and charts
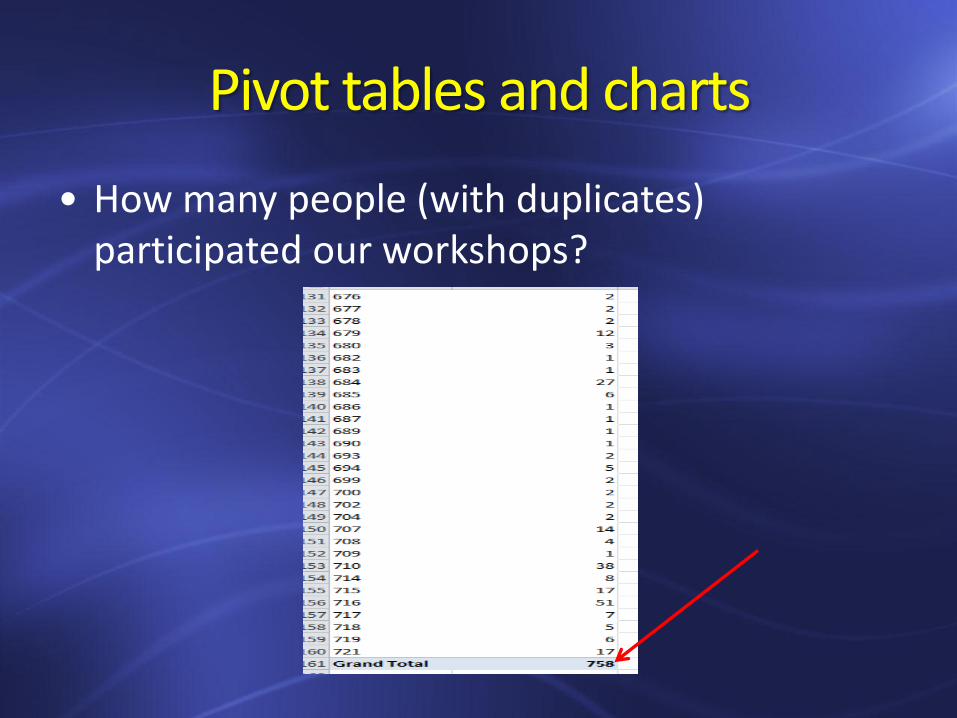
• How many people (with duplicates) participated our workshops?
Pivot tables and charts
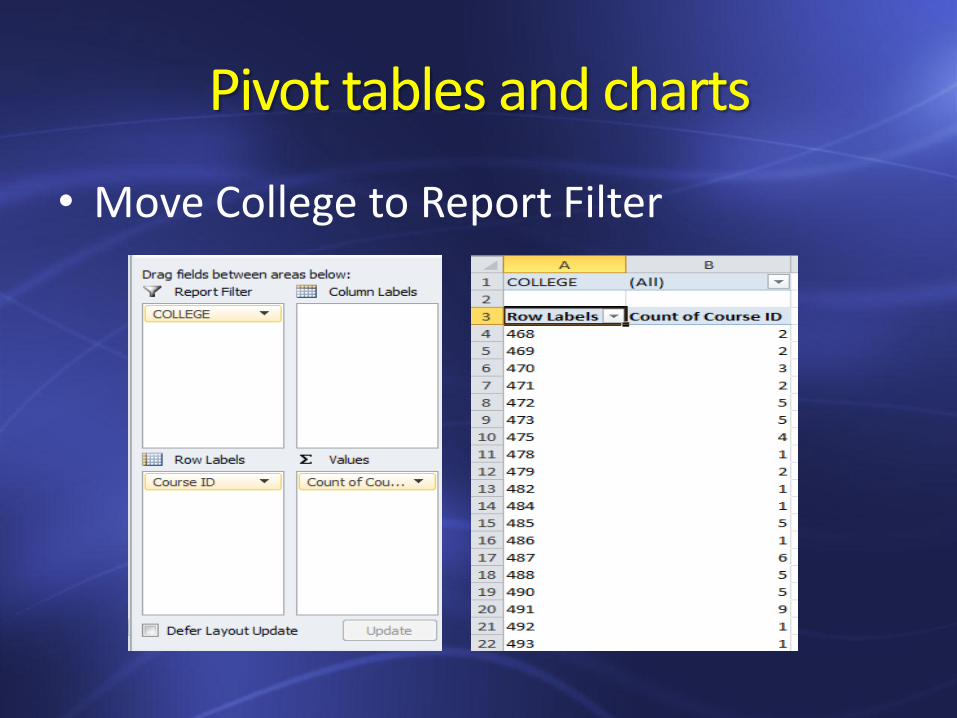
• Example 2: how many people (with duplicates) participated our workshops from College of Education?
–We have a filter variable or field: COLLEGE.
–Drag COLLEGE to Report Filter
Pivot tables and charts
• Move College to Report Filter
Pivot tables and charts
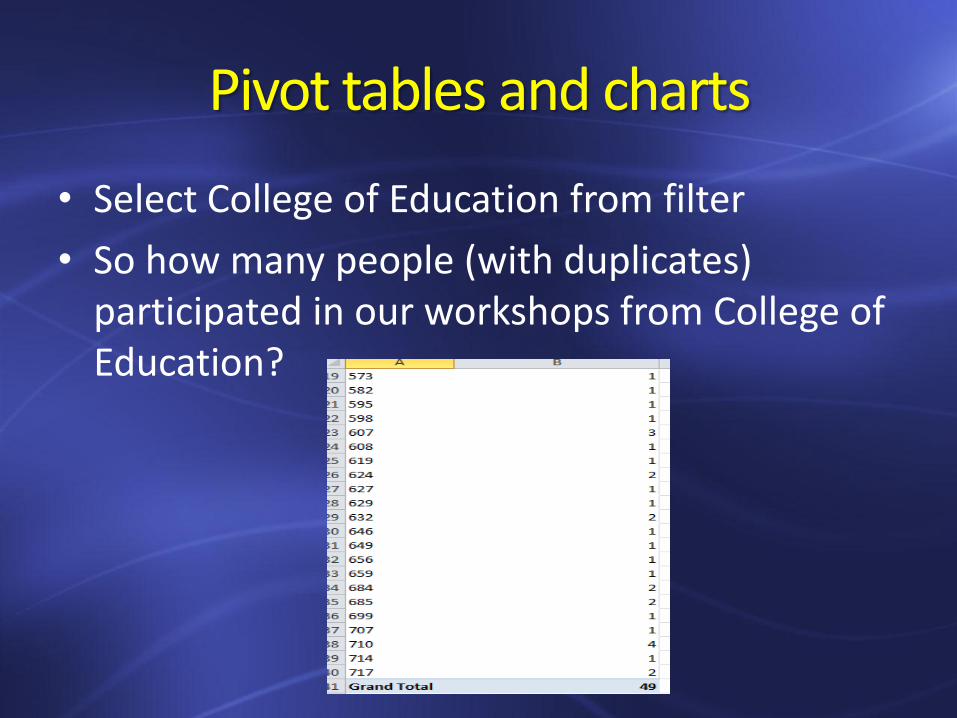
• Select College of Education from filter
• So how many people (with duplicates) participated in our workshops from College of Education?

Pivot tables and charts
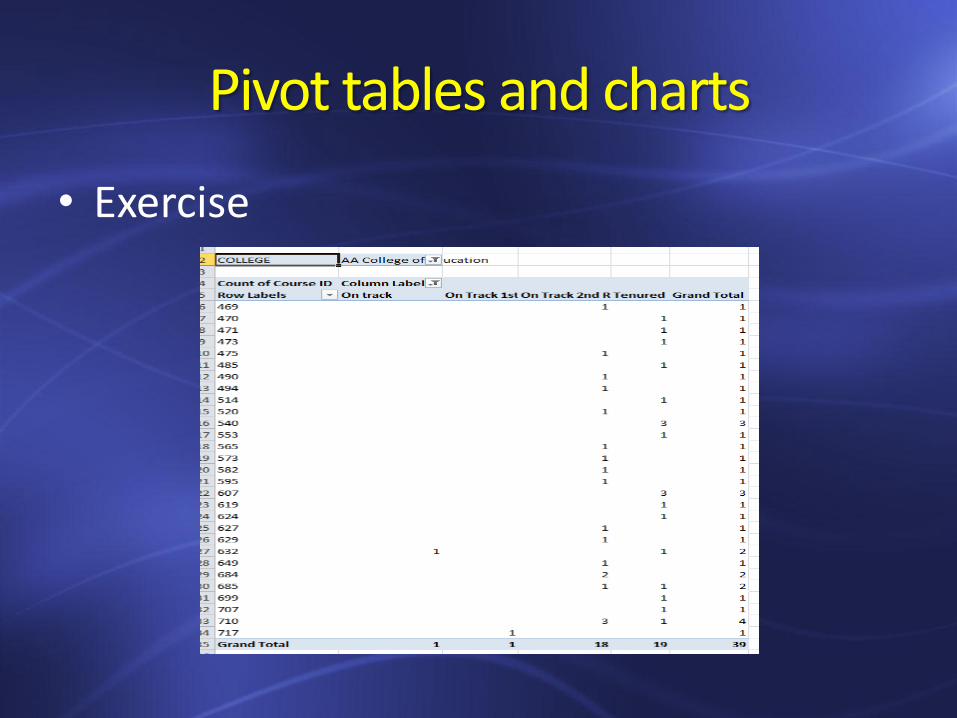
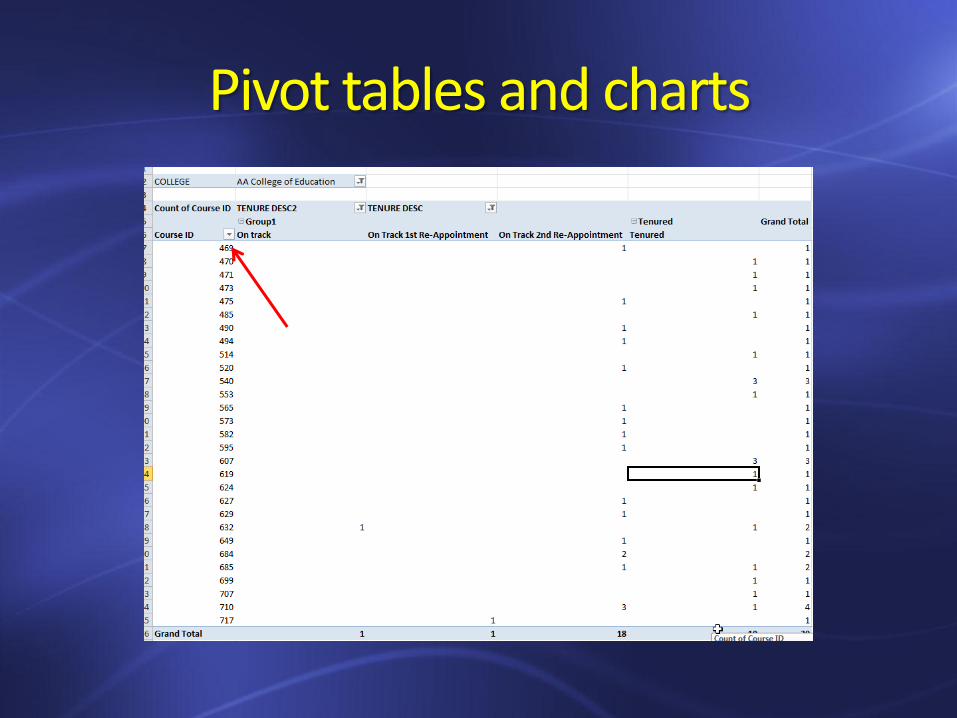
• Exercise: how many people (with duplicates) participated in our workshops from College of Education by faculty status (tenured or tenure track).
Pivot tables and charts
• Exercise
Pivot tables and charts
• we only want to show two columns: tenured and tenure track: group all tenure track categories into one group.
–Highlight all tenure track columns
–Click Group Selections under Options tab or Right click and select Group.
Pivot tables and charts
Pivot tables and charts
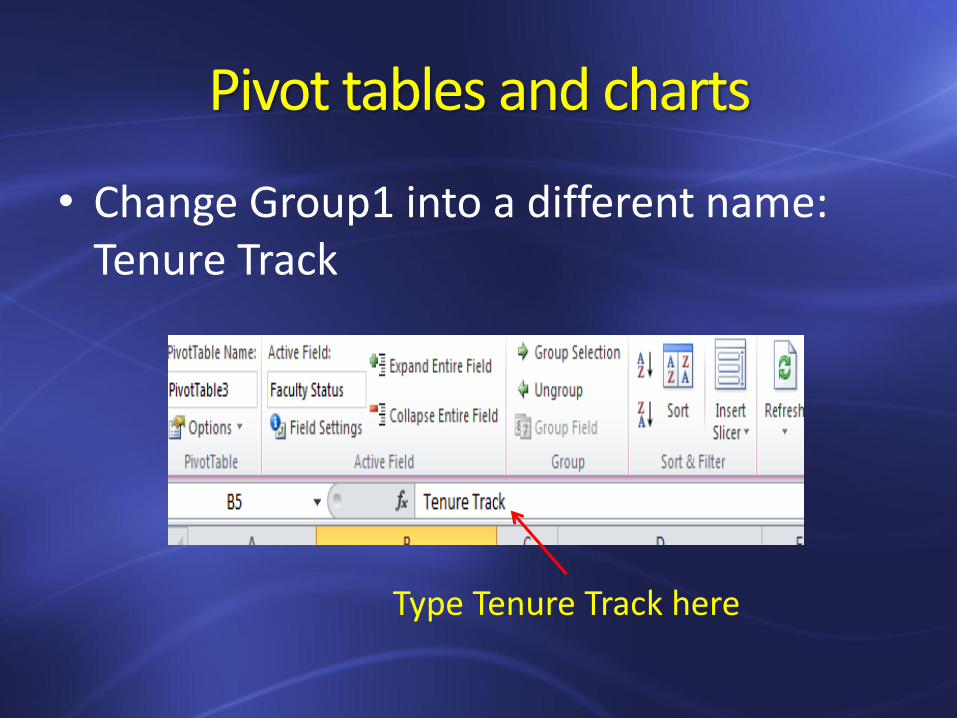
• Change Group1 into a different name: Tenure Track
Type Tenure Track here
Pivot tables and charts
• Example 3: Group fields –We want to see how many workshops were
offered by quarter and year.
– First we need a new field to group Start Time field into quarters (click anywhere inside column).
–Under PivotTable tools > Options > Group Field
Pivot tables and charts
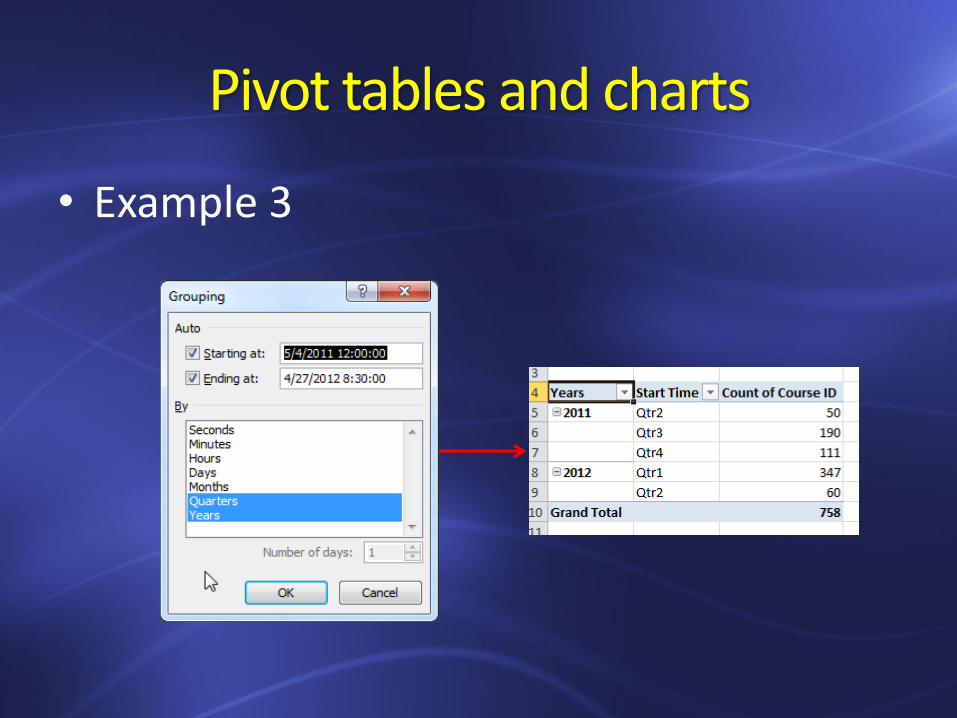
• Example 3
Pivot tables and charts
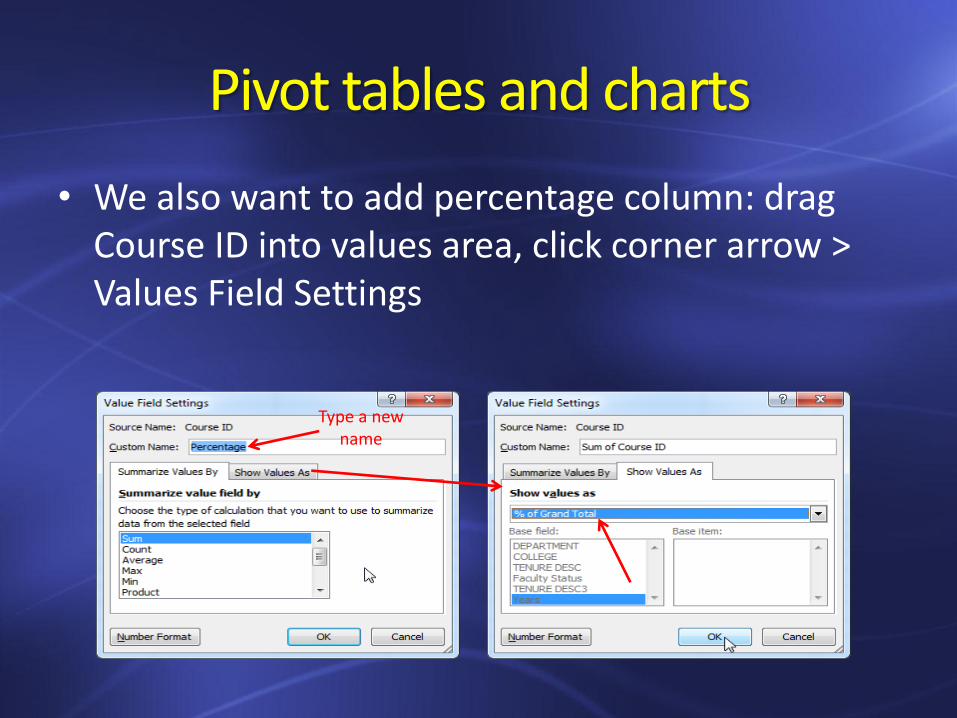
• We also want to add percentage column: drag Course ID into values area, click corner arrow > Values Field Settings
Type a new
name
Pivot tables and charts
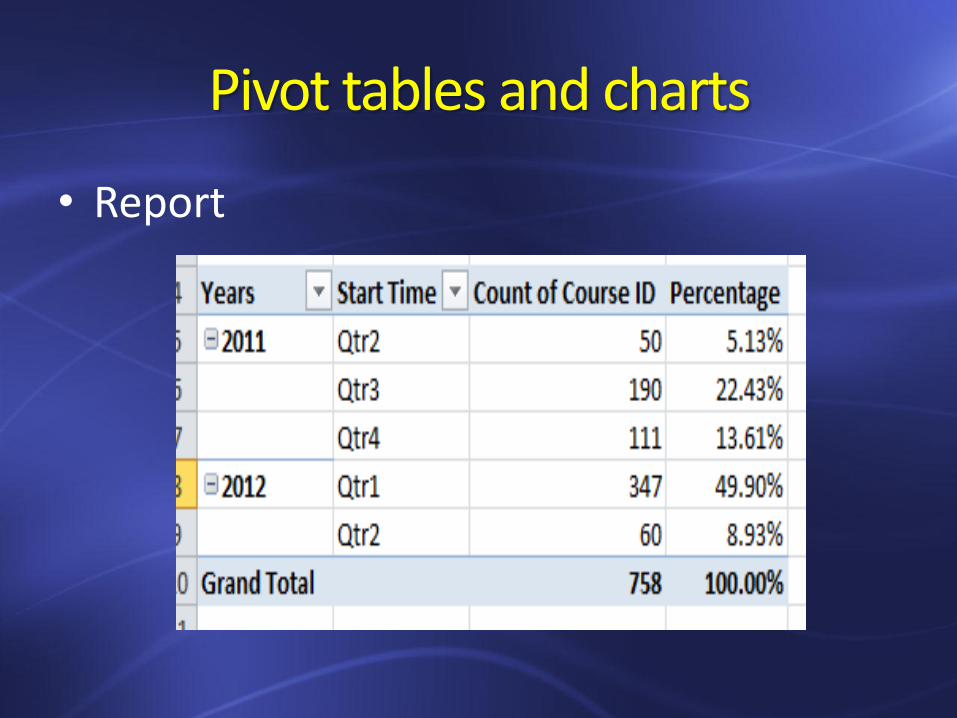
• Report
Pivot tables and charts
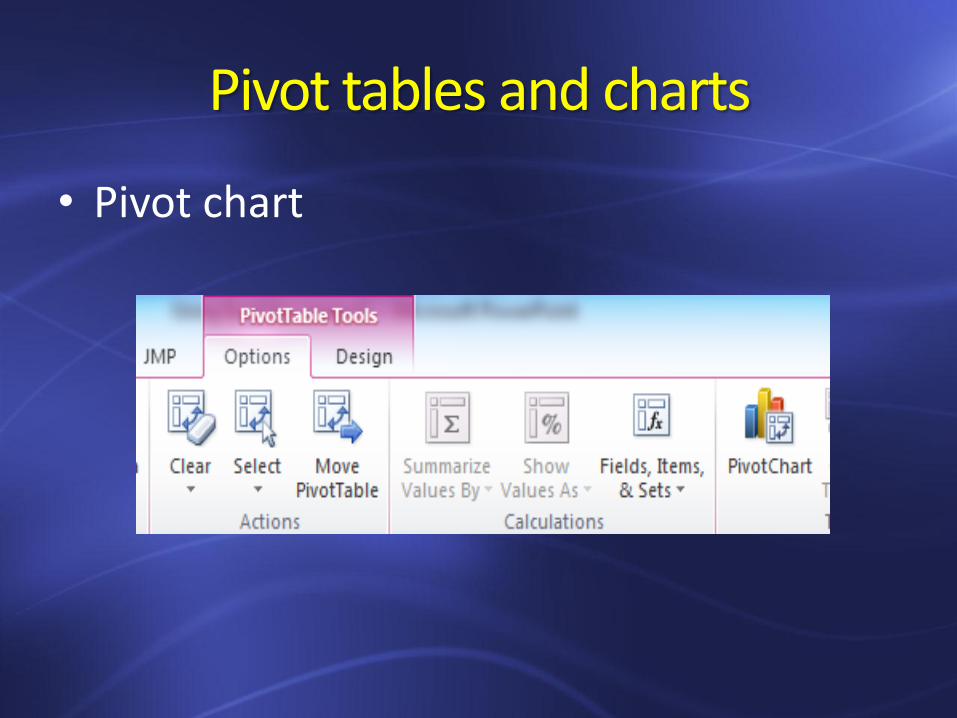
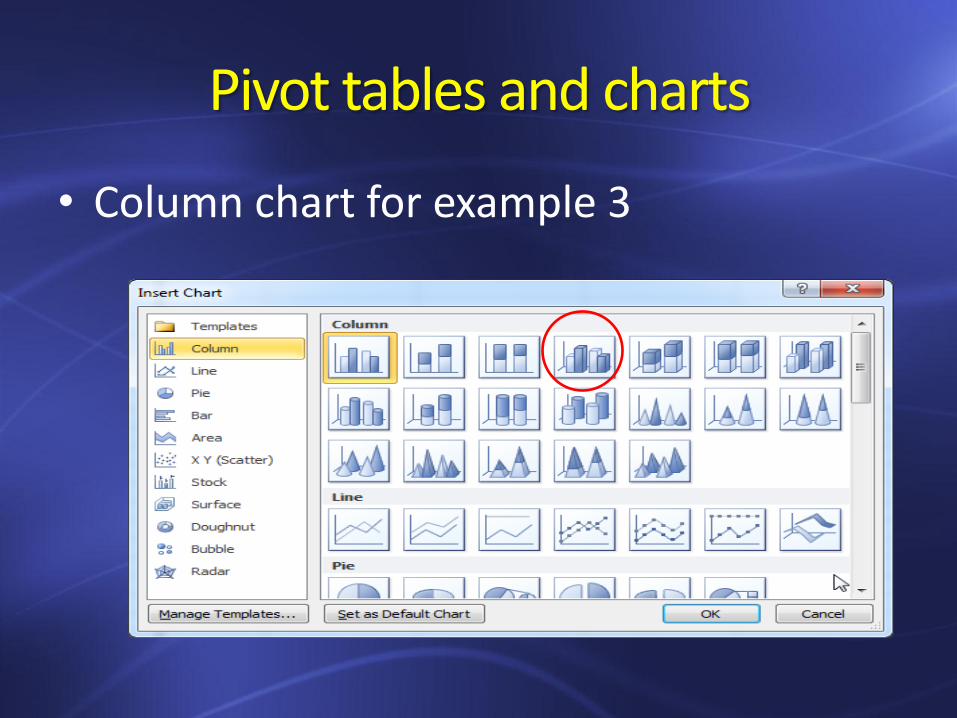
• Pivot Charts: we want column chart for example 3 (remove Percentage column first).
–Select any cell inside pivot table
–Choose PivotTable Tools > Options > Under Tools group > Pivot Chart > Choose Column.
Pivot tables and charts
• Pivot chart
Pivot tables and charts
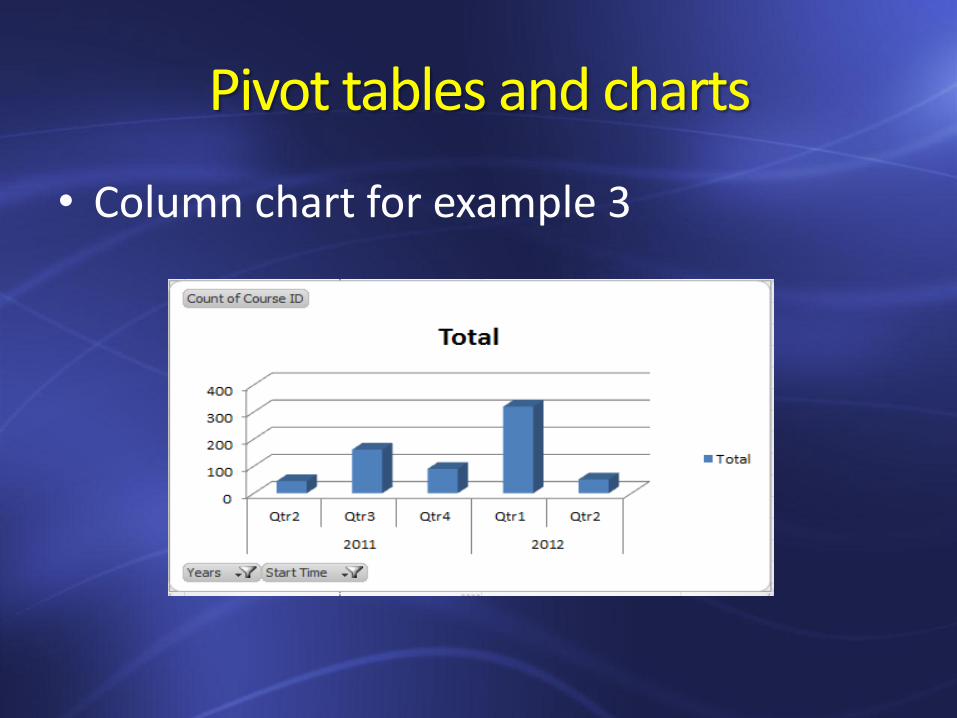
• Column chart for example 3
Pivot tables and charts
• Column chart for example 3
Pivot tables and charts
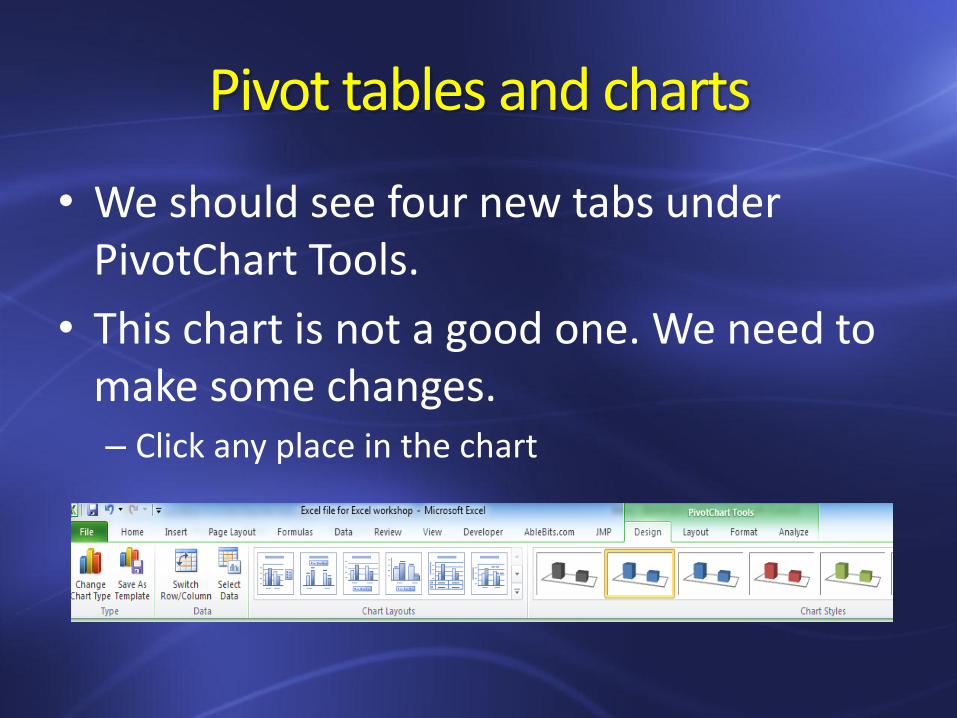
• We should see four new tabs under PivotChart Tools.
• This chart is not a good one. We need to make some changes. – Click any place in the chart
Pivot tables and charts
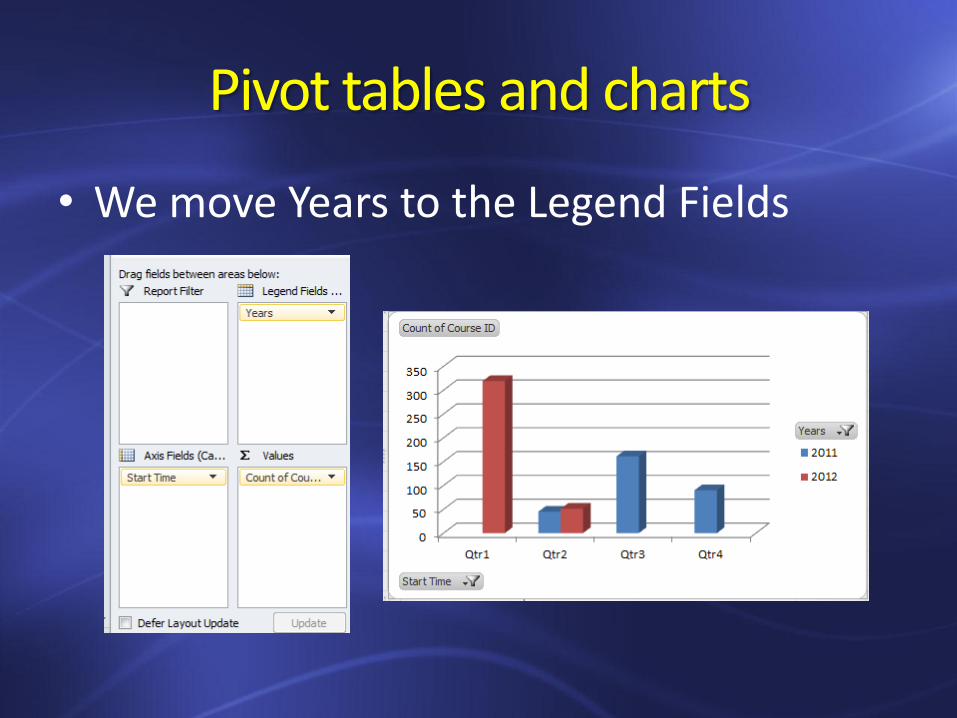
• We move Years to the Legend Fields
Pivot tables and charts
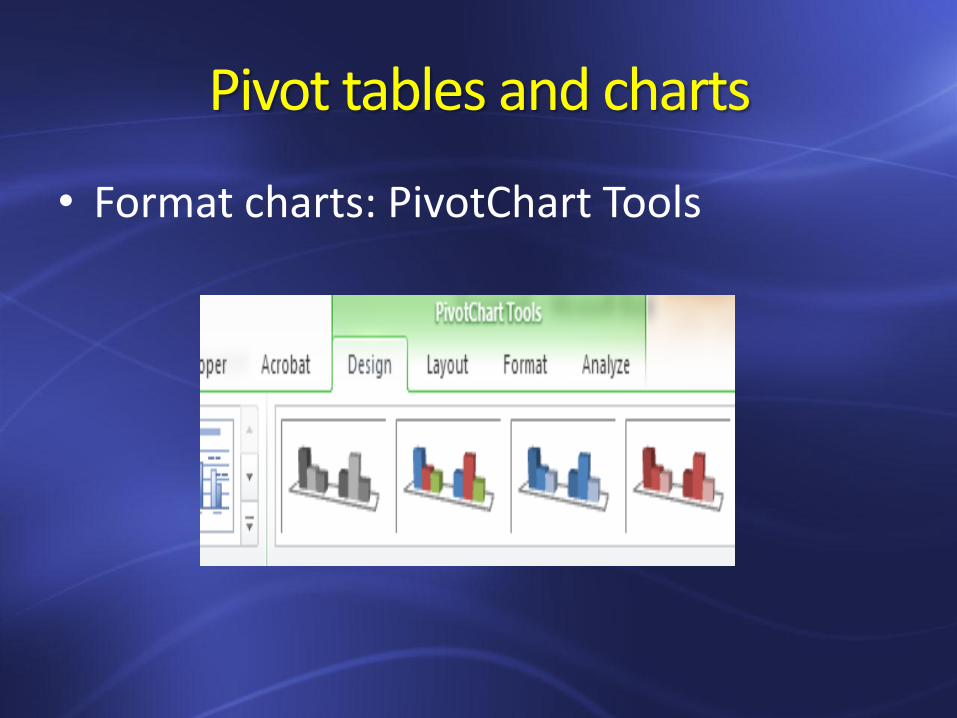
• Format charts: PivotChart Tools
Pivot tables and charts
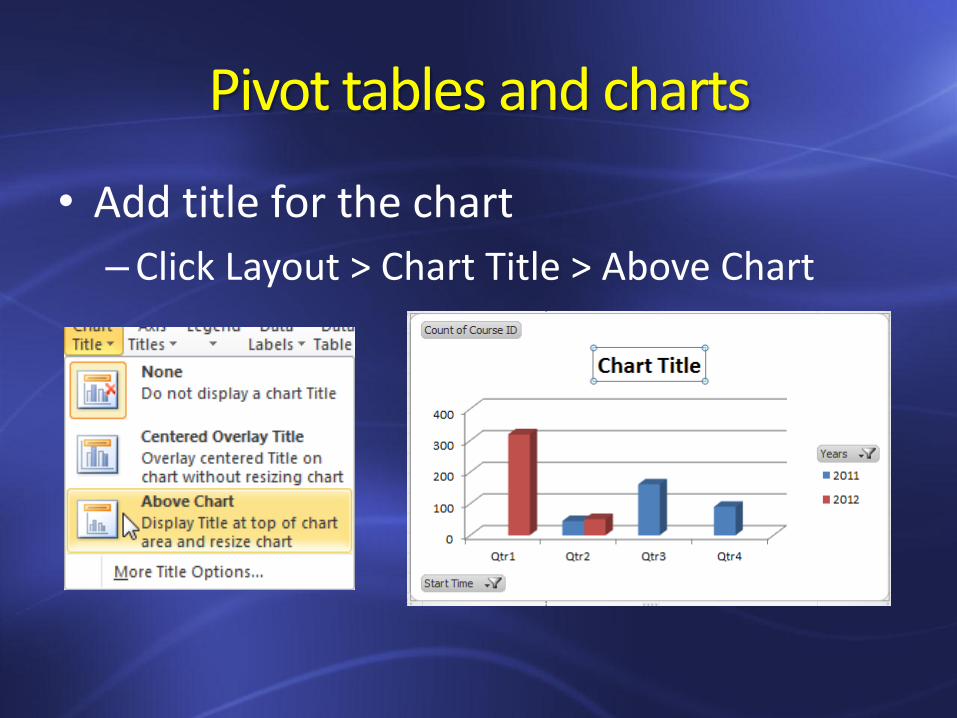
• Add title for the chart
–Click Layout > Chart Title > Above Chart
Pivot tables and charts
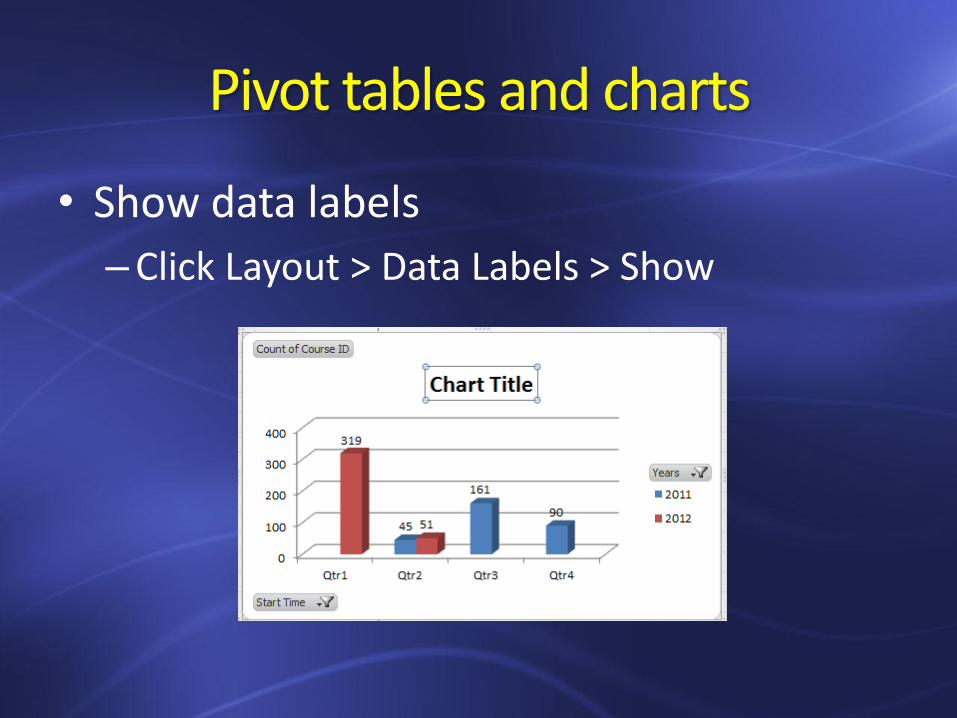
• Show data labels
–Click Layout > Data Labels > Show
Limitations of Pivot table
• You cannot add new rows or columns
• You cannot change any of the calculated values
• You cannot enter formulas within the pivot table.

Miscellaneous
• Generate random numbers
–RAND function: RAND ()*(b-a) + a
– (a, b) is a range, greater or equal to a, but less than b
– For example, we want to generate random numbers between 1 and 500.

Miscellaneous
• To quickly generate random numbers in many cells, all you have to do is generate the first random number in a particular cell, say with RAND function.
• Make that cell active and position the cursor over the bottom right corner of the cell until the cursor changes to a ‘+‘. When you see the ‘+‘, drag downwards.
Miscellaneous
• Or select a column, enter RAND function for the column, and press Ctrl + Enter
• The random numbers always change, so select all random numbers, Copy > Past as values
Miscellaneous
• How to use random numbers to assign people into different groups, for example two groups: Treatment and Control – Sort random numbers from lowest to
highest.
–Assign 1 and 2 for the first two cases, then continue doing the same to the second two cases, until assign 1 or 2 to all cases.

Miscellaneous
• Matrices calculation
–For example: three matrices stored in three sheets. The goal is to get sums of rows and columns of three matrices.
Miscellaneous
• First give a name of each matrix.
– Select the range of matrix
–Right click > define name > type a new name
• Then go to a new sheet, select a range the same size of the matrix.
• Type: = name 1 + name 2 + name 3
Miscellaneous
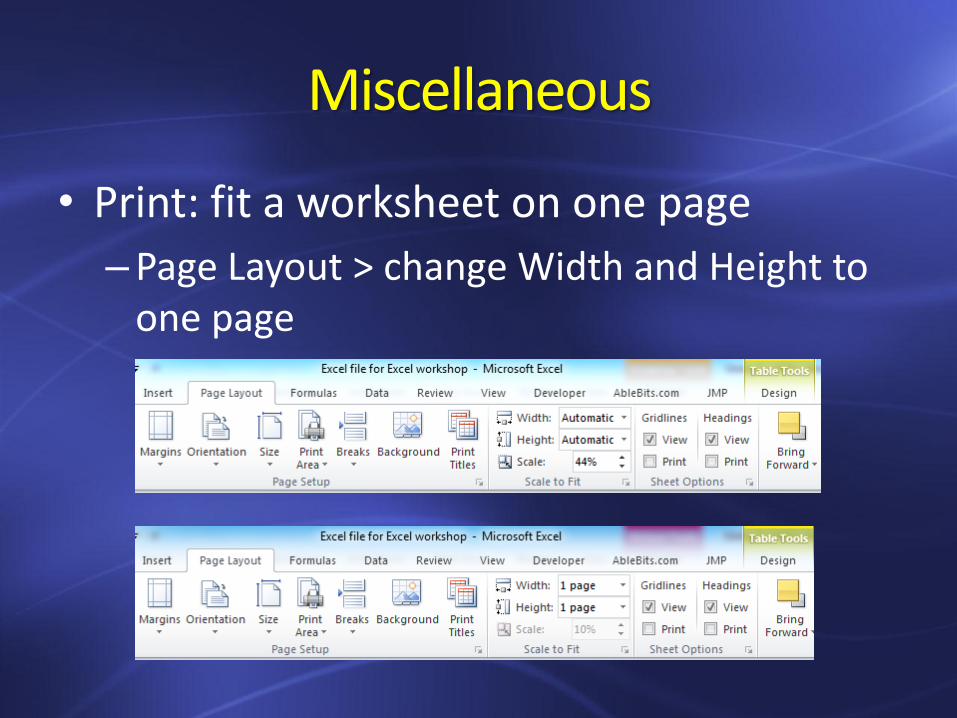
• Print: fit a worksheet on one page
–Page Layout > change Width and Height to one page