using excel functions
TRANSCRIPT

▼ –1
PART I
USING EXCEL FUNCTIONS
A function is a formula that is predefined to accomplish a certain task. In this introduction, we will show the general steps for using any Excel function.
Although there are many different types of functions (such as AVERAGE and STDEV.S) in many different categories (such as financial, logical, and engineering), most of what we will be dealing with in Excel Statistics: A Quick Guide focuses on working with numerical data and performing elementary and advanced operations. In other words, we’ll be learning to use those functions that fall in the group of functions known as statistical. Toward the end of Part I, we will introduce some database functions because they can be of particular interest, and importance, in analyzing data. They also fall under the general statistical functions category.
A Simple Example
In Figure I.1, you see a column of 10 numbers, with the average appearing in Cell B11. Take a look at the formula bar at the top of the figure, and you will see the syntax for this function:
=AVERAGE(B1:B10)

2–
▼
–EXCEL STATISTICS
Some general things to remember about using functions:
1. Functions always begin with an equal (=) sign as the first character entered in a cell.
2. A function can be placed in any cell. It will return the value of that function in that cell. It often makes sense to place the function near the data you are describing.
3. As you can see in Figure I.1, the syntax of the function, which is =AVERAGE(B1:B10), is not what is returned to the cell. Instead, you see the value computed by the function (in this case, 4.5) in the cell.
4. A function can be entered manually by typing the syntax and the range (or ranges) of cells that are to be applied), or it can be entered automatically. We’ll review both methods in this introduction, but Excel Statistics: A Quick Guide will focus exclusively on the auto-matic method because it is easier and faster and it can always be edited manually if necessary.
The Anatomy of a Function
Let’s take a quick look at what makes up a function, and then we will move on to how to enter one.
Figure I.1A Simple Function That Computes the Average of a Set of Values

Part I: Using Excel Functions– ▼ –3
Entering a Function Manually
To enter an Excel function manually (by typing an equal sign and the name of the function and the cells you want to be acted upon), you have to know two things:
1. The name of the function
2. The syntax or structure of the function. In the example that we have been using, AVERAGE is the name of the function and the syntax is =AVERAGE(range of cells).
Some functions are simple, and others are quite complex. You can find out the names of all available Excel functions, what they do, and their associ-ated syntax through Excel Help.
Entering a Function Automatically
Entering a function automatically is by far the fastest and easiest method, and we’ll use this model throughout Excel Statistics: A Quick Guide. Just as with entering a function manually, you need to know the function’s name. In our ongoing example, we use the AVERAGE function and compute the actual value.
1. Click on the cell where you want the function to be placed. In our example, the cell is B11. If you are following along, be sure you click in a cell that is blank.
Here’s the function that you saw in Figure I.1 that computes the average for a range of scores:
=AVERAGE(B1:B10)
And here is what each element represents . . .
= Tells Excel that this is a function. You want Excel to calculate a value in the cell, not put the syntax in the cell
AVERAGE Is the name of the function
(B1:B10) Is the range of cells that hold the input to the function. In the case of the AVERAGE function, these cells hold the values you want to find the average of
4–
▼
–EXCEL STATISTICS
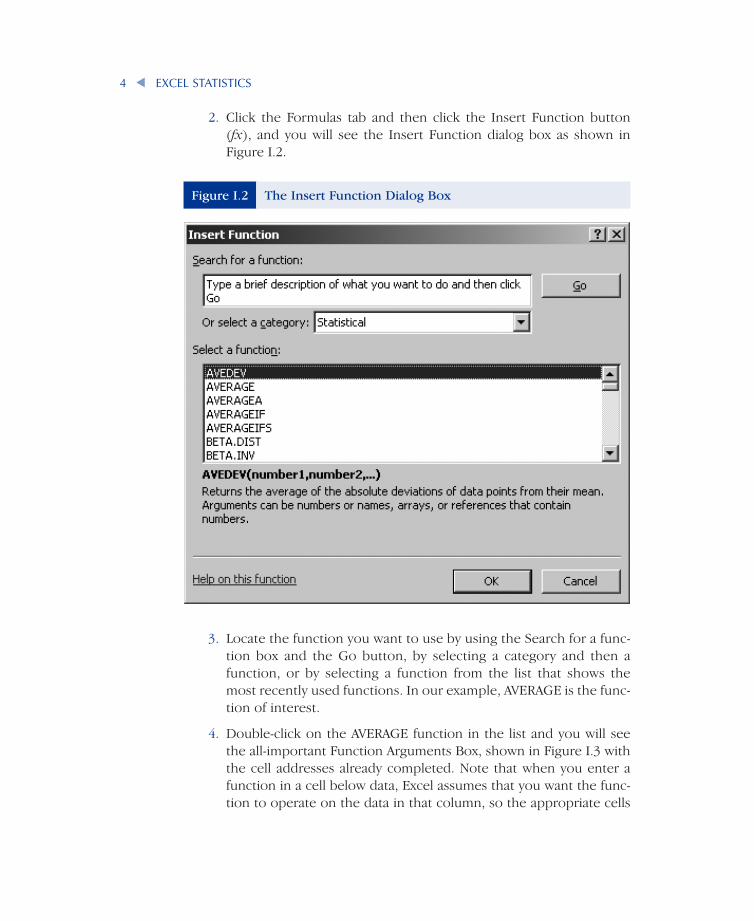
3. Locate the function you want to use by using the Search for a func-tion box and the Go button, by selecting a category and then a function, or by selecting a function from the list that shows the most recently used functions. In our example, AVERAGE is the func-tion of interest.
4. Double-click on the AVERAGE function in the list and you will see the all-important Function Arguments Box, shown in Figure I.3 with the cell addresses already completed. Note that when you enter a function in a cell below data, Excel assumes that you want the func-tion to operate on the data in that column, so the appropriate cells
2. Click the Formulas tab and then click the Insert Function button (fx), and you will see the Insert Function dialog box as shown in Figure I.2.
Figure I.2 The Insert Function Dialog Box

Part I: Using Excel Functions– ▼ –5
Here’s what’s in the dialog box you see in Figure I.3. (Remember, because there is already a function in the box, you see cell references. If you clicked on a blank cell, no cells would have been entered yet.)
•• There’s the name of the function, AVERAGE.•• Then there are text boxes where you enter the range of cells (the
argument) on which you want the function to perform its duty (B1:B10). Notice that the actual numbers (2, 2, 5, 7, 5, 6, 3, 6, 5, 4) you want to average are listed to the right of the text box.
•• Right below the argument boxes is the value the function will return to the cell in which it is located (in this case, 4.5).
•• Halfway down the dialog box is a description of what the function does (Returns the average . . . ).
•• Next is the syntax (or directions) of how to put the function together.•• The formula result (4.5) follows.•• Finally, there is a place to get help if you need it (Help on this function).
automatically appear as the range in the dialog box. If you have Excel enter a function and there is no data above that cell, then you will have to enter the range of data in the dialog box yourself.
Figure I.3The Function Arguments Dialog Box for the AVERAGE Function

6–
▼
–EXCEL STATISTICS
5. If Excel recognizes the data to which you want to apply the function, click OK and you are done. Otherwise, click on the RefEdit button and the Function Arguments box shrinks. (See the next section for an explanation of how the RefEdit button works.)
6. Drag the mouse over the range of cells (the data) you want included in the analysis. Click the RefEdit button.
7. Click the RefEdit button once again and then click OK. As you saw in Figure I.1, the results are shown in the Function Arguments box and returned to the worksheet. Also note that the syntax for the function appears in the formula bar.
About the RefEdit Button and Collapsing and Expanding
Microsoft (the developer of Excel) thought it best to refer to the collapse and expand button as the RefEdit button. When the Function Arguments dialog box is collapsed, clicking on the RefEdit button will expand the dialog box. And when it is expanded, clicking on the RefEdit button will collapse it. It’s as simple as that.
In sum, you use the RefEdit button to collapse and expand the Function Arguments dialog box, and you are then able to drag the mouse over the cells that contain the information that the Function Arguments dialog box requires to complete the function.
Another Way to Enter Functions Automatically (Using a Few More Clicks Than the Above Method)
Another very useful way to have Excel help you insert a function is to use the Formulas tab and the More Functions option as follows:
1. Click the Formulas tab → More Functions → Statistical
2. Select the function you want to insert.
3. You will now see whatever Function Arguments dialog box is appro-priate for the function you selected, and you can fill in the necessary information.
More About Function Names
As you use the newest version of Excel, you will see that the names of the possible functions appear in the cell as you type the function name. For

Part I: Using Excel Functions– ▼ –7
example, when you type =STD . . . , you will see a drop box for the =STDEV.P function, for the STDEV.S function, and for several others (such as =STDEVA). In other words, Excel allows you to compute several types of standard deviations. We focus on those that we believe are most important and most often used. So, in Chapter 2, you will see QuickGuides for STDEV.S (#5) and STDEV.P (#6) but not for other standard deviation functions.
Second, certain functions are available in Excel but do not appear in the list of functions that appears in the Insert Function dialog box. For example, RANK.AVG and RANK.EQ both appear in the Insert Function dialog box, but RANK does not. But RANK still appears when you begin to type =RAN . . . in any cell. That’s because the Excel developers only want people who have used earlier editions of Excel (where RANK was the only choice) to use that function in the latest version of Excel without distinguishing between RANK.AVG and RANK.EQ.

8–
▼
–USING EXCEL FUNCTIONS: COMPUTING AVERAGES
EXCEL QUICKGUIDE 1
The AVERAGE Function
What the AVERAGE Function Does
The AVERAGE function takes a set of values and computes the arithmetic mean, which is the sum of the values divided by the frequency of those values. It is the most often used measure of central tendency.
The Data Set
The data set used in this example is titled AVERAGE, and the question is, “What is the average speed of response and accuracy?”
Variable Description
Response Time Speed of response across 10 items
Accuracy Number of items correct
Using the Average Function
1. Click on the cell where you want the AVERAGE function to be placed. (In the data set, the cell is B13.)
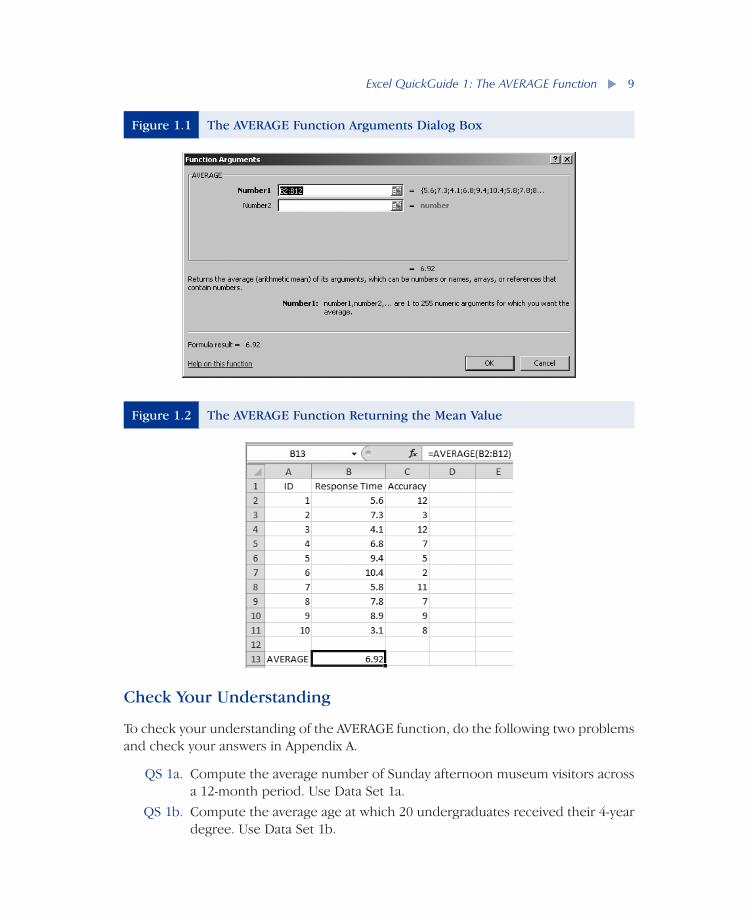
2. Click the Formulas tab → Insert Function button (fx) and locate and double-click the AVERAGE function. You will see the Function Arguments dialog box, as shown in Figure 1.1. Note that because the function is being inserted immedi-ately below the data, Excel automatically recognizes what data should be included.
3. Click OK. The AVERAGE function returns its value in Cell B13, as you see in Figure 1.2. Copy the function to Cell C13. The average response time is 6.92, and the average accuracy is 7.60. Note that you can see the syntax for the func-tion in the formula bar at the top of the worksheet.
Related Functions: MEDIAN, MODE.SNGL, GEOMEAN
Excel QuickGuide 1: The AVERAGE Function– ▼ –9
Check Your Understanding
To check your understanding of the AVERAGE function, do the following two problems and check your answers in Appendix A.
QS 1a. Compute the average number of Sunday afternoon museum visitors across a 12-month period. Use Data Set 1a.
QS 1b. Compute the average age at which 20 undergraduates received their 4-year degree. Use Data Set 1b.
Figure 1.1 The AVERAGE Function Arguments Dialog Box
Figure 1.2 The AVERAGE Function Returning the Mean Value

10–
▼
–USING EXCEL FUNCTIONS: COMPUTING AVERAGES
EXCEL QUICKGUIDE 2
The MEDIAN Function
What the MEDIAN Function Does
The MEDIAN function computes the data point at which 50% of the values fall above it and 50% of the values fall below it. It is most often used as a measure of central tendency when there are extreme scores.
The Data Set
The data set used in this example is titled MEDIAN, and the question is, “What is the median annual income for a group of 11 homeowners?”
Variable Description
Income Annual income in dollars
Using the MEDIAN Function
1. Click on the cell where you want the MEDIAN function to be placed. (In the data set, the cell is B14.)
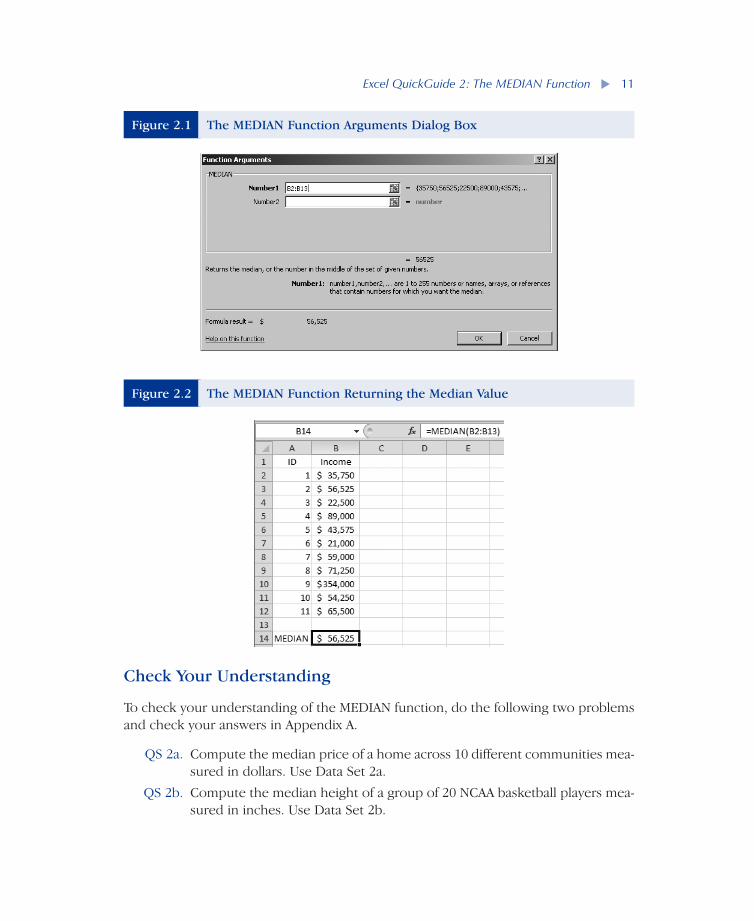
2. Click the Formulas tab → Insert Function button (fx) and locate and double-click on the MEDIAN function. You will see the Function Arguments dialog box, as shown in Figure 2.1. Note that because the function is being inserted imme-diately below the data, Excel automatically recognizes what data should be included.
3. Click OK. The MEDIAN function returns its value in Cell B14, as you see in Figure 2.2. The median income value is $56,525. Note that you can see the syn-tax for the function in the formula bar at the top of the worksheet.
Related Functions: AVERAGE, MODE.SNGL, GEOMEAN
Excel QuickGuide 2: The MEDIAN Function– ▼ –11
Check Your Understanding
To check your understanding of the MEDIAN function, do the following two problems and check your answers in Appendix A.
QS 2a. Compute the median price of a home across 10 different communities mea-sured in dollars. Use Data Set 2a.
QS 2b. Compute the median height of a group of 20 NCAA basketball players mea-sured in inches. Use Data Set 2b.
Figure 2.1 The MEDIAN Function Arguments Dialog Box
Figure 2.2 The MEDIAN Function Returning the Median Value

12–
▼
–USING EXCEL FUNCTIONS: COMPUTING AVERAGES
EXCEL QUICKGUIDE 3
The MODE.SNGL Function
What the MODE.SNGL Function Does
The MODE.SNGL function computes the most frequently occurring value in a set of values.
The Data Set
The data set used in this example is titled MODE, and the question is, “What is the mode, or favorite, flavor of ice cream?”
Variable Description
Preference 1 = vanilla ice cream, 2 = strawberry ice cream, 3 = chocolate ice cream
Using the MODE.SNGL Function
1. Click on the cell where you want the MODE function to be placed. (In the data set, the cell is B23.)
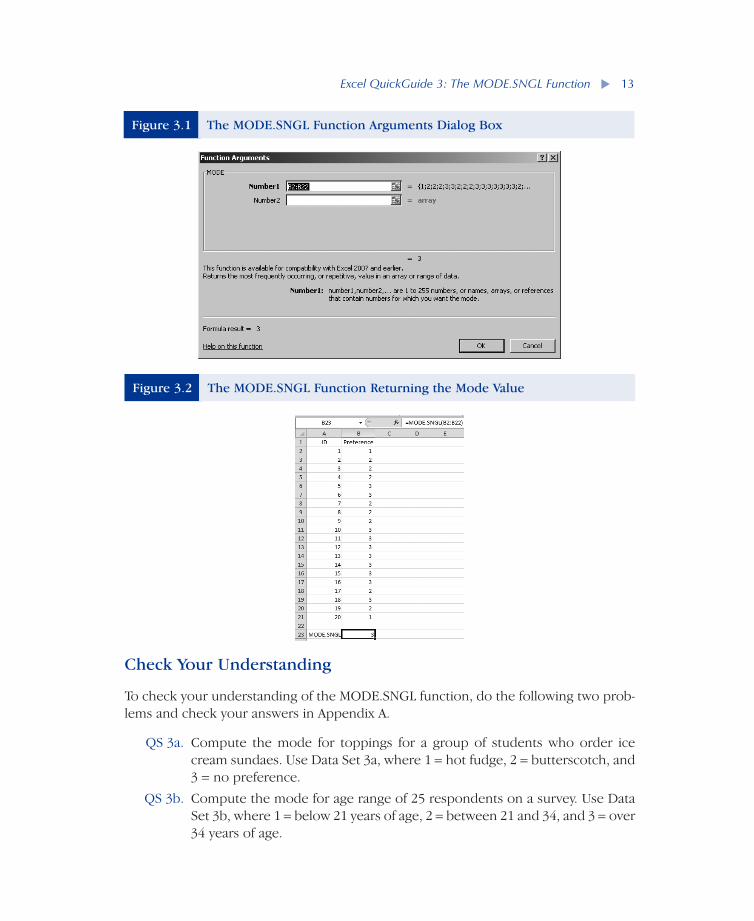
2. Click the Formulas tab → Insert Function button (fx) and locate and double-click on the MODE.SNGL function. You will see the Function Arguments dialog box, as shown in Figure 3.1. Note that because the function is being inserted immediately below the data, Excel automatically recognizes what data should be included.
3. Click OK. The MODE.SNGL function returns its value in Cell B23, as you see in Figure 3.2. The MODE.SNGL is 3; in other words, the most popular flavor of ice cream is chocolate. Note that you can see the syntax for the function in the formula bar at the top of the worksheet.
Related Functions: AVERAGE, MEDIAN, GEOMEAN
Excel QuickGuide 3: The MODE.SNGL Function– ▼ –13
Check Your Understanding
To check your understanding of the MODE.SNGL function, do the following two prob-lems and check your answers in Appendix A.
QS 3a. Compute the mode for toppings for a group of students who order ice cream sundaes. Use Data Set 3a, where 1 = hot fudge, 2 = butterscotch, and 3 = no preference.
QS 3b. Compute the mode for age range of 25 respondents on a survey. Use Data Set 3b, where 1 = below 21 years of age, 2 = between 21 and 34, and 3 = over 34 years of age.
Figure 3.1 The MODE.SNGL Function Arguments Dialog Box
Figure 3.2 The MODE.SNGL Function Returning the Mode Value

14–
▼
–USING EXCEL FUNCTIONS: COMPUTING AVERAGES
EXCEL QUICKGUIDE 4
The GEOMEAN Function
What the GEOMEAN Function Does
The GEOMEAN function computes the geometric mean. It multiplies a set of numbers and takes the nth root of the product, where n is the number of numbers in the set. The geometric mean is generally used to compute an appropriate weighted average when a factor, such as reading ability, is measured on two different scales, say reading speed in words per minute and recall of what was read on a scale of 1 to 5. As another example, the United Nations Human Development Index uses the geometric mean.
The Data Set
The data set used in this example is titled GEOMEAN, and the question is, “What is the geometric mean for percent gains in achievement over a 5-year period?”
Variable Description
Ach Achievement gain for years 1 through 5
Using the GEOMEAN Function
1. Click on the cell where you want the GEOMEAN function to be placed. (In the data set, the cell is B8.)
2. Click the Formulas tab → Insert Function button (fx) and locate and double-click on the GEOMEAN function. You will see the Function Arguments dialog box, as shown in Figure 4.1. Note that because the function is being inserted immediately below the data, Excel automatically recognizes what data should be included.
3. Click OK. The GEOMEAN function returns its value as .083 or 8.3% in Cell B8, as you see in Figure 4.2. Note that you can see the syntax for the function in the formula bar at the top of the worksheet.
Related Functions: AVERAGE, MEDIAN, MODE.SNGL

Excel QuickGuide 4: The GEOMEAN Function– ▼ –15
Check Your Understanding
To check your understanding of the GEOMEAN function, do the following two prob-lems and check your answers in Appendix A.
QS 4a. Compute the geometric mean for average achievement score for a group of 10 high schools. Use Data Set 4a.
QS 4b. Compute the geometric mean for average amount spent on groceries per week in dollars over a year. Use Data Set 4b.
Figure 4.1 The GEOMEAN Function Arguments Dialog Box
Figure 4.2 The GEOMEAN Function Returning the Geometric Mean Value