uk renal registry 10th annual report 2007 fig 3.1 incident rates in the countries of the uk:...
TRANSCRIPT

UK Renal Registry 10th Annual Report 2007
Fig 3.1 Incident rates in the countries of the UK: 1990-2006
0
20
40
60
80
100
120
140
160
1990
1991
1992
1993
1994
1995
1996
1997
1998
1999
2000
2001
2002
2003
2004
2005
2006
Year
Rat
e pe
r m
illion
pop
ulat
ion
ScotlandWalesEnglandN Ireland

UK Renal Registry 10th Annual Report 2007
Fig 3.2 95% confidence limits for take on rate of 111 pmp for population size 50,000 - 1 million
0
20
40
60
80
100
120
140
160
180
200
0 100 200 300 400 500 600 700 800 900 1,000
Population (thousands)
Tak
e on
rat
e pm
p
Upper 95% CI111 pmpLower 95% CI

UK Renal Registry 10th Annual Report 2007
Fig 3.3 Relationship between ethnic mix and acceptance ratio
0.0
0.4
0.8
1.2
1.6
2.0
2.4
0 20 40 60 80
Percentage non-white
Std
anda
rdis
ed r
ate
ratio
North East
North West
Yorkshire and the Humber
East Midlands
West Midlands
East of England
London
South East
South West
Wales

UK Renal Registry 10th Annual Report 2007
Fig 3.4 Median age of new patients by centre
50 55 60 65 70 75 80 85
D&GallChelms
Sw anseClw ydAntrimDudleyTyroneDorsetExeterWrexmGloucPlymth
Norw chDundee
AbrdnInvernsB HeartBrightnCarshB QEH
YorkIpsw iNottm
GlasgwBangorMiddlbrRedngPortsCambBristolCardffBelfastWolveCarlisSund
New ryWirralTruroCovntDerby
BradfdPrestn
LeicStevngDunfnEdinbLiv RI
KlmarnkLiv AinSheff
HullManWst
LeedsBasldnSthendL KingsL WestL BartsL RfreeOxfordShrewNew c
L GuysAirdrie
EnglandN IrelandScotland
WalesUK
Cen
tre
Median age

UK Renal Registry 10th Annual Report 2007
Fig 3.5 Incident rates by age and gender
0
100
200
300
400
500
600
700
Age band
Rat
e pe
r m
illion
pop
ulat
ion Males
FemalesAll UK

UK Renal Registry 10th Annual Report 2007
Fig 3.6 Percentage of total starting RRT who are male, by age band
40
50
60
70
80
18-24 25-34 35-44 45-54 55-64 65-74 75-84 ≥85
Age band
Pe
rce
nta
ge
ma
le
Error bars = 95% CI

UK Renal Registry 10th Annual Report 2007
Fig 3.7 Percentage of new patients who are male
0 10 20 30 40 50 60 70 80 90 100
WrexmIpswi
DudleyBasldnD&GallBangor
SundNewryDerby
SwanseClwyd
InvernsPlymthAirdrieBrightnAntrimPorts
ManWstAbrdn
LeicBradfdShrewSheff
StevngHull
CovntL KingsB HeartLeedsPrestnLiv RITruro
L WestOxfordWolveBristolEdinb
L BartsCamb
MiddlbrWirralCardffExeterNottmTyroneDorsetRedngL GuysBelfastL RfreeNorwchB QEHNewc
KlmarnkDunfn
DundeeCarsh
GlasgwSthendGlouc
ChelmsYork
Liv AinCarlis
EnglandN IrelandScotland
WalesUK
Cen
tre
Percentage male

UK Renal Registry 10th Annual Report 2007
Fig 3.8 Trends in the incidence of RRT for the treatment of type 2 diabetic nephropathy

UK Renal Registry 10th Annual Report 2007
Fig 3.9 RRT modality day 90 - 2006 cohort
Home - HD0.1%
Satellite HD20.6%
Hosp - HD52.0%
Cycling PD < 6 nights/wk0.5%
Transplant4.7%
CAPD Disconnect15.6%
CAPD Connect0.4%
Cycling PD >= 6 nights/wk6.2%

UK Renal Registry 10th Annual Report 2007
Fig 3.10 New patients 2006 : Percentage of incident dialysis patients on HD at day 90
0 10 20 30 40 50 60 70 80 90 100
Liv AinClwyd
D&GallCamb
TyroneL WestNorwchStevngAbrdnAirdrie
SundGlouc
BradfdSthendL GuysChelms
CarshSwanseB HeartBelfast
DundeeL RfreePlymthLeedsB QEH
KlmarnkHull
DudleyMiddlbrBristolCardffNewryNewcTruro
LeicPrestnWolveCarlisSheff
GlasgwAntrim
L KingsDunfnShrewPorts
WirralExeter
BrightnBasldn
YorkCovntEdinbDerby
RedngWrexmOxfordNottm
ManWstLiv RI
DorsetL Barts
IpswiBangorInverns
EnglandN
ScotlandWales
UK
Cen
tre
Percentage of patients

UK Renal Registry 10th Annual Report 2007
Percentage of incident dialysis patients on HD on day 90, by age, 2006
10 20 30 40 50 60 70 80 90 100
Clw ydLiv AinD&GallCamb
StevngL WestDudleyL GuysAirdrie
Norw chTyrone
SundBradfdAbrdnWolveGloucCarsh
SthendDundeePlymth
LeicHull
PrestnL RfreeB HeartWrexmL KingsKlmarnkSw anse
CovntBelfastWirral
DorsetLeedsCarlisTruroYork
SheffBasldnCardff
GlasgwNew cAntrimDunfn
ChelmsB QEHDerby
ShrewEdinb
MiddlbrPorts
BristolBrightnBangorL BartsOxfordExeterRedng
ManWstNottmIpsw i
InvernsNew ry
Liv RIEngland
N IrelandScotland
WalesUK
Cen
tre
Percentage of patients
>65
<65
m
UK Renal Registry 10th Annual Report 2007
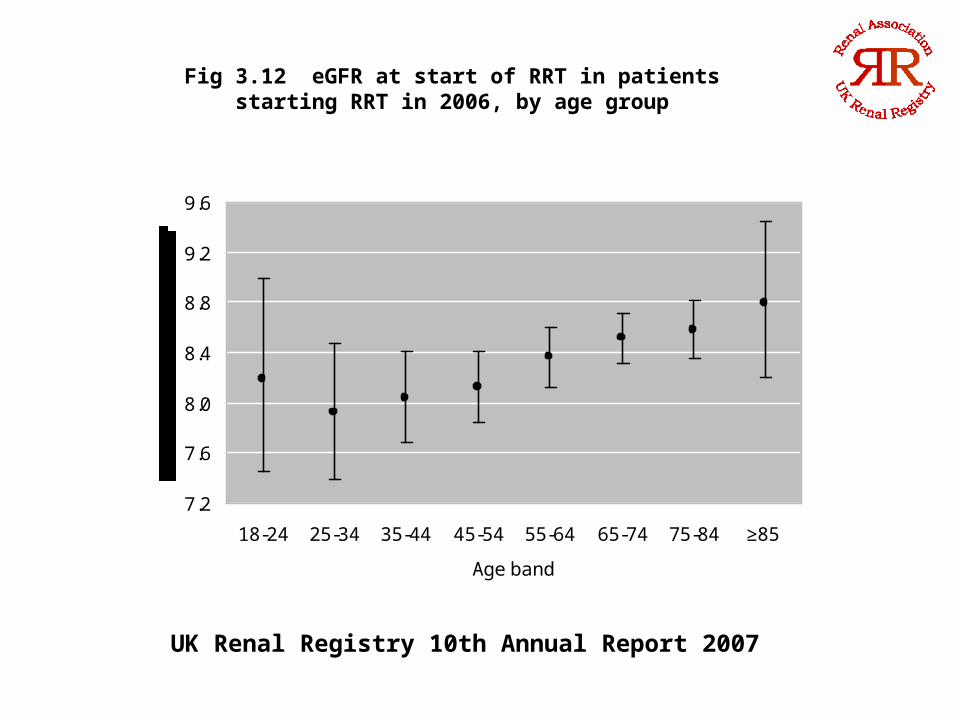
Fig 3.12 eGFR at start of RRT in patients starting RRT in 2006, by age group
7.2
7.6
8.0
8.4
8.8
9.2
9.6
18-24 25-34 35-44 45-54 55-64 65-74 75-84 ≥85
Age band

UK Renal Registry 10th Annual Report 2007
Fig 3.13 eGFR at start of RRT in patients starting RRT by year
5.5
6.0
6.5
7.0
7.5
8.0
8.5
9.0
1997 1998 1999 2000 2001 2002 2003 2004 2005 2006
Year
Ge
om
etr
ic m
ea
n e
GF
R m
l/min
/1.7
3m2
HD
PD
UK Renal Registry 10th Annual Report 2007
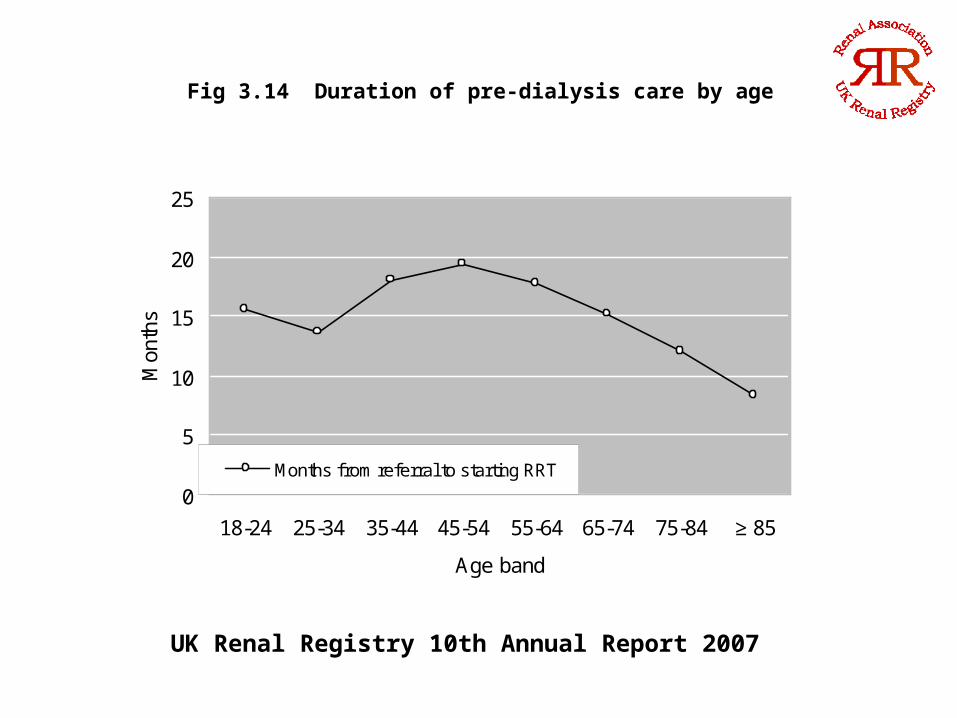
Fig 3.14 Duration of pre-dialysis care by age
0
5
10
15
20
25
18-24 25-34 35-44 45-54 55-64 65-74 75-84 ≥ 85
Age band
Mon
ths
Months from referral to starting RRT