uk markets –what’s going on and why is the usa doing
TRANSCRIPT

UK markets – what’s going on and why is the USA doing better than us? Friday 16 October 2020

2Brewin Dolphin | 2020 YTD Update
COVID-19 Markets The US The UK Income Sterling US Election Outlook
Blair MullenDivisional Director
Tel: 0292 034 7614Email: [email protected]
5 Callaghan Square, Cardiff CF10 5BT
Review of Year to date
Impact of COVID-19
Key Market Drivers
Impact on Income
Outlook
This publication is for FCA authorised individuals only and should not be distributed in whole or in part to retail clients.

3
COVID-19: the human story so far
Brewin Dolphin | 2020 YTD Update
COVID-19 Markets The US The UK Income Sterling US Election Outlook
Source: S&P 500 Total Return YTD 2020 - Thomson Reuters Eikon (Refinitiv), Data Retrieved 22 September 2020. Data used: S&P 500 (S&P 500 Index – CBOE, .SPX)Source: COVID-19 Global Cases YTD 2020 - Thomson Reuters Eikon (Refinitiv), Data Retrieved 22 September 2020. Data used: Global COVID-19 Cases (World, Coronavirus (COVID-19), Total Cases, Volume - XWCCOV=ECI)
The information contained in this document is believed to be reliable and accurate, but without further investigation cannot be warranted as to accuracy or completeness.
0
5,000,000
10,000,000
15,000,000
20,000,000
25,000,000
30,000,000
35,000,000
-35%
-30%
-25%
-20%
-15%
-10%
-5%
0%
5%
10%
15%
Tuesday, 31December 2019
Friday, 31 January2020
Saturday, 29February 2020
Tuesday, 31 March2020
Thursday, 30 April2020
Sunday, 31 May2020
Tuesday, 30 June2020
Friday, 31 July2020
Monday, 31 August2020
Confirmed COVID-19 Cases vs S&P 500 Total Return YTDAs of 21 September 2020
Global COVID-19 Cases S&P 500
First UK Case
January 31st
WHO Declare Global Pandemic UK lockdown
US $2 Trillion economic stimulus
Easing of UK lockdown begins
UK £330bn economic stimulus
March 11thMarch 16th
May 10th
March 25th
March 17th

4
What has happened to Markets?
Brewin Dolphin | 2020 YTD Update
COVID-19 Markets The US The UK Income Sterling US Election Outlook
Data as of 21 September 2020
Source: Thomson Reuters Eikon (Refinitiv), Data Retrieved 22 September 2020.Data used: UK Gilts (FTSE Actuaries UK Conventional Gilts All Stocks Index, .FTFS), FTSE All Share (FTSE All Share Index, .FTAS), S&P 500 (S&P 500 Index –CBOE, .SPX), China (MSCI China Price Index USD End of Day, .dMICN00000PUS), Property (MSCI United Kingdom IMI (STD) Liquid Real Estate Price Index GBP End of Day - .DMIUK0LRE2PGB), Gold (Gold Spot Multi-Contributor, XAU), Oil (ICE Europe Brent Crude Electronic Energy Future, LCOc1).
The information contained in this document is believed to be reliable and accurate, but without further investigation cannot be warranted as to accuracy or completeness. Past performance is not a guide to future performance.
4.2%
19.2%
31.5%
20.9% 19.6%22.7%
18.3%
6.5%
-21.0%
3.0%
14.3%
-16.3%
-37.2%
26.1%
-50%
-40%
-30%
-20%
-10%
0%
10%
20%
30%
40%
UK Gilts FTSE All Share S&P 500 China Property Oil Gold
2019 2020 YTD
5
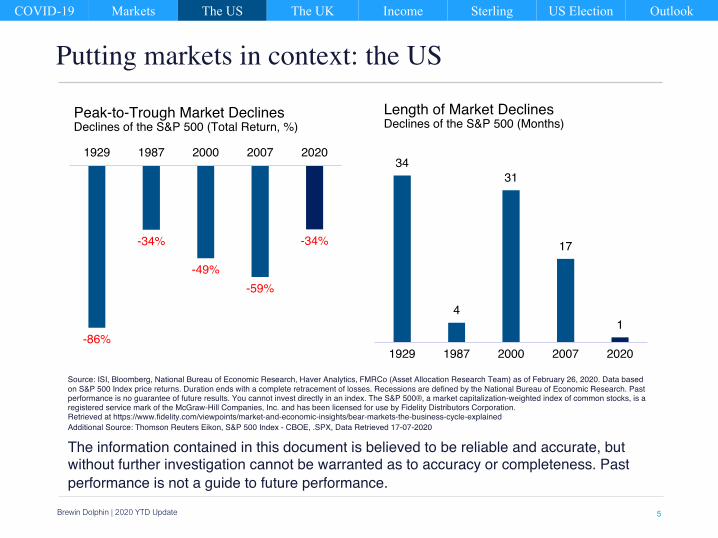
Putting markets in context: the US
Brewin Dolphin | 2020 YTD Update
COVID-19 Markets The US The UK Income Sterling US Election Outlook
-34%
-59%-49%
-34%
-86%
20202007200019871929
Peak-to-Trough Market DeclinesDeclines of the S&P 500 (Total Return, %)
1
17
31
4
34
20202007200019871929
Length of Market DeclinesDeclines of the S&P 500 (Months)
Source: ISI, Bloomberg, National Bureau of Economic Research, Haver Analytics, FMRCo (Asset Allocation Research Team) as of February 26, 2020. Data based on S&P 500 Index price returns. Duration ends with a complete retracement of losses. Recessions are defined by the National Bureau of Economic Research. Past performance is no guarantee of future results. You cannot invest directly in an index. The S&P 500®, a market capitalization-weighted index of common stocks, is a registered service mark of the McGraw-Hill Companies, Inc. and has been licensed for use by Fidelity Distributors Corporation.Retrieved at https://www.fidelity.com/viewpoints/market-and-economic-insights/bear-markets-the-business-cycle-explainedAdditional Source: Thomson Reuters Eikon, S&P 500 Index - CBOE, .SPX, Data Retrieved 17-07-2020
The information contained in this document is believed to be reliable and accurate, but without further investigation cannot be warranted as to accuracy or completeness. Past performance is not a guide to future performance.

6
An Evolving Landscape
Brewin Dolphin | 2020 YTD Update
COVID-19 Markets The US The UK Income Sterling US Election Outlook
Source: Thomson Reuters Eikon (Refinitiv), Price Return YTD as of 21-09-2020, Data Retrieved 22-09-2020.Data used: FTSE All Share (FTSE All Share Index, .FTAS), S&P 500 (S&P 500 Index – CBOE, .SPX), NASDAQ (NASDAQ Composite Index, .IXIC), Dow Jones Industrial Average (Dow Jones Industrial Average Index, .DJI).
The information contained in this document is believed to be reliable and accurate, but without further investigation cannot be warranted as to accuracy or completeness. Past performance is not a guide to future performance.
3.0%
21.0%
-3.2%
-21.0%-25%
-20%
-15%
-10%
-5%
0%
5%
10%
15%
20%
25%
S&P 500 NASDAQ Dow Jones Industrial Average FTSE All Share
US and UK Indices Performance YTD

7
An Evolving Landscape
Brewin Dolphin | 2020 YTD Update
COVID-19 Markets The US The UK Income Sterling US Election Outlook
Source: Thomson Reuters Eikon (Refinitiv), Price Return YTD as of 21-09-2020, Data Retrieved 22-09-2020. Sector data also provided by Thomson Reuters Eikon (Refinitiv), Data Retrieved 22-09-2020, S&P 500 Index - CBOE, .SPX.
The information contained in this document is believed to be reliable and accurate, but without further investigation cannot be warranted as to accuracy or completeness. Past performance is not a guide to future performance.
-22.1%
17.2%
3.1%
-46.9%
-0.1%
-6.7%
1.3%
-10.7%
5.1%
22.8%
-10.9%
Financia l
Consurmer Discretionary
Materials
Energy
Consumer Staples
Industrials
Health Care
Util ities
Communication Services
Information Technology
Real Estate
S&P 500 Sector Performance YTD
Financials, 9.8%
Consumer Cyclicals,
16.0%
Consumer Non-Cyclicals, 8.9%
Industrials, 8.4%Healthcare,
12.8%
Technology, 34.4%
S&P 500 Sector Breakdown
Financia ls Consumer Cyclica lsBasic Materials EnergyConsumer Non-Cyclica ls IndustrialsHealthcare Util itiesReal Estate Technology

8
An Evolving Landscape
Brewin Dolphin | 2020 YTD Update
COVID-19 Markets The US The UK Income Sterling US Election Outlook
Source: Thomson Reuters Eikon (Refinitiv), Total Return YTD as of 21-09-2020, Data Retrieved 22-09-2020. Sector data also provided by Thomson Reuters Eikon (Refinitiv), Data Retrieved 22-09-2020.Data used: US Banks (Dow Jones US Banks Index, .DJUSBK), US Financials (Dow Jones U.S. Financials Index, .DJUSFN), Facebook (Facebook Inc, FB.O), Amazon (Amazon.com Inc, AMZN.O), Apple (Apple Inc, AAPL.O), Tesla (Tesla Inc, TSLA.O), Microsoft (Microsoft Corp, MSFT.O), Alphabet (Alphabet Inc, GOOG.O), Netflix (Netflix Inc, NFLX.O).
The information contained in this document is believed to be reliable and accurate, but without further investigation cannot be warranted as to accuracy or completeness. Past performance is not a guide to future performance.
-60.0%
-40.0%
-20.0%
0.0%
20.0%
40.0%
60.0%
80.0%
100.0%
12/31/2019 1/31/2020 2/29/2020 3/31/2020 4/30/2020 5/31/2020 6/30/2020 7/31/2020 8/31/2020
FAATMAN vs Banks & Financials YTD
Banks Financials Facebook Am azon Apple Microsoft Alphabet Net flix
-100%
0%
100%
200%
300%
400%
500%
12/31/2019 1/31/2020 2/29/2020 3/31/2020 4/30/2020 5/31/2020 6/30/2020 7/31/2020 8/31/2020
FAATMAN vs Banks & Financials YTD
Banks Financials Facebook Am azon Apple Tesla Microsoft Alphabet Net flix

9
The UK: a contrasting story
Brewin Dolphin | 2020 YTD Update
COVID-19 Markets The US The UK Income Sterling US Election Outlook
Source: Thomson Reuters Eikon (Refinitiv), Price Return YTD as of 21-09-2020, Data Retrieved 22-09-2020.Data used: FTSE 100 (FTSE 100 Index, .FTSE), FTSE 250 (FTSE 250 Index, .FTMC), UK Small Cap (iShares MSCI UK Small Cap UCITS ETF GBP (Acc), .CUKS.L), FTSE All Share (FTSE All Share Index, .FTAS), S&P 500 (S&P 500 Index – CBOE, .SPX), Gold (Gold Spot Multi-Contributor, XAU), Oil (ICE Europe Brent Crude Electronic Energy Future, LCOc1).
The information contained in this document is believed to be reliable and accurate, but without further investigation cannot be warranted as to accuracy or completeness. Past performance is not a guide to future performance.
-21.1% -22.9% -23.6% -21.0%
-37.2%
26.1%
3.0%
-50%
-40%
-30%
-20%
-10%
0%
10%
20%
30%
FTSE 100 FTSE 250 UK Small Cap FTSE All Share Oil Price Gold S&P 500
UK Indices Performance YTDTotal Return

10
The UK: a contrasting story
Brewin Dolphin | 2020 YTD Update
COVID-19 Markets The US The UK Income Sterling US Election Outlook
Source: Thomson Reuters Eikon (Refinitiv), Price Return YTD as of 21-09-2020, Data Retrieved 22-09-2020. Sector data also provided by Thomson Reuters Eikon (Refinitiv), Data Retrieved 22-09-2020, FTSE All Share (FTSE All Share Index, .FTAS).
The information contained in this document is believed to be reliable and accurate, but without further investigation cannot be warranted as to accuracy or completeness. Past performance is not a guide to future performance.
-53.9%
-3.5%
-13.6%
-14.4%
-2.4%
-24.4%
-33.8%
-14.9%
-29.7%
-7.0%
Oil and Gas
Basic Materi als
Indust rials
Consum er Goods
Health Care
Consum er Services
Telecommunicat ions
Utilit ies
Financials
Technology
FTSE All Share Sector Performance YTD
Financials, 18.6%
Consumer Goods, 17.2%
Basic Materials,
10.3%Oil and Gas, 8.9%
Consumer Services,
12.9%
Industrials, 11.8%
Health Care, 12.9%
FTSE All Share Sector Breakdown
Financials Consumer Goods Basic MaterialsOil and Gas Consumer Services IndustrialsHealth Care Utilities TelecommunicationsTechnology

11
The UK: a contrasting story
Brewin Dolphin | 2020 YTD Update
COVID-19 Markets The US The UK Income Sterling US Election Outlook
Source: Thomson Reuters Eikon (Refinitiv), Price Return YTD as of 21-09-2020, Data Retrieved 22-09-2020. Sector data also provided by Thomson Reuters Eikon (Refinitiv), Data Retrieved 22-09-2020.Data used: FTSE All Share (FTSE All Share Index, .FTAS), Royal Dutch Shell (Royal Dutch Shell PLC, RDSb.L), EasyJet (Easyjet PLC, EZJ.L), Ocado (Ocado Group PLC, OCDO.L), AstraZeneca (AstraZeneca PLC, AZN.L), Lloyds Banking Group (Lloyds Banking Group, LLOY.L).
EasyJet Lloyds Banking Group Royal Dutch Shell FTSE All Share AstraZeneca Ocado-63.9% -61.6% -55.1% -21.0% 16.5% 119.2%
The information contained in this document is believed to be reliable and accurate, but without further investigation cannot be warranted as to accuracy or completeness. Past performance is not a guide to future performance.
-100.0%
-50.0%
0.0%
50.0%
100.0%
150.0%
12/31/2019 1/31/2020 2/29/2020 3/31/2020 4/30/2020 5/31/2020 6/30/2020 7/31/2020 8/31/2020
Key Movers within the UKYear to Date, as of 21st September 2020
FTSE All Share Royal Dutch Shell EasyJet Ocado AstraZeneca Lloyds Banking Group

12
Impact upon Income
Brewin Dolphin | 2020 YTD Update
COVID-19 Markets The US The UK Income Sterling US Election Outlook
UK's Top 10 Dividend PayersBased on the Past 5 Years
Royal Dutch Shell CutBP CutVodafone CutRio Tinto CutBHP CutLloyds Banking Group SuspendedHSBC SuspendedGlaxoSmithKline FlatAstraZeneca GrewBritish American Tobacco Grew
Source: Baillie Gifford & Co. and Eikon content from Refinitiv. Reflects dividend decisions as at 21 September 2020.Source: Dividend history retrieved from Thomson Reuters Eikon (Refinitiv) and accurately reflects as of 21-09-2020, Data Retrieved 22-09-2020. Data used: Royal Dutch Shell (Royal Dutch Shell PLC, RDSb.L).
The information contained in this document is believed to be reliable and accurate, but without further investigation cannot be warranted as to accuracy or completeness. Past performance is not a guide to future performance.
£0.00
£0.05
£0.10
£0.15
£0.20
£0.25
£0.30
£0.35
£0.40
£0.45
Mon
day,
1 N
ovem
ber 1
982
Tues
day,
1 M
ay 1
984
Frida
y, 1
Nove
mbe
r 198
5Fr
iday,
1 M
ay 1
987
Tues
day,
1 N
ovem
ber 1
988
Tues
day,
1 M
ay 1
990
Frida
y, 1
Nove
mbe
r 199
1Sa
turd
ay, 1
May
199
3Tu
esda
y, 1
Nov
embe
r 199
4W
edne
sday
, 1 M
ay 1
996
Satu
rday
, 1 N
ovem
ber 1
997
Satu
rday
, 1 M
ay 1
999
Wed
nesd
ay, 1
Nov
embe
r 200
0W
edne
sday
, 1 M
ay 2
002
Satu
rday
, 1 N
ovem
ber 2
003
Sund
ay, 1
May
200
5W
edne
sday
, 1 N
ovem
ber 2
006
Thur
sday
, 1 M
ay 2
008
Sund
ay, 1
Nov
embe
r 200
9Su
nday
, 1 M
ay 2
011
Thur
sday
, 1 N
ovem
ber 2
012
Thur
sday
, 1 M
ay 2
014
Sund
ay, 1
Nov
embe
r 201
5M
onda
y, 1
May
201
7Th
ursd
ay, 1
Nov
embe
r 201
8Fr
iday,
1 M
ay 2
020
Royal Dutch Shell Dividend HistoryNet Payment Data November 1982 - September 2020

13
Impact upon fixed income investments
Brewin Dolphin | 2020 YTD Update
COVID-19 Markets The US The UK Income Sterling US Election Outlook
Government Balance Sheets have Expanded Rates of Return from safe assets at all time lows
Source: The Federal Reserve Recent Balance Sheet Trends, The Federal Reserve, Data correct as at 21-09-2020, Data Retrieved 22-09-2020, accessed from https://www.federalreserve.gov/monetarypolicy/bst_recenttrends_accessible.htmSource: 10 Year Government Bonds, Thomson Reuters Eikon (Refinitiv), Price Return YTD as of 21-09-2020, Data Retrieved 22-09-2020.Data used: UK (United Kingdom 10 Year Benchmark, GB10YT=RR), US (United States 10 Year Benchmark, US10YT=RR), Europe (Euro 10 Year Benchmark, EU10YT=RR).
The information contained in this document is believed to be reliable and accurate, but without further investigation cannot be warranted as to accuracy or completeness. Past performance is not a guide to future performance.
£0M
£1,000,000M
£2,000,000M
£3,000,000M
£4,000,000M
£5,000,000M
£6,000,000M
£7,000,000M
£8,000,000M
2007
2008
2009
2010
2011
2012
2013
2014
2015
2016
2017
2018
2019
Federal ReserveRecent Balance Sheet Trends
-1.5-1.0-0.50.00.51.01.52.02.53.03.5
9/7/2015 9/7/2016 9/7/2017 9/7/2018 9/7/2019 9/7/2020
10 Year Government BondsBond Yields
UK US Europe

14
How does Sterling fit into all of this?
Brewin Dolphin | 2020 YTD Update
COVID-19 Markets The US The UK Income Sterling US Election Outlook
Source: Thomson Reuters Eikon (Refinitiv), Price Return YTD as of 21-09-2020, Data Retrieved 22-09-2020.Data used: US Dollar (UK Pound Sterling/US Dollar FX Spot Rate, GBP=), Euro (UK Pound Sterling/Euro FX Spot Rate, GBPEUR=), Japanese Yen (UK Pound Sterling/Japanese Yen FX Spot Rate, GBPJPY=).
The information contained in this document is believed to be reliable and accurate, but without further investigation cannot be warranted as to accuracy or completeness. Past performance is not a guide to future performance.
-3.4%
-7.9%
-5.4%
-16%
-14%
-12%
-10%
-8%
-6%
-4%
-2%
0%
2%
Wednesday, 4March 2020
Saturday, 4 April2020
Monday, 4 May2020
Thursday, 4 June2020
Saturday, 4 July2020
Tuesday, 4August 2020
Friday, 4September 2020
Sterling YTD Performance Relative to Major Global Currencies
US Dollar Euro Japanese Yen
15
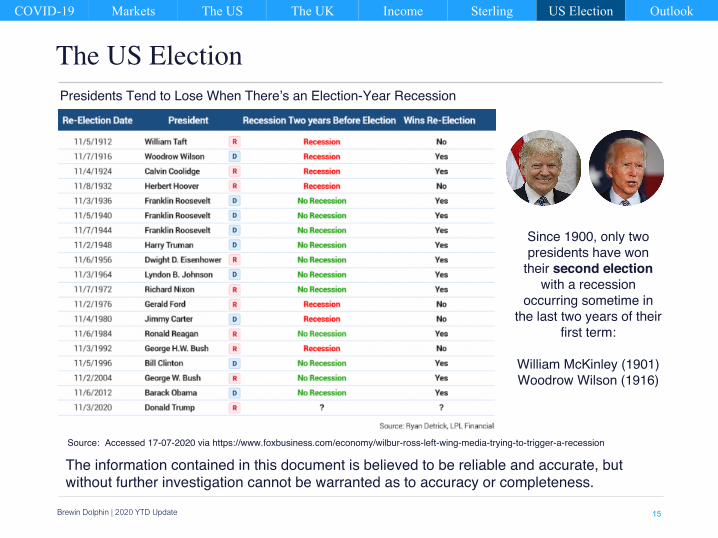
The US Election
Brewin Dolphin | 2020 YTD Update
COVID-19 Markets The US The UK Income Sterling US Election Outlook
Presidents Tend to Lose When There’s an Election-Year Recession
Since 1900, only two presidents have won
their second electionwith a recession
occurring sometime in the last two years of their
first term:
William McKinley (1901)Woodrow Wilson (1916)
Source: Accessed 17-07-2020 via https://www.foxbusiness.com/economy/wilbur-ross-left-wing-media-trying-to-trigger-a-recession
The information contained in this document is believed to be reliable and accurate, but without further investigation cannot be warranted as to accuracy or completeness.

16
Outlook
Brewin Dolphin | 2020 YTD Update
COVID-19 Markets The US The UK Income Sterling US Election Outlook
Brexit
Pandemic Control
Speed of Recovery
Unemployment Government Stimulus
TaxTrade Reform
The opinions expressed in this publication are not necessarily the views held throughout Brewin Dolphin Ltd.

17
Disclaimers
Brewin Dolphin | 2020 YTD Update
COVID-19 Markets The US The UK Income Sterling US Election Outlook
This publication is for FCA authorised individuals only and should not be distributed in whole or in part to retail clients.
The value of investments can fall and you may get back less than you invested. or if income is mentioned The value of investments and any income from them can fall and you may get back less than you invested.
Past performance is not a guide to future performance.
We or a connected person may have positions in or options on the securities mentioned herein or may buy, sell or offer to make a purchase or sale of such securities from time to time. In addition we reserve the right to act as principal or agent with regard to the sale or purchase of any security mentioned in this document. For further information, please refer to our conflicts policy which is available on request or can be accessed via our website at www.brewin.co.uk
The information contained in this document is believed to be reliable and accurate, but without further investigation cannot be warranted as to accuracy or completeness.
If you invest in currencies other than your own, fluctuations in currency value will mean that the value of your investment will move independently of the underlying asset.
The opinions expressed in this publication are not necessarily the views held throughout Brewin Dolphin Ltd.

18
2nd Floor, 5 Callaghan Square, Cardiff CF10 5BTTel: 029 2034 0100
https://www.brewin.co.uk/cardiff
Brewin Dolphin Limited is a member of the London Stock Exchange and is authorised and regulated by the Financial Conduct Authority (Financial Services Register reference number: 124444). Registered office: 12 Smithfield Street, London, EC1A 9BD. Registered in England and Wales – company number: 2135876. VAT number: GB 690 8994 69