tx map linking report final as - nwea ·...
TRANSCRIPT

Linking the Texas STAAR Assessments to NWEA MAP Tests
February 2016
Page 2 of 23
Introduction
Northwest Evaluation Association™ (NWEA™) is committed to providing partners with useful tools to help make inferences from the Measures of Academic Progress® (MAP®) interim assessment scores. One important tool is the concordance table between MAP and state summative assessments. Concordance tables have been used for decades to relate scores on different tests measuring similar but distinct constructs. These tables, typically derived from statistical linking procedures, provide a direct link between scores on different tests and serve various purposes. Aside from describing how a score on one test relates to performance on another test, they can also be used to identify benchmark scores on one test corresponding to performance categories on another test, or to maintain continuity of scores on a test after the test is redesigned or changed. Concordance tables are helpful for educators, parents, administrators, researchers, and policy makers to evaluate and formulate academic standing and growth.
Recently, NWEA completed a concordance study to connect the scales of the State of Texas Assessments of Academic Readiness™ (STAAR™) reading and math with those of the MAP
Reading and MAP for Mathematics assessments. In this report, we present the 3rd through 8th grade cut scores on MAP reading and mathematics scales that correspond to the benchmarks on the STAAR reading and math tests. Information about the consistency rate of classification based on the estimated MAP cut scores is also provided, along with a series of tables that predict the probability of receiving a Level II (i.e., “Satisfactory”) or higher performance designation on the STAAR assessments, based on the observed MAP scores taken during the same school year. A detailed description of the data and analysis method used in this study is provided in the Appendix.
Overview of Assessments
STAAR includes a series of vertically scaled achievement tests aligned to the Texas state curriculum, the Texas Essential Knowledge and Skills (TEKS) in math and reading for grades 3-‐8, writing for grades 4 and 7, science for grades 5 and 8, social science for grades 5 and 8 and end-‐of-‐course assessments for English I, English II, Algebra I, biology, and U.S history. STAAR tests can be delivered online or in the paper-‐and-‐pencil form. For each grade and subject, there are two cut scores that distinguish between performance levels: Level I: Unsatisfactory Academic Performance, Level II: Satisfactory Academic Performance and Level III: Advanced Academic Performance. The Level II cut score demarks the minimum level of performance considered to be “Passed” for accountability purposes (Texas Education Agency, 2015).
Page 3 of 23
MAP tests are vertically scaled interim assessments that are administered in the form of a computerized adaptive test (CAT). MAP tests are constructed to measure student achievement from Grades K to 12 in math, reading, language usage, and science and aligned to the TEKS standards. MAP scores are reported on a Rasch Unit (RIT) scale with a range from 100 to 350. Each subject has its own RIT scale. To aid interpretation of MAP scores, NWEA periodically conducts norming studies of student and school performance on MAP. For example, the 2015 RIT Scale norming study (Thum & Hauser, 2015) employed multi-‐level growth models on nearly 500,000 longitudinal test scores from over 100,000 students that were weighted to create large, nationally representative norms for math, reading, language usage, and general science.
Estimated MAP Cut Scores Associated with STAAR Readiness Levels
Tables 1 to 4 report the STAAR scaled scores associated with each of the three performance levels, as well as the estimated cut scores on the MAP tests associated with the STAAR performance levels. Specifically, Tables 1 and 2 apply to MAP scores obtained during the spring testing season for reading and math, respectively. Tables 3 and 4 apply to MAP tests taken in a prior testing season (fall or winter) for reading and math, respectively. The tables also report the percentile rank (based on the NWEA 2015 MAP Norms) associated with each estimated MAP cut score. The MAP cut scores can be used to predict students’ most probable STAAR performance level, based on their observed MAP scores. For example, a 6th grade student who obtained a MAP math score of 240 in the spring testing season is likely to be at the very high end of Level II (Satisfactory) on the STAAR taken during that same testing season (see Table 2). Similarly, a 3rd grade student who obtained a MAP reading score of 210 in the fall testing season is likely to be at Level III (Advanced) on the STAAR taken in the spring of 3rd grade (see Table 3).

Page 4 of 23
TABLE 1. CONCORDANCE OF PERFORMANCE LEVEL SCORE RANGES BETWEEN STAAR
AND MAP READING (WHEN MAP IS TAKEN IN SPRING)
Grade
STAAR
Level I Unsatisfactory
Level II Satisfactory
Level III Advanced
3 700-‐1330 1331-‐1554 1555-‐2300
4 700-‐1421 1422-‐1632 1633-‐2300
5 700-‐1457 1458-‐1666 1667-‐2300
6 700-‐1503 1504-‐1717 1718-‐2300
7 700-‐1555 1556-‐1752 1753-‐2300
8 700-‐1576 1575-‐1782 1783-‐2300
Grade
MAP
Level I Unsatisfactory
Level II Satisfactory
Level III Advanced
RIT %ile RIT %ile RIT %ile
3 100-‐191 1-‐31 192-‐213 32-‐83 214-‐350 84-‐99
4 100-‐200 1-‐35 201-‐220 36-‐83 221-‐350 84-‐99
5 100-‐205 1-‐33 206-‐225 34-‐82 226-‐350 83-‐99
6 100-‐205 1-‐24 206-‐229 25-‐82 230-‐350 83-‐99
7 100-‐208 1-‐26 209-‐232 27-‐82 233-‐350 83-‐99
8 100-‐208 1-‐23 209-‐234 24-‐82 235-‐350 83-‐99 Notes. 1. %ile=percentile. 2. Bolded numbers indicate the cut scores considered to be at least “passed” for accountability purposes.

Page 5 of 23
TABLE 2. CONCORDANCE OF PERFORMANCE LEVEL SCORE RANGES BETWEEN STAAR
AND MAP MATH (WHEN MAP IS TAKEN IN SPRING)
Grade
STAAR
Level I Unsatisfactory
Level II Satisfactory
Level III Advanced
3 700-‐1346 1347-‐1595 1596-‐2300
4 700-‐1452 1453-‐1669 1670-‐2300
5 700-‐1486 1487-‐1723 1724-‐2300
6 700-‐1522 1523-‐1771 1772-‐2300
7 700-‐1562 1563-‐1797 1798-‐2300
8 700-‐1582 1583-‐1853 1854-‐2300
Grade
MAP
Level I Unsatisfactory
Level II Satisfactory
Level III Advanced
RIT %ile RIT %ile RIT %ile
3 100-‐197 1-‐33 198-‐219 34-‐87 220-‐350 88-‐99
4 100-‐209 1-‐39 210-‐232 40-‐89 233-‐350 90-‐99
5 100-‐212 1-‐29 213-‐239 30-‐86 240-‐350 87-‐99
6 100-‐215 1-‐27 216-‐243 28-‐86 244-‐350 87-‐99
7 100-‐219 1-‐30 220-‐249 31-‐88 250-‐350 89-‐99
8 100-‐220 1-‐29 221-‐257 30-‐91 258-‐350 92-‐99 Notes. 1. %ile=percentile. 2. Bolded numbers indicate the cut scores considered to be at least “passed” for accountability purposes.

Page 6 of 23
TABLE 3. CONCORDANCE OF PERFORMANCE LEVEL SCORE RANGES BETWEEN STAAR
AND MAP READING (WHEN MAP IS TAKEN IN FALL OR WINTER PRIOR TO SPRING
STAAR TESTS)
Notes. 1. %ile=percentile. 2. Bolded numbers indicate the cut scores considered to be at least “passed” for accountability purposes.
Grade STAAR
Level I Unsatisfactory
Level II Satisfactory
Level III Advanced
3 700-‐1330 1331-‐1554 1555-‐2300
4 700-‐1421 1422-‐1632 1633-‐2300
5 700-‐1457 1458-‐1666 1667-‐2300
6 700-‐1503 1504-‐1717 1718-‐2300
7 700-‐1555 1556-‐1752 1753-‐2300
8 700-‐1576 1575-‐1782 1783-‐2300 MAP FALL
Grade Level I
Unsatisfactory Level II
Satisfactory Level III Advanced
RIT %ile RIT %ile RIT %ile
3 100-‐179 1-‐28 180-‐206 29-‐87 207-‐350 88-‐99
4 100-‐191 1-‐33 192-‐215 34-‐86 216-‐350 87-‐99
5 100-‐198 1-‐31 199-‐221 32-‐85 222-‐350 86-‐99
6 100-‐199 1-‐22 200-‐226 23-‐85 227-‐350 86-‐99
7 100-‐203 1-‐23 204-‐230 24-‐85 231-‐350 86-‐99
8 100-‐203 1-‐19 204-‐232 20-‐83 233-‐350 84-‐99 MAP WINTER
Grade Level I
Unsatisfactory Level II
Satisfactory Level III Advanced
RIT %ile RIT %ile RIT %ile
3 100-‐187 1-‐29 188-‐211 30-‐85 212-‐350 86-‐99
4 100-‐197 1-‐34 198-‐219 35-‐85 220-‐350 86-‐99
5 100-‐203 1-‐33 204-‐224 34-‐84 225-‐350 85-‐99
6 100-‐203 1-‐23 204-‐228 24-‐83 229-‐350 84-‐99
7 100-‐206 1-‐24 207-‐231 25-‐83 232-‐350 84-‐99
8 100-‐207 1-‐22 208-‐233 23-‐82 234-‐350 83-‐99
Page 7 of 23
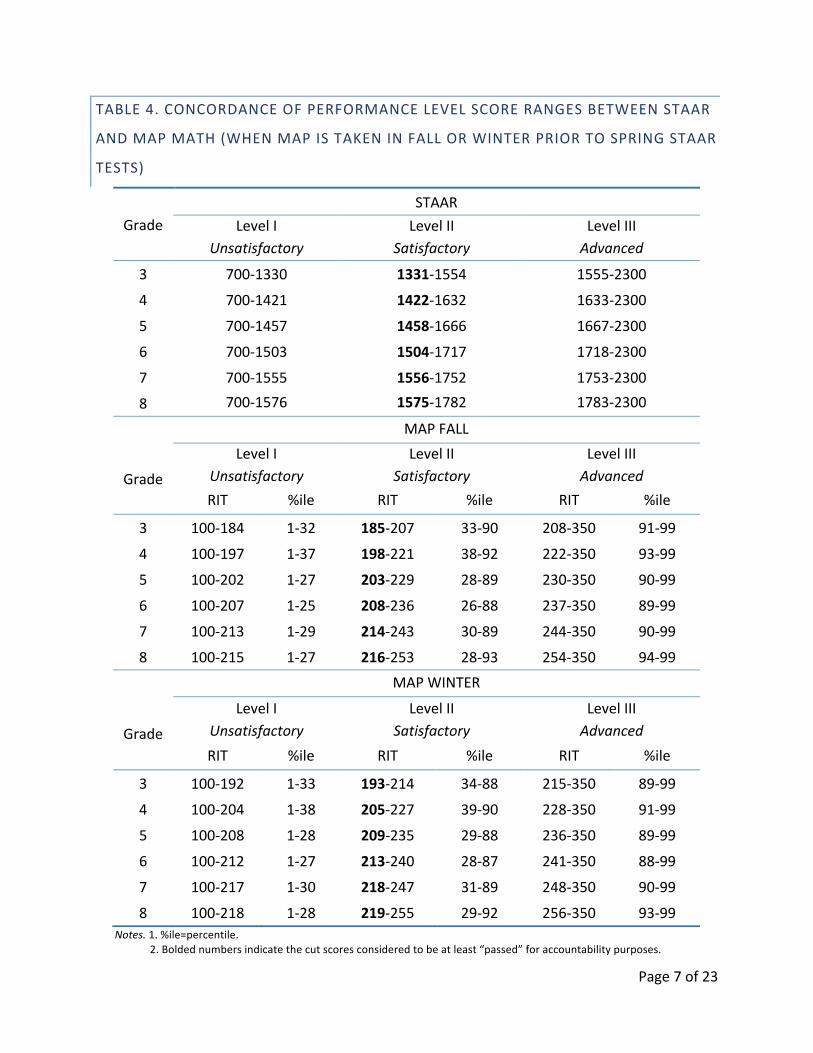
TABLE 4. CONCORDANCE OF PERFORMANCE LEVEL SCORE RANGES BETWEEN STAAR
AND MAP MATH (WHEN MAP IS TAKEN IN FALL OR WINTER PRIOR TO SPRING STAAR
TESTS)
Notes. 1. %ile=percentile. 2. Bolded numbers indicate the cut scores considered to be at least “passed” for accountability purposes.
Grade STAAR
Level I Unsatisfactory
Level II Satisfactory
Level III Advanced
3 700-‐1330 1331-‐1554 1555-‐2300
4 700-‐1421 1422-‐1632 1633-‐2300
5 700-‐1457 1458-‐1666 1667-‐2300
6 700-‐1503 1504-‐1717 1718-‐2300
7 700-‐1555 1556-‐1752 1753-‐2300
8 700-‐1576 1575-‐1782 1783-‐2300 MAP FALL
Grade Level I
Unsatisfactory Level II
Satisfactory Level III Advanced
RIT %ile RIT %ile RIT %ile
3 100-‐184 1-‐32 185-‐207 33-‐90 208-‐350 91-‐99
4 100-‐197 1-‐37 198-‐221 38-‐92 222-‐350 93-‐99
5 100-‐202 1-‐27 203-‐229 28-‐89 230-‐350 90-‐99
6 100-‐207 1-‐25 208-‐236 26-‐88 237-‐350 89-‐99
7 100-‐213 1-‐29 214-‐243 30-‐89 244-‐350 90-‐99
8 100-‐215 1-‐27 216-‐253 28-‐93 254-‐350 94-‐99 MAP WINTER
Grade Level I
Unsatisfactory Level II
Satisfactory Level III Advanced
RIT %ile RIT %ile RIT %ile
3 100-‐192 1-‐33 193-‐214 34-‐88 215-‐350 89-‐99
4 100-‐204 1-‐38 205-‐227 39-‐90 228-‐350 91-‐99
5 100-‐208 1-‐28 209-‐235 29-‐88 236-‐350 89-‐99
6 100-‐212 1-‐27 213-‐240 28-‐87 241-‐350 88-‐99
7 100-‐217 1-‐30 218-‐247 31-‐89 248-‐350 90-‐99
8 100-‐218 1-‐28 219-‐255 29-‐92 256-‐350 93-‐99

Page 8 of 23
Consistency Rate of Classification
Consistency rate of classification (Pommerich, Hanson, Harris, & Sconing, 2004), expressed in the form of a rate between 0 and 1, provides a means to measure the departure from equity for concordances (Hanson et al., 2001). This index can also be used as an indicator for the predictive validity of the MAP tests, i.e., how accurately the MAP scores can predict a student’s proficiency status in the STAAR test. For each pair of concordant scores, a classification is considered consistent if the examinee is classified into the same performance category regardless of the test used for making a decision. Consistency rate provided in this report can be calculated as, for the “passed” performance category concordant scores, the percentage of examinees who score at or above both concordant scores plus the percentage of examinees who score below both concordant scores on each test. Higher consistency rate indicates stronger congruence between STAAR and MAP cut scores. The results in Table 5 demonstrate that MAP reading scores can consistently classify students’ proficiency (Level II or higher) status on STAAR reading test 85-‐90% of the time and MAP math scores can consistently classify students on STAAR math test 81-‐92% of the time. Those numbers are high suggesting that both MAP reading and math tests are great predictors of the students’ proficiency status on the STAAR tests.
TABLE 5. CONSISTENCY RATE OF CLASSIFICATION FOR MAP AND STAAR LEVEL II
EQUIPERCENTILE CONCORDANCES
Grade Reading Math
Consistency Rate
False Consistency Rate
False Positives Negatives Positives Negatives
3 0.90 0.05 0.05 0.89 0.06 0.03 4 0.89 0.06 0.05 0.90 0.06 0.04 5 0.89 0.05 0.06 0.92 0.05 0.03 6 0.88 0.06 0.06 0.88 0.07 0.05 7 0.87 0.07 0.06 0.88 0.07 0.05 8 0.85 0.07 0.08 0.81 0.09 0.10
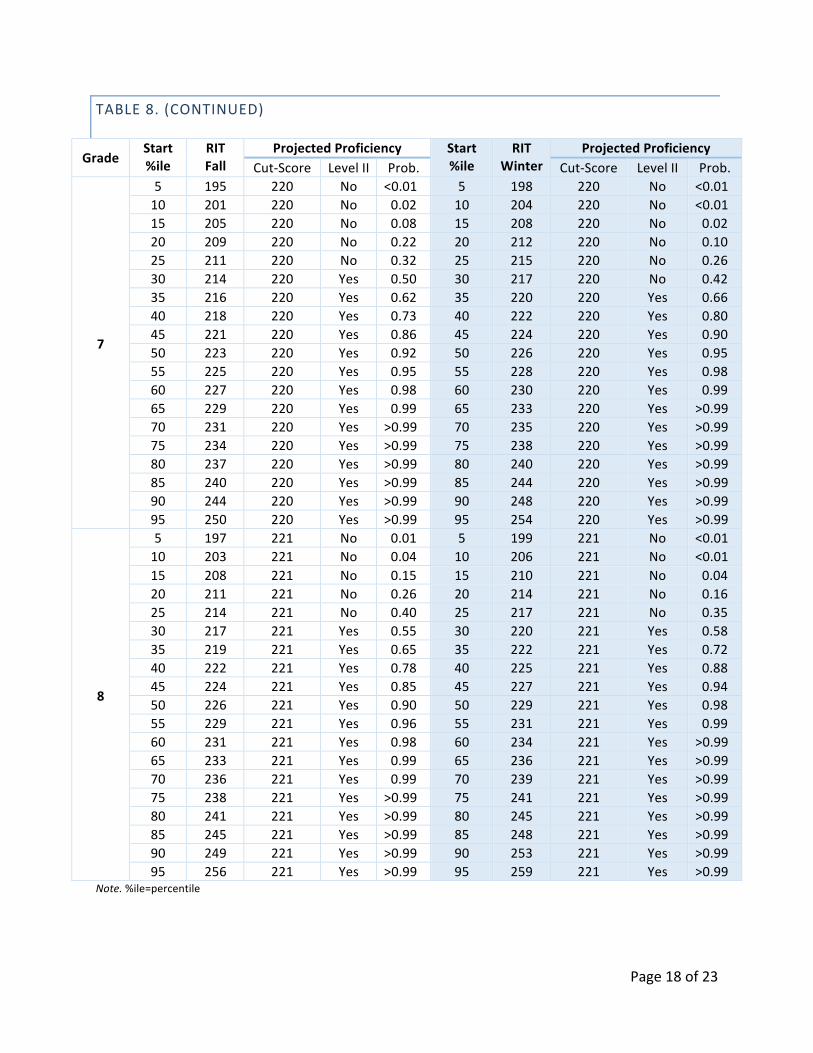
Proficiency Projection
Proficiency projection tells how likely a student is classified as “passed” on STAAR tests based on his/her observed MAP scores. The conditional growth norms provided in the 2015 MAP Norms were used to calculate this information (Thum & Hauser, 2015). The results of proficiency projection and corresponding probability of achieving “passed” on the STAAR tests are presented

Page 9 of 23
in Tables 6 to 8. These tables estimate the probability of scoring at Level II or above on STAAR in the spring and the prior fall or winter testing season. For example, if a 3rd grade student obtained a MAP math score of 190 in the fall, the probability of obtaining a Level II or higher STAAR score in the spring of 3rd grade is 78%. Table 6 presents the estimated probability of meeting Level II benchmark when MAP is taken in the spring, whereas Tables 7 and 8 present the estimated probability of meeting Level II benchmark when MAP is taken in the fall or winter prior to taking the STAAR tests.

Page 10 of 23
TABLE 6. PROFICIENCY PROJECTION AND PROBABILITY FOR PASSING STAAR LEVEL II (SATISFACTORY) WHEN MAP IS TAKEN IN THE SPRING
Grade
Reading Math
Start %ile
RIT Spring
Projected Proficiency Start %ile
RIT Spring
Projected Proficiency
Cut Score Level II Prob. Cut Score Level II Prob.
3
5 174 192 No <0.01 5 181 198 No <0.01 10 179 192 No <0.01 10 186 198 No <0.01 15 183 192 No <0.01 15 189 198 No <0.01 20 186 192 No 0.03 20 192 198 No 0.02 25 188 192 No 0.11 25 194 198 No 0.08 30 191 192 No 0.38 30 196 198 No 0.25 35 193 192 Yes 0.62 35 198 198 Yes 0.50 40 195 192 Yes 0.83 40 200 198 Yes 0.75 45 197 192 Yes 0.94 45 202 198 Yes 0.92 50 199 192 Yes 0.99 50 203 198 Yes 0.96 55 201 192 Yes >0.99 55 205 198 Yes 0.99 60 202 192 Yes >0.99 60 207 198 Yes >0.99 65 204 192 Yes >0.99 65 209 198 Yes >0.99 70 207 192 Yes >0.99 70 211 198 Yes >0.99 75 209 192 Yes >0.99 75 213 198 Yes >0.99 80 211 192 Yes >0.99 80 215 198 Yes >0.99 85 214 192 Yes >0.99 85 218 198 Yes >0.99 90 218 192 Yes >0.99 90 221 198 Yes >0.99 95 223 192 Yes >0.99 95 226 198 Yes >0.99
4
5 181 201 No <0.01 5 189 210 No <0.01 10 187 201 No <0.01 10 194 210 No <0.01 15 190 201 No <0.01 15 198 210 No <0.01 20 193 201 No 0.01 20 201 210 No <0.01 25 196 201 No 0.06 25 203 210 No 0.01 30 198 201 No 0.17 30 206 210 No 0.08 35 200 201 No 0.38 35 208 210 No 0.25 40 202 201 Yes 0.62 40 210 210 Yes 0.50 45 204 201 Yes 0.83 45 212 210 Yes 0.75 50 206 201 Yes 0.94 50 213 210 Yes 0.85 55 208 201 Yes 0.99 55 215 210 Yes 0.96 60 210 201 Yes >0.99 60 217 210 Yes 0.99 65 212 201 Yes >0.99 65 219 210 Yes >0.99 70 214 201 Yes >0.99 70 221 210 Yes >0.99 75 216 201 Yes >0.99 75 224 210 Yes >0.99 80 218 201 Yes >0.99 80 226 210 Yes >0.99 85 221 201 Yes >0.99 85 229 210 Yes >0.99 90 225 201 Yes >0.99 90 233 210 Yes >0.99 95 230 201 Yes >0.99 95 238 210 Yes >0.99

Page 11 of 23
TABLE 6. (CONTINUED)
Grade
Reading Math
Start %ile
RIT Spring
Projected Proficiency Start %ile
RIT Spring
Projected Proficiency
Cut Score Level II Prob. Cut Score Level II Prob.
5
5 188 206 No <0.01 5 195 213 No <0.01 10 193 206 No <0.01 10 201 213 No <0.01 15 197 206 No <0.01 15 205 213 No <0.01 20 199 206 No 0.01 20 208 213 No 0.04 25 202 206 No 0.11 25 210 213 No 0.15 30 204 206 No 0.27 30 213 213 Yes 0.50 35 206 206 Yes 0.50 35 215 213 Yes 0.75 40 208 206 Yes 0.73 40 217 213 Yes 0.92 45 210 206 Yes 0.89 45 219 213 Yes 0.98 50 212 206 Yes 0.97 50 221 213 Yes >0.99 55 214 206 Yes 0.99 55 223 213 Yes >0.99 60 216 206 Yes >0.99 60 225 213 Yes >0.99 65 217 206 Yes >0.99 65 228 213 Yes >0.99 70 220 206 Yes >0.99 70 230 213 Yes >0.99 75 222 206 Yes >0.99 75 232 213 Yes >0.99 80 224 206 Yes >0.99 80 235 213 Yes >0.99 85 227 206 Yes >0.99 85 238 213 Yes >0.99 90 231 206 Yes >0.99 90 242 213 Yes >0.99 95 236 206 Yes >0.99 95 248 213 Yes >0.99
6
5 192 206 No <0.01 5 198 216 No <0.01 10 197 206 No <0.01 10 204 216 No <0.01 15 201 206 No 0.06 15 208 216 No <0.01 20 203 206 No 0.17 20 211 216 No 0.04 25 206 206 Yes 0.50 25 214 216 No 0.25 30 208 206 Yes 0.73 30 217 216 Yes 0.63 35 210 206 Yes 0.89 35 219 216 Yes 0.85 40 212 206 Yes 0.97 40 221 216 Yes 0.96 45 214 206 Yes 0.99 45 223 216 Yes 0.99 50 216 206 Yes >0.99 50 225 216 Yes >0.99 55 218 206 Yes >0.99 55 227 216 Yes >0.99 60 219 206 Yes >0.99 60 230 216 Yes >0.99 65 221 206 Yes >0.99 65 232 216 Yes >0.99 70 223 206 Yes >0.99 70 234 216 Yes >0.99 75 226 206 Yes >0.99 75 237 216 Yes >0.99 80 228 206 Yes >0.99 80 239 216 Yes >0.99 85 231 206 Yes >0.99 85 243 216 Yes >0.99 90 235 206 Yes >0.99 90 247 216 Yes >0.99 95 240 206 Yes >0.99 95 253 216 Yes >0.99

Page 12 of 23
TABLE 6. (CONTINUED)
Grade
Reading Math
Start %ile
RIT Spring
Projected Proficiency Start %ile
RIT Spring
Projected Proficiency
Cut Score Level II Prob. Cut Score Level II Prob.
7
5 193 209 No <0.01 5 199 220 No <0.01 10 199 209 No <0.01 10 206 220 No <0.01 15 202 209 No 0.01 15 210 220 No <0.01 20 205 209 No 0.11 20 214 220 No 0.02 25 208 209 No 0.38 25 217 220 No 0.15 30 210 209 Yes 0.62 30 219 220 No 0.37 35 212 209 Yes 0.83 35 222 220 Yes 0.75 40 214 209 Yes 0.94 40 224 220 Yes 0.92 45 216 209 Yes 0.99 45 226 220 Yes 0.98 50 218 209 Yes >0.99 50 229 220 Yes >0.99 55 220 209 Yes >0.99 55 231 220 Yes >0.99 60 222 209 Yes >0.99 60 233 220 Yes >0.99 65 224 209 Yes >0.99 65 235 220 Yes >0.99 70 226 209 Yes >0.99 70 238 220 Yes >0.99 75 228 209 Yes >0.99 75 241 220 Yes >0.99 80 231 209 Yes >0.99 80 244 220 Yes >0.99 85 234 209 Yes >0.99 85 247 220 Yes >0.99 90 238 209 Yes >0.99 90 251 220 Yes >0.99 95 243 209 Yes >0.99 95 258 220 Yes >0.99
8
5 194 209 No <0.01 5 199 221 No <0.01 10 200 209 No <0.01 10 206 221 No <0.01 15 204 209 No 0.06 15 211 221 No <0.01 20 207 209 No 0.27 20 215 221 No 0.02 25 209 209 Yes 0.50 25 218 221 No 0.15 30 212 209 Yes 0.83 30 221 221 Yes 0.50 35 214 209 Yes 0.94 35 224 221 Yes 0.85 40 216 209 Yes 0.99 40 226 221 Yes 0.96 45 218 209 Yes >0.99 45 229 221 Yes >0.99 50 220 209 Yes >0.99 50 231 221 Yes >0.99 55 222 209 Yes >0.99 55 233 221 Yes >0.99 60 224 209 Yes >0.99 60 236 221 Yes >0.99 65 226 209 Yes >0.99 65 238 221 Yes >0.99 70 228 209 Yes >0.99 70 241 221 Yes >0.99 75 231 209 Yes >0.99 75 244 221 Yes >0.99 80 233 209 Yes >0.99 80 247 221 Yes >0.99 85 236 209 Yes >0.99 85 251 221 Yes >0.99 90 240 209 Yes >0.99 90 255 221 Yes >0.99 95 246 209 Yes >0.99 95 262 221 Yes >0.99
Note. %ile=percentile

Page 13 of 23
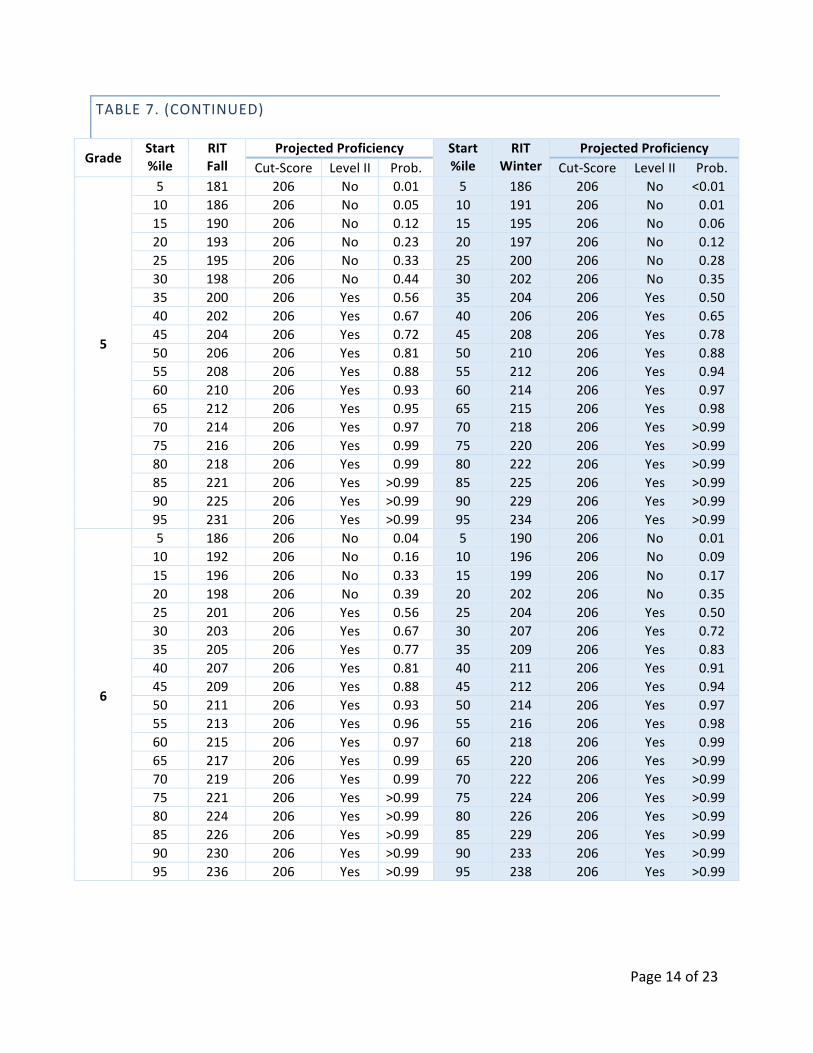
ABLE 7. PROFICIENCY PROJECTION AND PROBABILITY FOR PASSING STAAR READING LEVEL II (SATISFACTORY) WHEN MAP IS TAKEN IN THE FALL OR WINTER PRIOR TO SPRING STAAR TESTS
Grade Start %ile
RIT Fall
Projected Proficiency Start %ile
RIT Winter
Projected Proficiency Cut Score Level II Prob. Cut Score Level II Prob.
3
5 162 192 No 0.02 5 171 192 No <0.01 10 168 192 No 0.08 10 176 192 No 0.01 15 172 192 No 0.16 15 180 192 No 0.06 20 175 192 No 0.24 20 183 192 No 0.17 25 178 192 No 0.39 25 185 192 No 0.28 30 180 192 Yes 0.50 30 188 192 Yes 0.50 35 182 192 Yes 0.56 35 190 192 Yes 0.58 40 184 192 Yes 0.66 40 192 192 Yes 0.72 45 186 192 Yes 0.76 45 194 192 Yes 0.83 50 188 192 Yes 0.80 50 196 192 Yes 0.91 55 190 192 Yes 0.87 55 198 192 Yes 0.96 60 192 192 Yes 0.92 60 199 192 Yes 0.97 65 194 192 Yes 0.94 65 201 192 Yes 0.99 70 197 192 Yes 0.97 70 204 192 Yes >0.99 75 199 192 Yes 0.99 75 206 192 Yes >0.99 80 202 192 Yes 0.99 80 208 192 Yes >0.99 85 205 192 Yes >0.99 85 211 192 Yes >0.99 90 209 192 Yes >0.99 90 215 192 Yes >0.99 95 214 192 Yes >0.99 95 221 192 Yes >0.99
4
5 173 201 No 0.01 5 179 201 No <0.01 10 178 201 No 0.04 10 184 201 No 0.01 15 182 201 No 0.09 15 188 201 No 0.02 20 185 201 No 0.18 20 191 201 No 0.08 25 188 201 No 0.27 25 194 201 No 0.22 30 190 201 No 0.38 30 196 201 No 0.35 35 192 201 Yes 0.50 35 198 201 Yes 0.50 40 194 201 Yes 0.56 40 200 201 Yes 0.65 45 196 201 Yes 0.67 45 202 201 Yes 0.72 50 198 201 Yes 0.77 50 204 201 Yes 0.84 55 200 201 Yes 0.82 55 205 201 Yes 0.88 60 202 201 Yes 0.88 60 207 201 Yes 0.94 65 204 201 Yes 0.93 65 209 201 Yes 0.98 70 206 201 Yes 0.96 70 211 201 Yes 0.99 75 209 201 Yes 0.98 75 214 201 Yes >0.99 80 211 201 Yes 0.99 80 216 201 Yes >0.99 85 214 201 Yes >0.99 85 219 201 Yes >0.99 90 218 201 Yes >0.99 90 223 201 Yes >0.99 95 224 201 Yes >0.99 95 228 201 Yes >0.99
Page 14 of 23
TABLE 7. (CONTINUED)
Grade Start %ile
RIT Fall
Projected Proficiency Start %ile
RIT Winter
Projected Proficiency Cut-‐Score Level II Prob. Cut-‐Score Level II Prob.
5
5 181 206 No 0.01 5 186 206 No <0.01 10 186 206 No 0.05 10 191 206 No 0.01 15 190 206 No 0.12 15 195 206 No 0.06 20 193 206 No 0.23 20 197 206 No 0.12 25 195 206 No 0.33 25 200 206 No 0.28 30 198 206 No 0.44 30 202 206 No 0.35 35 200 206 Yes 0.56 35 204 206 Yes 0.50 40 202 206 Yes 0.67 40 206 206 Yes 0.65 45 204 206 Yes 0.72 45 208 206 Yes 0.78 50 206 206 Yes 0.81 50 210 206 Yes 0.88 55 208 206 Yes 0.88 55 212 206 Yes 0.94 60 210 206 Yes 0.93 60 214 206 Yes 0.97 65 212 206 Yes 0.95 65 215 206 Yes 0.98 70 214 206 Yes 0.97 70 218 206 Yes >0.99 75 216 206 Yes 0.99 75 220 206 Yes >0.99 80 218 206 Yes 0.99 80 222 206 Yes >0.99 85 221 206 Yes >0.99 85 225 206 Yes >0.99 90 225 206 Yes >0.99 90 229 206 Yes >0.99 95 231 206 Yes >0.99 95 234 206 Yes >0.99
6
5 186 206 No 0.04 5 190 206 No 0.01 10 192 206 No 0.16 10 196 206 No 0.09 15 196 206 No 0.33 15 199 206 No 0.17 20 198 206 No 0.39 20 202 206 No 0.35 25 201 206 Yes 0.56 25 204 206 Yes 0.50 30 203 206 Yes 0.67 30 207 206 Yes 0.72 35 205 206 Yes 0.77 35 209 206 Yes 0.83 40 207 206 Yes 0.81 40 211 206 Yes 0.91 45 209 206 Yes 0.88 45 212 206 Yes 0.94 50 211 206 Yes 0.93 50 214 206 Yes 0.97 55 213 206 Yes 0.96 55 216 206 Yes 0.98 60 215 206 Yes 0.97 60 218 206 Yes 0.99 65 217 206 Yes 0.99 65 220 206 Yes >0.99 70 219 206 Yes 0.99 70 222 206 Yes >0.99 75 221 206 Yes >0.99 75 224 206 Yes >0.99 80 224 206 Yes >0.99 80 226 206 Yes >0.99 85 226 206 Yes >0.99 85 229 206 Yes >0.99 90 230 206 Yes >0.99 90 233 206 Yes >0.99 95 236 206 Yes >0.99 95 238 206 Yes >0.99

Page 15 of 23
TABLE 7. (CONTINUED)
Grade Start %ile
RIT Fall
Projected Proficiency Start %ile
RIT Winter
Projected Proficiency Cut-‐Score Level II Prob. Cut-‐Score Level II Prob.
7
5 189 209 No 0.03 5 192 209 No <0.01 10 195 209 No 0.12 10 198 209 No 0.04 15 199 209 No 0.28 15 201 209 No 0.12 20 202 209 No 0.39 20 204 209 No 0.28 25 204 209 Yes 0.50 25 207 209 Yes 0.50 30 206 209 Yes 0.61 30 209 209 Yes 0.65 35 209 209 Yes 0.72 35 211 209 Yes 0.78 40 211 209 Yes 0.81 40 213 209 Yes 0.83 45 213 209 Yes 0.88 45 215 209 Yes 0.91 50 214 209 Yes 0.90 50 217 209 Yes 0.96 55 216 209 Yes 0.93 55 219 209 Yes 0.98 60 218 209 Yes 0.96 60 221 209 Yes 0.99 65 220 209 Yes 0.98 65 223 209 Yes >0.99 70 222 209 Yes 0.99 70 225 209 Yes >0.99 75 225 209 Yes >0.99 75 227 209 Yes >0.99 80 227 209 Yes >0.99 80 230 209 Yes >0.99 85 230 209 Yes >0.99 85 232 209 Yes >0.99 90 234 209 Yes >0.99 90 236 209 Yes >0.99 95 240 209 Yes >0.99 95 242 209 Yes >0.99
8
5 191 209 No 0.06 5 194 209 No 0.01 10 197 209 No 0.22 10 199 209 No 0.07 15 201 209 No 0.35 15 203 209 No 0.23 20 204 209 Yes 0.50 20 206 209 No 0.43 25 207 209 Yes 0.60 25 209 209 Yes 0.57 30 209 209 Yes 0.69 30 211 209 Yes 0.71 35 211 209 Yes 0.78 35 213 209 Yes 0.82 40 213 209 Yes 0.81 40 215 209 Yes 0.90 45 215 209 Yes 0.87 45 217 209 Yes 0.95 50 217 209 Yes 0.92 50 219 209 Yes 0.98 55 219 209 Yes 0.95 55 221 209 Yes 0.99 60 221 209 Yes 0.96 60 223 209 Yes >0.99 65 223 209 Yes 0.98 65 225 209 Yes >0.99 70 225 209 Yes 0.99 70 227 209 Yes >0.99 75 228 209 Yes 0.99 75 229 209 Yes >0.99 80 230 209 Yes >0.99 80 232 209 Yes >0.99 85 234 209 Yes >0.99 85 235 209 Yes >0.99 90 237 209 Yes >0.99 90 239 209 Yes >0.99 95 243 209 Yes >0.99 95 244 209 Yes >0.99
Note. %ile=percentile

Page 16 of 23
TABLE 8. PROFICIENCY PROJECTION AND PROBABILITY FOR PASSING STAAR MATH LEVEL II (SATISFACTORY) WHEN MAP IS TAKEN IN THE FALL OR WINTER PRIOR TO SPRING STAAR TESTS
Grade Start %ile
RIT Fall
Projected Proficiency Start %ile
RIT Winter
Projected Proficiency Cut Score Level II Prob. Cut Score Level II Prob.
3
5 169 198 No 0.01 5 176 198 No <0.01 10 174 198 No 0.06 10 181 198 No 0.01 15 177 198 No 0.14 15 184 198 No 0.05 20 179 198 No 0.22 20 187 198 No 0.10 25 182 198 No 0.38 25 189 198 No 0.20 30 184 198 No 0.44 30 191 198 No 0.34 35 185 198 Yes 0.50 35 193 198 Yes 0.50 40 187 198 Yes 0.62 40 195 198 Yes 0.66 45 189 198 Yes 0.73 45 197 198 Yes 0.80 50 190 198 Yes 0.78 50 198 198 Yes 0.86 55 192 198 Yes 0.86 55 200 198 Yes 0.93 60 194 198 Yes 0.92 60 202 198 Yes 0.97 65 195 198 Yes 0.94 65 203 198 Yes 0.98 70 197 198 Yes 0.97 70 205 198 Yes 0.99 75 199 198 Yes 0.98 75 207 198 Yes >0.99 80 201 198 Yes 0.99 80 209 198 Yes >0.99 85 204 198 Yes >0.99 85 212 198 Yes >0.99 90 207 198 Yes >0.99 90 215 198 Yes >0.99 95 212 198 Yes >0.99 95 220 198 Yes >0.99
4
5 179 210 No <0.01 5 185 210 No <0.01 10 184 210 No 0.01 10 190 210 No <0.01 15 188 210 No 0.06 15 194 210 No 0.01 20 190 210 No 0.11 20 197 210 No 0.05 25 193 210 No 0.22 25 199 210 No 0.10 30 195 210 No 0.32 30 201 210 No 0.20 35 197 210 No 0.44 35 203 210 No 0.34 40 198 210 Yes 0.50 40 205 210 Yes 0.50 45 200 210 Yes 0.62 45 207 210 Yes 0.66 50 202 210 Yes 0.73 50 209 210 Yes 0.80 55 204 210 Yes 0.83 55 211 210 Yes 0.90 60 205 210 Yes 0.83 60 212 210 Yes 0.93 65 207 210 Yes 0.89 65 214 210 Yes 0.97 70 209 210 Yes 0.94 70 216 210 Yes 0.99 75 211 210 Yes 0.97 75 218 210 Yes >0.99 80 214 210 Yes 0.99 80 221 210 Yes >0.99 85 216 210 Yes >0.99 85 223 210 Yes >0.99 90 220 210 Yes >0.99 90 227 210 Yes >0.99 95 225 210 Yes >0.99 95 232 210 Yes >0.99

Page 17 of 23
TABLE 8. (CONTINUED)
Grade Start %ile
RIT Fall
Projected Proficiency Start %ile
RIT Winter
Projected Proficiency Cut-‐Score Level II Prob. Cut-‐Score Level II Prob.
5
5 187 213 No 0.01 5 192 213 No <0.01 10 193 213 No 0.07 10 198 213 No 0.01 15 196 213 No 0.15 15 201 213 No 0.05 20 199 213 No 0.28 20 204 213 No 0.15 25 202 213 No 0.44 25 207 213 No 0.34 30 204 213 Yes 0.56 30 209 213 Yes 0.50 35 206 213 Yes 0.67 35 211 213 Yes 0.66 40 208 213 Yes 0.77 40 213 213 Yes 0.80 45 210 213 Yes 0.85 45 215 213 Yes 0.89 50 211 213 Yes 0.88 50 217 213 Yes 0.95 55 213 213 Yes 0.93 55 219 213 Yes 0.98 60 215 213 Yes 0.96 60 221 213 Yes 0.99 65 217 213 Yes 0.98 65 223 213 Yes >0.99 70 219 213 Yes 0.99 70 225 213 Yes >0.99 75 221 213 Yes >0.99 75 228 213 Yes >0.99 80 224 213 Yes >0.99 80 230 213 Yes >0.99 85 227 213 Yes >0.99 85 233 213 Yes >0.99 90 230 213 Yes >0.99 90 237 213 Yes >0.99 95 236 213 Yes >0.99 95 242 213 Yes >0.99
6
5 192 216 No 0.01 5 196 216 No <0.01 10 198 216 No 0.07 10 202 216 No 0.01 15 202 216 No 0.19 15 205 216 No 0.05 20 205 216 No 0.33 20 209 216 No 0.20 25 207 216 No 0.44 25 211 216 No 0.34 30 209 216 Yes 0.56 30 214 216 Yes 0.58 35 212 216 Yes 0.72 35 216 216 Yes 0.73 40 214 216 Yes 0.81 40 218 216 Yes 0.85 45 216 216 Yes 0.88 45 220 216 Yes 0.93 50 218 216 Yes 0.93 50 222 216 Yes 0.97 55 220 216 Yes 0.96 55 224 216 Yes 0.99 60 222 216 Yes 0.98 60 226 216 Yes >0.99 65 224 216 Yes 0.99 65 228 216 Yes >0.99 70 226 216 Yes >0.99 70 230 216 Yes >0.99 75 228 216 Yes >0.99 75 233 216 Yes >0.99 80 231 216 Yes >0.99 80 236 216 Yes >0.99 85 234 216 Yes >0.99 85 239 216 Yes >0.99 90 238 216 Yes >0.99 90 243 216 Yes >0.99 95 243 216 Yes >0.99 95 248 216 Yes >0.99
Page 18 of 23
TABLE 8. (CONTINUED)
Grade Start %ile
RIT Fall
Projected Proficiency Start %ile
RIT Winter
Projected Proficiency Cut-‐Score Level II Prob. Cut-‐Score Level II Prob.
7
5 195 220 No <0.01 5 198 220 No <0.01 10 201 220 No 0.02 10 204 220 No <0.01 15 205 220 No 0.08 15 208 220 No 0.02 20 209 220 No 0.22 20 212 220 No 0.10 25 211 220 No 0.32 25 215 220 No 0.26 30 214 220 Yes 0.50 30 217 220 No 0.42 35 216 220 Yes 0.62 35 220 220 Yes 0.66 40 218 220 Yes 0.73 40 222 220 Yes 0.80 45 221 220 Yes 0.86 45 224 220 Yes 0.90 50 223 220 Yes 0.92 50 226 220 Yes 0.95 55 225 220 Yes 0.95 55 228 220 Yes 0.98 60 227 220 Yes 0.98 60 230 220 Yes 0.99 65 229 220 Yes 0.99 65 233 220 Yes >0.99 70 231 220 Yes >0.99 70 235 220 Yes >0.99 75 234 220 Yes >0.99 75 238 220 Yes >0.99 80 237 220 Yes >0.99 80 240 220 Yes >0.99 85 240 220 Yes >0.99 85 244 220 Yes >0.99 90 244 220 Yes >0.99 90 248 220 Yes >0.99 95 250 220 Yes >0.99 95 254 220 Yes >0.99
8
5 197 221 No 0.01 5 199 221 No <0.01 10 203 221 No 0.04 10 206 221 No <0.01 15 208 221 No 0.15 15 210 221 No 0.04 20 211 221 No 0.26 20 214 221 No 0.16 25 214 221 No 0.40 25 217 221 No 0.35 30 217 221 Yes 0.55 30 220 221 Yes 0.58 35 219 221 Yes 0.65 35 222 221 Yes 0.72 40 222 221 Yes 0.78 40 225 221 Yes 0.88 45 224 221 Yes 0.85 45 227 221 Yes 0.94 50 226 221 Yes 0.90 50 229 221 Yes 0.98 55 229 221 Yes 0.96 55 231 221 Yes 0.99 60 231 221 Yes 0.98 60 234 221 Yes >0.99 65 233 221 Yes 0.99 65 236 221 Yes >0.99 70 236 221 Yes 0.99 70 239 221 Yes >0.99 75 238 221 Yes >0.99 75 241 221 Yes >0.99 80 241 221 Yes >0.99 80 245 221 Yes >0.99 85 245 221 Yes >0.99 85 248 221 Yes >0.99 90 249 221 Yes >0.99 90 253 221 Yes >0.99 95 256 221 Yes >0.99 95 259 221 Yes >0.99
Note. %ile=percentile

Page 19 of 23
Summary and Discussion
This study produced a set of cut scores on MAP reading and math tests for Grades 3 to 8 that correspond to each STAAR performance level. By using matched score data from a sample of students from Texas, the study demonstrates that MAP scores can accurately predict whether a student could be proficient or above on the basis of his/her MAP scores. This study also used the 2015 NWEA norming study results to project a student’s probability to meet proficiency based on that student’s prior MAP scores in fall and winter. These results will help educators predict student performance in STAAR tests as early as possible and identify those students who are at risk of failing to meet required standards so that they can receive necessary resources and assistance to meet their goals.
While concordance tables can be helpful and informative, they have general limitations. First, the concordance tables provide information about score comparability on different tests, but the scores cannot be assumed to be interchangeable. In the case for STAAR and MAP tests, as they are not parallel in content, scores from these two tests should not be directly compared. Second, while the sample data used in this study were collected from 147 schools in Texas, cautions should be exercised when generalizing the results to test takers who differ significantly from this sample. Finally, cautions should also be exercised if the concorded scores are used for a subpopulation. NWEA will continue to gather information about STAAR performance from other schools in Texas to enhance the quality and generalizability of the study.

Page 20 of 23
References
Hanson, B. A., Harris, D. J., Pommerich, M., Sconing, J. A., & Yi, Q. (2001). Suggestions for the evaluation and use of concordance results. (ACT Research Report No. 2001-‐1). Iowa City, IA: ACT, Inc.
Kolen, M. J., & Brennan, R. L. (2004). Test equating, scaling, and linking. New York: Springer.
Pommerich, M., Hanson, B., Harris, D., & Sconing, J. (2004). Issues in conducting linkage between distinct tests. Applied Psychological Measurement, 28(4), 247-‐273.
Texas Education Agency (2015). Technical Digest for the academic year 2014-‐2015. Austin, TX: TE Agency.
Thum Y. M., & Hauser, C. H. (2015). NWEA 2015 MAP Norms for Student and School Achievement Status and Growth. NWEA Research Report. Portland, OR: NWEA.

Page 21 of 23
Appendix
Data and Analysis
Data
Data used in this study were collected from 147 schools in Texas. The sample contained matched STAAR and MAP reading scores of 50,108 students in Grades 3 to 8 and matched STAAR and MAP math scores of 46,987 students in Grades 3 to 8 who completed both MAP and STAAR in the spring of 2015.
To understand the statistical characteristics of the test scores, descriptive statistics are provided in Table A1 below. As Table A1 indicates, the correlation coefficients between MAP and STAAR reading scores range from 0.75 to 0.82, and the correlation coefficients between MAP and STAAR math scores range from 0.76 to 0.87. In general, all these correlations indicate a strong relationship between MAP and STAAR test scores.
TABLE A1. DESCRIPTIVE STATISTICS OF THE SAMPLE DATA
STAAR MAP Subject Grade N r Mean SD Min Max Mean SD Min Max
Reading
3 8,750 0.82 1464 148.26 1026 1911 204 15.16 143 248 4 8,736 0.82 1548 150.91 1047 1995 212 15.14 134 259 5 8,627 0.78 1595 145.94 1110 2025 218 14.10 140 270 6 8,451 0.79 1623 139.78 1178 2074 218 16.50 143 261 7 8,403 0.78 1664 133.51 1295 2140 221 17.45 140 264 8 7,141 0.75 1696 133.39 1178 2156 223 17.26 143 283
Math
3 8,838 0.84 1486 154.28 1033 1921 210 13.36 145 283 4 8,844 0.87 1569 153.21 1191 2065 222 15.47 138 290 5 8,634 0.87 1639 151.22 1189 2091 230 16.45 155 298 6 8,160 0.84 1647 145.49 1024 2189 229 16.00 146 278 7 8,256 0.86 1678 140.65 1015 2229 234 18.19 145 312 8 4,255 0.76 1633 97.65 1315 2103 228 15.88 164 293

Page 22 of 23
Equipercentile Linking Procedure
The equipercentile procedure (e.g., Kolen & Brennan, 2004) was used to establish the concordance relationship between STAAR and MAP scores for grades 3 to 8 in reading and math. This procedure matches scores on the two scales that have the same percentile rank (i.e., the proportion of scores at or below each score).
Suppose we need to establish the concorded scores between two tests. 𝑥 is a score on Test 𝑋 (e.g., STAAR). Its equipercentile equivalent score on Test 𝑌 (e.g., MAP), 𝑒& 𝑥 , can be obtained through a cumulative-‐distribution-‐based linking function defined in Equation (A1):
𝑒& 𝑥 = 𝐺*+[𝑃 𝑥 ] (A1)
where 𝑒& 𝑥 is the equipercentile equivalent of scores on STAAR on the scale of MAP, 𝑃 𝑥 is the percentile rank of a given score on Test 𝑋. 𝐺*+ is the inverse of the percentile rank function for scores on Test 𝑌 which indicates the scores on Test 𝑌 corresponding to a given percentile. Polynomial loglinear pre-‐smoothing was applied to reduce irregularities of the frequency distributions as well as equipercentile linking curve.
Consistency rate of Classification
Consistency rate of classification accuracy, expressed in the form of a rate between 0 and 1, measures the extent to which MAP scores (and the estimated MAP cut scores) accurately predicted whether students in the sample would pass (i.e., Level II or higher) on STAAR tests.
To calculate consistency rate of classification, sample students were designated “Below STAAR cut” or “At or above STAAR cut” based on their actual STAAR scores. Similarly, they were also designated as “Below MAP cut” or “At or above MAP cut” based on their actual MAP scores. A 2-‐way contingency table was then tabulated (see Table A2), classifying students as “Passed” on the basis of STAAR cut score and concordant MAP cut score. Students classified in the true positive (TP) category were those predicted to be Passed based on the MAP cut scores and were also classified as Passed based on the STAAR cut scores. Students classified in the true negative (TN) category were those predicted to be Not Passed based on the MAP cut scores and were also classified as Not Passed based on the STAAR cut scores. Students classified in the false positive (FP) category were those predicted to be Passed based on the MAP cut scores but were classified as Not Passed based on the STAAR cut scores. Students classified in the false negative (FN) category were those predicated to be Not Passed based on the MAP cut scores but were classified as Passed based on the STAAR cut scores. The overall consistency rate of classification was computed as the proportion of correct classifications among the entire sample by (TP+TN) / (TP+TN+FP+FN).

Page 23 of 23
TABLE A2. DEFINITION OF CONSISTENCY RATE FOR STAAR TO MAP CONCORDANCE
STAAR Score
Below STAAR cut At or Above STAAR cut
MAP Score Below MAP cut True Negaqve False Posiqve
At or Above MAP cut False Negaqve True Posiqve Note. Shaded cells are summed to compute the consistency rate.
Proficiency Projection
MAP conditional growth norms provide student’s expected gain scores across testing seasons (Thum & Hauser, 2015). This information is utilized to predict a student’s performance on the STAAR based on that student’s MAP scores in prior seasons (e.g. fall and winter). The probability of a student achieving Level II (Passed) on STAAR, based on his/her fall or winter MAP score is given in Equation (A2):
𝑃𝑟 𝐴𝑐ℎ𝑖𝑒𝑣𝑒𝑖𝑛𝑔 𝐿𝑒𝑣𝑒𝑙 𝐼𝐼 𝑖𝑛 𝑠𝑝𝑟𝑖𝑛𝑔 𝑎 𝑅𝐼𝑇 𝑠𝑐𝑜𝑟𝑒 𝑜𝑓 𝑥) = 1 − Φ 𝑥 + 𝑔 − 𝑐
𝑆𝐷 (𝐴2)
where, Φ is a standardized normal cumulative distribution, 𝑥 is the student’s RIT score in fall or winter, 𝑔 is the expected growth from fall or winter to spring corresponding to 𝑥, 𝑐 is the MAP cut-‐score for spring, and 𝑆𝐷 is the conditional standard deviation of growth from fall or winter to spring.
For the probability of a student achieving Level II on the STAAR tests, based on his/her spring score 𝑠, it can be calculated by Equation (A3):
𝑃𝑟 𝐴𝑐ℎ𝑖𝑒𝑣𝑒𝑖𝑛𝑔 𝐿𝑒𝑣𝑒𝑙 𝐼𝐼 𝑖𝑛 𝑠𝑝𝑟𝑖𝑛𝑔 𝑎 𝑅𝐼𝑇 𝑠𝑐𝑜𝑟𝑒 𝑜𝑓 𝑠 𝑖𝑛 𝑠𝑝𝑟𝑖𝑛𝑔) = 1 − Φ 𝑠 − 𝑐𝑆𝐸 (𝐴3)
where SE is the standard error of measurement for MAP reading or math test.
Founded by educators nearly 40 years ago, Northwest Evaluation Association (NWEA) is a global not-‐for-‐profit educational services organization known for our flagship interim assessment, Measures of Academic Progress (MAP). More than 7,800 partners in U.S. schools, school districts, education agencies, and international schools trust us to offer pre-‐kindergarten through grade 12 assessments that accurately measure student growth and learning needs, professional development that fosters educators’ ability to accelerate student learning, and research that supports assessment validity and data interpretation. To better inform instruction and maximize every learner’s academic growth, educators currently use NWEA assessments with nearly eight million students.
© Northwest Evaluation Association 2016. Measures of Academic Progress, MAP, and Partnering to help all kids learn are registered trademarks of Northwest Evaluation Association in the U.S. and in other countries. Northwest Evaluation Association and NWEA are trademarks of Northwest Evaluation Association in the U.S. and in other countries. The names of other companies and their products mentioned are the trademarks of their respective owners.