trucks and twin cities traffic management
TRANSCRIPT
2005-21Final Report
Trucks and Twin Cities Traffic Management
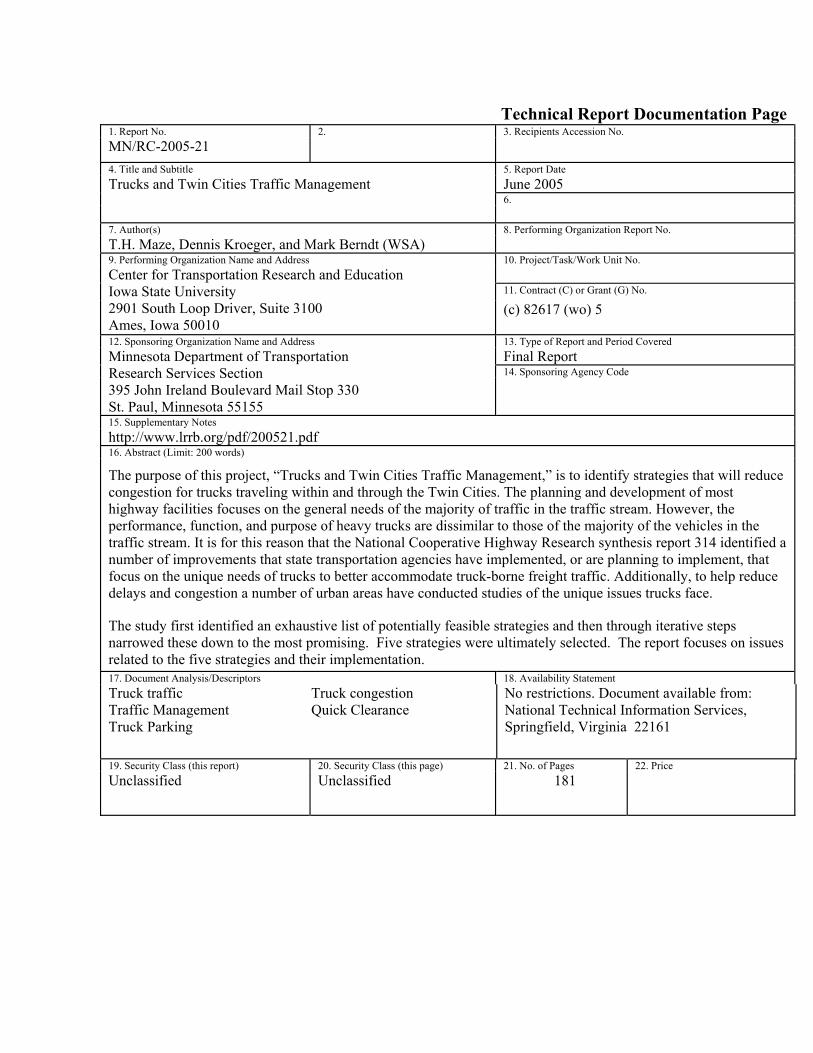
Technical Report Documentation Page 1. Report No. 2. 3. Recipients Accession No. MN/RC-2005-21 4. Title and Subtitle 5. Report Date
June 2005 6.
Trucks and Twin Cities Traffic Management
7. Author(s) 8. Performing Organization Report No. T.H. Maze, Dennis Kroeger, and Mark Berndt (WSA) 9. Performing Organization Name and Address 10. Project/Task/Work Unit No.
11. Contract (C) or Grant (G) No.
Center for Transportation Research and Education Iowa State University 2901 South Loop Driver, Suite 3100 Ames, Iowa 50010
(c) 82617 (wo) 5
12. Sponsoring Organization Name and Address 13. Type of Report and Period Covered Final Report 14. Sponsoring Agency Code
Minnesota Department of Transportation Research Services Section 395 John Ireland Boulevard Mail Stop 330 St. Paul, Minnesota 55155
15. Supplementary Notes http://www.lrrb.org/pdf/200521.pdf 16. Abstract (Limit: 200 words)
The purpose of this project, “Trucks and Twin Cities Traffic Management,” is to identify strategies that will reduce congestion for trucks traveling within and through the Twin Cities. The planning and development of most highway facilities focuses on the general needs of the majority of traffic in the traffic stream. However, the performance, function, and purpose of heavy trucks are dissimilar to those of the majority of the vehicles in the traffic stream. It is for this reason that the National Cooperative Highway Research synthesis report 314 identified a number of improvements that state transportation agencies have implemented, or are planning to implement, that focus on the unique needs of trucks to better accommodate truck-borne freight traffic. Additionally, to help reduce delays and congestion a number of urban areas have conducted studies of the unique issues trucks face.
The study first identified an exhaustive list of potentially feasible strategies and then through iterative steps narrowed these down to the most promising. Five strategies were ultimately selected. The report focuses on issues related to the five strategies and their implementation. 17. Document Analysis/Descriptors 18. Availability Statement Truck traffic Traffic Management Truck Parking
Truck congestion Quick Clearance
No restrictions. Document available from: National Technical Information Services, Springfield, Virginia 22161
19. Security Class (this report) 20. Security Class (this page) 21. No. of Pages 22. Price Unclassified Unclassified 181
Twin Cities Truck Traffic Management
Final Report
Prepared by: T.H. Maze
Dennis Kroeger Mark J. Berndt
Department of Civil Engineering
Iowa State University
&
Wilbur Smith Associate
June 2005
Published by: Minnesota Department of Transportation
Research Services Section 395 John Ireland Boulevard, MS 330
St. Paul, Minnesota 55155-1899
This report represents the results of research conducted by the authors and does not necessarily represent the views or policies of the Minnesota Department of Transportation and/or the Center for Transportation Studies. This report does not contain a standard or specified technique.
The authors and the Minnesota Department of Transportation and/or Center for Transportation Studies do not endorse products or manufacturers. Trade or manufacturers’ names appear herein solely because they are considered essential to this report.
Table of Contents
Chapter 1............................................................................................................................. 1
Project Objectives ........................................................................................................... 1
Research Steps ................................................................................................................ 2
Report Organization........................................................................................................ 7
Chapter 2............................................................................................................................. 8
Outline of Minnesota Guidance for Planning, Designing, Specifying, and Maintaining
Transportation Facilities around Heavy Truck Traffic Generators............................... 11
Relationship to Mn/DOT Performance Measures and Goals ....................................... 13
Relationship to Mn/DOT and Mn/DOT Partners ......................................................... 13
Implementation Strategy............................................................................................... 13
Chapter 3........................................................................................................................... 15
Description.................................................................................................................... 15
Importance of Unexpected Delay ................................................................................. 15
Legislation Enabling Quick Clearance ......................................................................... 17
Driver Stop Law........................................................................................................ 18 Driver Removal Law................................................................................................. 19 Authority Removal Law ........................................................................................... 19 Authority Tow Law................................................................................................... 20 Unique Aspects of Implementing a Strategy in the Twin Cities .............................. 21 Relationship to Agency Performance Measures ....................................................... 21 Relationship to On–going Mn/DOT Programs ......................................................... 21
Implementation ............................................................................................................. 22
Benefits ..................................................................................................................... 22 Costs.......................................................................................................................... 22
Recommendations......................................................................................................... 22
Chapter 4........................................................................................................................... 24
Description.................................................................................................................... 24
Characterizing the Issues .............................................................................................. 24
Experiences in Other States .......................................................................................... 25
Unique Aspects of Increasing Truck Parking in the Twin Cities ................................. 28
Parking Location and Quality ....................................................................................... 30
Relationship to Performance Measures and Goal......................................................... 33
Relationship to Ongoing Mn/DOT Programs............................................................... 34
Implementation Plan ..................................................................................................... 34
Benefits of Providing Additional Truck Parking.......................................................... 35
Costs.............................................................................................................................. 36
Institutional, Political, and Policy Issues ...................................................................... 37
Chapter 5........................................................................................................................... 38
Description.................................................................................................................... 38
Unique Aspects of the Twin Cities Metropolitan Area ................................................ 38
Relationships to Ongoing Mn/DOT Programs ............................................................. 41
Other Experience with Guide Signs.............................................................................. 43
Benefits ......................................................................................................................... 43
Costs.............................................................................................................................. 43
Institution and Policy Issues ......................................................................................... 43
Chapter 6........................................................................................................................... 44
Description.................................................................................................................... 44
Deceleration Lanes ....................................................................................................... 44
Relationships to Ongoing Mn/DOT Programs ............................................................. 50
Implementation ............................................................................................................. 50
Cost ............................................................................................................................... 50
Benefits ......................................................................................................................... 51
Institution and Policy Issues ......................................................................................... 51
Chapter 7........................................................................................................................... 52
References...........................................................................................................................53

Appendix A..............................................................................................................A-1 Appendix B..............................................................................................................B-1 Appendix C..............................................................................................................C-1 Appendix D..............................................................................................................D-1 Appendix E..............................................................................................................E-1
List of Figures
Figure 2-1. Wheel ruts in a median with an inadequate turning radius for trucks.............. 8 Figure 2-2. Terminal with inadequate maneuvering and parking space........................... 10 Figure 2-3. Trucks queuing on roadway............................................................................10 Figure 4-1. Top of Iowa Welcome Center, Worth County, Iowa ..................................... 26 Figure 4-2. Twin Cities catchment area of origins ........................................................... 29 Figure 4-3. Parking at commercial truck stops or travel plazas around the Twin Cities.. 32 Figure 4-4. Truck tire tracks on ramp shoulder ................................................................ 33 Figure 4-5. States with length of stay regulations............................................................. 35 Figure 5-1. Diamond interchange at Lexington Avenue and I-494 .................................. 38 Figure 5-2. Folded diamond interchange at Dodd Road and I-494 .................................. 39 Figure 5-3. Advance guide sign on Dodd Road, south of I-494 ....................................... 40 Figure 5-4. Guidance signage at south ramp terminal intersection .................................. 40 Figure 5-5. Sign guiding west-bound traffic to the right lane........................................... 41 Figure 5-6. MUTCD typical layout for guide signs on the approach to a folded diamond
interchange................................................................................................................ 42 Figure 6-1 Deceleration lanes at the intersection of four-lane and two-lane highways.... 45 Figure 6-2. Free right acceleration lane ............................................................................ 46 Figure 6-3. Left-turn median acceleration lanes ............................................................... 48
List of Tables
Table 1-1. Strategies eliminated by researchers ................................................................. 3 Table 1-2. Top-ranking strategies ....................................................................................... 4 Table 1-3. Lower priority strategies.................................................................................... 5 Table 3-1. States with incident clearance laws ................................................................. 21 Table 4-1. Summary of recent or current actions pursued by state partners..................... 27 Table 4-2. Truck parking space use, Sunday to Friday..................................................... 31 Table 4-3. Goals and goal measurements of the Minnesota FAC .................................... 34 Table 6-1. Minnesota median acceleration lane locations ................................................ 49
Executive Summary
The purpose of this project, “Trucks and Twin Cities Traffic Management,” is to identify strategies that will reduce congestion for trucks traveling within and through the Twin Cities. The planning and development of most highway facilities focuses on the general needs of the majority of traffic in the traffic stream. However, the performance, function, and purpose of heavy trucks are dissimilar to those of the majority of the vehicles in the traffic stream. It is for this reason that the National Cooperative Highway Research synthesis report 314 identified a number of improvements that state transportation agencies have implemented, or are planning to implement that focus on the unique needs of trucks to better accommodate truck-borne freight traffic. Additionally, to help reduce delays and congestion a number of urban areas have conducted studies of the unique issues trucks face. This study identified several strategies and then winnowed the strategies down to the few that meet the unique needs of the Twin Cities highway system. The steps used in this process included the following:
1. A search to find viable strategies 2. Interviews with Twin Cities transportation professionals to discover additional
strategies while eliminating some that did not fit the requirements of the Twin Cities
3. A survey of the motor carrier industry to determine which attributes of the highway system presented them with the greatest challenges
4. The development of a list of 23 candidate strategies 5. The prioritization of candidates through a focus group of private and public
stakeholders This resulted in the following five high-priority strategies:
1. Development of Minnesota guidance for planning, design, specifying, and maintaining transportation facilities around heavy truck traffic generators
2. Outreach to explore legislation to hold the Minnesota Department of Transportation (Mn/DOT) and enforcement agencies harmless from liability when conducting Quick Clearance activities
3. Achievement of increases in commercial vehicle parking supplies on the urban fringe.
4. Improved advanced guide signage for freeway entrances 5. Longer, truck-friendly acceleration and deceleration lanes
1
Chapter 1 Introduction
This document reports on a research project conducted to identify strategies for reducing congestion and improving safety for trucks traveling in and through the Twin Cities. It is the intention of the project to identify a broad variety of new strategies and solutions, as well as strategies that have been used or proposed in other areas of the U.S., to reduce congestion that slows truck travel time and makes it unreliable. Once several strategies are identified, the project will winnow the strategies down to those that naturally fit the Twin Cities area. For selected strategies that present problematic institutional or policy issues, the project report will suggest steps to overcome these institutional barriers. To reach the project’s objective, several successive steps were involved. First, to make sure that all reasonable potential strategies were considered, the research gathered strategies broadly from the literature and through interviews with Twin Cities transportation professionals. The next step involved winnowing the possible strategies down to those that were the most promising. The final stage of the research was to develop a discussion of the issues related to the most promising strategies and issues associated with their implementation. The bulk of this report contains that discussion.
Project Objectives “The 2004 Urban Mobility Report,” prepared by the Texas Transportation Institute, reports on congestion in the nation’s urban areas and found that the Twin Cities metro area is one of the most congested areas for its population size in the United States [1]. When the Twin Cities are compared to urban areas of similar population size, the total delay (travel time above what it takes to complete a trip at free-flow speeds) falls in the top 25% of the most congested of its peer urban areas [2]. What is even more troublesome is that the growth in the congestion in the Twin Cities metro area places it in the top 20% of its peer urban areas. Hence, the unfortunate trend is that the Twin Cities are more congested than most of their peer urban areas and are getting increasingly more congested at a faster rate. High and quickly increasing congestion means that the cost of doing business in the Twin Cities is increasing faster than in comparable urban areas for companies that ship inbound and outbound goods by truck, for the costs of truck service, and for the unreliability of transit times. This places the Twin Cities at a competitive disadvantage when firms compare the cost of doing business in the Twin Cities or elsewhere. The objective of this project is to identify strategies that can be employed to reverse this trend. The National Cooperative Highway Research Program (NCHRP) synthesis report 314 identified a number of strategies that could be employed to better manage traffic congestion and improve efficiency of truck traffic movements. The types of strategies identified in the NCHRP synthesis 314 ranged from low-cost strategies, such as better signage, to institutional and public policy strategies, such as developing freight advisory committees for regional governments that ensure that planned transportation
2
improvements are sensitive to freight transportation issues, or high-cost infrastructure improvements, such as the construction of truck-only highway lanes to increase the truck movement capacity of the highway system [3]. In addition, a number of metropolitan areas and states have conducted studies focusing on better managing and improving the movement of trucks through urban areas like Atlanta, Philadelphia, and Oakland [4,5,6]. The objective of the research project, “Trucks and Twin Cities Traffic Management,” was to screen strategies proposed and/or applied in other urban areas, identify additional strategies unique to the Twin Cities that have not been implemented before, consider their deployment in the Twin Cities, and reduce the number of strategies to the most promising.
Research Steps The research project began by identifying strategies that could potentially be applied in the Twin Cities. This list was largely developed from strategies found in the literature and from telephone discussions with organizations identified in the literature that have experimented with strategies to reduce congestion and better manage truck traffic. The initial list contained 38 strategies and is included in Appendix A, along with a brief discussion of each strategy, locations where the strategy was deployed, a brief list of positive and negative attributes (pros/challenges), the environment where the strategy is most effective (operating environment), and examples of the strategies’ use (if available). To provide a framework for categorizing strategies with similar objectives, we adopted the following four categorizes used in the Atlanta study [4]:
• Operational strategies. Strategies that involve traffic operation and management solutions to reduce or mitigate truck-related congestion.
• Driver-oriented strategies. Issues that focus on providing drivers with better or more information and strategies that allow truck operators to better perform their driving.
• Capital investment strategies. Strategies that involve the construction of new facilities to improve truck traffic movements and congestion.
• Planning strategies. Strategies that focus on improvements to planning or changes in institutional or legal systems that will result in better capital programs or in operations resulting in reduced truck-related congestion.
The next step of the research involved collecting information specific to the Twin Cities to identify the applicability of strategies to the area. This was done through two mechanisms. The first was to conduct a survey of the Minnesota motor carrier industry to determine the trucking industry’s issues with the transportation system and traffic management in the Twin Cities area. The survey was conducted by distributing a written questionnaire to all Minnesota Trucking Association (MTA) members. The analysis of this questionnaire is included in Appendix B. The second mechanism was to interview transportation professionals in the Twin Cities to have them identify the most promising strategies and determine additional desirable strategies. The individuals interviewed are listed in Appendix C. Following the interviews, the list of strategies was modified to include the information from the interviews. Some were eliminated and new ones were
3
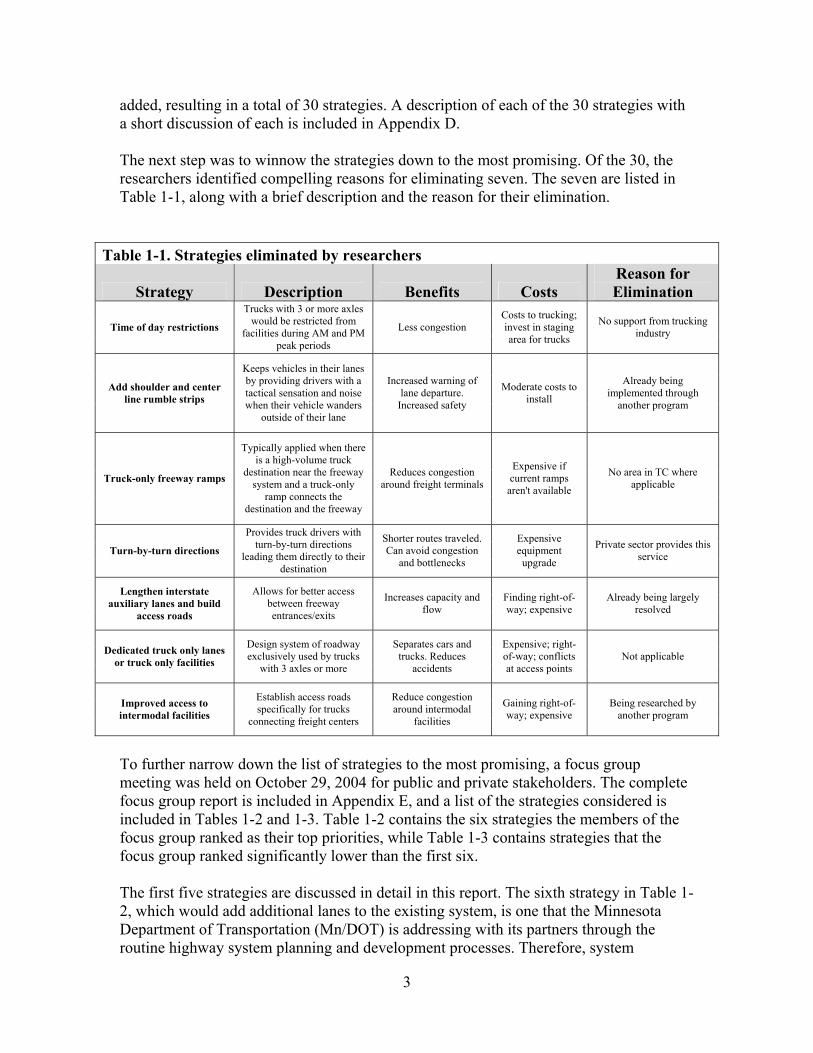
added, resulting in a total of 30 strategies. A description of each of the 30 strategies with a short discussion of each is included in Appendix D. The next step was to winnow the strategies down to the most promising. Of the 30, the researchers identified compelling reasons for eliminating seven. The seven are listed in Table 1-1, along with a brief description and the reason for their elimination.
Table 1-1. Strategies eliminated by researchers
Strategy Description Benefits Costs Reason for Elimination
Time of day restrictions
Trucks with 3 or more axles would be restricted from
facilities during AM and PM peak periods
Less congestion Costs to trucking; invest in staging area for trucks
No support from trucking industry
Add shoulder and center line rumble strips
Keeps vehicles in their lanes by providing drivers with a tactical sensation and noise when their vehicle wanders
outside of their lane
Increased warning of lane departure.
Increased safety
Moderate costs to install
Already being implemented through
another program
Truck-only freeway ramps
Typically applied when there is a high-volume truck
destination near the freeway system and a truck-only
ramp connects the destination and the freeway
Reduces congestion around freight terminals
Expensive if current ramps
aren't available
No area in TC where applicable
Turn-by-turn directions
Provides truck drivers with turn-by-turn directions
leading them directly to their destination
Shorter routes traveled. Can avoid congestion
and bottlenecks
Expensive equipment upgrade
Private sector provides this service
Lengthen interstate auxiliary lanes and build
access roads
Allows for better access between freeway entrances/exits
Increases capacity and flow
Finding right-of-way; expensive
Already being largely resolved
Dedicated truck only lanes or truck only facilities
Design system of roadway exclusively used by trucks
with 3 axles or more
Separates cars and trucks. Reduces
accidents
Expensive; right-of-way; conflicts at access points
Not applicable
Improved access to intermodal facilities
Establish access roads specifically for trucks
connecting freight centers
Reduce congestion around intermodal
facilities
Gaining right-of-way; expensive
Being researched by another program
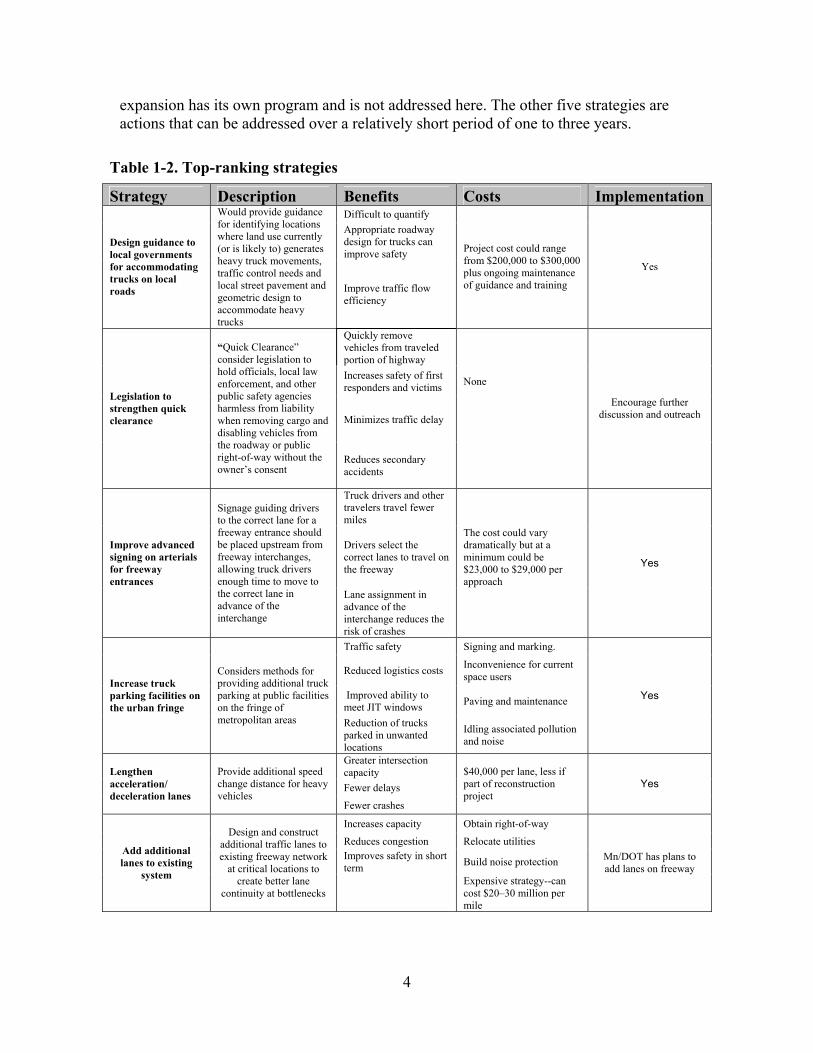
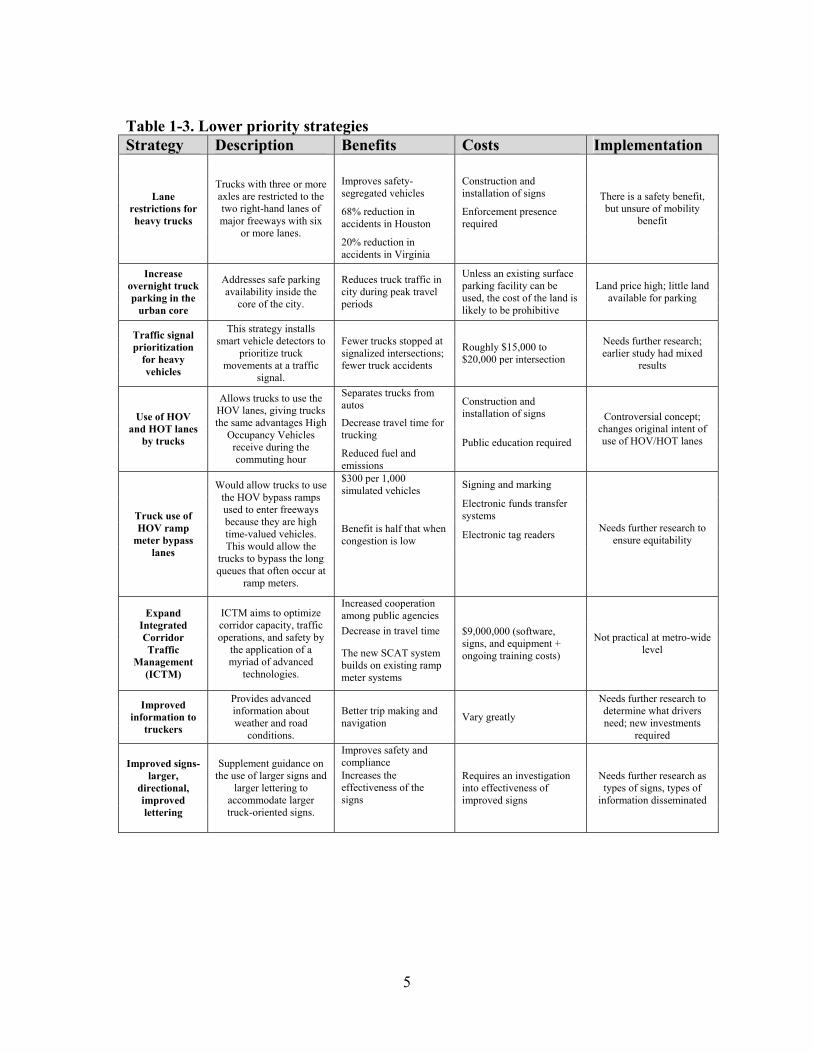
To further narrow down the list of strategies to the most promising, a focus group meeting was held on October 29, 2004 for public and private stakeholders. The complete focus group report is included in Appendix E, and a list of the strategies considered is included in Tables 1-2 and 1-3. Table 1-2 contains the six strategies the members of the focus group ranked as their top priorities, while Table 1-3 contains strategies that the focus group ranked significantly lower than the first six. The first five strategies are discussed in detail in this report. The sixth strategy in Table 1-2, which would add additional lanes to the existing system, is one that the Minnesota Department of Transportation (Mn/DOT) is addressing with its partners through the routine highway system planning and development processes. Therefore, system
4
expansion has its own program and is not addressed here. The other five strategies are actions that can be addressed over a relatively short period of one to three years.
Table 1-2. Top-ranking strategies
Strategy Description Benefits Costs ImplementationDifficult to quantify Appropriate roadway design for trucks can improve safety
Design guidance to local governments for accommodating trucks on local roads
Would provide guidance for identifying locations where land use currently (or is likely to) generates heavy truck movements, traffic control needs and local street pavement and geometric design to accommodate heavy trucks
Improve traffic flow efficiency
Project cost could range from $200,000 to $300,000 plus ongoing maintenance of guidance and training
Yes
Quickly remove vehicles from traveled portion of highway
Increases safety of first responders and victims None
Minimizes traffic delay
Legislation to strengthen quick clearance
“Quick Clearance” consider legislation to hold officials, local law enforcement, and other public safety agencies harmless from liability when removing cargo and disabling vehicles from the roadway or public right-of-way without the owner’s consent
Reduces secondary accidents
Encourage further discussion and outreach
Truck drivers and other travelers travel fewer miles
Drivers select the correct lanes to travel on the freeway
The cost could vary dramatically but at a minimum could be $23,000 to $29,000 per approach
Improve advanced signing on arterials for freeway entrances
Signage guiding drivers to the correct lane for a freeway entrance should be placed upstream from freeway interchanges, allowing truck drivers enough time to move to the correct lane in advance of the interchange
Lane assignment in advance of the interchange reduces the risk of crashes
Yes
Traffic safety Signing and marking.
Reduced logistics costs Inconvenience for current space users
Improved ability to meet JIT windows Paving and maintenance
Increase truck parking facilities on the urban fringe
Considers methods for providing additional truck parking at public facilities on the fringe of metropolitan areas Reduction of trucks
parked in unwanted locations
Idling associated pollution and noise
Yes
Greater intersection capacity Fewer delays
Lengthen acceleration/ deceleration lanes
Provide additional speed change distance for heavy vehicles
Fewer crashes
$40,000 per lane, less if part of reconstruction project
Yes
Increases capacity Obtain right-of-way
Reduces congestion Relocate utilities Improves safety in short term Build noise protection
Add additional lanes to existing
system
Design and construct additional traffic lanes to existing freeway network
at critical locations to create better lane
continuity at bottlenecks Expensive strategy--can cost $20–30 million per mile
Mn/DOT has plans to add lanes on freeway
5
Table 1-3. Lower priority strategies Strategy Description Benefits Costs Implementation
Improves safety-segregated vehicles
Construction and installation of signs
68% reduction in accidents in Houston
Enforcement presence required
Lane restrictions for heavy trucks
Trucks with three or more axles are restricted to the two right-hand lanes of major freeways with six
or more lanes. 20% reduction in accidents in Virginia
There is a safety benefit, but unsure of mobility
benefit
Increase overnight truck parking in the
urban core
Addresses safe parking availability inside the
core of the city.
Reduces truck traffic in city during peak travel periods
Unless an existing surface parking facility can be used, the cost of the land is likely to be prohibitive
Land price high; little land available for parking
Traffic signal prioritization
for heavy vehicles
This strategy installs smart vehicle detectors to
prioritize truck movements at a traffic
signal.
Fewer trucks stopped at signalized intersections; fewer truck accidents
Roughly $15,000 to $20,000 per intersection
Needs further research; earlier study had mixed
results
Separates trucks from autos Construction and
installation of signs Decrease travel time for trucking
Use of HOV and HOT lanes
by trucks
Allows trucks to use the HOV lanes, giving trucks the same advantages High
Occupancy Vehicles receive during the commuting hour Reduced fuel and
emissions
Public education required
Controversial concept; changes original intent of use of HOV/HOT lanes
$300 per 1,000 simulated vehicles Signing and marking
Electronic funds transfer systems
Benefit is half that when congestion is low Electronic tag readers
Truck use of HOV ramp
meter bypass lanes
Would allow trucks to use the HOV bypass ramps used to enter freeways because they are high time-valued vehicles. This would allow the
trucks to bypass the long queues that often occur at
ramp meters.
Needs further research to ensure equitability
Increased cooperation among public agencies Decrease in travel time
Expand Integrated Corridor Traffic
Management (ICTM)
ICTM aims to optimize corridor capacity, traffic operations, and safety by
the application of a myriad of advanced
technologies.
The new SCAT system builds on existing ramp meter systems
$9,000,000 (software, signs, and equipment + ongoing training costs)
Not practical at metro-wide level
Improved information to
truckers
Provides advanced information about weather and road
conditions.
Better trip making and navigation Vary greatly
Needs further research to determine what drivers need; new investments
required Improves safety and compliance Increases the effectiveness of the signs
Improved signs-larger,
directional, improved lettering
Supplement guidance on the use of larger signs and
larger lettering to accommodate larger truck-oriented signs.
Requires an investigation into effectiveness of improved signs
Needs further research as types of signs, types of
information disseminated
6
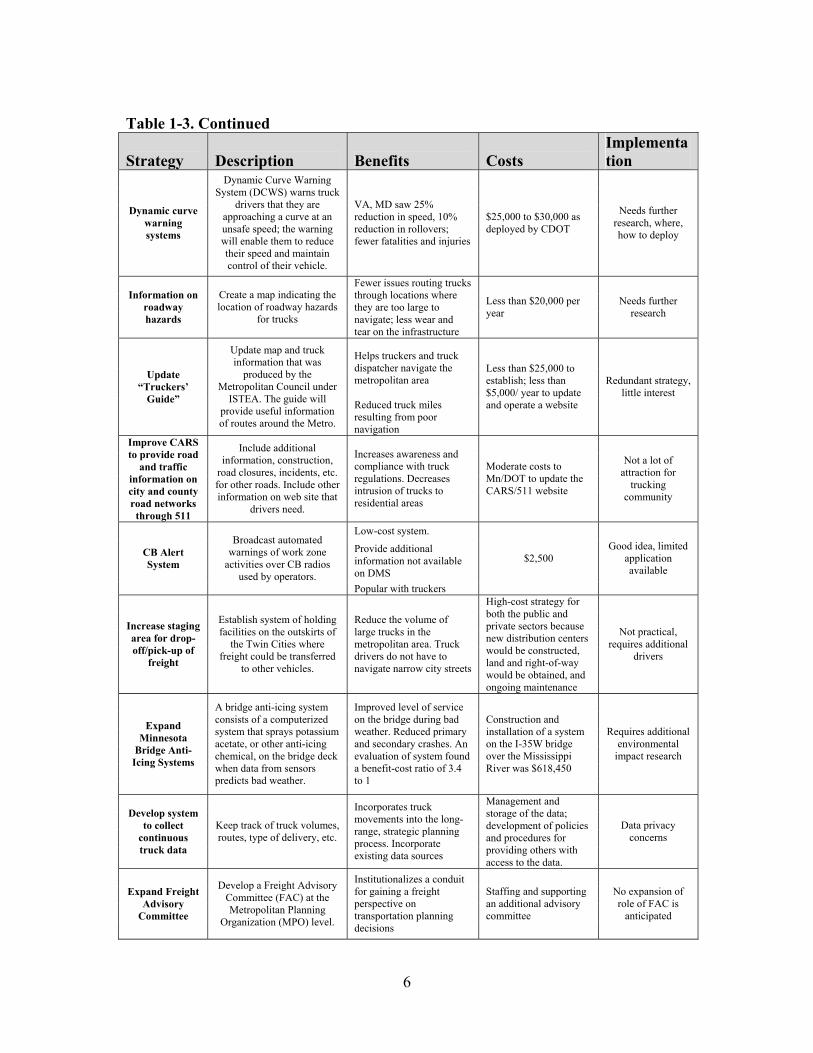
Table 1-3. Continued
Strategy Description Benefits Costs Implementation
Dynamic curve warning systems
Dynamic Curve Warning System (DCWS) warns truck
drivers that they are approaching a curve at an unsafe speed; the warning will enable them to reduce their speed and maintain control of their vehicle.
VA, MD saw 25% reduction in speed, 10% reduction in rollovers; fewer fatalities and injuries
$25,000 to $30,000 as deployed by CDOT
Needs further research, where, how to deploy
Information on roadway hazards
Create a map indicating the location of roadway hazards
for trucks
Fewer issues routing trucks through locations where they are too large to navigate; less wear and tear on the infrastructure
Less than $20,000 per year
Needs further research
Helps truckers and truck dispatcher navigate the metropolitan area Update
“Truckers’ Guide”
Update map and truck information that was
produced by the Metropolitan Council under
ISTEA. The guide will provide useful information of routes around the Metro.
Reduced truck miles resulting from poor navigation
Less than $25,000 to establish; less than $5,000/ year to update and operate a website
Redundant strategy, little interest
Improve CARS to provide road
and traffic information on city and county road networks
through 511
Include additional information, construction,
road closures, incidents, etc. for other roads. Include other information on web site that
drivers need.
Increases awareness and compliance with truck regulations. Decreases intrusion of trucks to residential areas
Moderate costs to Mn/DOT to update the CARS/511 website
Not a lot of attraction for
trucking community
Low-cost system.
Provide additional information not available on DMS
CB Alert System
Broadcast automated warnings of work zone
activities over CB radios used by operators.
Popular with truckers
$2,500 Good idea, limited
application available
Increase staging area for drop-off/pick-up of
freight
Establish system of holding facilities on the outskirts of
the Twin Cities where freight could be transferred
to other vehicles.
Reduce the volume of large trucks in the metropolitan area. Truck drivers do not have to navigate narrow city streets
High-cost strategy for both the public and private sectors because new distribution centers would be constructed, land and right-of-way would be obtained, and ongoing maintenance
Not practical, requires additional
drivers
Expand Minnesota
Bridge Anti-Icing Systems
A bridge anti-icing system consists of a computerized system that sprays potassium acetate, or other anti-icing chemical, on the bridge deck when data from sensors predicts bad weather.
Improved level of service on the bridge during bad weather. Reduced primary and secondary crashes. An evaluation of system found a benefit-cost ratio of 3.4 to 1
Construction and installation of a system on the I-35W bridge over the Mississippi River was $618,450
Requires additional environmental
impact research
Develop system to collect
continuous truck data
Keep track of truck volumes, routes, type of delivery, etc.
Incorporates truck movements into the long-range, strategic planning process. Incorporate existing data sources
Management and storage of the data; development of policies and procedures for providing others with access to the data.
Data privacy concerns
Expand Freight Advisory
Committee
Develop a Freight Advisory Committee (FAC) at the Metropolitan Planning
Organization (MPO) level.
Institutionalizes a conduit for gaining a freight perspective on transportation planning decisions
Staffing and supporting an additional advisory committee
No expansion of role of FAC is
anticipated

7
Report Organization This report consists of seven chapters (including this chapter) and an additional five appendices. Chapters 2 through 6 discuss the most promising strategies identified in Table 1-2. Each chapter describes one strategy and explains the issue the strategy is intended to solve or ameliorate, then discusses issues in implementing the strategy, such as the benefits and costs. Each chapter ends with recommendations intended to move the strategy toward implementation.
8
Chapter 2 Zoning and Roadway Design and Specification Guidance for Local
Governments in and around Heavy Truck Traffic Generators
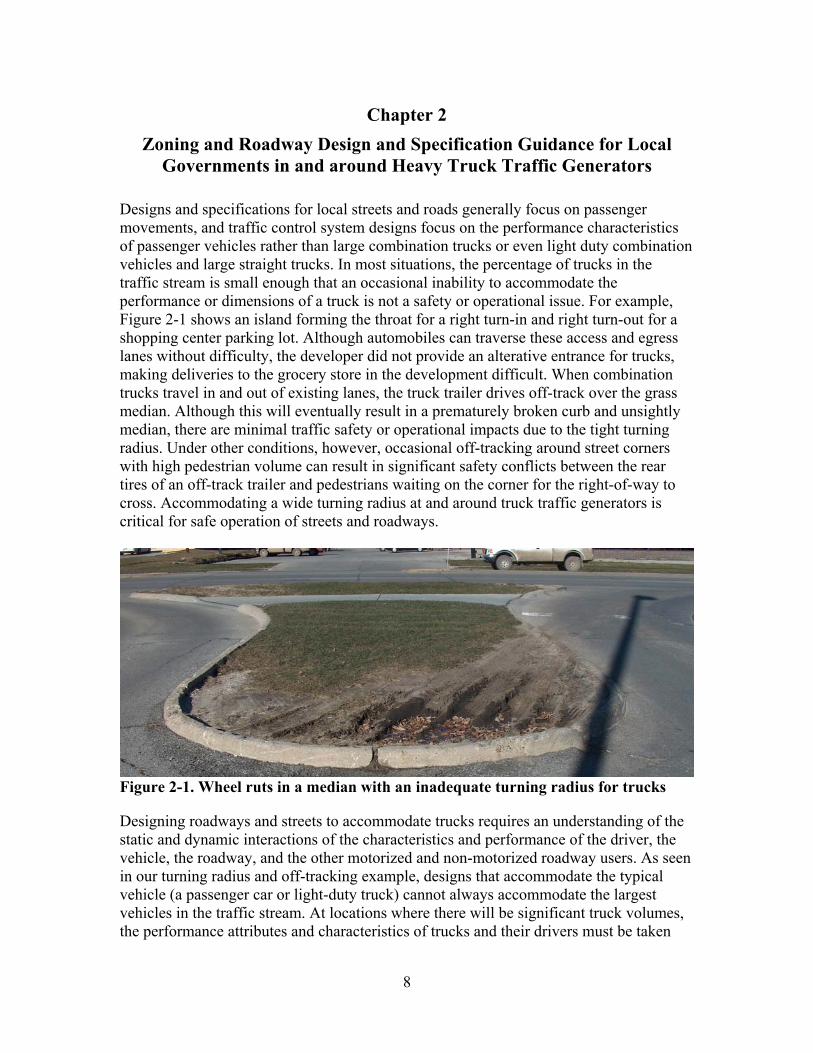
Designs and specifications for local streets and roads generally focus on passenger movements, and traffic control system designs focus on the performance characteristics of passenger vehicles rather than large combination trucks or even light duty combination vehicles and large straight trucks. In most situations, the percentage of trucks in the traffic stream is small enough that an occasional inability to accommodate the performance or dimensions of a truck is not a safety or operational issue. For example, Figure 2-1 shows an island forming the throat for a right turn-in and right turn-out for a shopping center parking lot. Although automobiles can traverse these access and egress lanes without difficulty, the developer did not provide an alterative entrance for trucks, making deliveries to the grocery store in the development difficult. When combination trucks travel in and out of existing lanes, the truck trailer drives off-track over the grass median. Although this will eventually result in a prematurely broken curb and unsightly median, there are minimal traffic safety or operational impacts due to the tight turning radius. Under other conditions, however, occasional off-tracking around street corners with high pedestrian volume can result in significant safety conflicts between the rear tires of an off-track trailer and pedestrians waiting on the corner for the right-of-way to cross. Accommodating a wide turning radius at and around truck traffic generators is critical for safe operation of streets and roadways.
Figure 2-1. Wheel ruts in a median with an inadequate turning radius for trucks
Designing roadways and streets to accommodate trucks requires an understanding of the static and dynamic interactions of the characteristics and performance of the driver, the vehicle, the roadway, and the other motorized and non-motorized roadway users. As seen in our turning radius and off-tracking example, designs that accommodate the typical vehicle (a passenger car or light-duty truck) cannot always accommodate the largest vehicles in the traffic stream. At locations where there will be significant truck volumes, the performance attributes and characteristics of trucks and their drivers must be taken
9
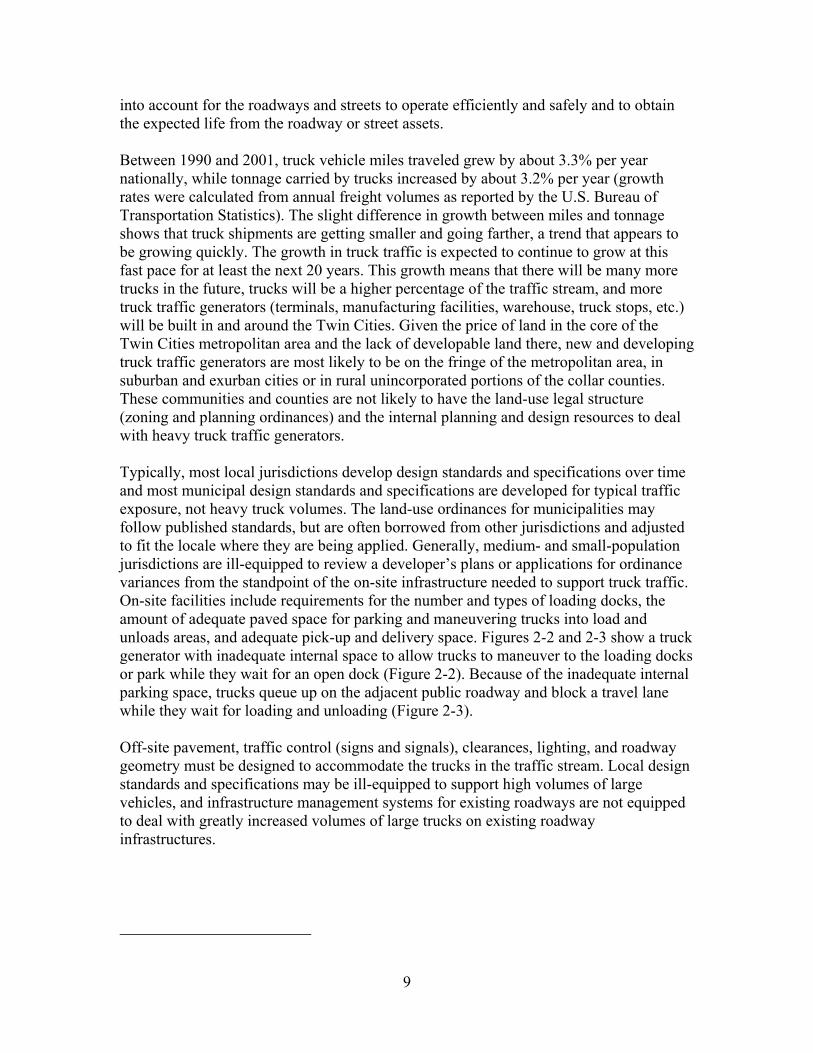
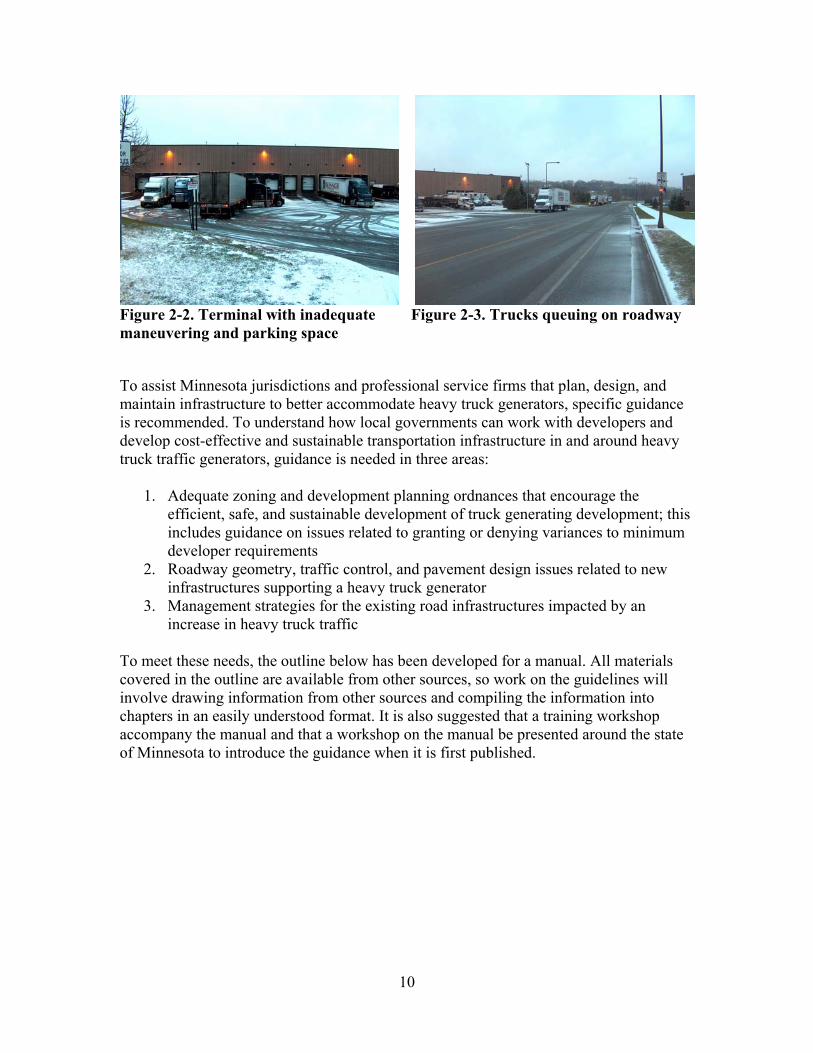
into account for the roadways and streets to operate efficiently and safely and to obtain the expected life from the roadway or street assets. Between 1990 and 2001, truck vehicle miles traveled grew by about 3.3% per year nationally, while tonnage carried by trucks increased by about 3.2% per year (growth rates were calculated from annual freight volumes as reported by the U.S. Bureau of Transportation Statistics). The slight difference in growth between miles and tonnage shows that truck shipments are getting smaller and going farther, a trend that appears to be growing quickly. The growth in truck traffic is expected to continue to grow at this fast pace for at least the next 20 years. This growth means that there will be many more trucks in the future, trucks will be a higher percentage of the traffic stream, and more truck traffic generators (terminals, manufacturing facilities, warehouse, truck stops, etc.) will be built in and around the Twin Cities. Given the price of land in the core of the Twin Cities metropolitan area and the lack of developable land there, new and developing truck traffic generators are most likely to be on the fringe of the metropolitan area, in suburban and exurban cities or in rural unincorporated portions of the collar counties. These communities and counties are not likely to have the land-use legal structure (zoning and planning ordinances) and the internal planning and design resources to deal with heavy truck traffic generators. Typically, most local jurisdictions develop design standards and specifications over time and most municipal design standards and specifications are developed for typical traffic exposure, not heavy truck volumes. The land-use ordinances for municipalities may follow published standards, but are often borrowed from other jurisdictions and adjusted to fit the locale where they are being applied. Generally, medium- and small-population jurisdictions are ill-equipped to review a developer’s plans or applications for ordinance variances from the standpoint of the on-site infrastructure needed to support truck traffic. On-site facilities include requirements for the number and types of loading docks, the amount of adequate paved space for parking and maneuvering trucks into load and unloads areas, and adequate pick-up and delivery space. Figures 2-2 and 2-3 show a truck generator with inadequate internal space to allow trucks to maneuver to the loading docks or park while they wait for an open dock (Figure 2-2). Because of the inadequate internal parking space, trucks queue up on the adjacent public roadway and block a travel lane while they wait for loading and unloading (Figure 2-3). Off-site pavement, traffic control (signs and signals), clearances, lighting, and roadway geometry must be designed to accommodate the trucks in the traffic stream. Local design standards and specifications may be ill-equipped to support high volumes of large vehicles, and infrastructure management systems for existing roadways are not equipped to deal with greatly increased volumes of large trucks on existing roadway infrastructures.
10
Figure 2-2. Terminal with inadequate Figure 2-3. Trucks queuing on roadway maneuvering and parking space
To assist Minnesota jurisdictions and professional service firms that plan, design, and maintain infrastructure to better accommodate heavy truck generators, specific guidance is recommended. To understand how local governments can work with developers and develop cost-effective and sustainable transportation infrastructure in and around heavy truck traffic generators, guidance is needed in three areas:
1. Adequate zoning and development planning ordnances that encourage the efficient, safe, and sustainable development of truck generating development; this includes guidance on issues related to granting or denying variances to minimum developer requirements
2. Roadway geometry, traffic control, and pavement design issues related to new infrastructures supporting a heavy truck generator
3. Management strategies for the existing road infrastructures impacted by an increase in heavy truck traffic
To meet these needs, the outline below has been developed for a manual. All materials covered in the outline are available from other sources, so work on the guidelines will involve drawing information from other sources and compiling the information into chapters in an easily understood format. It is also suggested that a training workshop accompany the manual and that a workshop on the manual be presented around the state of Minnesota to introduce the guidance when it is first published.
11
Outline of Minnesota Guidance for Planning, Designing, Specifying, and Maintaining Transportation Facilities around Heavy Truck Traffic Generators CHAPTER 1 – INTRODUCTION
• Introducing the purpose for the manual, providing guidance on the following: o Zoning and approval of development plans for new truck attractions o Roadway design issues for new and existing roadways to support the access to
truck attracting development o The impacts to existing bridges related to accommodating developments that
attract increased heavy truck traffic • Defining the relationship between the guidance in this manual and the design standards
and guidance offered in the State Aid Manual, Mn/DOT Design Standards, and AASHTO design guidance.
CHAPTER 2 – TRUCKING ISSUES
Identifying locations that have or are likely to experience significant growth in truck traffic volume. Identifying land use that is likely to attract significant numbers of trucks and estimate truck attraction.
Understanding and accommodate urban goods movement. Accommodating truck parking, delivery routes and maneuvering of larger vehicles, and the number of docks required to accommodate truck deliveries and other needed ancillary facilities.
Contemporary trucking issues, including truck staging and overnight parking issues, increases in smaller shipments and structural changes in the economy, vehicle size and weight regulation, and truck traffic growth and its impact on the community, the state, and the nation.
Understanding truck dimensions and performance regulations at the local, state, and federal levels. Cover such issues as Minnesota spring-load restrictions and Minnesota and federal vehicle bridge formula, axle load, and gross vehicle weight restrictions.
CHAPTER 3 – TRUCK CHARACTERISTICS
Understanding the hierarchy of truck dimensions and performance with respect to the use of truck and van types, ranging from large combination tractor-trailers used in truckload delivery, four- and five- combination tractor-trailer used mostly for terminal to terminal delivery and some warehouse and office delivery, and vans and small trucks used between break-bulk facilities and offices, retailers, and homes.
Defineing the vehicle characteristics and performance (acceleration, deceleration, noise, etc.) for large trucks, medium trucks, and vans.
Understanding the interaction between heavy vehicles and flexible and rigid pavement deterioration.
Understanding the interaction between heavy vehicles and bridge deterioration. Outlining trucking demands on roadway geometry and typical points of conflict. Defining truck driver characteristics, needs, and performance. Defining operational characteristics and challenges due to volume composition; driver
expectancy; peak hour demands; lane, ramp, and intersection capacities; weaving; and work zone issues.
12
CHAPTER 4 – TRUCKING TERMINALS AND ATTRACTIONS Compatible and complimentary land uses and interaction with neighboring commercial
and residential users. Identifying the characteristics and peak demands for typical facilities that attract high
truck traffic and the impacts these facilities have on adjacent roadway operations and safety.
Defining terminal and truck-stop operations and characteristics, number of attractions, peaking, and traffic operations issues.
Defining the orientation of these facilities to the roadway network. Establishing the need to predict the impact of such facilities and address how to
accommodate heavy truck operations in roadway design. Recommended development plan approval and zoning ordinance language at the local
level. The purpose of the guidance will be to create developments that contain adequate roadway, parking, staging, and maneuvering facilities that contain sufficient dock and terminal space for expected truck traffic.
CHAPTER 5 – GUIDANCE ON ROADWAY GEOMETRIC DESIGN AND TRAFFIC CONTROL
• Designing intersections to accommodate heavy truck volumes, including corner turning radii, driveway opening and lane width, and median openings to accommodate truck and trailer off-tracking.
• Designing storage and turning lanes, median openings, and shoulders to accommodate trucks.
• Designing curbs, pedestrian facilities, safety features, and other roadside features to accommodate truck traffic.
• Designing traffic signals and signal phasing and timing to accommodate truck traffic.
CHAPTER 6 – PAVEMENT DESIGN FOR TRUCKS Characteristics of subgrades, base, and concrete or asphalt pavements that impact
deterioration due to repetitive heavy truck loadings. Example pavement layer thickness designs that exceed minimum requirements and
represent good practice. Using Mn/DOT standards to develop a pavement specification and pavement thickness
design for flexible and rigid pavements to accommodate heavy truck use. Issues related to maintenance, rehabilitation, and reconstruction of existing pavement
exposed to increased heavy truck loadings. Guidance on pavement condition monitoring and maintaining new and existing
pavements.
CHAPTER 7 – EXISTING BRIDGES • Issues related to evaluation of bridge strength deterioration and wear when exposed to
increased truck traffic. o The increase in the repetitive heavy truck traffic will affect the wear or fatigue
resistance, for steel bridges in particular. Bridge connection components are particularly vulnerable to fatigue
problems. o The strength deterioration is also affected by the potential for unusually heavy
truck loadings or unusual truck geometries. • Bridge monitoring, load testing, and evaluation. Guidance on bridge condition
monitoring.
13
• Considering bridge strengthening and rehabilitation. o Guidelines using various types of strengthening and rehabilitation schemes can
be discussed along with their relevance to different bridge types and problem. • Bridge posting and load restrictions.
o Posting decisions are typically made after using conventional structural evaluation methods. Methods available (and limitations, applicability, etc) can be discussed.
Relationship to Mn/DOT Performance Measures and Goals Mn/DOT is currently completing a statewide freight plan. This policy plan provides specific strategies and performance measures. Two of the six policy directions speak directly in support of the types of activities that planning and design guidance for local governments engenders. Although it does not directly address local governments, Policy Direction 4 recommends better integration of freight considerations in planning and investment decisions. The policy addresses the regional level (rather than the local level), but local government engineers and planners are actually that the ones who implement local investment decisions for the transportation system. Providing local governments the tools to better integrate freight consideration into planning and investment decisions is consistent with this goal. Policy Direction 5, “Strengthening Partnerships to Address Significant Freight Issues,” focuses directly on the spirit of the recommended guidance purpose. One of the suggested strategies under Policy Direction 5 is to “promote regional and local collaboration to improve compatibility of freight facilities with adjacent land uses,” which is what the proposed guidance will help to achieve.
Relationship to Mn/DOT and Mn/DOT Partners The Minnesota Office of State Aid and Local Transportation is currently refocusing and looking to redefine or refocus its mission. Clearly, the Office of State Aid and Local Transportation would be the logical home for the proposed guidance. However, until the Office of State Aid and Local Transportation is done refocusing its mission, it is impossible to determine whether it is an appropriate home for the manual.
Implementation Strategy Leadership for the development of “Zoning and Roadway Design and Specification Guidance for Local Governments in and around Heavy Truck Traffic Generators” should originate from a partnership between the Office of State Aid and Local Transportation and the Office of Freight and Commercial Vehicle Operations, with the Office of State Aid and Local Transportation becoming the likely home for the manual. We suspect that the proposed guidance manual could be developed for $200,000 to $300,000 and that other states might consider sharing the cost of creating common portions of the guidance. Given the large costs of making a mistake in infrastructure development through underdesigning a roadway or bridge, resulting in premature failure, the guidance will quickly pay for itself by avoiding an underdesigned facility.

14
Developing the design manual is not a matter of creating new information, but rather one of compiling existing information into a single readable format. Therefore, the manual and training course could be completed in 12 months.
15
Chapter 3 Exploration of Hold Harmless Legislation to Strengthen Quick
Clearance Incident Management Functions
Description The term “quick clearance,” as used in incident management, is defined as the “process of quickly removing wreckage, debris, or any other elements that disrupt the normal flow of traffic, or force lane closures, and restoring the roadway capacity to its pre-incident condition” [7, p. 27]. Quick clearance practices decrease the time required to clear incidents, thereby reducing delays for both trucks and passenger vehicles. Mn/DOT and its partner law enforcement agencies currently conduct quick clearance practices. This chapter addresses the potential for new Minnesota legislation to strengthen quick clearance activities. Specifically, potential legislation could hold Mn/DOT and law enforcement agencies, their employees, and their agents (contractors) harmless from liability when clearing an incident involving the removal or towing of vehicles (personal vehicle or commercial vehicles) or cargo from the roadway. Several other states hold first responders harmless from liability, meaning that the responders do not have to wait for the owner’s permission to clear a disabled vehicle or spilled cargo, a liability protection that reduces the time until an incident is cleared. Research has shown that when the time taken to clear an incident increases, traffic delays induced by the incident increase geometrically [8]. In other words, if the clearance time of an incident increases from 15 minutes to 30 minutes, the total delay suffered by motorists in the traffic stream behind the incident is not doubled, but is four times as large. In addition, as traffic delays increase, the opportunity for secondary incidents increases, as does exposure of first responders to peril. In 2001, 28 law enforcement officers and 6 firefighters and emergency medical technicians nationwide died after being struck outside their emergency vehicles by another vehicle while responding to an incident [9]. Thus, it is important that incidents are cleared as quickly as possible. The delay imposed on the traffic stream by an incident is “unexpected delay.” In other words, there is no means for truck operators or other motorists to plan in advance for such delay and, therefore, it is unexpected. Although unexpected delay imposes a cost on all vehicles in the traffic stream, the impact on each truck is much greater than for passenger vehicle, on a per-vehicle basis.
Importance of Unexpected Delay Delay is typically divided into recurring and non-recurring delays. Recurring delay is delay due to natural traffic patterns. For example, traffic congestion typically builds during peak commuting periods and then ebbs following the peak. This pattern recurs daily and is therefore recurring delay. Non-recurring delay is a result of several causes, including weather events (e.g., snow storms, fog, etc.), special events (football games, parades, etc.), and traffic incidents that block the flow of traffic. Incidents range from minor events such as a stalled vehicle to major events involving multi-vehicle crashes.
16
Unlike special events or the weather, drivers have no advance warning of non-recurring delay and, hence, the delay is unexpected. The literature covering unexpected delay (travel time unreliability) in the United States is almost nonexistent for freight transportation and rather sparse for passenger transportation. For this reason, one of the research themes in the Transportation Research Board’s proposed Future Strategic Highway Research Program (F-SHRP) addresses transportation reliability with a 75 million dollar, multi-year research program (funding for F-SHRP is being considered by lawmakers in the next Transportation Authorization Bill that congress is considering in spring 2005) [10]. However, even without the benefit of F-SHRP, there are strong inferences that can be taken from the Western European literature on the subject and the modest U.S. literature. A recent U.S. study by Small, Winston, and Yan identified the value of travel time and travel time reliability for commuters [11]. The authors found that the median value commuters placed on travel time was $20.36 per hour. The median value on travel time reliability was $19.31 per hour – this is the median value that a driver would pay (in addition to value of their time) to avoid an hour of unexpected delay. Taken together, the value of an hour of unexpected delay, including the value of travel time reliability and the travel time itself, is nearly $40 per hour or almost twice the value of an hour of expected delay. A few researchers have tried to estimate a value for travel time and travel time reliability for truck freight in the United States; far more examples exist in studies conducted in Western Europe. One U.S. study by Small, Noland, and Lewis estimated the value carriers place on travel time savings during congested periods and the value they place on travel time predictability [12]. Based on this small sample (20 carriers), it was estimated that motor carriers value transit travel time from $144.22 to $192.83 per hour and savings in late scheduled delays at $371.33 per hour (unexpected delay). The U.S. studies found in the literature estimate the value of truck travel time using values derived from motor carriers. Shippers/receivers are in a better position to understand the implications of an hour of unexpected delay on the supply chain and, therefore, make better resources for measuring travel time values. Several Western European studies have attempted to measure travel time values from the shipper/receiver’s perspective. One notable effort that estimated the value of travel time from the shipper’s perspective is a research project conducted by Kurri, Sirkia, and Mikola in Finland. Kurri et al. were successful in isolating the expected travel time cost and unexpected travel time costs with a data set that included 103 shippers shipping 236 different commodities. They found that, on average, an expected hour of travel time was valued at $11.03 per shipment and unexpected delay was valued at $350.96 per shipment (the authors do not say whether a shipment is the same as a truckload). In other words, an hour of unexpected delay imposes a cost more than 30 times the expected delay cost. The difference between the value of expected travel time and unexpected delay is even greater for perishable goods (the authors called these daily goods). The authors note that their
17
estimates of the value of freight travel time are low, but what is important is the difference between the values of expected travel time and unexpected delay. In the literature, U.S. values for expected truck travel time were found to vary from $50 to $75 per hour [13,14]. The Minnesota statewide freight plan uses a value of $70 per hour of delay. To be consistent with the freight plan, a $70 per hour estimate was used for expected delay and Kurri et al.’s estimate of the relative importance of unexpected delay (30 times greater) was used to derive a value of $2,100 per hour of unexpected delay. Unexpected delay is so much costlier than expected delay because of the interruption the delay imposes on synchronous activities at the destination and the inability to plan for disruption. Although more research needs to be done on the value of freight travel time reliability, the following points can be concluded:
• The impacts of unexpected travel time delay are more costly than expected delays for all vehicles, but the additional cost for trucks is extremely high (i.e., between $370 and $2,100 per hour)
• Activities that more quickly remove incidents and reduce delays benefit shippers, receivers, and carriers of truck-borne freight disproportionately, and those that benefit the most ship, receive, and carry high-value, time-sensitive, and/or perishable freight
Legislation Enabling Quick Clearance At a minimum, quick clearance responses are usually policies designed to require motorists involved in minor collisions to move their vehicles quickly out of travel lanes to locations either on the shoulder of the roadway or to designated accident investigation sites. These policies are backed by legislation that actually requires drivers to move their vehicles from the travel lanes, provided the vehicles can be safely moved under their own power and no serious personal injuries are involved. Traditionally, authorities have carefully removed vehicles only after the owner has off-loaded cargo from wrecked/disabled trucks to minimize damage to the cargo and/or vehicles. This is due to concern over the agency’s exposure to legal liability for damaged vehicles and cargo. However, under congested conditions, waiting to unload cargo results in extensive delays, and secondary crashes can occur. Waiting for an owner to remove vehicles when highways are congested has been deemed unacceptable in 21 states (not including Minnesota) and more aggressive methods are used to remove vehicles and cargo from the roadway. In these 21 states, agencies are held harmless from legal liability when they move or remove vehicles or cargo from the right-of-way to clear an incident, while taking reasonable precautions to guard against economic losses resulting from damage to the vehicles or cargo (including hazardous materials) and following reasonable efforts to preserve crash reconstruction data. NCHRP synthesis 318 recommends that to expedite quick clearance, laws should address the question of who is authorized to remove vehicles and cargo and shield agencies from legal liability resulting from damage to the equipment and cargo [15, p. 22]. Most states
18
(but not all) have laws requiring the owner to clear disable vehicles from the roadway. Some states hold public agencies harmless from liability when the agencies attempt to clear disabled vehicles from the roadway. States with laws requiring owners or enabling agencies to clear vehicles have one of four types of state statutes. Each of the four types of statutes supports quick clearance activities to varying degrees. The first two types of laws require drivers to quickly clear their vehicles, while the second two types of laws hold public agencies harmless from liability while removing disabled vehicles and spilled cargo from the roadway. Minnesota law falls into the first category of clearance laws and supports quick clearance by assigning the driver the responsibility for clearing the road after a crash.
Driver Stop Law NCHRP synthesis 318 notes that the driver stop laws are the oldest type of quick clearance legislation and includes the following standard provisions [15, p. 22]:
• It applies to drivers involved in a crash, and • It stipulates that drivers must stop their vehicles without obstructing traffic more
than necessary.
The Uniform Vehicle Code, under Section 10-103, has maintained a model driver stop law since 1956 [16,17]. The Uniform Vehicle Code is maintained by the National Committee on Uniform Traffic Laws and Ordinances, which promotes uniformity in traffic laws between jurisdictions by providing model legislation. Section 10-103 states,
“The driver of any vehicle involved in an accident resulting only in damage to a vehicle or other property which is driven or attended by any person shall immediately stop such vehicle at the scene of such accident or as close as possible, but shall forthwith return to and in every event shall remain at the scene of such accident until he has fulfilled the requirements of [Section] 10-104. Every such stop shall be made without obstructing traffic more than is necessary (emphasis added). Any person failing to stop or comply with said requirements under such circumstances shall be guilty of a misdemeanor and, upon conviction, shall be punished as provided in [Section] 17-101.”
Minnesota law on clearance fits into the driver stop law category and drivers have the primary responsibility for stopping their vehicles and for avoiding the obstructing of traffic. Minnesota law provides enforcement agencies the authority to tow vehicles under certain circumstances (e.g., a vehicle parked in a no parking zone). Minnesota law does not, however, hold law enforcement agencies, their employees, and agents harmless from liability should the vehicle or cargo be damaged while it is being removed. Minnesota State Statute 169.041 allows the appropriate law enforcement agency to tow a vehicle four hours after a citation or ticket has been issued (four hours are given to allow the driver the opportunity to remove the vehicle). However, under subdivision 4, paragraph
19
8, the appropriate enforcement agency can tow a vehicle immediately if the vehicle is parked within the right-of-way of a controlled-access highway or within the traveled portion of a public street when travel is allowed there. This means that under the supervision of law enforcement officials, vehicles in incidents on controlled-access highways can be towed immediately, but the agency, its staff, or its agents are not protected from liability should the load or the equipment be damaged while being removed. Minnesota law is modeled after the Uniform Vehicle Code created in the 1950s, when the notion of modern traffic management and the concept of quick clearance had not yet been conceived. Hence, the authors couldn’t have considered the possible need for public agencies to clear disabled vehicles.
Driver Removal Law In some states, a driver removal law also targets drivers involved in traffic incidents. However, this law differs from a driver stop law in that it places direct responsibility on drivers involved in a traffic incident, whose vehicles block all or part of a travel lane, to move their vehicles off the traveled way when practical. States that have established driver removal laws have done so to address accidents that result in disabled vehicles, property damage only crashes, and minor injury crashes, but not in serious personal injury or fatalities. In the case of a disablement involving immobile vehicles, typical driver removal laws mandate that drivers immediately seek assistance to remove their vehicles from travel lanes.
Authority Removal Law NCHRP synthesis 318 defines an authority removal law as providing authorization to a predesignated set of public agencies to remove the following [15, p. 25]:
(1) Driver-attended disabled or wrecked vehicles
(2) Spilled cargo or other personal property blocking travel lanes or otherwise creating a hazard to the flow of adjacent traffic
For definitional purposes, an “authority” represents a public agency authorized to remove or cause the removal of vehicles under an authority removal law. Such agencies generally include state, county, and local law enforcement, in addition to state DOTs. By authorizing the removal of vehicles, these laws protect the responsible agency from liability resulting from any reasonable amount of damage done to vehicles or cargo while performing the agency’s official duties. Compared with the driver stop law and the driver removal law, the authority removal law charges the on-site incident responder with rapidly removing vehicles or cargo obstructing traffic. The law aims to strengthen quick clearance practices, particularly in the safe and fast removal of incapacitated vehicles and cargo blocking travel lanes.
20
Drivers cannot single-handedly remove these types of minor and major incidents in a safe manner.
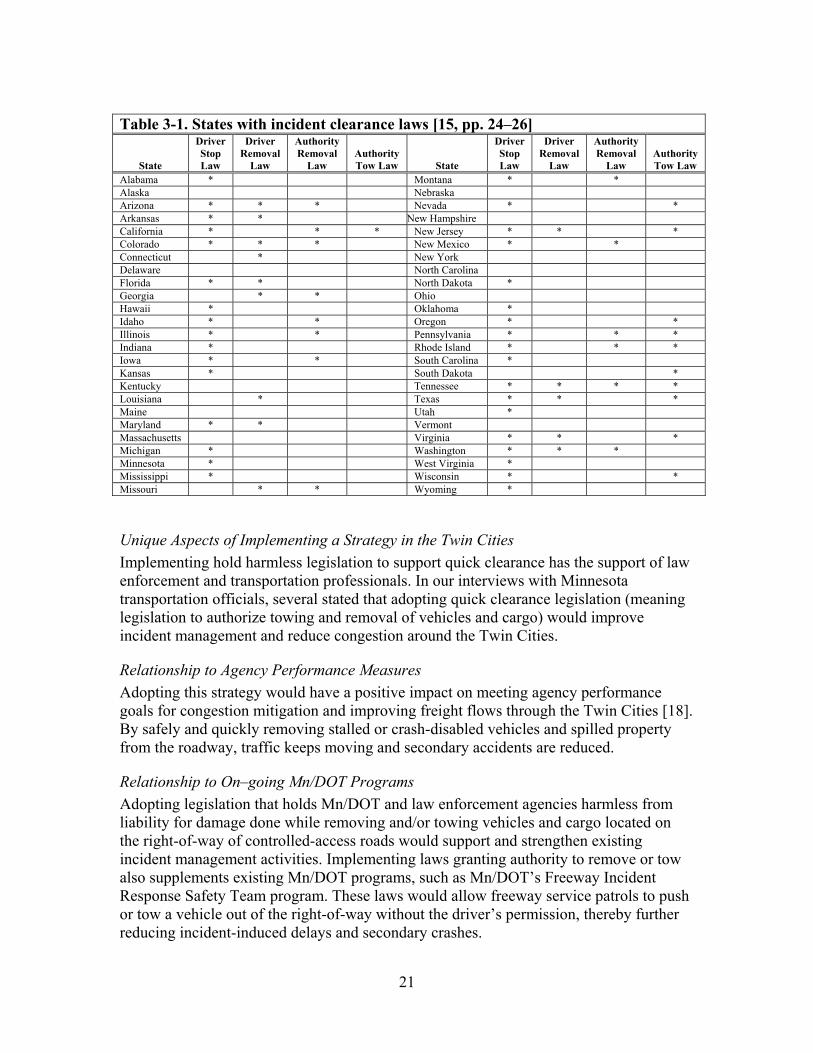
Authority Tow Law NCHRP synthesis 318 states that an authority tow law accomplishes the same goal as an authority removal law with regard to the maintenance of open roads [15, p.26]. However, an authority tow law emphasizes that driver-attended disabled or wrecked vehicles must be removed from the highway right-of-way and brought to a legal parking area, to a crash investigation site, or other area of safe refuge, such as a storage yard. Some states have expanded the law to include the removal of spilled cargo from a highway right–of–way. In certain cases, incident responders may apply an authority tow law when drivers or cargo owners cannot provide for the timely removal of an incapacitated vehicle or spilled cargo located on, and perhaps previously moved to, the shoulder. In other instances, states have developed authority tow laws specifically to protect those persons involved in or responding to a traffic incident from exposure to adjacent traffic, even if the traffic incident is contained on the shoulder. Under authority removal and authority tow laws, the responsible authority would recoup costs associate with special towing of a disabled vehicle or cargo removal from the owners of the crashed vehicles. Table 3-1 shows the results of a survey of states conducted for NCHRP synthesis 318. The table lists the types of clearance laws adopted by each state. Most states (38 of 50, including Minnesota) have laws requiring drivers of vehicles involved in an incident to stop and/or move disabled vehicles from the roadway. States with both driver stop and driver removal laws and authority removal or tow laws generally empower authorities to remove vehicles from the roadway on higher design-standard highways, such as interstates. Twenty-one states have laws providing authorities to remove or tow vehicles. It was expected that the states with the most aggressive authority to remove or tow laws would be states with large urban areas and congested highway. Several states are urban states, like Arizona, California, Colorado, Georgia, Illinois, and Pennsylvania. However, some largely rural states have also adopted aggressive laws providing agencies the authority to remove or tow, including Idaho, Iowa, Montana, New Mexico, and South Dakota.
21
Table 3-1. States with incident clearance laws [15, pp. 24–26]
State
Driver Stop Law
Driver Removal
Law
Authority Removal
Law Authority Tow Law State
Driver Stop Law
Driver Removal
Law
Authority Removal
Law Authority Tow Law
Alabama * Montana * * Alaska Nebraska Arizona * * * Nevada * * Arkansas * * New Hampshire California * * * New Jersey * * * Colorado * * * New Mexico * * Connecticut * New York Delaware North Carolina Florida * * North Dakota * Georgia * * Ohio Hawaii * Oklahoma * Idaho * * Oregon * * Illinois * * Pennsylvania * * * Indiana * Rhode Island * * * Iowa * * South Carolina * Kansas * South Dakota * Kentucky Tennessee * * * * Louisiana * Texas * * * Maine Utah * Maryland * * Vermont Massachusetts Virginia * * * Michigan * Washington * * * Minnesota * West Virginia * Mississippi * Wisconsin * * Missouri * * Wyoming *
Unique Aspects of Implementing a Strategy in the Twin Cities Implementing hold harmless legislation to support quick clearance has the support of law enforcement and transportation professionals. In our interviews with Minnesota transportation officials, several stated that adopting quick clearance legislation (meaning legislation to authorize towing and removal of vehicles and cargo) would improve incident management and reduce congestion around the Twin Cities.
Relationship to Agency Performance Measures Adopting this strategy would have a positive impact on meeting agency performance goals for congestion mitigation and improving freight flows through the Twin Cities [18]. By safely and quickly removing stalled or crash-disabled vehicles and spilled property from the roadway, traffic keeps moving and secondary accidents are reduced.
Relationship to On–going Mn/DOT Programs Adopting legislation that holds Mn/DOT and law enforcement agencies harmless from liability for damage done while removing and/or towing vehicles and cargo located on the right-of-way of controlled-access roads would support and strengthen existing incident management activities. Implementing laws granting authority to remove or tow also supplements existing Mn/DOT programs, such as Mn/DOT’s Freeway Incident Response Safety Team program. These laws would allow freeway service patrols to push or tow a vehicle out of the right-of-way without the driver’s permission, thereby further reducing incident-induced delays and secondary crashes.
22
Implementation Mn/DOT continues to consider legislative proposals to hold Mn/DOT and law enforcement agencies, their employees, and their agents harmless from liability resulting from removing disabled vehicles and spilled cargo from the right-of-way, except in the case of gross negligence. The MTA is on record as opposing the proposed legislation to strengthen quick clearance, citing three reasons. The MTA focuses on (1) the difficulties that might result for crash reconstruction if vehicles are cleared before proper reconstruction data are collected, (2) damage that might be done during quick clearance activities when trucks carrying hazardous materials might spill it, and (3) damage that might be done to cargo and equipment during quick clearance [19].
Benefits There are no known studies of the benefits of quick clearance with and without laws that hold the agencies responsible for damage done during clearance of disabled vehicles and spilled cargo. However, given that extending or decreasing the blockage of a lane results in a geometric increase or decrease in delay and that shortening the duration of incidents by any amount will significantly impact traffic congestion, secondary crashes, and the exposure of first responders to peril, the benefits are likely to be very large. The motor carrier industry, as well as shippers and receivers of truck-borne freight, benefit from quick clearance disproportionately more than other vehicles in the traffic stream because of the higher value that shippers and receivers place on avoiding unexpected delay. Depending on the values used for an hour of unexpected delay for a typical truck, shippers and receivers benefit between 9 to 52 times more on a per-vehicle basis than commuters from reducing unexpected, incident-induced delays.
Costs Changing Minnesota statutes to hold the responsible agencies harmless from lawsuits when removing or towing disabled vehicles or spilled cargo are believed to have no cost associated with strengthened quick clearance incident management practices [20]. In fact, strengthening quick clearance activities might even increase efficiency, since Mn/DOT vehicles are also caught in congestion related to incidents, like all other vehicles.
Recommendations It is recommended that the Office of Traffic, Security, and Operations in cooperation with the Office of Freight and Commercial Vehicle Operations develop an outreach program to educate interest groups about the positive and negative points of legislation that would hold Mn/DOT, enforcement agencies, their employees, and their agents harmless when performing quick clearance activities. The outreach should also seek input from and discussion with the MTA, individual carriers, and first responder communities to reach an agreement about quick clearance procedures and educate the industry about existing and planned quick clearance processes. Twenty-one other states have felt it necessary to hold first responders harmless from liability when clearing an incident with or without the permission of the owner. Protection from liability during incidents provides benefits to motor carriers and

23
motorists in terms of reduced congestion, but costs are borne by individual carriers when their equipment and cargo is cleared without their permission. Through discussion and education, a compromise is likely to arise that fits Minnesota and the Twin Cities.
24
Chapter 4 Achieving Increases in Commercial Vehicle Parking Supply on the
Urban Fringe
Description Trucks are carrying an increasing proportion of the nation’s freight. As overall vehicle miles of travel increase, so does the demand for overnight truck parking. Truck operators need to find locations that fit their schedules and routes and allow them to rest and satisfy federal regulations governing consecutive hours of driving and rest. This chapter considers methods for providing additional truck parking on the fringes of the Twin Cities metropolitan area. Parking in such locations allows truck operators to position themselves to meet delivery windows and to avoid peak hour congestion for destinations within or beyond the Twin Cities.
Characterizing the Issues There are many issues to consider when examining the supply of truck parking space. The first issue is the role Mn/DOT should play in providing the state’s supply of overnight truck parking. Nationally, public agencies (largely state transportation agencies at rest areas) provide only about 10% of all truck parking spaces, while the private sector provides the majority of parking through truck stops and travel plaza operations [21]. The American Trucking Association, the Commercial Vehicle Safety Alliance, the Truckload Carriers Association, and the Owner-Operators Independent Driver Association have all taken official positions that the U.S. Department of Transportation should take the initiative to increase quantity and quality of truck parking. There are two reasons why the trucking industry argues that the public sector, led by the U.S. Department of Transportation, should bear some of the burden of supplying additional parking to meet the growing demand [22,23,24,25].
1. Efficiency of Goods Movement by Truck. Along with the growth in truck-borne freight, the demand for overnight truck parking has increased. Without additional truck parking, more growth becomes costly to sustain. Additionally, government regulations mandating rest and driving times for truck operators changed in 2003. The changes increased the number of hours of continuous rest required for truck operators. Consequently, this increased the demand for truck parking. In fact, the Owner Operator Independent Driver Association’s 2004 truck parking survey found that 70% of their members believe that since the change in regulations they have a harder or much harder time finding truck parking [26]. Since some of the truck parking shortage is a result of government regulations, the argument follows that government should bare some of burden to remedy the situation.
2. Convenient Truck Parking Improves Traffic Safety. In 1994, a National Highway Traffic Safety Administration research study estimated that truck
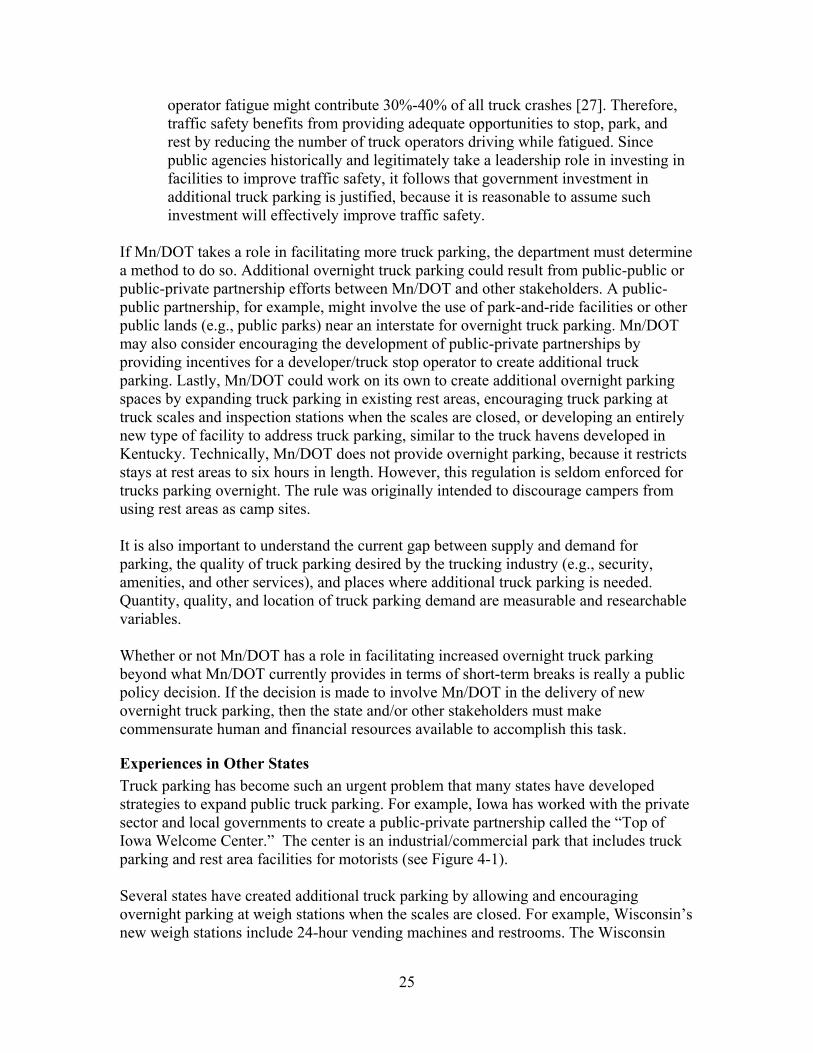
25
operator fatigue might contribute 30%-40% of all truck crashes [27]. Therefore, traffic safety benefits from providing adequate opportunities to stop, park, and rest by reducing the number of truck operators driving while fatigued. Since public agencies historically and legitimately take a leadership role in investing in facilities to improve traffic safety, it follows that government investment in additional truck parking is justified, because it is reasonable to assume such investment will effectively improve traffic safety.
If Mn/DOT takes a role in facilitating more truck parking, the department must determine a method to do so. Additional overnight truck parking could result from public-public or public-private partnership efforts between Mn/DOT and other stakeholders. A public-public partnership, for example, might involve the use of park-and-ride facilities or other public lands (e.g., public parks) near an interstate for overnight truck parking. Mn/DOT may also consider encouraging the development of public-private partnerships by providing incentives for a developer/truck stop operator to create additional truck parking. Lastly, Mn/DOT could work on its own to create additional overnight parking spaces by expanding truck parking in existing rest areas, encouraging truck parking at truck scales and inspection stations when the scales are closed, or developing an entirely new type of facility to address truck parking, similar to the truck havens developed in Kentucky. Technically, Mn/DOT does not provide overnight parking, because it restricts stays at rest areas to six hours in length. However, this regulation is seldom enforced for trucks parking overnight. The rule was originally intended to discourage campers from using rest areas as camp sites. It is also important to understand the current gap between supply and demand for parking, the quality of truck parking desired by the trucking industry (e.g., security, amenities, and other services), and places where additional truck parking is needed. Quantity, quality, and location of truck parking demand are measurable and researchable variables. Whether or not Mn/DOT has a role in facilitating increased overnight truck parking beyond what Mn/DOT currently provides in terms of short-term breaks is really a public policy decision. If the decision is made to involve Mn/DOT in the delivery of new overnight truck parking, then the state and/or other stakeholders must make commensurate human and financial resources available to accomplish this task.
Experiences in Other States Truck parking has become such an urgent problem that many states have developed strategies to expand public truck parking. For example, Iowa has worked with the private sector and local governments to create a public-private partnership called the “Top of Iowa Welcome Center.” The center is an industrial/commercial park that includes truck parking and rest area facilities for motorists (see Figure 4-1). Several states have created additional truck parking by allowing and encouraging overnight parking at weigh stations when the scales are closed. For example, Wisconsin’s new weigh stations include 24-hour vending machines and restrooms. The Wisconsin
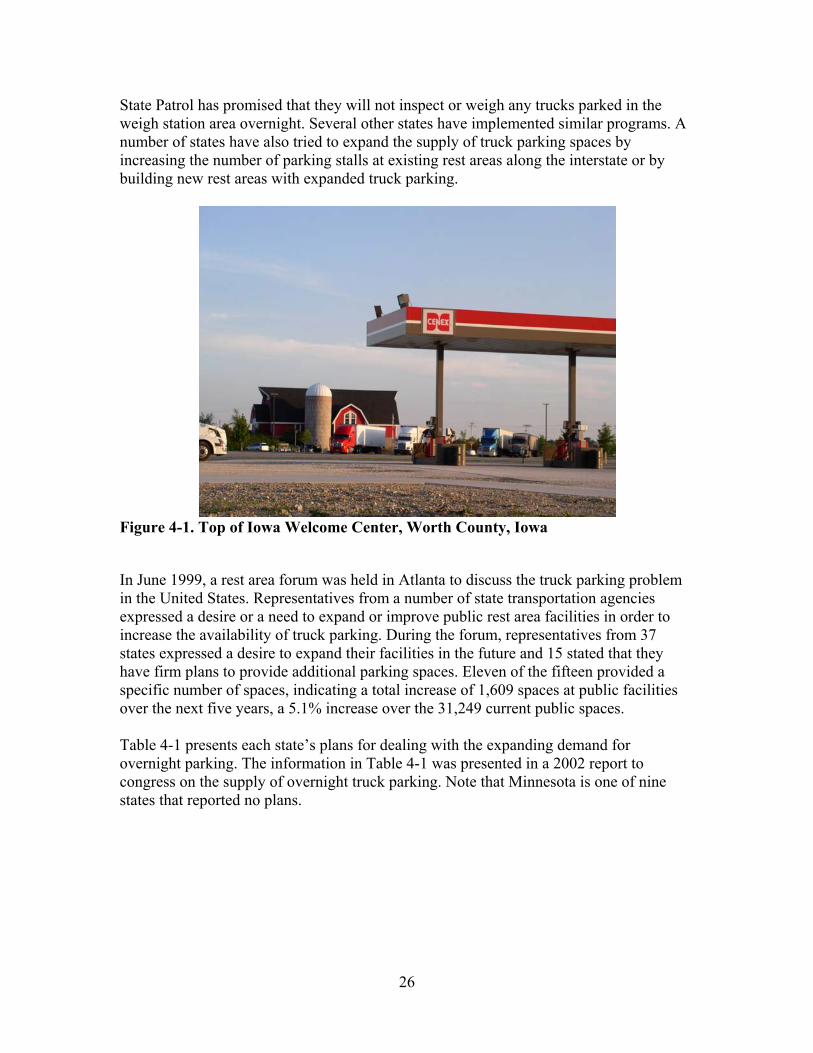
26
State Patrol has promised that they will not inspect or weigh any trucks parked in the weigh station area overnight. Several other states have implemented similar programs. A number of states have also tried to expand the supply of truck parking spaces by increasing the number of parking stalls at existing rest areas along the interstate or by building new rest areas with expanded truck parking.
Figure 4-1. Top of Iowa Welcome Center, Worth County, Iowa
In June 1999, a rest area forum was held in Atlanta to discuss the truck parking problem in the United States. Representatives from a number of state transportation agencies expressed a desire or a need to expand or improve public rest area facilities in order to increase the availability of truck parking. During the forum, representatives from 37 states expressed a desire to expand their facilities in the future and 15 stated that they have firm plans to provide additional parking spaces. Eleven of the fifteen provided a specific number of spaces, indicating a total increase of 1,609 spaces at public facilities over the next five years, a 5.1% increase over the 31,249 current public spaces. Table 4-1 presents each state’s plans for dealing with the expanding demand for overnight parking. The information in Table 4-1 was presented in a 2002 report to congress on the supply of overnight truck parking. Note that Minnesota is one of nine states that reported no plans.
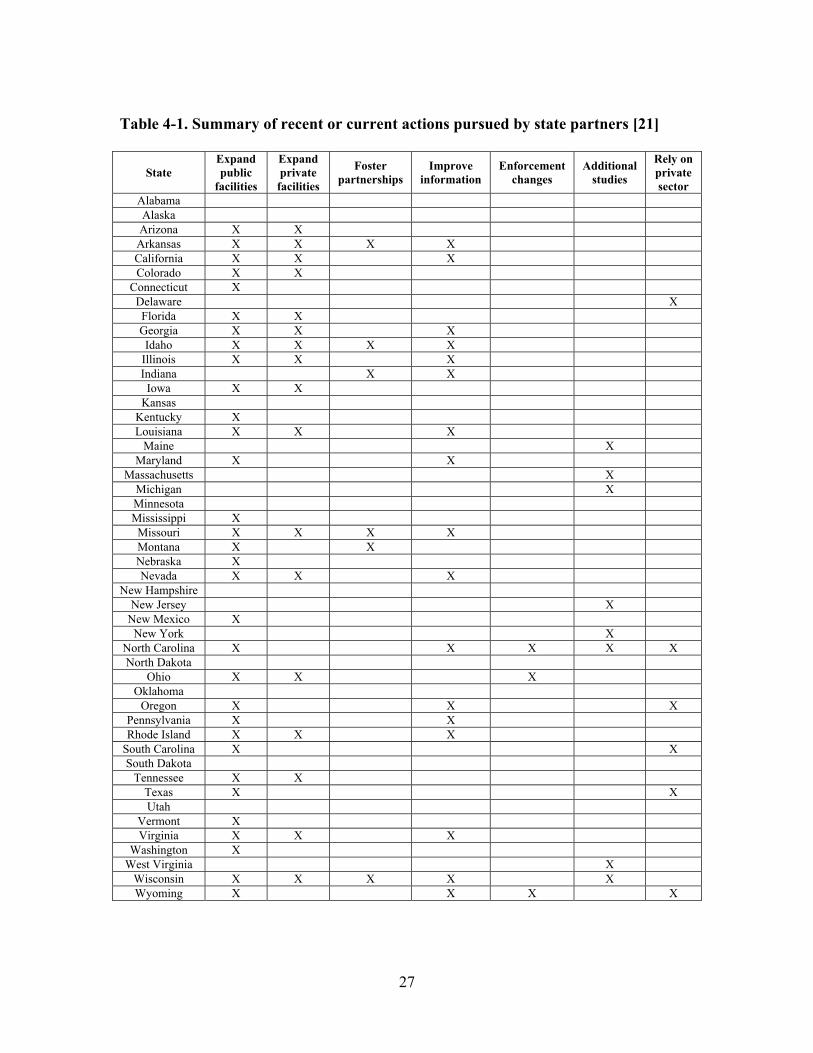
27
Table 4-1. Summary of recent or current actions pursued by state partners [21]
State Expand public
facilities
Expand private facilities
Foster partnerships
Improve information
Enforcement changes
Additional studies
Rely on private sector
Alabama Alaska Arizona X X Arkansas X X X X California X X X Colorado X X
Connecticut X Delaware X Florida X X Georgia X X X Idaho X X X X
Illinois X X X Indiana X X Iowa X X
Kansas Kentucky X Louisiana X X X
Maine X Maryland X X
Massachusetts X Michigan X Minnesota Mississippi X Missouri X X X X Montana X X Nebraska X Nevada X X X
New Hampshire New Jersey X
New Mexico X New York X
North Carolina X X X X X North Dakota
Ohio X X X Oklahoma
Oregon X X X Pennsylvania X X Rhode Island X X X
South Carolina X X South Dakota
Tennessee X X Texas X X Utah
Vermont X Virginia X X X
Washington X West Virginia X
Wisconsin X X X X X Wyoming X X X X
28
Unique Aspects of Increasing Truck Parking in the Twin Cities Several variables dictate the need for overnight truck parking at a given point along the highway network. To understand some of the spatial dimensions of the truck parking problem, it is important to understand the hours of service (HOS) regulations. The HOS regulations determine the number of hours a truck operator can drive without continuous hours of downtime. The downtime is for the truck operator to rest. Federal HOS regulations were changed in 2003 and the changes were implemented in early 2004. HOS regulations allow truck operators to drive for 11 hours followed by a minimum of 10 hours of uninterrupted rest. Given that a truck operator can drive a maximum of 11 hours before stopping for rest, the maximum distance to the Twin Cities area that a truck could travel before requiring overnight parking is 11 hours. Assuming an average speed of 50 miles per hour, this calculates to about 550 miles. It is important to note that it is not only truck operators who are approaching the mandatory rest period, but often operators traveling for less time that may need truck parking, not in order to meet HOS regulations but to better facilitate a freight delivery. Figure 4-2 contains a map showing a 550-mile radius from the Twin Cities. The radius defines the approximate maximum distance a truck operator could travel before needing HOS rest requirements. A more precise analysis of how far a truck could travel in 11 hours, based on road type, congestion, and other factors, would result in a more accurate demarcation, one less regular than the 550-mile radius shown. However, the radius shown in the figure is adequate for the purposes of discussion. Detailed truck parking analysis is complicated by the fact that significant truck traffic heading to the Twin Cities could originate within the 550-mile radius. Specifically, a number of major freight origins, including Detroit, Chicago, Milwaukee, St. Louis, Kansas City, Omaha, Des Moines, and Winnipeg, lie within the radius. Estimating parking needs for truck operators making these shorter runs is more complicated. Mn/DOT may consider conducting an origin and destination study. The study would gather data about trucks already parking on the fringe of the Twin Cities metropolitan area. The department could use the gathered data to overlay the origins and destinations of truck-borne freight moving through or to the Twin Cities. The overlays would make it possible for Mn/DOT to identify the specific locations around the Twin Cities where additional truck parking spaces are needed to accommodate the following:
• HOS rest requirements • Truck staging or positioning to make efficient pickups and deliveriess in the Twin
Cities area.
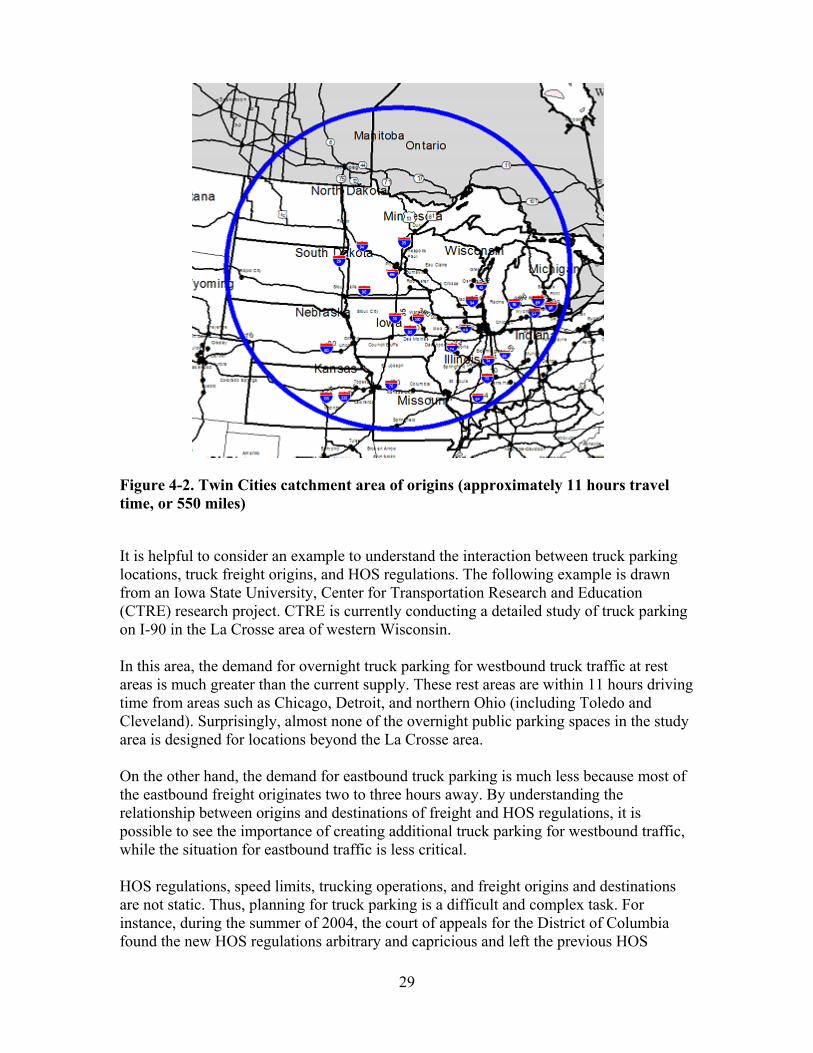
29
Figure 4-2. Twin Cities catchment area of origins (approximately 11 hours travel time, or 550 miles)
It is helpful to consider an example to understand the interaction between truck parking locations, truck freight origins, and HOS regulations. The following example is drawn from an Iowa State University, Center for Transportation Research and Education (CTRE) research project. CTRE is currently conducting a detailed study of truck parking on I-90 in the La Crosse area of western Wisconsin. In this area, the demand for overnight truck parking for westbound truck traffic at rest areas is much greater than the current supply. These rest areas are within 11 hours driving time from areas such as Chicago, Detroit, and northern Ohio (including Toledo and Cleveland). Surprisingly, almost none of the overnight public parking spaces in the study area is designed for locations beyond the La Crosse area. On the other hand, the demand for eastbound truck parking is much less because most of the eastbound freight originates two to three hours away. By understanding the relationship between origins and destinations of freight and HOS regulations, it is possible to see the importance of creating additional truck parking for westbound traffic, while the situation for eastbound traffic is less critical. HOS regulations, speed limits, trucking operations, and freight origins and destinations are not static. Thus, planning for truck parking is a difficult and complex task. For instance, during the summer of 2004, the court of appeals for the District of Columbia found the new HOS regulations arbitrary and capricious and left the previous HOS
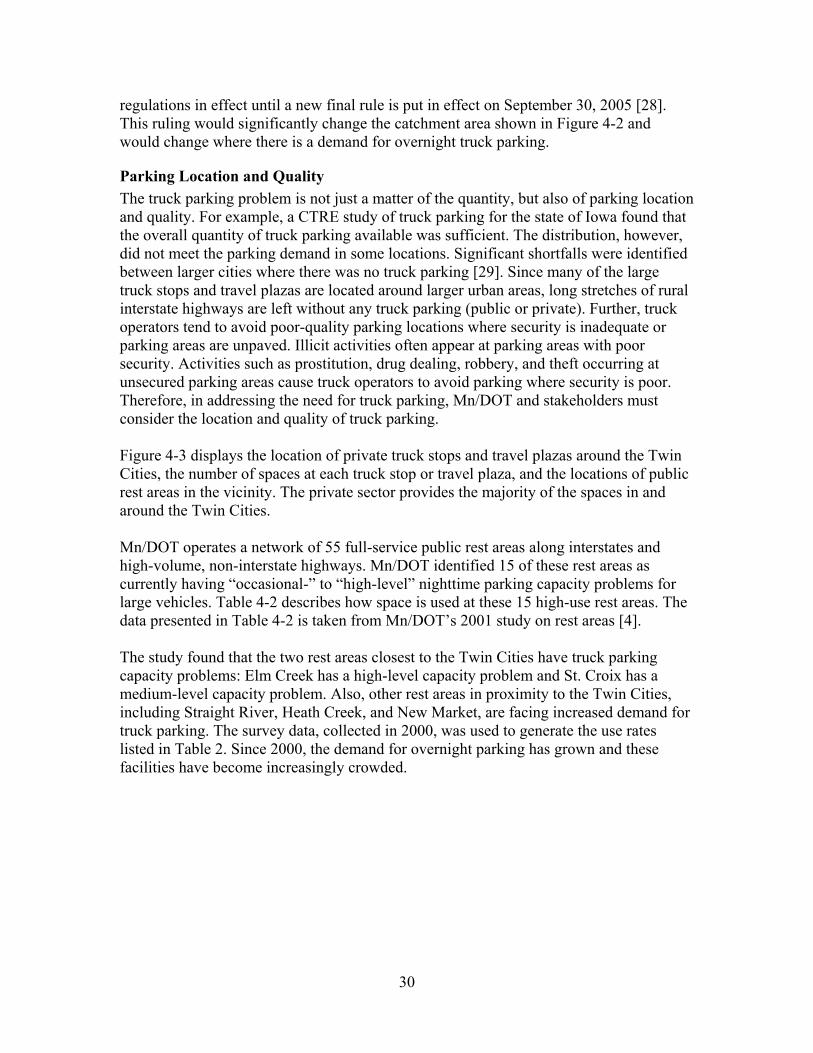
30
regulations in effect until a new final rule is put in effect on September 30, 2005 [28]. This ruling would significantly change the catchment area shown in Figure 4-2 and would change where there is a demand for overnight truck parking.
Parking Location and Quality The truck parking problem is not just a matter of the quantity, but also of parking location and quality. For example, a CTRE study of truck parking for the state of Iowa found that the overall quantity of truck parking available was sufficient. The distribution, however, did not meet the parking demand in some locations. Significant shortfalls were identified between larger cities where there was no truck parking [29]. Since many of the large truck stops and travel plazas are located around larger urban areas, long stretches of rural interstate highways are left without any truck parking (public or private). Further, truck operators tend to avoid poor-quality parking locations where security is inadequate or parking areas are unpaved. Illicit activities often appear at parking areas with poor security. Activities such as prostitution, drug dealing, robbery, and theft occurring at unsecured parking areas cause truck operators to avoid parking where security is poor. Therefore, in addressing the need for truck parking, Mn/DOT and stakeholders must consider the location and quality of truck parking. Figure 4-3 displays the location of private truck stops and travel plazas around the Twin Cities, the number of spaces at each truck stop or travel plaza, and the locations of public rest areas in the vicinity. The private sector provides the majority of the spaces in and around the Twin Cities. Mn/DOT operates a network of 55 full-service public rest areas along interstates and high-volume, non-interstate highways. Mn/DOT identified 15 of these rest areas as currently having “occasional-” to “high-level” nighttime parking capacity problems for large vehicles. Table 4-2 describes how space is used at these 15 high-use rest areas. The data presented in Table 4-2 is taken from Mn/DOT’s 2001 study on rest areas [4]. The study found that the two rest areas closest to the Twin Cities have truck parking capacity problems: Elm Creek has a high-level capacity problem and St. Croix has a medium-level capacity problem. Also, other rest areas in proximity to the Twin Cities, including Straight River, Heath Creek, and New Market, are facing increased demand for truck parking. The survey data, collected in 2000, was used to generate the use rates listed in Table 2. Since 2000, the demand for overnight parking has grown and these facilities have become increasingly crowded.
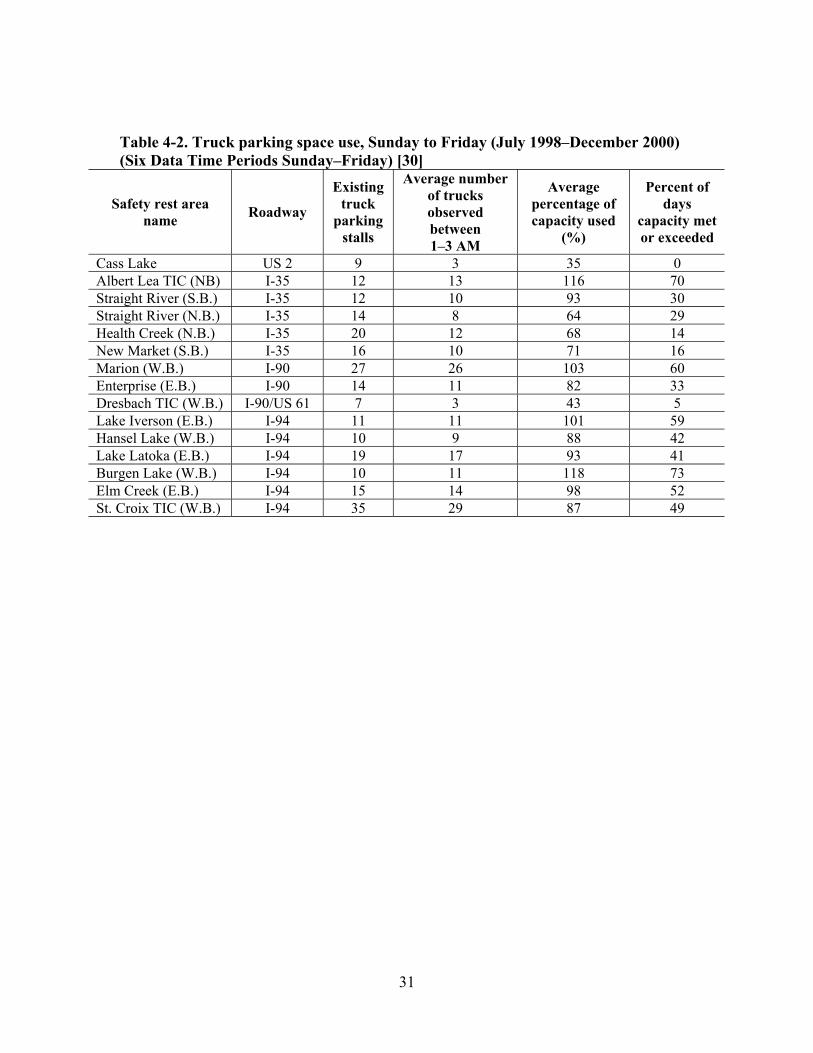
31
Table 4-2. Truck parking space use, Sunday to Friday (July 1998–December 2000) (Six Data Time Periods Sunday–Friday) [30]
Safety rest area name Roadway
Existing truck
parking stalls
Average number of trucks observed between 1–3 AM
Average percentage of capacity used
(%)
Percent of days
capacity met or exceeded
Cass Lake US 2 9 3 35 0 Albert Lea TIC (NB) I-35 12 13 116 70 Straight River (S.B.) I-35 12 10 93 30 Straight River (N.B.) I-35 14 8 64 29 Health Creek (N.B.) I-35 20 12 68 14 New Market (S.B.) I-35 16 10 71 16 Marion (W.B.) I-90 27 26 103 60 Enterprise (E.B.) I-90 14 11 82 33 Dresbach TIC (W.B.) I-90/US 61 7 3 43 5 Lake Iverson (E.B.) I-94 11 11 101 59 Hansel Lake (W.B.) I-94 10 9 88 42 Lake Latoka (E.B.) I-94 19 17 93 41 Burgen Lake (W.B.) I-94 10 11 118 73 Elm Creek (E.B.) I-94 15 14 98 52 St. Croix TIC (W.B.) I-94 35 29 87 49
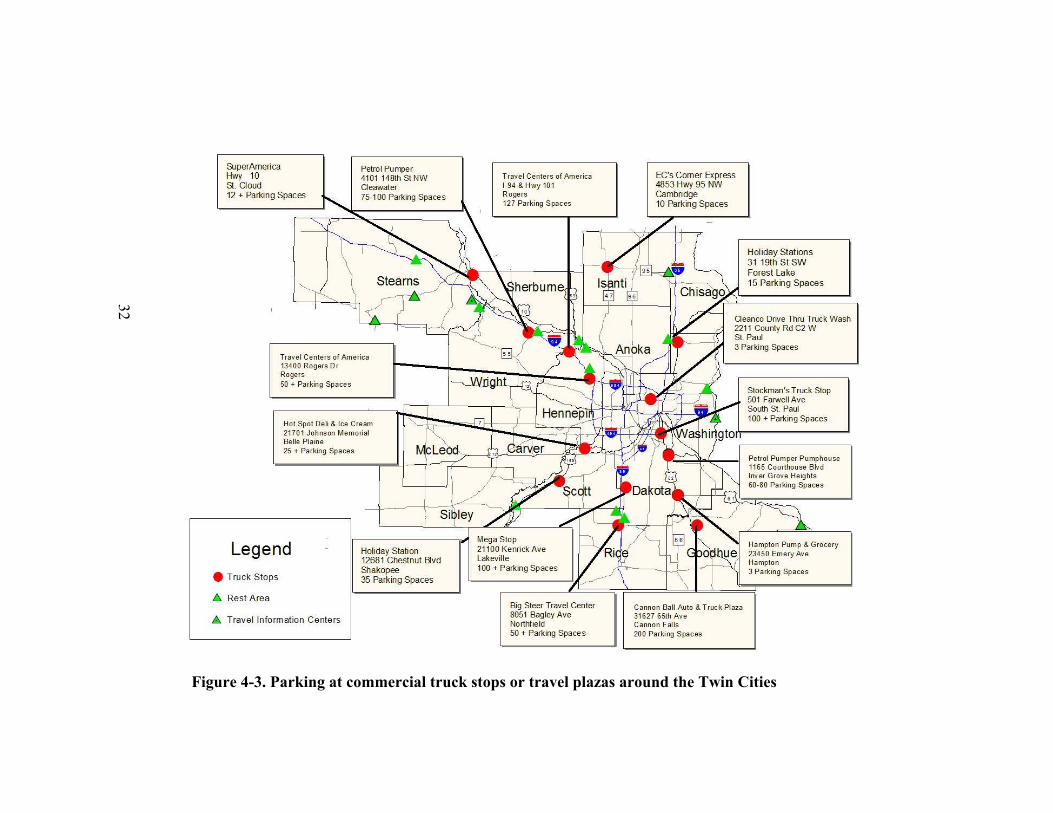
Figure 4-3. Parking at commercial truck stops or travel plazas around the Twin Cities
32
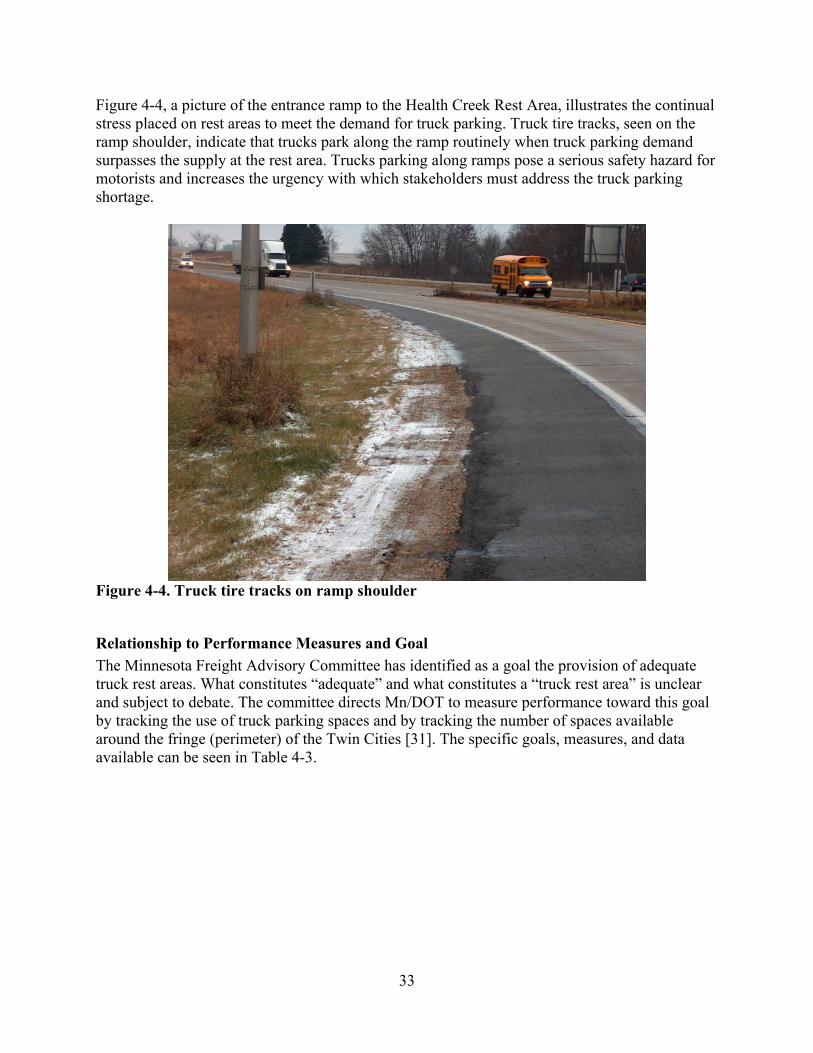
33
Figure 4-4, a picture of the entrance ramp to the Health Creek Rest Area, illustrates the continual stress placed on rest areas to meet the demand for truck parking. Truck tire tracks, seen on the ramp shoulder, indicate that trucks park along the ramp routinely when truck parking demand surpasses the supply at the rest area. Trucks parking along ramps pose a serious safety hazard for motorists and increases the urgency with which stakeholders must address the truck parking shortage.
Figure 4-4. Truck tire tracks on ramp shoulder
Relationship to Performance Measures and Goal The Minnesota Freight Advisory Committee has identified as a goal the provision of adequate truck rest areas. What constitutes “adequate” and what constitutes a “truck rest area” is unclear and subject to debate. The committee directs Mn/DOT to measure performance toward this goal by tracking the use of truck parking spaces and by tracking the number of spaces available around the fringe (perimeter) of the Twin Cities [31]. The specific goals, measures, and data available can be seen in Table 4-3.
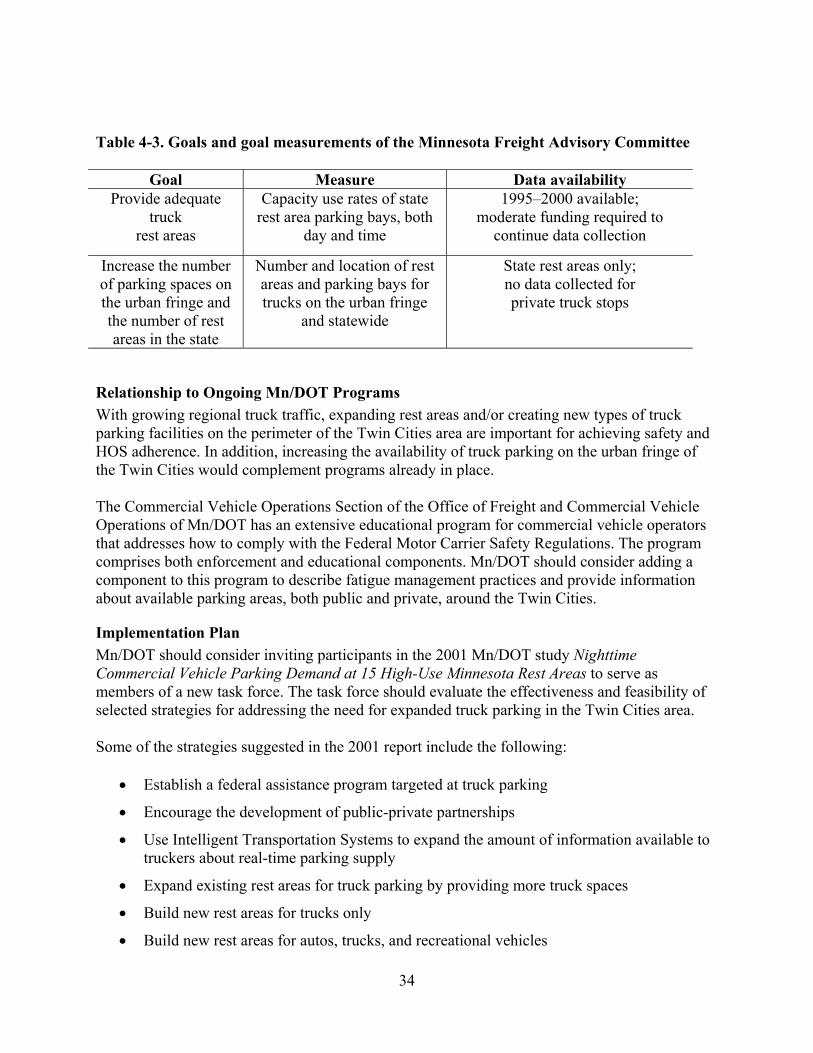
34
Table 4-3. Goals and goal measurements of the Minnesota Freight Advisory Committee
Goal Measure Data availability Provide adequate
truck rest areas
Capacity use rates of state rest area parking bays, both
day and time
1995–2000 available; moderate funding required to
continue data collection
Increase the number of parking spaces on the urban fringe and the number of rest areas in the state
Number and location of rest areas and parking bays for trucks on the urban fringe
and statewide
State rest areas only; no data collected for private truck stops
Relationship to Ongoing Mn/DOT Programs With growing regional truck traffic, expanding rest areas and/or creating new types of truck parking facilities on the perimeter of the Twin Cities area are important for achieving safety and HOS adherence. In addition, increasing the availability of truck parking on the urban fringe of the Twin Cities would complement programs already in place. The Commercial Vehicle Operations Section of the Office of Freight and Commercial Vehicle Operations of Mn/DOT has an extensive educational program for commercial vehicle operators that addresses how to comply with the Federal Motor Carrier Safety Regulations. The program comprises both enforcement and educational components. Mn/DOT should consider adding a component to this program to describe fatigue management practices and provide information about available parking areas, both public and private, around the Twin Cities.
Implementation Plan Mn/DOT should consider inviting participants in the 2001 Mn/DOT study Nighttime Commercial Vehicle Parking Demand at 15 High-Use Minnesota Rest Areas to serve as members of a new task force. The task force should evaluate the effectiveness and feasibility of selected strategies for addressing the need for expanded truck parking in the Twin Cities area. Some of the strategies suggested in the 2001 report include the following:
• Establish a federal assistance program targeted at truck parking
• Encourage the development of public-private partnerships
• Use Intelligent Transportation Systems to expand the amount of information available to truckers about real-time parking supply
• Expand existing rest areas for truck parking by providing more truck spaces
• Build new rest areas for trucks only
• Build new rest areas for autos, trucks, and recreational vehicles
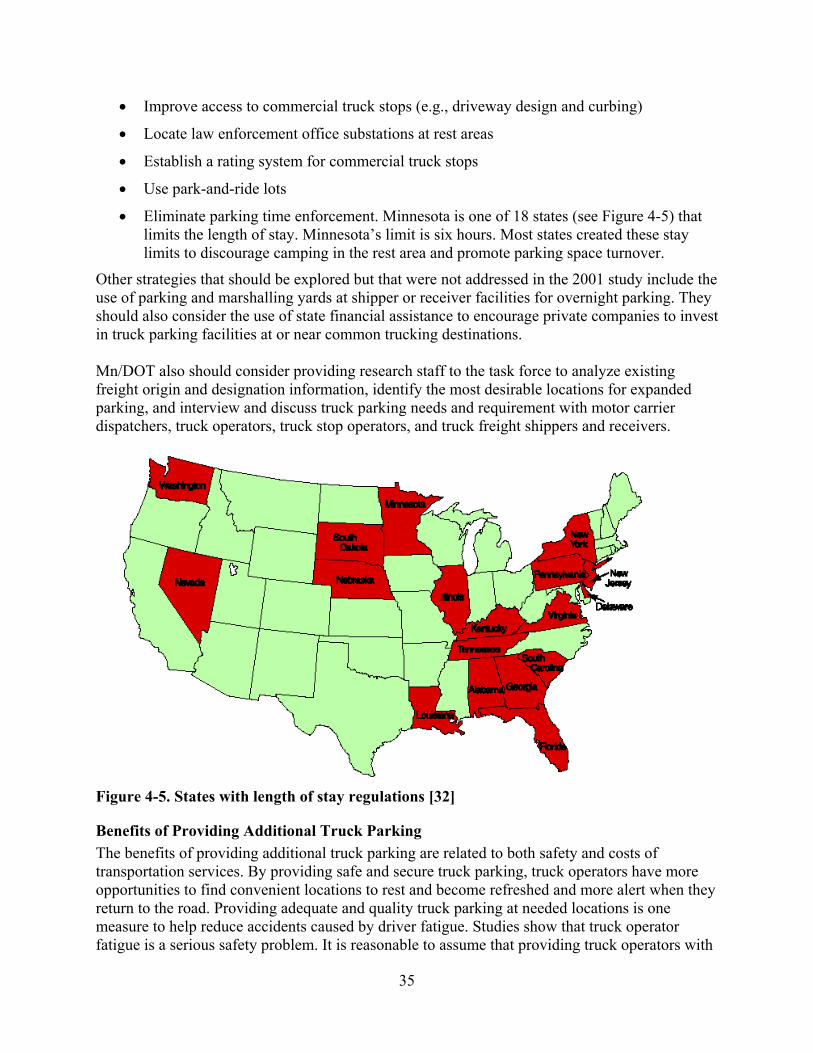
35
• Improve access to commercial truck stops (e.g., driveway design and curbing)
• Locate law enforcement office substations at rest areas
• Establish a rating system for commercial truck stops
• Use park-and-ride lots
• Eliminate parking time enforcement. Minnesota is one of 18 states (see Figure 4-5) that limits the length of stay. Minnesota’s limit is six hours. Most states created these stay limits to discourage camping in the rest area and promote parking space turnover.
Other strategies that should be explored but that were not addressed in the 2001 study include the use of parking and marshalling yards at shipper or receiver facilities for overnight parking. They should also consider the use of state financial assistance to encourage private companies to invest in truck parking facilities at or near common trucking destinations. Mn/DOT also should consider providing research staff to the task force to analyze existing freight origin and designation information, identify the most desirable locations for expanded parking, and interview and discuss truck parking needs and requirement with motor carrier dispatchers, truck operators, truck stop operators, and truck freight shippers and receivers.
Figure 4-5. States with length of stay regulations [32]
Benefits of Providing Additional Truck Parking The benefits of providing additional truck parking are related to both safety and costs of transportation services. By providing safe and secure truck parking, truck operators have more opportunities to find convenient locations to rest and become refreshed and more alert when they return to the road. Providing adequate and quality truck parking at needed locations is one measure to help reduce accidents caused by driver fatigue. Studies show that truck operator fatigue is a serious safety problem. It is reasonable to assume that providing truck operators with
36
more opportunities to park and rest will result in safer highways. In other words, if truck parking supply is so tight that it discourages truck operators from stopping to rest, the operators may become fatigued, increasing the opportunity for a serious crash. Crashes involving a heavy truck are about 2.6 times as likely to involve a fatality as a crash involving only passenger vehicles. Heavy truck crashes also create about twice the economic loss [33,34]. The benefits of additional truck parking are very difficult to measure because no known research has correlated truck crashes with the availability of parking spaces. However, a Michigan State University study does correlate increased fatigue-related truck crashes with distances between rest area and suggests that more frequent rest areas would reduce fatigue-related crashes [35]. Industries involved in high technology manufacturing and technology integration typically ship high-value inbound and outbound freight. Shipments are likely time-sensitive, and shippers often consider these deliveries just-in-time (JIT). JIT shipping is facilitated by the availability of areas at which drivers can rest near their destinations so the trucks can meet narrow delivery windows. By providing convenient locations to park, truck operators can position their trucks to meet the requirements of a delivery window and reduce logistics costs. Constructing or expanding existing rest areas also provides opportunities for partnerships, which can reduce costs to government. Co-locating rest areas off the interstate right-of-way and near commercial truck stops is one possibility for a public-private partnership. The Top of Iowa Welcome Center in Worth County, Iowa (mentioned earlier) is an example of a public-private partnership. The Iowa DOT and a developer designed and maintain this welcome center along interstate 35. Iowa DOT shouldered the bulk of the capital investment costs and a private developer holds responsibility for facility maintenance and operation. The Iowa DOT estimates that the partnership will save the state approximately $3.43 million in maintenance costs over the term of the contract. In addition to saving the state of Iowa money on maintenance costs, the facility also added truck parking spaces. As a side note, concerns about unfair competition halted development of similar partnerships in Iowa. The Iowa state legislation passed laws preventing development of this type of partnership in the future.
Costs The cost associated with increasing truck parking depends on the particular approach taken. In locations where existing truck parking is adequate, the costs associated with allowing trucks to park is minimal and mostly involves costs related to maintenance and guide signs directing truck operators to new parking locations. If, however, Mn/DOT and stakeholders must construct new facilities, earthwork and paving costs are typically expensive. The National Association for Truck Stop Operators estimates that it costs roughly $100,000 to convert an acre of bare land into a truck parking lot. They also estimate that an acre of parking can store about 18 trucks and may cost $8,000 to $10,000 per year to maintain [36]. Also, land acquisition and costs associated with other services and amenities, such as lighted restrooms and vending areas, increase the cost of developing new truck parking areas.
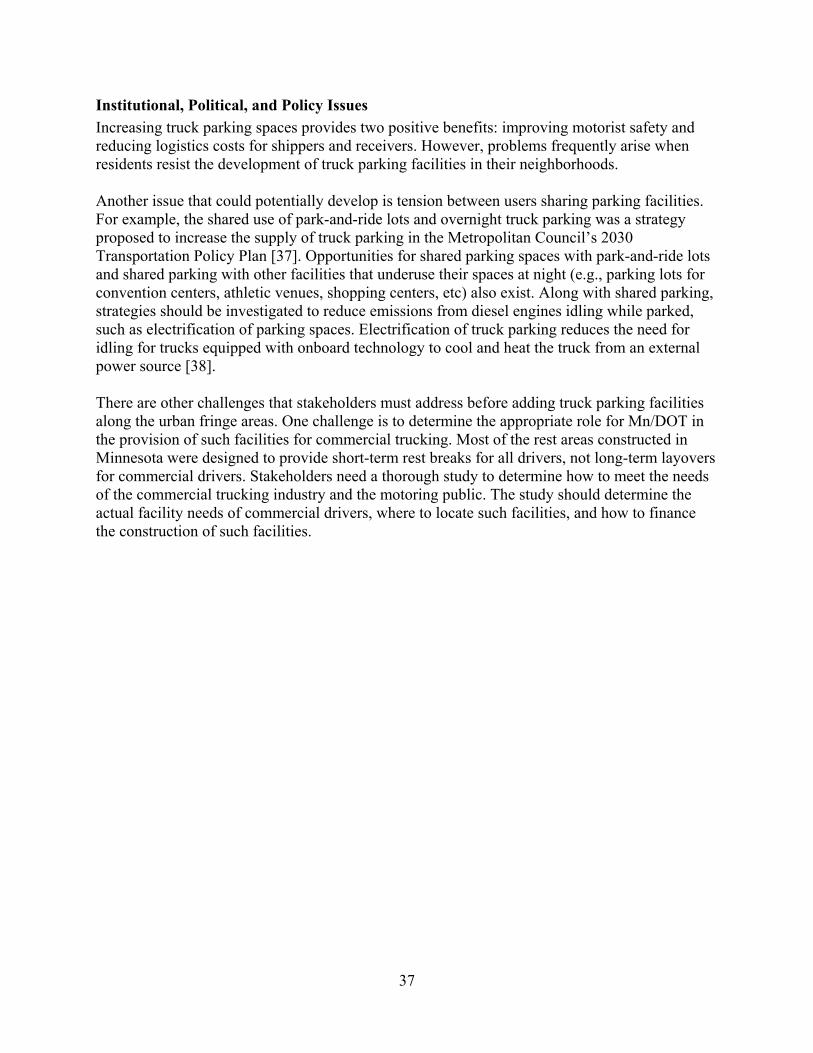
37
Institutional, Political, and Policy Issues Increasing truck parking spaces provides two positive benefits: improving motorist safety and reducing logistics costs for shippers and receivers. However, problems frequently arise when residents resist the development of truck parking facilities in their neighborhoods. Another issue that could potentially develop is tension between users sharing parking facilities. For example, the shared use of park-and-ride lots and overnight truck parking was a strategy proposed to increase the supply of truck parking in the Metropolitan Council’s 2030 Transportation Policy Plan [37]. Opportunities for shared parking spaces with park-and-ride lots and shared parking with other facilities that underuse their spaces at night (e.g., parking lots for convention centers, athletic venues, shopping centers, etc) also exist. Along with shared parking, strategies should be investigated to reduce emissions from diesel engines idling while parked, such as electrification of parking spaces. Electrification of truck parking reduces the need for idling for trucks equipped with onboard technology to cool and heat the truck from an external power source [38]. There are other challenges that stakeholders must address before adding truck parking facilities along the urban fringe areas. One challenge is to determine the appropriate role for Mn/DOT in the provision of such facilities for commercial trucking. Most of the rest areas constructed in Minnesota were designed to provide short-term rest breaks for all drivers, not long-term layovers for commercial drivers. Stakeholders need a thorough study to determine how to meet the needs of the commercial trucking industry and the motoring public. The study should determine the actual facility needs of commercial drivers, where to locate such facilities, and how to finance the construction of such facilities.
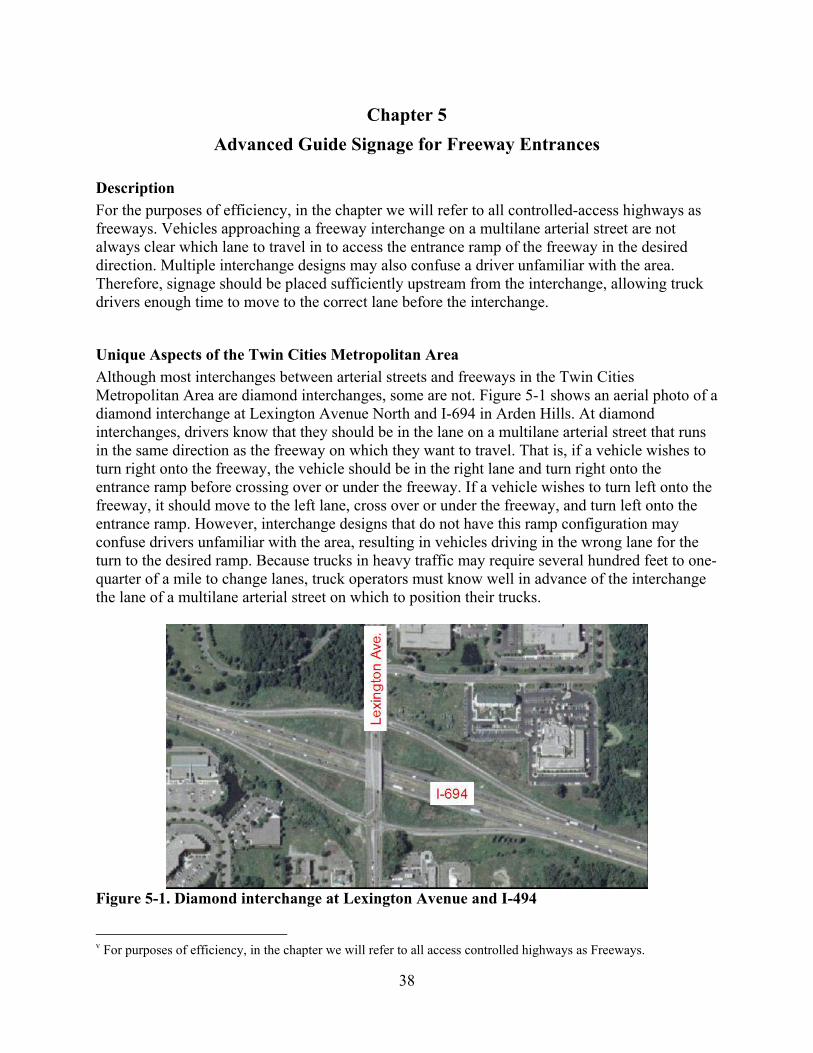
38
Chapter 5 Advanced Guide Signage for Freeway Entrances
Description For the purposes of efficiency, in the chapter we will refer to all controlled-access highways as freeways. Vehicles approaching a freeway interchange on a multilane arterial street are not always clear which lane to travel in to access the entrance ramp of the freeway in the desired direction. Multiple interchange designs may also confuse a driver unfamiliar with the area. Therefore, signage should be placed sufficiently upstream from the interchange, allowing truck drivers enough time to move to the correct lane before the interchange.
Unique Aspects of the Twin Cities Metropolitan Area Although most interchanges between arterial streets and freeways in the Twin Cities Metropolitan Area are diamond interchanges, some are not. Figure 5-1 shows an aerial photo of a diamond interchange at Lexington Avenue North and I-694 in Arden Hills. At diamond interchanges, drivers know that they should be in the lane on a multilane arterial street that runs in the same direction as the freeway on which they want to travel. That is, if a vehicle wishes to turn right onto the freeway, the vehicle should be in the right lane and turn right onto the entrance ramp before crossing over or under the freeway. If a vehicle wishes to turn left onto the freeway, it should move to the left lane, cross over or under the freeway, and turn left onto the entrance ramp. However, interchange designs that do not have this ramp configuration may confuse drivers unfamiliar with the area, resulting in vehicles driving in the wrong lane for the turn to the desired ramp. Because trucks in heavy traffic may require several hundred feet to one-quarter of a mile to change lanes, truck operators must know well in advance of the interchange the lane of a multilane arterial street on which to position their trucks.
Figure 5-1. Diamond interchange at Lexington Avenue and I-494
v For purposes of efficiency, in the chapter we will refer to all access controlled highways as Freeways.
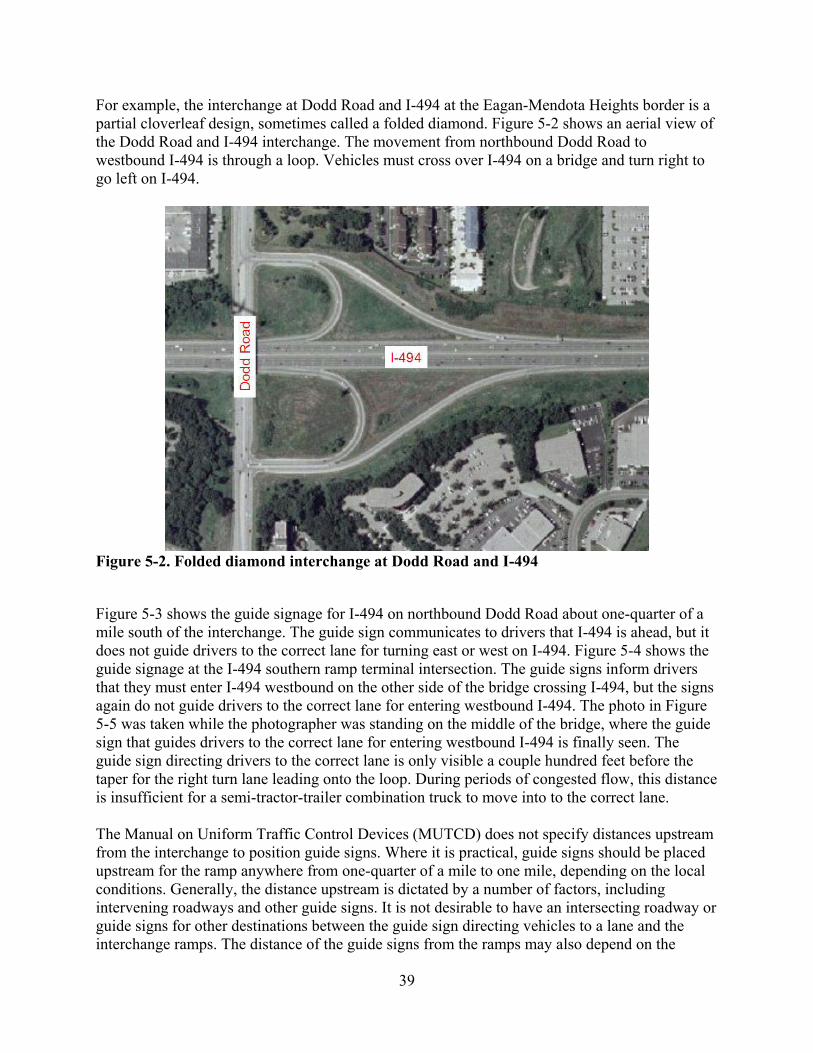
39
For example, the interchange at Dodd Road and I-494 at the Eagan-Mendota Heights border is a partial cloverleaf design, sometimes called a folded diamond. Figure 5-2 shows an aerial view of the Dodd Road and I-494 interchange. The movement from northbound Dodd Road to westbound I-494 is through a loop. Vehicles must cross over I-494 on a bridge and turn right to go left on I-494.
Figure 5-2. Folded diamond interchange at Dodd Road and I-494
Figure 5-3 shows the guide signage for I-494 on northbound Dodd Road about one-quarter of a mile south of the interchange. The guide sign communicates to drivers that I-494 is ahead, but it does not guide drivers to the correct lane for turning east or west on I-494. Figure 5-4 shows the guide signage at the I-494 southern ramp terminal intersection. The guide signs inform drivers that they must enter I-494 westbound on the other side of the bridge crossing I-494, but the signs again do not guide drivers to the correct lane for entering westbound I-494. The photo in Figure 5-5 was taken while the photographer was standing on the middle of the bridge, where the guide sign that guides drivers to the correct lane for entering westbound I-494 is finally seen. The guide sign directing drivers to the correct lane is only visible a couple hundred feet before the taper for the right turn lane leading onto the loop. During periods of congested flow, this distance is insufficient for a semi-tractor-trailer combination truck to move into to the correct lane. The Manual on Uniform Traffic Control Devices (MUTCD) does not specify distances upstream from the interchange to position guide signs. Where it is practical, guide signs should be placed upstream for the ramp anywhere from one-quarter of a mile to one mile, depending on the local conditions. Generally, the distance upstream is dictated by a number of factors, including intervening roadways and other guide signs. It is not desirable to have an intersecting roadway or guide signs for other destinations between the guide sign directing vehicles to a lane and the interchange ramps. The distance of the guide signs from the ramps may also depend on the
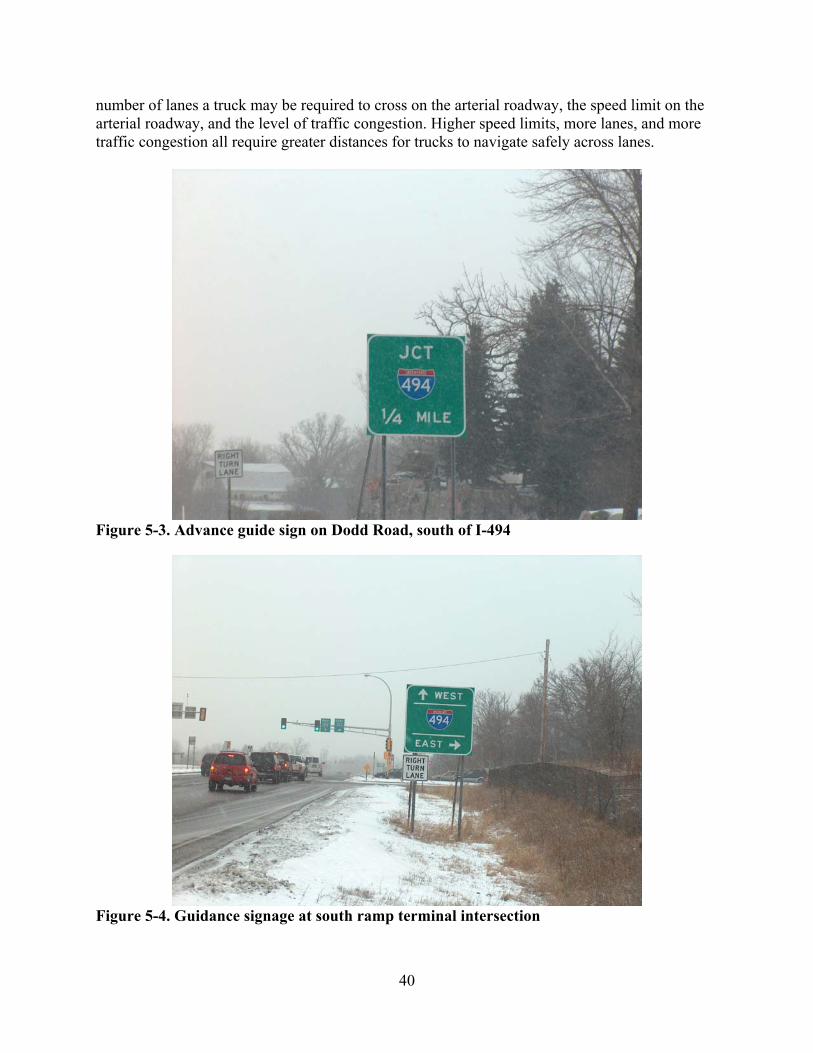
40
number of lanes a truck may be required to cross on the arterial roadway, the speed limit on the arterial roadway, and the level of traffic congestion. Higher speed limits, more lanes, and more traffic congestion all require greater distances for trucks to navigate safely across lanes.
Figure 5-3. Advance guide sign on Dodd Road, south of I-494
Figure 5-4. Guidance signage at south ramp terminal intersection
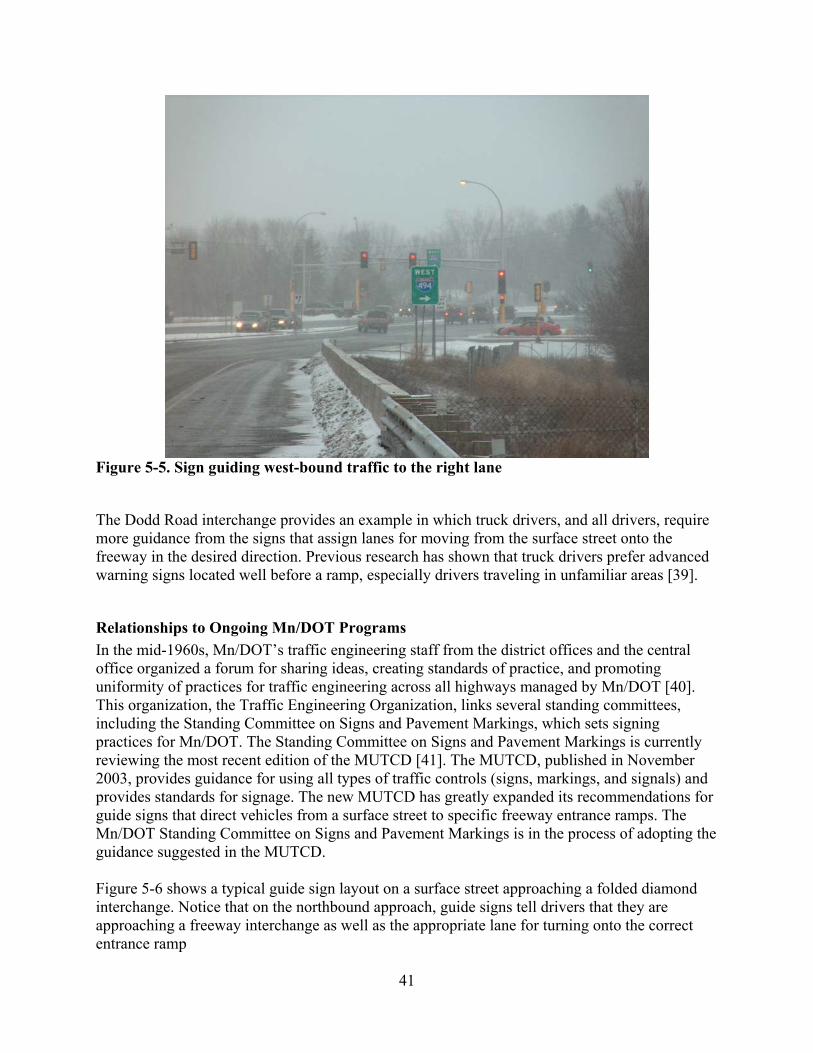
41
Figure 5-5. Sign guiding west-bound traffic to the right lane
The Dodd Road interchange provides an example in which truck drivers, and all drivers, require more guidance from the signs that assign lanes for moving from the surface street onto the freeway in the desired direction. Previous research has shown that truck drivers prefer advanced warning signs located well before a ramp, especially drivers traveling in unfamiliar areas [39].
Relationships to Ongoing Mn/DOT Programs In the mid-1960s, Mn/DOT’s traffic engineering staff from the district offices and the central office organized a forum for sharing ideas, creating standards of practice, and promoting uniformity of practices for traffic engineering across all highways managed by Mn/DOT [40]. This organization, the Traffic Engineering Organization, links several standing committees, including the Standing Committee on Signs and Pavement Markings, which sets signing practices for Mn/DOT. The Standing Committee on Signs and Pavement Markings is currently reviewing the most recent edition of the MUTCD [41]. The MUTCD, published in November 2003, provides guidance for using all types of traffic controls (signs, markings, and signals) and provides standards for signage. The new MUTCD has greatly expanded its recommendations for guide signs that direct vehicles from a surface street to specific freeway entrance ramps. The Mn/DOT Standing Committee on Signs and Pavement Markings is in the process of adopting the guidance suggested in the MUTCD. Figure 5-6 shows a typical guide sign layout on a surface street approaching a folded diamond interchange. Notice that on the northbound approach, guide signs tell drivers that they are approaching a freeway interchange as well as the appropriate lane for turning onto the correct entrance ramp
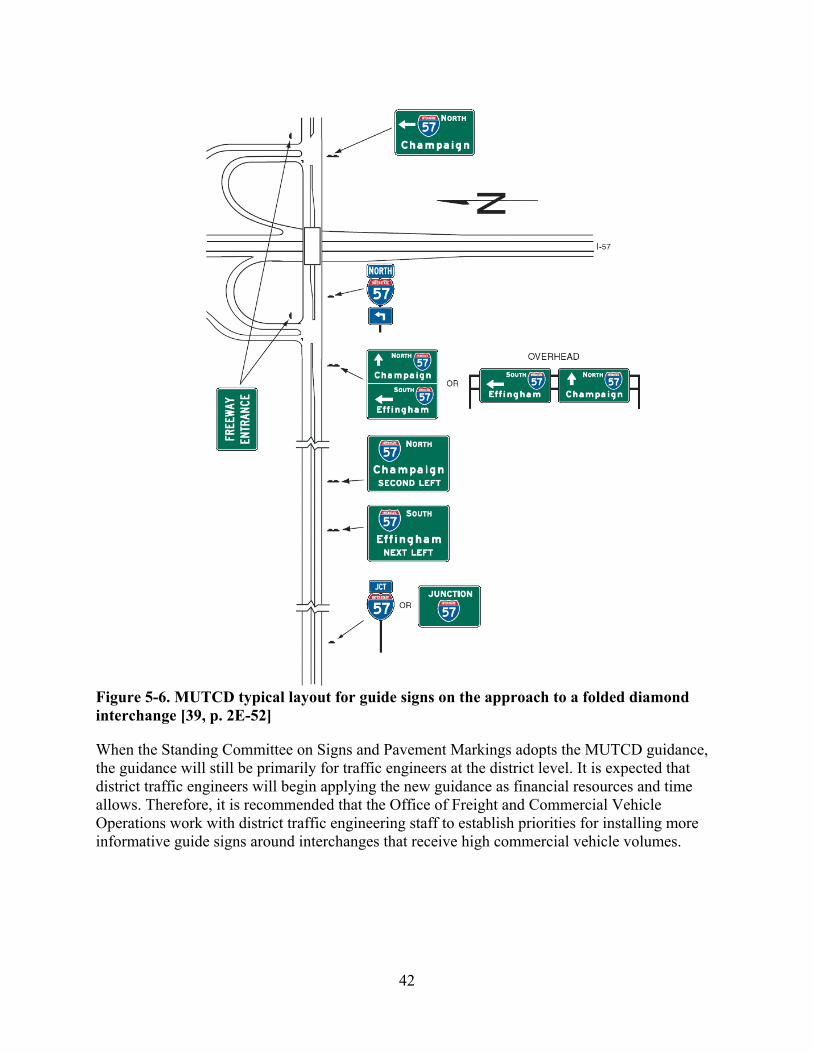
42
Figure 5-6. MUTCD typical layout for guide signs on the approach to a folded diamond interchange [39, p. 2E-52]
When the Standing Committee on Signs and Pavement Markings adopts the MUTCD guidance, the guidance will still be primarily for traffic engineers at the district level. It is expected that district traffic engineers will begin applying the new guidance as financial resources and time allows. Therefore, it is recommended that the Office of Freight and Commercial Vehicle Operations work with district traffic engineering staff to establish priorities for installing more informative guide signs around interchanges that receive high commercial vehicle volumes.
43
Other Experience with Guide Signs In a recent survey of states conducted for NCHRP study 314, over half of the responding states (12 of 22) indicated that they had improved informational or directional signage in response to increased truck traffic [42].
Benefits The benefits of providing additional lane assignment guidance signs relate both to safety and the cost of transportation services. Drivers given advanced lane assignment information have sufficient time to maneuver to the proper lanes and safely merge and position their vehicles to enter the correct entrance ramp. When trucks are in the incorrect lane on the approach to an interchange, they may miss the turn and be forced to circle back or merge into the correct lane with insufficient distance to safely change lanes. These missed turns result in addition travel time and distance, situations in which trucks must maneuver through local streets to circle back, or situations in which trucks must unsafely change lanes.
Costs The costs of additional guide signs vary tremendously, depending on the design of the signs and their location. The sign bridges used to mount overhead signs start at around $50,000 and could be more expensive, depending on the conditions. However, installing the roadside signs shown in Figure 5-6 (without the overhead signs) will cost roughly $23,000 to $29,000 for each approach to the interchange [43].
Institution and Policy Issues No institutional issues are envisioned. Some interviewed transportation professionals have voiced their resistance to this signage strategy because they felt that there is already a proliferation of signs around interchanges.
44
Chapter 6 Longer and Truck-Friendly Acceleration and Deceleration Lanes
Description This strategy deals with three separate road design features: (1) deceleration lanes, (2) acceleration lanes, and (3) median acceleration lanes. All three are speed change lanes for vehicles entering or leaving the highway. Acceleration and deceleration lanes are intended to reduce the speed differentials between through and turning vehicles. These lanes decrease the turbulence in the traffic flow and reduce the incidence of rear-end crashes resulting from vehicles traveling in the same direction at different speeds. Deceleration lanes are used in advance of intersections or interchanges for vehicles departing the highway. Left-turn deceleration lanes, and sometimes right-turn lanes, are used for vehicle storage and as speed-change lanes. Acceleration lanes are used for vehicles entering the roadway through an intersection or interchange and are typically on the right side of the facility. Median acceleration lanes are located at median crossovers on divided highways. A vehicle turning left onto a divided highway will use an acceleration lane, paved over the median adjacent to the median cross-section, and accelerate and merge with the left through lane from the left. While deceleration and acceleration lanes are commonly included at the intersections of high-speed roadways and at all freeway entrance and exit ramps, there are less than 15 median acceleration lanes in the state of Minnesota. Our discussion of each of their three features investigates national guidance on the length of these lanes, as well as guidance from Mn/DOT’s “Road Design Manual,” and then attempts to distill the relevant issues.
Deceleration Lanes “A Policy of Geometric Design of Highways and Streets” (the Green Book), published by the American Association of State Highway and Transportation Officials (AASHTO), encourages the use of deceleration lanes at intersections of major roadways (arterials), at intersections with minor arterials, or at higher functional class facilities wherever it is practical [44, p. 718]. Figure 6-1 shows a drawing of a four-lane highway intersecting a two-lane roadway. Although no attempt is made to draw the lanes to scale, the right- and left-turn deceleration lanes can be clearly seen. These lanes are intended to provide storage for turning vehicles so they do not block the through lane while vehicles wait to turn and provide a lane in which to change speed before making the turn, thus not blocking the through lanes while changing speed. The Green Book provides fairly specific guidance for deceleration lanes on a controlled-access facility (a freeway-like highway). The length of deceleration lanes are based on stopping sight distance (SSD). SSD is the distance traveled while reacting (assumed to take 2.5 seconds) and then braking to a stop at a deceleration rate of -11.2 ft/sec2. The braking rate is considered a comfortable rate of deceleration on a wet pavement. A wet pavement coefficient of friction is used to represent conditions that are not ideal. Semi-tractor-trailer combination trucks equipped with antilock braking systems (ABS) can achieve deceleration rates in controlled braking nearly equal to the rate the Green Book uses for passenger cars [45, p. 57]. The 2002 Vehicle Inventory
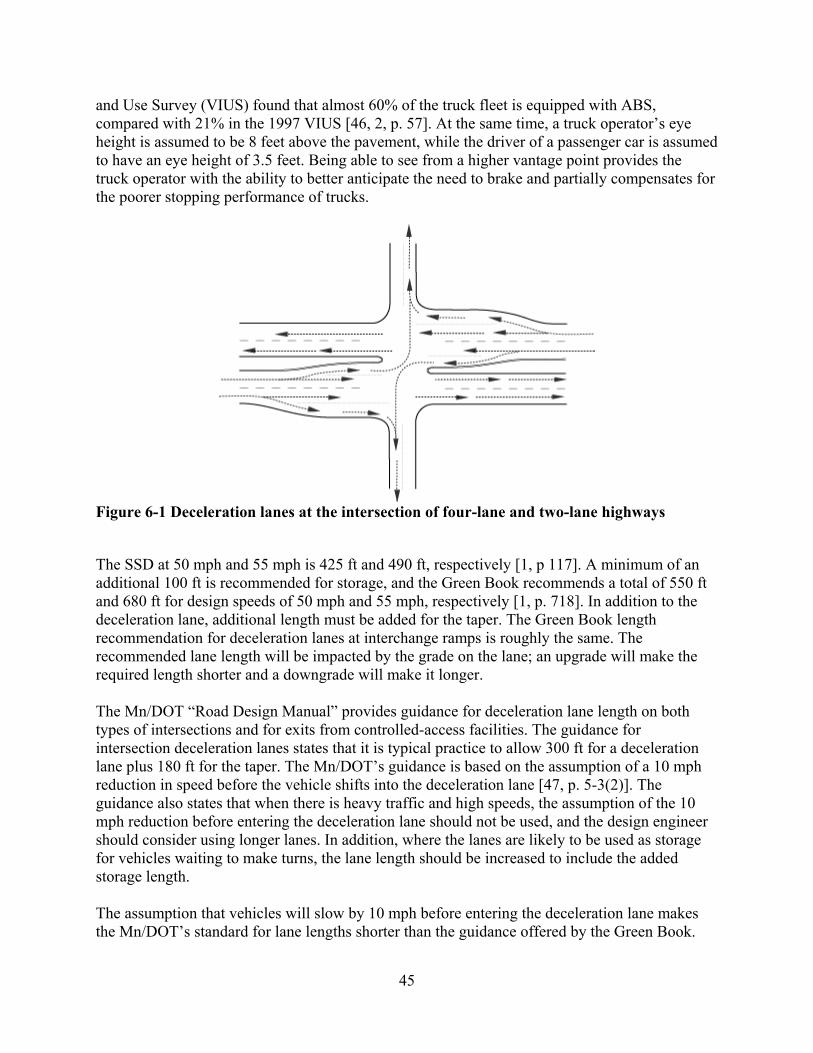
45
and Use Survey (VIUS) found that almost 60% of the truck fleet is equipped with ABS, compared with 21% in the 1997 VIUS [46, 2, p. 57]. At the same time, a truck operator’s eye height is assumed to be 8 feet above the pavement, while the driver of a passenger car is assumed to have an eye height of 3.5 feet. Being able to see from a higher vantage point provides the truck operator with the ability to better anticipate the need to brake and partially compensates for the poorer stopping performance of trucks.
Figure 6-1 Deceleration lanes at the intersection of four-lane and two-lane highways
The SSD at 50 mph and 55 mph is 425 ft and 490 ft, respectively [1, p 117]. A minimum of an additional 100 ft is recommended for storage, and the Green Book recommends a total of 550 ft and 680 ft for design speeds of 50 mph and 55 mph, respectively [1, p. 718]. In addition to the deceleration lane, additional length must be added for the taper. The Green Book length recommendation for deceleration lanes at interchange ramps is roughly the same. The recommended lane length will be impacted by the grade on the lane; an upgrade will make the required length shorter and a downgrade will make it longer. The Mn/DOT “Road Design Manual” provides guidance for deceleration lane length on both types of intersections and for exits from controlled-access facilities. The guidance for intersection deceleration lanes states that it is typical practice to allow 300 ft for a deceleration lane plus 180 ft for the taper. The Mn/DOT’s guidance is based on the assumption of a 10 mph reduction in speed before the vehicle shifts into the deceleration lane [47, p. 5-3(2)]. The guidance also states that when there is heavy traffic and high speeds, the assumption of the 10 mph reduction before entering the deceleration lane should not be used, and the design engineer should consider using longer lanes. In addition, where the lanes are likely to be used as storage for vehicles waiting to make turns, the lane length should be increased to include the added storage length. The assumption that vehicles will slow by 10 mph before entering the deceleration lane makes the Mn/DOT’s standard for lane lengths shorter than the guidance offered by the Green Book.
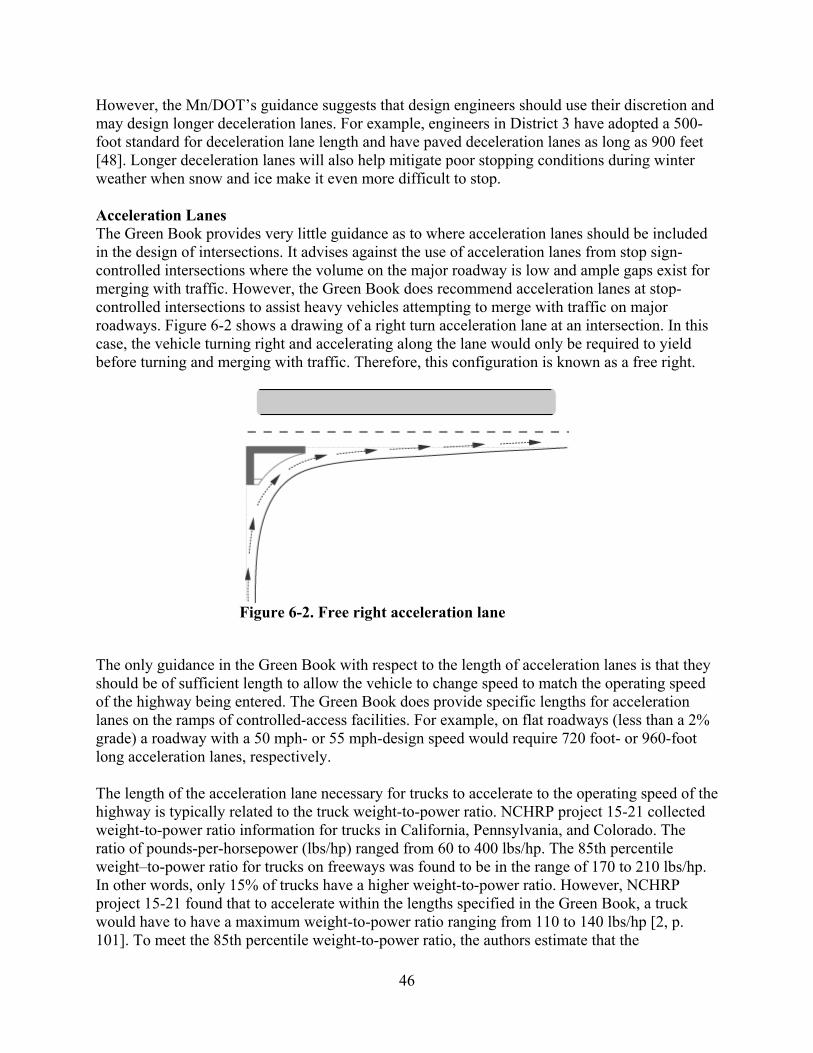
46
However, the Mn/DOT’s guidance suggests that design engineers should use their discretion and may design longer deceleration lanes. For example, engineers in District 3 have adopted a 500-foot standard for deceleration lane length and have paved deceleration lanes as long as 900 feet [48]. Longer deceleration lanes will also help mitigate poor stopping conditions during winter weather when snow and ice make it even more difficult to stop. Acceleration Lanes The Green Book provides very little guidance as to where acceleration lanes should be included in the design of intersections. It advises against the use of acceleration lanes from stop sign-controlled intersections where the volume on the major roadway is low and ample gaps exist for merging with traffic. However, the Green Book does recommend acceleration lanes at stop-controlled intersections to assist heavy vehicles attempting to merge with traffic on major roadways. Figure 6-2 shows a drawing of a right turn acceleration lane at an intersection. In this case, the vehicle turning right and accelerating along the lane would only be required to yield before turning and merging with traffic. Therefore, this configuration is known as a free right.
Figure 6-2. Free right acceleration lane
The only guidance in the Green Book with respect to the length of acceleration lanes is that they should be of sufficient length to allow the vehicle to change speed to match the operating speed of the highway being entered. The Green Book does provide specific lengths for acceleration lanes on the ramps of controlled-access facilities. For example, on flat roadways (less than a 2% grade) a roadway with a 50 mph- or 55 mph-design speed would require 720 foot- or 960-foot long acceleration lanes, respectively. The length of the acceleration lane necessary for trucks to accelerate to the operating speed of the highway is typically related to the truck weight-to-power ratio. NCHRP project 15-21 collected weight-to-power ratio information for trucks in California, Pennsylvania, and Colorado. The ratio of pounds-per-horsepower (lbs/hp) ranged from 60 to 400 lbs/hp. The 85th percentile weight–to-power ratio for trucks on freeways was found to be in the range of 170 to 210 lbs/hp. In other words, only 15% of trucks have a higher weight-to-power ratio. However, NCHRP project 15-21 found that to accelerate within the lengths specified in the Green Book, a truck would have to have a maximum weight-to-power ratio ranging from 110 to 140 lbs/hp [2, p. 101]. To meet the 85th percentile weight-to-power ratio, the authors estimate that the
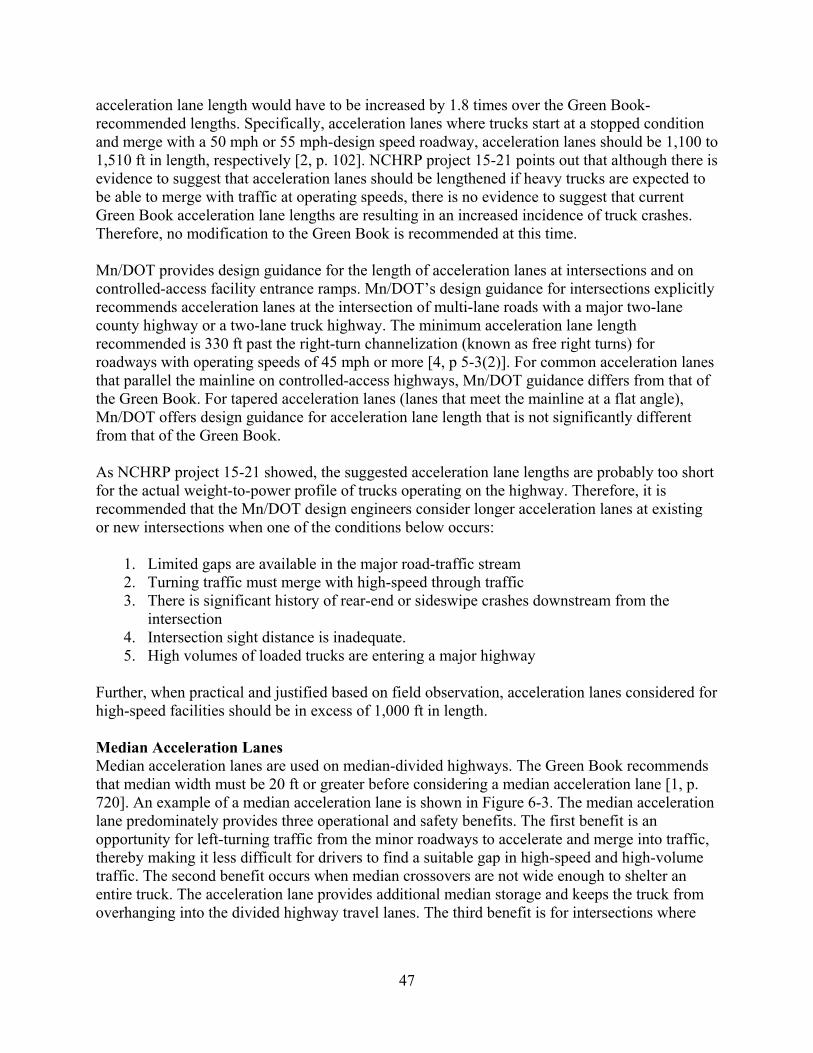
47
acceleration lane length would have to be increased by 1.8 times over the Green Book-recommended lengths. Specifically, acceleration lanes where trucks start at a stopped condition and merge with a 50 mph or 55 mph-design speed roadway, acceleration lanes should be 1,100 to 1,510 ft in length, respectively [2, p. 102]. NCHRP project 15-21 points out that although there is evidence to suggest that acceleration lanes should be lengthened if heavy trucks are expected to be able to merge with traffic at operating speeds, there is no evidence to suggest that current Green Book acceleration lane lengths are resulting in an increased incidence of truck crashes. Therefore, no modification to the Green Book is recommended at this time. Mn/DOT provides design guidance for the length of acceleration lanes at intersections and on controlled-access facility entrance ramps. Mn/DOT’s design guidance for intersections explicitly recommends acceleration lanes at the intersection of multi-lane roads with a major two-lane county highway or a two-lane truck highway. The minimum acceleration lane length recommended is 330 ft past the right-turn channelization (known as free right turns) for roadways with operating speeds of 45 mph or more [4, p 5-3(2)]. For common acceleration lanes that parallel the mainline on controlled-access highways, Mn/DOT guidance differs from that of the Green Book. For tapered acceleration lanes (lanes that meet the mainline at a flat angle), Mn/DOT offers design guidance for acceleration lane length that is not significantly different from that of the Green Book. As NCHRP project 15-21 showed, the suggested acceleration lane lengths are probably too short for the actual weight-to-power profile of trucks operating on the highway. Therefore, it is recommended that the Mn/DOT design engineers consider longer acceleration lanes at existing or new intersections when one of the conditions below occurs:
1. Limited gaps are available in the major road-traffic stream 2. Turning traffic must merge with high-speed through traffic 3. There is significant history of rear-end or sideswipe crashes downstream from the
intersection 4. Intersection sight distance is inadequate. 5. High volumes of loaded trucks are entering a major highway
Further, when practical and justified based on field observation, acceleration lanes considered for high-speed facilities should be in excess of 1,000 ft in length. Median Acceleration Lanes Median acceleration lanes are used on median-divided highways. The Green Book recommends that median width must be 20 ft or greater before considering a median acceleration lane [1, p. 720]. An example of a median acceleration lane is shown in Figure 6-3. The median acceleration lane predominately provides three operational and safety benefits. The first benefit is an opportunity for left-turning traffic from the minor roadways to accelerate and merge into traffic, thereby making it less difficult for drivers to find a suitable gap in high-speed and high-volume traffic. The second benefit occurs when median crossovers are not wide enough to shelter an entire truck. The acceleration lane provides additional median storage and keeps the truck from overhanging into the divided highway travel lanes. The third benefit is for intersections where
48
sight distance is inadequate. The acceleration lane allows the vehicle to accelerate and then merge with traffic with less sight distance. A 1986 Institute of Transportation Engineers (ITE) survey of 53 transportation agencies found that 13 of the respondents had used median acceleration lanes [49]. Respondents were split in their opinion regarding the desirability of acceleration lanes. The ITE concluded that the lanes appear to reduce crashes, promote efficiency in left-turn movements, and reduce conflicts, but insufficient data were available to quantify their safety and operational benefits. Harwood et al. recommend that highway agencies consider left-turn acceleration lanes at locations where adequate median width is available to pave an acceleration lane without compromising the median, and when the following attributes are true [7]:
1. Limited gaps are available in the major-road traffic streams 2. Turning traffic must merge with high-speed through traffic 3. There is significant history of rear-end or sideswipe accidents 4. Intersection sight distance is inadequate 5. There are high volumes of trucks entering the divided highway
Figure 6-3. Left-turn median acceleration lanes [50]
As of 2002, Mn/DOT had constructed ten expressway intersections with median acceleration lanes (MALs) [51]. The locations of these MALs are shown in Table 6-1. Some have since been eliminated when the intersection was upgraded to an interchange. In 2002, Mn/DOT conducted an evaluation involving nine of these intersections. Their evaluation measurements included the suggestion that operational performances be measured by delay, safety measured by crash rates, and the public’s perception measured through a mail-out opinion survey.
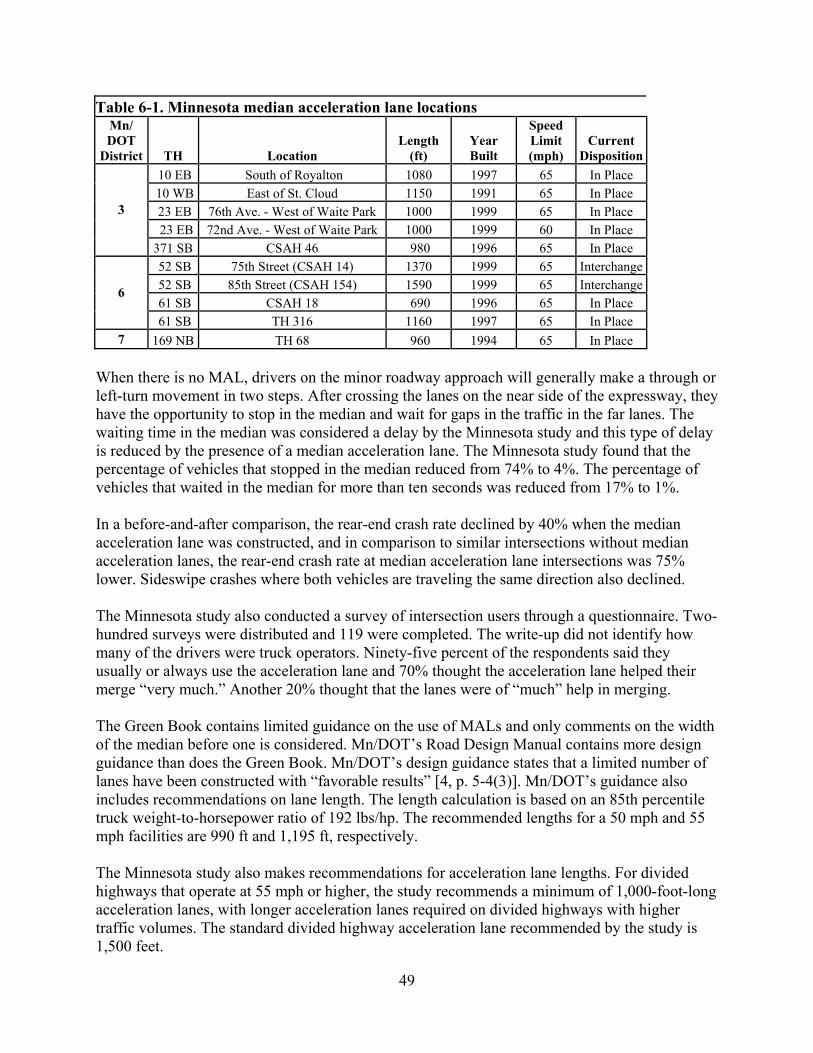
49
Table 6-1. Minnesota median acceleration lane locations Mn/ DOT
District TH Location Length
(ft) Year Built
Speed Limit (mph)
Current Disposition
10 EB South of Royalton 1080 1997 65 In Place 10 WB East of St. Cloud 1150 1991 65 In Place 23 EB 76th Ave. - West of Waite Park 1000 1999 65 In Place 23 EB 72nd Ave. - West of Waite Park 1000 1999 60 In Place
3
371 SB CSAH 46 980 1996 65 In Place 52 SB 75th Street (CSAH 14) 1370 1999 65 Interchange 52 SB 85th Street (CSAH 154) 1590 1999 65 Interchange 61 SB CSAH 18 690 1996 65 In Place
6
61 SB TH 316 1160 1997 65 In Place 7 169 NB TH 68 960 1994 65 In Place
When there is no MAL, drivers on the minor roadway approach will generally make a through or left-turn movement in two steps. After crossing the lanes on the near side of the expressway, they have the opportunity to stop in the median and wait for gaps in the traffic in the far lanes. The waiting time in the median was considered a delay by the Minnesota study and this type of delay is reduced by the presence of a median acceleration lane. The Minnesota study found that the percentage of vehicles that stopped in the median reduced from 74% to 4%. The percentage of vehicles that waited in the median for more than ten seconds was reduced from 17% to 1%. In a before-and-after comparison, the rear-end crash rate declined by 40% when the median acceleration lane was constructed, and in comparison to similar intersections without median acceleration lanes, the rear-end crash rate at median acceleration lane intersections was 75% lower. Sideswipe crashes where both vehicles are traveling the same direction also declined. The Minnesota study also conducted a survey of intersection users through a questionnaire. Two-hundred surveys were distributed and 119 were completed. The write-up did not identify how many of the drivers were truck operators. Ninety-five percent of the respondents said they usually or always use the acceleration lane and 70% thought the acceleration lane helped their merge “very much.” Another 20% thought that the lanes were of “much” help in merging. The Green Book contains limited guidance on the use of MALs and only comments on the width of the median before one is considered. Mn/DOT’s Road Design Manual contains more design guidance than does the Green Book. Mn/DOT’s design guidance states that a limited number of lanes have been constructed with “favorable results” [4, p. 5-4(3)]. Mn/DOT’s guidance also includes recommendations on lane length. The length calculation is based on an 85th percentile truck weight-to-horsepower ratio of 192 lbs/hp. The recommended lengths for a 50 mph and 55 mph facilities are 990 ft and 1,195 ft, respectively. The Minnesota study also makes recommendations for acceleration lane lengths. For divided highways that operate at 55 mph or higher, the study recommends a minimum of 1,000-foot-long acceleration lanes, with longer acceleration lanes required on divided highways with higher traffic volumes. The standard divided highway acceleration lane recommended by the study is 1,500 feet.
50
Relationships to Ongoing Mn/DOT Programs Mn/DOT’s guidance encourages design engineers to use engineering judgment when designing acceleration and deceleration lanes for intersections and controlled-access highway entrance and exit ramps. Mn/DOT’s Road Design Manual contains minimum recommended lengths and suggests that the design engineer use actual conditions to decide whether longer lanes or other design features would improve operations and safety. As we found from talking to design professionals within Mn/DOT, the need for longer acceleration and deceleration lanes under some conditions is recognized. Further, the Road Design Manual encourages designers to consider MALs where the right conditions exist for their use.
Implementation Mn/DOT is currently (in 2005) working on the publication of the first “Minnesota Comprehensive Highway Safety Plan,” and a draft interim plan has been prepared [52]. The eighth highest-ranked ranked strategy is “Cost Effective Intersection Improvement.” This strategy includes lengthening acceleration and deceleration lanes. It does not specifically include the use of MALs. The write-up of this strategy recommends targets for application but does not identify areas with heavy truck volumes as potential target locations for acceleration and deceleration lanes. Since the lengths of these lanes are explicitly designed around the performance of heavy trucks, the failure to mention the targeting of locations with high truck volumes is probably just an oversight. Therefore, it is recommended that the Office of Freight and Commercial Vehicle Operations work with the Traffic Safety Section to make sure that truck-related criteria are included in the guidance for the recommended improvements in future versions of the “Minnesota Comprehensive Highway Safety Plan.” Mn/DOT roadway design practices closely adhere to the design guidance offered by AASHTO in the Green Book and other AASHTO design guidance manuals, such as the “Roadside Design Guide.” Like most other state transportation agencies, Mn/DOT publishes its own “Road Design Manual” to help guide agency designers with local practices and standards. The Office of Technical Support prepares the Mn/DOT “Road Design Manual.” Mn/DOT’s current version of the “Road Design Manual” does not include advice for road designers to consider longer acceleration and deceleration lanes on roadways carrying high truck volume or along highways that access truck generating facilities, such as grain elevators, truck terminals, intermodal yards, etc. It is recommended that the Office of Freight and Commercial Vehicle Operations work with the Office of Technical Support to ensure that the next editions of Chapter 5 (“At-Grade Intersections”) and Chapter 6 (“Interchanges and Grade Separations”) contain language that encourages designers to consider longer acceleration and deceleration lanes on highways expected to carry high truck volumes and that specifies daily threshold volumes indicating when longer lanes should be considered (e.g., 400 heavy trucks per day).
Cost There is no cost for explicitly spelling out the need to accommodate the performance characteristics of heavy trucks in the “Minnesota Comprehensive Highway Safety Plan” or in Mn/DOT “Road Design Manual.” However, implementing longer acceleration and deceleration lanes can be costly. For example, if built separately, a 500-foot deceleration lane will cost around
51
$40,000, assuming no right-of-way has to be purchased. However, if the lane is part of a construction or reconstruction project, the cost of adding lanes while paving the entire intersection or entrance ramp typically results in a small incremental increase in cost.
Benefits Longer acceleration/deceleration lanes are known to improve the safety and efficiency of intersection operations. Other benefits include the following:
• Greater through capacity • Fewer delays • Reduction in rear-end and sideswipe crashes
The AASHTO Strategic Highway Safety Plan recommends adding left-turn and right-turn lanes (deceleration lanes) to unsignalled intersections as a moderately priced countermeasure [53].
Institution and Policy Issues There do not appear to be any institutional issues. In fact, the lack of design guidance in Mn/DOT’s “Road Design Manual” for considering trucks when designing the length of acceleration and deceleration lanes is probably an oversight. Additional assistance to reinforce recommendations regarding the special performance attributes of trucks will probably be welcomed.
52
Chapter 7 Conclusion/Recommendation
The research project, “Trucks and Twin Cities Traffic Management,” began by gathering potential strategies to reduce truck traffic congestion in the Twin Cities. Initially, a list of 38 potential strategies was developed and through successive evaluation was winnowed down to 5. All were high-priority strategies that can be accomplished in a short time frame (one to three years). Four of the five strategies deal with developing or revising processes and procedures and only one (achieving increased truck parking) could potentially result directly in new capital expenditures. The recommendations made include the following five:
1. Development of Minnesota guidance for planning, designing, specifying, and maintaining transportation facilities around heavy truck traffic generators. The guidance manual will help local governments better accommodate the transportation infrastructure demand of heavy truck generators and truck-oriented development. When the manual is first introduced, it is recommended that a training program be developed to accompany the manual’s introduction.
2. Outreach to explore legislation to hold Mn/DOT and enforcement agencies harmless from liability when conducting quick clearance activities. Many other states have found it necessary to hold first responders harmless from liability so that they can more aggressively clear disabled vehicles and spilled cargo from the roadway. There are clear benefits and costs related to protecting first responders from liability when they move vehicles and freight without the owner’s permission. These issues need to be explored further. Thus, it is recommended that the Office of Traffic, Security, and Operations develop an outreach plan to that end.
3. Increase commercial vehicle parking supplies on the urban fringe. There is a growing need for increased overnight truck parking around the Twin Cities. It is recommended that the Mn/DOT identify its role in providing truck parking, then reconsider the recommendations made in the 2001 Mn/DOT study “Nighttime Commercial Vehicle Parking Demand at 15 High-Use Minnesota Rest Areas.”
4. Improve advanced guide signage for freeway entrances. Mn/DOT is in the process of reviewing the 2003 MUTCD and then adopting the expanded guidance for interchange approach guide signs. Once adopted, Mn/DOT will begin upgrading its guide signs. Since this will take several years, it is recommended that the Office of Freight and Commercial Vehicle Operations work with district traffic engineers to define priorities for the interchange locations that should be upgraded first.
5. Develop longer and truck-friendly acceleration and deceleration lanes. There is evidence that acceleration lanes are too short for the performance characteristics of typical semi-tractor-trailer trucks. Therefore, at locations where there are high truck volumes, designers should consider longer acceleration lanes and the use of median left-turn acceleration lanes. It is recommended that the Office of Freight and Commercial Vehicle Operations work with the appropriate offices to develop explicit criteria to be considered. There is no cost for spelling out the need to accommodate the performance characteristics of heavy trucks in the guidance offered in the “Minnesota Comprehensive Highway Safety Plan” and in Mn/DOT’s “Road Design Manual.”
53
References
1. Schrank, D. and T. Lomax, The 2004 Urban Mobility Report (College Station, Texas: Texas
A&M University System, Texas Transportation Institute, September, 2004). 2. Schrank, D., and T. Lomax, The 2004 Urban Mobility Report: Performance Measurement
Summary for Minneapolis-St. Paul (College Station, Texas: Texas A&M University System, Texas Transportation Institute, September 2004).
3. Douglas, J.G., Strategies for Managing Increasing Truck Traffic: A Synthesis of Highway
Practice (Washington, D.C.: Transportation Research Board, National Cooperative Highway Program synthesis 314, 2003).
4. Street Smarts, Rizzo Associates, and Georgia Institute of Technology, Study of Hourly Truck
Movements around Atlanta (Atlanta, Georgia: Georgia Department of Transportation, 2003). 5. National Highway System Connectors to Freight Facilities in the Delaware Valley Region
(Philadelphia, PA: Delaware Valley Regional Planning Commission, June 2001). 6. Katz, Okitsu, and Associates, I-880 Corridor Truck Access Study: Final Report ( Oakland,
CA: Metropolitan Transportation Commission, December 1999). 7. Incident Management: Successful Practices: A Cross-Cutting Study: Improving Mobility and
Saving Lives (Washington, D.C.: Federal Highway Administration, FHWA-JOP-99-018, 2000).
8. Cragg, C.A., and M.J. Demetsky, Simulation Analysis of Route Diversions Strategies for
Freeway Incident Management (Virginal Transportation Research Council and Federal Highway Administration, VTRC 95-R11, 1995).
9. Sullivan, J., Highway Incident Safety for Emergency Responders (presentation) (Kansas City,
MO: 2002 Fire-Rescue International, August 23–26, 2002). 10. Cambridge Systematics, Inc., Texas Transportation Institute, University of Washington, and
Dowling Associates, Proving a Highway System with Reliable Travel Times: Study 3 – Reliability (Washington, D.C.: Transportation Research Board, Future Strategic Highway Research Program, September 2003).
11. Small, K.A., Winston, C., and Yan, Y. (Internet), Uncovering the Distribution of Motorists’
Preferences for Travel Time Reliability: Implications and Road Pricing, paper 546, University of California Transportation Center, Berkeley, 2003, http://www.uctc.net/papers/546.pdf.
54
12. Small, K.A., Noland, R., and Lewis, D., Valuation of Travel-Time Savings and Predictability
in Congested Conditions for Highway Users-Cost Estimation (Washington, D.C.: Transportation Research Board, National Cooperative Highway Research Program Report 431, 1999).
13. Smalkoski, B., and D. Levinson, “Value of Time for Commercial Vehicle Operators in
Minnesota,” Evanston, IL: Proceedings of the 45th Annual Forum of the Transportation Research Forum, March 2004.
14. Maze, T.H., M.R. Crum, and G. Bruchett, User Benefits of Winter Maintenance – Maintenance of Intercity Traffic Operations During Winter Storms (Ames, Iowa: Iowa State
University, Center for Transportation Research and Education and Midwest Transportation Consortium, January 2005).
15. Dunn, W. and S. P. Latoski, Safe and Quick Clearance of Traffic Incidents: A Synthesis of
Highway Practice (Washington, D.C.: Transportation Research Board, National Cooperative Highway Research Program Report 318, 2003).
16. National Committee on Uniform Traffic Laws and Ordinances (Internet), 1997 Uniform
Vehicle Code, Section 10, Alexandria, VA, http://www.ncutlo.org/modellaws.htm. 17. Reiss, R. and W. Dunn, Jr., Freeway Incident Management Handbook, Final Report
(Washington, D.C.: Federal Highway Administration, Report FHWA-HI-94-053, July 1991: 142).
18. Minnesota Department of Transportation, Freight Performance Measures: A Yardstick for
Minnesota’s Transportation System, Recommendations of the Minnesota Freight Advisory Committee (November 1999).
19. Private written communication with John Hausladen, President of the Minnesota Trucking
Association, March 3, 2005. The three points were taken verbatim from Mr. Housladen’s written comments.
20. Private communication with Nick Thompson, Manager of the Regional Transportation
Management Center, Minnesota Department of Transportation, March 1, 2005. 21. Federal Highway Administration (Internet), Report to Congress: Study of Adequacy of
Parking Facilities (Washington, DC: U.S. Department of Transportation, Federal Highway Administration, June 2002). http://safety.fhwa.dot.gov/media/repcong5.htm.
22. Duncan, D.G., representing the American Trucking Associations (Internet), Testimony before
the U.S. Senate Commerce, Science and Transportation Committee on Reauthorization of the Federal Motor Carrier Safety Administration. Washington, D.C., June 10, 2003, http://commerce.senate.gov/hearings/testimony.cfm?id-806&wit_id=2195.
55
23. Commercial Vehicle Safety Alliance (Internet), Letter to the ranking members of the U.S.
House of Representatives Committee on Transportation and Infrastructure supports the inclusion in the Transportation Reauthorization Bill Funding Rest Areas, Washington, D.C., March 2004, http://www.cvsa.org/resourcecenter/restarealetterupdated.pdf.
24. Truckload Carriers Association (Internet), TCA Epresses Support for Current Highway Bill
Truck Parking Provisions, Alexandria, VA, July 2004, http://www.truckload.org/members/2004/nl07_06_04.htm#a.
25 Spencer, T., Vice President of OOIDA (Internet), Testimony before the U.S. House of
Representatives Committee on Transportation and Infrastructure Subcommittee on Highways and Transit, Washington, D.C. July 2004, http://www.ooida.com/straight_talk/text_of_speech70902.html
26. Spencer, T. (Internet), Can Trucking Prep for the Future?, FHWA Talking Freight Seminar,
March 2004, http://www.fhwa.dot.gov/freightplanning/talking.htm. 27. Knipling, R.R., and J.S. Wang, Research Note. Crashes and Fatalities Related to Driver
Drowsiness/Fatigue (Washington, D.C.: National Highway Traffic Safety Administration, 1994).
28. Department of Transportation, Federal Motor Carriers Administration. Hours of Service of
Drivers. Notice of Proposed Rule-Making, 49 CFR Parts 385, 390, and 395 (3339–3355). January 24, 2005.
29. Maze, T.H., B.A. Taylor, and M. Nelson, of the Center for Transportation Research and
Education, Commercial Vehicle Parking (Iowa Department of Transportation, 1999).
30. SRF Consulting Group, Inc., Nighttime Commercial Vehicle Parking Demand at 15 High-Use Minnesota Rest Areas (Minnesota Department of Transportation, December 2001).
31. Minnesota Department of Transportation, Freight Performance Measures: A Yardstick for
Minnesota’s Transportation System, Recommendations of the Minnesota Freight Advisory Committee (November 1999).
32. National Transportation Safety Board (Internet), Highway Special Investigation Report:
Truck Parking Areas. Washington, D.C., May 17, 2000, http://www.ntsb.gov/publictn/2000/SIR0001.pdf.
33. Knipling, R.R., P. Waller, R.C. Peck, R. Pfefer, T.R., Neuman, K.L. Slack, and K.K. Hardy,
Guidance for Implementation of the AASHTO Strategic Highway Safety Plan: Volume 13: A Guide for Reducing Collisions Involving Heavy Trucks (Washington, D.C.: Transportation Research Board, NCHRP Report 500, 2004).
34. Wang, J.S., R.R. Knipling, and L.J. Blincoe, “The Dimensions of Motor Vehicle Crash
Risk,” Journal of Transportation and Statistics, vol 2, no. 1 (May 1999), 19-43.
56
35. Taylor, W.C., and N. Sung, “A Study of Highway Research Areas and Fatigue Related Truck
Crashes,” Proceedings of the Annual Meeting of the Transportation Research Board, Washington, D.C., 2000.
36. National Association for Truck Stop Operators, Truck Parking/Rest Area Commercialization
(Alexandra, VA, 2001). 37. Metropolitan Council, 2030 Transportation Policy Plan (St. Paul, Minnesota, December
2004). 38. Andrle, S., R. Boeckenstedt, and D. Kroeger (Internet), Alternatives to Truck Engine Idling,
Ames, Iowa: Iowa State University, Iowa Energy Center, June 2004, http://www.energy.iastate.edu/efficiency/transportation/cs/CTRE_EngineIdlingAlt.pdf.
39. Tribbett, L., P. McGowen, and J. Mounce, An Evaluation of Dynamic Curve Warning
Systems in the Sacramento River Canyon Final Report (Bozeman, MT: Montana State University, Western Transportation Institute, April 2000, p. 14).
40. Traffic Engineering Organization (Internet),
http://www.dot.state.mn.us/trafficeng/committees/teo.html. 41. Manual on Uniform Traffic Control Devices (Washington, D.C.: Federal Highway
Administration, U.S. Department of Transportation, 2003). 42. Douglas, J.G., Strategies for Managing Increasing Truck Traffic (NCHRP Synthesis 314,
2003). 43. Private correspondence with Michael Weiss, State Signing Engineer, Minnesota Department
of Transportation, St. Paul, Minnesota, March 7, 2005. 44. A Policy on Geometric Design of Highways and Streets: Fourth Edition (Washington, D.C.:
American Association of State Highway and Transportation Offices, 2001). 45. Harwood, D.W., D.J., Torbic, K.R. Richard, W.D. Glauz, L. Elefteriadou, Review of Truck
Characteristics as Factors in Roadway Design (Washington, D.C.: Transportation Research Board, National Cooperative Research Program Report 505, 2003).
46. Vehicle Inventory and Use Survey, (Washington, D.C.: U.S. Census Bureau, related
December 2004). 47. Minnesota Department of Transportation (Internet), Road Design Manual, St. Paul,
Minnesota, various dates depending on the chapter, http://www.dot.state.mn.us/tecsup/rdm/.
57
48. Private communication with Keith Jacobson, Maintenance Operations, Metro District,
Minnesota Department of Transportation, Roseville, Minnesota, 2004. 49. Effectiveness of Median Storage and Acceleration Lanes for Left-Turning Vehicles (Institute
of Transportation Engineers, Committee Report, 1986). 50. Harwood, D.W., Innovative Intersection Improvements (Kansas City, MO: Midwest
Research Institute). 51. Janson, C., Median Acceleration Lane Study Report (Rochester, Minnesota: Minnesota
Department of Transportation, District 6, Traffic Office, 2002). 52. CH2M Hill, Minnesota Comprehensive Highway Safety Plan (St. Paul, Minnesota:
Departments of Public Safety and of Transportation, March 2005). 53 Neuman, T.R., R. Pfefer, K.L. Slack, D.W. Harwood, I.B. Potts, D.J. Torbic, E.R.K. Rabbani,
Guidance for Implementation of the AASHTO Strategic Highway Safety Plan: Volume 5: A Guide for Addressing Unsignalized Intersection Collisions (Washington, D.C.: Transportation Research Board, NCHRP Report 500, 2003).
Appendix A
POTENTIAL TRANSPORTATION PLANNING STRATEGIES TO IMPROVE FREIGHT MOBILITY
THROUGH THE TWIN CITIES
A-1
INTRODUCTION The Minnesota Department of Transportation is studying means to improve freight mobility in and around the metropolitan area of Minneapolis and St. Paul. The area is subject to increasing traffic congestion that hampers commerce and decreases the quality of life for residents who must spend more time commuting than on other activities. This research project investigates highway-based improvements to improve travel times and the travel-time reliability of trucks in and through the Twin Cities. The objectives of the project are the following:
1. To qualitatively identify and assess the most promising strategies for managing the increasing truck volume in the Twin Cities metropolitan area
2. To provide an evaluation for the proposed strategies The strategies listed here are organized by function. At this point, the strategies presented are only for discussion purposes; they are not listed in order of implementation. The following are the types of strategies:
• Operational strategies. Operational strategies are those that necessitate operational management of the highway system.
• Driver-oriented strategies. Driver-oriented strategies are those that are geared toward Intelligent Transportation Systems (ITS) that use telecommunications and other technology to convey information and data to the drivers and operators to make better informed trip decisions.
• Capital investment strategies. Capital investment strategies necessitate long term improvements, investments, and engineering of facilities to handle freight travel better.
• Planning strategies. Planning strategies necessitate enhancing the transportation planning process to better address freight and truck travel through the area.
The following tables list examples for each type of strategy, where they have been implemented (if applicable), brief comments on the strategies’ strengths and weaknesses, and optimal operating environments for implementing the strategies.
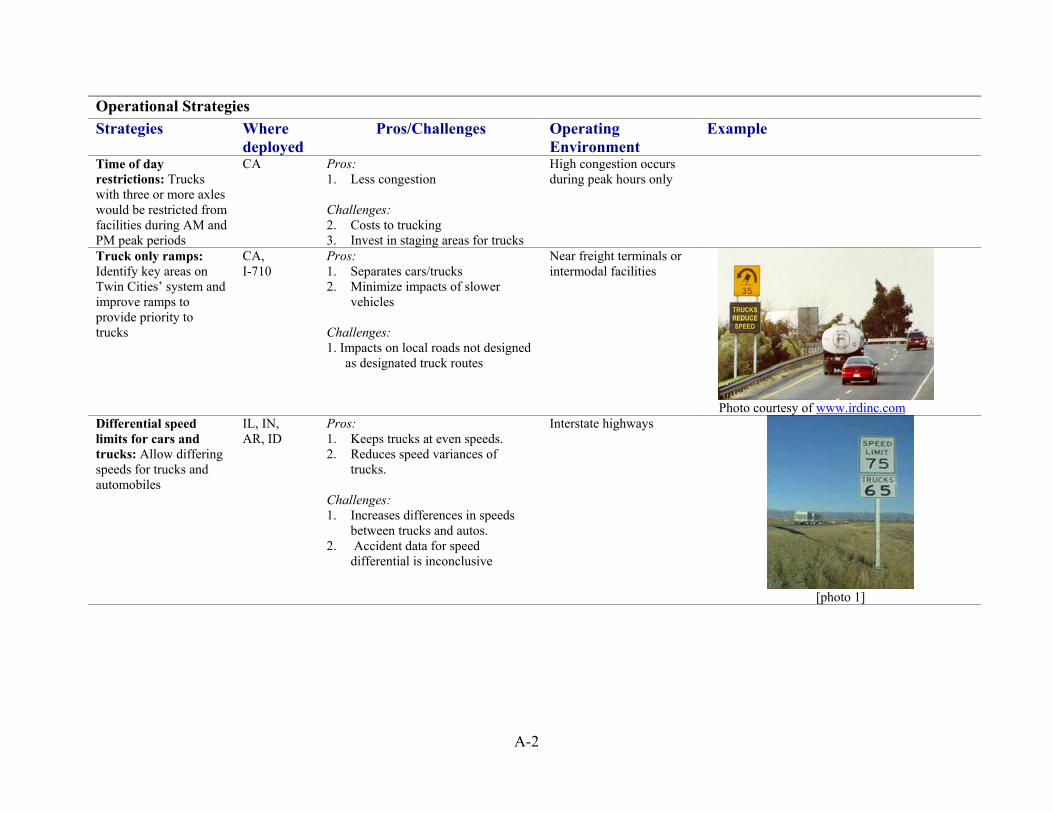
A-2
Operational Strategies Strategies Where
deployed Pros/Challenges Operating
Environment Example
Time of day restrictions: Trucks with three or more axles would be restricted from facilities during AM and PM peak periods
CA Pros: 1. Less congestion Challenges: 2. Costs to trucking 3. Invest in staging areas for trucks
High congestion occurs during peak hours only
Truck only ramps: Identify key areas on Twin Cities’ system and improve ramps to provide priority to trucks
CA, I-710
Pros: 1. Separates cars/trucks 2. Minimize impacts of slower
vehicles Challenges: 1. Impacts on local roads not designed
as designated truck routes
Near freight terminals or intermodal facilities
Photo courtesy of www.irdinc.com Differential speed limits for cars and trucks: Allow differing speeds for trucks and automobiles
IL, IN, AR, ID
Pros: 1. Keeps trucks at even speeds. 2. Reduces speed variances of
trucks. Challenges: 1. Increases differences in speeds
between trucks and autos. 2. Accident data for speed
differential is inconclusive
Interstate highways
[photo 1]
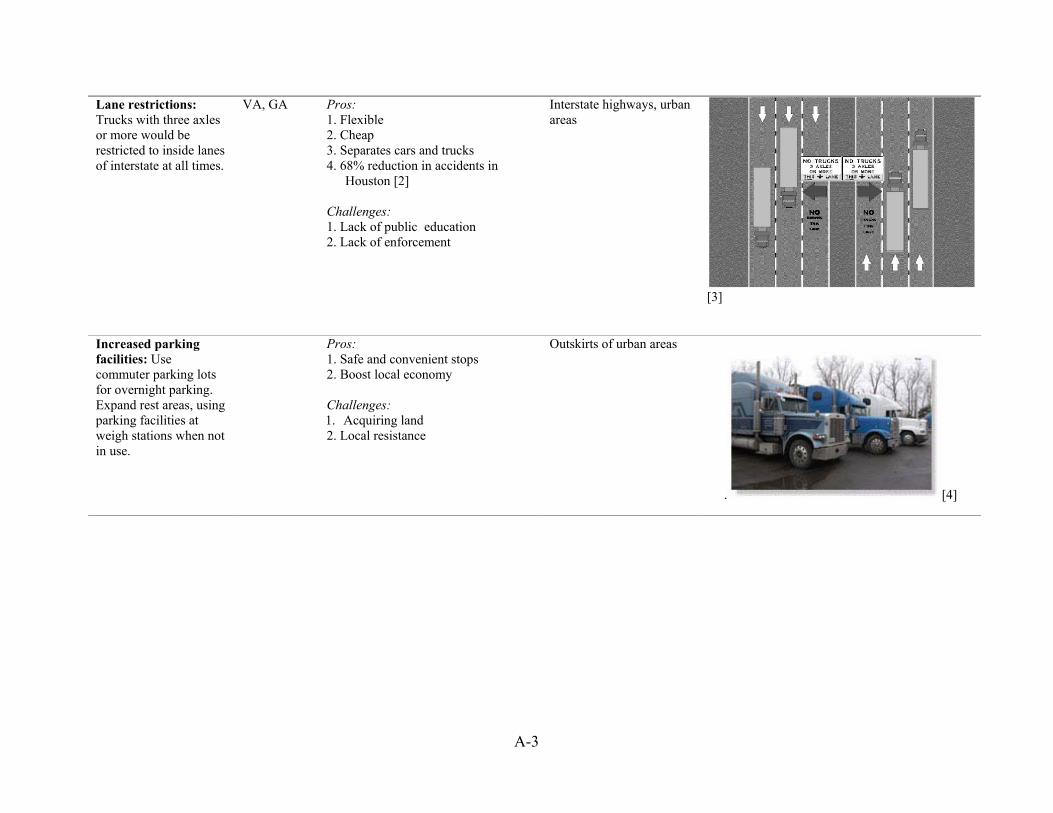
A-3
Lane restrictions: Trucks with three axles or more would be restricted to inside lanes of interstate at all times.
VA, GA Pros: 1. Flexible 2. Cheap 3. Separates cars and trucks 4. 68% reduction in accidents in
Houston [2] Challenges: 1. Lack of public education 2. Lack of enforcement
Interstate highways, urban areas
[3]
Increased parking facilities: Use commuter parking lots for overnight parking. Expand rest areas, using parking facilities at weigh stations when not in use.
Pros: 1. Safe and convenient stops 2. Boost local economy Challenges: 1. Acquiring land 2. Local resistance
Outskirts of urban areas
. [4]
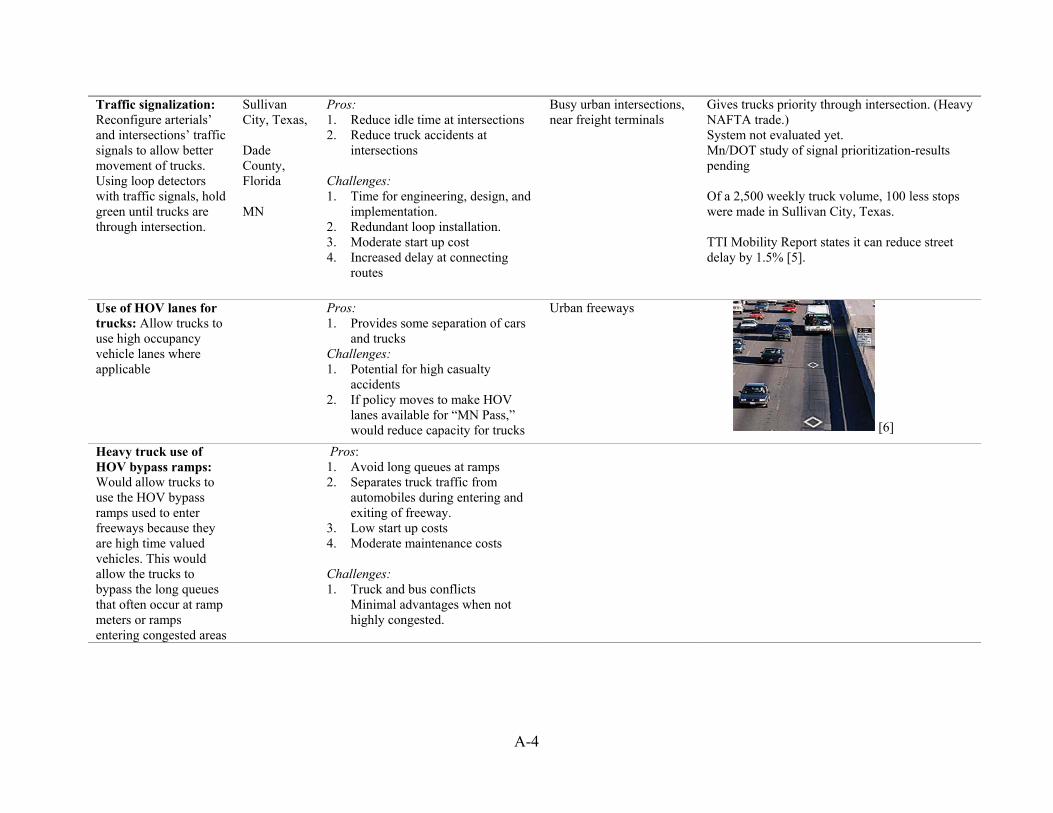
A-4
Traffic signalization: Reconfigure arterials’ and intersections’ traffic signals to allow better movement of trucks. Using loop detectors with traffic signals, hold green until trucks are through intersection.
Sullivan City, Texas, Dade County, Florida MN
Pros: 1. Reduce idle time at intersections 2. Reduce truck accidents at
intersections Challenges: 1. Time for engineering, design, and
implementation. 2. Redundant loop installation. 3. Moderate start up cost 4. Increased delay at connecting
routes
Busy urban intersections, near freight terminals
Gives trucks priority through intersection. (Heavy NAFTA trade.) System not evaluated yet. Mn/DOT study of signal prioritization-results pending Of a 2,500 weekly truck volume, 100 less stops were made in Sullivan City, Texas. TTI Mobility Report states it can reduce street delay by 1.5% [5].
Use of HOV lanes for trucks: Allow trucks to use high occupancy vehicle lanes where applicable
Pros: 1. Provides some separation of cars
and trucks Challenges: 1. Potential for high casualty
accidents 2. If policy moves to make HOV
lanes available for “MN Pass,” would reduce capacity for trucks
Urban freeways
[6]
Heavy truck use of HOV bypass ramps: Would allow trucks to use the HOV bypass ramps used to enter freeways because they are high time valued vehicles. This would allow the trucks to bypass the long queues that often occur at ramp meters or ramps entering congested areas
Pros: 1. Avoid long queues at ramps 2. Separates truck traffic from
automobiles during entering and exiting of freeway.
3. Low start up costs 4. Moderate maintenance costs Challenges: 1. Truck and bus conflicts
Minimal advantages when not highly congested.
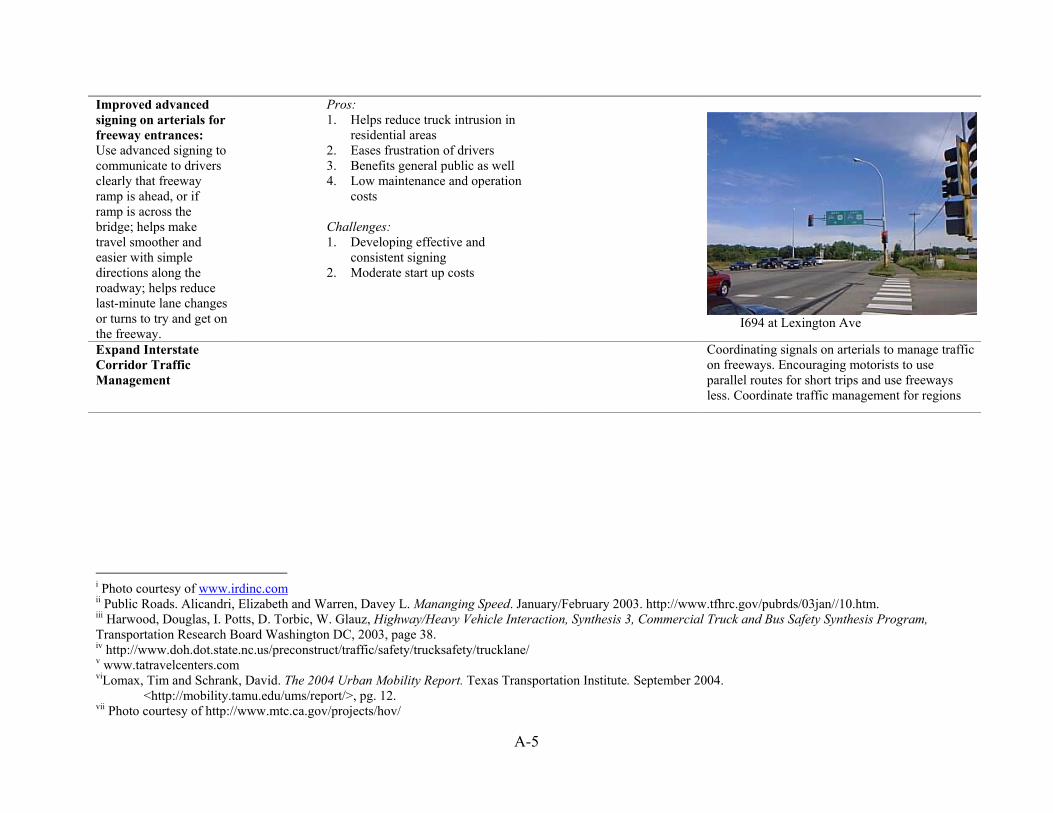
A-5
Improved advanced signing on arterials for freeway entrances: Use advanced signing to communicate to drivers clearly that freeway ramp is ahead, or if ramp is across the bridge; helps make travel smoother and easier with simple directions along the roadway; helps reduce last-minute lane changes or turns to try and get on the freeway.
Pros: 1. Helps reduce truck intrusion in
residential areas 2. Eases frustration of drivers 3. Benefits general public as well 4. Low maintenance and operation
costs Challenges: 1. Developing effective and
consistent signing 2. Moderate start up costs
I694 at Lexington Ave
Expand Interstate Corridor Traffic Management
Coordinating signals on arterials to manage traffic on freeways. Encouraging motorists to use parallel routes for short trips and use freeways less. Coordinate traffic management for regions
i Photo courtesy of www.irdinc.com ii Public Roads. Alicandri, Elizabeth and Warren, Davey L. Mananging Speed. January/February 2003. http://www.tfhrc.gov/pubrds/03jan//10.htm. iii Harwood, Douglas, I. Potts, D. Torbic, W. Glauz, Highway/Heavy Vehicle Interaction, Synthesis 3, Commercial Truck and Bus Safety Synthesis Program, Transportation Research Board Washington DC, 2003, page 38. iv http://www.doh.dot.state.nc.us/preconstruct/traffic/safety/trucksafety/trucklane/ v www.tatravelcenters.com viLomax, Tim and Schrank, David. The 2004 Urban Mobility Report. Texas Transportation Institute. September 2004.
<http://mobility.tamu.edu/ums/report/>, pg. 12. vii Photo courtesy of http://www.mtc.ca.gov/projects/hov/
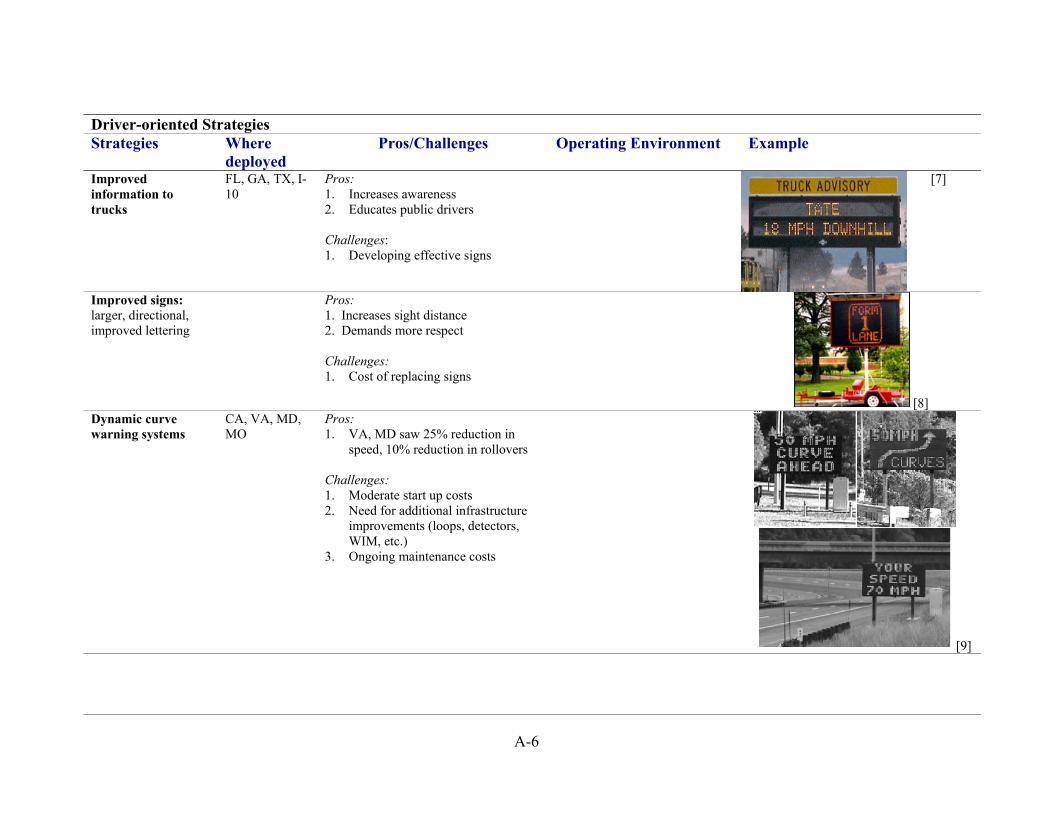
A-6
Driver-oriented Strategies Strategies Where
deployed Pros/Challenges Operating Environment Example
Improved information to trucks
FL, GA, TX, I-10
Pros: 1. Increases awareness 2. Educates public drivers Challenges: 1. Developing effective signs
[7]
Improved signs: larger, directional, improved lettering
Pros: 1. Increases sight distance 2. Demands more respect Challenges: 1. Cost of replacing signs
[8] Dynamic curve warning systems
CA, VA, MD, MO
Pros: 1. VA, MD saw 25% reduction in
speed, 10% reduction in rollovers Challenges: 1. Moderate start up costs 2. Need for additional infrastructure
improvements (loops, detectors, WIM, etc.)
3. Ongoing maintenance costs
[9]
A-7
Weather and road conditions
511 Coalition Pros: 1. Allows for advanced planning 2. Increased safety
[10]
Improved information on road conditions, construction, incidents, weather: Refine tools to warn drivers of incidents, weather and road conditions; includes RWIS, bridge anti-icing devices, fog-detection, MDSS, etc.
MN, IA, SD, ND,
Pros: 1. Allows drivers to take detours 2. Increased safety Challenges: 1. Coordinate with other agencies. 2. Compare results
[11] Improved information of truck-related service facilities (regulatory, fuel, service, medical, mechanical)
Pros: 1. Allows for better planning for drivers Challenges: 1. Management and storage of
information
Provide additional information with Minnesota’s CDL and Trucking Regulations handbooks, similar to Michigan Truck Safety Center. Information may include rest areas and other locations that offer truck parking, fatigue management strategies, weigh station locations, Canadian border crossing information, and web sites of federal/state agencies, safety organizations, and Canadian government. Other information may be locations of medical and veterinary facilities and truck repair facilities viii
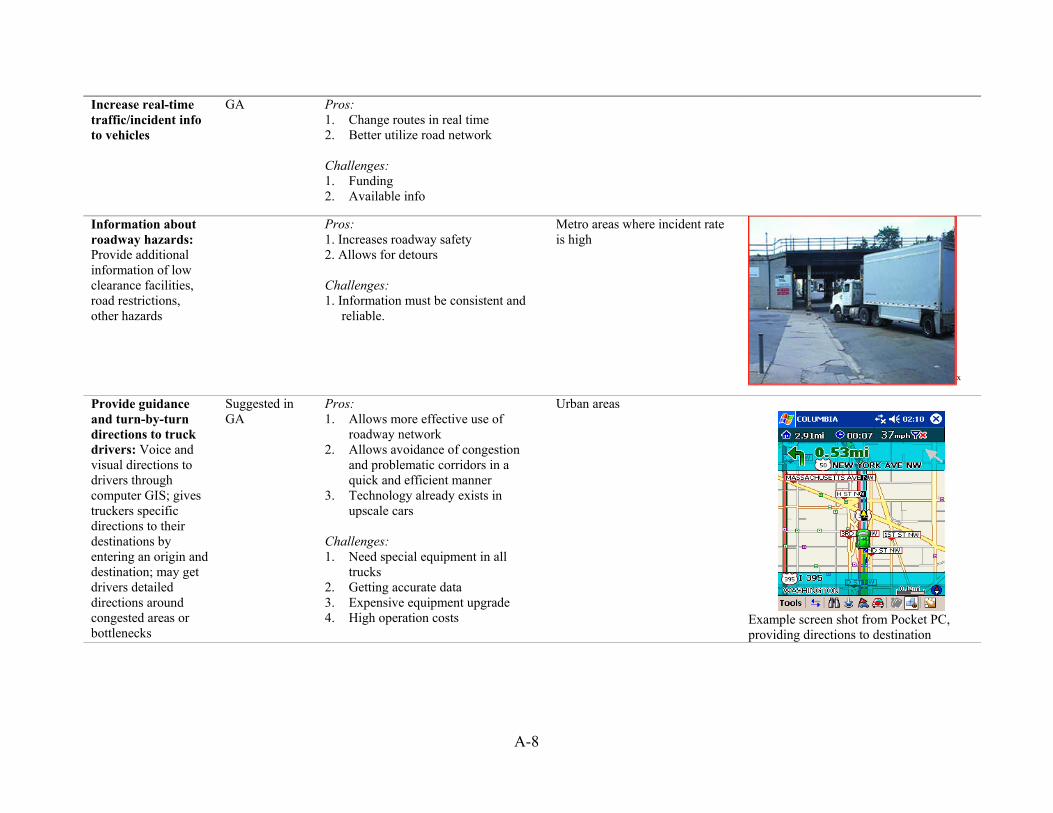
A-8
Increase real-time traffic/incident info to vehicles
GA Pros: 1. Change routes in real time 2. Better utilize road network Challenges: 1. Funding 2. Available info
Information about roadway hazards: Provide additional information of low clearance facilities, road restrictions, other hazards
Pros: 1. Increases roadway safety 2. Allows for detours Challenges: 1. Information must be consistent and
reliable.
Metro areas where incident rate is high
x
Provide guidance and turn-by-turn directions to truck drivers: Voice and visual directions to drivers through computer GIS; gives truckers specific directions to their destinations by entering an origin and destination; may get drivers detailed directions around congested areas or bottlenecks
Suggested in GA
Pros: 1. Allows more effective use of
roadway network 2. Allows avoidance of congestion
and problematic corridors in a quick and efficient manner
3. Technology already exists in upscale cars
Challenges: 1. Need special equipment in all
trucks 2. Getting accurate data 3. Expensive equipment upgrade 4. High operation costs
Urban areas
Example screen shot from Pocket PC, providing directions to destination
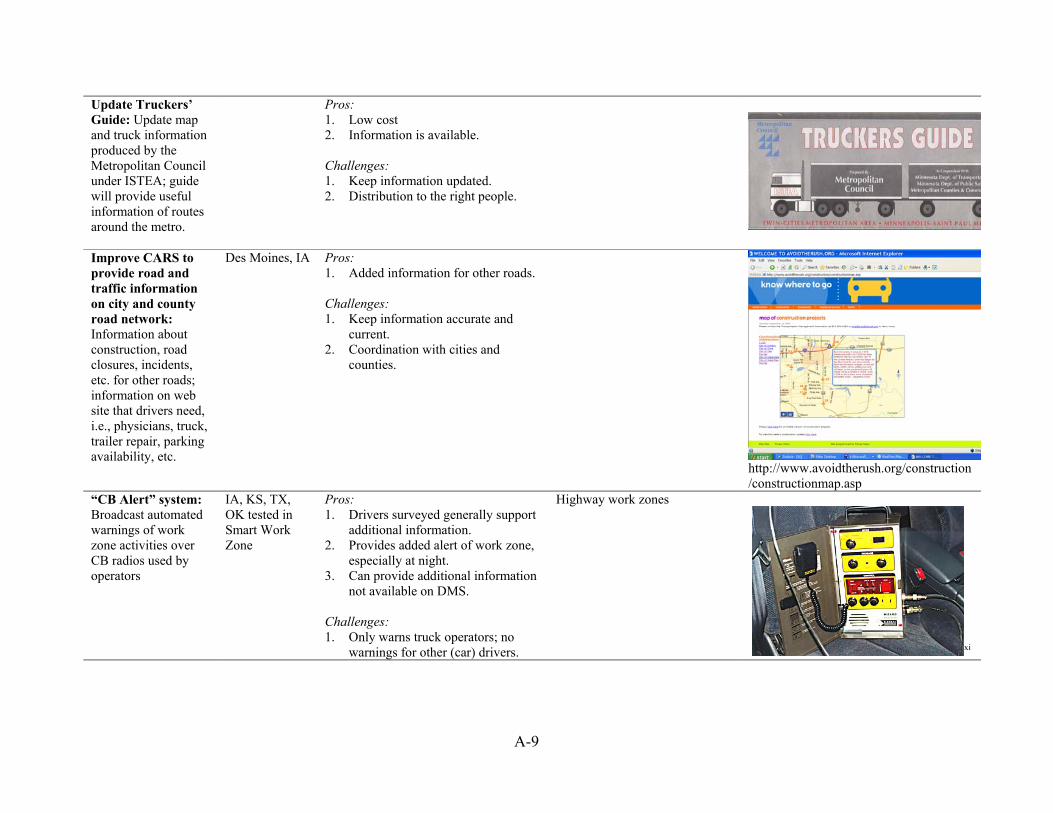
A-9
Update Truckers’ Guide: Update map and truck information produced by the Metropolitan Council under ISTEA; guide will provide useful information of routes around the metro.
Pros: 1. Low cost 2. Information is available. Challenges: 1. Keep information updated. 2. Distribution to the right people.
Improve CARS to provide road and traffic information on city and county road network: Information about construction, road closures, incidents, etc. for other roads; information on web site that drivers need, i.e., physicians, truck, trailer repair, parking availability, etc.
Des Moines, IA Pros: 1. Added information for other roads. Challenges: 1. Keep information accurate and
current. 2. Coordination with cities and
counties.
http://www.avoidtherush.org/construction/constructionmap.asp
“CB Alert” system: Broadcast automated warnings of work zone activities over CB radios used by operators
IA, KS, TX, OK tested in Smart Work Zone
Pros: 1. Drivers surveyed generally support
additional information. 2. Provides added alert of work zone,
especially at night. 3. Can provide additional information
not available on DMS. Challenges: 1. Only warns truck operators; no
warnings for other (car) drivers.
Highway work zones
xi
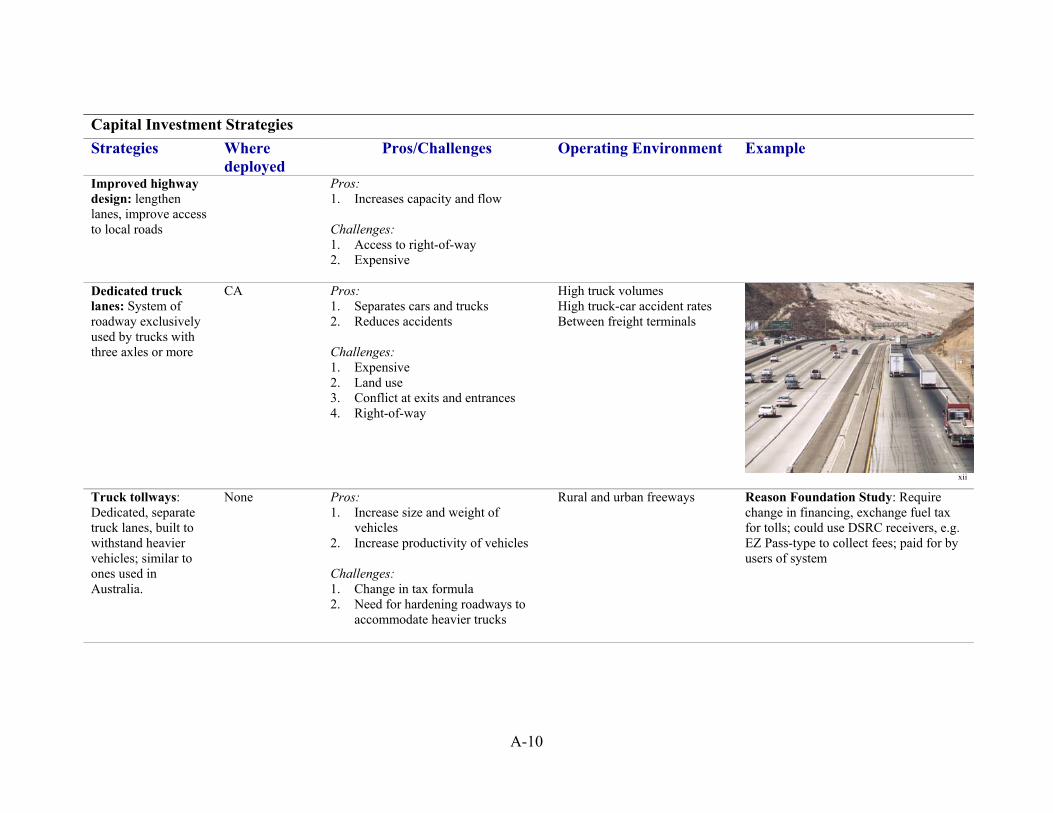
A-10
Capital Investment Strategies Strategies Where
deployed Pros/Challenges Operating Environment Example
Improved highway design: lengthen lanes, improve access to local roads
Pros: 1. Increases capacity and flow Challenges: 1. Access to right-of-way 2. Expensive
Dedicated truck lanes: System of roadway exclusively used by trucks with three axles or more
CA Pros: 1. Separates cars and trucks 2. Reduces accidents Challenges: 1. Expensive 2. Land use 3. Conflict at exits and entrances 4. Right-of-way
High truck volumes High truck-car accident rates Between freight terminals
xii Truck tollways: Dedicated, separate truck lanes, built to withstand heavier vehicles; similar to ones used in Australia.
None Pros: 1. Increase size and weight of
vehicles 2. Increase productivity of vehicles Challenges: 1. Change in tax formula 2. Need for hardening roadways to
accommodate heavier trucks
Rural and urban freeways
Reason Foundation Study: Require change in financing, exchange fuel tax for tolls; could use DSRC receivers, e.g. EZ Pass-type to collect fees; paid for by users of system
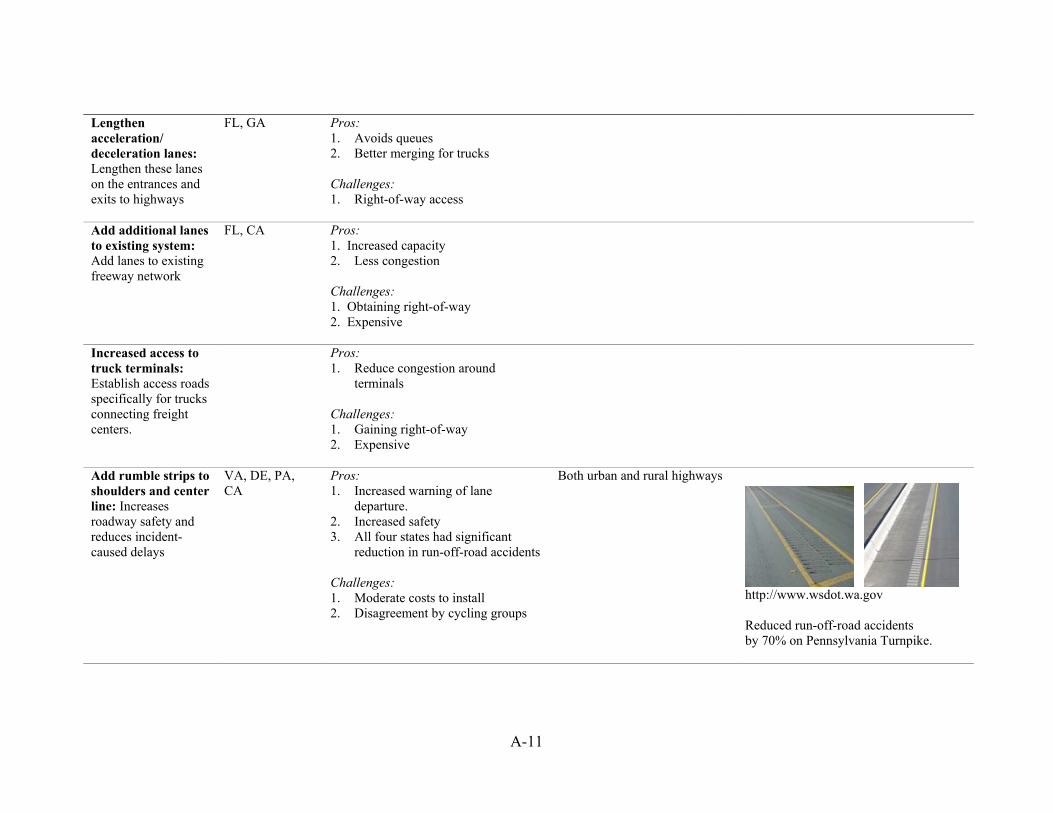
A-11
Lengthen acceleration/ deceleration lanes: Lengthen these lanes on the entrances and exits to highways
FL, GA Pros: 1. Avoids queues 2. Better merging for trucks Challenges: 1. Right-of-way access
Add additional lanes to existing system: Add lanes to existing freeway network
FL, CA Pros: 1. Increased capacity 2. Less congestion Challenges: 1. Obtaining right-of-way 2. Expensive
Increased access to truck terminals: Establish access roads specifically for trucks connecting freight centers.
Pros: 1. Reduce congestion around
terminals Challenges: 1. Gaining right-of-way 2. Expensive
Add rumble strips to shoulders and center line: Increases roadway safety and reduces incident-caused delays
VA, DE, PA, CA
Pros: 1. Increased warning of lane
departure. 2. Increased safety 3. All four states had significant
reduction in run-off-road accidents Challenges: 1. Moderate costs to install 2. Disagreement by cycling groups
Both urban and rural highways
http://www.wsdot.wa.gov Reduced run-off-road accidents by 70% on Pennsylvania Turnpike.
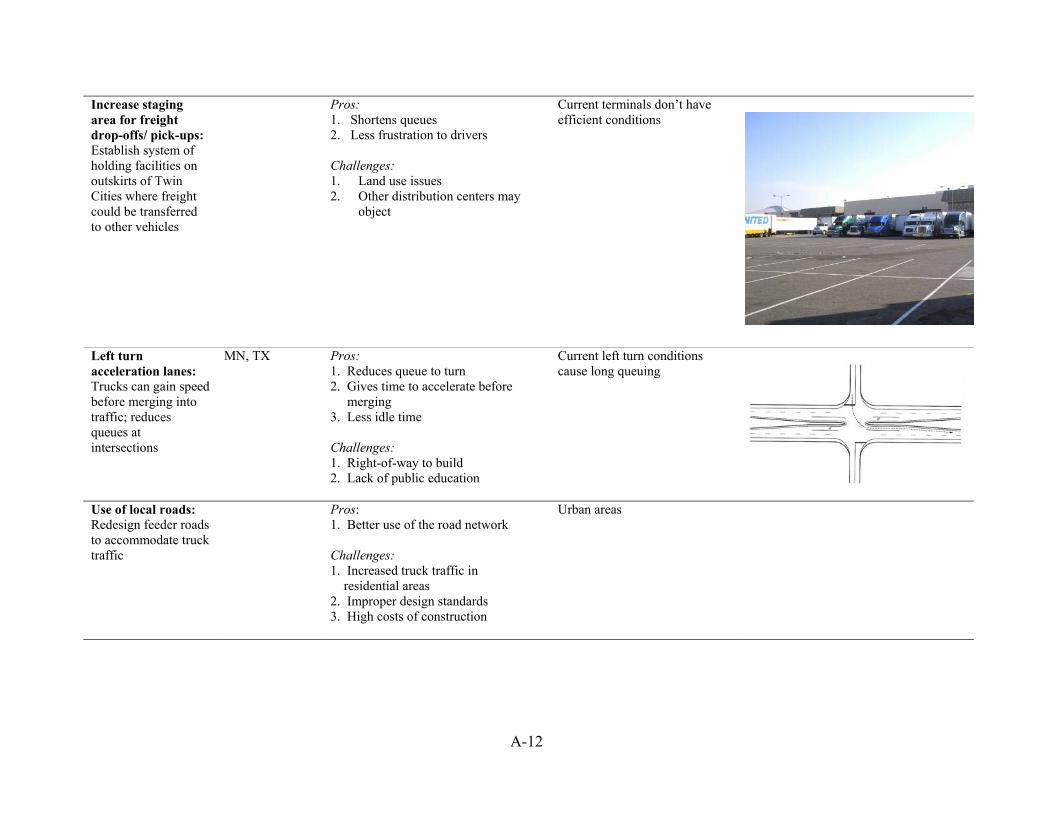
A-12
Increase staging area for freight drop-offs/ pick-ups: Establish system of holding facilities on outskirts of Twin Cities where freight could be transferred to other vehicles
Pros: 1. Shortens queues 2. Less frustration to drivers Challenges: 1. Land use issues 2. Other distribution centers may
object
Current terminals don’t have efficient conditions
Left turn acceleration lanes: Trucks can gain speed before merging into traffic; reduces queues at intersections
MN, TX Pros: 1. Reduces queue to turn 2. Gives time to accelerate before
merging 3. Less idle time Challenges: 1. Right-of-way to build 2. Lack of public education
Current left turn conditions cause long queuing
Use of local roads: Redesign feeder roads to accommodate truck traffic
Pros: 1. Better use of the road network Challenges: 1. Increased truck traffic in residential areas 2. Improper design standards 3. High costs of construction
Urban areas
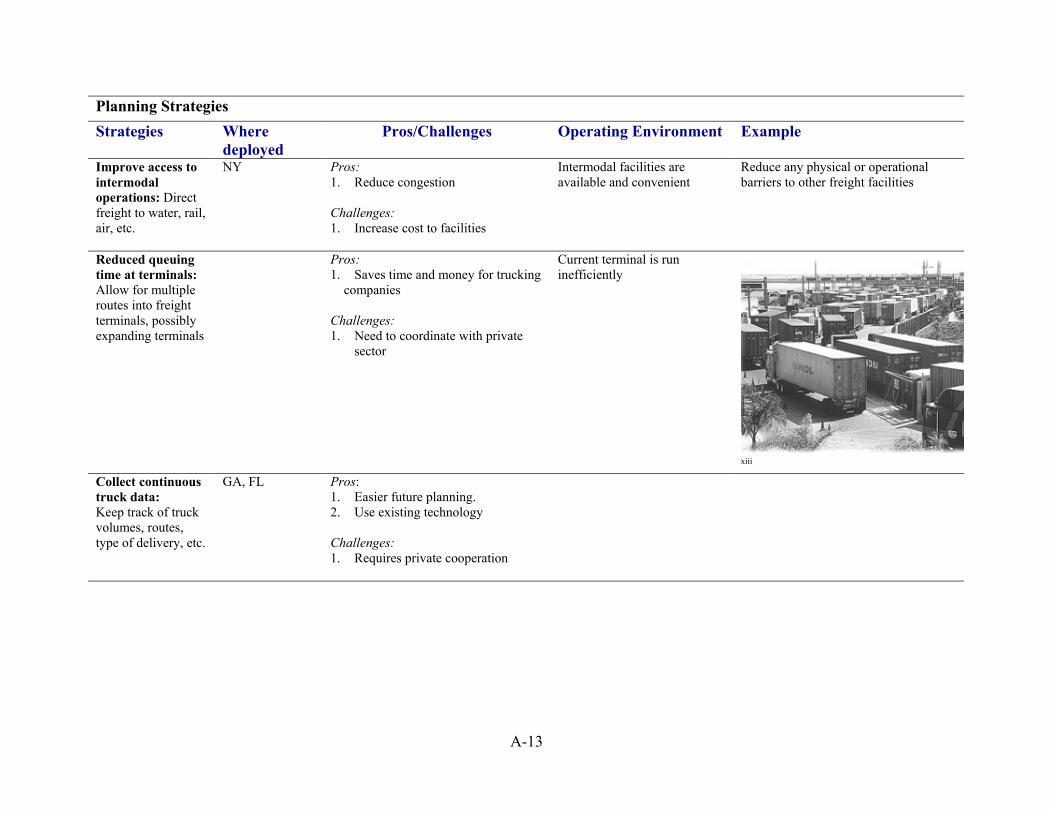
A-13
Planning Strategies Strategies Where
deployed Pros/Challenges Operating Environment Example
Improve access to intermodal operations: Direct freight to water, rail, air, etc.
NY Pros: 1. Reduce congestion Challenges: 1. Increase cost to facilities
Intermodal facilities are available and convenient
Reduce any physical or operational barriers to other freight facilities
Reduced queuing time at terminals: Allow for multiple routes into freight terminals, possibly expanding terminals
Pros: 1. Saves time and money for trucking companies Challenges: 1. Need to coordinate with private
sector
Current terminal is run inefficiently
xiii Collect continuous truck data: Keep track of truck volumes, routes, type of delivery, etc.
GA, FL Pros: 1. Easier future planning. 2. Use existing technology Challenges: 1. Requires private cooperation
A-14
Increase role of Freight Advisory Council: Incorporate freight issues into the planning process
PA Pros: 1. Increased cooperation between
public/private sectors 2. Improve intermodal connectivity 3. Improve operating conditions for
commercial vehicles 4. Increase access to economic
activity centers Challenges: 1. Agency can become reactive rather
than proactive 2. Need to identify funding sources 3. Must ensure that small projects do
not supersede large, needed projects
Delaware Valley Regional Planning Commission (DVRC) uses Freight Forward, to which operators, dispatchers, and other users submit project ideas directly to DVRC for small capital project improvements. Projects that can be advanced under Freight Forward include the following:
• fixing a pothole • resurfacing a highway/railroad
grade crossing • installing a directional sign • increasing turning radii • retiming traffic signals • striping pavement • improving railroad siding
Develop criteria for evaluating projects: Investigate process for reducing truck congestion and improving freight flows and safety
Pros: 1. Systematic approach to funding Challenges: 1. Develop mechanism for ranking
projects
(investigating these issues)
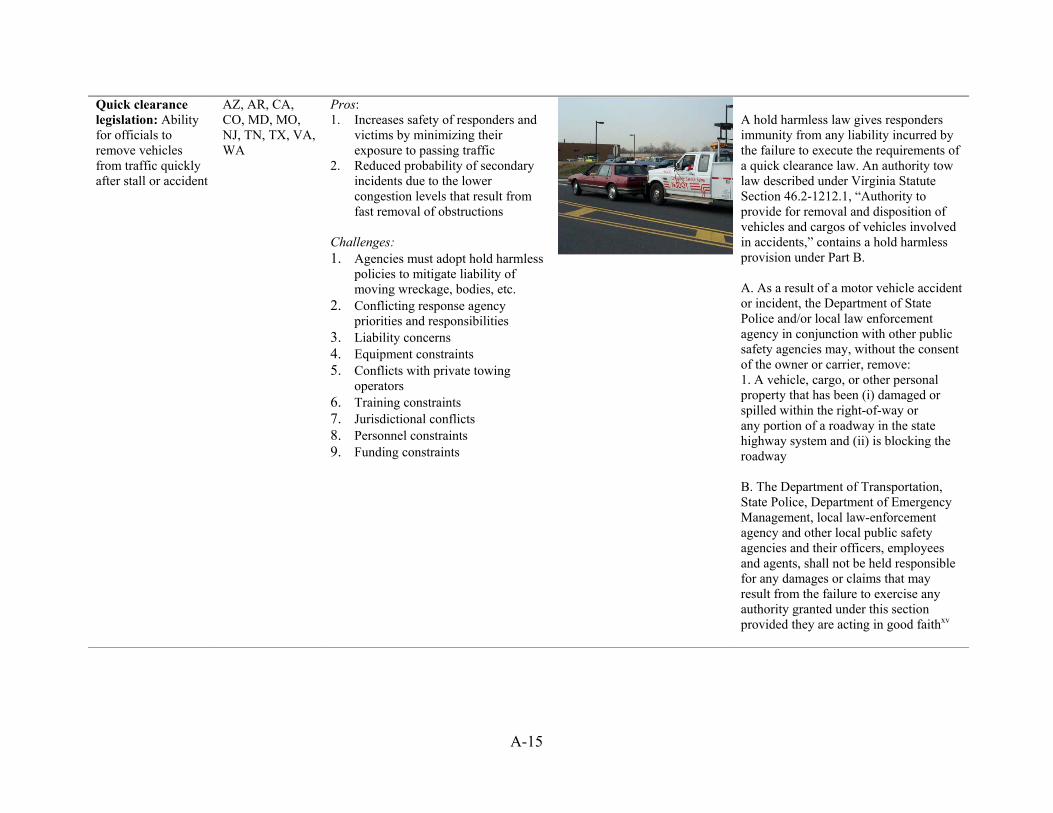
A-15
Quick clearance legislation: Ability for officials to remove vehicles from traffic quickly after stall or accident
AZ, AR, CA, CO, MD, MO, NJ, TN, TX, VA, WA
Pros: 1. Increases safety of responders and
victims by minimizing their exposure to passing traffic
2. Reduced probability of secondary incidents due to the lower congestion levels that result from fast removal of obstructions
Challenges: 1. Agencies must adopt hold harmless
policies to mitigate liability of moving wreckage, bodies, etc.
2. Conflicting response agency priorities and responsibilities
3. Liability concerns 4. Equipment constraints 5. Conflicts with private towing
operators 6. Training constraints 7. Jurisdictional conflicts 8. Personnel constraints 9. Funding constraints
� A hold harmless law gives responders immunity from any liability incurred by the failure to execute the requirements of a quick clearance law. An authority tow law described under Virginia Statute Section 46.2-1212.1, “Authority to provide for removal and disposition of vehicles and cargos of vehicles involved in accidents,” contains a hold harmless provision under Part B. A. As a result of a motor vehicle accident or incident, the Department of State Police and/or local law enforcement agency in conjunction with other public safety agencies may, without the consent of the owner or carrier, remove: 1. A vehicle, cargo, or other personal property that has been (i) damaged or spilled within the right-of-way or any portion of a roadway in the state highway system and (ii) is blocking the roadway B. The Department of Transportation, State Police, Department of Emergency Management, local law-enforcement agency and other local public safety agencies and their officers, employees and agents, shall not be held responsible for any damages or claims that may result from the failure to exercise any authority granted under this section provided they are acting in good faithxv
A-16
REFERENCES
1. Public Roads. Alicandri, Elizabeth and Warren, Davey L. Mananging Speed. January/February 2003. http://www.tfhrc.gov/pubrds/03jan//10.htm.
2. Harwood, Douglas, I. Potts, D. Torbic, W. Glauz, Highway/Heavy Vehicle Interaction, Synthesis 3, Commercial Truck and Bus Safety Synthesis Program, Transportation Research Board Washington DC, 2003, page 38.
3. http://www.doh.dot.state.nc.us/preconstruct/traffic/safety/trucksafety/trucklane/
4. www.tatravelcenters.com
5. Lomax, Tim and Schrank, David. The 2004 Urban Mobility Report. Texas Transportation Institute. September 2004. http://mobility.tamu.edu/ums/report/
6. Photo courtesy of http://www.mtc.ca.gov/projects/hov/
7. Oregon DOT Downhill Speed Advisory sign http://www.odot.state.or.us/trucking/its/greenlight/whatsnew.htm
8. http://www.barco.com.au/prod_matvms/.html
9. California DOT dynamic curve warning systems, Harwood, Douglas, I. Potts, D. Torbic, W. Glauz, Highway/Heavy Vehicle Interaction, Synthesis 3, Commercial Truck and Bus Safety Synthesis Program, Transportation Research Board Washington DC, 2003, page 48.
10. Photo courtesy of www.511mn.org
11. Virginia Department of Transportation, http://www.virginiadot.org/infoservice/news/newsrelease-stc-alerts.asp
Appendix B
RESULTS OF THE TWIN CITIES TRUCK MOBILITY SURVEY
B-1
1.0. INTRODUCTION Traffic congestion is recognized as a severe impediment to traveling through the Twin Cities metropolitan area. Iowa State University’s Center for Transportation Research and Education (CTRE) conducted a survey for the Minnesota Department of Transportation to determine strategies for improving the flow of truck travel through the Twin Cities. The Minnesota Trucking Association sent the surveys below regarding trucking conditions in the Twin Cities to 483 of their members. Of the 483 surveys, 88 were returned completed. The 18% return rate was considered large enough to provide reasonable general opinions of the trucking companies in the Twin Cities area. A copy of the survey is provided below. The survey consisted of four “Yes, No, Not Sure” response questions that were specific to each individual company and their opinions. The survey also included 14 statements that requested each respondent to rate a specific attribute of the transportation infrastructure in the Twin Cities. The responses were based on a Likert-type scale, with “1” indicating “Not Satisfied” and 5 indicating “Very Satisfied.” At the end of the survey, the respondents were asked to specify the type of operation they were involved with (e.g., truckload, less-than-truckload) as well as their role in the operation (e.g., manager, owner, driver). Respondents were also asked to select the types of freight they hauled and the type and number of trucks they operated. The following responses to the survey are divided between Truckload carriers (TL) and Less-than-truckload carriers (LTL), and other (sand and gravel haulers, drayage firms, utility companies, etc.). Of the 88 responses received, 54 were from TL Carriers, 19 were from LTL Carriers, and 15 were from other or specialized carriers.
2.0. THE SURVEY The survey was designed to gather information in three primary areas: Part 1 contained questions to solicit general opinions from the responding firms about the Twin Cities region, Part 2 solicited opinions about specific freight-related infrastructure in the Twin Cities, and Part 3 asked for specific details about the firm and allowed respondents to provide any additional comments about operating in the Twin Cities. Part 1 consisted of four questions oriented towards the condition of the Twin Cities highway system in general, and not a specific attribute of the highway system. Respondents were instructed to answer the questions by circling either “Yes”, “No”, or “Not Sure.” The following questions were presented in this section:
1. Do you believe that significant improvements are needed to roadways in the Twin Cities
area in order to facilitate freight movements throughout the area? 2. Are there enough signs and/or marking of routes to freight terminals, other highways, low
clearance bridges, truck routes, etc.?
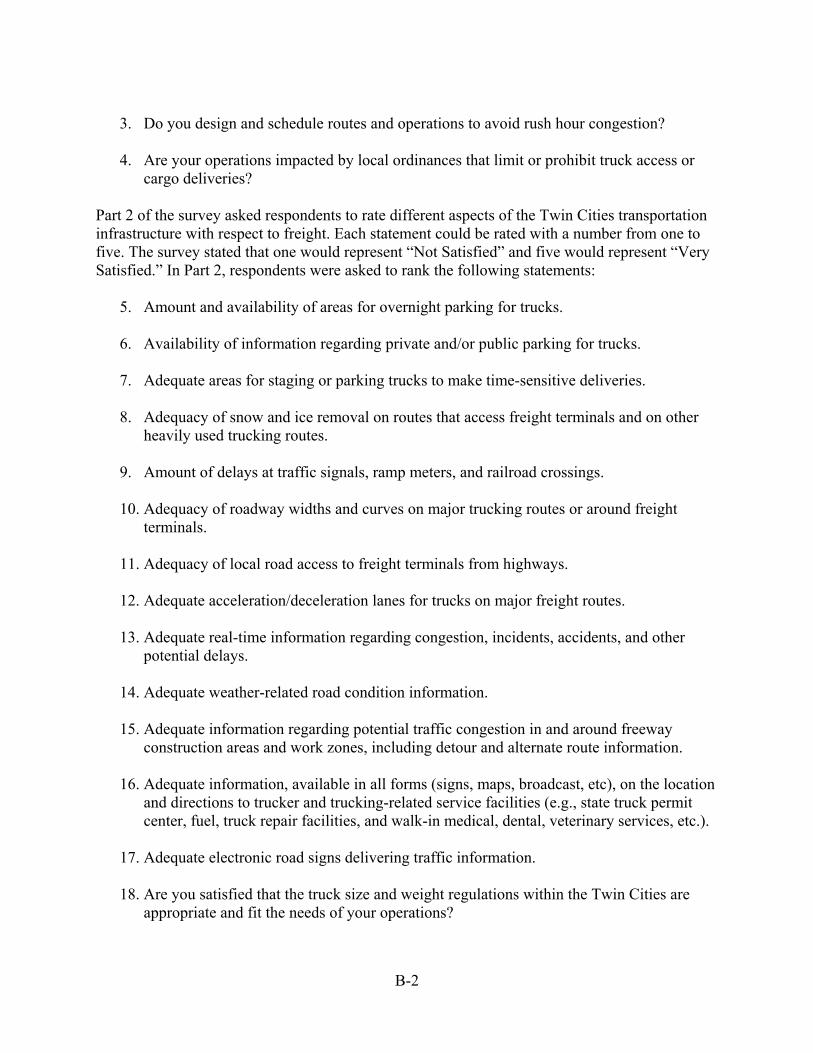
B-2
3. Do you design and schedule routes and operations to avoid rush hour congestion?
4. Are your operations impacted by local ordinances that limit or prohibit truck access or
cargo deliveries? Part 2 of the survey asked respondents to rate different aspects of the Twin Cities transportation infrastructure with respect to freight. Each statement could be rated with a number from one to five. The survey stated that one would represent “Not Satisfied” and five would represent “Very Satisfied.” In Part 2, respondents were asked to rank the following statements:
5. Amount and availability of areas for overnight parking for trucks. 6. Availability of information regarding private and/or public parking for trucks.
7. Adequate areas for staging or parking trucks to make time-sensitive deliveries.
8. Adequacy of snow and ice removal on routes that access freight terminals and on other
heavily used trucking routes. 9. Amount of delays at traffic signals, ramp meters, and railroad crossings.
10. Adequacy of roadway widths and curves on major trucking routes or around freight
terminals. 11. Adequacy of local road access to freight terminals from highways.
12. Adequate acceleration/deceleration lanes for trucks on major freight routes.
13. Adequate real-time information regarding congestion, incidents, accidents, and other
potential delays. 14. Adequate weather-related road condition information.
15. Adequate information regarding potential traffic congestion in and around freeway
construction areas and work zones, including detour and alternate route information. 16. Adequate information, available in all forms (signs, maps, broadcast, etc), on the location
and directions to trucker and trucking-related service facilities (e.g., state truck permit center, fuel, truck repair facilities, and walk-in medical, dental, veterinary services, etc.).
17. Adequate electronic road signs delivering traffic information.
18. Are you satisfied that the truck size and weight regulations within the Twin Cities are
appropriate and fit the needs of your operations?
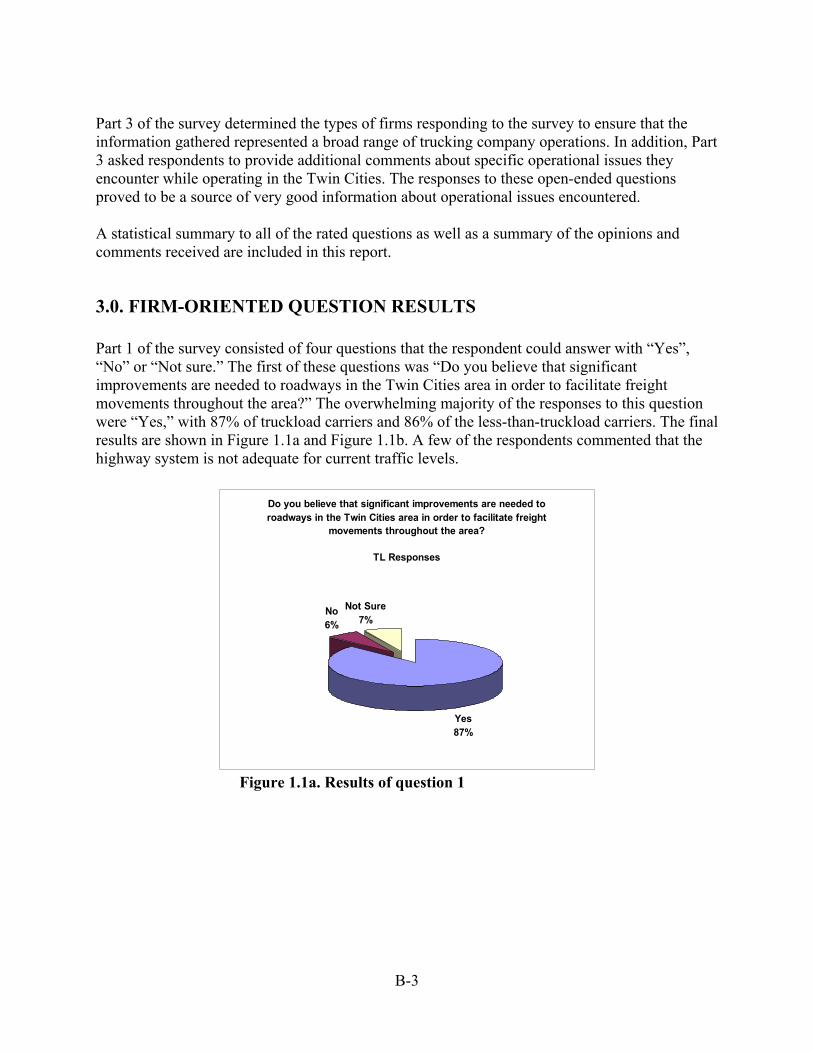
B-3
Part 3 of the survey determined the types of firms responding to the survey to ensure that the information gathered represented a broad range of trucking company operations. In addition, Part 3 asked respondents to provide additional comments about specific operational issues they encounter while operating in the Twin Cities. The responses to these open-ended questions proved to be a source of very good information about operational issues encountered. A statistical summary to all of the rated questions as well as a summary of the opinions and comments received are included in this report.
3.0. FIRM-ORIENTED QUESTION RESULTS Part 1 of the survey consisted of four questions that the respondent could answer with “Yes”, “No” or “Not sure.” The first of these questions was “Do you believe that significant improvements are needed to roadways in the Twin Cities area in order to facilitate freight movements throughout the area?” The overwhelming majority of the responses to this question were “Yes,” with 87% of truckload carriers and 86% of the less-than-truckload carriers. The final results are shown in Figure 1.1a and Figure 1.1b. A few of the respondents commented that the highway system is not adequate for current traffic levels.
Do you believe that significant improvements are needed to roadways in the Twin Cities area in order to facilitate freight
movements throughout the area?
TL Responses
Yes87%
No6%
Not Sure7%
Figure 1.1a. Results of question 1
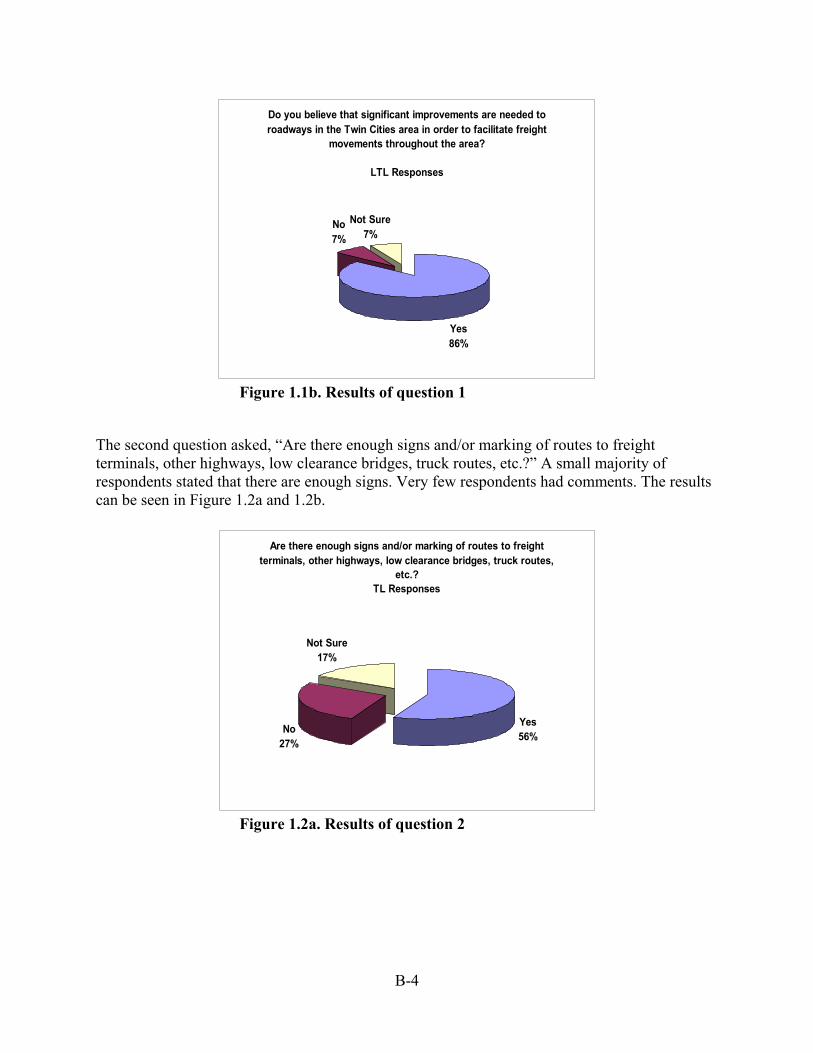
B-4
Do you believe that significant improvements are needed to roadways in the Twin Cities area in order to facilitate freight
movements throughout the area?
LTL Responses
Yes86%
No7%
Not Sure7%
Figure 1.1b. Results of question 1
The second question asked, “Are there enough signs and/or marking of routes to freight terminals, other highways, low clearance bridges, truck routes, etc.?” A small majority of respondents stated that there are enough signs. Very few respondents had comments. The results can be seen in Figure 1.2a and 1.2b.
Are there enough signs and/or marking of routes to freight terminals, other highways, low clearance bridges, truck routes,
etc.?TL Responses
Yes56%
No27%
Not Sure17%
Figure 1.2a. Results of question 2
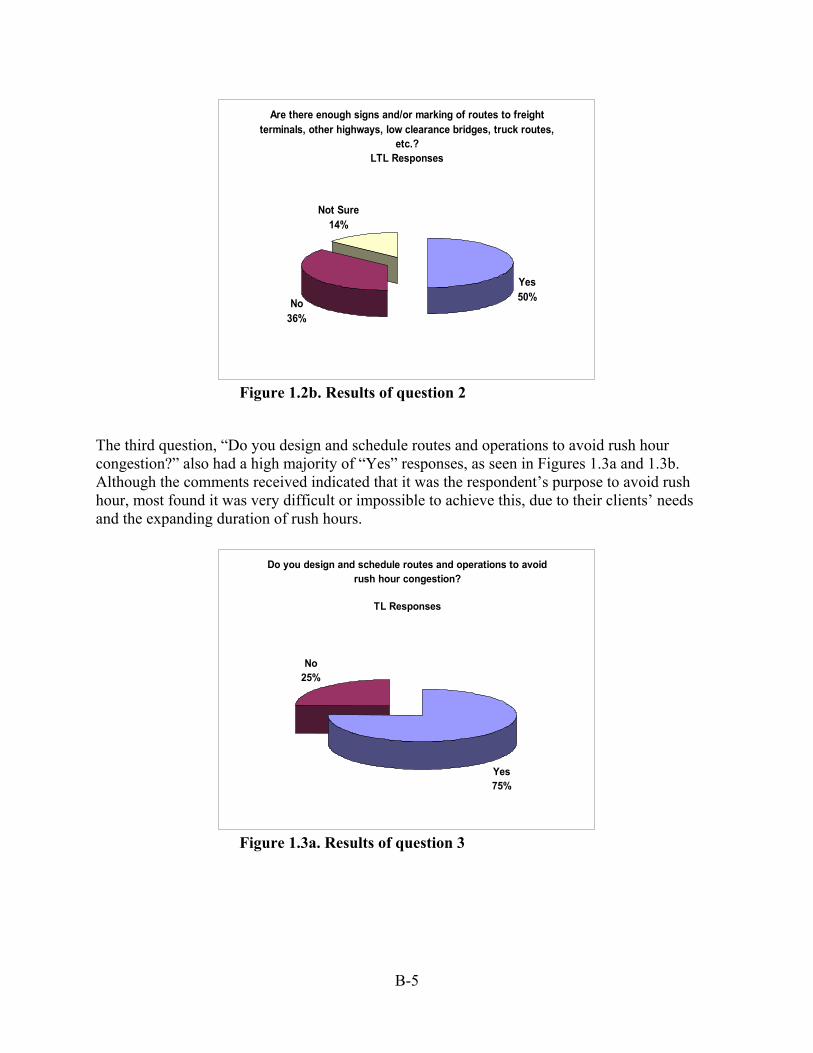
B-5
Are there enough signs and/or marking of routes to freight terminals, other highways, low clearance bridges, truck routes,
etc.?LTL Responses
Yes50%No
36%
Not Sure14%
Figure 1.2b. Results of question 2
The third question, “Do you design and schedule routes and operations to avoid rush hour congestion?” also had a high majority of “Yes” responses, as seen in Figures 1.3a and 1.3b. Although the comments received indicated that it was the respondent’s purpose to avoid rush hour, most found it was very difficult or impossible to achieve this, due to their clients’ needs and the expanding duration of rush hours.
Do you design and schedule routes and operations to avoid rush hour congestion?
TL Responses
Yes75%
No25%
Figure 1.3a. Results of question 3
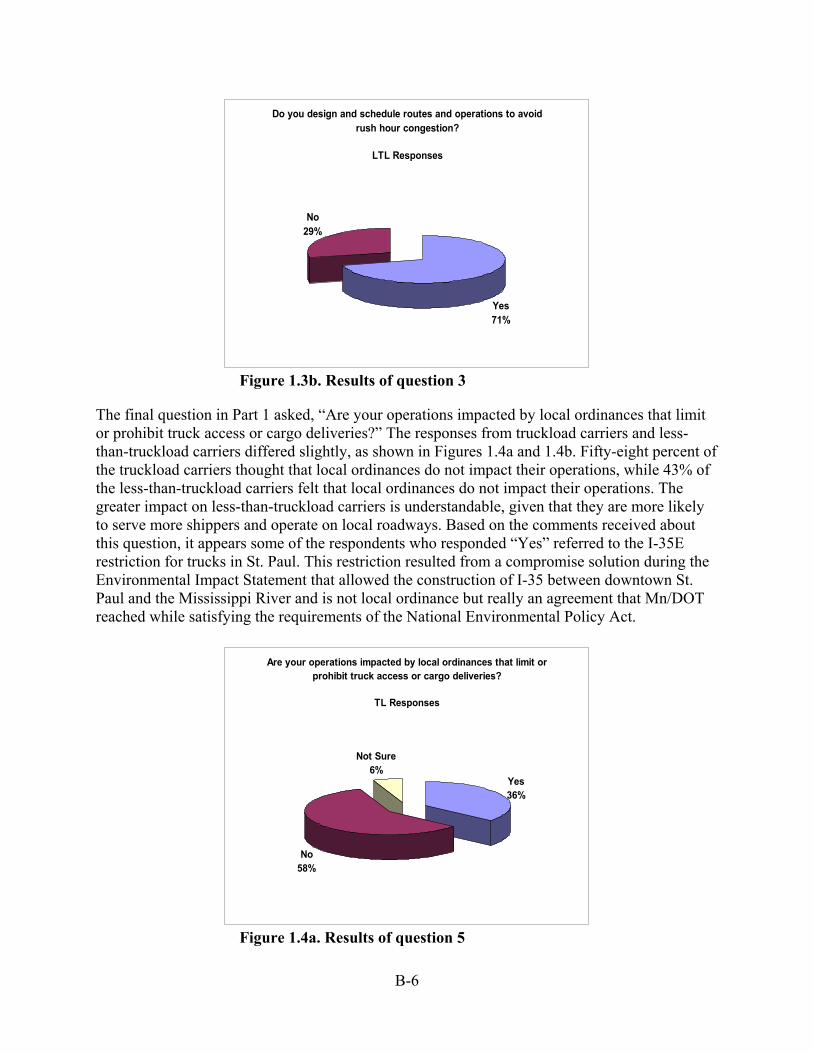
B-6
Do you design and schedule routes and operations to avoid rush hour congestion?
LTL Responses
Yes71%
No29%
Figure 1.3b. Results of question 3
The final question in Part 1 asked, “Are your operations impacted by local ordinances that limit or prohibit truck access or cargo deliveries?” The responses from truckload carriers and less-than-truckload carriers differed slightly, as shown in Figures 1.4a and 1.4b. Fifty-eight percent of the truckload carriers thought that local ordinances do not impact their operations, while 43% of the less-than-truckload carriers felt that local ordinances do not impact their operations. The greater impact on less-than-truckload carriers is understandable, given that they are more likely to serve more shippers and operate on local roadways. Based on the comments received about this question, it appears some of the respondents who responded “Yes” referred to the I-35E restriction for trucks in St. Paul. This restriction resulted from a compromise solution during the Environmental Impact Statement that allowed the construction of I-35 between downtown St. Paul and the Mississippi River and is not local ordinance but really an agreement that Mn/DOT reached while satisfying the requirements of the National Environmental Policy Act.
Are your operations impacted by local ordinances that limit or prohibit truck access or cargo deliveries?
TL Responses
Yes36%
No58%
Not Sure6%
Figure 1.4a. Results of question 5
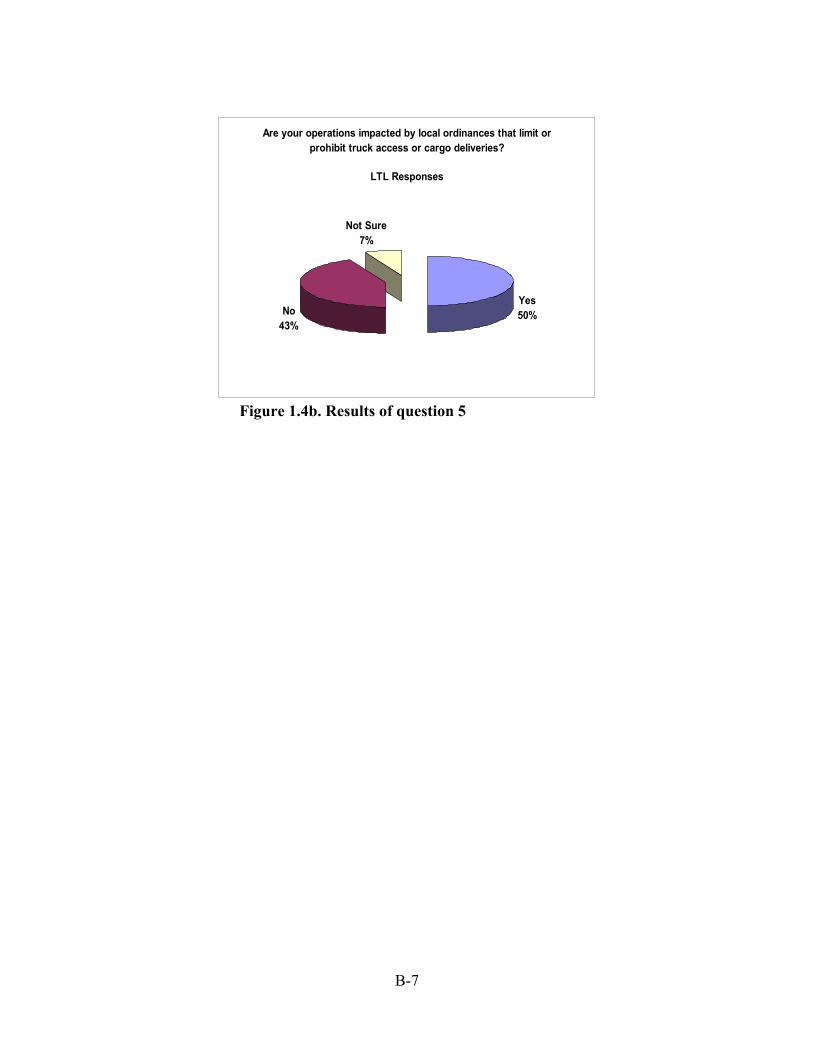
B-7
Are your operations impacted by local ordinances that limit or prohibit truck access or cargo deliveries?
LTL Responses
Yes50%No
43%
Not Sure7%
Figure 1.4b. Results of question 5
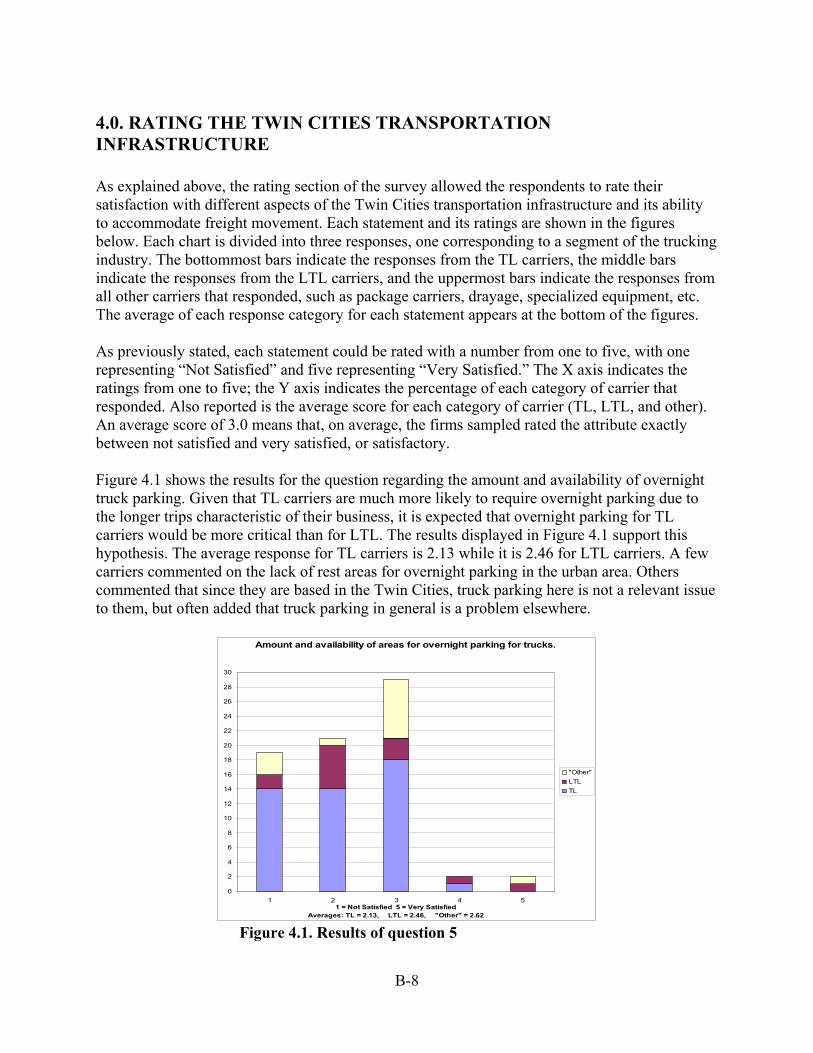
B-8
4.0. RATING THE TWIN CITIES TRANSPORTATION INFRASTRUCTURE As explained above, the rating section of the survey allowed the respondents to rate their satisfaction with different aspects of the Twin Cities transportation infrastructure and its ability to accommodate freight movement. Each statement and its ratings are shown in the figures below. Each chart is divided into three responses, one corresponding to a segment of the trucking industry. The bottommost bars indicate the responses from the TL carriers, the middle bars indicate the responses from the LTL carriers, and the uppermost bars indicate the responses from all other carriers that responded, such as package carriers, drayage, specialized equipment, etc. The average of each response category for each statement appears at the bottom of the figures. As previously stated, each statement could be rated with a number from one to five, with one representing “Not Satisfied” and five representing “Very Satisfied.” The X axis indicates the ratings from one to five; the Y axis indicates the percentage of each category of carrier that responded. Also reported is the average score for each category of carrier (TL, LTL, and other). An average score of 3.0 means that, on average, the firms sampled rated the attribute exactly between not satisfied and very satisfied, or satisfactory. Figure 4.1 shows the results for the question regarding the amount and availability of overnight truck parking. Given that TL carriers are much more likely to require overnight parking due to the longer trips characteristic of their business, it is expected that overnight parking for TL carriers would be more critical than for LTL. The results displayed in Figure 4.1 support this hypothesis. The average response for TL carriers is 2.13 while it is 2.46 for LTL carriers. A few carriers commented on the lack of rest areas for overnight parking in the urban area. Others commented that since they are based in the Twin Cities, truck parking here is not a relevant issue to them, but often added that truck parking in general is a problem elsewhere.
Amount and availability of areas for overnight parking for trucks.
0
2
4
6
8
10
12
14
16
18
20
22
24
26
28
30
1 2 3 4 51 = Not Satisfied 5 = Very Satisfied
Averages: TL = 2.13, LTL = 2.46, "Other" = 2.62
"Other"LTLTL
Figure 4.1. Results of question 5
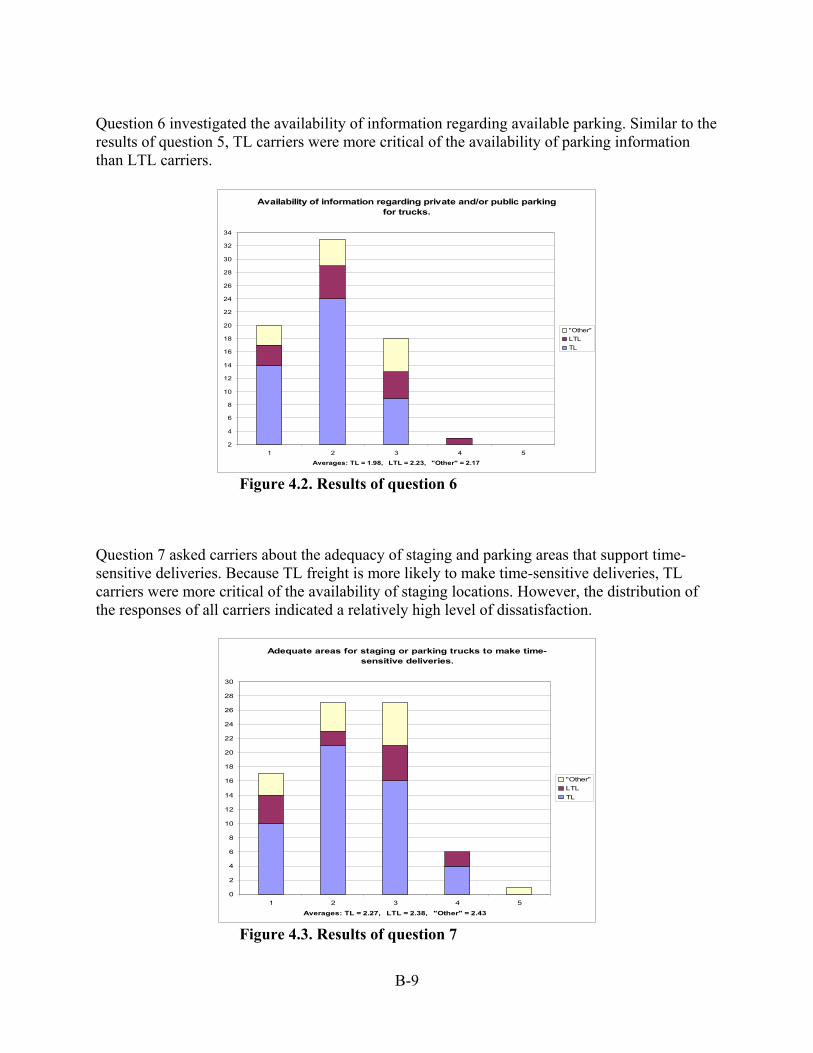
B-9
Question 6 investigated the availability of information regarding available parking. Similar to the results of question 5, TL carriers were more critical of the availability of parking information than LTL carriers.
Availability of information regarding private and/or public parking for trucks.
2
4
6
8
10
12
14
16
18
20
22
24
26
28
30
32
34
1 2 3 4 5
Averages: TL = 1.98, LTL = 2.23, "Other" = 2.17
"Other"LTLTL
Figure 4.2. Results of question 6
Question 7 asked carriers about the adequacy of staging and parking areas that support time-sensitive deliveries. Because TL freight is more likely to make time-sensitive deliveries, TL carriers were more critical of the availability of staging locations. However, the distribution of the responses of all carriers indicated a relatively high level of dissatisfaction.
Adequate areas for staging or parking trucks to make time-sensitive deliveries.
0
2
4
6
8
10
12
14
16
18
20
22
24
26
28
30
1 2 3 4 5
Averages: TL = 2.27, LTL = 2.38, "Other" = 2.43
"Other"LTLTL
Figure 4.3. Results of question 7
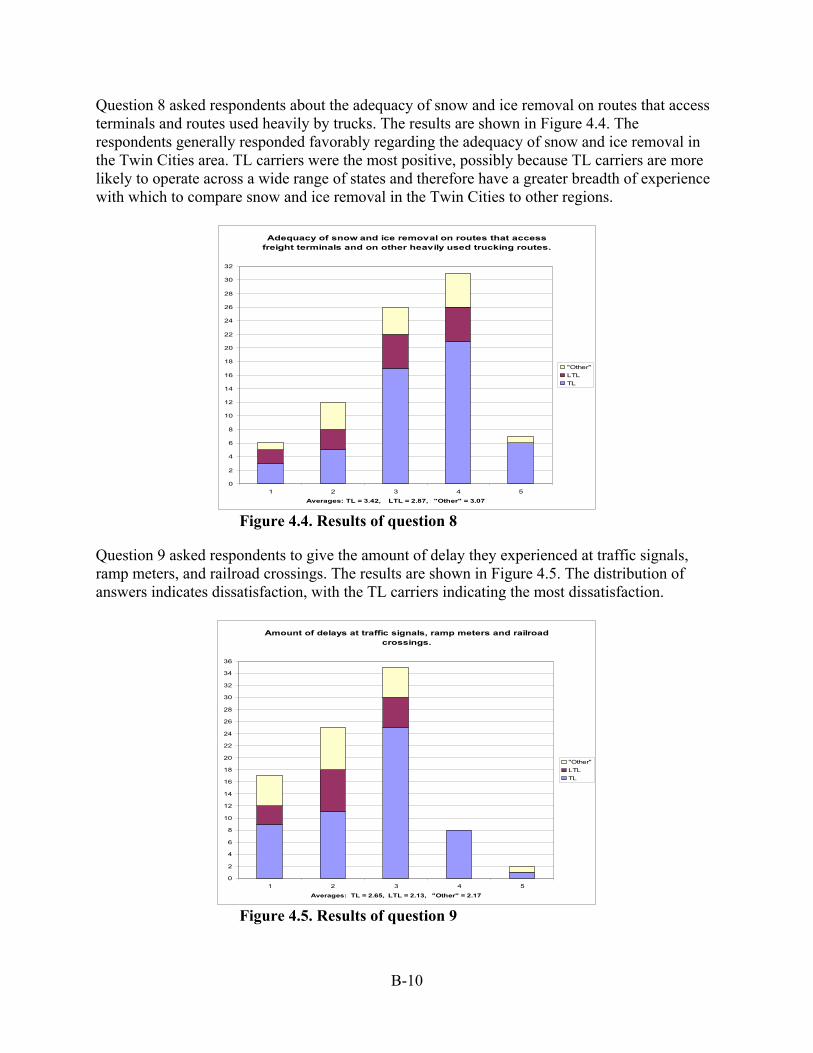
B-10
Question 8 asked respondents about the adequacy of snow and ice removal on routes that access terminals and routes used heavily by trucks. The results are shown in Figure 4.4. The respondents generally responded favorably regarding the adequacy of snow and ice removal in the Twin Cities area. TL carriers were the most positive, possibly because TL carriers are more likely to operate across a wide range of states and therefore have a greater breadth of experience with which to compare snow and ice removal in the Twin Cities to other regions.
Adequacy of snow and ice removal on routes that access freight terminals and on other heavily used trucking routes.
0
2
4
6
8
10
12
14
16
18
20
22
24
26
28
30
32
1 2 3 4 5
Averages: TL = 3.42, LTL = 2.87, "Other" = 3.07
"Other"LTLTL
Figure 4.4. Results of question 8
Question 9 asked respondents to give the amount of delay they experienced at traffic signals, ramp meters, and railroad crossings. The results are shown in Figure 4.5. The distribution of answers indicates dissatisfaction, with the TL carriers indicating the most dissatisfaction.
Amount of delays at traffic signals, ramp meters and railroad crossings.
0
2
4
6
8
10
12
14
16
18
20
22
24
26
28
30
32
34
36
1 2 3 4 5
Averages: TL = 2.65, LTL = 2.13, "Other" = 2.17
"Other"LTLTL
Figure 4.5. Results of question 9
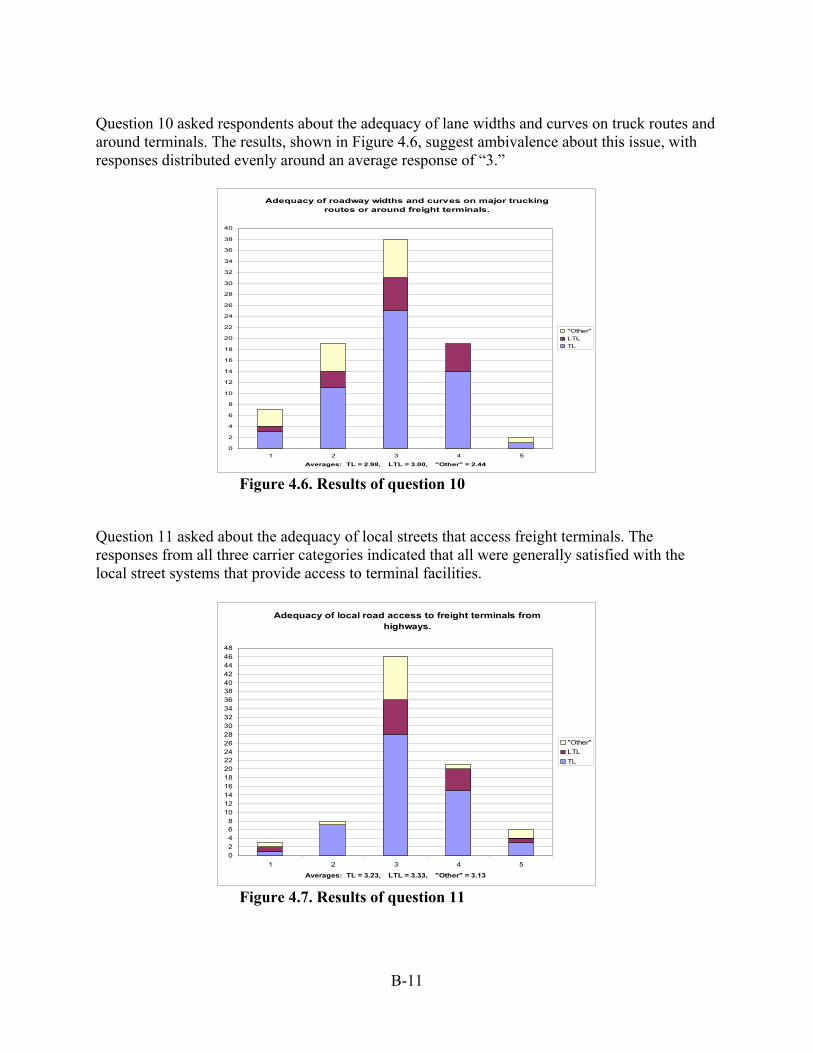
B-11
Question 10 asked respondents about the adequacy of lane widths and curves on truck routes and around terminals. The results, shown in Figure 4.6, suggest ambivalence about this issue, with responses distributed evenly around an average response of “3.”
Adequacy of roadway widths and curves on major trucking routes or around freight terminals.
0
2
4
6
8
10
12
14
16
18
20
22
24
26
28
30
32
34
36
38
40
1 2 3 4 5
Averages: TL = 2.98, LTL = 3.00, "Other" = 2.44
"Other"LTLTL
Figure 4.6. Results of question 10
Question 11 asked about the adequacy of local streets that access freight terminals. The responses from all three carrier categories indicated that all were generally satisfied with the local street systems that provide access to terminal facilities.
Adequacy of local road access to freight terminals from highways.
02468
1012141618202224262830323436384042444648
1 2 3 4 5
Averages: TL = 3.23, LTL = 3.33, "Other" = 3.13
"Other"LTLTL
Figure 4.7. Results of question 11
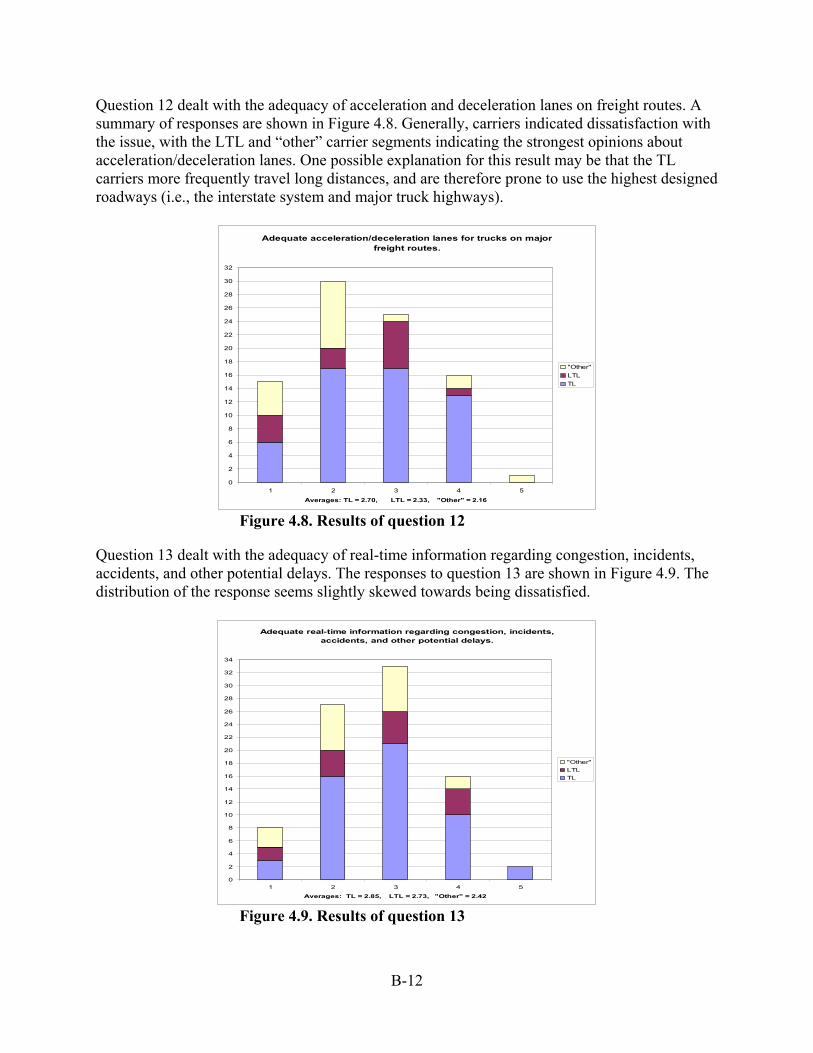
B-12
Question 12 dealt with the adequacy of acceleration and deceleration lanes on freight routes. A summary of responses are shown in Figure 4.8. Generally, carriers indicated dissatisfaction with the issue, with the LTL and “other” carrier segments indicating the strongest opinions about acceleration/deceleration lanes. One possible explanation for this result may be that the TL carriers more frequently travel long distances, and are therefore prone to use the highest designed roadways (i.e., the interstate system and major truck highways).
Adequate acceleration/deceleration lanes for trucks on major freight routes.
0
2
4
6
8
10
12
14
16
18
20
22
24
26
28
30
32
1 2 3 4 5
Averages: TL = 2.70, LTL = 2.33, "Other" = 2.16
"Other"LTLTL
Figure 4.8. Results of question 12
Question 13 dealt with the adequacy of real-time information regarding congestion, incidents, accidents, and other potential delays. The responses to question 13 are shown in Figure 4.9. The distribution of the response seems slightly skewed towards being dissatisfied.
Adequate real-time information regarding congestion, incidents, accidents, and other potential delays.
0
2
4
6
8
10
12
14
16
18
20
22
24
26
28
30
32
34
1 2 3 4 5
Averages: TL = 2.85, LTL = 2.73, "Other" = 2.42
"Other"LTLTL
Figure 4.9. Results of question 13
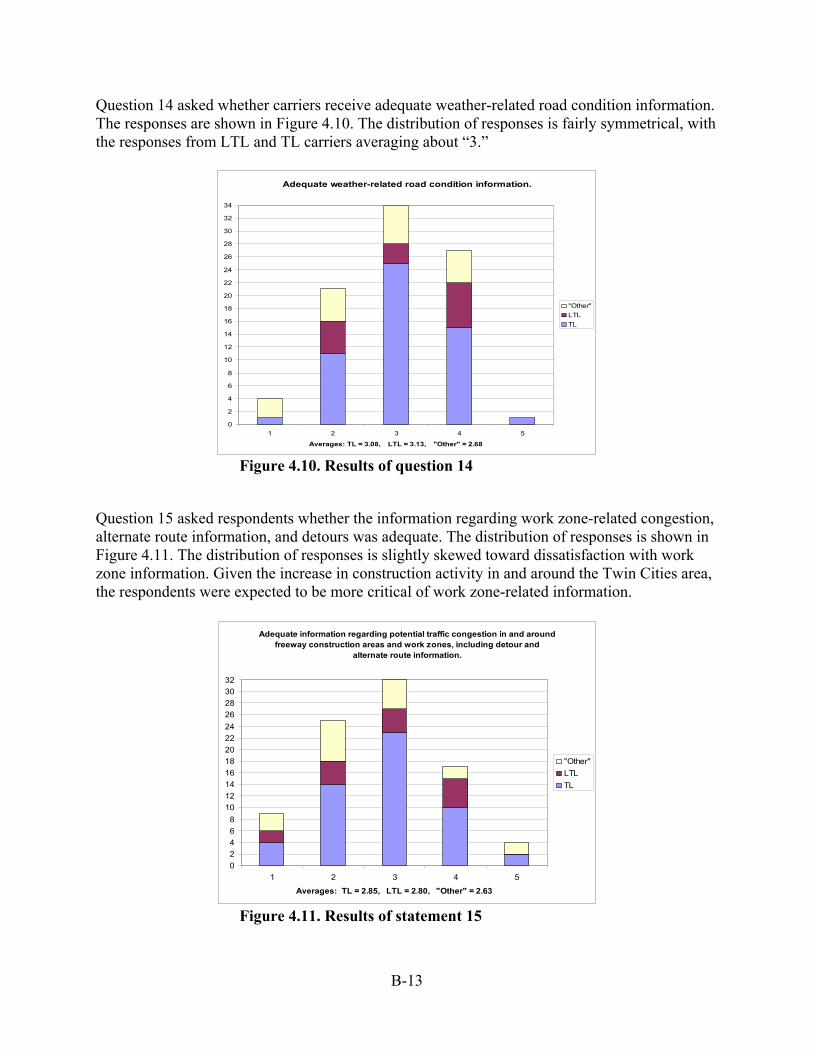
B-13
Question 14 asked whether carriers receive adequate weather-related road condition information. The responses are shown in Figure 4.10. The distribution of responses is fairly symmetrical, with the responses from LTL and TL carriers averaging about “3.”
Adequate weather-related road condition information.
0
2
4
6
8
10
12
14
16
18
20
22
24
26
28
30
32
34
1 2 3 4 5
Averages: TL = 3.08, LTL = 3.13, "Other" = 2.68
"Other"LTLTL
Figure 4.10. Results of question 14
Question 15 asked respondents whether the information regarding work zone-related congestion, alternate route information, and detours was adequate. The distribution of responses is shown in Figure 4.11. The distribution of responses is slightly skewed toward dissatisfaction with work zone information. Given the increase in construction activity in and around the Twin Cities area, the respondents were expected to be more critical of work zone-related information.
Adequate information regarding potential traffic congestion in and around freeway construction areas and work zones, including detour and
alternate route information.
02468
101214161820222426283032
1 2 3 4 5
Averages: TL = 2.85, LTL = 2.80, "Other" = 2.63
"Other"LTLTL
Figure 4.11. Results of statement 15
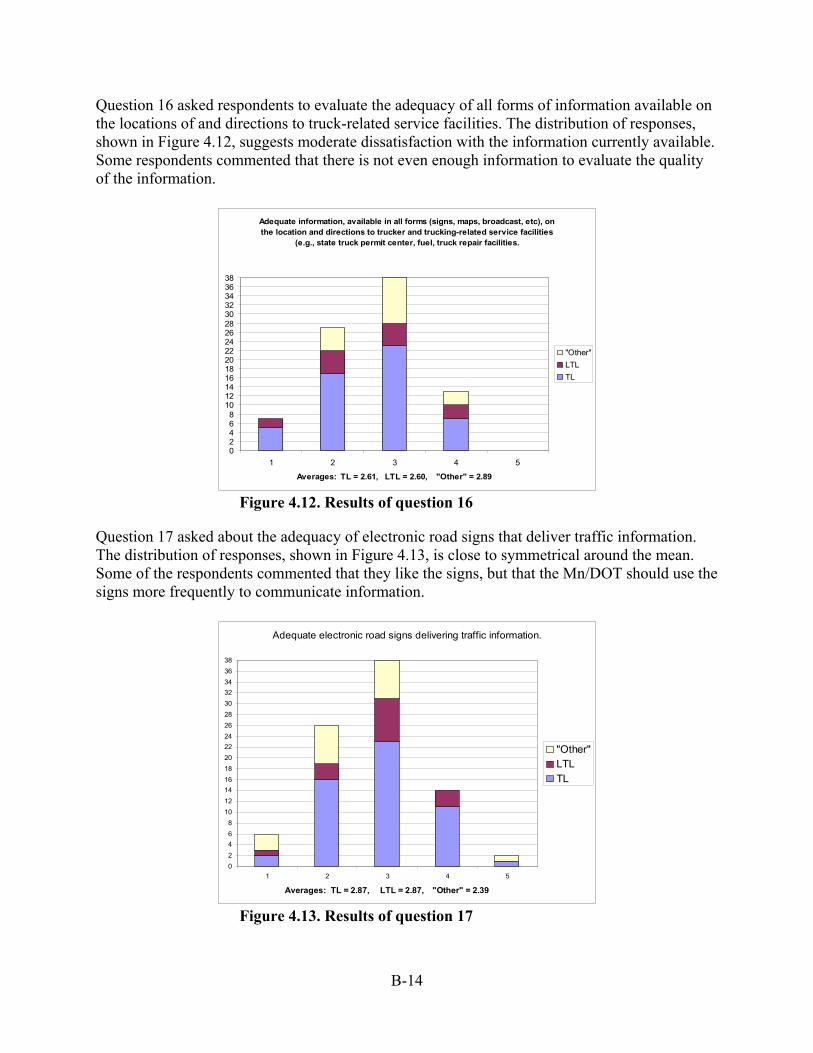
B-14
Question 16 asked respondents to evaluate the adequacy of all forms of information available on the locations of and directions to truck-related service facilities. The distribution of responses, shown in Figure 4.12, suggests moderate dissatisfaction with the information currently available. Some respondents commented that there is not even enough information to evaluate the quality of the information.
Adequate information, available in all forms (signs, maps, broadcast, etc), on the location and directions to trucker and trucking-related service facilities
(e.g., state truck permit center, fuel, truck repair facilities.
02468
101214161820222426283032343638
1 2 3 4 5
Averages: TL = 2.61, LTL = 2.60, "Other" = 2.89
"Other"LTLTL
Figure 4.12. Results of question 16
Question 17 asked about the adequacy of electronic road signs that deliver traffic information. The distribution of responses, shown in Figure 4.13, is close to symmetrical around the mean. Some of the respondents commented that they like the signs, but that the Mn/DOT should use the signs more frequently to communicate information.
Adequate electronic road signs delivering traffic information.
02468
101214161820222426283032343638
1 2 3 4 5
Averages: TL = 2.87, LTL = 2.87, "Other" = 2.39
"Other"LTLTL
Figure 4.13. Results of question 17
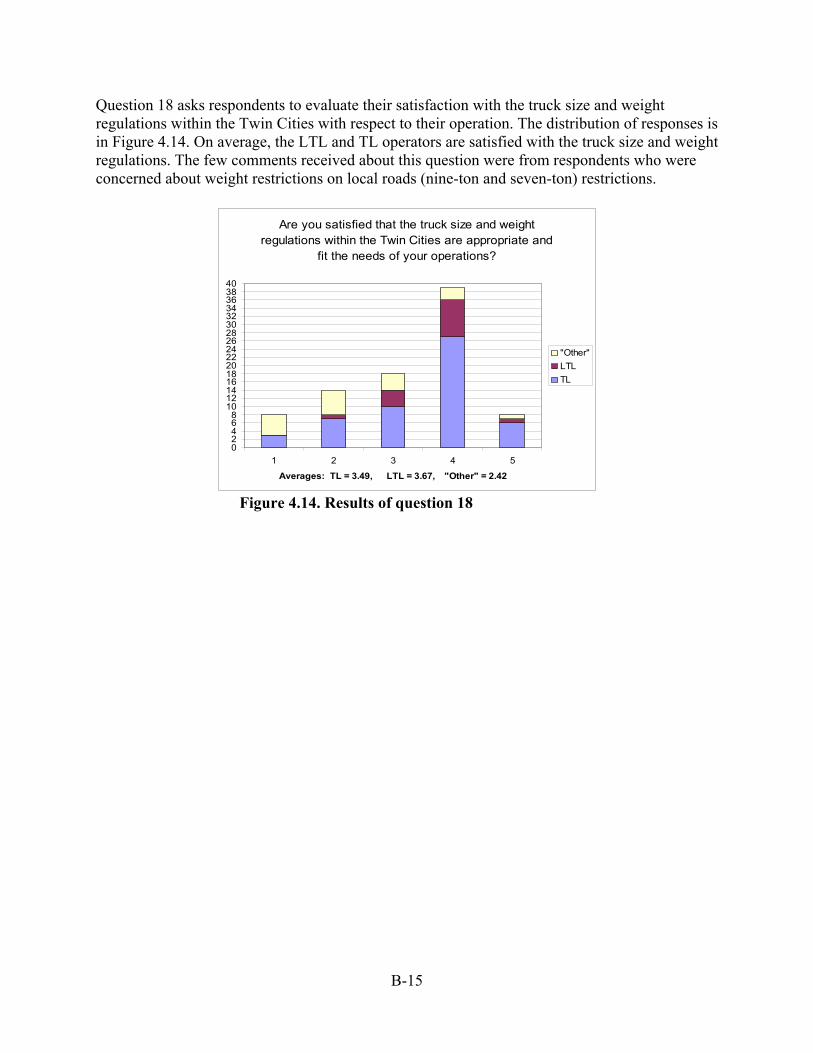
B-15
Question 18 asks respondents to evaluate their satisfaction with the truck size and weight regulations within the Twin Cities with respect to their operation. The distribution of responses is in Figure 4.14. On average, the LTL and TL operators are satisfied with the truck size and weight regulations. The few comments received about this question were from respondents who were concerned about weight restrictions on local roads (nine-ton and seven-ton) restrictions.
Are you satisfied that the truck size and weight regulations within the Twin Cities are appropriate and
fit the needs of your operations?
02468
10121416182022242628303234363840
1 2 3 4 5
Averages: TL = 3.49, LTL = 3.67, "Other" = 2.42
"Other"LTLTL
Figure 4.14. Results of question 18
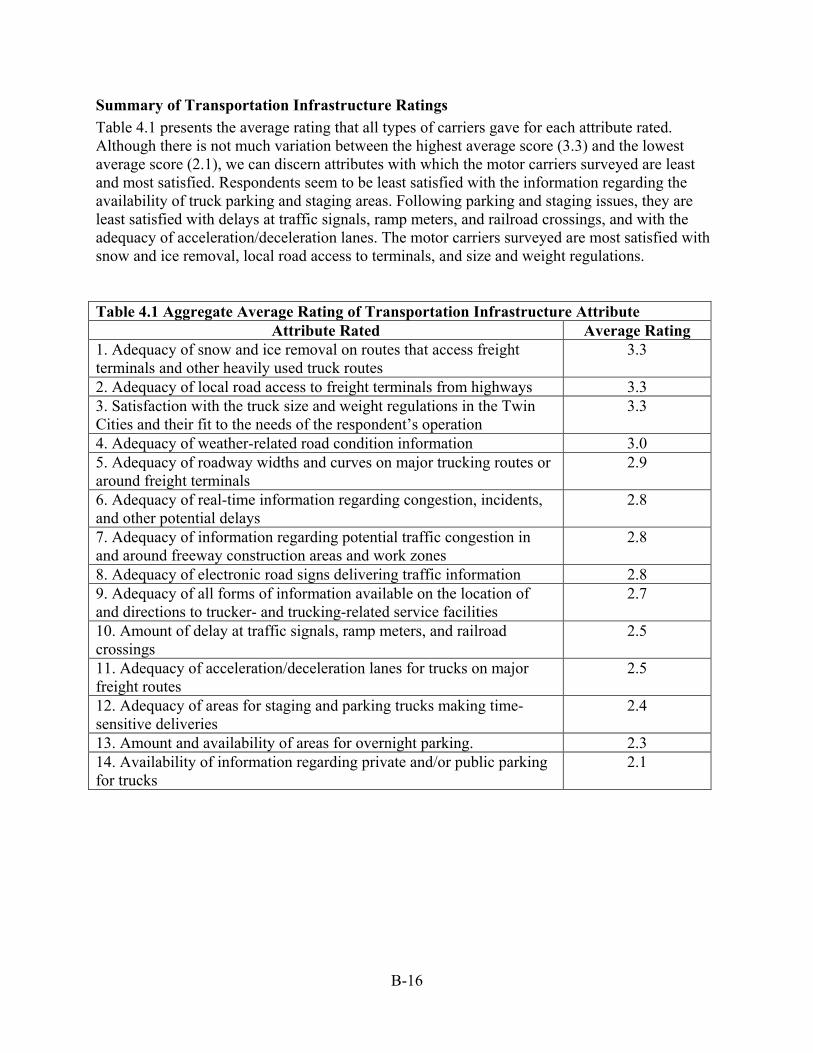
B-16
Summary of Transportation Infrastructure Ratings Table 4.1 presents the average rating that all types of carriers gave for each attribute rated. Although there is not much variation between the highest average score (3.3) and the lowest average score (2.1), we can discern attributes with which the motor carriers surveyed are least and most satisfied. Respondents seem to be least satisfied with the information regarding the availability of truck parking and staging areas. Following parking and staging issues, they are least satisfied with delays at traffic signals, ramp meters, and railroad crossings, and with the adequacy of acceleration/deceleration lanes. The motor carriers surveyed are most satisfied with snow and ice removal, local road access to terminals, and size and weight regulations. Table 4.1 Aggregate Average Rating of Transportation Infrastructure Attribute
Attribute Rated Average Rating 1. Adequacy of snow and ice removal on routes that access freight terminals and other heavily used truck routes
3.3
2. Adequacy of local road access to freight terminals from highways 3.3 3. Satisfaction with the truck size and weight regulations in the Twin Cities and their fit to the needs of the respondent’s operation
3.3
4. Adequacy of weather-related road condition information 3.0 5. Adequacy of roadway widths and curves on major trucking routes or around freight terminals
2.9
6. Adequacy of real-time information regarding congestion, incidents, and other potential delays
2.8
7. Adequacy of information regarding potential traffic congestion in and around freeway construction areas and work zones
2.8
8. Adequacy of electronic road signs delivering traffic information 2.8 9. Adequacy of all forms of information available on the location of and directions to trucker- and trucking-related service facilities
2.7
10. Amount of delay at traffic signals, ramp meters, and railroad crossings
2.5
11. Adequacy of acceleration/deceleration lanes for trucks on major freight routes
2.5
12. Adequacy of areas for staging and parking trucks making time-sensitive deliveries
2.4
13. Amount and availability of areas for overnight parking. 2.3 14. Availability of information regarding private and/or public parking for trucks
2.1
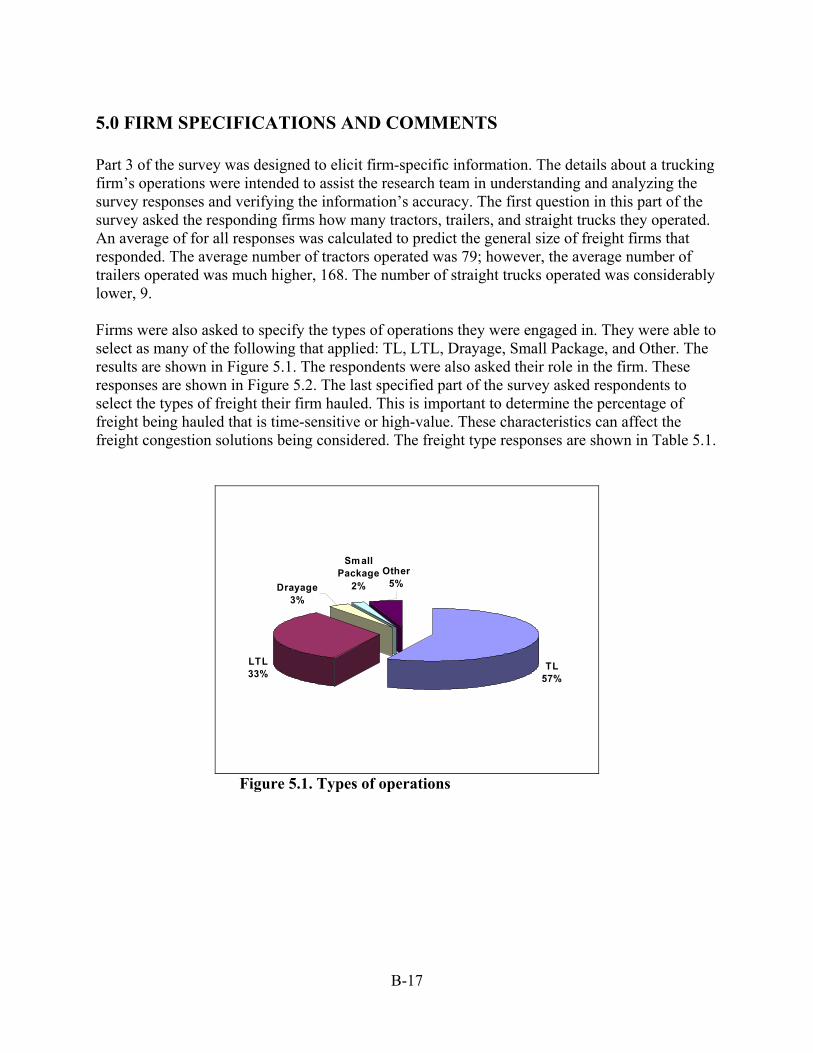
B-17
5.0 FIRM SPECIFICATIONS AND COMMENTS Part 3 of the survey was designed to elicit firm-specific information. The details about a trucking firm’s operations were intended to assist the research team in understanding and analyzing the survey responses and verifying the information’s accuracy. The first question in this part of the survey asked the responding firms how many tractors, trailers, and straight trucks they operated. An average of for all responses was calculated to predict the general size of freight firms that responded. The average number of tractors operated was 79; however, the average number of trailers operated was much higher, 168. The number of straight trucks operated was considerably lower, 9. Firms were also asked to specify the types of operations they were engaged in. They were able to select as many of the following that applied: TL, LTL, Drayage, Small Package, and Other. The results are shown in Figure 5.1. The respondents were also asked their role in the firm. These responses are shown in Figure 5.2. The last specified part of the survey asked respondents to select the types of freight their firm hauled. This is important to determine the percentage of freight being hauled that is time-sensitive or high-value. These characteristics can affect the freight congestion solutions being considered. The freight type responses are shown in Table 5.1.
TL57%
LTL33%
Drayage3%
Sm all Package
2%Other
5%
Figure 5.1. Types of operations
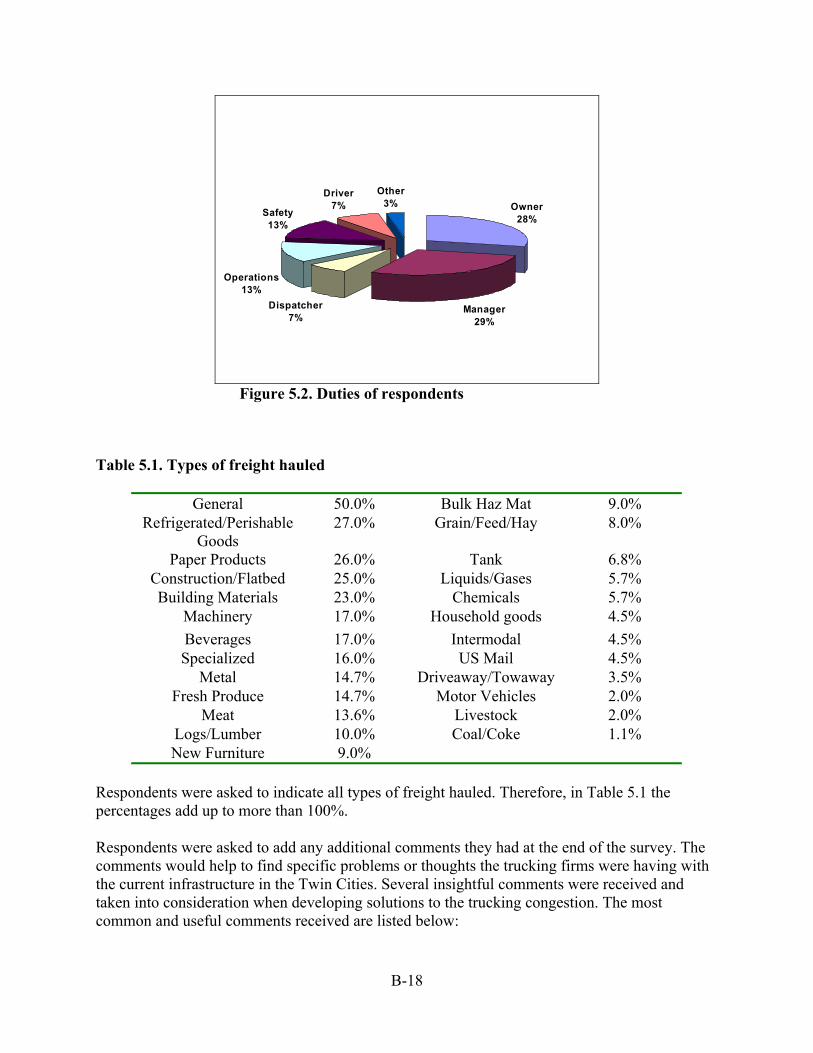
B-18
Owner28%
Manager29%
Dispatcher7%
Operations13%
Safety13%
Driver7%
Other3%
Figure 5.2. Duties of respondents
Table 5.1. Types of freight hauled
General 50.0% Bulk Haz Mat 9.0% Refrigerated/Perishable
Goods 27.0% Grain/Feed/Hay 8.0%
Paper Products 26.0% Tank 6.8% Construction/Flatbed 25.0% Liquids/Gases 5.7% Building Materials 23.0% Chemicals 5.7%
Machinery 17.0% Household goods 4.5% Beverages 17.0% Intermodal 4.5% Specialized 16.0% US Mail 4.5%
Metal 14.7% Driveaway/Towaway 3.5% Fresh Produce 14.7% Motor Vehicles 2.0%
Meat 13.6% Livestock 2.0% Logs/Lumber 10.0% Coal/Coke 1.1% New Furniture 9.0%
Respondents were asked to indicate all types of freight hauled. Therefore, in Table 5.1 the percentages add up to more than 100%. Respondents were asked to add any additional comments they had at the end of the survey. The comments would help to find specific problems or thoughts the trucking firms were having with the current infrastructure in the Twin Cities. Several insightful comments were received and taken into consideration when developing solutions to the trucking congestion. The most common and useful comments received are listed below:
B-19
• Lift the truck restriction on I-35E in St. Paul • Better educate public drivers about truck safety • Add more lanes • Add truck-only lanes • Build more staging areas for peak traffic times • Inability to plan around peak periods due to customers’ needs and extended rush hours • Add more room/lanes during construction • Allow trucks to use underutilized HOV lanes • Lower or reduce speed limits on freeways
Removing the trucking restriction on I-35E was mentioned on many of the surveys. Another recurring comment concerned automobile drivers and their lack of education about trucking. Many respondents complained that cars do not give the trucks the space or attention the trucks need. Cars cutting off trucks, stopping quickly in front of them, merging in front of them, speeding past them, and tailgating them are problems mentioned in the surveys.
Appendix C
Transportation Professionals Interviewed
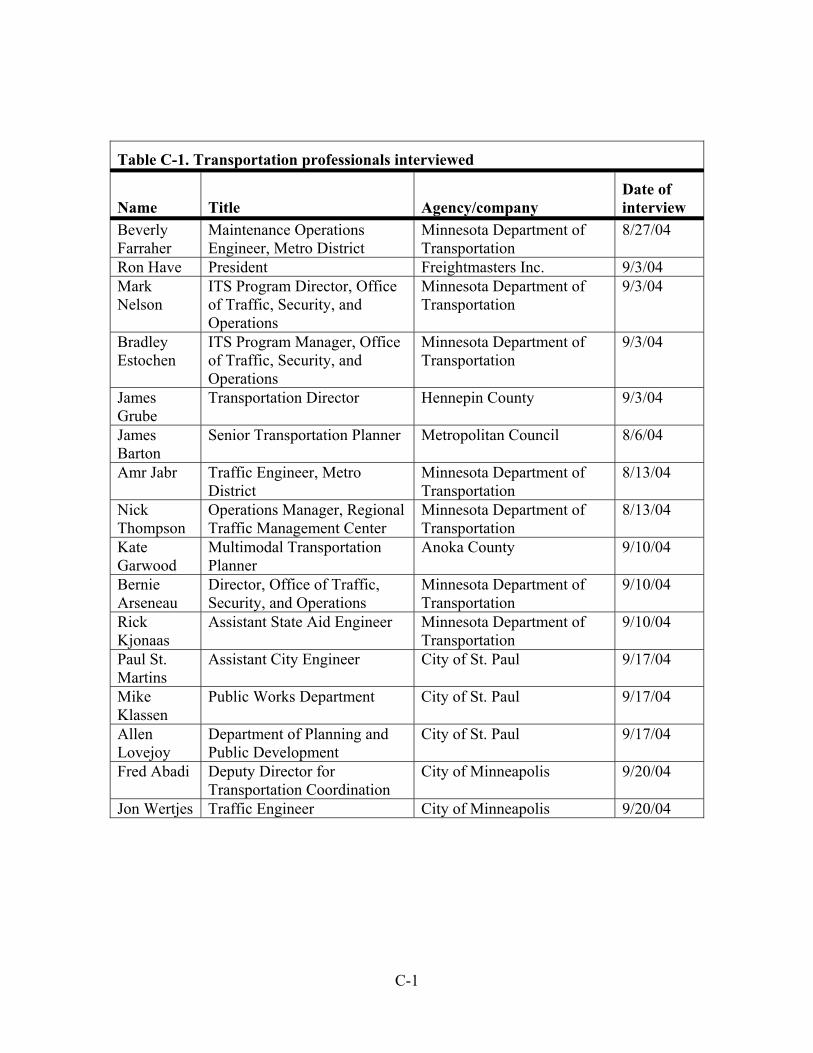
C-1
Table C-1. Transportation professionals interviewed
Name Title Agency/company Date of interview
Beverly Farraher
Maintenance Operations Engineer, Metro District
Minnesota Department of Transportation
8/27/04
Ron Have President Freightmasters Inc. 9/3/04 Mark Nelson
ITS Program Director, Office of Traffic, Security, and Operations
Minnesota Department of Transportation
9/3/04
Bradley Estochen
ITS Program Manager, Office of Traffic, Security, and Operations
Minnesota Department of Transportation
9/3/04
James Grube
Transportation Director Hennepin County 9/3/04
James Barton
Senior Transportation Planner Metropolitan Council 8/6/04
Amr Jabr Traffic Engineer, Metro District
Minnesota Department of Transportation
8/13/04
Nick Thompson
Operations Manager, Regional Traffic Management Center
Minnesota Department of Transportation
8/13/04
Kate Garwood
Multimodal Transportation Planner
Anoka County 9/10/04
Bernie Arseneau
Director, Office of Traffic, Security, and Operations
Minnesota Department of Transportation
9/10/04
Rick Kjonaas
Assistant State Aid Engineer Minnesota Department of Transportation
9/10/04
Paul St. Martins
Assistant City Engineer City of St. Paul 9/17/04
Mike Klassen
Public Works Department City of St. Paul 9/17/04
Allen Lovejoy
Department of Planning and Public Development
City of St. Paul 9/17/04
Fred Abadi Deputy Director for Transportation Coordination
City of Minneapolis 9/20/04
Jon Wertjes Traffic Engineer City of Minneapolis 9/20/04
Appendix D
DESCRIPTIONS OF POTENTIAL PLANNING STRATEGIES TO IMPROVE FREIGHT MOBILITY
THROUGH THE TWIN CITIES
D-1
Introduction This report represents one of the objectives of the Minnesota Department of Transportation’s (Mn/DOT) study to identify potential strategies for the Trucks and Twin Cities Traffic Management Project. In this document, we have summarized potential strategies and identified potential challenges to implementing the strategies. The barriers to implementation may be financial, political, or both. However, any barriers to implementation are identified. The strategies reported here are organized by function. The order in which they are presented is not meant to indicate the order in which they should be implemented. Rather, they are presented functionally to be considered by numerous stakeholders so that different strategies may be implemented simultaneously. The following are the types of strategies presented:
• Operational strategies. Operational strategies necessitate operational management of the highway system.
• Driver-oriented strategies. Driver-oriented strategies are geared toward intelligent transportation systems that use telecommunications and other technology to convey information and data to drivers and operators to help them make informed trip decisions.
• Capital investment strategies. Capital investment strategies necessitate long-term improvements, investments, and engineering of facilities to better handle freight travel.
• Planning and operations strategies. Planning and operations strategies necessitate enhancing the transportation planning process to better address freight and truck travel through the area.
After Mn/DOT and the Technical Advisory Panel review these strategies, CTRE and Wilbur Smith Associates will work with Mn/DOT to develop a plan for implementation. The plan will identify in order of magnitude the estimates of benefits, including potential safety and traffic operational benefits and identify issues related to the institutional, financial, economic, and physical feasibility of the strategies listed. The plan will also identify cumulative benefits of the potential strategies and how they may be phased into the transportation improvement plan.
D-2
Operational Strategies
1. Time of Day Restrictions
2. Truck Only Ramps
3. Differential Speed Limits for Cars and Truck
4. Lane Restrictions for Heavy Trucks
5. Increase Overnight Truck Parking Facilities on Urban Fringe
6. Increase Overnight Truck Parking in the Urban Core
7. Traffic Signal Prioritization for Heavy Vehicles
8. Use of HOV and HOT Lanes by Trucks
9. Improve Advance Signing on Arterials for Freeway Entrances
10. Expand Integrated Corridor Traffic Management
D-3
1. Time of Day Restrictions Description and how the strategy works: Trucks with three or more axles would be restricted from facilities during AM and PM peak periods. Typically, core urban areas are restricted to automobile or even pedestrians and transit during peak commuter periods. The purpose is to keep slower moving trucks out of the traffic flow and eliminate lane blockages due to trucks making deliveries. Places where the strategy has been applied: Time of day restrictions are common in cities outside of the United States. Many congested cities in Europe and Asia have restricted trucks and deliveries to times non-peak commuter times or to evening and early morning hours. Time of day restrictions were implemented in downtown Los Angeles, but due to legal challenges the time of day restrictions were dropped. Other cities have considered time of day restrictions (e.g., Minneapolis and New Orleans) but have not implemented them. Truck movements have been restricted from facilities or localized areas (e.g., shopping centers) by time of day or from particular routes due to environmental concerns or infrastructure design that was inconsistent with heavy truck volumes (e.g., thin pavements). Benefits: Time of day restrictions reduce the amount of congestion during peak periods, thereby reducing the need to add capacity. In very congested cities, time of day of restrictions on traffic may be the only way possible for them to accommodate traffic demands. Costs: The public agency costs associated with implementing this strategy only involve additional signage and enforcement of the time of day of restrictions. The motor carrier industry is, however, saddled with the costs of delivering outside of the restricted hours, which may create inefficiencies for the motor carriers and increased labor costs for drivers making deliveries and businesses accepting deliveries outside of normal working hours. Institutional, political, and policy issues: Overall we expect that the motor carrier industry will be against time of day restriction. The motor carrier member of the advisory committee told us that he did not mind a time of day restriction, as long it is applied uniformly to all motor carriers. The traffic engineering staff in both Minneapolis and St. Paul opposed this strategy. If an issue arises from too many truck deliveries to a particular building during peak hours, the staff work it out with the individual building owner/tenant and negotiate the location of loading zone parking restrictions. Minneapolis has changed its building code to require all newly constructed buildings to have a loading dock, thus alleviating the need for trucks to deliver from adjacent streets. Opportunity for application in the Twin Cities (description and high, medium and low): Low; there does not seem to be much need for this in the Twin Cities. The traffic engineering staffs of both core cities were not in favor of this strategy.
D-4
2. Truck-only Ramps Description and how the strategy works: Truck-only ramps act as an exit or entrance to the freeway that is to be used by trucks only. In general, the lane should provide access to a freight terminal. For example, a truck-only ramp is planned for I-4 in Tampa to connect the interstate highway with the Port of Tampa. Places where it has been applied: Although there a number of proposed locations for truck-only ramps, we could find very few examples where truck-only ramps have been implemented. Benefits: A truck-only ramp would provide access directly to terminals, thereby reducing travel time for trucks. Safety benefits and improved traffic flow would also result from segregating trucks from mixed traffic. Costs: The cost of adding a ramp can vary greatly, depending on the design parameters and the nature of the ramp. Simple slip ramps can be relatively inexpensive, but ramps requiring a structure and/or addition of lanes can costs tens of millions of dollars. Institutional, political, and policy issues: There are no institutional or political issues related to truck-only ramps. Opportunity for application in the Twin Cities (description and high, medium and low): There are no locations in the Twin Cities where the truck volumes into and out of a freight generator are concentrated enough to warrant a truck-only ramp. Opportunity for implementation: Low.
D-5
3. Differential Speed Limits for Cars and Trucks Description and how the strategy works: Differential speed limits restrict heavy trucks or other vehicles of a certain size, weight, and axle configuration to traveling at lower speeds than passenger vehicles. Places where it has been applied: California, Illinois, Indiana, Washington, Arkansas, Idaho. Benefits: Proponents of the policy state that heavy trucks have limited maneuvering and braking capabilities and therefore should be required to travel at lower speeds in mixed traffic to accommodate these limitations. Heavy trucks can maintain these (lower) speeds more easily, reducing the risk of crashes. Costs: Costs would be associated with making and installing signs and enforcing lower speed limits. Institutional, political, and policy issues: The Minnesota legislature will have to pass new speed limits for automobiles and heavy trucks. Accident data for differential speed limits are mixed. Harkey and Mera found that overall, states with differential speed limits experienced higher proportions of car-striking-truck accidents. In states with uniform speed limits, car-truck accidents were more likely to involve trucks striking cars. There were no differences in fatal accident proportions between the states with differential and uniform speed limits. However, the states with uniform speed limits did experience a higher proportion of injury accidents. Baum et al. conducted a study that compared vehicles on rural interstates in California and Illinois, which have differential speeds, and Arizona and Iowa, which have uniform speed limits. The study found that trucks travel slower in states with differential speed limits than in those with uniform speed limits. In a survey for the Commercial Truck and Bus Safety Synthesis, Synthesis 3, Highway Vehicle Interaction, respondents from the motor carrier industry indicated that some in the industry felt that differential speed limits had an adverse impact on safety and would like to see those differential speed limits eliminated. Opportunity for application in the Twin Cities (description and high, medium and low): Since the accident data are not conclusive, and the benefits to the agency and industry are negligible, the opportunity for application is low.
D-6
4. Lane Restrictions for Heavy Trucks Description and how the strategy works: Trucks with three or more axles are restricted to the two right-hand lanes of major freeways with six or more lanes. Places where it has been applied: Virginia, Georgia, Illinois, Texas. Benefits: The strategy is inexpensive to deploy. An initial study in Houston, Texas found a 68% reduction in truck accidents during a 36-week period. Texas plans to expand this strategy to other areas. In Virginia, a 20% reduction in injury accidents was found. Lane restriction improves safety because the segregation of vehicle types results in fewer passing maneuvers, and the vehicle types tend to separate. Costs: Costs include construction and installation of signs along the roadway. Successful implementation requires enforcement to keep trucks and cars in designated lanes. Institutional, political, and policy issues: Lane restrictions may be perceived to reduce the level of highway services provided to trucks on interstate highways, so there may be a negative reaction to this strategy from the trucking industry. Some transportation professionals we interviewed also believe that restricting trucks to the right-hand lanes might make it more difficult for cars to merge with traffic at entrance ramps. We discussed both of these issues with the traffic engineer in the Schaumburg district office of the Illinois Department of Transportation (the Chicago district). Lane restrictions have been in place on some Chicago area freeways for over 20 years and neither issue has been a problem for the Illinois Department of Transportation. Opportunity for application in the Twin Cities (description and high, medium and low): The safety benefits of restricting trucks to the two right-hand lanes make it an attractive option. Therefore, the opportunity for implementing this strategy is high.
D-7
5A. Increase Truck Parking Facilities on the Urban Fringe Description and how the strategy works: Truck parking is a national problem. There is an ever-increasing demand for safe and secure truck parking locations. As more freight is carried longer distances by trucks, truck operators need to find locations that fit into their schedule and route that allow them to obtain uninterrupted rest so they can be alert when driving. This strategy considers methods for providing additional truck parking at public facilities on the fringe of metropolitan areas. This would allow truckers to position themselves on the fringe of a metropolitan area to meet a delivery window on the next day. The creation of more truck parking could originate from the use of park-and-ride facilities on the fringe, the use of the truck inspection areas (a weigh station for parking when the scale is closed), and the use of other public land for truck parking. One of the transportation professionals interviewed suggested that the county park system in an outlying county could be used for truck parking. Use of the park system in this way would be feasible because truck operators would use the park’s parking spaces at night when the parks are underused by park goers and the parks have adequate amenities for the truck drivers. Places where it has been applied: Many states have strategies to expand public truck parking. For example, Iowa has worked with the private sector and local governments to create a public-private partnership to develop truck parking and rest facilities for motorists as part of an industrial/commercial park (the Top of Iowa Rest Area). Several states allow overnight parking at weigh stations when the scale is closed, and a number of states are simply increasing parking at existing rest stops along the interstate or building new rest stops with expanded truck parking. Benefits: The benefits of providing additional truck parking are related to both safety and to transportation service costs. With safe and secure truck parking, drivers have more opportunities to find convenient locations to rest and they are, therefore, more alert when they are driving. There is a safety benefit from providing truck parking, but the benefits are very difficult to measure. We also know that by providing convenient locations to park, truck operators can position their trucks to meet the requirements of a delivery window and thus convenient parking helps to reduce logistics costs. Industries involved in high technology manufacturing and integration are usually shipping high-value inbound and outbound freight, which is likely to be time-sensitive and shippers are likely to consider these deliveries just-in-time (JIT). JIT is facilitated by the availability of areas where a driver can rest near a destination so the truck can meet narrow delivery windows. Costs: The costs depend on the particular approach taken to increase truck parking. In locations where existing parking lots are adequate for trucks, the cost associated with allowing trucks to park may be minimal and involve mostly maintenance and signing to direct truck drivers to the new locations. However, paving new land for truck parking can be expensive. The National Association of Truck Stop Operators (NATSO) estimates that it costs roughly $100,000 to convert an acre of bare land into a truck parking lot. NATSO also estimates that an acre of
D-8
parking can store about 18 trucks and may cost $8,000 to $10,000 to maintain per year (NATSO, “Truck Parking/Rest Area Commercialization,” Alexandra, VA, 2001). Institutional, political, and policy issues: Increasing truck parking spaces provides dual positive benefits by improving safety and reducing logistics costs for shippers and receivers. The real problem is likely to be with residents resisting the development of a truck parking facility in their neighborhood. Another issue is likely to be tension between existing users of possible public space for parking and their perceived ownership of the space. For example, the use of park-and-ride lots for truck parking has been discussed, but has not been embraced by the transit community. However, the Metropolitan Council has already identified the use of shared facilities (e.g., park-and-ride lots) for truck parking on the fringe as one of its freight transportation strategies in its draft transportation plan. Opportunity for application in the Twin Cities (description and high, medium and low): Finding more truck parking on the fringe of the metropolitan area through innovative and joint use arrangements seems to be a very positive strategy. Therefore, there is a high opportunity for application.
D-9
5B. Increase Overnight Truck Parking in the Urban Core Description and how the strategy works: This strategy would address safe parking availability inside the core of the city. Parking in the middle of the city allows trucks to position themselves near their destination for a morning delivery. Without parking in the city core, trucks would position themselves at a fringe parking location and then need to compete with commuters on highways leading into the city. Truck parking could be provided at a separate secure location or in conjunction with a multi-use parking facility. For example, truck parking could be provided in a parking facility for athletic venues or convention facilities within a city’s core. Places where it has been applied: This strategy has been proposed by the Dallas/Fort Worth MPO, but no known application of this concept has been instituted by a public entity in a large city. Benefits: This strategy reduces truck traffic in the city core during the peak travel period. Costs: Unless an existing surface parking facility can be used, the cost of the land is likely to be prohibitive. Institutional, political, and policy issues: In a city core, where space is scarce, it is a matter of priorities. When we spoke to transportation professionals in the metropolitan area’s core, they felt that it would be difficult politically to devote space to overnight parking. Opportunity for application in the Twin Cities (description and high, medium and low): In the survey of trucking companies conducted by the Dallas/Fort Worth MPO, this strategy was highly ranked. However, in the Twin Cities, trucking activity is fairly dispersed across the metro area and, therefore, it would be difficult to select a location in one of the core areas that would be convenient for truckers making deliveries in the city. This strategy would only be feasible if a location could be found were the parking would have some joint use. This should be a medium to low priority opportunity for the Twin Cities.
D-10
6. Traffic Signal Prioritization for Heavy Vehicles Description and how the strategy works: This strategy would provide would install smart vehicle detectors (detectors that can distinguish between trucks and cars) to prioritize truck movements at a traffic signal. These smart vehicle detectors sense when a truck has approached the signal and know if the signal is going to turn red before the truck is able to clear the intersection. If the truck would be unable to clear the intersection, the signal controller extends the green to allow the truck to pass through the intersection. Places where it has been applied: Sullivan City, Texas; Dade County, Florida; Washington. Tested in Blooming Prairie, Minnesota. Primarily used in busy rural intersections near freight terminals. Benefits: Reduces truck accidents and idle times at intersections. A Texas Transportation Institute study in Texas showed that on a road with a weekly volume of 2,500 trucks, 100 fewer stops were made at the intersection. The Minnesota field evaluation of truck traffic signal prioritization found no benefits, but evaluation was inconclusive. Costs: Costs include engineering time for design and redundant loop detector installation (roughly $15,000 to $20,000 per intersection) on the major roadway approach to the intersection. Drivers on the minor roadway approach may experience increased delay. Institutional, political, and policy issues: Issues include vehicles on other roads queuing up longer than usual. Also, after drivers understand that the green light timing is extended, they may lose respect for the signal. Coordination with local communities is required for any changes in the signal timing. Opportunity for application in the Twin Cities (description and high, medium and low): Opportunity for application in the Twin Cities is high. There are several routes that have signalized intersections near freight terminals with heavy truck traffic that would benefit from changes in signal timing. Mn/DOT is still testing this strategy.
D-11
7. Use of HOV and HOT Lanes by Trucks Description and how the strategy works: This strategy involves allowing trucks to use the high-occupancy vehicle (HOV) lanes, giving trucks the same advantages HOVs receive during the commuting hour. This strategy might be considered differently, depending on whether the HOV lanes are separate or just diamond lanes that are not segregated from the regular roadway. Allowing trucks to use HOV lanes would be justified because HOV lanes are underutilized. Places where it has been applied: Trucks are permitted to use the HOV lanes in the Washington, D.C. suburbs of Northern Virginia when they meet the vehicle occupancy requirements. Use of the HOV lanes by trucks, regardless of their occupancy level, was considered by the California DOT in Southern California, but was dropped due to legal and funding barriers. Benefits: Trucks generally have poor acceleration performance when compared to smaller vehicles. Removing trucks from congested lanes provides benefits to the vehicles remaining in the congested lanes. It allows the trucks to travel on non-congested HOV lanes, which is beneficial for trucking companies because it would decrease travel time. Non-congested travel for trucks would reduce stop and go movement in congested traffic, reducing truck fuel consumption and emissions. No known scientific study has been done to quantify the benefits of the use of HOV lanes by trucks. Costs: Assuming that excess capacity exists in the HOV lanes to accommodate additional trucks, the only cost associated with this strategy is to change the signing and conduct a public information campaign to inform motorists and trucking companies of this policy change. Institutional, political, and policy issues: Free use of the HOV lanes was not a very popular strategy with the transportation professionals interviewed. Like the California DOT, we believe that Mn/DOT would find that this was not a popular strategy among current HOV lane users and that it might meet legal challenges. At the very least, the use of HOV lanes by trucks would certainly be a contentious strategy from the public policy perspective and presents equity issues. The equity issue might be diminished if instead of free use of the HOV lanes, there was a toll for use of the lanes. This possibility is or has been considered in designing the prospective users of the future HOT lanes on I-394. Most of the transportation professionals interviewed were either in favor or not opposed to use of toll lanes by trucks. Opportunity for application in the Twin Cities (description and high, medium and low): Low opportunity for free lanes, medium to high opportunity for tolled lanes.
D-12
8. Truck Use of HOV Ramp Meter Bypass Lanes Description and how the strategy works: This strategy would allow trucks to use the bypass ramps around queues at a ramp meter. Of the 430 metered on-ramps on the metro freeway system, there are 73 on-ramps with HOV bypass lanes. This would allow trucks to avoid having to nose their way, stopping and starting, to the front of the queue. Since trucks would move past the ramp meter in motion, they would be able to enter the traffic stream at a higher speed and merge more smoothly. This could operate with or without a toll. Places where it has been applied: We found no locations where trucks were allowed to use the bypass lanes. However, Muthuswamy and Levinson conducted a simulation study of ramp meter bypasses in the Twin Cities metropolitan area to evaluate the concept. The purpose of the simulation study was to evaluate the effects of trucks paying a toll and bypassing the ramp meter and to understand how to maximize user benefits, toll authority profits, and system benefits. Muthuswamy and Levinson found that user benefits are maximized at a zero toll. In other words, removing as many trucks as possible from the metered ramps benefits everyone. Benefits: Muthuswamy and Levinson’s simulation model only investigated the aggregate travel time savings of one metered on-ramp with a bypass lane. The truck operators approaching the bypass ramp only had two choices: either pay the toll and use the bypass ramp or not pay the toll and avoid the bypass ramp. The simulation does not take into account network effects on the surface street system or the interstate. With these simplifying assumptions and under the user benefit maximization scenario, the researchers calculated the increase in user benefits to be almost $300 per 1,000 simulated vehicles (almost 30 cents per vehicle) when the demand is very high and the ramp is congested. When congestion is low, the benefits are half the benefits of high volume. The benefits are reduced when the toll is increased and maximized when the toll is zero. Muthuswamy and Levinson do not include in their analysis safety benefits that would result from smoother merges into the traffic stream and emission benefits that would result from trucks having to make fewer starts and stops. Costs: If there are no tolls, all that would be required is new signage for the entrance to the ramps. If there are tolls, there would be costs associated with electronic toll tag readers, communication systems among the road side readers, the centralized account processing systems, and toll enforcement. Institutional, political, and policy issues: Most of the transportation professionals interviewed were relatively positive regarding the idea of trucks using ramp meter bypass lanes. If the bypass lanes were not tolled, there would probably be equity issues raised. If the trucks were tolled, the toll would have to be great enough to more than cover the fixed and variable costs of transactions at a minimum (probably in the neighborhood of 10 cents per bypass). Opportunity for application in the Twin Cities (description and high, medium and low): High applicability.
D-13
9. Improved Advanced Signing on Arterials for Freeway Entrances Description and how the strategy works: There are a few methods of advanced guidance. One method is simply marking the route to an interchange with freeway shield signs and an arrow underneath. Another method involves overhead lane assignment signs on the approach to an interchange. When approaching an interchange on a multi-lane arterial street, it is not always clear which lane a vehicle should be in to travel on the freeway in the desired direction. For example, when turning onto a freeway at a diamond interchange, a vehicle should always enter the interchange in the lane that is in the same direction they wish to turn. The right lane is for turning right onto the freeway and the left lane is for turning left onto the freeway. However, with a partial or full cloverleaf interchange, the appropriate lane will not be the same as that of a diamond interchange. In this situation, signage should be placed upstream from the interchange, allowing trucks and other vehicles that are difficult to maneuver enough time to move to the correct lane in advance of the interchange. Places where it has been applied: Many states have assisted unfamiliar travelers with the identification of paths to freeway interchanges and the assignment of lanes on approaches. For a recent survey of states conducted for NCHRP 314, “Strategies for Managing Increased Truck Traffic,” over half of the states responding (12 of 22) indicated that they had improved informational or directional signage in response to increased truck traffic. Benefits: Trucks and unfamiliar travelers drive fewer miles out of the way looking for entrances to freeways. Vehicles on the approaches to interchanges select the correct lane for traveling on the freeway in the desired direction. Lane assignment in advance of the interchange reduces the risk of crashes. Costs: The costs vary tremendously, depending on location and the design of signs. At some interchanges, states have used overhead sign bridges with lane assignment signs. At other locations, states have mounted an interstate shield on the side of the road with a plate indicating the lane assignment for the direction (east or west/north or south). Institutional, political, and policy issues: No institutional issues are envisioned. There was some resistance to this strategy by transportation professionals interviewed because they felt that there already was a proliferation of signs around interchanges, and few believed that more directions to interchanges or lane assignment was an issue. Opportunity for application in the Twin Cities (description and high, medium and low): Medium to high opportunity.
D-14
10. Expand Integrated Corridor Traffic Management Description and how strategy works: Integrated corridor traffic management (ICTM) aims to optimize corridor capacity, traffic operations, and safety by applying many advanced technologies, including adaptive ramp metering, adaptive traffic signals, motorist information, and surveillance systems. ICTM uses Sydney Coordinated Adaptive Traffic System (SCATS) to provide adaptive traffic control technology for both freeway metered ramps and arterial traffic signals. The deployed technologies are designed to encourage locally generated short trips to remain on local roads and off the freeway system to maximize the capacity of the freeway and to support drivers bypassing freeway incidents by using parallel surface streets. Places where it has been applied: In Minnesota, along I-494, along with Hennepin County and the Cities of Bloomington, Richfield, and Edina. Benefits: Increased cooperation among public agencies. The new SCAT system builds on existing ramp meter systems. Decrease in travel time. The evaluation of the system showed that travelers will alter their travel routes when provided with incident information. Motorists will use parallel surface streets to avoid congestion on I-494. Costs: The costs for software, signs, and equipment for the I-494 corridor were $9,000,000. There were ongoing training costs, as well. Institutional, political, and policy issues: Local and state agencies must cooperate and provide information to each other. Cross training is required. Traffic control systems at all levels must be coordinated to work the system. Opportunity for application in the Twin Cities (description and high, medium and low): The opportunity for application in the Twin Cities is high because after deploying the system in the southern metro area, expansion of the system into other metro area sections appears likely.
D-15
Driver-oriented Strategies
11. Improvement of Information for Truck Drivers
12. Improved Signs: Larger, Directional, Improved Lettering
13. Dynamic Curve Warning Systems
14. Information on Roadway Hazards
15. Provide Guidance and Turn-by-Turn Directions to Truck Drivers
16. Update Trucker’s Guide
17. Improve CARS to Provide Road and Traffic Information on City and County Road Networks through 511
18. Utilize CB Alert System
D-16
11. Improvement of Information for Truck Drivers
Description and how the strategy works: Traveler information requirements for over-the-road truckers are considerably different than those of a normal commuter. Over-the-road truckers need information on weather and other road conditions in the future and miles away from their current locations. They need information on special events that may interfere with a delivery or congestion that could be avoided by traveling through an urban area at a different time. Truckers also have unique needs regarding servicing and repairing trucks and other services that an ordinary traveler would not need. For example, truckers that sleep in their cab overnight need to know where overnight parking spaces are available along the interstate. This strategy is not suggesting a specific type of media for delivery of this information (HAR, rest area kiosks, email list serves, internet web sites, DMSs, etc.), but is instead suggesting that improvements to trucker-oriented traveler information should be investigated and implemented by Mn/DOT. Places where it has been applied: Deciding what information to deliver and how is still being researched. Several studies have been conducted over the last several years on what kinds of information truckers want and may even be willing to pay for. FreightForward was a U.S. Department of Transportation Field Operational Test which provided truckers with real-time, customized traffic congestion, incident, construction, and maintenance information along the I-95 corridor from Virginia to Maine. The evaluation of FreightForward was completed in 2000 and the test generally found that although truckers have a greater appreciation for the usefulness of traveler information, the information had a minimal impact on the operational efficiencies of their companies. At the end of the field test, FreightForward migrated into a failed attempt to commercialize the information. Benefits: Although the work in this area has not been extensive, based on the FreightForward operational test, the benefits of improved information for truckers were fewer than expected. Costs: Costs could vary greatly, depending on the delivery of the information. However, costs would most likely be minimized because the delivery of information is likely to be through existing transmission systems, e.g., the internet, DMS, or other available media. The content is likely to include information that is already collected and would simply need to be repackaged for trucking firms. Institutional, political, and policy issues: None. All the transportation professionals we interviewed were positive about this strategy. Opportunity for application in the Twin Cities (description and high, medium and low): This strategy would have received a high ranking, but the lack of success achieved by the FreightForward system caused us to be more cautious and assign this strategy a medium to high ranking.

D-17
12. Improved Signs: Larger, Directional, Improved Lettering Description and how the strategy works: This strategy would supplement the Minnesota Manual of Uniform Traffic Control Devices (MUTCD) to accommodate larger truck-oriented signs. The signs would specifically include regulatory and other information for truck drivers, using bigger and brighter signs, larger lettering, and a higher print contrast. Places where it has been applied: Being investigated in Georgia. Benefits: Improves safety and compliance with regulations and increases sign effectiveness. Costs: This strategy would require an investigation of the specific effectiveness of the improved signs to determine sign placement, the reflectivity of improved lettering, and the message types that are most consistent for truck drivers. Institutional, political, and policy issues: Implementing this strategy will require a significant amount of planning and development of policy guidelines for new signage and for ensuring that new signs do not interfere with existing signs. None of the transportation professionals we interviewed thought that signage was an issue for trucks in the Twin Cities. On the contrary, a few of the Mn/DOT employees were concerned about sign pollution. Opportunity for application in the Twin Cities (description and high, medium and low): The opportunity for application for this strategy is in the medium range. As the Minnesota MUTCD is being revised, the authors should review the requirements to make sure that truck-oriented signage is posted with the adequate size and height to accommodate trucks.
D-18
13. Dynamic Curve Warning Systems Description and how the strategy works: The Dynamic Curve Warning System (DCWS) warns truck drivers that they are approaching a curve at an unsafe speed, based on weather conditions, road geometry, and their current vehicle speed. The warning will enable them to reduce their speed and maintain control of their vehicle. In addition to warning drivers that they are driving too fast, the speed warning systems can also vary the advisor speed with respect to current conditions based on algorithms defined by the DOT. Typical speed warning systems can be composed of speed measurement technology, an automatic vehicle classification (AVC) system, a weigh-in-motion (WIM) system, and a DMS to communicate with the driver. The AVC and WIM technologies are primarily used for commercial vehicle operations. Some systems merely inform the driver of the recommended speed for prevailing roadway conditions (fog, construction, congestion, etc.) and the driver's actual speed. Other systems run an algorithm to determine the recommended speed for the particular vehicle's characteristics (loaded or empty truck, etc.) and the vehicle's actual speed. Speed warning systems are not necessarily infrastructure intensive. They can require minimal permanent equipment installation or they can be set up as a completely mobile system. Places where it has been applied: Virginia, Maryland, California, Missouri, Colorado. Benefits: A DCWS on I-70 in Colorado reduced truck accidents near Eisenhower tunnel by 24% over two years. A DCWS system was deployed in Northern Virginia. Following its deployment, Virginia DOT reduced speed by 25% and reduced rollover accidents by 10%. A DCWS offers other benefits, including the following:
• Lower costs incurred in making repairs to crash locations • Fewer fatalities and injuries • Lower costs incurred in repairs or insurance through avoiding accidents • Lower costs incurred in repairs, insurance, and loss of shipments through avoiding
accidents • Favorable public perceptions of safety improvement schemes • Reduced incident management costs
Costs: A truck-speed warning system was deployed on a downgrade curve along I-70 in Glenwood Canyon, Colorado by the Colorado DOT. The curve tightens from seven to five degrees. This stretch of roadway had a history of severe runaway truck accidents. If a truck is detected (via radar) exceeding the posted speed, then the truck's speed is posted on a dynamic message sign. The sign displays, “YOU ARE SPEEDING AT [XX] MPH. 45 MPH. CURVE AHEAD.” The system has been in operation since September 1996. The cost of the system is estimated in the range of $25,000 to $30,000. Institutional, political, and policy issues: Periodic testing should be undertaken to ensure that drivers are continuing to alter their speeds in response to the warnings. In cases where the speeds are not just recommended, but are actually enforceable, the enforcement agencies should be involved. Calibration of speed warning systems is critical. Care should be taken to ensure that
D-19
speed readings displayed on the warning signs are consistently accurate, because readings that differ from vehicle speedometer readings will damage the credibility of the system. Opportunity for application in the Twin Cities (description and high, medium and low): Opportunity for deployment in the Twin Cities is high. A system could be deployed in several areas where sharp corners turn onto freeway entry or exit ramps. In addition to speed warnings, the system can be expanded to include the following:
• Warnings about construction or maintenance occurring ahead • Temporary speed advisories and warnings due to construction activities or severe weather • Snow chains usage advice • Traveler information, including diversion advice • Warnings for vehicles approaching high-speed intersections • Warnings of hazardous roadway or weather conditions • Vehicle width, height, or weight restrictions ahead
Interconnection of signs to a regional traffic management or traveler information center may provide maximum flexibility in the displayed messages. Should additional types of information be displayed on the speed warning signs, it would be necessary to establish rules for determining how and when a speed warning message should override a more general informational message.
D-20
14. Information on Roadway Hazards
Description and how the strategy works: This strategy would create a map indicating the location of roadway hazards for trucks, such as low-clearance or weight-restricted bridges, roadways with tight turning radii, and other infrastructures not designed for combination tractor-trailer trucks. The map could be distributed as paper copies or over the internet. Places where it has been applied: This strategy has been planned both in Des Moines and in the Gary-Chicago-Milwaukee corridor, but never put into operation in either location. At one time, the Metropolitan Council produced a paper map that included weight-restricted routes and bridges in the metro area. However, it did not include other hazards and the Metropolitan Council discontinued printing the map in the early 1990s. Benefits: Fewer issues routing trucks through locations where they are too large to navigate. Less wear and tear on the infrastructure: fewer bridges are hit and fewer overweight trucks inadvertently travel on roadways. Costs: Less than $20,000 per year. Institutional, political, and policy issues: None. Opportunity for application in the Twin Cities (description and high, medium and low): In the Twin Cities, there are very few low clearance bridges or other infrastructure impediments to large trucks. Therefore, a map focusing only on hazards would probably not be cost effective. This strategy should be folded into the strategy “Update the Trucker’s Guide.”
D-21
15. Provide Guidance and Turn-by-Turn Directions to Truck Drivers Description and how the strategy works: Two levels of navigation assistance can be provided. The first involves static turn-by-turn voice and graphical guidance using a static map database. The driver enters the destination address and the system determines the route and guides the driver to the destination, turn-by-turn. Several such systems are commercially available. The second type is dynamic turn-by-turn instructions to the driver based on current conditions. A dynamic system would require that current and forecasted link-by-link travel times be calculated by the Twin Cities Traffic Management Center, including lane blockages and restrictions (weather conditions, incidents, and construction). This information would then be downloaded to the onboard navigation system. Using current information on incidents, weather conditions, and construction, the onboard navigation system would provide the driver with turn-by-turn instructions based on current conditions and advice on alternative routes for efficient travel. Places where it has been applied: Suggested in Georgia. Benefits: An evaluation of commuters in Turin, Italy showed that cars equipped with in-vehicle navigation equipment experienced a 10% reduction in travel time. Other benefits include avoidance of congested areas and more efficient use of time and road networks. The FleetForward Operational Test provided current traffic, incident, and roadway conditions to dispatchers (rather than drivers). The evaluation of FleetForward found that two-thirds of the carriers in the field test experienced no change in measures related to on-time delivery and the accuracy of estimated time of arrival. Therefore, the findings regarding benefits are mixed. Costs: Off-the-shelf technology is available. Currently, turn-by-turn static navigation systems are available for as little as $1,000. A dynamic system would have to be developed through a private/public partnership with Mn/DOT providing line-by-link dynamic travel time information and roadway lane blockages and restriction information, either directly to wireless onboard communication systems or to a private partner that would communicate the information to an onboard communication system. There is an entire market package (ATIS4-Dynamic Route Guidance) in the National ITS Architecture dealing with dynamic systems. Although Mn/DOT has much of the required information on its managed freeway system in the metropolitan area, the planning and design of a system to deliver the information to onboard navigation systems could be a significant task. Institutional, political, and policy issues: There are no institutional issues associated with static systems. These systems are already commercially available. Dynamic systems would encounter significant challenges. A primary challenge is the cost of providing in-vehicle travel time information when such information is already available through radio channels that broadcast traffic reports. Opportunity for application in the Twin Cities (description and high, medium and low): The opportunity for dynamic guidance is low, primarily due to high start-up, operation, and maintenance costs to Mn/DOT.

D-22
16. Update Trucker’s Guide
Description and how the strategy works: The Twin Cities Metropolitan Area Trucker’s Guide was a paper map produced by the Metropolitan Council in the 1980s and early 1990s. It included truck routes, weight-restricted routes and bridges, truck-prohibited roads, and 12-month roads and spring load-restricted roads in the metropolitan area. This map could be constructed for current conditions for the seven-county (or eleven-county) area in a geographic information system (GIS) and posted on the internet. The original Trucker’s Guide included information on Minnesota size and weight regulations, driver’s licensing regulations, and general guidance on the rules of the road. It also included the telephone numbers of local and state truck-related information sources. The Trucker’s Guide should be expanded to include infrastructure hazards like low-clearance bridges and information on obtaining dimensional permits at the state and local level. Places where it has been applied: The Port of Tacoma and many other ports have developed their own trucker’s guides. We did not find any at the metropolitan level, but found that the American Transportation Association (now the American Transportation Research Institute) used to produce a state guide. Benefits: The guide helps truckers and truck dispatchers navigate the metropolitan area. Better developed routes through the metropolitan area on appropriate roadways will reduce wear and tear on roadways not equipped to handle heavy trucks. This will also reduce truck miles resulting from poor navigation. Costs: Less than $25,000 to establish and less than $5,000 per year to update and operate a website. Paper copies would probably cost about $3.00 per map. If 2,000 maps were printed each year, the cost would be around $6,000.
Institutional, political, and policy issues: None Opportunity for application in the Twin Cities (description and high, medium and low): This is a relatively low-cost activity that appears beneficial. In addition, the information included in the map will probably serve many other planning purposes. For example, the information on 10-ton and 9-ton truck routes will be useful for planning continuity of truck route across municipal and county boundaries.
D-23
17. Improve CARS to Provide Road and Traffic Information on City and County Road Networks through 511 Description and how the strategy works: This strategy would allow cities and counties to enter data into the Condition and Acquisition Reporting System (CARS) for their jurisdiction, such as data on construction, road closures, incidents, etc. The information could then be disseminated through 511 and used by individual jurisdictions for management of their roadway networks. Places where it has been applied: Des Moines, IA and Philadelphia, PA have systems that operate independently of CARS, but provide internet-accessible maps that display information about lane restriction and blocks. Benefits: This strategy increases awareness and compliance with truck regulations and decreases the intrusion of trucks into residential areas. Commuters surveyed in Philadelphia stated that 66% changed departure times and 86% changed their routes after receiving local information. Costs: There would be moderate costs for Mn/DOT to update the CARS website, but the basic website infrastructure already exists. There would also be costs for maintaining up-to-date information. Institutional, political, and policy issues: This strategy would require coordination between cities, counties, and Mn/DOT. Mn/DOT would have to include the local road information into the database. Cities and counties would have to develop a system for assuring the quality of data maintained by the local jurisdiction. Erroneous information in any jurisdiction would result in loss of credibility for the entire system. Opportunity for application in the Twin Cities (description and high, medium and low): The opportunity for application in the Twin Cities is high. The basic infrastructure already exists and would require additional programming. The migration of CARS to a local jurisdiction could start with one of the core cities and Hennepin or Ramsey County. During our interview with City of St. Paul staff members, they expressed an interest in the CARS program.
D-24
18. Utilize the CB Alert System Description and how the strategy works: The Wizard Work Zone Alert and Information Radio (CB Alert) was designed and patented by Highway Technologies, Inc. and built and marketed by TRAFCON Industries, Inc. It was designed to give drivers monitoring the CB radio advanced warning of upcoming delays at construction sites or incidents. The advanced warning will allow drivers the opportunity to slow, stop, or maneuver before they reach the work zone or encounter queues of halted vehicles. Since CB radios are generally monitored by truck operators, it was assumed that the CB Alert would primarily impact truck drivers. Places where it has been applied: Iowa, Kansas, Texas, and Oklahoma. Benefits: Surveyed drivers generally supported obtaining additional information. Drivers saw the system as particularly beneficial in alerting them to work zone activity, especially at night. The CB Alert system can provide work zone activity information that is not available on DMS. Users have found that the system is very useful when a lane closure causes a queue on a heavily trafficked highway. Queue length can fluctuate by miles and quickly become backed up beyond the early warning signs for a work zone. The signal sent by the CB radio is not constrained to a specific point. Other applications include informing trucks of the appropriate lane assignment, warning trucks of their approach to mobile work zones (paint-stripping crews), and other special conditions. Although there is no hard statistical evidence defining the savings in crashes, field tests in Iowa and Texas have shown that they are effective in warning truck drivers in advance. Costs: $3,500 to $5,000, including include radio, speed detector, and static speed sign. Institutional, political, and policy issues: There are few institutional issues for deploying this system. If the work zone is a Mn/DOT project, then Mn/DOT would have responsibility for setting up the system at its work zones. Furthermore, the use of CB radio frequencies does not require FCC permits, unlike the use of Highway Advisory Radio. The CB radio does have a limited broadcast range, which has to be taken into account. The alert message must be direct and concise in order to convey the required information without causing unwarranted concern. For example, messages from Mn/DOT should be worded as a road work alert and not an enforcement alert. Opportunity for application in the Twin Cities (description and high, medium and low): This is a low-cost, highly effective method for warning truck drivers about upcoming road conditions. The opportunity for application in the Twin Cities is high.

D-25
Capital Investment Strategies
19. Improved Highway Design: Lengthen Lanes, Access to Local Roads
20. Dedicated Truck Lanes and Dedicated Truck Toll Lanes
21. Deceleration Lanes
22. Add Additional Lanes to Existing System
23. Increased Staging Areas for Drop-off/Pick-up of Freight
24. Expand Minnesota Bridge Anti-icing Systems
D-26
19. Improved Highway Design: Lengthen Lanes, Access to Local Roads Description and how the strategy works: This strategy develops improved collector routes adjacent to mainline interstates that allow truck traffic to enter and exit the interstate system. Places where it has been applied: Proposed in New York on the Long Island Expressway. Benefits: This strategy increases safety by decreasing weaving maneuvers and lane changing on the mainline route. For short trips, trucks would be able to remain on local roads. Costs: This is a long-term strategy that is expensive for the public sector. Institutional, political, and policy issues: There are several issues to implementing this strategy. One is purchasing the required right-of-way. This strategy also requires cooperation with the cities and counties along the interstate network and working with local businesses and citizens whose properties may be affected. Finally, there would have to be access to sufficient funding. Opportunity for application in the Twin Cities (description and high, medium and low): The opportunity for application in the Twin Cities is low. This strategy represents an expensive undertaking and poses right-of-way issues, especially along routes like I-494, where the commercial zone buffers the freeway corridor.
D-27
20. Dedicated Truck Lanes and Dedicated Truck Toll Lanes Description and how the strategy works: This strategy creates a system of roadways to be used exclusively by trucks with three or more axles. The exclusive roadways may be tolled or free. Places where it has been applied:
• California Pomona Freeway from Los Angeles to Ontario • New Jersey Turnpike • Part of I-75 in Detroit (uses jersey barriers to segregate lanes) • Texas DOT is studying the issue for the Dallas-Ft. Worth area; a bond issue has passed
for the Trans-Texas Corridor in Austin, which will have four dedicated truck lanes (two for each direction) on Texas highways 130 and 45
• I-81 in Northwest Virginia is under consideration for dedicated truck lanes; $1.5 billion has been earmarked in the highway reauthorization bill for this project
• Strategy is being examined on I-80 between Davenport, Iowa and Des Moines, Iowa. Benefits: This strategy of segregating cars from trucks potentially improves safety, reduces congestion, improves traffic operations, and facilitates efficiency of goods movement. Costs: A California study showed capital costs of a 142-mile segment from San Pedro to Barstow at $16.5 billion. The I-81 corridor in Virginia, if completed by 2018, is estimated at $13 billion. Mn/DOT estimates that putting an extra lane on an existing suburban freeway can cost between $20 and $30 million per mile, depending on conditions (soils, drainage, existing adjacent highways, availability of right-of-way, and utility relocation costs). Institutional, political, and policy issues: This strategy requires extensive planning, engineering, design, and new roadway construction. There would have to be close coordination with local and state governments, access to right-of-way, and cooperation from citizens and local businesses. This strategy also requires access to funding to help pay for new roads. The roads in Texas and Virginia are partially funded by toll revenue. During interviews with transportation professionals, we found very little support for dedicating a lane from the existing system to truck traffic. However, most agreed that if new capacity is being built into the system, a truck-only lane should be examined. As general planning guidance, a feasibility study of truck-only lanes conducted by the Southern California Association of Governments recommended that truck-only lanes should not be considered until the following volume levels were met: 1) truck volume exceeds 30% of the vehicle mix, 2) peak hour volume exceeds 1,800 vehicles per hour per lane, and 3) off-peak volumes exceed 1,200 vehicles per hour per lane. Although some of the freeway system meets or exceeds the vehicle volumes, none carry a vehicle mix with 30% trucks. Opportunity for application in the Twin Cities (description and high, medium and low): Although there are potential public safety and efficiency benefits to be gained by this strategy, the opportunity for application of this strategy is low. This is a long-term strategy with high implementation costs. Some of the transportation professionals interviewed suggested that when an outer beltway is planned, the feasibility of parallel dedicated truck lanes should be considered.
D-28
21. Deceleration Lanes
Description and how the strategy works: On all roadways, right-turn deceleration lanes reduce rear-end crashes involving through vehicles and right-turning vehicles. On multi-lane, median-divided highways, left-turn deceleration lanes also decrease rear-end crashes and allow slowing traffic to move off of the through lane so through traffic is unimpeded. Deceleration lanes are particularly important when there is a high percentage of truck traffic. Turning trucks are moved off of the roadway sooner, creating less delay. Through trucks are not required to slow or stop for turning vehicles. Places where it has been applied: Deceleration lanes are used practically everywhere, but they are not usually long enough to allow large trucks to decelerate without slowing traffic in through lanes. Furthermore, deceleration lanes are often not included in the designs of low-volume intersections. On high-speed facilities (55 mph or greater) deceleration lanes should be about 500 feet long. Benefits: This strategy provides greater through capacity and fewer delays and rear-end crashes. Costs: If built as an independent improvement, a 500-foot deceleration lane will cost around $40,000. However, if the lane is added as part of the construction or reconstruction of an intersection, deceleration lanes costs much less. Institutional, political, and policy issues: None. Opportunity for application in the Twin Cities (description and high, medium and low): Longer deceleration lanes are known to improve safety and improve intersection operating efficiency. This strategy’s applicability to the Twin Cities is high.
D-29
22. Add Additional Lanes to Existing System Description and how the strategy works: This strategy designs and constructs additional traffic lanes for the existing freeway network at critical locations to create better lane continuity at bottlenecks. Lane drops result in merging traffic merging to the left, which reduces the capacity of the through lane. In other words, if the capacity of a through lane is 2,400 vehicles per hour, the merging action may reduce the capacity of the through lane from 1,600 to 1,800 vehicles per day. Merging is particularly problematic for large trucks because they require large gaps in traffic. Places where it has been applied: I-10 Florida, California, and many locations around the Twin Cities metropolitan area (e.g., adding a lane on I-494 from I-394 to T.H. 212 and on I-694 from T.H. 100 to the Fish Lake interchange). Benefits: This strategy increases capacity, reduces short-term congestion, and improves safety. Costs: There are costs to obtain right-of-way, relocate utilities, and build noise protection. This expensive strategy can cost, depending on the conditions, between $20-30 million per mile. Institutional, political, and policy issues: There are numerous environmental and right-of-way issues to contend with. Local communities may resist widening of the freeway. Cooperation with businesses and residents along the freeway would have to be established. Opportunity for application in the Twin Cities (description and high, medium, and low): There are a number of locations in the metropolitan area where there is a lack of lane continuity and, therefore, the opportunity for application of the strategy is high. Several of these locations are scheduled to be improved in the future. Some of the most notable include the reduction to a through lane on 694 at old highway 10 between Lexington Avenue and I-35W and the lane drop of I-35E northbound at the ramps from I-94 just before the University interchange.
D-30
24. Increased Staging Area for Drop-off/Pick-up of Freight Description and how the strategy works: Establish system of distribution or staging facilities on the outskirts of the Twin Cities where freight could be transferred to smaller vehicles that would then deliver and/or pick up at the destinations within the city. Places where it has been applied: California is investigating staging areas or distribution centers along the Alameda corridor. Other examples of value-added warehousing and distribution include Newport, Virginia; Wilmington, Delaware; Umatilla, Oregon; Hampton Roads, Virginia; Savannah, Georgia; and Morrow, Oregon. Benefits: The benefits to implementing this strategy include a reduction in the volume of large trucks in the metropolitan area. This strategy may also benefit truck drivers by not requiring them to navigate narrow city streets, causing them less frustration. Costs: This is a high-cost strategy for both the public and private sectors because new distribution centers would be constructed, land and right-of-way would be obtained, and maintenance would be performed following construction. Institutional, political, and policy issues: Other distribution centers may object. There are land use and possible noise issues for neighboring businesses and residents. Trucking would have to work out pick-up and delivery schedules with shippers and receivers. Opportunity for application in the Twin Cities (description and high, medium and low): Although there are potential public sector benefits and economic benefits, the opportunity for application of this strategy is medium. This is a long-term strategy with high costs for implementation. The benefits of implementing this strategy would not be realized for 5–10 years.
D-31
25. Expand Minnesota Bridge Anti-icing Systems Description and how the strategy works: A bridge anti-icing system consists of a computerized system that sprays potassium acetate, or another anti-icing chemical, on the bridge deck when data from sensors and a Road Weather Information System (RWIS) determine that hazardous winter driving conditions are imminent. An example of the bridge anti-icing system is deployed on I-35W over the Mississippi River in Minneapolis. The system works with a combination of sensors, RWIS weather stations, a computerized control system, and a series of 38 valve units and 76 spray nozzles that apply potassium acetate. A 3,100-gallon tank is located in a small control pump building next to the bridge for potassium acetate storage. The high-tech bridge anti-icing system includes two types of sensors: active ground and pavement temperature/moisture sensors, and ice formation sensors, both of which are proprietary. In simple terms, an active sensor is one that interacts with the environment and observes how the environment affects the sensor or how the sensor affects the environment. A passive sensor simply receives information. The sensors give advanced warning that approaching weather may produce hazardous driving conditions on the bridge. The RWIS weather stations’ optical precipitation sensors measure the air temperature and detect the presence and intensity of rain, sleet, or snow. Information collected by the proprietary sensors and weather station is transmitted to a Mn/DOT computer. The relevant issue for trucks is that frost or ice most commonly forms on bridges late at night or in the early morning. The first vehicle on the bridge at that time is often a truck. Although all traffic will benefit from bridge anti-icing systems, the benefit to trucks will be proportionately greater than for other vehicles. Places where it has been applied: Bridge anti-icing systems have been implemented in the following locations:
• Metro District - Boshung System, I-35W over the Mississippi River in Minneapolis, using potassium
acetate
• District 7W, Windom Maintenance Area - Freeze-Free System, I-90 at junction Rock County Road 4 near Beaver Creek, using
magnesium chloride - Freeze-Free System, I-90 at junction MNTH 60 in Worthington, using magnesium
chloride
• District 1A, Duluth Maintenance Area - Freeze-Free System, 2nd Ave. West between 5th St. and Mesaba Ave. (steep
roadway) in Duluth, using magnesium chloride - Nordic Engineering, I-35 at Atkins Bridge (RP 231), using magnesium chloride

D-32
• District 4, Detroit Lakes Maintenance Area - Boschung System, TH 336 at US 10, using potassium acetate
• District 6A, Rochester Maintenance Area
- Odin System, SB TH 61 at Snake Creek Bridge over Township Rd. between Wabasha and Winona, using potassium acetate
- Odin System, NB TH 61 on right-turn lane and bridge over CP-RAIL (ramp to I-90 over Mississippi River), using potassium acetate
• Other states, including Iowa and Kansas
Benefits: The benefits of this type of system are improved level of service on the bridge during inclement weather and reduced primary and secondary crashes. Time is saved by not having to divert snowplow operators to treat the bridge while they are on their routes. An evaluation of the bridge anti-icing system found a benefit-cost ratio of 3.4 to 1 for this type of system. Costs: Construction and installation of this type of system on the bridge on I-35W at the Mississippi River bridge was $618,450. Costs can be minimized if the addition of a bridge anti-icing system can be scheduled with the reconstruction of the bridge deck. Institutional, political, and policy issues: First, there is a need to identify the bridges that would benefit from such a system. Furthermore, there is a need to develop an internal Mn/DOT program delivery team to coordinate the deployment of future anti-icing systems. The development of a 5- and 10-year plan to identify funding, resources, and integration opportunities with new bridge construction and rehabilitation projects would be necessary. Training for these types of systems is also required. Although these systems are automated, they require ongoing maintenance. Opportunity for application in the Twin Cities (description and high, medium and low): The opportunity for application is high.
D-33
Planning and Operations Strategies
26. Develop System to Collect Continuous Truck Data
27. Freight Advisory Council
28. Left-Turn Acceleration Lanes
29. Adapting Quick Clearance Legislation
30. Design Guidance to Local Governments for Accommodating Trucks on Local Roads
D-34
26. Develop System to Collect Continuous Truck Data Description and how the strategy works: This strategy would collect and maintain data related to truck movements in the region using fixed automatic traffic recorders, automatic vehicle classifiers, weigh-in-motion, video detection, mobile traffic counting and classifying equipment, and periodic origin-destination surveys to support data from secondary private and public sources (TranSearch, Commodity Flow Survey, etc.). This strategy would also develop a database and operational procedure for periodically collecting a range of data for analyzing goods movement needs. Finally, this strategy would expand the system to the state level. Places where it has been applied: Georgia, Florida. Benefits: This strategy incorporates truck movements into the long-range, strategic, regional transportation plan. By providing continuous truck-related data, Mn/DOT, the Metropolitan Council, and other local transportation planning agencies can make efficient decisions related to freight transportation. Costs: The costs of this strategy would include the management and storage of the data. Costs would be incurred for the development of policies and procedures for providing others with access to the data. There are also staffing requirements; probably one position would be added to Mn/DOT’s Office of Transportation Data. Institutional, political, and policy issues: The principal policy issue is to develop procedures for protecting data privacy. Furthermore, freight planning can help ensure that freight movement needs are appropriately considered by decision makers, because state and local transportation planners would be provided with the necessary tools to understand the impacts of alternative investments on the freight system’s efficiency. Opportunity for application in the Twin Cities (description and high, medium and low): The opportunity for application of this strategy is high. Currently, the Mn/DOT has numerous data collection systems in place. Implementation of this strategy would involve identifying current activities (single and repetitive) for data collection, ways to focus on the trucking component of the traffic stream, and gaps in the data related to trucks. The procedures for capturing truck data could then be developed and initiated.
D-35
27. Freight Advisory Committee
Description and how the strategy works: There are often a number of deficiencies in the ability of metropolitan planning organizations to plan for freight. Training for transportation planners and engineers has focused on accommodating automobiles and passengers. As a result, there are few available data sources that measure the demands for and performance of freight systems. One method for obtaining more freight input into the metropolitan planning process is to develop a Freight Advisory Committee at the Metropolitan Planning Organization (MPO) level. A 2003 survey conducted by the Association of Metropolitan Planning Organizations estimated that 18% of all MPOs have instituted a Freight Advisory Committee. Places where it has been applied: Several metropolitan area MPOs have Freight Advisory Committees, including the MPO's for the Philadelphia, Seattle-Tacoma, San Francisco-Oakland-San Jose, Toledo, Miami, and Chicago metropolitan areas. Benefits: This strategy institutes a conduit for gaining a freight perspective on transportation planning decisions. Costs: Costs would be associated with staffing and supporting an additional advisory committee. Institutional, political, and policy issues: In general, if not organized and managed appropriately, the committee can backfire. Freight executives are accustomed to having decisions implemented quickly. In the public sector, the project planning and development process is long and laborious. These differences in perspective can violate the expectations of the Freight Advisory Committee members. Opportunity for application in the Twin Cities (description and high, medium and low): Several of the transportation professionals we interviewed felt a need for more involvement in the regional planning programming process. One professional strongly advocated the necessity of their involvement at the local government level as well. However, those that were most actively involved with the Metropolitan Council pointed out that a member of Mn/DOT’s Freight Advisory Committee is already on the Metropolitan Council’s Transportation Advisory Board and that this provided plenty of freight input into the regional planning process. As a result, the opportunity for implementation appears to be medium.
D-36
28. Left-Turn Acceleration Lanes
Description and how the strategy works: This is a strategy for adding left-turn acceleration lanes to two-way, stop-controlled intersections on multi-lane, median-divided highways. At such intersections, vehicles turning left from the minor road must travel through the median crossover and merge into traffic in the far lanes. Building a left-turn acceleration lane on the far side of the median would have two purposes. The first is to provide storage for vehicles longer than the width of the median, allowing them to wait in a lane running along the median. For example, if a 65-foot-long tractor-trailer combination wants to turn left through a 30-foot median crossover, the driver cannot move through the intersection in two steps, but must wait for a sufficient gap in both directions because the median is not sufficiently wide to provide the truck refuge. An ancillary lane starting upstream of the median crossover in the far lane along the median will allow the truck driver to seek refuge by hugging the median in the ancillary lane. The second purpose for the left-turn lane is to allow trucks to accelerate before merging, thereby allowing for a safer and smoother merge. Places where it has been applied: Mn/DOT has built 11 of these left-turn acceleration lanes in the state. Additionally, 13 other states employ this strategy. Benefits: Left-turn acceleration lanes reduce delays and improve safety. On roadways where the median does not provide sufficient storage for long trucks, left-turning truck drivers are forced to wait until they can find a sufficient gap in both directions. If the volume of traffic on the mainline is sufficiently high, this can greatly increase the amount of delay. The ability to accelerate before merging provides significant safety benefits. In a Minnesota evaluation of crashes before and after the installation of left-turn median acceleration lanes, rear-end crashes declined by 40%. When compared to similar intersections without left-turn median acceleration lanes, the intersections with left-turn median acceleration lanes had 75% fewer rear-end crashes. Costs: The Minnesota evaluation of left-turn median acceleration lanes estimated that a highway with speeds above 55 mph would require an acceleration lane and taper of 1,500 feet, for a total cost of $115,000. Although left-turn median acceleration lanes are expensive, they cost much less than other improvements, such as signals and grade-separation, that increase capacity and reduce delays at an intersection. Institutional, political, and policy issues: No institutional barriers are expected. Driver education is required to help drivers navigate the unique intersection geometry. Opportunity for application in the Twin Cities (description and high, medium and low): High.
D-37
29. Adapting Quick Clearance Legislation Description and how the strategy works: Quick clearance legislation provides officials, local law enforcement, and other public safety agencies with the ability to remove vehicles, cargo, or other personal property from the roadway or public right-of-way without the owner’s consent, if the vehicle has been in an accident or is blocking the roadway. Places where it has been applied: Arizona, Arkansas, California, Colorado, Maryland, Missouri, New Jersey, Tennessee, Texas, Virginia, Washington. Benefits: Quickly removing vehicles from the traveled portion of the highway improves safety for first responders and victims by minimizing their exposure to traffic. The probability of secondary incidents and congestion is reduced by swift clearance of vehicles. Costs: The costs consist of establishing the enabling “hold harmless” legislation, the subsequent training of officers, emergency responders, and tow truck operators, as well as public education campaigns and materials. Institutional, political, and policy issues: There are many institutional issues involving numerous stakeholders, including state, county, and municipal law enforcement; incident response teams; emergency medical services; the insurance industry; and motor vehicle owners. Successful implementation of the legislation also requires a “hold harmless” provision stating that any agency or public agency employee shall not be held responsible for any damages or claims that may result from the failure to exercise any authority granted under the legislation, providing the agency or employee is acting in good faith. Coordination across the spectrum is required to ensure success. Other institutional issues include the following:
• Conflicting response agency concerns • Liability concerns • Equipment constraints • Possible conflicts with tow truck operators • Training constraints • Personnel constraints • Funding constraints • Jurisdictional constraints
Opportunity for application in the Twin Cities (description and high, medium and low): Mn/DOT has in place an automatic tow program that quickly dispatches tow trucks to accident sites. Mn/DOT also has incident management teams to review accidents and responses to them. Therefore, many of the elements for applying the quick clearance legislation in the Twin Cities are already in place. The opportunity for applying the strategy depends on the political climate in the legislature and the ability of finding a champion to support the passage of the legislation.
D-38
30. Design Guidance to Local Governments for Accommodating Trucks on Local Roads
Description and how the strategy works: Specifications for city and county streets and roads have evolved within each jurisdiction over time. Generally, local design standards follow national and state guidance in such documents as AASHTO’s “Policy on Geometric Design of Highways and Streets,” the Minnesota MUTCD, and AASHTO’s roadside design guidelines. However, many design parameters for the geometry and traffic controls are defined by local design practice and agency design standards. As a result, in locations with heavy traffic volumes, local streets can be underdesigned to accommodate heavy truck traffic. These design features include turning radii, turning bay length, traffic signal timings to accommodate larger and slower vehicles, and acceleration and deceleration lanes to accommodate large trucks. This strategy would provide guidance for identifying locations where land use currently (or is likely to) support heavy truck movements, where traffic control is needed, and where local streets are designed to accommodate heavy trucks. Places where it has been applied: Although we found no examples of guidance specifically tailored for local governments, several documents provide guidance on designing roadways to accommodate heavy trucks. Inadequate geometry on local streets is a commonly reported problem in urban areas in NCHRP 314. Benefits: The benefits of this strategy are difficult to quantify. However, providing appropriate design for heavy trucks when roadways are constructed or reconstructed can improve safety and improve traffic flow efficiency in locations where heavy truck traffic volumes are expected. Costs: The development of a Minnesota design guide for accommodating truck traffic could be developed as part of a research project. Depending on the scope of the guide and the level of involvement of professionals from federal, state, and local governments and from the design consultant industry, the project could cost between $100,000 to $200,000. Institutional, political, and policy issues: We see no issues associated with this strategy. However, since most of the transportation professionals with whom we discussed it work in large organizations with extensive professional staffs, they did not find this strategy very attractive. We believe it would be more popular with medium to small local governments, particularly those with a growing industrial and commercial economic base. In fact, during one of our interviews with the staff of a large city, we were told that designing streets to accommodate the wide turning path of heavy trucks results in a less pedestrian-friendly design. Therefore, in some cases, the city will make a conscious effort to have restrictive turning radii in order to encourage pedestrian traffic at the expense of not appearing heavy truck-friendly. Opportunity for application in the Twin Cities (description and high, medium and low): High opportunity for application in the Twin Cities and all of Minnesota.
Appendix E
RESULTS OF THE TRUCKS AND TWIN CITIES TRAFFIC MANAGEMENT FOCUS GROUP
WORKSHOP
E-1
1. INTRODUCTION As has been stated in earlier reports, congestion is a significant issue in the Twin Cities. The Texas Transportation Institute (TTI) urban mobility study found that the congestion in the Twin Cities is about 25% greater than in other American cities of comparable size. Residents of this area spend a disproportionate amount of time commuting. For businesses that ship goods in and through the Twin Cities, congestion and unreliable travel times are dead-weight costs of doing business in the Twin Cities when compared to other urban areas. According to the background technical analysis of Mn/DOT’s Statewide Freight Plan (October 2004), trucks in the Twin Cities incur two million hours of delay at an estimated cost of $140 million. Congestion and unreliable travel times in the Twin Cities represent a major bottleneck for shippers throughout Minnesota. In addition, crashes involving heavy trucks worsen traffic congestion. Given the dilemma of growing highway congestion and industries dependent on efficient and reliable transportation, this project seeks to explore program and transportation system management improvements that can be made to improve travel times, travel-time reliability, and the safety of freight trucking in and through the Twin Cities. The purpose of the project “Truck and Twin Cities Traffic Management” is to identify the promising strategies that can manage and reduce congestion that impedes freight hauled by trucks. From the broadest group of possible strategies, a small number of strategies will be selected that provide congestion mitigation and safety benefits and can be implemented with limited barriers. As part of the strategy-winnowing process, a workshop was held with transportation experts from both Mn/DOT and its partners in local government and the private sector. This workshop was held on October 29, 2004. This document reports the results of that workshop.
Background As an initial step, the Center for Transportation Research and Education (CTRE) reviewed studies completed nationally that have examined strategies for reducing truck-related congestion in other urban areas. This resulted in a list of 38 candidate strategies. These strategies were described in the first technical memorandum, titled “Potential Transportation Planning Strategies to Improve Freight Mobility through the Twin Cities” (see Appendix A). To add, reduce, or modify strategies, we scheduled interviews with a number of transportation professionals from state and local government and the private sector to determine their opinions on the applicability and benefits of the strategies identified. The individuals interviewed, their titles, and their agencies are shown in Table E-1. As a result of these interviews, some the strategies were consolidated, some were removed, and new ones were added. Thirty-one strategies remained and a one- to two-page description was developed for each of the remaining strategies. These descriptions are part of the technical memorandum titled “Description of Potential Transportation Strategies to Improve Freight Mobility through the Twin Cities” (see Appendix D). The researchers further eliminated seven of the strategies because, although they had merit, the set of circumstances that made the strategies advantageous were not present in the Twin
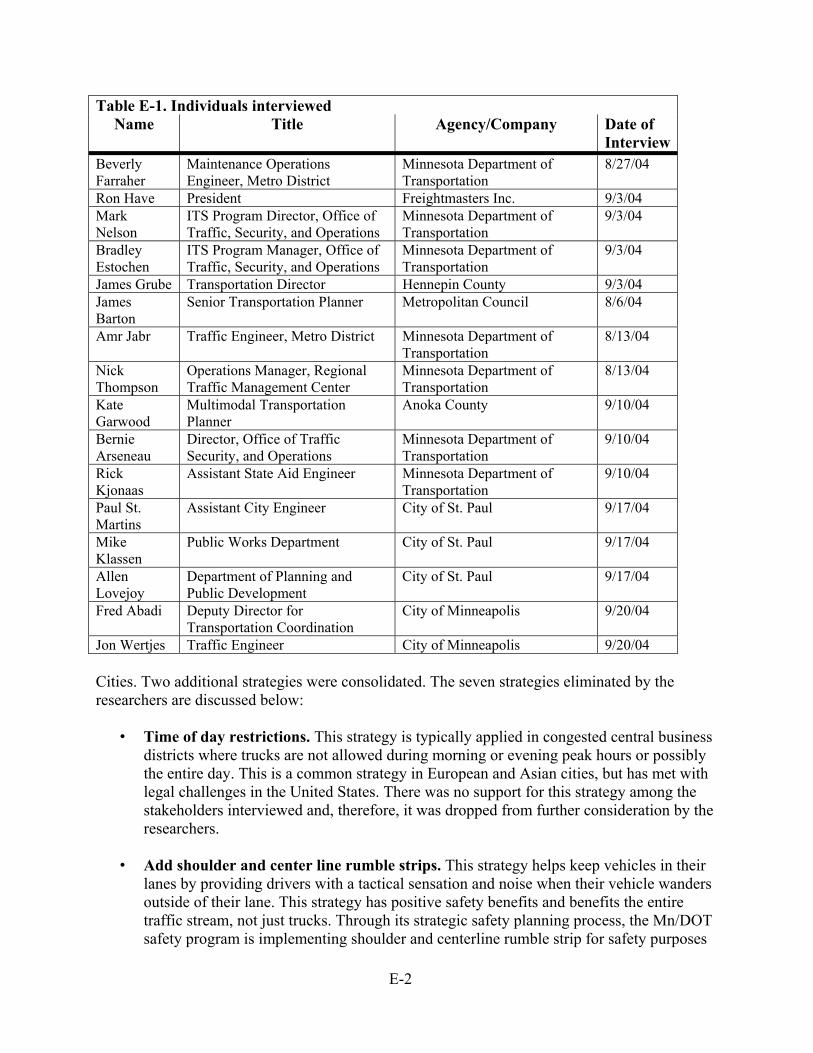
E-2
Table E-1. Individuals interviewed Name Title Agency/Company Date of
InterviewBeverly Farraher
Maintenance Operations Engineer, Metro District
Minnesota Department of Transportation
8/27/04
Ron Have President Freightmasters Inc. 9/3/04 Mark Nelson
ITS Program Director, Office of Traffic, Security, and Operations
Minnesota Department of Transportation
9/3/04
Bradley Estochen
ITS Program Manager, Office of Traffic, Security, and Operations
Minnesota Department of Transportation
9/3/04
James Grube Transportation Director Hennepin County 9/3/04 James Barton
Senior Transportation Planner Metropolitan Council 8/6/04
Amr Jabr Traffic Engineer, Metro District Minnesota Department of Transportation
8/13/04
Nick Thompson
Operations Manager, Regional Traffic Management Center
Minnesota Department of Transportation
8/13/04
Kate Garwood
Multimodal Transportation Planner
Anoka County 9/10/04
Bernie Arseneau
Director, Office of Traffic Security, and Operations
Minnesota Department of Transportation
9/10/04
Rick Kjonaas
Assistant State Aid Engineer Minnesota Department of Transportation
9/10/04
Paul St. Martins
Assistant City Engineer City of St. Paul 9/17/04
Mike Klassen
Public Works Department City of St. Paul 9/17/04
Allen Lovejoy
Department of Planning and Public Development
City of St. Paul 9/17/04
Fred Abadi Deputy Director for Transportation Coordination
City of Minneapolis 9/20/04
Jon Wertjes Traffic Engineer City of Minneapolis 9/20/04 Cities. Two additional strategies were consolidated. The seven strategies eliminated by the researchers are discussed below:
• Time of day restrictions. This strategy is typically applied in congested central business districts where trucks are not allowed during morning or evening peak hours or possibly the entire day. This is a common strategy in European and Asian cities, but has met with legal challenges in the United States. There was no support for this strategy among the stakeholders interviewed and, therefore, it was dropped from further consideration by the researchers.
• Add shoulder and center line rumble strips. This strategy helps keep vehicles in their
lanes by providing drivers with a tactical sensation and noise when their vehicle wanders outside of their lane. This strategy has positive safety benefits and benefits the entire traffic stream, not just trucks. Through its strategic safety planning process, the Mn/DOT safety program is implementing shoulder and centerline rumble strip for safety purposes
E-3
throughout the entire state highway system. Because this strategy is being implemented through another program, it has been dropped from further consideration here.
• Truck-only freeway ramps. This is strategy that is typically applied when there is a
high-volume truck destination near the freeway system and a truck-only ramp connects the destination and the freeway. For example, a truck-only ramp would benefit high and continuous volumes of truck traffic from a port terminal area to a freeway. In the Twin Cities area, there are currently no facilities adjacent to the freeway system that attract the truck volume to warrant a dedicated freeway ramp.
• Turn-by-turn directions. This strategy would provide truck drivers with turn-by-turn
directions leading them directly to their destination. The intent would be to minimize excess travel by trucks unable to find their destinations. Previous market research conducted by Mn/DOT with truckers and dispatchers indicated a demand for this service. The private sector already provides this service, so it was dropped from further consideration here.
• Lengthen interstate auxiliary lanes and build access roads. Although there are some
locations in the Twin Cities area where interstates have inadequate auxiliary lanes, there are very few such locations and most of the remaining locations are programmed for improvement. There are no known truck-specific issues at these locations. Given that these deficiencies are largely going to be resolved, they were dropped from further consideration here.
• Dedicated truck-only lanes or truck-only facilities. When this strategy was discussed
with the transportation professionals interviewed, all felt that there may be opportunities for this strategy in the future, particularly on future ring roads or interstate segments outside the metro. Converting an existing mixed-use lane to a truck-only lane without adding capacity would worsen existing traffic conditions (proposed FAST toll lanes would be capacity expansions). Therefore, dedicated lanes and truck-only roads were dropped from further consideration.
• Improved access to intermodal facilities. The transportation professionals we
interviewed did not see intermodal facility access as an issue requiring additional resources. Mn/DOT and the Metropolitan Council have documented the major intermodal facilities in the region and Mn/DOT is conducting further analysis of local connections to intermodal facilities. Considering this other work is underway, it does not need to be addressed in this project.
Ultimately, 23 strategies remained. All 23 remaining strategies represented improvements that were both feasible and beneficial. However, some had associated institutional issues that would make their adoption problematic. Others could be implemented quickly and would serve as early winners. Further, the scope and scale of strategies tended to vary dramatically, and the incongruities make an objective comparison difficult. Therefore, to narrow the strategies to those that are most promising, the researchers convened a group of experts to screen the strategies
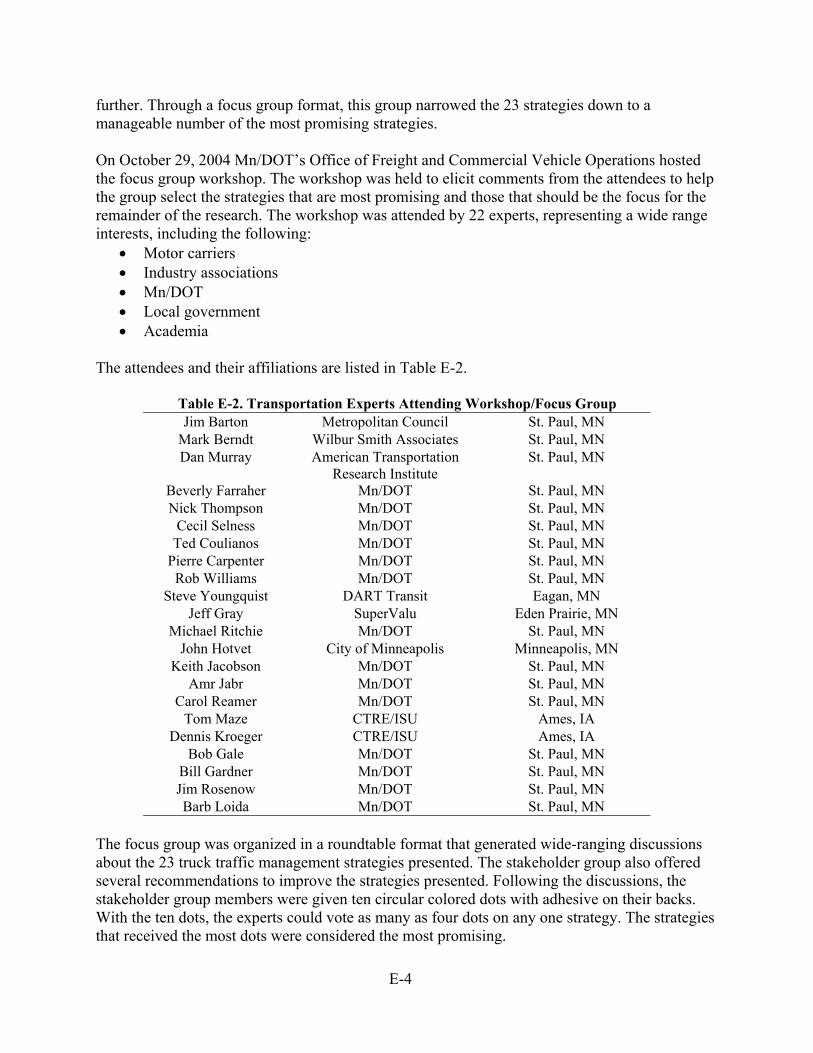
E-4
further. Through a focus group format, this group narrowed the 23 strategies down to a manageable number of the most promising strategies. On October 29, 2004 Mn/DOT’s Office of Freight and Commercial Vehicle Operations hosted the focus group workshop. The workshop was held to elicit comments from the attendees to help the group select the strategies that are most promising and those that should be the focus for the remainder of the research. The workshop was attended by 22 experts, representing a wide range interests, including the following:
• Motor carriers • Industry associations • Mn/DOT • Local government • Academia
The attendees and their affiliations are listed in Table E-2.
Table E-2. Transportation Experts Attending Workshop/Focus Group Jim Barton Metropolitan Council St. Paul, MN
Mark Berndt Wilbur Smith Associates St. Paul, MN Dan Murray American Transportation
Research Institute St. Paul, MN
Beverly Farraher Mn/DOT St. Paul, MN Nick Thompson Mn/DOT St. Paul, MN
Cecil Selness Mn/DOT St. Paul, MN Ted Coulianos Mn/DOT St. Paul, MN
Pierre Carpenter Mn/DOT St. Paul, MN Rob Williams Mn/DOT St. Paul, MN
Steve Youngquist DART Transit Eagan, MN Jeff Gray SuperValu Eden Prairie, MN
Michael Ritchie Mn/DOT St. Paul, MN John Hotvet City of Minneapolis Minneapolis, MN
Keith Jacobson Mn/DOT St. Paul, MN Amr Jabr Mn/DOT St. Paul, MN
Carol Reamer Mn/DOT St. Paul, MN Tom Maze CTRE/ISU Ames, IA
Dennis Kroeger CTRE/ISU Ames, IA Bob Gale Mn/DOT St. Paul, MN
Bill Gardner Mn/DOT St. Paul, MN Jim Rosenow Mn/DOT St. Paul, MN Barb Loida Mn/DOT St. Paul, MN
The focus group was organized in a roundtable format that generated wide-ranging discussions about the 23 truck traffic management strategies presented. The stakeholder group also offered several recommendations to improve the strategies presented. Following the discussions, the stakeholder group members were given ten circular colored dots with adhesive on their backs. With the ten dots, the experts could vote as many as four dots on any one strategy. The strategies that received the most dots were considered the most promising.
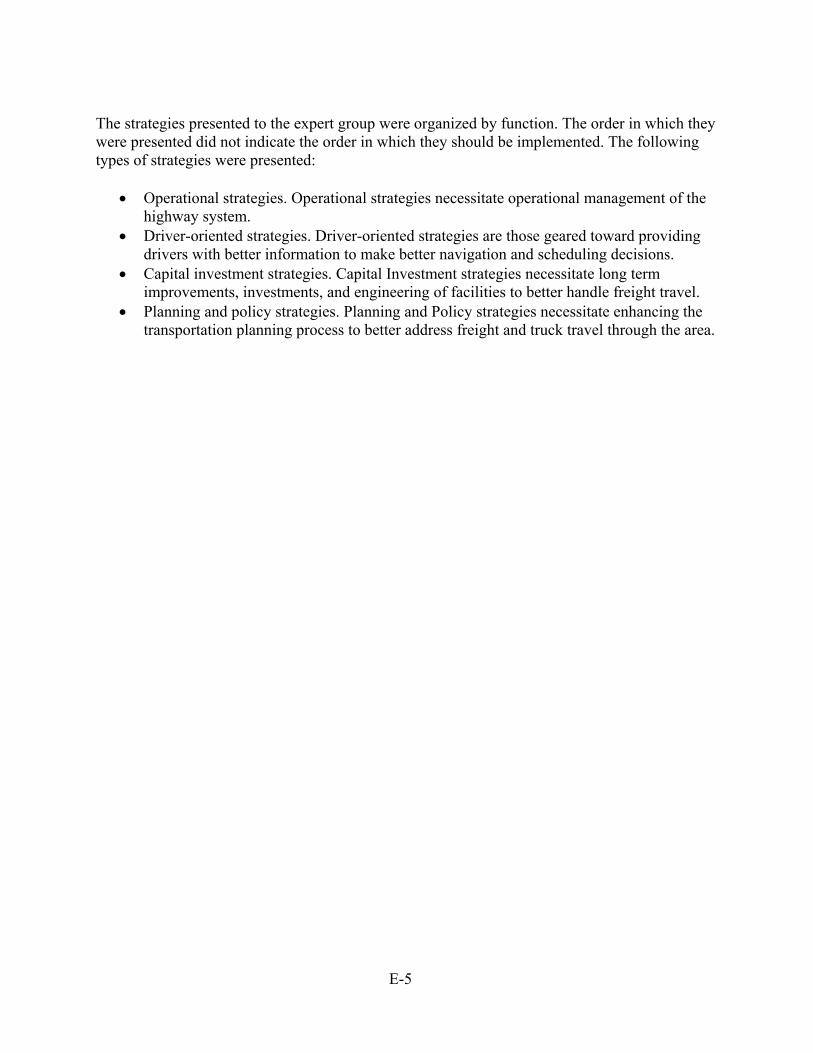
E-5
The strategies presented to the expert group were organized by function. The order in which they were presented did not indicate the order in which they should be implemented. The following types of strategies were presented:
• Operational strategies. Operational strategies necessitate operational management of the highway system.
• Driver-oriented strategies. Driver-oriented strategies are those geared toward providing drivers with better information to make better navigation and scheduling decisions.
• Capital investment strategies. Capital Investment strategies necessitate long term improvements, investments, and engineering of facilities to better handle freight travel.
• Planning and policy strategies. Planning and Policy strategies necessitate enhancing the transportation planning process to better address freight and truck travel through the area.

E-6
2. WORKSHOP ACTIVITIES This section describes the strategies presented to the experts attending the workshop and summarizes the discussion around each of the strategies. In this section, the strategy is briefly described, as it was presented to the focus group participants, and the group discussion is briefly summarized.
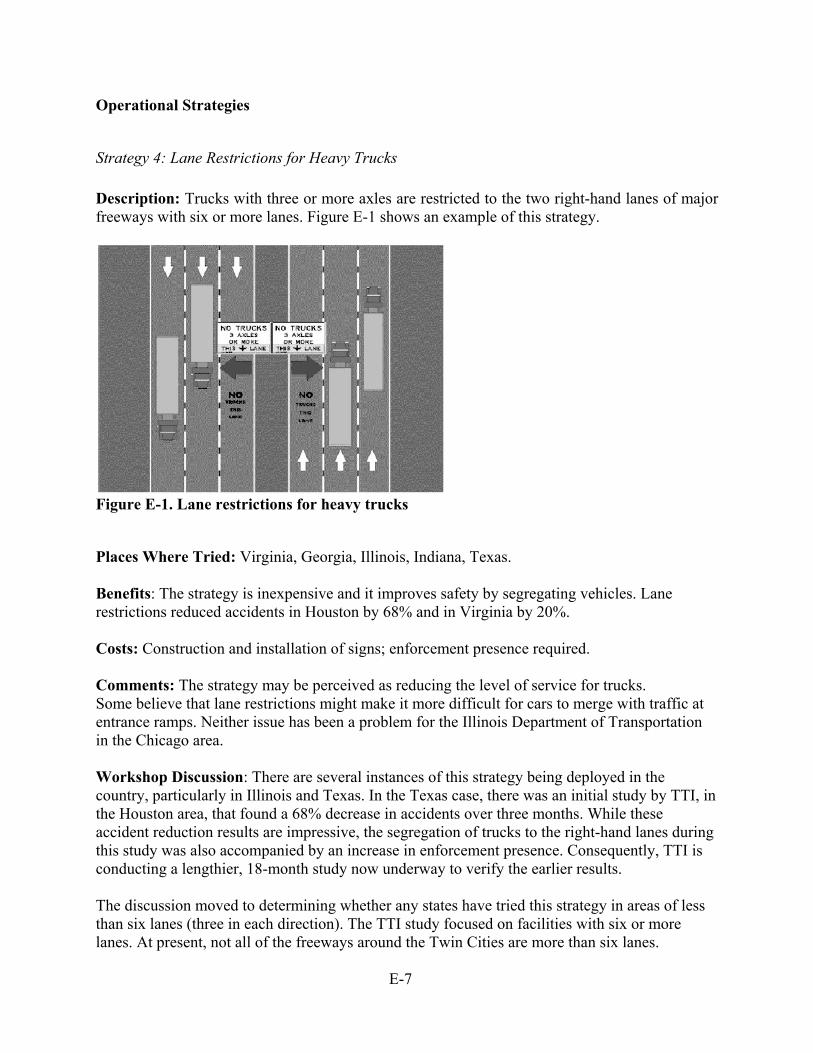
E-7
Operational Strategies
Strategy 4: Lane Restrictions for Heavy Trucks Description: Trucks with three or more axles are restricted to the two right-hand lanes of major freeways with six or more lanes. Figure E-1 shows an example of this strategy.
Figure E-1. Lane restrictions for heavy trucks
Places Where Tried: Virginia, Georgia, Illinois, Indiana, Texas. Benefits: The strategy is inexpensive and it improves safety by segregating vehicles. Lane restrictions reduced accidents in Houston by 68% and in Virginia by 20%. Costs: Construction and installation of signs; enforcement presence required. Comments: The strategy may be perceived as reducing the level of service for trucks. Some believe that lane restrictions might make it more difficult for cars to merge with traffic at entrance ramps. Neither issue has been a problem for the Illinois Department of Transportation in the Chicago area. Workshop Discussion: There are several instances of this strategy being deployed in the country, particularly in Illinois and Texas. In the Texas case, there was an initial study by TTI, in the Houston area, that found a 68% decrease in accidents over three months. While these accident reduction results are impressive, the segregation of trucks to the right-hand lanes during this study was also accompanied by an increase in enforcement presence. Consequently, TTI is conducting a lengthier, 18-month study now underway to verify the earlier results. The discussion moved to determining whether any states have tried this strategy in areas of less than six lanes (three in each direction). The TTI study focused on facilities with six or more lanes. At present, not all of the freeways around the Twin Cities are more than six lanes.
E-8
Another point brought up was the issue of defining the term “heavy truck.” In the example presented, a heavy truck is a vehicle or a combination of vehicles of three or more axles. If this definition were to be applied, it would include pick-ups, trailers, motor homes, and other vehicles. The argument goes that if you move all of these vehicles to the right lane you are reducing the capacity of the system. It was recommended to define heavy truck as Class 6–8-type vehicles. This definition would move tractor-trailers to right lanes and allow the smaller class vehicles to travel in any of the lanes.
The discussion then centered on defining commercial vehicles and the need to be as clear as possible in the definition, as well as how the restrictions are classified for those vehicles.
The discussion moved to the idea that this strategy was more of a safety strategy than an economic or truck mobility strategy as presented in the scope of work. It was decided that since safety and traffic flow efficiency are linked, it is difficult to separate the two. In addition, strategies with a safety component are more likely to receive priority in investment decisions. When thinking of safety, one participant argued that segregation of truck traffic is really for the benefit of the motorist. Studies have found that cars are responsible for truck-car crashes between 71% and 75% of the time. It was decided that the issue requires further study regarding speed and safety impacts, in part because the benefits and the traffic conditions that make this strategy attractive are unclear. For example, Georgia has lifted their lane restrictions within the Atlanta metropolitan area in an attempt to reduce the perceived conflicts of automobiles merging onto freeways filled with truck traffic in the right lane. One participant asked whether there were any figures on the crash experience on the truck-restricted area of I-35E. The issue on I-35E is that the artificially low speed creates a larger speed differential. The next question raised was, “Are trucks in the left lane an issue?” Anecdotally, yes they are. For the Twin Cities area, however, we have no hard data.
E-9
Strategy 5A: Increase Truck Parking Facilities on the Urban Fringe Description: This strategy considers methods for providing additional truck parking at public facilities on the fringe of metropolitan areas. The creation of more truck parking could originate from the use of park-and-ride facilities on the fringe, from the use of the truck inspection areas (a weigh station for parking when the scale is closed), and the use of other public land (parks) for truck parking. Places Where Tried: A number of states have tried to make joint use of facilities for truck parking. The Iowa DOT has developed partnerships with the private sector and local governments, and several state transportation agencies, including the Wisconsin DOT and the Kentucky Transportation Cabinet, encourage overnight parking at closed weigh stations. Benefits: Traffic safety; reduced logistics costs; improved ability to meet just-in-time windows; reduction of trucks parked in unwanted locations. Costs: Signing and marking; inconvenience for current space users; paving and maintenance; idling associated pollution and noise; not-in–my-back-yard syndrome. Comments: This is a strategy that has been identified in the Metropolitan Council’s draft transportation plan. The need for overnight truck parking is a nationwide issue that will worsen with increasing truck traffic volumes. New federal service regulations increasing the hours during which drivers must have uninterrupted rest may increase the demand for truck parking. Workshop Discussion: One participant suggested that Mn/DOT should examine opportunities within publicly owned facilities, e.g. public parks or city and county facilities, or possibly using existing park-and-ride lots for more truck parking possibilities.
Another issue for more overnight truck parking is security. Security is the second highest driver-related concern behind driver shortage, based on a study conducted with carrier executives. Any areas made available for truck parking will have to provide some amenities to make drivers feel secure enough to use them. Another issue in providing additional truck parking is the idling of trucks at rest areas. If other areas are made available to trucks, there will be idling of these vehicles and the creation of local pollution. The EPA has made some truck stop electrification funding available for demonstration projects, but these projects are tied to a specific vendor of technology. There may be opportunities to use CMAQ funding for electrification in the future. The trucking industry’s preference is to have plug-in power stations on-board, and not have to rely on one particular technology. OEMs are now developing those capabilities. Any use of public areas for truck parking would require significant study to identify and overcome issues related to security, noise, idling, etc.
E-10
The discussion continued about whether to focus on public facilities or on private sector partnering opportunities, such as using parking facilities at large retailers. There would still need to be an effort to understand the incentives required to get private companies, particularly shippers and receivers, to offer space, as well as to understand whether drivers would use the spaces and under what circumstances. Regarding allowing truck drivers to use major shopping center parking, a question was asked whether anyone had spoken with operators of major shopping centers on the subject. If not, would the MTA be willing to lead the charge? Would the public sector facilitate? The discussion concluded that there is a need to understand specifically where truck parking is needed around the Twin Cities area before solutions are explored, such as converting private parking lots, expanding public rest areas, using park-and-ride lots, and expanding private truck stops.
E-11
Strategy 5B: Increase Overnight Truck Parking in the Urban Core Description: This strategy would address safe parking availability inside the core of the city. Providing parking in the city center allows trucks to position themselves near their destination for a morning delivery. Using lots near large facilities when not in use would be examined. Places Where Tried: This has been proposed by the Dallas/Fort Worth MPO, but no known application of this concept has been instituted by a public entity in a large city. Benefits: Reduces truck traffic in the city during peak travel periods. Costs: Unless an existing surface parking facility is used, the land cost is likely to be prohibitive. Comments: Space is scare in city cores. Agency transportation professionals from Minneapolis and St. Paul felt that devoting space to overnight truck parking would not be high on the cities’ agendas. In the survey of trucking companies conducted by the Dallas/Fort Worth MPO, this strategy was highly ranked. Workshop Discussion: An example of truck parking in the urban core was in St. Paul. They used to park trucks underneath the north end of the Lafayette Bridge, but the city has moved them all out. Much of the traditional industry has moved out of the urban downtown, so there is a need to understand specifically where the demand is for more truck parking. A place to gather some information on truck parking needs is Mn/DOT, which has done a study of major shippers in the state. Shipping activity data could be mapped to determine where clusters of activity are located.
Other issues discussed included zoning ordinances. These ordinances can sometimes prevent companies from parking vehicles on their own property. One participant cited a specific example in which city ordinances will not allow overnight parking on their property. Other comments were made pertaining to both urban fringe and urban core truck parking. For one, regardless of whether the proposed truck parking is in the urban core or fringe areas, more study of the location and of the demand for more truck parking is required. Generally companies will want to stage trucks as close as possible to the urban core, but land values are a factor in determining private sector site location. Furthermore, the location of staging areas should be cognizant of the impacts from commercial driver hours-of-service rules.
Mn/DOT also needs to be cognizant of how the presence of hazardous materials loads might affect parking or staging areas. Placarded hazardous materials loads have some special requirements due to safety regulations and terrorism.
The discussion concluded that there is a need to better understand the public and private parking supply in the urban core and then examine specific solutions.
E-12
Strategy 6: Traffic Signal Prioritization for Heavy Vehicles Description: This strategy installs smart vehicle detectors (detectors that can distinguish between trucks and cars) to prioritize truck movements at traffic signals. These smart vehicle detectors sense when a truck is approaching the traffic signal. The sensor then determines whether the signal is going to turn red before the truck is able to clear the intersection. If the truck would be unable to clear the intersection, the signal controller extends the green to allow the truck to pass through the intersection. Places Where Tried: Sullivan City, Texas; Dade County, Florida; Washington, D.C. This strategy was also tested by Mn/DOT in Belle Plaine, Minnesota. Smart vehicle detectors are primarily used in busy rural intersections near freight terminals. Benefits: Fewer trucks stopped at signalized intersections; reduction in truck accidents. A TTI study in Texas showed that on a road with a weekly volume of 2,500 trucks, 100 fewer stops were made at the intersection. Costs: Engineering time for design /installation, roughly $15,000 to $20,000 per intersection; drivers on other roads may experience increased delay. Comments: Issues include vehicles on other roads queuing up longer than usual. Also, after drivers understand that the green light timing is extended, they may lose respect for the signal. Coordination with local communities is required to make any changes in the signal timing. Mn/DOT is evaluating conducting another test of this concept. Workshop Discussion: The discussion of this strategy began with the study conducted in Belle Plaine, Minnesota. The Mn/DOT project showed mixed results. However, the TTI study in Sullivan City, Texas has successfully tested the technology with good results. This strategy has been around for awhile and has been tested in several places. There is anecdotal evidence that signal prioritization works in other metro areas, but it is unclear how well it works. This strategy works for isolated signals, but in the Twin Cities metropolitan area there are few isolated signals. An interesting point was made regarding the Mn/DOT study in Belle Plaine. A participant observed that the study may have been too limiting; there may be a need to examine corridors that have high volumes of trucks. Thus, one could study how traffic reacts when a series of signals are timed together. One example is between BNSF and CP yards, where there are many traffic lights and large volumes of trucks. Another comment made was that this issue may go more toward signal timing on local streets and timing more appropriate for trucks on heavily used routes. However, improving coordination between state and local governments is a great idea, and if we had more money, more could be done. In fact, signal coordination did improve the timing on TH-156 (Concorde Street) near I-494. A study looked at this in detail. Traffic signal timing as a means of promoting progression

E-13
for trucks (as opposed to automobiles) created a net benefit. At the time, however, this was the only corridor in the Twin Cities where the volumes supported that type of treatment. The discussion concluded with the idea that there may be opportunities for this strategy on the county road system, as well.
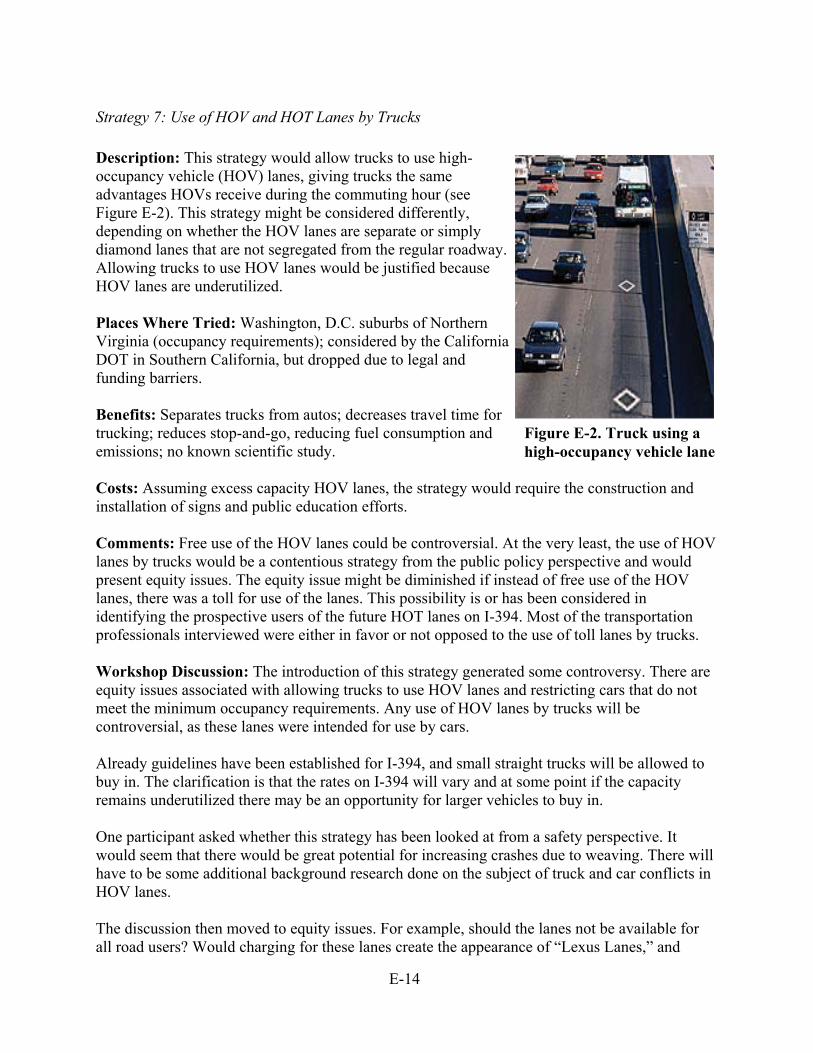
E-14
Strategy 7: Use of HOV and HOT Lanes by Trucks Description: This strategy would allow trucks to use high-occupancy vehicle (HOV) lanes, giving trucks the same advantages HOVs receive during the commuting hour (see Figure E-2). This strategy might be considered differently, depending on whether the HOV lanes are separate or simply diamond lanes that are not segregated from the regular roadway. Allowing trucks to use HOV lanes would be justified because HOV lanes are underutilized. Places Where Tried: Washington, D.C. suburbs of Northern Virginia (occupancy requirements); considered by the California DOT in Southern California, but dropped due to legal and funding barriers. Benefits: Separates trucks from autos; decreases travel time for trucking; reduces stop-and-go, reducing fuel consumption and emissions; no known scientific study. Costs: Assuming excess capacity HOV lanes, the strategy would require the construction and installation of signs and public education efforts. Comments: Free use of the HOV lanes could be controversial. At the very least, the use of HOV lanes by trucks would be a contentious strategy from the public policy perspective and would present equity issues. The equity issue might be diminished if instead of free use of the HOV lanes, there was a toll for use of the lanes. This possibility is or has been considered in identifying the prospective users of the future HOT lanes on I-394. Most of the transportation professionals interviewed were either in favor or not opposed to the use of toll lanes by trucks. Workshop Discussion: The introduction of this strategy generated some controversy. There are equity issues associated with allowing trucks to use HOV lanes and restricting cars that do not meet the minimum occupancy requirements. Any use of HOV lanes by trucks will be controversial, as these lanes were intended for use by cars. Already guidelines have been established for I-394, and small straight trucks will be allowed to buy in. The clarification is that the rates on I-394 will vary and at some point if the capacity remains underutilized there may be an opportunity for larger vehicles to buy in. One participant asked whether this strategy has been looked at from a safety perspective. It would seem that there would be great potential for increasing crashes due to weaving. There will have to be some additional background research done on the subject of truck and car conflicts in HOV lanes. The discussion then moved to equity issues. For example, should the lanes not be available for all road users? Would charging for these lanes create the appearance of “Lexus Lanes,” and
Figure E-2. Truck using a high-occupancy vehicle lane

E-15
would those who can afford it be given preferential treatment? Others said that this is not an equity issue. Other than politics, what is the issue? The discussion concluded with the issue that the original intent of HOV lanes was to encourage the use the multi-occupant vehicles. Permitting others to use these lanes changes the intent of the practice.
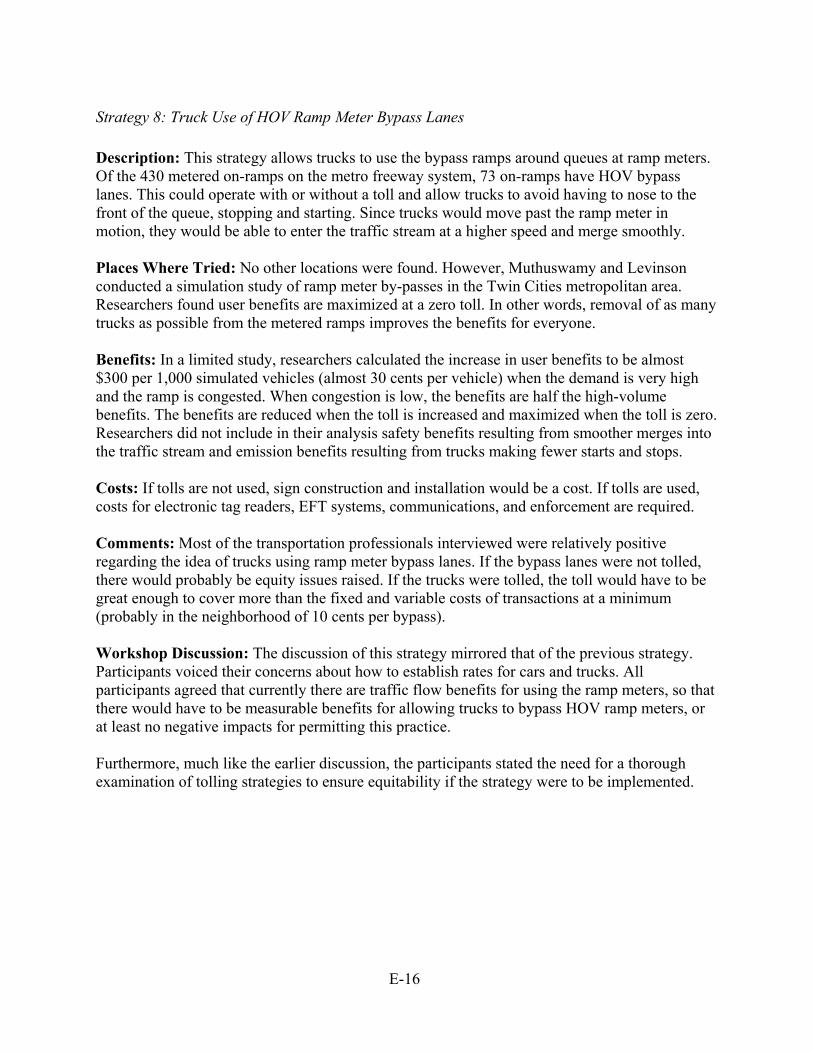
E-16
Strategy 8: Truck Use of HOV Ramp Meter Bypass Lanes Description: This strategy allows trucks to use the bypass ramps around queues at ramp meters. Of the 430 metered on-ramps on the metro freeway system, 73 on-ramps have HOV bypass lanes. This could operate with or without a toll and allow trucks to avoid having to nose to the front of the queue, stopping and starting. Since trucks would move past the ramp meter in motion, they would be able to enter the traffic stream at a higher speed and merge smoothly. Places Where Tried: No other locations were found. However, Muthuswamy and Levinson conducted a simulation study of ramp meter by-passes in the Twin Cities metropolitan area. Researchers found user benefits are maximized at a zero toll. In other words, removal of as many trucks as possible from the metered ramps improves the benefits for everyone. Benefits: In a limited study, researchers calculated the increase in user benefits to be almost $300 per 1,000 simulated vehicles (almost 30 cents per vehicle) when the demand is very high and the ramp is congested. When congestion is low, the benefits are half the high-volume benefits. The benefits are reduced when the toll is increased and maximized when the toll is zero. Researchers did not include in their analysis safety benefits resulting from smoother merges into the traffic stream and emission benefits resulting from trucks making fewer starts and stops. Costs: If tolls are not used, sign construction and installation would be a cost. If tolls are used, costs for electronic tag readers, EFT systems, communications, and enforcement are required. Comments: Most of the transportation professionals interviewed were relatively positive regarding the idea of trucks using ramp meter bypass lanes. If the bypass lanes were not tolled, there would probably be equity issues raised. If the trucks were tolled, the toll would have to be great enough to cover more than the fixed and variable costs of transactions at a minimum (probably in the neighborhood of 10 cents per bypass). Workshop Discussion: The discussion of this strategy mirrored that of the previous strategy. Participants voiced their concerns about how to establish rates for cars and trucks. All participants agreed that currently there are traffic flow benefits for using the ramp meters, so that there would have to be measurable benefits for allowing trucks to bypass HOV ramp meters, or at least no negative impacts for permitting this practice. Furthermore, much like the earlier discussion, the participants stated the need for a thorough examination of tolling strategies to ensure equitability if the strategy were to be implemented.
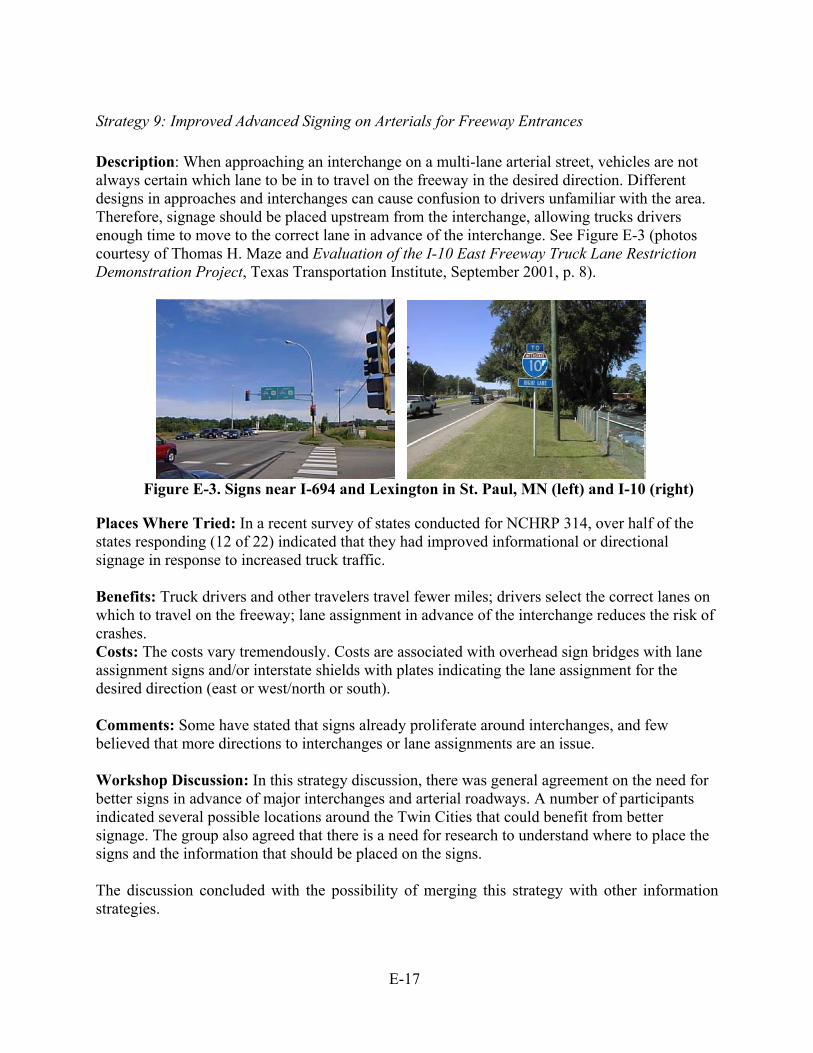
E-17
Strategy 9: Improved Advanced Signing on Arterials for Freeway Entrances Description: When approaching an interchange on a multi-lane arterial street, vehicles are not always certain which lane to be in to travel on the freeway in the desired direction. Different designs in approaches and interchanges can cause confusion to drivers unfamiliar with the area. Therefore, signage should be placed upstream from the interchange, allowing trucks drivers enough time to move to the correct lane in advance of the interchange. See Figure E-3 (photos courtesy of Thomas H. Maze and Evaluation of the I-10 East Freeway Truck Lane Restriction Demonstration Project, Texas Transportation Institute, September 2001, p. 8).
Figure E-3. Signs near I-694 and Lexington in St. Paul, MN (left) and I-10 (right)
Places Where Tried: In a recent survey of states conducted for NCHRP 314, over half of the states responding (12 of 22) indicated that they had improved informational or directional signage in response to increased truck traffic. Benefits: Truck drivers and other travelers travel fewer miles; drivers select the correct lanes on which to travel on the freeway; lane assignment in advance of the interchange reduces the risk of crashes. Costs: The costs vary tremendously. Costs are associated with overhead sign bridges with lane assignment signs and/or interstate shields with plates indicating the lane assignment for the desired direction (east or west/north or south). Comments: Some have stated that signs already proliferate around interchanges, and few believed that more directions to interchanges or lane assignments are an issue. Workshop Discussion: In this strategy discussion, there was general agreement on the need for better signs in advance of major interchanges and arterial roadways. A number of participants indicated several possible locations around the Twin Cities that could benefit from better signage. The group also agreed that there is a need for research to understand where to place the signs and the information that should be placed on the signs. The discussion concluded with the possibility of merging this strategy with other information strategies.
E-18
Strategy 10: Expand Integrated Corridor Traffic Management Description: Integrated Corridor Traffic Management (ICTM) aims to optimize corridor capacity, traffic operations, and safety by applying many advanced technologies. The deployed technologies were designed to encourage locally generated short trips to remain on local roads and off the freeway system to maximize freeway capacity and support drivers using parallel surface streets to bypass freeway incidents. Places Where Tried: This strategy has been tried along I-494in Minnesota, as well as in Hennepin County and the cities of Bloomington, Richfield, and Edina. Benefits: Increased cooperation among public agencies; a new SCAT system that builds on existing ramp meter systems; decreased travel time. Evaluation showed that travelers will alter their travel routes when provided with incident information, and motorists will use parallel surface streets to avoid congestion on I-494. Costs: $9,000,000, including software, signs, and equipment, plus ongoing training costs. Comments: Local and state agencies must cooperate and provide information to each other. Cross training is required. Traffic control systems at all levels must be coordinated for the system to work. Workshop Discussion: The discussion of this strategy showed a tepid reception by the group. This strategy is expensive to implement and requires a great deal of state and local coordination. When this program was implemented by Mn/DOT several years ago, it was in a limited area of the Twin Cities, where numerous parallel routes exist. There are not many other locations around the Twin Cities where parallel routes are available for diverting local traffic. The discussion concluded with the feeling that this strategy may not be practical on a metro-wide level.
E-19
Driver Oriented Strategies
Strategy 11: Improvement of Information for Truck Drivers Description: Over-the-road truckers need information about weather and other road conditions in the future and miles away from their current locations. Truck drivers require information about special events that may increase congestion, maintenance/repair facilities, overnight parking availability, and other truck driver-oriented traveler information. Figure E-4 shows a truck advisory sign (photo from http://www.odot.state.or.us/trucking/its/green/whatsnew.html). Places Where Tried: FreightForward, a U.S. DOT Field Operational Test tried on I-95 between Virginia and Maine, provided truckers with real-time, customized traffic congestion, incident, construction, and maintenance information, but had minimal impact on operations.
Benefits: Benefits have not been fully realized.
Costs: Costs vary greatly, depending on the delivery of the information. Costs may be reduced using the internet, DMS, or other available media. Comments: All the transportation professionals interviewed were positive about this strategy. Workshop Discussion: This strategy is based on the Fleet Forward operational test on I-95 that provided customized traffic information to truck firm dispatchers. Two other tests have also been conducted, one in Chicago, IL and the other in Phoenix, AZ. These tests developed key systems to disseminate information to drivers half of the time, and to dispatchers for the other half. Within Minnesota, dispatchers are currently using Mn/DOT web sites. There has been little feedback from the public about suitability of the information. A participant asked what the most common communication device is for drivers. The group consensus was cellular phone and CB radio. Among fleets nationwide, there are currently 265,000 Qualcomm brand units in use, plus another 135,000 for approximately 400,000 total satellite communication devices. This is not a deep market penetration, although it is growing. Simple communication to drivers is still probably the best route of information. One member of the group pointed out the emerging use of cellular telephones. Cellular telephones are commonly used to communicate with truck drivers. There may be new opportunities for leveraging these capabilities to deliver information to drivers.
Figure E-4. Truck advisory sign
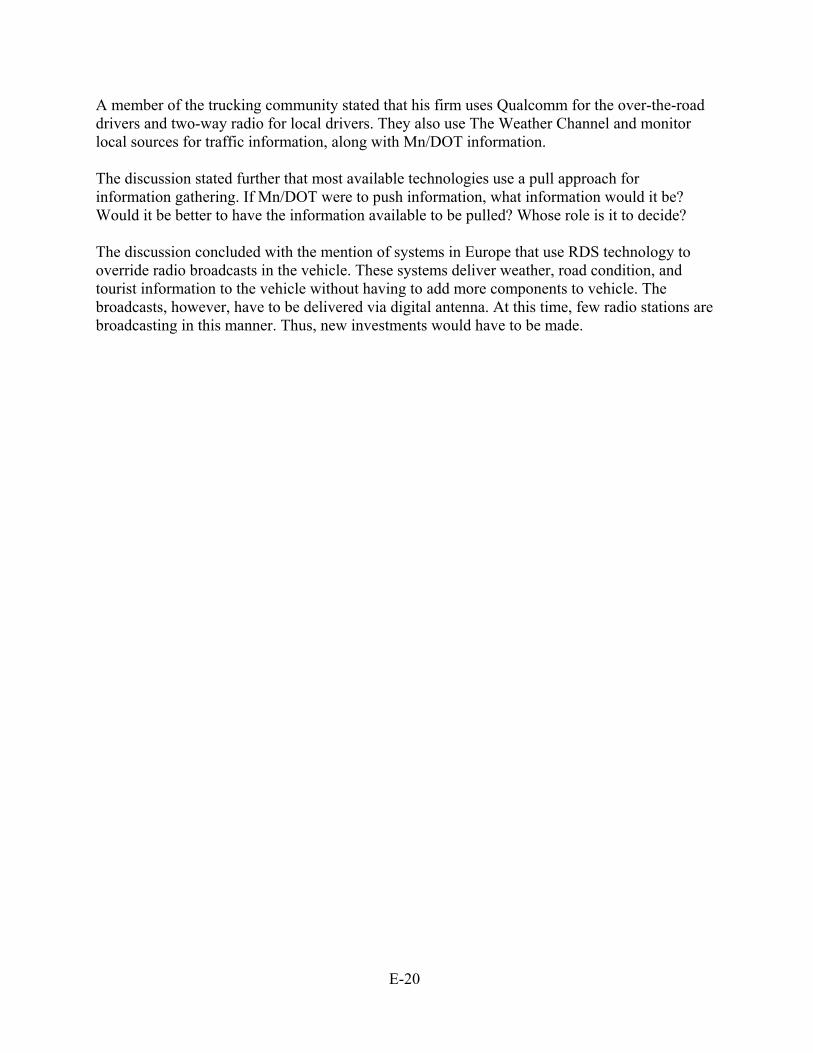
E-20
A member of the trucking community stated that his firm uses Qualcomm for the over-the-road drivers and two-way radio for local drivers. They also use The Weather Channel and monitor local sources for traffic information, along with Mn/DOT information. The discussion stated further that most available technologies use a pull approach for information gathering. If Mn/DOT were to push information, what information would it be? Would it be better to have the information available to be pulled? Whose role is it to decide? The discussion concluded with the mention of systems in Europe that use RDS technology to override radio broadcasts in the vehicle. These systems deliver weather, road condition, and tourist information to the vehicle without having to add more components to vehicle. The broadcasts, however, have to be delivered via digital antenna. At this time, few radio stations are broadcasting in this manner. Thus, new investments would have to be made.
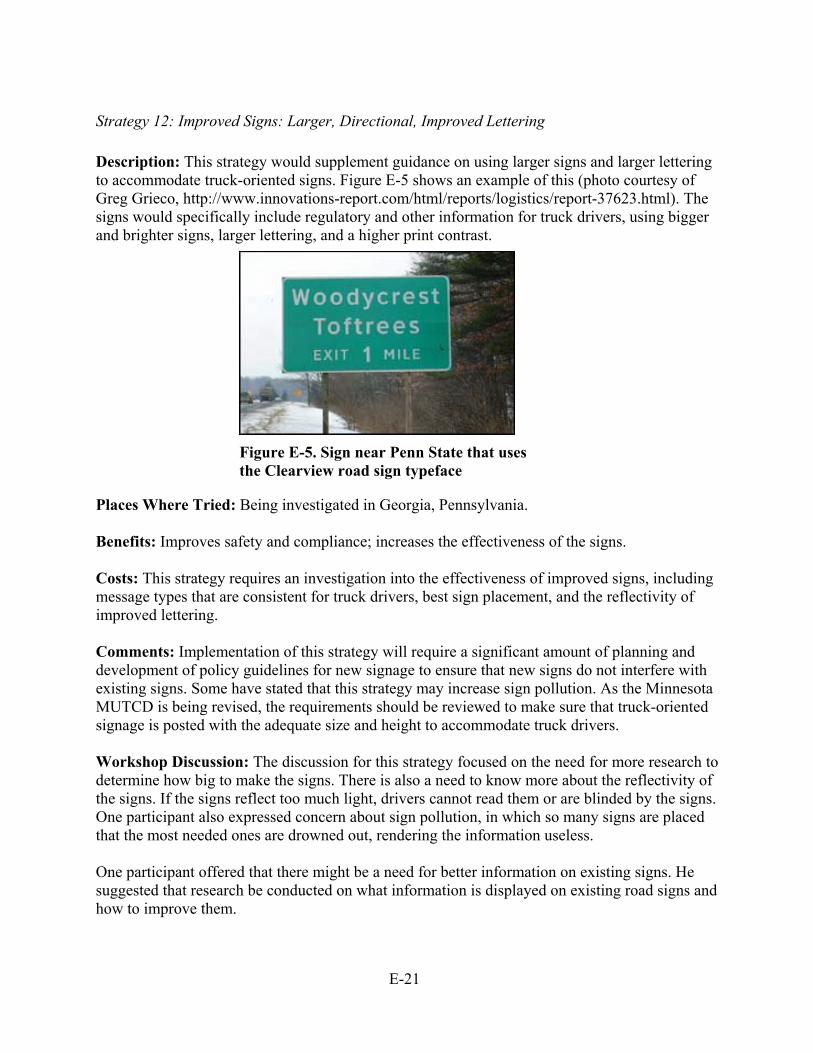
E-21
Strategy 12: Improved Signs: Larger, Directional, Improved Lettering Description: This strategy would supplement guidance on using larger signs and larger lettering to accommodate truck-oriented signs. Figure E-5 shows an example of this (photo courtesy of Greg Grieco, http://www.innovations-report.com/html/reports/logistics/report-37623.html). The signs would specifically include regulatory and other information for truck drivers, using bigger and brighter signs, larger lettering, and a higher print contrast.
Figure E-5. Sign near Penn State that uses the Clearview road sign typeface
Places Where Tried: Being investigated in Georgia, Pennsylvania. Benefits: Improves safety and compliance; increases the effectiveness of the signs. Costs: This strategy requires an investigation into the effectiveness of improved signs, including message types that are consistent for truck drivers, best sign placement, and the reflectivity of improved lettering. Comments: Implementation of this strategy will require a significant amount of planning and development of policy guidelines for new signage to ensure that new signs do not interfere with existing signs. Some have stated that this strategy may increase sign pollution. As the Minnesota MUTCD is being revised, the requirements should be reviewed to make sure that truck-oriented signage is posted with the adequate size and height to accommodate truck drivers. Workshop Discussion: The discussion for this strategy focused on the need for more research to determine how big to make the signs. There is also a need to know more about the reflectivity of the signs. If the signs reflect too much light, drivers cannot read them or are blinded by the signs. One participant also expressed concern about sign pollution, in which so many signs are placed that the most needed ones are drowned out, rendering the information useless. One participant offered that there might be a need for better information on existing signs. He suggested that research be conducted on what information is displayed on existing road signs and how to improve them.
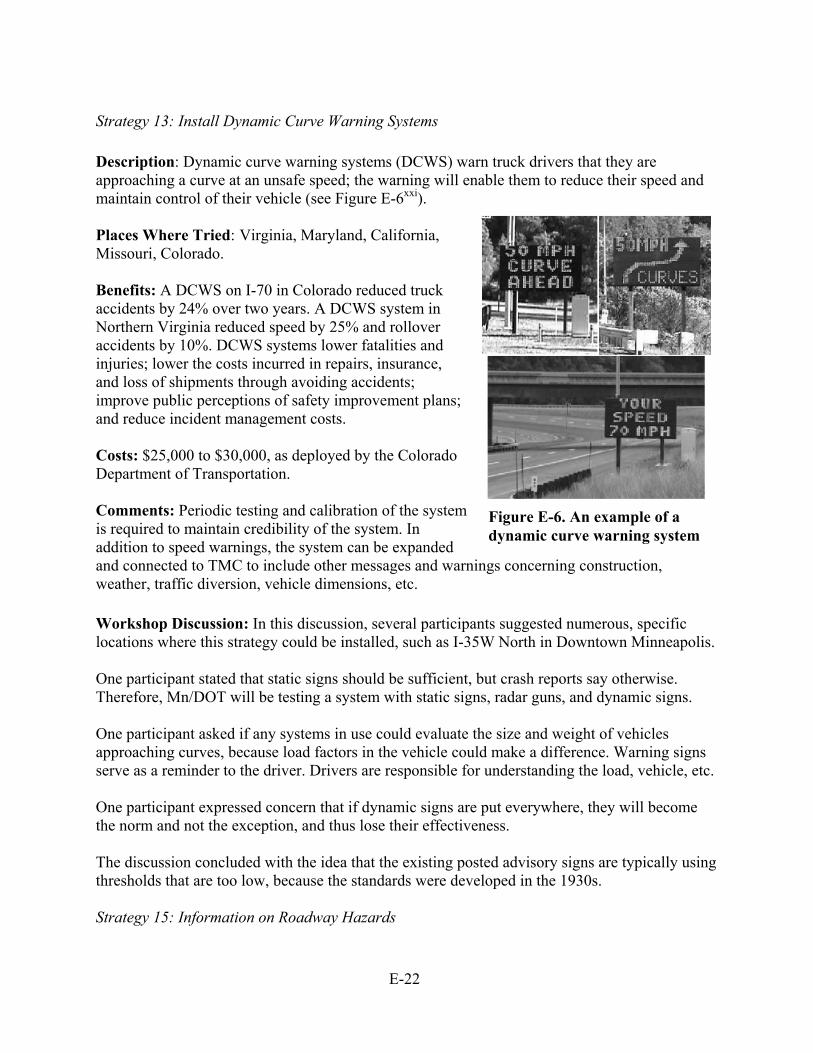
E-22
Strategy 13: Install Dynamic Curve Warning Systems Description: Dynamic curve warning systems (DCWS) warn truck drivers that they are approaching a curve at an unsafe speed; the warning will enable them to reduce their speed and maintain control of their vehicle (see Figure E-6xxi). Places Where Tried: Virginia, Maryland, California, Missouri, Colorado.
Benefits: A DCWS on I-70 in Colorado reduced truck accidents by 24% over two years. A DCWS system in Northern Virginia reduced speed by 25% and rollover accidents by 10%. DCWS systems lower fatalities and injuries; lower the costs incurred in repairs, insurance, and loss of shipments through avoiding accidents; improve public perceptions of safety improvement plans; and reduce incident management costs. Costs: $25,000 to $30,000, as deployed by the Colorado Department of Transportation. Comments: Periodic testing and calibration of the system is required to maintain credibility of the system. In addition to speed warnings, the system can be expanded and connected to TMC to include other messages and warnings concerning construction, weather, traffic diversion, vehicle dimensions, etc. Workshop Discussion: In this discussion, several participants suggested numerous, specific locations where this strategy could be installed, such as I-35W North in Downtown Minneapolis. One participant stated that static signs should be sufficient, but crash reports say otherwise. Therefore, Mn/DOT will be testing a system with static signs, radar guns, and dynamic signs. One participant asked if any systems in use could evaluate the size and weight of vehicles approaching curves, because load factors in the vehicle could make a difference. Warning signs serve as a reminder to the driver. Drivers are responsible for understanding the load, vehicle, etc. One participant expressed concern that if dynamic signs are put everywhere, they will become the norm and not the exception, and thus lose their effectiveness. The discussion concluded with the idea that the existing posted advisory signs are typically using thresholds that are too low, because the standards were developed in the 1930s. Strategy 15: Information on Roadway Hazards
Figure E-6. An example of a dynamic curve warning system

E-23
Description: This strategy would create a map indicating the location of roadway hazards for trucks, such as low-clearance bridges, weight-restricted bridges, roadways with tight turning radii, and other infrastructures not designed for combination tractor-trailer trucks. The map could be distributed as paper copies or over the internet. Places Where Tried: This strategy has been planned in Des Moines, IA and the Gary-Chicago-Milwaukee corridor, but never put into operation in either location. The Metropolitan Council produced a map that included weight-restricted routes and bridges, but not other hazards. Benefits: There would be fewer issues with routing trucks through locations through which they are too large to navigate. Less wear and tear on the infrastructure would also result: fewer bridges would be hit and fewer overweight trucks would inadvertently travel on roadways. Costs: Less than $20,000 per year. Comments: There are very few low-clearance bridges or other infrastructure impediments to large trucks in the Twin Cities. Therefore, a map focusing only on hazards would probably not be cost effective. This strategy should be folded into “Strategy 17: Update the Trucker’s Guide.” Workshop discussion: This discussion was combined with that for “Strategy 17: Update Trucker’s Guide.”
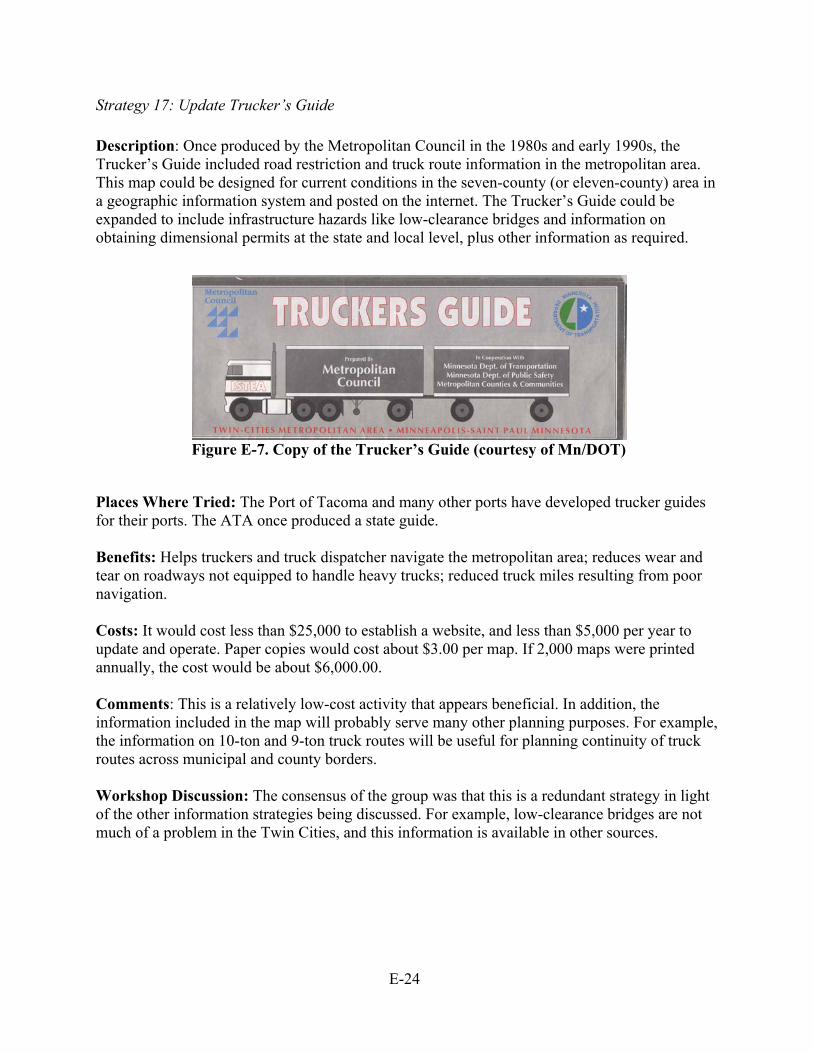
E-24
Strategy 17: Update Trucker’s Guide Description: Once produced by the Metropolitan Council in the 1980s and early 1990s, the Trucker’s Guide included road restriction and truck route information in the metropolitan area. This map could be designed for current conditions in the seven-county (or eleven-county) area in a geographic information system and posted on the internet. The Trucker’s Guide could be expanded to include infrastructure hazards like low-clearance bridges and information on obtaining dimensional permits at the state and local level, plus other information as required.
Figure E-7. Copy of the Trucker’s Guide (courtesy of Mn/DOT)
Places Where Tried: The Port of Tacoma and many other ports have developed trucker guides for their ports. The ATA once produced a state guide. Benefits: Helps truckers and truck dispatcher navigate the metropolitan area; reduces wear and tear on roadways not equipped to handle heavy trucks; reduced truck miles resulting from poor navigation. Costs: It would cost less than $25,000 to establish a website, and less than $5,000 per year to update and operate. Paper copies would cost about $3.00 per map. If 2,000 maps were printed annually, the cost would be about $6,000.00. Comments: This is a relatively low-cost activity that appears beneficial. In addition, the information included in the map will probably serve many other planning purposes. For example, the information on 10-ton and 9-ton truck routes will be useful for planning continuity of truck routes across municipal and county borders. Workshop Discussion: The consensus of the group was that this is a redundant strategy in light of the other information strategies being discussed. For example, low-clearance bridges are not much of a problem in the Twin Cities, and this information is available in other sources.
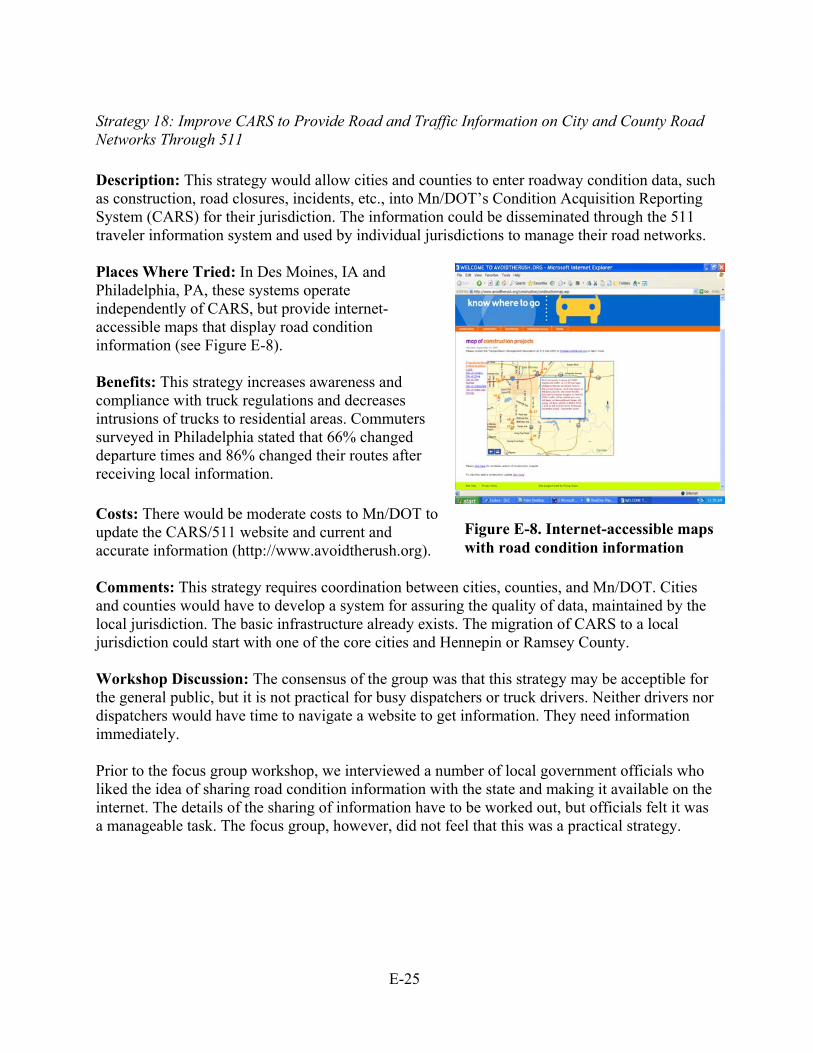
E-25
Strategy 18: Improve CARS to Provide Road and Traffic Information on City and County Road Networks Through 511 Description: This strategy would allow cities and counties to enter roadway condition data, such as construction, road closures, incidents, etc., into Mn/DOT’s Condition Acquisition Reporting System (CARS) for their jurisdiction. The information could be disseminated through the 511 traveler information system and used by individual jurisdictions to manage their road networks. Places Where Tried: In Des Moines, IA and Philadelphia, PA, these systems operate independently of CARS, but provide internet-accessible maps that display road condition information (see Figure E-8). Benefits: This strategy increases awareness and compliance with truck regulations and decreases intrusions of trucks to residential areas. Commuters surveyed in Philadelphia stated that 66% changed departure times and 86% changed their routes after receiving local information. Costs: There would be moderate costs to Mn/DOT to update the CARS/511 website and current and accurate information (http://www.avoidtherush.org).
Comments: This strategy requires coordination between cities, counties, and Mn/DOT. Cities and counties would have to develop a system for assuring the quality of data, maintained by the local jurisdiction. The basic infrastructure already exists. The migration of CARS to a local jurisdiction could start with one of the core cities and Hennepin or Ramsey County. Workshop Discussion: The consensus of the group was that this strategy may be acceptible for the general public, but it is not practical for busy dispatchers or truck drivers. Neither drivers nor dispatchers would have time to navigate a website to get information. They need information immediately. Prior to the focus group workshop, we interviewed a number of local government officials who liked the idea of sharing road condition information with the state and making it available on the internet. The details of the sharing of information have to be worked out, but officials felt it was a manageable task. The focus group, however, did not feel that this was a practical strategy.
Figure E-8. Internet-accessible maps with road condition information
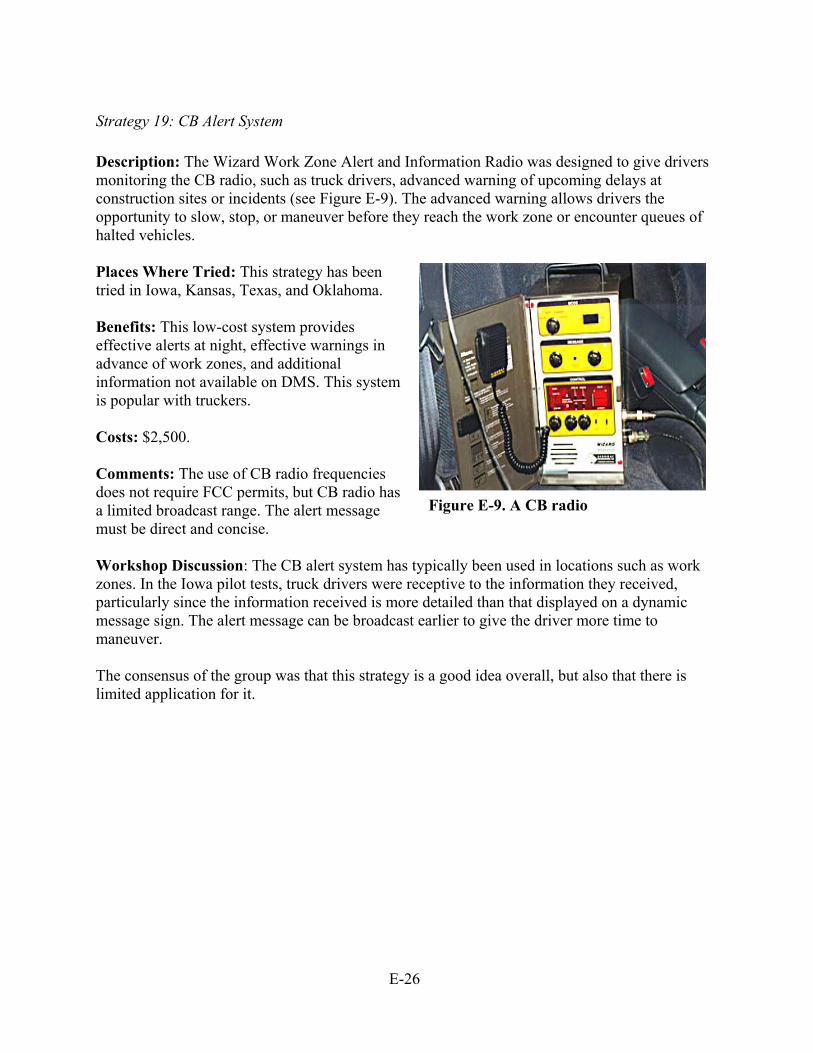
E-26
Strategy 19: CB Alert System Description: The Wizard Work Zone Alert and Information Radio was designed to give drivers monitoring the CB radio, such as truck drivers, advanced warning of upcoming delays at construction sites or incidents (see Figure E-9). The advanced warning allows drivers the opportunity to slow, stop, or maneuver before they reach the work zone or encounter queues of halted vehicles. Places Where Tried: This strategy has been tried in Iowa, Kansas, Texas, and Oklahoma. Benefits: This low-cost system provides effective alerts at night, effective warnings in advance of work zones, and additional information not available on DMS. This system is popular with truckers. Costs: $2,500. Comments: The use of CB radio frequencies does not require FCC permits, but CB radio has a limited broadcast range. The alert message must be direct and concise. Workshop Discussion: The CB alert system has typically been used in locations such as work zones. In the Iowa pilot tests, truck drivers were receptive to the information they received, particularly since the information received is more detailed than that displayed on a dynamic message sign. The alert message can be broadcast earlier to give the driver more time to maneuver. The consensus of the group was that this strategy is a good idea overall, but also that there is limited application for it.
Figure E-9. A CB radio
E-27
Capital Investment Strategies
Strategy 22: Lengthen Deceleration Lanes Description: On all roadways, right-turn decelerations lanes reduce rear-end crashes between through vehicles and right-turning vehicles. On multi-lane, median-divided highways, left-turn decelerations lanes also reduce rear-end crashes. These lanes also allow slowing traffic to move off of the through lane so through traffic is unimpeded. Deceleration lanes are particularly important when there is a high percentage of truck traffic. Turning trucks are moved off of the roadway sooner, creating less delay, and through trucks are not required to slow or stop for turning vehicles. Places Where Tried: This strategy is widely used throughout United States, but the deceleration lanes are usually not long enough for large trucks. On high-speed facilities (55 mph or greater) deceleration lanes should be about 500 feet long.
Benefits: Greater through capacity; fewer delays; fewer rear-end crashes. Costs: If built separately, a 500-foot deceleration lane costs around $40,000. If the lane is part of a reconstruction project, the deceleration lane costs much less. Comments: Longer deceleration lanes are known to improve safety and improve intersection operating efficiency. Workshop Discussion: The discussion of this strategy revealed that Minnesota District 3 has adopted a 500-foot policy for deceleration lanes. In one instance, District 3 used 900 feet. At present, 500 feet seems to be the upcoming standard. The current standard is 300 feet. The discussion then focused on where to place deceleration lanes. It was then revealed that Mn/DOT is currently conducting a research project on that issue.
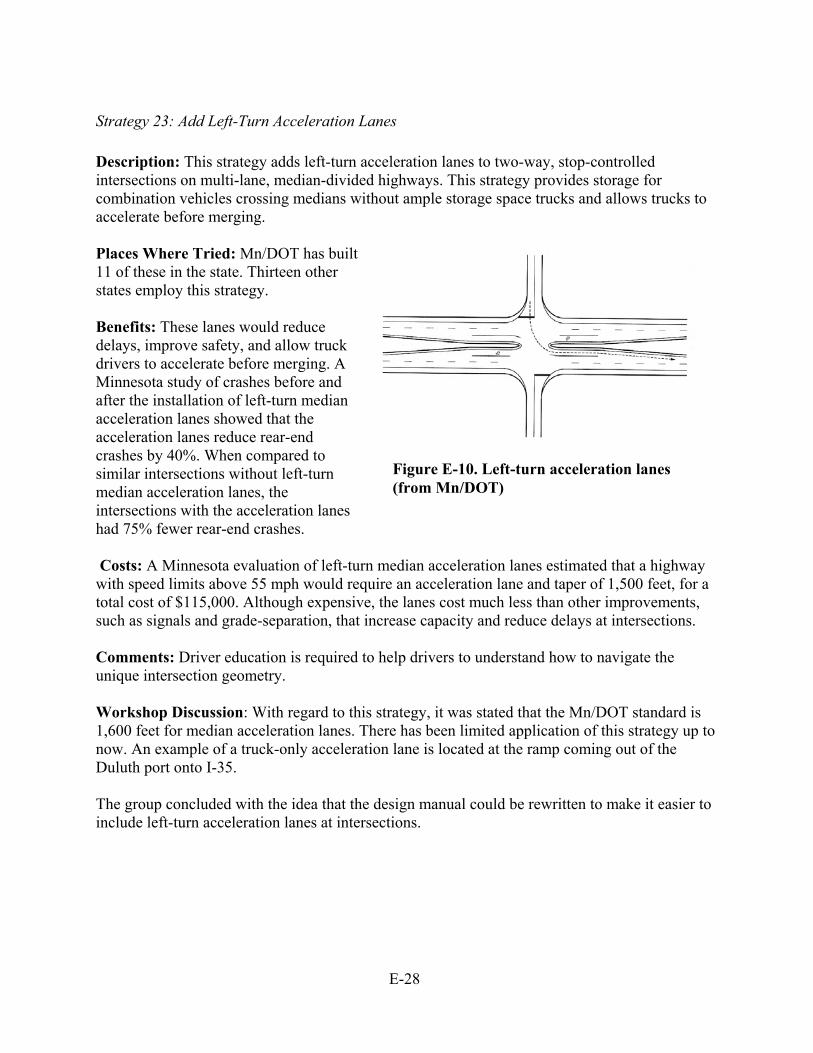
E-28
Strategy 23: Add Left-Turn Acceleration Lanes Description: This strategy adds left-turn acceleration lanes to two-way, stop-controlled intersections on multi-lane, median-divided highways. This strategy provides storage for combination vehicles crossing medians without ample storage space trucks and allows trucks to accelerate before merging. Places Where Tried: Mn/DOT has built 11 of these in the state. Thirteen other states employ this strategy. Benefits: These lanes would reduce delays, improve safety, and allow truck drivers to accelerate before merging. A Minnesota study of crashes before and after the installation of left-turn median acceleration lanes showed that the acceleration lanes reduce rear-end crashes by 40%. When compared to similar intersections without left-turn median acceleration lanes, the intersections with the acceleration lanes had 75% fewer rear-end crashes. Costs: A Minnesota evaluation of left-turn median acceleration lanes estimated that a highway with speed limits above 55 mph would require an acceleration lane and taper of 1,500 feet, for a total cost of $115,000. Although expensive, the lanes cost much less than other improvements, such as signals and grade-separation, that increase capacity and reduce delays at intersections. Comments: Driver education is required to help drivers to understand how to navigate the unique intersection geometry. Workshop Discussion: With regard to this strategy, it was stated that the Mn/DOT standard is 1,600 feet for median acceleration lanes. There has been limited application of this strategy up to now. An example of a truck-only acceleration lane is located at the ramp coming out of the Duluth port onto I-35. The group concluded with the idea that the design manual could be rewritten to make it easier to include left-turn acceleration lanes at intersections.
Figure E-10. Left-turn acceleration lanes (from Mn/DOT)
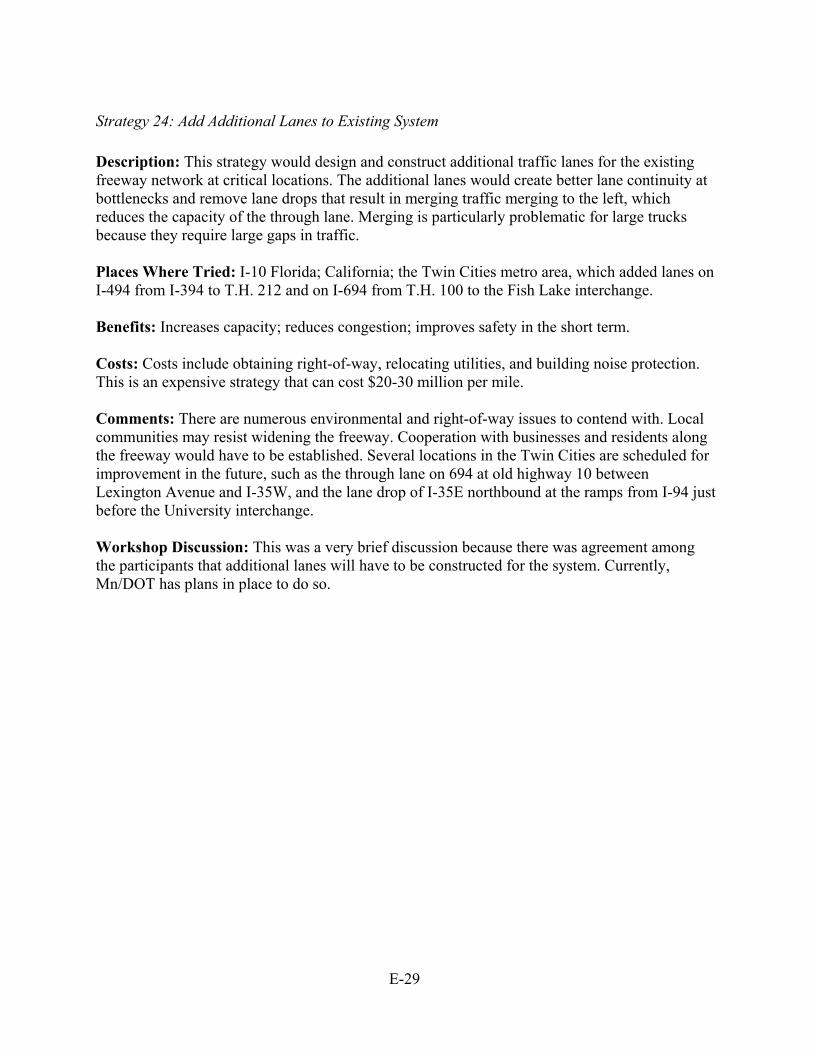
E-29
Strategy 24: Add Additional Lanes to Existing System Description: This strategy would design and construct additional traffic lanes for the existing freeway network at critical locations. The additional lanes would create better lane continuity at bottlenecks and remove lane drops that result in merging traffic merging to the left, which reduces the capacity of the through lane. Merging is particularly problematic for large trucks because they require large gaps in traffic. Places Where Tried: I-10 Florida; California; the Twin Cities metro area, which added lanes on I-494 from I-394 to T.H. 212 and on I-694 from T.H. 100 to the Fish Lake interchange.
Benefits: Increases capacity; reduces congestion; improves safety in the short term.
Costs: Costs include obtaining right-of-way, relocating utilities, and building noise protection. This is an expensive strategy that can cost $20-30 million per mile. Comments: There are numerous environmental and right-of-way issues to contend with. Local communities may resist widening the freeway. Cooperation with businesses and residents along the freeway would have to be established. Several locations in the Twin Cities are scheduled for improvement in the future, such as the through lane on 694 at old highway 10 between Lexington Avenue and I-35W, and the lane drop of I-35E northbound at the ramps from I-94 just before the University interchange. Workshop Discussion: This was a very brief discussion because there was agreement among the participants that additional lanes will have to be constructed for the system. Currently, Mn/DOT has plans in place to do so.
E-30
Strategy 25: Increase Staging Area for Drop-off/Pick-up of Freight Description: Establish a system of distribution or staging facilities on the outskirts of the Twin Cities where freight could be transferred to smaller vehicles that would then deliver and/or pick up at the destinations within the city. See Figure E-11 (FHWA, Office of Freight Management, National Freight Dialogue, http://www.ops.fhwa.dot.gov/freight/).
Places Where Tried: California is investigating areas along the Alameda Corridor. Other places considered include Newport, VA; Wilmington, DE; Umatilla, OR; Hampton Roads, VA; Savannah, GA; and Morrow, OR. Benefits: Implementing this strategy can reduce the volume of large trucks in the metropolitan area and eliminate the necessity for truck drivers to navigate narrow city streets, reducing their frustration. Costs: This is a high-cost strategy for both the public and private sectors because new distribution centers would be constructed, land-use and right-of-way would be obtained, and ongoing maintenance would be performed.
Comments: Other distribution centers may object. There are land-use and possible noise issues for neighboring businesses and residents. Trucking would have to work out pick-up and delivery schedules with shippers and receivers. This is a long-term strategy, and the benefits would not be realized for 5–10 years. Workshop Discussion: In this strategy discussion, one participant suggested that this strategy was a return to railroad days, where the loads come in by train and then drayed. A similar system exists right now via freight forwarders who pick up and consolidate loads, but it doesn’t work the other way. The group questioned whether this strategy adds value to the supply chain. Thus, the participants concluded that this strategy would require many additional drivers, and carriers are scrambling for qualified drivers now.
Figure E-11. Distribution/stagingfacility
E-31
Strategy 27: Expand Minnesota Bridge Anti-icing Systems Description: A bridge anti-icing system consists of a computerized system that sprays potassium acetate or another anti-icing chemical on the bridge deck when data from sensors and a road weather information system determine that hazardous winter driving conditions are imminent. Since ice or frost forms on bridge decks overnight or in the early morning, trucks making early deliveries or traveling during off-peak hours are often the first vehicles to experience slick bridge decks. Places Where Tried: Metro District I-35W over the Mississippi River; District 7W, Windom Maintenance Area; District 1A, Duluth Maintenance Area; District 4, Detroit Lakes Maintenance. Area; District 6A, Rochester Maintenance Area; other states, including Iowa and Kansas. Benefits: This strategy would improve the level of service on the bridge during bad weather, reduce primary and secondary crashes, and save time, because snow plows would not have to be diverted to treat the bridge while they are on their routes. An evaluation of system found a benefit-cost ratio of 3.4 to 1.
Costs: Construction and installation of a system on the I-35W bridge over the Mississippi River was $618,450.
Comments: The development of 5- and 10-year plans to identify funding and resources and integrate the anti-icing system with new bridge construction and rehabilitation projects would be necessary. Training for these types of systems is also required. Although these systems are automated, they require ongoing maintenance. Workshop Discussion: There are at least two studies underway in the trucking industry to look at chemical damage to trucks and chassis.
There is research underway at Mn/DOT examining the impacts of the newer de-icing chemicals on vehicles and the environment.
E-32
Planning and Policy Strategies
Strategy 28: Develop System to Collect Continuous Truck Data Description: This strategy would implement the collection and maintenance of data related to truck movements in the region using fixed automatic traffic recorders, automatic vehicle classifiers, weigh-in-motion, video detection, mobile traffic counting and classifying equipment, and periodic origin-destination surveys to support data from secondary private and public sources. A database for analysis would be developed. Other Places Where Tried: Georgia, Florida. Benefits: This strategy incorporates truck movements and existing data sources into the long-range, strategic planning process. By providing continuous truck-related data, planning agencies can make efficient decisions related to freight transportation. Costs: Costs would be associated with managing and storing the data, developing policies and procedures for providing others with access to the data, and staffing requirements; one position may be added. Comments: Those implementing this system must develop procedures for protecting data privacy. Furthermore, freight planning can help ensure that decision makers appropriately consider freight movement needs by providing state and local transportation planners with the necessary tools to understand the impacts of alternative investments on the efficiency of the freight system. Workshop Discussion: In this strategy discussion, members of the group stated that the Metropolitan Council is currently building a truck-forecasting model. Once the truck model is in place they would like to develop better data to support the model. One participant expressed concern about the type of data gathered. The purpose of this strategy is to better understand the traffic component of highway design forecasting. While most state DOTs have vehicle count and classification stations, there are limited applications.
Regarding other privacy issues, if this strategy is referring to external data collection, i.e., collecting data on the freeway, then industry can not do anything about it. If this is referring to internal data collection, i.e., collecting data from carriers, then there are privacy issues. One last item raised in the discussion was that industry is working with FHWA on data privacy standards. When data issues are raised in the context of examining alternative investment strategies, for example, that definitely raises red flags in the trucking industry.
E-33
Strategy 29: Expand Freight Advisory Committee Description: One method to obtain more freight input into the metropolitan planning process is to develop a Freight Advisory Committee (FAC) at the Metropolitan Planning Organization (MPO) level. The FAC would collect and analyze freight-specific data for the MPO to meet the increasing demands of freight systems. A 2003 survey conducted by the Association of Metropolitan Planning Organizations estimated that 18% of all MPOs have institutionalized a FAC. Other Places Where Tried: Philadelphia, Seattle-Tacoma, San Francisco-Oakland-San Jose, Toledo, Miami, and Chicago.
Benefits: The creation of a FAC institutionalizes a conduit for gaining a freight perspective on transportation planning decisions. Costs: Costs would be associated with staffing and supporting an additional advisory committee. Comments: The FAC must be well organized and well managed. Freight executives are accustomed to having decisions implemented quickly. In the public sector, the project planning and development process is long and laborious. These differences in perspective can violate the expectations of the FAC members. Some transportation professionals have expressed a need for more involvement at both the regional and local planning processes. Currently, a member of Mn/DOT’s FAC is a member of the Metropolitan Council Transportation Advisory Board, and provides freight input into the planning process. Workshop Discussion: The group consensus was that the present role of a member of Mn/DOT’s FAC on the Metropolitan Council Transportation Advisory Board is sufficient to provide input to the planning process.
No further expansion of that role is necessary at this time.
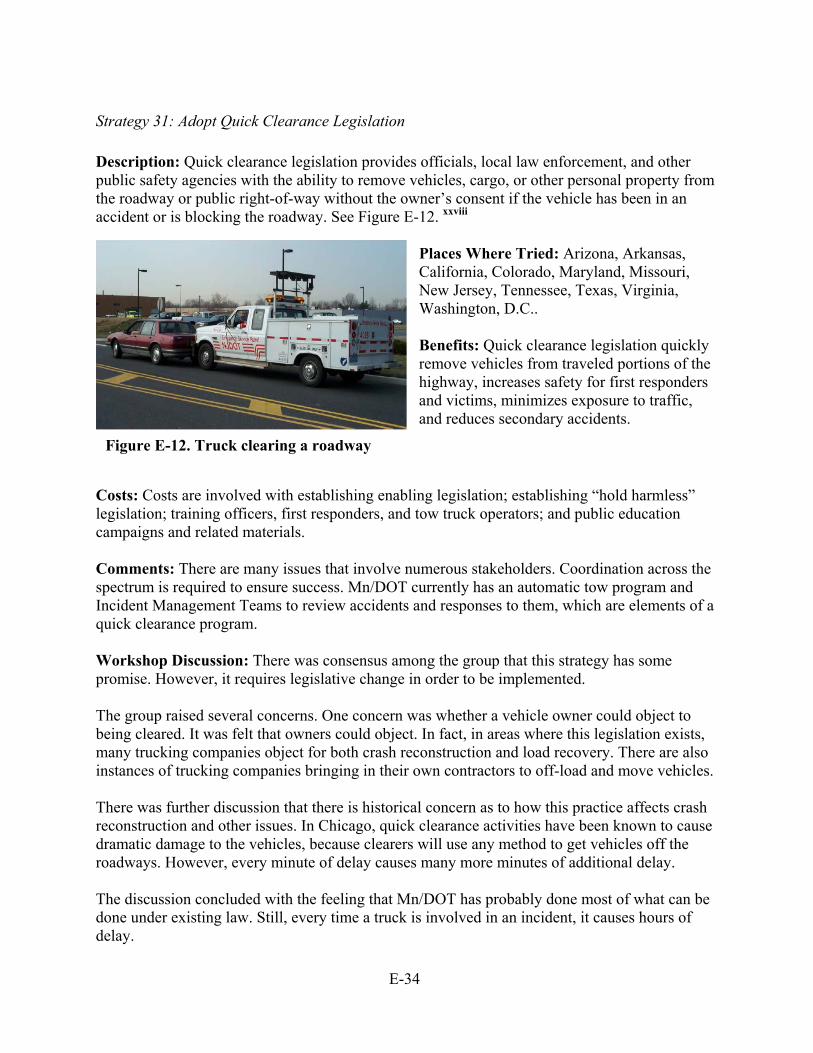
E-34
Strategy 31: Adopt Quick Clearance Legislation Description: Quick clearance legislation provides officials, local law enforcement, and other public safety agencies with the ability to remove vehicles, cargo, or other personal property from the roadway or public right-of-way without the owner’s consent if the vehicle has been in an accident or is blocking the roadway. See Figure E-12. xxviii
Places Where Tried: Arizona, Arkansas, California, Colorado, Maryland, Missouri, New Jersey, Tennessee, Texas, Virginia, Washington, D.C.. Benefits: Quick clearance legislation quickly remove vehicles from traveled portions of the highway, increases safety for first responders and victims, minimizes exposure to traffic, and reduces secondary accidents.
Costs: Costs are involved with establishing enabling legislation; establishing “hold harmless” legislation; training officers, first responders, and tow truck operators; and public education campaigns and related materials. Comments: There are many issues that involve numerous stakeholders. Coordination across the spectrum is required to ensure success. Mn/DOT currently has an automatic tow program and Incident Management Teams to review accidents and responses to them, which are elements of a quick clearance program. Workshop Discussion: There was consensus among the group that this strategy has some promise. However, it requires legislative change in order to be implemented. The group raised several concerns. One concern was whether a vehicle owner could object to being cleared. It was felt that owners could object. In fact, in areas where this legislation exists, many trucking companies object for both crash reconstruction and load recovery. There are also instances of trucking companies bringing in their own contractors to off-load and move vehicles. There was further discussion that there is historical concern as to how this practice affects crash reconstruction and other issues. In Chicago, quick clearance activities have been known to cause dramatic damage to the vehicles, because clearers will use any method to get vehicles off the roadways. However, every minute of delay causes many more minutes of additional delay. The discussion concluded with the feeling that Mn/DOT has probably done most of what can be done under existing law. Still, every time a truck is involved in an incident, it causes hours of delay.
Figure E-12. Truck clearing a roadway
E-35
Strategy 32: Design Guidance to Local Governments for Accommodating Trucks on Local Roads Description: This strategy would provide guidance for identifying locations where land use applications currently or are likely to generate heavy truck movements, traffic control needs, and local street pavement and geometric design to accommodate heavy trucks. Places Where Tried: No specific examples were found for local governments. Inadequate geometry on local streets is a commonly reported problem in urban areas. Benefits: The benefits are difficult to quantify, but appropriate roadway design for trucks can improve safety and traffic flow efficiency. Costs: Depending on the scope of the guide and the level of involvement of government and private design professionals, the project cost could range from $50,000 to $150,000. Comments: Some transportation professionals from large organizations have not found this strategy attractive. This strategy may be more popular with medium-to-small local governments, particularly those with a growing industrial and commercial economic base. It has been noted that in some cases a city will make a conscious effort to have restrictive turning radii in order to encourage pedestrian traffic at the expense of not appearing to be heavy truck-friendly. Workshop Discussion: The discussion of this strategy was very favorable. One participant asked whether the state aid office provides any guidance to local units of government. Most of the guidance presently provided applies to pavement thickness and width of pavements. One participant stated that this is one issue that the design office deals with all the time. One participant stated that this strategy would be well received by communities. In fact, the research office conducts focus groups with local governments, and the issue of accommodating trucks comes up a lot. The discussion concluded with the belief that the proposal would be very practical and beneficial if implemented.
E-36
3. WORKSHOP RESULTS Following the discussion of the strategies presented, the workshop participants were asked to vote on the strategies that they felt were the most promising for further research. Table 3 shows the results of the voting. The seven top-ranked strategies are listed below:
1. Strategy 32: Design Guidance to Local Governments for Accommodating Trucks on Local Roads
2. Strategy 31: Adapting Quick Clearance Legislation 3. Strategy 23: Add Additional Lanes to Existing System 4. Strategy 9: Improve Advanced Signing on Arterials for Freeway Entrances 5. Strategy 5A: Increase Truck Parking Facilities on the Urban Fringe 6. Strategy 21: Deceleration Lanes 7. Strategy 22: Left-Turn Acceleration Lanes
Table E-3. Tally of strategy votes by experts Operational Strategies Votes 4. Lane Restrictions for Heavy Trucks 7 Votes 5A. Increase Truck Parking Facilities on the Urban Fringe 18 Votes 5B. Increase Overnight Truck Parking in the Urban Core 8 Votes 6. Traffic Signal Prioritization for Heavy Vehicles 0 Votes 6A Coordinate Arterial Signal Systems to Accommodate Trucks on Heavy Truck Trafficked Corridors 1 Vote 7. Use of HOV and HOT Lanes by Trucks 1 Vote 8. Truck Use of HOV Ramp Meter Bypass Lanes 4 Votes 9. Improved Advanced Signing on Arterials for Freeway Entrances 18 Votes 10. Expand Integrated Corridor Traffic Management 3 Votes Driver Oriented Strategies 11. Improvement of Information for Truck Drivers 4 Votes 12. Improved Signs: Larger, Directional, Improved Lettering 6 Votes 13. Dynamic Curve Warning Systems 5 Votes 14. Information on Roadway Hazards 0 Votes 16. Update Trucker’s Guide 4 Votes 17. Improve CARS to Provide Road and Traffic Information on City and County Road Networks through 511 2 Votes 18. CB Alert System 3 Votes Capital Investment Strategies 21. Deceleration Lanes 10 Votes 22. Left-Turn Acceleration Lanes 9 Votes 23. Add Additional Lanes to Existing System 14 Votes 24. Increased Staging Area for Drop-off/Pick-up of Freight 0 Votes 25. Expand Minnesota Bridge Anti-icing Systems 3 Votes Planning and Policy Strategies 26. Develop System to Collect Continuous Truck Data 6 Votes 27. Freight Advisory Committee 1 Vote 28. Adapting Quick Clearance Legislation 19 Votes 29. Design Guidance to Local Governments for Accommodating Trucks on Local Roads 21 Votes

E-37
The third ranked strategy, “Add Additional Lanes to Existing System,” is being accomplished by Mn/DOT through its normal capital improvement program. As a result, this strategy was dropped from further development through this project. The remaining six strategies will be further developed and refined for potential implementation in the future.