twin cities region
TRANSCRIPT

FOR RESIDENTIAL REAL ESTATE ACTIVITY IN THE13-COUNTY TWIN CITIES REGION
Annual Report on the Twin Cities Housing Market

Table of Contents3 Quick Facts
5 Property Type Review
6 Distressed Homes Review
7 New Construction Review
8 Area Overviews
17 Area Historical Prices
26 Historical ReviewClick on desired metric to jump to that page.
Current as of January 10, 2014. Sponsored by Royal Credit Union (www.RCU.org). All data from NorthstarMLS. Powered by 10K Research and Marketing. | 2
It was a banner year for residential real estate across America. Nearly every metropolitan housing market embarked upon or continued along the road to recovery. Local and regional markets once burdened by excessive supply levels and heavy foreclosure loads have given way to multiple-offer situations, homes selling in record-low market times and prices rallying to multi-year highs in many cases.
The year 2013 brought tectonic shifts to housing's landscape. Many local markets transitioned from buyers' markets to sellers' markets. Closed sales are up. Days on market until sale is trending downward. The percent of list price received at sale is trending higher. Sellers even managed to post a notable gain.
Low (but upwardly mobile) mortgage rates, still affordable prices and a better jobs scene created a triple play that helped bolster consumer confidence and galvanize local markets. Rising prices have the dual benefit of further cementing confidence as well as lifting homeowners out of underwater positions, which should create more inventory in 2014.
Sales Favorable rates, more employment opportunities and a rising stock market mixed with rising prices, rising rents and shrinking inventory left buyers with a sense of empowerment and urgency. Unsurprisingly, buyers closed on 8.8 percent more homes in 2013 than in 2012, finishing at 53,087 for the year. That's the highest number of sales since 2005. Not only was there more demand in 2013, but the product mix of those additional sales also skewed toward higher-priced traditional homes. In 2014, buyers who endured foreclosure could become ready to purchase again. Also watch for signs of life among move-up buyers and in the upper-price echelons. Investor activity should continue to subside.
Listings At 11,646, inventory levels fell throughout most of the year, finishing 10.5 percent below 2012's tally. That is likely to change in 2014 as recovery continues. Rising prices should continue to unlock additional inventory. A better labor market meant more stable household finances. There was pent-up demand remaining from the economic downturn, and sellers were evidently eager to make a move. Sellers regained a lot of ground in 2013, listing 72,128 properties or 9.4 percent more than 2012. They must have caught wind of the robust demand, rising prices and speedy market times. And many of them got top dollar for their home – in some instances, an amount greater than their list price.
Annual Report on the Twin Cities Housing MarketFOR RESIDENTIAL REAL ESTATE ACTIVITY IN THE13-COUNTY TWIN CITIES REGION
Distressed Properties Foreclosures and short sales exerted far less downward pressure on prices, partly due to recovery within those segments but mainly because of their dwindling market share. Plummeting from 50.0 percent to 26.4 percent in two years, the percentage of all sales that were in financial distress is on the decline. In this improving economy, fewer homeowners are defaulting, which means banks are listing fewer distressed homes, which means fewer are closing. That's a good thing, since these listings tend to sell for between $130,000 and $140,000 compared to $220,000 for their traditional counterparts.
Prices We closed 2013 with a 14.4 percent median price increase compared to 2012. At $192,000, the median sales price is proudly standing at a five-year high. Prices are now just 16.5 percent below their 2006 peak but 28.0 percent above their 2011 valley. Watch for move-up buyers, fewer foreclosures and new construction to impact prices in 2014. Prices are likely to grow but at a tempered pace.
Housing is closely tied to economic health. Households with gainfully employed wage earners are more likely to make bigger purchases like a house or a car. When gauging the housing market, it's important to closely track job growth and unemployment.
"A nation of homeowners is unconquerable." So said FDR. The American Dream was alive and well in 2013, as U.S. citizens proved that they still want a stake in the action. With countless benefits to families, cities and regions, homeownership continues to be the fabric of our communities, and we expect the national and local housing morale to remain sharp in 2014.

Saint Francis + 63.4% Birchwood Village + 220.0%Cologne + 60.9% Lauderdale + 94.4%Grant + 52.1% Rush City + 79.4%Falcon Heights + 50.0% Greenfield + 76.2%Saint Bonifacius + 48.6% Hudson + 61.4%
Hampton - 18.2% Becker - 17.3%Spring Park - 24.2% South Saint Paul - 18.4%Long Lake - 28.3% Saint Paul - Thomas-Dale - 18.8%Circle Pines - 29.1% Minneapolis - Phillips - 26.9%Tonka Bay - 32.1% Circle Pines - 33.7%
Birchwood Village + 200.0% Maple Plain + 100.0%Rush City + 68.6% Bayport + 80.0%Greenfield + 65.2% Hammond + 77.8%Corcoran + 64.1% Saint Bonifacius + 66.7%Lauderdale + 63.2% Zumbrota + 52.0%
Columbus - 17.1% Birchwood Village - 57.1%Spring Park - 17.9% Spring Park - 63.6%Scandia - 18.2% Tonka Bay - 69.2%Minneapolis - Phillips - 25.7% Loretto - 75.0%Circle Pines - 26.0% Excelsior - 90.9%
At the end of the year
2013 Annual Report on the Twin Cities Housing Market
Current as of January 10, 2014. Sponsored by Royal Credit Union (www.RCU.org). All data from NorthstarMLS. Powered by 10K Research and Marketing. | 3
Bottom 5 Areas: Change in Closed Sales from 2012 Bottom 5 Areas: Change in Homes for Sale from 2012
Top 5 Areas: Change in Pending Sales from 2012
Bottom 5 Areas: Change in Pending Sales from 2012
Top 5 Areas: Change in Closed Sales from 2012 Top 5 Areas: Change in Homes for Sale from 2012
Bottom 5 Areas: Change in New Listings from 2012
Top 5 Areas: Change in New Listings from 2012
Quick FactsRankings include geographies with 15 sales or more. Counties, townships and Minneapolis neighborhoods are not included.
20,622 22,651
17,441
13,012 11,646
2009 2010 2011 2012 2013
45,877
38,288 41,606
48,812 53,087
2009 2010 2011 2012 2013
46,178
38,194 42,060
49,370 52,917
2009 2010 2011 2012 2013
82,977 81,858
68,886 65,910 72,128
2009 2010 2011 2012 2013
New Listings Pending Sales
- 1.3% - 15.8% - 4.3%
Closed Sales Inventory of Homes for Sale
+ 9.4% - 17.3% + 10.1% + 17.4% + 7.2%
- 16.5% + 8.7% + 17.3% + 8.8% + 9.8% - 23.0% - 25.4% - 10.5%

Stacy + 67.1% Dellwood + 60.9%Hampton + 56.9% Loretto + 59.2%Saint Paul - Dayton's Bluff + 56.3% Newport + 55.2%Loretto + 53.8% Stacy + 53.4%Afton + 48.9% Birchwood Village + 48.7%
Osseo - 7.8% Greenfield - 10.3%Wayzata - 18.6% Spring Park - 11.2%Spring Park - 22.7% Lakeland - 13.8%Lake St. Croix Beach - 22.8% Tonka Bay - 19.4%Tonka Bay - 40.1% Lake St. Croix Beach - 20.9%
Birchwood Village + 76.1% Loretto + 19.2%Dayton + 22.2% Dellwood + 8.3%Saint Paul - Summit Hill + 18.5% Excelsior + 7.9%Corcoran + 13.6% Nowthen + 7.1%Faribault + 12.7% Afton + 6.5%
Mayer - 49.0% Newport - 2.0%
Osseo - 49.4% Maple Lake - 2.2%
Lake Elmo - 49.5% Minneapolis - Near North - 3.5%
Rogers - 50.8% Norwood Young America - 4.2%
Rockford - 61.4% Birchwood Village - 5.4%
Current as of January 10, 2014. Sponsored by Royal Credit Union (www.RCU.org). All data from NorthstarMLS. Powered by 10K Research and Marketing. | 4
Bottom 5 Areas: Change in Cumulative Days on Market from 2012 Bottom 5 Areas: Change in Pct. of Orig. Price Received from 2012
Top 5 Areas: Change in Cumulative Days on Market from 2012 Top 5 Areas: Change in Pct. of Orig. Price Received from 2012
Top 5 Areas: Change in Median Sales Price from 2012 Top 5 Areas: Change in Average Sales Price from 2012
Bottom 5 Areas: Change in Median Sales Price from 2012 Bottom 5 Areas: Change in Average Sales Price from 2012
2013 Annual Report on the Twin Cities Housing Market
Quick FactsRankings include geographies with 15 sales or more. Counties, townships and Minneapolis neighborhoods are not included.
$165,000 $169,900 $150,000
$167,900 $192,000
2009 2010 2011 2012 2013
92.7% 92.3% 90.6%
94.0%
96.1%
2009 2010 2011 2012 2013
144 133
147
117
83
2009 2010 2011 2012 2013
$199,377 $211,338
$193,341 $210,727
$236,219
2009 2010 2011 2012 2013
Median Sales Price Average Sales Price
+ 3.0% - 11.7% + 11.9%
Cumulative Days on Market Until Sale Percent of Original List Price Received
+ 14.4% + 6.0% - 8.5% + 9.0% + 12.1%
- 7.6% + 10.5% - 20.4% - 29.1% - 0.4% - 1.8% + 3.8% + 2.2%

Top Areas: Townhouse-Condo Attached Market Share in 2013Twin Cities Region 22.6%Minneapolis - Central 99.7%Saint Paul - Downtown 96.8%Lilydale 95.8%Minneapolis - University 73.5%Hugo 50.0%Minneapolis - Calhoun-Isle 47.2%Apple Valley 46.2%Vadnais Heights 44.4%Saint Paul - Summit-University 44.3%Burnsville 44.3%Spring Park 43.5%Little Canada 43.0%Hopkins 41.8%Saint Anthony 38.8%Shoreview 38.5%Minneapolis - Phillips 38.3%Woodbury 37.9%Eagan 36.6%Eden Prairie 36.4%Inver Grove Heights 36.3%Saint Paul - Summit Hill 36.3%Maple Grove 36.0%Edina 35.5%Shakopee 35.1%Saint Paul - St. Anthony Park 35.0%
2013 Annual Report on the Twin Cities Housing Market
Current as of January 10, 2014. Sponsored by Royal Credit Union (www.RCU.org). All data from NorthstarMLS. Powered by 10K Research and Marketing. | 5
One-Year Change in Price Single-Family Detached
One-Year Change in Price Townhouse-Condo Attached
Pct. of Orig. Price Received Single-Family Detached
Pct. of Orig. Price Received Townhouse-Condo Attached
+ 14.7% + 17.4% 96.0% 96.3%
This chart uses a rolling 12-month average for each data point.
Property Type ReviewRankings include geographies with 15 sales or more. Counties, townships and Minneapolis neighborhoods are not included.
84 80Average Cumulative Days on
Market Single-FamilyAverage Cumulative Days on Market Townhouse-Condo
93.2% 91.2% 92.7% 91.3% 91.1% 89.2% 94.1% 93.4%
96.0% 96.3%
Single-Family Detached Townhouse-Condo Attached
2009 2010 2011 2012 2013
$179K
$140K
$185K
$135K
$167K
$115K
$184K
$125K
$211K
$147K
Single-Family Detached Townhouse-Condo Attached
2009 2010 2011 2012 2013
75
85
95
105
115
125
135
145
155
165
175
1-2009 1-2010 1-2011 1-2012 1-2013
Single-Family Townhouse-Condo
Cumulative Days on Market Until Sale
Median Sales Price Percent of Original List Price Received

Twin Cities Region 26.4%Isanti 57.2%Circle Pines 52.1%Cambridge 48.8%Saint Paul - Thomas-Dale 48.2%Mora 47.4%Somerset 47.1%Minneapolis - Phillips 45.7%Minneapolis - Near North 45.5%Zimmerman 44.6%Pine City 44.5%Minneapolis - Camden 44.0%Saint Paul - West Side 43.4%Saint Paul - Payne-Phalen 43.3%Saint Francis 43.2%Princeton 42.7%Saint Paul - Greater East Side 42.7%East Bethel 41.7%Belle Plaine 41.6%Saint Paul - North End / South Como 41.5%Newport 40.5%Albertville 40.3%Saint Paul - Dayton's Bluff 40.3%Brooklyn Center 40.0%Saint Paul - Battle Creek / Highwood 40.0%Greenfield 39.5%
Current as of January 10, 2014. Sponsored by Royal Credit Union (www.RCU.org). All data from NorthstarMLS. Powered by 10K Research and Marketing. | 6
+ 13.0% + 1.4% - 6.7% + 5.6%Four-Year Change in Price
All PropertiesFour-Year Change in Price
Traditional PropertiesFour-Year Change in Price
Short SalesFour-Year Change in Price
Foreclosures
Distressed Homes ReviewRankings include geographies with 15 sales or more. Counties, townships and Minneapolis neighborhoods are not included.
26.4% - 27.8%Top Areas: Distressed Market Share in 2013
2013 Annual Report on the Twin Cities Housing Market
Percent of Closed Sales in 2013 That Were Distressed
One-Year Change in Sales of Distressed Properties
48.9% 47.9% 50.0%
39.7%
26.4%
2009 2010 2011 2012 2013
$217,000
$150,000
$125,900
$200,000
$131,600
$108,000
$208,800
$129,200 $118,000
$220,000
$140,000 $133,000
Traditional Short Sales Foreclosures
2010 2011 2012 2013
+4.4% -12.3%
Percent of Sales That Were Distressed
Median Sales Price
-7.8% +5.4% -1.8% +8.4% +12.7% +9.3% -14.2%

Twin Cities Region 6.9%Hanover 36.1%Medina 35.3%Bayport 33.3%Otsego 31.6%Rogers 29.8%Victoria 27.8%Delano 26.7%Cologne 25.0%North Oaks 25.0%Mayer 24.4%Chisago 22.1%Minnetrista 21.8%Oak Grove 21.1%Chanhassen 19.5%Stacy 19.5%Blaine 18.0%Prior Lake 17.7%Carver 17.1%Elko New Market 16.9%Ramsey 16.9%Andover 16.8%Montrose 16.5%Waconia 16.2%Lakeville 15.5%Woodbury 15.0%
2013 Annual Report on the Twin Cities Housing Market
New Construction ReviewRankings include geographies with 15 sales or more. Counties, townships and Minneapolis neighborhoods are not included.
Feb '09 1,762Top Areas: New Construction Market Share in 2013
Current as of January 10, 2014. Sponsored by Royal Credit Union (www.RCU.org). All data from NorthstarMLS. Powered by 10K Research and Marketing. | 7
95.8%Year-End Months Supply
New ConstructionYear-End Months Supply
Previously OwnedPct. of Orig. Price Received
New ConstructionPct. of Orig. Price Received
Previously Owned
This chart uses a rolling 12-month average for each data point.
100.3%
Peak of New Construction Inventory
Drop in New Construction Inventory from Peak
5.2 2.5
1,000
2,000
3,000
1-2009 1-2010 1-2011 1-2012 1-2013
7.9
5.3
8.1
7.2 7.4
4.9 5.3
3.0
5.2
2.5
New Construction Previously Owned
2009 2010 2011 2012 2013
88%
90%
92%
94%
96%
98%
100%
102%
1-2009 1-2010 1-2011 1-2012 1-2013
New Construction Previously Owned
New Construction Homes for Sale
Months Supply of Inventory Percent of Original List Price Received
TotalClosed Sales
Changefrom 2012
Percent New Construction
Percent Townhouse-
CondoPercent
Distressed
Cumulative Days on Market
Pct. of Orig. Price
Received
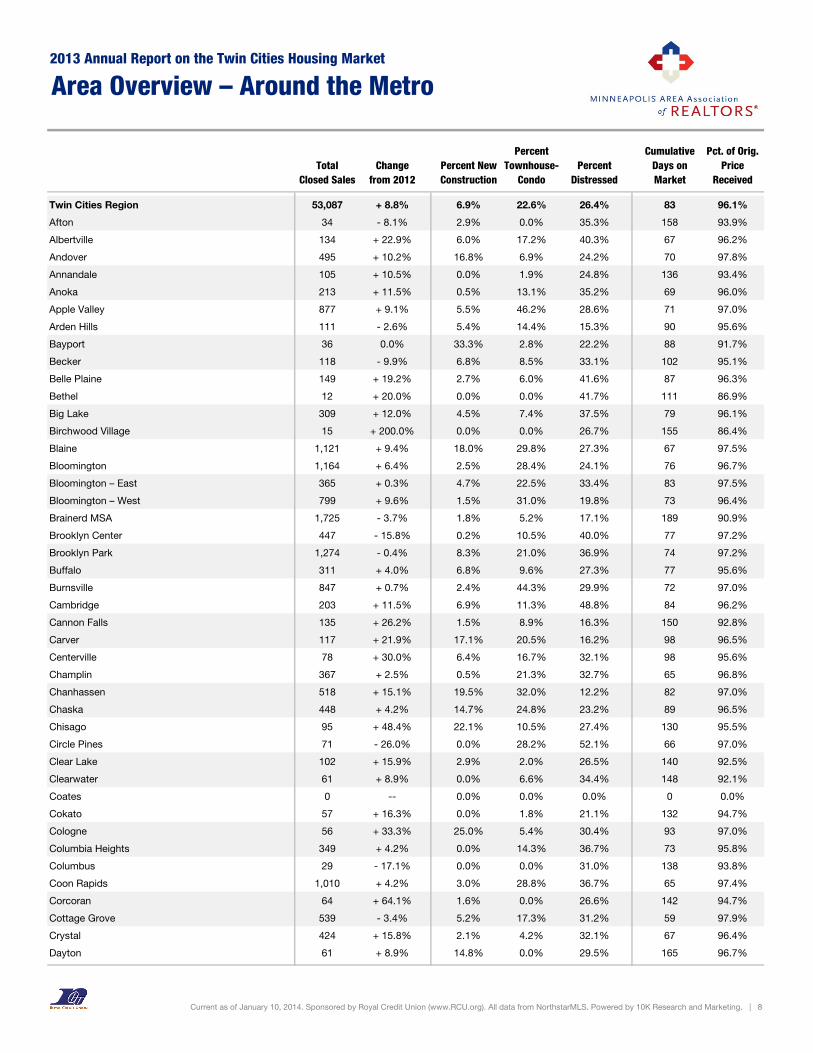
Twin Cities Region 53,087 + 8.8% 6.9% 22.6% 26.4% 83 96.1%
Afton 34 - 8.1% 2.9% 0.0% 35.3% 158 93.9%
Albertville 134 + 22.9% 6.0% 17.2% 40.3% 67 96.2%
Andover 495 + 10.2% 16.8% 6.9% 24.2% 70 97.8%
Annandale 105 + 10.5% 0.0% 1.9% 24.8% 136 93.4%
Anoka 213 + 11.5% 0.5% 13.1% 35.2% 69 96.0%
Apple Valley 877 + 9.1% 5.5% 46.2% 28.6% 71 97.0%
Arden Hills 111 - 2.6% 5.4% 14.4% 15.3% 90 95.6%
Bayport 36 0.0% 33.3% 2.8% 22.2% 88 91.7%
Becker 118 - 9.9% 6.8% 8.5% 33.1% 102 95.1%
Belle Plaine 149 + 19.2% 2.7% 6.0% 41.6% 87 96.3%
Bethel 12 + 20.0% 0.0% 0.0% 41.7% 111 86.9%
Big Lake 309 + 12.0% 4.5% 7.4% 37.5% 79 96.1%
Birchwood Village 15 + 200.0% 0.0% 0.0% 26.7% 155 86.4%
Blaine 1,121 + 9.4% 18.0% 29.8% 27.3% 67 97.5%
Bloomington 1,164 + 6.4% 2.5% 28.4% 24.1% 76 96.7%
Bloomington – East 365 + 0.3% 4.7% 22.5% 33.4% 83 97.5%
Bloomington – West 799 + 9.6% 1.5% 31.0% 19.8% 73 96.4%
Brainerd MSA 1,725 - 3.7% 1.8% 5.2% 17.1% 189 90.9%
Brooklyn Center 447 - 15.8% 0.2% 10.5% 40.0% 77 97.2%
Brooklyn Park 1,274 - 0.4% 8.3% 21.0% 36.9% 74 97.2%
Buffalo 311 + 4.0% 6.8% 9.6% 27.3% 77 95.6%
Burnsville 847 + 0.7% 2.4% 44.3% 29.9% 72 97.0%
Cambridge 203 + 11.5% 6.9% 11.3% 48.8% 84 96.2%
Cannon Falls 135 + 26.2% 1.5% 8.9% 16.3% 150 92.8%
Carver 117 + 21.9% 17.1% 20.5% 16.2% 98 96.5%
Centerville 78 + 30.0% 6.4% 16.7% 32.1% 98 95.6%
Champlin 367 + 2.5% 0.5% 21.3% 32.7% 65 96.8%
Chanhassen 518 + 15.1% 19.5% 32.0% 12.2% 82 97.0%
Chaska 448 + 4.2% 14.7% 24.8% 23.2% 89 96.5%
Chisago 95 + 48.4% 22.1% 10.5% 27.4% 130 95.5%
Circle Pines 71 - 26.0% 0.0% 28.2% 52.1% 66 97.0%
Clear Lake 102 + 15.9% 2.9% 2.0% 26.5% 140 92.5%
Clearwater 61 + 8.9% 0.0% 6.6% 34.4% 148 92.1%
Coates 0 -- 0.0% 0.0% 0.0% 0 0.0%
Cokato 57 + 16.3% 0.0% 1.8% 21.1% 132 94.7%
Cologne 56 + 33.3% 25.0% 5.4% 30.4% 93 97.0%
Columbia Heights 349 + 4.2% 0.0% 14.3% 36.7% 73 95.8%
Columbus 29 - 17.1% 0.0% 0.0% 31.0% 138 93.8%
Coon Rapids 1,010 + 4.2% 3.0% 28.8% 36.7% 65 97.4%
Corcoran 64 + 64.1% 1.6% 0.0% 26.6% 142 94.7%
Cottage Grove 539 - 3.4% 5.2% 17.3% 31.2% 59 97.9%
Crystal 424 + 15.8% 2.1% 4.2% 32.1% 67 96.4%
Dayton 61 + 8.9% 14.8% 0.0% 29.5% 165 96.7%
Current as of January 10, 2014. Sponsored by Royal Credit Union (www.RCU.org). All data from NorthstarMLS. Powered by 10K Research and Marketing. | 8
2013 Annual Report on the Twin Cities Housing Market
Area Overview – Around the Metro

TotalClosed Sales
Changefrom 2012
Percent New Construction
Percent Townhouse-
CondoPercent
Distressed
Cumulative Days on Market
Pct. of Orig. Price
Received
Deephaven 65 + 8.3% 3.1% 1.5% 6.2% 97 93.8%
Delano 150 + 50.0% 26.7% 6.7% 20.7% 94 97.0%
Dellwood 17 + 54.5% 0.0% 0.0% 17.6% 196 91.6%
Eagan 951 + 0.2% 7.2% 36.6% 23.0% 68 96.7%
East Bethel 151 - 8.5% 4.0% 0.7% 41.7% 94 95.3%
Eden Prairie 1,067 + 15.2% 3.4% 36.4% 17.0% 75 96.4%
Edina 986 + 3.4% 5.7% 35.5% 8.1% 85 95.5%
Elk River 447 + 13.7% 11.6% 20.6% 33.8% 81 95.9%
Elko New Market 118 + 19.2% 16.9% 10.2% 30.5% 91 97.2%
Excelsior 29 0.0% 3.4% 24.1% 13.8% 115 98.1%
Falcon Heights 61 + 38.6% 0.0% 18.0% 9.8% 91 95.0%
Faribault 364 + 11.0% 1.1% 9.3% 31.9% 115 93.4%
Farmington 503 + 17.0% 9.7% 23.3% 34.6% 74 97.3%
Forest Lake 367 + 29.7% 9.3% 25.6% 27.2% 106 95.9%
Fridley 361 + 21.1% 1.1% 16.9% 36.6% 76 96.7%
Gem Lake 4 + 300.0% 0.0% 0.0% 50.0% 53 87.5%
Golden Valley 378 + 22.3% 1.6% 15.9% 12.7% 71 95.6%
Grant 45 + 50.0% 0.0% 0.0% 13.3% 139 96.1%
Greenfield 38 + 65.2% 0.0% 21.1% 39.5% 129 92.8%
Greenwood 16 - 15.8% 0.0% 6.3% 12.5% 184 93.5%
Ham Lake 212 + 1.0% 13.2% 7.1% 26.9% 87 96.8%
Hamburg 9 + 28.6% 0.0% 0.0% 22.2% 223 88.8%
Hammond 53 + 1.9% 1.9% 5.7% 34.0% 168 94.2%
Hampton 17 - 5.6% 0.0% 0.0% 5.9% 81 94.8%
Hanover 72 + 50.0% 36.1% 0.0% 36.1% 95 98.2%
Hastings 332 - 6.7% 4.8% 28.6% 29.5% 80 95.8%
Hilltop 1 0.0% 0.0% 100.0% 100.0% 52 92.0%
Hopkins 213 + 1.9% 0.9% 41.8% 28.6% 88 96.8%
Hudson 509 + 59.1% 9.4% 22.0% 18.7% 116 96.2%
Hugo 346 + 8.5% 14.7% 50.0% 28.0% 74 97.3%
Hutchinson 285 + 3.6% 2.1% 10.5% 24.6% 92 93.7%
Independence 44 - 2.2% 0.0% 0.0% 18.2% 220 91.4%
Inver Grove Heights 463 + 15.5% 9.9% 36.3% 24.6% 75 96.3%
Isanti 201 + 20.4% 7.0% 11.9% 57.2% 82 96.7%
Jordan 112 + 4.7% 5.4% 4.5% 26.8% 100 95.8%
Lake Elmo 89 + 7.2% 6.7% 1.1% 22.5% 94 94.4%
Lake Minnetonka Area 961 + 3.1% 7.7% 11.9% 20.2% 133 93.7%
Lake St. Croix Beach 15 + 15.4% 0.0% 0.0% 33.3% 101 91.5%
Lakeland 33 + 26.9% 0.0% 0.0% 30.3% 88 93.2%
Lakeland Shores 5 - 28.6% 0.0% 0.0% 20.0% 111 90.5%
Lakeville 1,106 + 19.7% 15.5% 20.1% 24.2% 76 97.1%
Lauderdale 31 + 63.2% 0.0% 22.6% 22.6% 96 95.4%
Lexington 11 - 31.3% 0.0% 0.0% 27.3% 90 89.7%
Lilydale 24 + 14.3% 0.0% 95.8% 20.8% 153 93.4%
Current as of January 10, 2014. Sponsored by Royal Credit Union (www.RCU.org). All data from NorthstarMLS. Powered by 10K Research and Marketing. | 9
2013 Annual Report on the Twin Cities Housing Market
Area Overview – Around the Metro

TotalClosed Sales
Changefrom 2012
Percent New Construction
Percent Townhouse-
CondoPercent
Distressed
Cumulative Days on Market
Pct. of Orig. Price
Received
Lindstrom 112 + 3.7% 4.5% 17.0% 37.5% 144 93.3%
Lino Lakes 254 + 8.5% 7.1% 16.9% 28.3% 83 96.7%
Little Canada 121 + 11.0% 2.5% 43.0% 28.1% 93 94.5%
Long Lake 31 + 14.8% 0.0% 9.7% 29.0% 99 92.3%
Lonsdale 111 + 14.4% 2.7% 0.0% 38.7% 81 95.0%
Loretto 15 + 50.0% 0.0% 20.0% 6.7% 52 96.9%
Mahtomedi 132 + 30.7% 6.1% 12.1% 15.9% 101 94.6%
Maple Grove 1,302 + 11.5% 11.4% 36.0% 21.9% 68 96.9%
Maple Lake 62 + 1.6% 1.6% 6.5% 35.5% 117 89.7%
Maple Plain 23 - 11.5% 0.0% 0.0% 30.4% 86 92.3%
Maplewood 521 - 1.7% 1.9% 24.8% 31.9% 76 96.2%
Marine on St. Croix 21 + 40.0% 0.0% 14.3% 19.0% 172 84.6%
Mayer 45 + 12.5% 24.4% 0.0% 35.6% 53 98.0%
Medicine Lake 4 + 300.0% 0.0% 0.0% 0.0% 110 86.8%
Medina 119 + 33.7% 35.3% 14.3% 8.4% 146 94.1%
Mendota 1 0.0% 0.0% 0.0% 0.0% 19 104.4%
Mendota Heights 164 - 5.7% 1.2% 33.5% 12.2% 90 96.1%
Miesville 4 + 300.0% 25.0% 0.0% 25.0% 131 94.2%
Minneapolis - (Citywide) 5,603 + 6.7% 2.0% 23.5% 23.9% 77 95.9%
Minneapolis - Calhoun-Isle 434 + 0.9% 4.1% 47.2% 13.4% 113 93.7%
Minneapolis - Camden 645 + 14.8% 0.6% 1.7% 44.0% 89 93.1%
Minneapolis - Central 648 + 14.7% 4.9% 99.7% 16.5% 76 96.5%
Minneapolis - Longfellow 349 + 9.4% 1.4% 3.7% 18.3% 51 97.5%
Minneapolis - Near North 330 + 3.4% 1.5% 8.2% 45.5% 98 91.5%
Minneapolis - Nokomis 847 + 12.3% 0.7% 3.8% 22.8% 65 96.8%
Minneapolis - Northeast 497 + 4.0% 1.2% 9.5% 27.6% 68 97.0%
Minneapolis - Phillips 81 - 25.7% 1.2% 38.3% 45.7% 94 93.5%
Minneapolis - Powderhorn 605 + 9.6% 0.7% 15.0% 29.6% 77 96.8%
Minneapolis - Southwest 961 + 1.5% 2.6% 5.9% 9.3% 62 97.2%
Minneapolis - University 215 - 0.9% 3.3% 73.5% 18.1% 117 95.4%
Minnetonka 837 + 3.3% 3.5% 30.5% 15.4% 76 95.8%
Minnetonka Beach 10 - 9.1% 0.0% 0.0% 10.0% 185 89.9%
Minnetrista 133 + 10.8% 21.8% 3.0% 13.5% 152 94.9%
Monticello 254 + 28.9% 9.4% 18.1% 33.5% 78 96.0%
Montrose 103 + 30.4% 16.5% 13.6% 21.4% 96 95.5%
Mora 116 - 7.2% 0.0% 2.6% 47.4% 157 90.5%
Mound 197 - 0.5% 3.0% 6.1% 31.0% 107 93.3%
Mounds View 121 - 6.2% 1.7% 9.9% 26.4% 75 95.4%
New Brighton 227 - 13.7% 5.7% 32.6% 22.9% 75 96.0%
New Germany 12 + 9.1% 0.0% 0.0% 33.3% 102 95.5%
New Hope 258 + 13.7% 0.8% 15.9% 28.7% 68 94.7%
New Prague 191 + 2.7% 5.2% 20.4% 27.7% 110 95.9%
New Richmond 228 + 20.0% 6.6% 8.3% 30.7% 142 95.2%
New Trier 2 - 33.3% 0.0% 0.0% 0.0% 53 88.2%
2013 Annual Report on the Twin Cities Housing Market
Current as of January 10, 2014. Sponsored by Royal Credit Union (www.RCU.org). All data from NorthstarMLS. Powered by 10K Research and Marketing. | 10
Area Overview – Around the Metro

TotalClosed Sales
Changefrom 2012
Percent New Construction
Percent Townhouse-
CondoPercent
Distressed
Cumulative Days on Market
Pct. of Orig. Price
Received
Newport 37 + 19.4% 0.0% 0.0% 40.5% 74 93.8%
North Branch 243 + 23.4% 14.0% 7.0% 35.4% 92 96.0%
North Oaks 100 + 44.9% 25.0% 14.0% 5.0% 128 94.5%
North Saint Paul 176 + 6.7% 0.6% 8.5% 34.1% 86 94.1%
Northfield 286 - 2.7% 5.9% 26.6% 28.7% 109 94.6%
Norwood Young America 61 0.0% 11.5% 14.8% 29.5% 133 90.6%
Nowthen 55 - 9.8% 0.0% 0.0% 34.5% 102 96.0%
Oak Grove 109 - 2.7% 21.1% 0.0% 28.4% 81 96.6%
Oak Park Heights 47 - 4.1% 0.0% 21.3% 36.2% 133 95.0%
Oakdale 461 + 19.1% 1.3% 34.3% 28.2% 78 95.8%
Orono 175 + 8.7% 13.7% 13.1% 27.4% 168 93.3%
Osseo 36 + 28.6% 0.0% 16.7% 38.9% 90 93.0%
Otsego 412 + 31.2% 31.6% 22.3% 30.6% 75 98.3%
Pine City 119 + 3.5% 1.7% 2.5% 44.5% 135 92.8%
Pine Springs 2 - 50.0% 0.0% 0.0% 50.0% 97 97.6%
Plymouth 1,347 + 21.4% 14.6% 32.7% 14.5% 74 96.7%
Princeton 206 + 0.5% 1.0% 4.9% 42.7% 86 94.1%
Prior Lake 549 + 5.4% 17.7% 27.3% 19.9% 89 96.2%
Ramsey 437 + 17.8% 16.9% 23.8% 33.2% 73 97.4%
Randolph 11 + 37.5% 9.1% 0.0% 18.2% 114 91.8%
Red Wing 284 + 29.7% 0.7% 12.0% 27.5% 155 90.1%
Richfield 581 + 6.2% 0.3% 12.0% 22.9% 64 97.0%
River Falls 215 + 18.1% 9.8% 13.0% 26.0% 129 95.7%
Robbinsdale 273 + 1.9% 1.1% 11.7% 31.1% 80 93.9%
Rockford 52 - 11.9% 5.8% 5.8% 23.1% 59 97.4%
Rogers 215 + 32.7% 29.8% 16.7% 15.8% 64 97.6%
Rosemount 408 + 8.5% 10.8% 34.3% 29.2% 66 97.4%
Roseville 440 + 5.8% 2.0% 23.0% 18.6% 75 95.2%
Rush City 59 + 68.6% 6.8% 1.7% 33.9% 108 92.3%
Saint Anthony 121 + 26.0% 0.8% 38.8% 17.4% 68 95.5%
Saint Bonifacius 45 + 36.4% 0.0% 28.9% 37.8% 100 94.9%
Saint Cloud MSA 2,143 + 10.4% 3.7% 5.3% 21.6% 147 92.8%
Saint Francis 148 + 48.0% 4.1% 18.9% 43.2% 78 95.2%
Saint Louis Park 908 + 12.7% 1.8% 24.3% 17.1% 62 97.4%
Saint Mary's Point 8 + 300.0% 0.0% 0.0% 37.5% 223 97.3%
Saint Michael 284 + 13.1% 7.7% 22.5% 30.6% 75 96.1%
Saint Paul 3,586 + 2.8% 0.8% 12.4% 31.1% 88 95.3%
Saint Paul - Battle Creek / Highwood 285 + 6.3% 0.0% 7.7% 40.0% 81 96.6%
Saint Paul - Como Park 183 + 5.8% 0.5% 2.7% 15.8% 69 96.4%
Saint Paul - Dayton's Bluff 211 + 1.4% 0.5% 5.2% 40.3% 89 95.4%
Saint Paul - Downtown 125 0.0% 0.8% 96.8% 23.2% 140 94.4%
Saint Paul - Greater East Side 417 - 2.6% 1.2% 1.7% 42.7% 80 95.4%
Saint Paul - Hamline-Midway 135 0.0% 0.0% 0.7% 34.8% 62 96.7%
Saint Paul - Highland Park 339 + 1.2% 0.9% 13.3% 14.2% 70 95.8%
2013 Annual Report on the Twin Cities Housing Market
Current as of January 10, 2014. Sponsored by Royal Credit Union (www.RCU.org). All data from NorthstarMLS. Powered by 10K Research and Marketing. | 11
Area Overview – Around the Metro

TotalClosed Sales
Changefrom 2012
Percent New Construction
Percent Townhouse-
CondoPercent
Distressed
Cumulative Days on Market
Pct. of Orig. Price
Received
Saint Paul - Lexington-Hamline 166 + 9.9% 0.6% 6.0% 18.7% 89 94.7%
Saint Paul - Macalester-Groveland 314 + 12.1% 0.6% 8.9% 10.5% 69 96.7%
Saint Paul - North End / South Como 277 - 9.8% 0.4% 4.0% 41.5% 97 93.0%
Saint Paul - Payne-Phalen 351 + 7.0% 0.9% 1.4% 43.3% 92 95.1%
Saint Paul - St. Anthony Park 60 + 11.1% 8.3% 35.0% 13.3% 100 95.3%
Saint Paul - Summit Hill 91 + 11.0% 0.0% 36.3% 9.9% 179 91.9%
Saint Paul - Summit-University 185 + 20.9% 0.0% 44.3% 30.8% 113 94.5%
Saint Paul - Thomas-Dale 110 - 11.3% 1.8% 1.8% 48.2% 73 94.4%
Saint Paul - West Seventh 161 + 1.9% 0.0% 21.1% 31.7% 91 95.1%
Saint Paul - West Side 175 - 2.2% 1.7% 3.4% 43.4% 101 95.4%
Saint Paul Park 94 + 16.0% 7.4% 11.7% 39.4% 77 95.6%
Savage 566 + 8.2% 11.0% 25.1% 20.7% 72 96.9%
Scandia 45 - 18.2% 8.9% 0.0% 22.2% 165 93.5%
Shakopee 720 + 19.0% 3.3% 35.1% 33.2% 69 97.1%
Shoreview 403 + 3.9% 1.0% 38.5% 18.1% 72 96.3%
Shorewood 127 + 6.7% 7.1% 10.2% 12.6% 136 93.5%
Somerset 68 - 9.3% 2.9% 7.4% 47.1% 138 94.8%
South Haven 54 + 17.4% 0.0% 0.0% 24.1% 167 92.3%
South Saint Paul 311 - 14.6% 2.6% 5.5% 38.6% 71 96.4%
Spring Lake Park 95 - 15.9% 1.1% 22.1% 35.8% 63 96.7%
Spring Park 23 - 17.9% 0.0% 43.5% 8.7% 162 91.4%
Stacy 77 + 60.4% 19.5% 10.4% 31.2% 89 98.8%
Stillwater 384 + 10.3% 11.2% 24.2% 18.2% 110 95.4%
Sunfish Lake 7 0.0% 0.0% 0.0% 0.0% 175 84.6%
Tonka Bay 32 - 13.5% 0.0% 9.4% 12.5% 163 92.2%
Vadnais Heights 187 + 16.9% 0.5% 44.4% 29.4% 77 94.5%
Vermillion 2 - 33.3% 0.0% 0.0% 0.0% 178 92.2%
Victoria 223 + 22.5% 27.8% 25.6% 9.0% 103 96.6%
Waconia 247 + 21.7% 16.2% 16.6% 17.4% 82 95.7%
Watertown 90 + 42.9% 2.2% 4.4% 30.0% 100 94.6%
Wayzata 69 - 8.0% 4.3% 34.8% 10.1% 115 94.5%
West Saint Paul 262 - 2.6% 1.5% 22.5% 29.4% 84 95.1%
White Bear Lake 406 + 18.0% 1.7% 22.7% 26.4% 88 94.9%
Willernie 13 + 44.4% 0.0% 0.0% 30.8% 159 92.1%
Woodbury 1,416 + 26.3% 15.0% 37.9% 18.9% 68 97.4%
Woodland 9 - 40.0% 0.0% 0.0% 11.1% 234 84.8%
Wyoming 112 + 40.0% 13.4% 4.5% 25.9% 90 95.4%
Zimmerman 240 + 12.1% 3.8% 4.2% 44.6% 94 96.0%
Zumbrota 59 0.0% 1.7% 3.4% 15.3% 116 93.8%
2013 Annual Report on the Twin Cities Housing Market
Current as of January 10, 2014. Sponsored by Royal Credit Union (www.RCU.org). All data from NorthstarMLS. Powered by 10K Research and Marketing. | 12
Area Overview – Around the Metro

TotalClosed Sales
Changefrom 2012
Percent New Construction
Percent Townhouse-
CondoPercent
Distressed
Cumulative Days on Market
Pct. of Orig. Price
Received
Maple Plain 5,603 + 6.7% 2.0% 23.5% 23.9% 77 95.9%
Armatage 124 - 0.8% 0.8% 0.0% 9.7% 47 97.1%
Audubon Park 86 - 7.5% 0.0% 0.0% 29.1% 52 97.7%
Bancroft 72 + 2.9% 0.0% 8.3% 34.7% 66 97.3%
Beltrami 12 0.0% 0.0% 0.0% 41.7% 92 89.5%
Bottineau 9 - 64.0% 0.0% 66.7% 22.2% 27 104.0%
Bryant 49 - 2.0% 2.0% 0.0% 30.6% 76 97.5%
Bryn Mawr 54 + 8.0% 0.0% 7.4% 9.3% 78 94.9%
Calhoun (CARAG) 46 - 4.2% 0.0% 39.1% 15.2% 63 96.5%
Cedar-Isles-Dean 69 - 23.3% 23.2% 71.0% 21.7% 134 93.2%
Cedar-Riverside 21 + 23.5% 0.0% 100.0% 19.0% 178 92.7%
Central 84 + 42.4% 0.0% 3.6% 39.3% 77 96.4%
Cleveland 86 + 21.1% 0.0% 0.0% 43.0% 87 90.8%
Columbia Park 32 - 3.0% 3.1% 0.0% 28.1% 70 95.3%
Cooper 47 - 2.1% 0.0% 2.1% 6.4% 47 99.9%
Corcoran Neighborhood 56 + 16.7% 0.0% 5.4% 37.5% 76 94.8%
Diamond Lake 127 + 38.0% 0.0% 3.1% 12.6% 73 95.7%
Downtown East – Mpls 71 - 14.5% 11.3% 100.0% 5.6% 92 96.9%
Downtown West – Mpls 166 + 35.0% 1.8% 100.0% 25.9% 72 96.8%
East Calhoun 31 - 16.2% 0.0% 29.0% 19.4% 106 97.3%
East Harriet 57 + 11.8% 0.0% 21.1% 14.0% 124 95.3%
East Isles 56 + 47.4% 0.0% 62.5% 3.6% 129 92.5%
East Phillips 23 - 28.1% 4.3% 34.8% 47.8% 97 101.2%
Elliot Park 90 + 1.1% 21.1% 100.0% 16.7% 77 96.0%
Ericsson 86 + 22.9% 0.0% 0.0% 20.9% 48 96.9%
Field 57 + 18.8% 1.8% 0.0% 22.8% 64 97.9%
Folwell 127 + 21.0% 0.0% 6.3% 44.9% 105 90.2%
Fulton 155 - 1.9% 9.0% 0.6% 4.5% 66 98.2%
Hale 58 - 9.4% 1.7% 0.0% 8.6% 43 98.2%
Harrison 23 + 9.5% 0.0% 0.0% 56.5% 97 87.9%
Hawthorne 45 + 50.0% 6.7% 8.9% 35.6% 105 90.5%
Hiawatha 82 + 3.8% 4.9% 3.7% 18.3% 62 96.6%
Holland 60 + 22.4% 0.0% 8.3% 38.3% 90 98.6%
Howe 119 + 11.2% 0.0% 1.7% 23.5% 50 97.8%
Jordan Neighborhood 74 - 35.7% 0.0% 0.0% 50.0% 114 88.9%
Keewaydin 76 + 18.8% 2.6% 7.9% 18.4% 54 97.6%
Kenny 101 + 9.8% 0.0% 0.0% 2.0% 50 98.2%
Kenwood 23 - 11.5% 0.0% 4.3% 4.3% 121 95.2%
Kenyon 27 - 20.6% 0.0% 0.0% 25.9% 75 91.4%
Kingfield 118 - 9.2% 0.0% 15.3% 13.6% 57 97.1%
Lind-Bohanon 101 + 23.2% 1.0% 3.0% 49.5% 82 96.3%
Linden Hills 142 - 7.8% 6.3% 15.5% 9.2% 71 96.3%
Logan Park 29 + 61.1% 6.9% 58.6% 17.2% 50 98.3%
Longfellow 60 + 27.7% 1.7% 0.0% 23.3% 42 96.9%
2013 Annual Report on the Twin Cities Housing Market
Current as of January 10, 2014. Sponsored by Royal Credit Union (www.RCU.org). All data from NorthstarMLS. Powered by 10K Research and Marketing. | 13
Area Overview – Minneapolis Neighborhoods

TotalClosed Sales
Changefrom 2012
Percent New Construction
Percent Townhouse-
CondoPercent
Distressed
Cumulative Days on Market
Pct. of Orig. Price
Received
Loring Park 104 + 8.3% 0.0% 100.0% 7.7% 88 95.7%
Lowry Hill 65 - 5.8% 1.5% 47.7% 10.8% 171 91.4%
Lowry Hill East 46 + 17.9% 0.0% 63.0% 15.2% 72 94.4%
Lyndale 64 + 18.5% 0.0% 25.0% 23.4% 73 95.4%
Lynnhurst 109 0.0% 0.9% 0.0% 5.5% 52 97.1%
Marcy Holmes 41 - 4.7% 2.4% 80.5% 26.8% 102 94.6%
Marshall Terrace 12 - 33.3% 0.0% 0.0% 8.3% 68 96.7%
McKinley 60 + 30.4% 0.0% 0.0% 50.0% 85 89.7%
Midtown Phillips 28 - 34.9% 0.0% 17.9% 46.4% 93 89.2%
Minnehaha 97 + 6.6% 1.0% 14.4% 29.9% 62 96.9%
Morris Park 82 + 5.1% 1.2% 0.0% 37.8% 73 95.5%
Near North 37 + 27.6% 0.0% 18.9% 45.9% 85 94.0%
Nicollet Island - East Bank 65 + 22.6% 0.0% 100.0% 18.5% 105 95.7%
North Loop 188 + 28.8% 0.5% 100.0% 13.3% 64 97.4%
Northeast Park 13 - 7.1% 0.0% 0.0% 46.2% 104 97.8%
Northrup 99 + 10.0% 0.0% 5.1% 19.2% 60 97.7%
Page 32 - 5.9% 0.0% 0.0% 3.1% 46 97.3%
Phillips West 16 - 30.4% 0.0% 56.3% 31.3% 85 91.3%
Powderhorn Park 73 + 4.3% 1.4% 13.7% 24.7% 67 97.3%
Prospect Park 41 - 19.6% 2.4% 61.0% 12.2% 99 95.6%
Regina 47 - 2.1% 0.0% 6.4% 38.3% 85 96.9%
Seward 41 + 7.9% 0.0% 17.1% 9.8% 53 97.0%
Sheridan 18 - 10.0% 5.6% 11.1% 50.0% 82 94.6%
Shingle Creek 71 + 16.4% 1.4% 0.0% 50.7% 77 99.1%
Southeast Como 47 - 11.3% 10.6% 29.8% 14.9% 132 96.7%
St. Anthony East 20 + 17.6% 0.0% 30.0% 25.0% 54 95.9%
St. Anthony West 20 + 25.0% 0.0% 40.0% 15.0% 56 98.4%
Standish 141 + 6.8% 0.7% 3.5% 24.1% 76 99.0%
Stevens Square 29 + 3.6% 3.4% 93.1% 41.4% 101 93.7%
Sumner-Glenwood 19 + 46.2% 5.3% 84.2% 31.6% 146 95.3%
Tangletown 70 - 9.1% 0.0% 4.3% 12.9% 68 98.1%
University District 0 -- 0.0% 0.0% 0.0% 0 0.0%
Ventura Village 14 + 27.3% 0.0% 64.3% 57.1% 104 92.5%
Victory 105 + 1.9% 1.0% 0.0% 31.4% 79 93.9%
Waite Park 124 + 21.6% 0.8% 0.0% 24.2% 66 97.0%
Webber-Camden 95 + 1.1% 1.1% 0.0% 43.2% 103 92.2%
Wenonah 86 + 14.7% 0.0% 0.0% 33.7% 87 95.8%
West Calhoun 45 + 36.4% 2.2% 64.4% 17.8% 122 90.9%
Whittier 66 - 4.3% 1.5% 72.7% 27.3% 112 94.2%
Willard Hay 131 + 18.0% 0.8% 0.0% 46.6% 84 92.7%
Windom 51 + 15.9% 0.0% 2.0% 31.4% 112 92.4%
Windom Park 61 + 13.0% 0.9% 0.0% 55.0% 107 92.4%
2013 Annual Report on the Twin Cities Housing Market
Current as of January 10, 2014. Sponsored by Royal Credit Union (www.RCU.org). All data from NorthstarMLS. Powered by 10K Research and Marketing. | 14
Area Overview – Minneapolis Neighborhoods

TotalClosed Sales
Changefrom 2012
Percent New Construction
Percent Townhouse-
CondoPercent
Distressed
Cumulative Days on Market
Pct. of Orig. Price
Received
Baytown Township 21 - 19.2% 33.3% 0.0% 4.8% 101 96.0%
Belle Plaine Township 4 + 100.0% 0.0% 0.0% 25.0% 105 95.0%
Benton Township 2 - 100.0% 0.0% 0.0% 50.0% 109 -100.0%
Blakeley Township 3 -- 0.0% 0.0% 33.3% 133 81.2%
Camden Township 1 - 100.0% 0.0% 0.0% 0.0% 249 -100.0%
Castle Rock Township 10 + 400.0% 0.0% 0.0% 30.0% 162 88.6%
Cedar Lake Township 18 + 20.0% 16.7% 0.0% 27.8% 160 97.5%
Credit River Township 42 + 16.7% 11.9% 0.0% 21.4% 119 97.7%
Dahlgren Township 3 - 40.0% 0.0% 0.0% 0.0% 135 82.4%
Douglas Township 1 -- 0.0% 0.0% 0.0% 98 85.0%
Empire Township 16 - 50.0% 37.5% 31.3% 25.0% 61 100.3%
Eureka Township 21 + 75.0% 4.8% 0.0% 38.1% 129 85.9%
Greenvale Township 5 + 400.0% 0.0% 0.0% 60.0% 180 88.1%
Grey Cloud Island Township 0 -- 0.0% 0.0% 0.0% 0 0.0%
Hancock Township 0 -- 0.0% 0.0% 0.0% 0 0.0%
Hassan Township 0 -- 0.0% 0.0% 0.0% 0 0.0%
Helena Township 4 - 50.0% 50.0% 0.0% 50.0% 20 96.0%
Hollywood Township 2 + 100.0% 0.0% 0.0% 50.0% 300 97.1%
Jackson Township 18 0.0% 0.0% 0.0% 16.7% 285 87.7%
Laketown Township 14 + 40.0% 0.0% 0.0% 14.3% 155 92.2%
Linwood Township 59 - 3.3% 18.6% 0.0% 27.1% 132 96.6%
Louisville Township 4 + 33.3% 0.0% 0.0% 25.0% 55 90.0%
Marshan Township 4 + 300.0% 0.0% 0.0% 25.0% 111 92.7%
May Township 16 - 38.5% 0.0% 0.0% 6.3% 150 94.7%
New Market Township 7 - 56.3% 14.3% 0.0% 14.3% 100 86.2%
Nininger Township 5 + 25.0% 0.0% 0.0% 40.0% 90 92.1%
Randolph Township 0 -- 0.0% 0.0% 0.0% 0 0.0%
Ravenna Township 7 0.0% 0.0% 0.0% 42.9% 132 96.8%
San Francisco Township 1 - 75.0% 0.0% 0.0% 100.0% 643 82.3%
Sand Creek Township 4 + 100.0% 0.0% 0.0% 50.0% 122 91.9%
Sciota Township 0 -- 0.0% 0.0% 0.0% 0 0.0%
Spring Lake Township 15 0.0% 0.0% 0.0% 33.3% 171 98.1%
St. Lawrence Township 1 -- 0.0% 0.0% 100.0% 72 79.1%
Stillwater Township 14 - 39.1% 7.1% 0.0% 7.1% 114 91.2%
Vermillion Township 2 - 75.0% 0.0% 0.0% 0.0% 26 97.6%
Waconia Township 4 + 33.3% 0.0% 0.0% 25.0% 18 102.0%
Waterford Township 1 -- 0.0% 0.0% 0.0% 156 66.0%
Watertown Township 4 - 33.3% 0.0% 0.0% 50.0% 226 82.9%
West Lakeland Township 30 - 21.1% 0.0% 0.0% 23.3% 133 94.7%
White Bear Township 176 + 30.4% 6.3% 27.8% 29.0% 91 94.9%
Young America Township 2 - 60.0% 0.0% 0.0% 0.0% 179 100.8%
2013 Annual Report on the Twin Cities Housing Market
Current as of January 10, 2014. Sponsored by Royal Credit Union (www.RCU.org). All data from NorthstarMLS. Powered by 10K Research and Marketing. | 15
Area Overview – Townships

TotalClosed Sales
Changefrom 2012
Percent New Construction
Percent Townhouse-
CondoPercent
Distressed
Cumulative Days on Market
Pct. of Orig. Price
Received
Anoka County 5,294 + 7.5% 9.4% 19.6% 32.5% 74 96.9%
Carver County 1,848 + 14.6% 17.5% 22.5% 18.4% 92 96.2%
Chisago County 900 + 13.1% 12.0% 7.0% 33.6% 112 95.1%
Dakota County 6,336 + 4.9% 7.6% 32.1% 27.4% 74 96.7%
Goodhue County 639 + 19.4% 0.8% 10.3% 23.5% 149 91.4%
Hennepin County 19,107 + 7.9% 5.0% 24.5% 22.4% 78 96.1%
Isanti County 642 + 15.1% 4.5% 7.6% 50.9% 95 95.2%
Kanabec County 203 - 18.5% 0.5% 1.5% 41.4% 161 88.9%
Mille Lacs County 360 - 14.9% 0.6% 7.8% 36.9% 114 91.7%
Ramsey County 6,699 + 4.7% 1.8% 19.2% 28.0% 85 95.3%
Rice County 831 + 7.2% 3.0% 14.6% 33.5% 111 93.9%
Scott County 2,461 + 11.9% 9.4% 24.0% 26.7% 81 96.6%
Sherburne County 1,500 + 8.2% 7.9% 10.1% 36.1% 95 95.6%
St. Croix County 1,339 + 12.5% 6.6% 12.6% 28.0% 141 95.0%
Washington County 4,295 + 15.1% 9.7% 27.7% 23.9% 85 96.3%
Wright County 2,244 + 18.7% 13.2% 13.1% 29.5% 91 95.8%
2013 Annual Report on the Twin Cities Housing Market
Current as of January 10, 2014. Sponsored by Royal Credit Union (www.RCU.org). All data from NorthstarMLS. Powered by 10K Research and Marketing. | 16
Area Overview – Counties

2009 2010 2011 2012 2013Change
From 2012Change
From 2009
Twin Cities Region $165,000 $169,900 $150,000 $167,900 $192,000 + 14.4% + 16.4%
Afton $307,000 $330,000 $430,000 $275,000 $409,500 + 48.9% + 33.4%
Albertville $167,190 $150,200 $142,500 $149,950 $178,900 + 19.3% + 7.0%
Andover $205,000 $205,000 $182,000 $205,000 $227,500 + 11.0% + 11.0%
Annandale $154,700 $154,110 $153,889 $170,000 $159,000 - 6.5% + 2.8%
Anoka $130,000 $136,312 $113,500 $122,900 $146,950 + 19.6% + 13.0%
Apple Valley $170,500 $177,150 $149,950 $175,000 $195,000 + 11.4% + 14.4%
Arden Hills $232,250 $241,025 $157,500 $325,000 $300,300 - 7.6% + 29.3%
Bayport $186,000 $157,500 $147,000 $184,500 $200,000 + 8.4% + 7.5%
Becker $134,500 $131,950 $131,700 $149,375 $155,900 + 4.4% + 15.9%
Belle Plaine $149,900 $142,250 $137,300 $145,000 $159,000 + 9.7% + 6.1%
Bethel $140,000 $147,600 $100,000 $115,950 $135,000 + 16.4% - 3.6%
Big Lake $135,900 $140,000 $117,500 $134,900 $154,500 + 14.5% + 13.7%
Birchwood Village $299,000 $0 $240,500 $227,900 $287,375 + 26.1% - 3.9%
Blaine $169,900 $170,500 $154,900 $175,000 $199,500 + 14.0% + 17.4%
Bloomington $181,200 $178,322 $157,000 $171,000 $193,050 + 12.9% + 6.5%
Bloomington – East $157,250 $157,000 $140,000 $145,300 $169,350 + 16.6% + 7.7%
Bloomington – West $210,000 $206,950 $181,725 $191,000 $215,000 + 12.6% + 2.4%
Brainerd MSA $142,250 $151,000 $145,000 $154,000 $160,000 + 3.9% + 12.5%
Brooklyn Center $90,000 $110,000 $82,300 $95,000 $122,000 + 28.4% + 35.6%
Brooklyn Park $134,020 $140,000 $127,000 $146,000 $167,000 + 14.4% + 24.6%
Buffalo $145,500 $150,000 $131,500 $141,000 $171,810 + 21.9% + 18.1%
Burnsville $175,000 $167,000 $147,750 $165,300 $185,000 + 11.9% + 5.7%
Cambridge $110,125 $105,000 $94,000 $101,300 $127,000 + 25.4% + 15.3%
Cannon Falls $146,500 $139,450 $121,450 $145,000 $177,500 + 22.4% + 21.2%
Carver $237,950 $225,900 $225,000 $245,000 $282,500 + 15.3% + 18.7%
Centerville $222,000 $180,000 $154,600 $180,000 $189,950 + 5.5% - 14.4%
Champlin $162,000 $172,078 $148,000 $159,400 $182,700 + 14.6% + 12.8%
Chanhassen $287,500 $313,500 $297,500 $280,500 $303,500 + 8.2% + 5.6%
Chaska $177,500 $210,750 $170,000 $207,500 $252,000 + 21.4% + 42.0%
Chisago $175,000 $159,500 $155,700 $168,500 $199,850 + 18.6% + 14.2%
Circle Pines $148,750 $139,900 $124,150 $139,450 $144,300 + 3.5% - 3.0%
Clear Lake $113,000 $168,950 $146,800 $152,450 $162,700 + 6.7% + 44.0%
Clearwater $122,000 $159,900 $127,750 $150,000 $160,000 + 6.7% + 31.1%
Coates $0 $0 $0 $0 $0 -- --
Cokato $120,000 $99,000 $107,500 $105,000 $129,900 + 23.7% + 8.3%
Cologne $205,013 $193,000 $189,900 $182,550 $181,500 - 0.6% - 11.5%
Columbia Heights $122,500 $120,000 $101,500 $99,950 $132,000 + 32.1% + 7.8%
Columbus $222,000 $232,000 $177,277 $208,500 $202,800 - 2.7% - 8.6%
Coon Rapids $136,500 $133,000 $114,900 $125,105 $150,000 + 19.9% + 9.9%
Corcoran $315,000 $291,500 $246,000 $230,000 $300,000 + 30.4% - 4.8%
Cottage Grove $180,000 $174,450 $160,000 $174,650 $194,000 + 11.1% + 7.8%
Crystal $139,950 $139,900 $105,000 $127,550 $149,500 + 17.2% + 6.8%
Dayton $197,000 $205,000 $142,000 $191,500 $274,000 + 43.1% + 39.1%
Median Prices – Around the Metro2013 Annual Report on the Twin Cities Housing Market
Current as of January 10, 2014. Sponsored by Royal Credit Union (www.RCU.org). All data from NorthstarMLS. Powered by 10K Research and Marketing. | 17

2009 2010 2011 2012 2013Change
From 2012Change
From 2009
Deephaven $545,000 $509,000 $322,000 $493,250 $518,500 + 5.1% - 4.9%
Delano $201,500 $195,000 $173,150 $205,500 $230,000 + 11.9% + 14.1%
Dellwood $462,500 $617,575 $499,000 $360,000 $507,500 + 41.0% + 9.7%
Eagan $182,150 $189,000 $170,950 $193,990 $220,000 + 13.4% + 20.8%
East Bethel $158,950 $150,400 $162,500 $165,000 $179,900 + 9.0% + 13.2%
Eden Prairie $250,000 $264,800 $257,110 $257,000 $280,000 + 8.9% + 12.0%
Edina $324,900 $339,000 $339,000 $343,875 $350,000 + 1.8% + 7.7%
Elk River $158,000 $160,000 $132,000 $157,000 $171,500 + 9.2% + 8.5%
Elko New Market $230,000 $209,900 $193,000 $215,000 $247,627 + 15.2% + 7.7%
Excelsior $332,450 $277,000 $350,000 $291,500 $409,750 + 40.6% + 23.3%
Falcon Heights $267,500 $239,500 $207,500 $228,706 $244,000 + 6.7% - 8.8%
Faribault $115,500 $118,500 $100,000 $115,000 $128,450 + 11.7% + 11.2%
Farmington $175,600 $172,000 $140,500 $163,000 $192,250 + 17.9% + 9.5%
Forest Lake $142,000 $135,450 $153,750 $185,000 $191,000 + 3.2% + 34.5%
Fridley $138,900 $136,545 $120,000 $127,000 $153,500 + 20.9% + 10.5%
Gem Lake $302,500 $225,450 $240,000 $352,261 $169,450 - 51.9% - 44.0%
Golden Valley $220,000 $235,500 $199,000 $218,500 $246,000 + 12.6% + 11.8%
Grant $432,500 $395,000 $422,500 $367,500 $415,500 + 13.1% - 3.9%
Greenfield $153,250 $237,750 $373,000 $350,000 $354,000 + 1.1% + 131.0%
Greenwood $796,750 $659,900 $755,000 $675,000 $921,500 + 36.5% + 15.7%
Ham Lake $235,500 $227,500 $211,500 $230,000 $271,600 + 18.1% + 15.3%
Hamburg $124,900 $102,450 $75,200 $111,500 $95,500 - 14.3% - 23.5%
Hammond $127,500 $116,500 $115,750 $121,450 $144,000 + 18.6% + 12.9%
Hampton $173,875 $189,950 $172,000 $138,500 $217,250 + 56.9% + 24.9%
Hanover $229,900 $208,875 $214,950 $211,000 $239,950 + 13.7% + 4.4%
Hastings $150,000 $148,500 $128,500 $142,000 $169,900 + 19.6% + 13.3%
Hilltop $120,000 $35,000 $0 $24,500 $34,500 + 40.8% - 71.3%
Hopkins $160,000 $148,000 $125,000 $159,950 $180,500 + 12.8% + 12.8%
Hudson $195,000 $194,848 $184,500 $195,000 $228,500 + 17.2% + 17.2%
Hugo $154,900 $158,338 $137,000 $164,199 $195,000 + 18.8% + 25.9%
Hutchinson $124,950 $127,950 $115,000 $111,500 $125,000 + 12.1% + 0.0%
Independence $306,500 $433,500 $247,950 $387,250 $405,000 + 4.6% + 32.1%
Inver Grove Heights $165,751 $165,500 $155,000 $160,000 $194,950 + 21.8% + 17.6%
Isanti $120,950 $114,114 $91,500 $117,000 $125,000 + 6.8% + 3.3%
Jordan $204,000 $174,150 $178,000 $177,000 $214,500 + 21.2% + 5.1%
Lake Elmo $405,250 $369,500 $374,800 $367,500 $374,900 + 2.0% - 7.5%
Lake Minnetonka Area $337,900 $341,250 $329,860 $339,000 $370,000 + 9.1% + 9.5%
Lake St. Croix Beach $158,000 $154,850 $85,250 $180,000 $139,000 - 22.8% - 12.0%
Lakeland $169,000 $211,000 $221,000 $195,500 $204,990 + 4.9% + 21.3%
Lakeland Shores $270,000 $738,100 $178,139 $270,000 $265,000 - 1.9% - 1.9%
Lakeville $224,188 $225,000 $205,000 $226,000 $258,000 + 14.2% + 15.1%
Lauderdale $189,950 $173,900 $128,150 $168,000 $175,000 + 4.2% - 7.9%
Lexington $138,250 $130,000 $108,563 $136,950 $149,900 + 9.5% + 8.4%
Lilydale $180,000 $201,500 $177,500 $190,000 $200,250 + 5.4% + 11.3%
2013 Annual Report on the Twin Cities Housing Market
Median Prices – Around the Metro
Current as of January 10, 2014. Sponsored by Royal Credit Union (www.RCU.org). All data from NorthstarMLS. Powered by 10K Research and Marketing. | 18

2009 2010 2011 2012 2013Change
From 2012Change
From 2009
Lindstrom $180,000 $150,000 $143,900 $140,000 $160,025 + 14.3% - 11.1%
Lino Lakes $218,950 $211,250 $174,200 $208,375 $229,900 + 10.3% + 5.0%
Little Canada $175,250 $106,500 $140,000 $175,000 $184,250 + 5.3% + 5.1%
Long Lake $197,450 $198,500 $186,500 $227,500 $231,500 + 1.8% + 17.2%
Lonsdale $160,750 $150,000 $135,000 $144,900 $171,000 + 18.0% + 6.4%
Loretto $190,800 $215,572 $217,875 $130,000 $199,900 + 53.8% + 4.8%
Mahtomedi $199,000 $249,995 $257,500 $249,900 $245,000 - 2.0% + 23.1%
Maple Grove $222,000 $258,000 $214,000 $219,453 $232,750 + 6.1% + 4.8%
Maple Lake $100,000 $100,000 $112,840 $134,950 $145,000 + 7.4% + 45.0%
Maple Plain $161,250 $166,700 $153,500 $187,450 $178,750 - 4.6% + 10.9%
Maplewood $162,000 $156,000 $139,400 $145,000 $165,000 + 13.8% + 1.9%
Marine on St. Croix $283,500 $272,500 $242,000 $274,450 $320,000 + 16.6% + 12.9%
Mayer $169,900 $174,950 $169,900 $164,405 $189,900 + 15.5% + 11.8%
Medicine Lake $0 $600,000 $315,000 $650,000 $542,000 - 16.6% --
Medina $580,000 $615,000 $525,000 $460,000 $527,500 + 14.7% - 9.1%
Mendota $0 $493,500 $80,000 $154,500 $287,000 + 85.8% --
Mendota Heights $289,450 $305,000 $286,500 $272,000 $282,500 + 3.9% - 2.4%
Miesville $0 $165,350 $0 $140,000 $231,671 + 65.5% --
Minneapolis - (Citywide) $145,000 $160,000 $140,000 $165,000 $189,075 + 14.6% + 30.4%
Minneapolis - Calhoun-Isle $272,750 $315,000 $267,021 $300,000 $327,780 + 9.3% + 20.2%
Minneapolis - Camden $49,000 $66,002 $45,000 $59,500 $77,000 + 29.4% + 57.1%
Minneapolis - Central $237,500 $225,000 $214,250 $220,000 $247,500 + 12.5% + 4.2%
Minneapolis - Longfellow $172,000 $170,500 $147,500 $169,000 $185,200 + 9.6% + 7.7%
Minneapolis - Near North $36,950 $55,000 $43,000 $60,000 $81,000 + 35.0% + 119.2%
Minneapolis - Nokomis $189,892 $195,200 $162,700 $176,500 $199,900 + 13.3% + 5.3%
Minneapolis - Northeast $150,000 $151,500 $125,000 $140,000 $169,900 + 21.4% + 13.3%
Minneapolis - Phillips $78,000 $110,000 $72,500 $88,000 $90,225 + 2.5% + 15.7%
Minneapolis - Powderhorn $123,950 $135,000 $110,000 $116,400 $157,500 + 35.3% + 27.1%
Minneapolis - Southwest $260,000 $276,000 $264,450 $277,000 $306,000 + 10.5% + 17.7%
Minneapolis - University $215,000 $207,950 $205,250 $209,950 $221,500 + 5.5% + 3.0%
Minnetonka $245,000 $265,713 $233,000 $255,000 $278,950 + 9.4% + 13.9%
Minnetonka Beach $2,700,000 $825,000 $1,130,000 $675,000 $892,500 + 32.2% - 66.9%
Minnetrista $346,639 $325,086 $349,950 $385,000 $435,000 + 13.0% + 25.5%
Monticello $133,000 $135,000 $124,000 $137,095 $155,990 + 13.8% + 17.3%
Montrose $133,943 $131,371 $114,950 $130,357 $149,000 + 14.3% + 11.2%
Mora $87,700 $79,900 $84,400 $86,500 $98,000 + 13.3% + 11.7%
Mound $181,000 $188,000 $150,000 $169,000 $192,750 + 14.1% + 6.5%
Mounds View $153,000 $166,700 $134,950 $139,500 $163,000 + 16.8% + 6.5%
New Brighton $187,000 $178,000 $157,500 $165,000 $171,000 + 3.6% - 8.6%
New Germany $109,000 $105,000 $110,000 $100,000 $142,450 + 42.5% + 30.7%
New Hope $158,250 $148,000 $126,125 $155,000 $173,000 + 11.6% + 9.3%
New Prague $170,000 $161,250 $143,000 $174,000 $195,000 + 12.1% + 14.7%
New Richmond $139,950 $135,400 $110,000 $124,900 $137,850 + 10.4% - 1.5%
New Trier $0 $149,900 $0 $75,000 $63,700 - 15.1% --
2013 Annual Report on the Twin Cities Housing Market
Median Prices – Around the Metro
Current as of January 10, 2014. Sponsored by Royal Credit Union (www.RCU.org). All data from NorthstarMLS. Powered by 10K Research and Marketing. | 19

2009 2010 2011 2012 2013Change
From 2012Change
From 2009
Newport $127,400 $123,500 $72,175 $98,500 $141,000 + 43.1% + 10.7%
North Branch $144,350 $136,000 $115,000 $123,650 $150,000 + 21.3% + 3.9%
North Oaks $475,000 $584,000 $480,000 $510,000 $625,000 + 22.5% + 31.6%
North Saint Paul $160,000 $145,000 $120,000 $139,950 $151,000 + 7.9% - 5.6%
Northfield $165,000 $159,900 $144,550 $157,250 $182,500 + 16.1% + 10.6%
Norwood Young America $134,500 $155,450 $119,900 $128,912 $146,000 + 13.3% + 8.6%
Nowthen $230,000 $216,000 $180,000 $209,500 $234,500 + 11.9% + 2.0%
Oak Grove $207,000 $200,450 $175,000 $200,825 $229,000 + 14.0% + 10.6%
Oak Park Heights $127,000 $136,100 $130,000 $134,799 $176,200 + 30.7% + 38.7%
Oakdale $159,900 $164,600 $133,000 $134,950 $164,000 + 21.5% + 2.6%
Orono $595,000 $565,000 $532,500 $377,223 $501,000 + 32.8% - 15.8%
Osseo $146,250 $136,000 $115,000 $153,950 $141,950 - 7.8% - 2.9%
Otsego $159,900 $160,610 $159,900 $163,450 $194,150 + 18.8% + 21.4%
Pine City $122,500 $100,000 $81,500 $105,260 $111,275 + 5.7% - 9.2%
Pine Springs $485,000 $390,000 $300,000 $271,500 $320,000 + 17.9% - 34.0%
Plymouth $253,500 $249,000 $245,000 $275,500 $301,500 + 9.4% + 18.9%
Princeton $103,160 $113,900 $111,000 $105,000 $140,000 + 33.3% + 35.7%
Prior Lake $234,500 $223,900 $211,000 $227,500 $270,100 + 18.7% + 15.2%
Ramsey $152,250 $156,830 $137,000 $153,000 $182,900 + 19.5% + 20.1%
Randolph $169,400 $198,900 $168,937 $139,950 $195,900 + 40.0% + 15.6%
Red Wing $139,900 $125,000 $119,850 $127,500 $126,900 - 0.5% - 9.3%
Richfield $165,000 $160,000 $140,250 $155,000 $174,900 + 12.8% + 6.0%
River Falls $165,000 $172,500 $143,600 $151,000 $168,500 + 11.6% + 2.1%
Robbinsdale $145,000 $131,500 $104,750 $123,500 $140,000 + 13.4% - 3.4%
Rockford $192,500 $169,800 $130,000 $154,000 $197,400 + 28.2% + 2.5%
Rogers $226,825 $212,000 $210,000 $236,000 $265,000 + 12.3% + 16.8%
Rosemount $193,500 $201,500 $170,000 $180,000 $215,000 + 19.4% + 11.1%
Roseville $198,000 $190,000 $158,500 $187,450 $197,535 + 5.4% - 0.2%
Rush City $87,000 $95,000 $113,000 $92,000 $122,750 + 33.4% + 41.1%
Saint Anthony $210,000 $181,000 $178,200 $154,950 $179,950 + 16.1% - 14.3%
Saint Bonifacius $170,000 $178,850 $145,000 $189,500 $185,500 - 2.1% + 9.1%
Saint Cloud MSA $135,200 $135,000 $127,000 $135,000 $144,500 + 7.0% + 6.9%
Saint Francis $133,000 $135,000 $122,100 $130,000 $149,450 + 15.0% + 12.4%
Saint Louis Park $212,500 $213,250 $185,000 $198,450 $219,000 + 10.4% + 3.1%
Saint Mary's Point $235,000 $134,500 $1,100,000 $170,500 $258,800 + 51.8% + 10.1%
Saint Michael $179,950 $165,000 $165,000 $183,363 $199,450 + 8.8% + 10.8%
Saint Paul $117,500 $121,250 $100,000 $120,000 $144,000 + 20.0% + 22.6%
Saint Paul - Battle Creek / Highwood $116,000 $121,500 $89,700 $111,950 $135,050 + 20.6% + 16.4%
Saint Paul - Como Park $199,900 $190,400 $145,000 $170,000 $190,000 + 11.8% - 5.0%
Saint Paul - Dayton's Bluff $60,000 $74,950 $50,000 $59,450 $92,900 + 56.3% + 54.8%
Saint Paul - Downtown $140,000 $152,500 $128,250 $136,500 $157,975 + 15.7% + 12.8%
Saint Paul - Greater East Side $103,000 $102,000 $85,000 $88,900 $115,750 + 30.2% + 12.4%
Saint Paul - Hamline-Midway $149,450 $142,000 $104,500 $126,350 $149,125 + 18.0% - 0.2%
Saint Paul - Highland Park $225,000 $232,250 $235,000 $229,900 $249,500 + 8.5% + 10.9%
2013 Annual Report on the Twin Cities Housing Market
Median Prices – Around the Metro
Current as of January 10, 2014. Sponsored by Royal Credit Union (www.RCU.org). All data from NorthstarMLS. Powered by 10K Research and Marketing. | 20

2009 2010 2011 2012 2013Change
From 2012Change
From 2009
Saint Paul - Lexington-Hamline $214,900 $217,000 $210,000 $240,000 $229,900 - 4.2% + 7.0%
Saint Paul - Macalester-Groveland $240,000 $250,000 $228,750 $235,000 $264,250 + 12.4% + 10.1%
Saint Paul - North End / South Como $75,000 $76,250 $57,313 $74,050 $99,900 + 34.9% + 33.2%
Saint Paul - Payne-Phalen $70,000 $82,000 $65,000 $80,500 $101,000 + 25.5% + 44.3%
Saint Paul - St. Anthony Park $258,000 $216,750 $180,000 $190,000 $259,500 + 36.6% + 0.6%
Saint Paul - Summit Hill $315,000 $377,500 $325,000 $288,000 $341,450 + 18.6% + 8.4%
Saint Paul - Summit-University $125,000 $157,325 $130,000 $148,750 $170,000 + 14.3% + 36.0%
Saint Paul - Thomas-Dale $49,500 $65,450 $45,000 $55,000 $80,950 + 47.2% + 63.5%
Saint Paul - West Seventh $148,450 $142,900 $103,626 $121,000 $145,000 + 19.8% - 2.3%
Saint Paul - West Side $91,000 $113,000 $82,000 $90,000 $122,000 + 35.6% + 34.1%
Saint Paul Park $129,900 $134,600 $117,000 $127,750 $145,200 + 13.7% + 11.8%
Savage $210,000 $200,000 $186,500 $208,000 $235,000 + 13.0% + 11.9%
Scandia $255,000 $235,000 $240,000 $247,870 $290,000 + 17.0% + 13.7%
Shakopee $175,000 $180,000 $154,900 $167,000 $193,000 + 15.6% + 10.3%
Shoreview $204,950 $205,000 $180,000 $191,000 $222,500 + 16.5% + 8.6%
Shorewood $356,200 $359,288 $349,950 $414,900 $425,000 + 2.4% + 19.3%
Somerset $136,400 $130,950 $127,000 $119,900 $144,500 + 20.5% + 5.9%
South Haven $160,000 $215,500 $187,500 $153,500 $184,950 + 20.5% + 15.6%
South Saint Paul $130,250 $131,500 $114,995 $112,000 $139,900 + 24.9% + 7.4%
Spring Lake Park $136,500 $131,000 $92,250 $118,000 $141,000 + 19.5% + 3.3%
Spring Park $270,000 $266,500 $199,900 $352,500 $272,500 - 22.7% + 0.9%
Stacy $153,450 $138,500 $139,000 $108,750 $181,750 + 67.1% + 18.4%
Stillwater $208,500 $230,000 $208,000 $216,000 $234,000 + 8.3% + 12.2%
Sunfish Lake $830,000 $300,000 $550,320 $685,000 $819,000 + 19.6% - 1.3%
Tonka Bay $525,000 $495,000 $550,000 $797,500 $477,500 - 40.1% - 9.0%
Vadnais Heights $153,500 $165,000 $165,000 $149,900 $167,250 + 11.6% + 9.0%
Vermillion $169,900 $145,013 $153,500 $187,500 $157,500 - 16.0% - 7.3%
Victoria $330,375 $374,695 $351,250 $344,123 $371,500 + 8.0% + 12.4%
Waconia $199,700 $213,500 $187,500 $204,250 $228,500 + 11.9% + 14.4%
Watertown $175,263 $159,500 $118,000 $153,000 $175,000 + 14.4% - 0.2%
Wayzata $500,000 $439,000 $426,000 $427,500 $348,000 - 18.6% - 30.4%
West Saint Paul $126,500 $136,500 $120,000 $125,700 $142,750 + 13.6% + 12.8%
White Bear Lake $167,000 $175,000 $148,500 $161,950 $178,500 + 10.2% + 6.9%
Willernie $70,000 $117,699 $77,000 $141,500 $128,900 - 8.9% + 84.1%
Woodbury $239,000 $243,750 $219,700 $240,000 $267,000 + 11.3% + 11.7%
Woodland $847,500 $561,000 $1,065,000 $700,000 $370,000 - 47.1% - 56.3%
Wyoming $165,000 $156,700 $150,000 $163,750 $190,000 + 16.0% + 15.2%
Zimmerman $135,000 $143,700 $118,000 $130,000 $151,250 + 16.3% + 12.0%
Zumbrota $154,000 $129,700 $132,950 $149,900 $155,000 + 3.4% + 0.6%
2013 Annual Report on the Twin Cities Housing Market
Median Prices – Around the Metro
Current as of January 10, 2014. Sponsored by Royal Credit Union (www.RCU.org). All data from NorthstarMLS. Powered by 10K Research and Marketing. | 21

2009 2010 2011 2012 2013Change
From 2012Change
From 2009
Minneapolis $145,000 $160,000 $140,000 $165,000 $189,075 + 14.6% + 30.4%
Armatage $231,500 $225,000 $203,750 $218,000 $250,000 + 14.7% + 8.0%
Audubon Park $169,400 $169,500 $137,275 $144,259 $166,450 + 15.4% - 1.7%
Bancroft $151,500 $153,750 $128,500 $143,500 $165,000 + 15.0% + 8.9%
Beltrami $115,000 $116,000 $100,450 $72,500 $131,000 + 80.7% + 13.9%
Bottineau $89,000 $156,500 $80,001 $132,000 $217,500 + 64.8% + 144.4%
Bryant $115,000 $121,450 $110,000 $120,369 $135,500 + 12.6% + 17.8%
Bryn Mawr $254,000 $306,000 $317,000 $278,000 $306,000 + 10.1% + 20.5%
Calhoun (CARAG) $265,500 $203,500 $195,000 $198,143 $267,450 + 35.0% + 0.7%
Cedar-Isles-Dean $385,000 $315,000 $320,000 $302,750 $306,000 + 1.1% - 20.5%
Cedar-Riverside $109,500 $111,950 $116,950 $119,050 $123,000 + 3.3% + 12.3%
Central $71,600 $118,950 $78,450 $89,000 $140,000 + 57.3% + 95.5%
Cleveland $78,000 $87,000 $50,000 $74,000 $84,400 + 14.1% + 8.2%
Columbia Park $105,000 $138,200 $120,718 $127,000 $147,250 + 15.9% + 40.2%
Cooper $192,000 $194,000 $165,000 $202,500 $232,450 + 14.8% + 21.1%
Corcoran Neighborhood $136,000 $145,500 $99,900 $105,000 $140,000 + 33.3% + 2.9%
Diamond Lake $223,700 $226,950 $195,000 $210,000 $245,000 + 16.7% + 9.5%
Downtown East – Mpls $374,243 $369,861 $415,500 $412,500 $462,500 + 12.1% + 23.6%
Downtown West – Mpls $180,000 $183,000 $165,000 $184,900 $210,000 + 13.6% + 16.7%
East Calhoun $234,750 $416,500 $397,500 $407,500 $509,500 + 25.0% + 117.0%
East Harriet $289,950 $298,500 $290,000 $268,000 $297,750 + 11.1% + 2.7%
East Isles $278,000 $244,500 $275,000 $299,000 $305,000 + 2.0% + 9.7%
East Phillips $59,000 $108,000 $55,000 $82,650 $81,250 - 1.7% + 37.7%
Elliot Park $255,000 $239,850 $220,000 $182,500 $229,500 + 25.8% - 10.0%
Ericsson $198,948 $197,750 $160,750 $175,000 $208,000 + 18.9% + 4.5%
Field $198,750 $192,500 $180,000 $185,750 $195,000 + 5.0% - 1.9%
Folwell $35,000 $45,000 $30,325 $44,034 $60,000 + 36.3% + 71.4%
Fulton $315,000 $303,905 $336,000 $349,000 $403,500 + 15.6% + 28.1%
Hale $277,550 $255,000 $249,000 $266,000 $281,500 + 5.8% + 1.4%
Harrison $42,000 $84,900 $76,450 $65,000 $89,000 + 36.9% + 111.9%
Hawthorne $37,300 $54,900 $46,500 $57,500 $90,000 + 56.5% + 141.3%
Hiawatha $182,000 $161,500 $150,400 $165,000 $184,000 + 11.5% + 1.1%
Holland $84,000 $118,500 $63,575 $100,000 $127,290 + 27.3% + 51.5%
Howe $175,000 $164,000 $125,900 $165,000 $179,900 + 9.0% + 2.8%
Jordan Neighborhood $29,000 $40,000 $29,000 $50,000 $45,625 - 8.8% + 57.3%
Keewaydin $207,000 $215,250 $161,775 $189,250 $207,500 + 9.6% + 0.2%
Kenny $242,500 $251,000 $242,500 $246,950 $256,850 + 4.0% + 5.9%
Kenwood $885,000 $817,500 $682,500 $760,000 $786,180 + 3.4% - 11.2%
Kenyon $107,000 $90,000 $68,300 $62,750 $86,000 + 37.1% - 19.6%
Kingfield $189,900 $224,900 $176,500 $227,000 $248,950 + 9.7% + 31.1%
Lind-Bohanon $51,838 $79,000 $50,000 $54,250 $82,500 + 52.1% + 59.1%
Linden Hills $330,000 $373,000 $347,500 $373,750 $415,000 + 11.0% + 25.8%
Logan Park $152,500 $180,500 $129,250 $153,850 $200,000 + 30.0% + 31.1%
Longfellow $152,000 $158,200 $121,000 $155,000 $174,900 + 12.8% + 15.1%
2013 Annual Report on the Twin Cities Housing Market
Median Prices – Minneapolis Neighborhoods
Current as of January 10, 2014. Sponsored by Royal Credit Union (www.RCU.org). All data from NorthstarMLS. Powered by 10K Research and Marketing. | 22

2009 2010 2011 2012 2013Change
From 2012Change
From 2009
Loring Park $179,900 $200,000 $169,000 $157,450 $210,000 + 33.4% + 16.7%
Lowry Hill $273,222 $455,000 $239,900 $494,500 $562,300 + 13.7% + 105.8%
Lowry Hill East $103,500 $200,000 $233,050 $236,500 $255,000 + 7.8% + 146.4%
Lyndale $125,125 $149,000 $125,000 $121,000 $179,000 + 47.9% + 43.1%
Lynnhurst $399,900 $448,716 $418,000 $414,500 $435,000 + 4.9% + 8.8%
Marcy Holmes $243,000 $438,750 $312,000 $299,900 $238,400 - 20.5% - 1.9%
Marshall Terrace $125,000 $124,000 $68,650 $128,000 $157,500 + 23.0% + 26.0%
McKinley $27,000 $39,000 $35,000 $44,450 $61,250 + 37.8% + 126.9%
Midtown Phillips $85,550 $118,000 $84,850 $94,900 $102,400 + 7.9% + 19.7%
Minnehaha $169,000 $169,000 $144,000 $149,000 $174,900 + 17.4% + 3.5%
Morris Park $112,000 $152,250 $109,950 $125,000 $150,000 + 20.0% + 33.9%
Near North $55,000 $70,550 $37,756 $63,750 $85,000 + 33.3% + 54.5%
Nicollet Island - East Bank $269,950 $250,000 $300,000 $322,500 $393,000 + 21.9% + 45.6%
North Loop $249,900 $249,000 $224,400 $261,500 $274,990 + 5.2% + 10.0%
Northeast Park $144,400 $150,450 $52,000 $88,875 $135,000 + 51.9% - 6.5%
Northrup $195,000 $206,450 $182,000 $195,000 $207,530 + 6.4% + 6.4%
Page $285,000 $293,750 $254,500 $306,000 $321,525 + 5.1% + 12.8%
Phillips West $88,000 $106,700 $50,000 $69,250 $98,625 + 42.4% + 12.1%
Powderhorn Park $104,900 $113,750 $73,250 $99,900 $137,000 + 37.1% + 30.6%
Prospect Park $213,500 $220,000 $229,750 $230,000 $261,250 + 13.6% + 22.4%
Regina $118,500 $164,900 $107,000 $133,241 $155,000 + 16.3% + 30.8%
Seward $170,950 $197,200 $161,000 $171,300 $185,000 + 8.0% + 8.2%
Sheridan $86,750 $136,000 $89,000 $111,500 $134,000 + 20.2% + 54.5%
Shingle Creek $72,500 $98,884 $55,000 $60,225 $90,000 + 49.4% + 24.1%
Southeast Como $189,000 $168,000 $157,000 $149,900 $170,000 + 13.4% - 10.1%
St. Anthony East $143,750 $179,900 $120,550 $154,771 $168,000 + 8.5% + 16.9%
St. Anthony West $249,575 $221,000 $207,250 $171,750 $237,500 + 38.3% - 4.8%
Standish $165,000 $155,500 $128,500 $142,000 $169,950 + 19.7% + 3.0%
Stevens Square $103,900 $60,000 $62,950 $104,000 $120,000 + 15.4% + 15.5%
Sumner-Glenwood $182,500 $155,000 $170,550 $201,500 $220,500 + 9.4% + 20.8%
Tangletown $257,150 $315,000 $330,000 $320,000 $320,500 + 0.2% + 24.6%
University District $210,000 $225,000 $0 $0 $0 -- - 100.0%
Ventura Village $100,500 $79,450 $57,900 $66,100 $82,775 + 25.2% - 17.6%
Victory $85,000 $115,000 $85,200 $96,250 $129,000 + 34.0% + 51.8%
Waite Park $174,200 $168,000 $137,588 $159,150 $189,000 + 18.8% + 8.5%
Webber-Camden $40,000 $61,000 $42,000 $47,500 $62,000 + 30.5% + 55.0%
Wenonah $176,000 $171,200 $143,000 $152,500 $176,000 + 15.4% 0.0%
West Calhoun $365,000 $567,500 $101,000 $163,250 $173,250 + 6.1% - 52.5%
Whittier $114,780 $100,000 $107,000 $84,500 $151,500 + 79.3% + 32.0%
Willard Hay $40,000 $66,450 $51,750 $67,000 $97,000 + 44.8% + 142.5%
Windom $196,750 $226,225 $163,832 $185,915 $218,900 + 17.7% + 11.3%
Windom Park $172,000 $146,000 $164,163 $163,500 $188,000 + 15.0% + 9.3%
2013 Annual Report on the Twin Cities Housing Market
Median Prices – Minneapolis Neighborhoods
Current as of January 10, 2014. Sponsored by Royal Credit Union (www.RCU.org). All data from NorthstarMLS. Powered by 10K Research and Marketing. | 23

2009 2010 2011 2012 2013Change
From 2012Change
From 2009
Baytown Township $425,000 $547,900 $455,000 $509,167 $525,000 + 3.1% + 23.5%
Belle Plaine Township $142,750 $65,000 $212,500 $216,000 $330,000 + 52.8% + 131.2%
Benton Township $0 $0 $165,000 $0 $122,950 -- --
Blakeley Township $205,000 $0 $0 $0 $180,000 -- - 12.2%
Camden Township $0 $219,000 $177,500 $0 $200,000 -- --
Castle Rock Township $162,500 $141,500 $160,000 $256,250 $253,000 - 1.3% + 55.7%
Cedar Lake Township $365,000 $273,950 $330,000 $203,000 $372,250 + 83.4% + 2.0%
Credit River Township $402,250 $400,000 $392,000 $438,000 $449,000 + 2.5% + 11.6%
Dahlgren Township $383,000 $135,000 $470,000 $250,000 $290,000 + 16.0% - 24.3%
Douglas Township $0 $181,000 $0 $0 $170,000 -- --
Empire Township $138,200 $189,250 $154,000 $208,000 $253,000 + 21.6% + 83.1%
Eureka Township $116,750 $127,000 $172,100 $132,500 $125,000 - 5.7% + 7.1%
Greenvale Township $351,707 $0 $0 $150,000 $201,000 + 34.0% - 42.9%
Grey Cloud Island Township $154,500 $500,000 $270,000 $203,000 $0 - 100.0% - 100.0%
Hancock Township $176,500 $216,400 $0 $0 $0 -- - 100.0%
Hassan Township $0 $0 $0 $0 $0 -- --
Helena Township $405,000 $215,000 $260,000 $303,000 $346,066 + 14.2% - 14.6%
Hollywood Township $230,500 $229,250 $319,950 $210,000 $169,950 - 19.1% - 26.3%
Jackson Township $173,000 $108,500 $143,000 $214,750 $117,450 - 45.3% - 32.1%
Laketown Township $160,000 $154,250 $189,900 $129,750 $137,000 + 5.6% - 14.4%
Linwood Township $187,900 $160,000 $139,750 $156,600 $219,900 + 40.4% + 17.0%
Louisville Township $0 $406,078 $395,000 $115,000 $270,000 + 134.8% --
Marshan Township $309,500 $302,500 $284,200 $205,000 $277,500 + 35.4% - 10.3%
May Township $332,000 $345,000 $285,000 $310,000 $360,000 + 16.1% + 8.4%
New Market Township $349,900 $271,200 $266,000 $331,500 $359,700 + 8.5% + 2.8%
Nininger Township $0 $272,450 $0 $400,000 $324,000 - 19.0% --
Randolph Township $335,000 $350,000 $0 $0 $0 -- - 100.0%
Ravenna Township $187,000 $213,000 $200,000 $219,165 $238,000 + 8.6% + 27.3%
San Francisco Township $132,500 $307,000 $199,250 $242,500 $185,000 - 23.7% + 39.6%
Sand Creek Township $0 $271,900 $152,500 $269,000 $284,500 + 5.8% --
Sciota Township $176,000 $348,800 $323,850 $245,000 $0 - 100.0% - 100.0%
Spring Lake Township $252,500 $324,900 $263,500 $301,000 $383,900 + 27.5% + 52.0%
St. Lawrence Township $0 $0 $0 $0 $146,300 -- --
Stillwater Township $357,450 $342,500 $350,000 $356,500 $479,425 + 34.5% + 34.1%
Vermillion Township $285,000 $162,500 $0 $298,000 $258,450 - 13.3% - 9.3%
Waconia Township $187,000 $300,000 $96,000 $366,000 $291,250 - 20.4% + 55.7%
Waterford Township $0 $0 $0 $0 $72,500 -- --
Watertown Township $245,000 $138,500 $472,500 $297,500 $392,500 + 31.9% + 60.2%
West Lakeland Township $384,500 $381,750 $308,000 $399,950 $438,000 + 9.5% + 13.9%
White Bear Township $214,000 $196,000 $181,000 $179,500 $215,000 + 19.8% + 0.5%
Young America Township $239,775 $565,000 $262,400 $215,000 $537,500 + 150.0% + 124.2%
2013 Annual Report on the Twin Cities Housing Market
Median Prices – Townships
Current as of January 10, 2014. Sponsored by Royal Credit Union (www.RCU.org). All data from NorthstarMLS. Powered by 10K Research and Marketing. | 24

2009 2010 2011 2012 2013Change
From 2012Change
From 2009
Anoka County $155,000 $155,000 $136,900 $152,000 $174,900 + 15.1% + 12.8%
Carver County $218,000 $230,000 $215,784 $230,000 $251,820 + 9.5% + 15.5%
Chisago County $155,000 $145,250 $136,000 $139,000 $165,000 + 18.7% + 6.5%
Dakota County $174,250 $175,000 $156,000 $170,359 $200,000 + 17.4% + 14.8%
Goodhue County $144,950 $134,500 $127,000 $134,900 $149,000 + 10.5% + 2.8%
Hennepin County $174,025 $184,000 $162,500 $182,500 $209,900 + 15.0% + 20.6%
Isanti County $119,000 $109,900 $94,950 $117,900 $128,100 + 8.7% + 7.6%
Kanabec County $84,950 $85,000 $76,250 $79,500 $100,000 + 25.8% + 17.7%
Mille Lacs County $92,000 $89,000 $85,000 $92,010 $110,000 + 19.6% + 19.6%
Ramsey County $144,000 $145,000 $125,500 $142,000 $163,000 + 14.8% + 13.2%
Rice County $145,000 $140,000 $125,000 $134,000 $155,250 + 15.9% + 7.1%
Scott County $200,000 $190,000 $180,000 $197,001 $226,550 + 15.0% + 13.3%
Sherburne County $144,000 $149,900 $129,900 $143,400 $162,300 + 13.2% + 12.7%
St. Croix County $161,450 $160,000 $144,650 $149,000 $177,250 + 19.0% + 9.8%
Washington County $189,000 $195,000 $179,000 $200,000 $220,000 + 10.0% + 16.4%
Wright County $153,450 $152,390 $139,000 $151,900 $176,000 + 15.9% + 14.7%
2013 Annual Report on the Twin Cities Housing Market
Median Prices – Counties
Current as of January 10, 2014. Sponsored by Royal Credit Union (www.RCU.org). All data from NorthstarMLS. Powered by 10K Research and Marketing. | 25

1980 37,018 $1.34 18,351 $74,069
1981 35,580 $1.25 15,675 $80,238
1982 41,465 $1.00 12,193 $82,288
1983 50,794 $1.35 15,914 $84,953
1984 53,646 $1.55 18,231 $85,007
1985 51,492 $1.87 21,335 $87,789
1986 58,382 $2.52 28,015 $90,319
1987 55,422 $2.46 25,772 $95,914
1988 80,771 $3.21 34,244 $93,977
1989 89,170 $3.28 33,962 $96,658
1990 78,548 $3.37 34,496 $98,016
1991 71,850 $3.52 35,598 $99,402
1992 72,730 $4.31 41,944 $103,264
1993 70,685 $4.30 39,842 $107,569
1994 63,369 $4.73 42,454 $111,806
1995 64,556 $4.94 42,310 $117,053
1996 73,433 $5.82 46,949 $124,022
1997 63,189 $5.68 41,441 $137,085
1998 64,280 $7.09 47,836 $147,346
1999 57,573 $7.62 46,675 $163,277
2000 59,618 $8.76 48,208 $181,605
2001 71,861 $10.22 50,298 $203,136
2002 73,940 $11.33 51,212 $221,275
2003 88,132 $13.79 57,458 $240,005
2004 100,042 $15.61 60,180 $259,278
2005 99,635 $16.60 60,065 $273,698
2006 108,050 $13.92 49,424 $279,143
2007 105,006 $11.41 41,034 $275,768
2008 93,465 $9.44 39,598 $236,569
2009 82,977 $9.19 45,877 $199,377
2010 81,858 $8.16 38,288 $211,338
2011 68,886 $8.10 41,606 $193,341
2012 65,910 $10.36 48,812 $210,727
2013 72,128 $12.61 53,087 $236,219
Current as of January 10, 2014. Sponsored by Royal Credit Union (www.RCU.org). All data from NorthstarMLS. Powered by 10K Research and Marketing. | 26
2013 Annual Report on the Twin Cities Housing Market
Historical Review
YearNumber of Listings
ProcessedTotal Dollar Volume
(in billions)Number ofUnits Sold
AverageSales Price
1980–1996
All property types and all MLS districts.
1997–Present
Single-family detached homes, condominiums, townhomes and twin homes for the 13-county metro area.
2003–Present Home sales were recalculated in 2012 to account for all late-recorded activity, affecting data back to 2003.
More Data! Visit mplsrealtor.com to access up-to-date market reports throughout the year. See residential real estate trends in sharp detail by week, month, locality and even through a mobile-ready interactive interface that allows for the creation of shareable charts.