trends in higher education: changes that may affect your
TRANSCRIPT
Trends in Higher Education: Changes That May Affect Your Career
Laura W. Perna, Ph.D.
Graduate School of Education November 7, 2013
Laura W. Perna
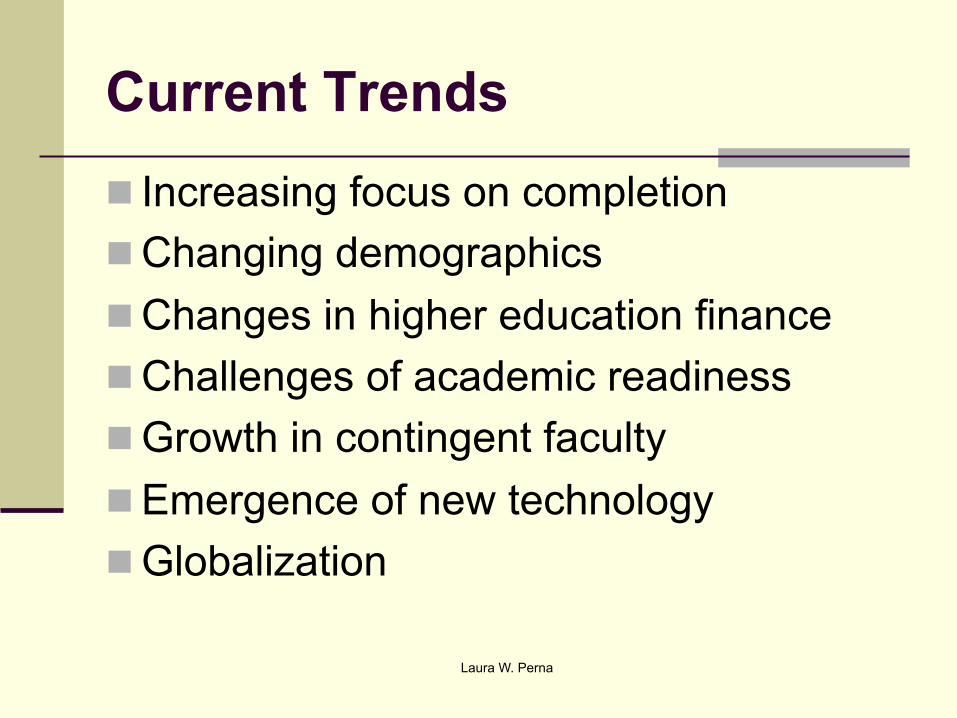
Current Trends n Increasing focus on completion n Changing demographics n Changes in higher education finance n Challenges of academic readiness n Growth in contingent faculty n Emergence of new technology n Globalization
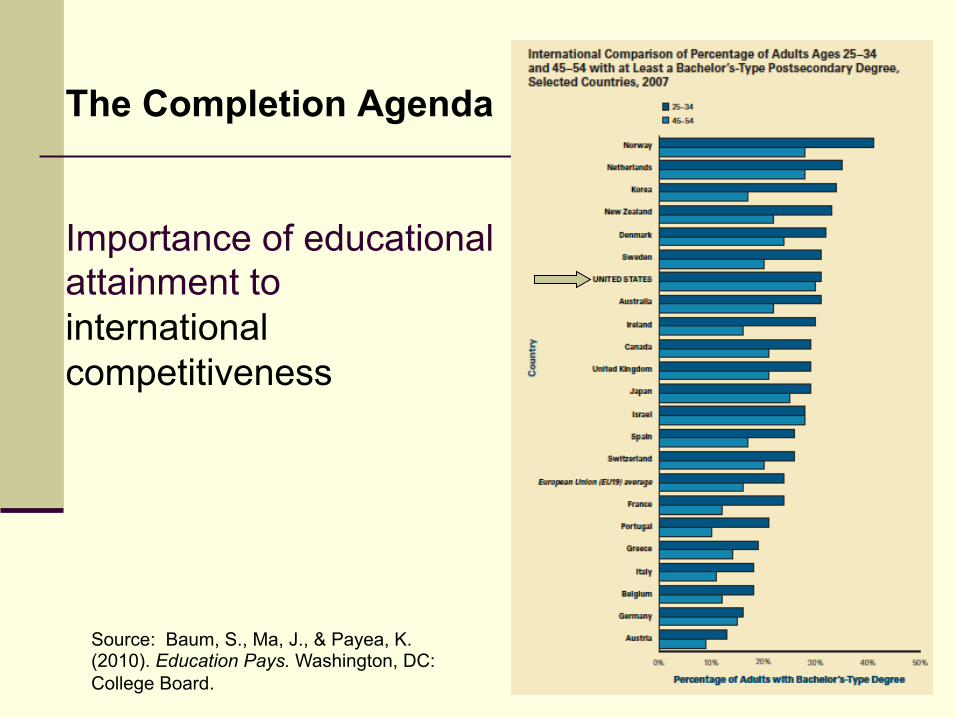
The Completion Agenda Importance of educational attainment to international competitiveness
Source: Baum, S., Ma, J., & Payea, K. (2010). Education Pays. Washington, DC: College Board.
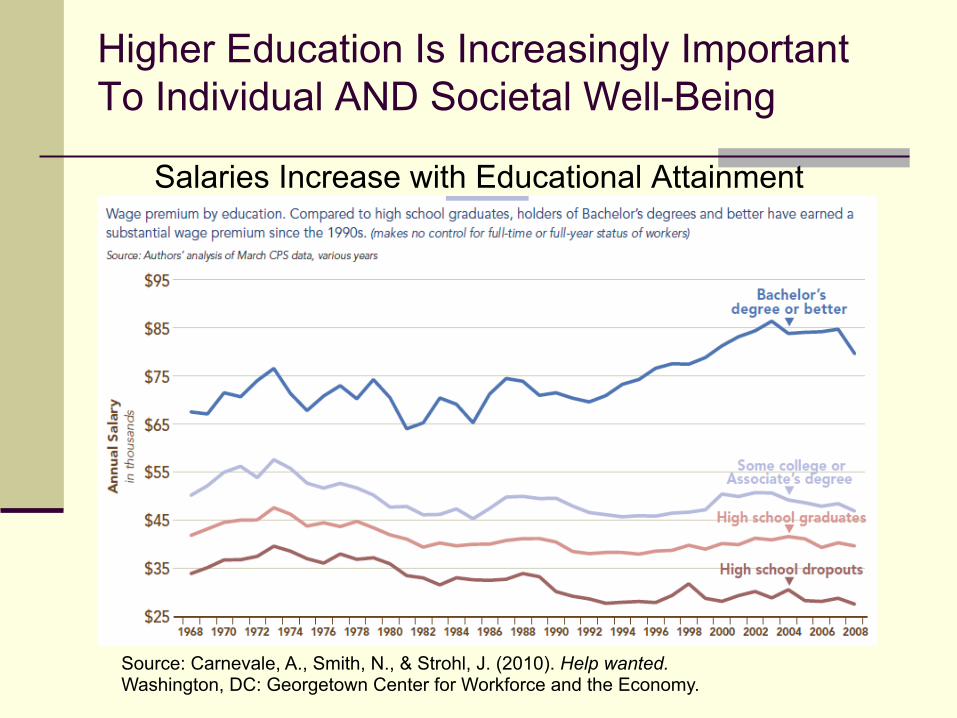
Higher Education Is Increasingly Important To Individual AND Societal Well-Being
Salaries Increase with Educational Attainment
Source: Carnevale, A., Smith, N., & Strohl, J. (2010). Help wanted. Washington, DC: Georgetown Center for Workforce and the Economy.
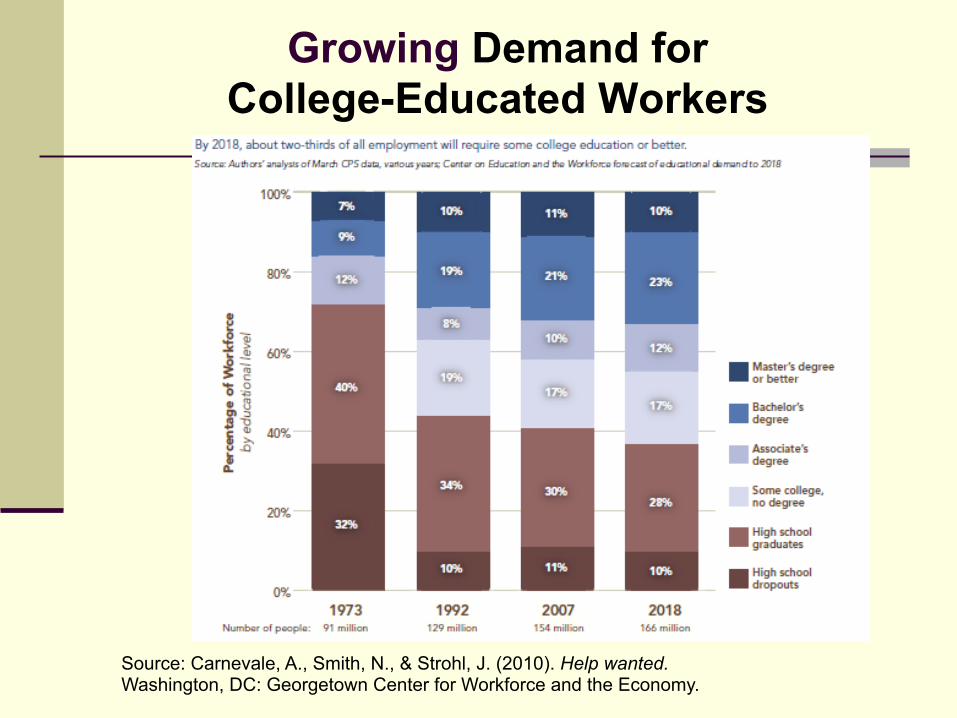
Growing Demand for College-Educated Workers
Source: Carnevale, A., Smith, N., & Strohl, J. (2010). Help wanted. Washington, DC: Georgetown Center for Workforce and the Economy.
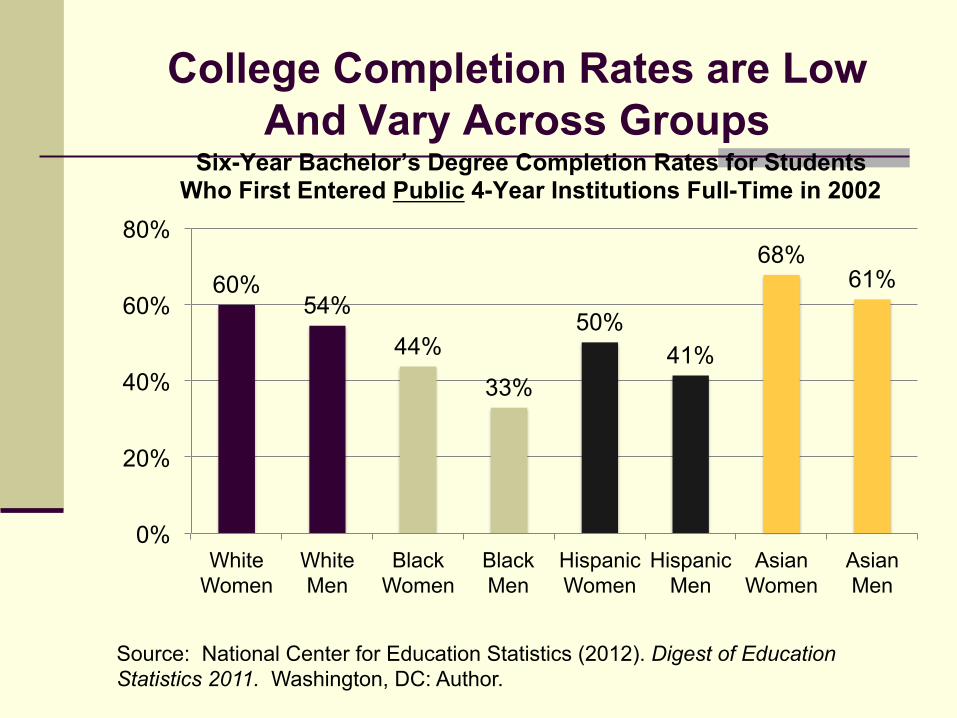
College Completion Rates are Low
And Vary Across Groups
60% 54%
44%
33%
50% 41%
68% 61%
0%
20%
40%
60%
80%
White Women
White Men
Black Women
Black Men
Hispanic Women
Hispanic Men
Asian Women
Asian Men
Six-Year Bachelor’s Degree Completion Rates for Students Who First Entered Public 4-Year Institutions Full-Time in 2002
Source: National Center for Education Statistics (2012). Digest of Education Statistics 2011. Washington, DC: Author.
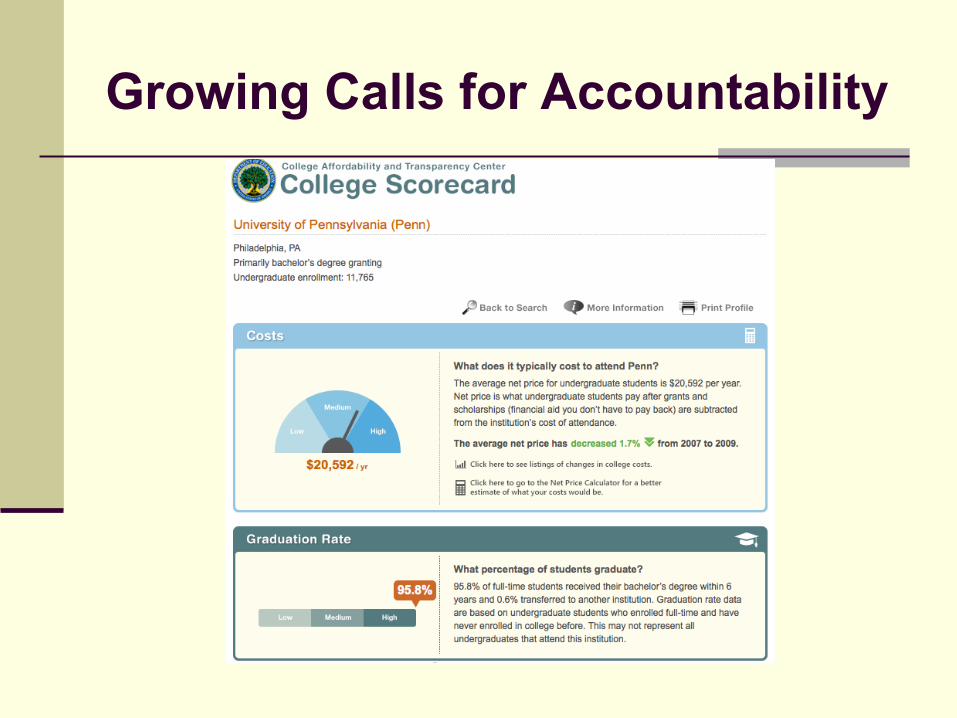
Growing Calls for Accountability
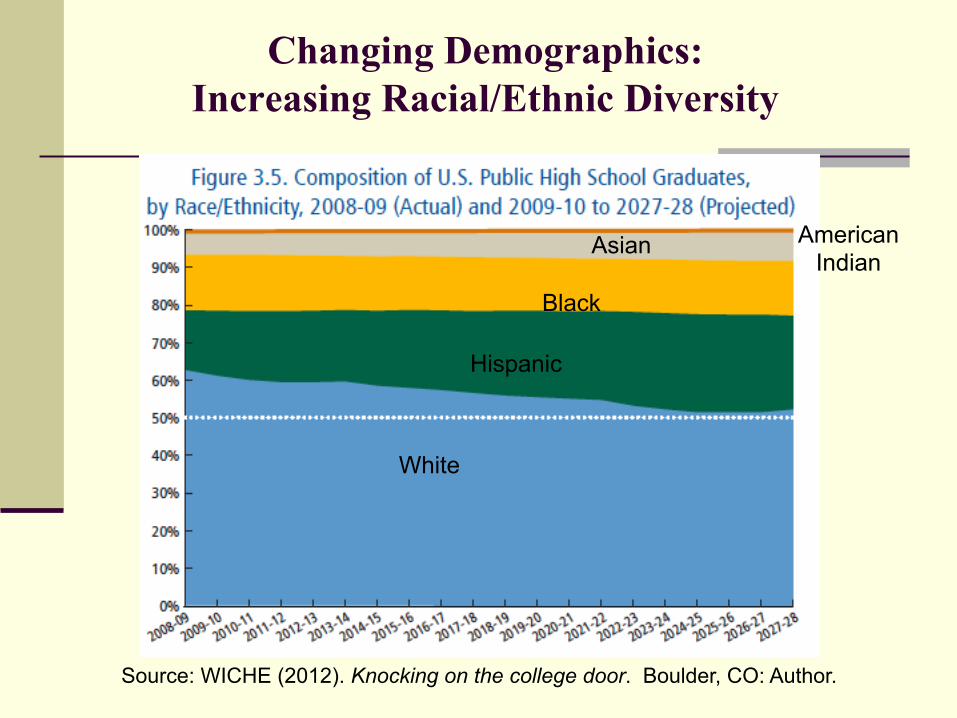
Changing Demographics: Increasing Racial/Ethnic Diversity
Source: WICHE (2012). Knocking on the college door. Boulder, CO: Author.
White
Hispanic
Black
Asian American Indian
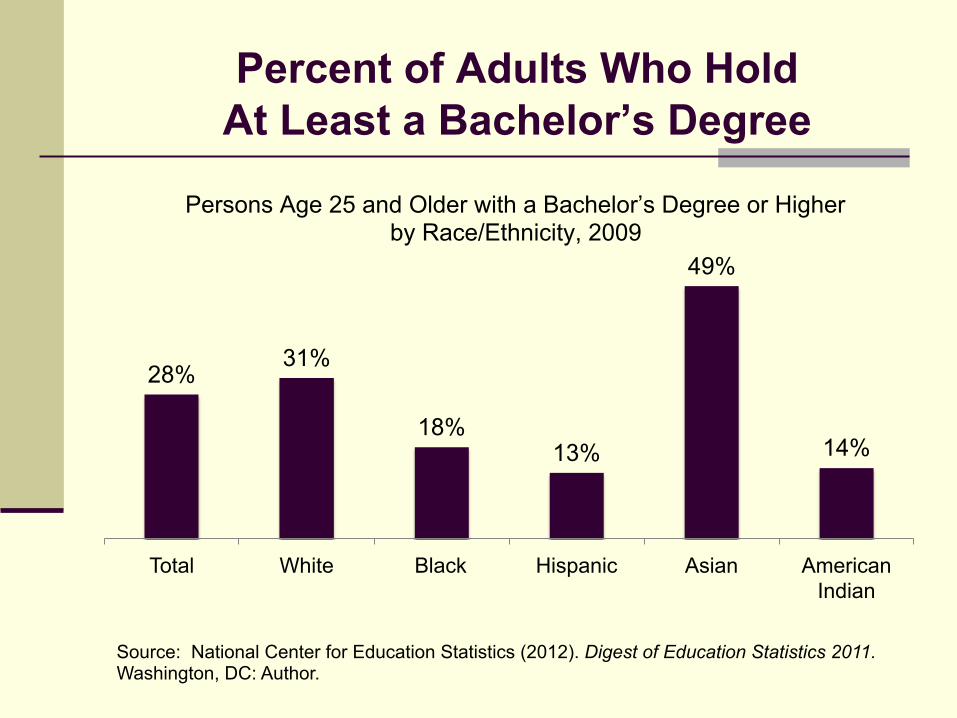
Percent of Adults Who Hold
At Least a Bachelor’s Degree
28% 31%
18% 13%
49%
14%
Total White Black Hispanic Asian American Indian
Persons Age 25 and Older with a Bachelor’s Degree or Higher by Race/Ethnicity, 2009
Source: National Center for Education Statistics (2012). Digest of Education Statistics 2011. Washington, DC: Author.
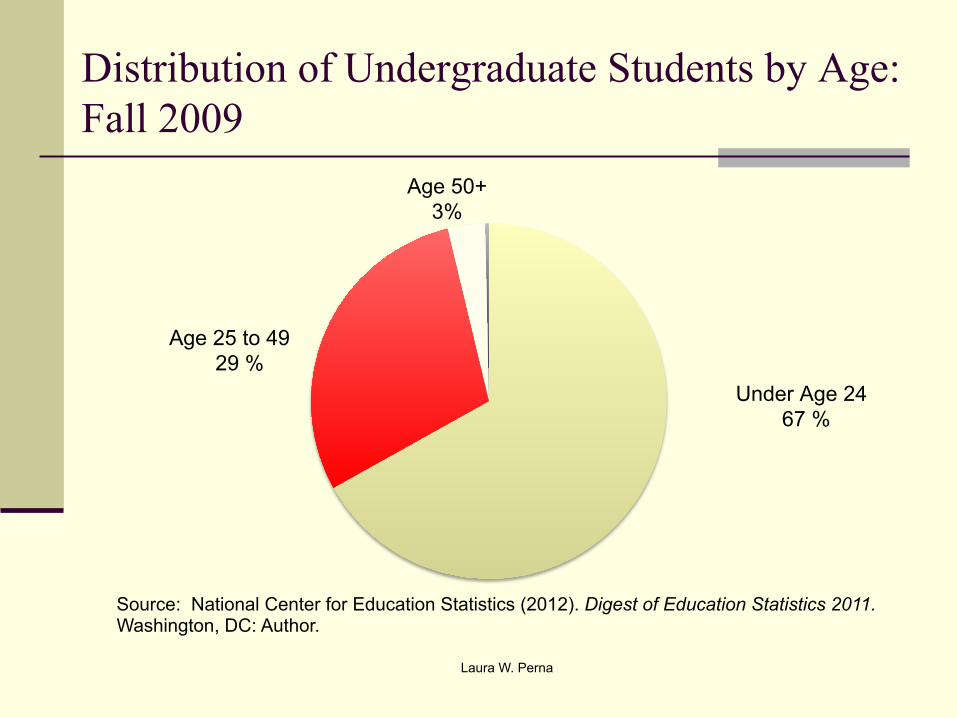
Distribution of Undergraduate Students by Age: Fall 2009
Under Age 24 67 %
Age 25 to 49 29 %
Age 50+ 3%
Source: National Center for Education Statistics (2012). Digest of Education Statistics 2011. Washington, DC: Author.
Laura W. Perna
Trends in Higher Education Finance
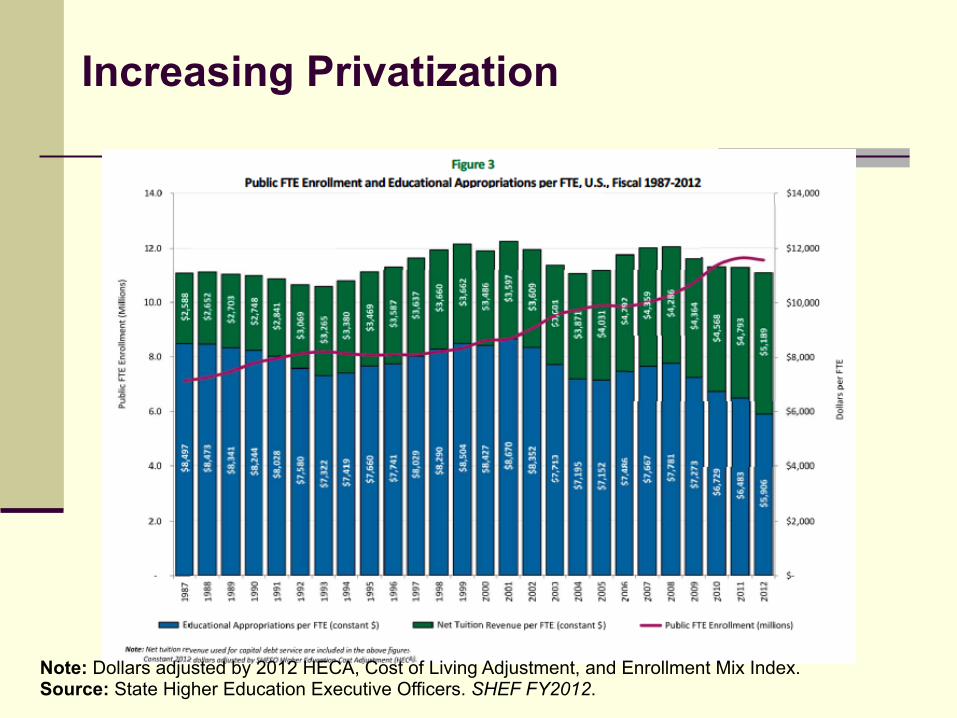
Increasing Privatization
Note: Dollars adjusted by 2012 HECA, Cost of Living Adjustment, and Enrollment Mix Index. Source: State Higher Education Executive Officers. SHEF FY2012.
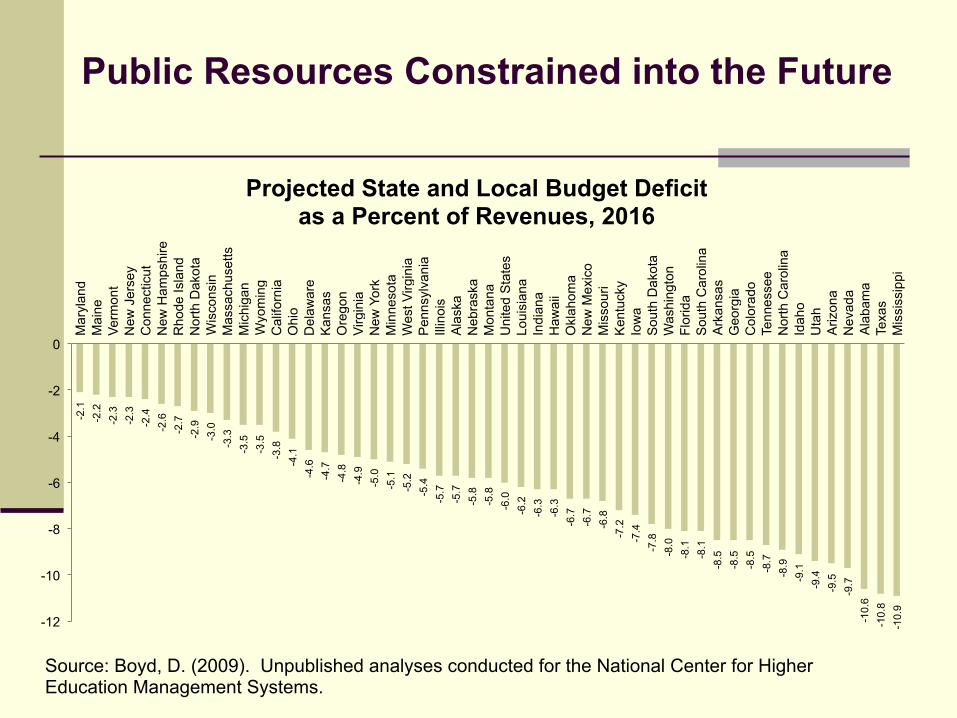
Public Resources Constrained into the Future -2
.1
-2.2
-2
.3
-2.3
-2
.4
-2.6
-2
.7
-2.9
-3
.0
-3.3
-3
.5
-3.5
-3
.8
-4.1
-4
.6
-4.7
-4
.8
-4.9
-5
.0
-5.1
-5
.2
-5.4
-5
.7
-5.7
-5
.8
-5.8
-6
.0
-6.2
-6
.3
-6.3
-6
.7
-6.7
-6
.8
-7.2
-7
.4
-7.8
-8
.0
-8.1
-8
.1
-8.5
-8
.5
-8.5
-8
.7
-8.9
-9
.1
-9.4
-9
.5
-9.7
-1
0.6
-10.
8 -1
0.9
-12
-10
-8
-6
-4
-2
0
Mar
ylan
d M
aine
Ve
rmon
t N
ew J
erse
y C
onne
ctic
ut
New
Ham
pshi
re
Rho
de Is
land
N
orth
Dak
ota
Wis
cons
in
Mas
sach
uset
ts
Mic
higa
n W
yom
ing
Cal
iforn
ia
Ohi
o D
elaw
are
Kan
sas
Ore
gon
Virg
inia
N
ew Y
ork
Min
neso
ta
Wes
t Virg
inia
P
enns
ylva
nia
Illin
ois
Ala
ska
Neb
rask
a M
onta
na
Uni
ted
Sta
tes
Loui
sian
a In
dian
a H
awai
i O
klah
oma
New
Mex
ico
Mis
sour
i K
entu
cky
Iow
a S
outh
Dak
ota
Was
hing
ton
Flor
ida
Sou
th C
arol
ina
Ark
ansa
s G
eorg
ia
Col
orad
o Te
nnes
see
Nor
th C
arol
ina
Idah
o U
tah
Ariz
ona
Nev
ada
Ala
bam
a Te
xas
Mis
siss
ippi
Projected State and Local Budget Deficit as a Percent of Revenues, 2016
Source: Boyd, D. (2009). Unpublished analyses conducted for the National Center for Higher Education Management Systems.
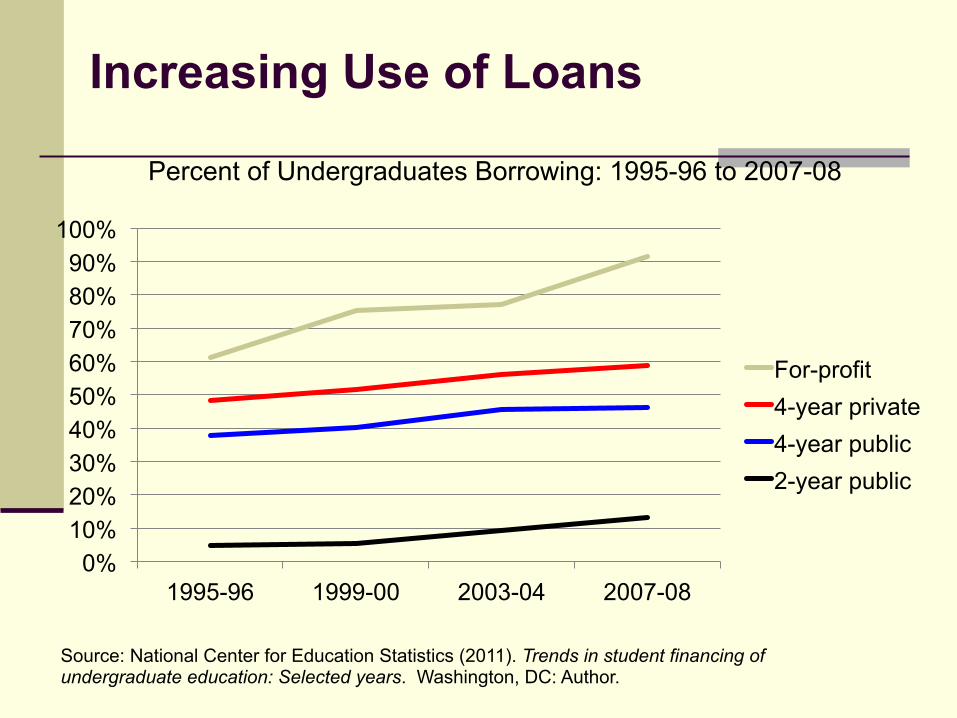
Increasing Use of Loans
0% 10% 20% 30% 40% 50% 60% 70% 80% 90%
100%
1995-96 1999-00 2003-04 2007-08
For-profit 4-year private 4-year public 2-year public
Percent of Undergraduates Borrowing: 1995-96 to 2007-08
Source: National Center for Education Statistics (2011). Trends in student financing of undergraduate education: Selected years. Washington, DC: Author.

Growth in Cumulative Debt
13,000 15,000 14,700 15,700
21,100 22,400 20,500
24,200
18,200
24,700 23,100
26,100
Federal loans Total Non- Pell recipients
Pell recipients
1992-93 1999-2000 2007-08
Source: National Center for Education Statistics (2013). Degrees of Debt, Student Borrowing and Loan Repayment of Bachelor’s Degree Recipients Selected years. Washington, DC: Author.
Average Cumulative Debt Among Bachelor’s Degree Recipients By Loan Type and Pell Recipient Status, 2009
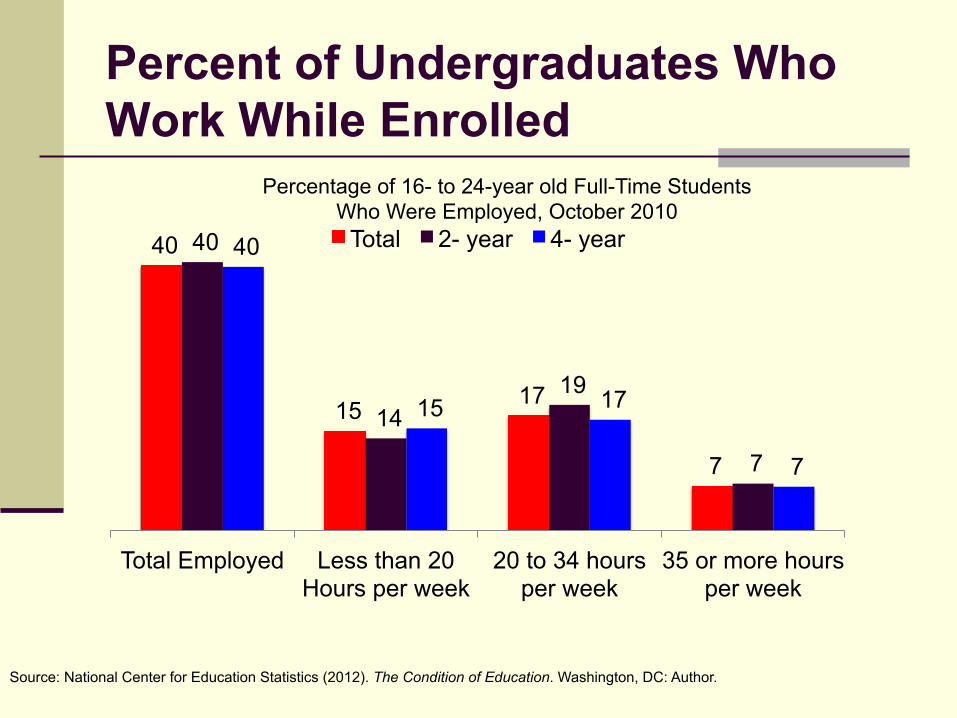
Percent of Undergraduates Who Work While Enrolled
40
15 17
7
40
14 19
7
40
15 17
7
Total Employed Less than 20 Hours per week
20 to 34 hours per week
35 or more hours per week
Total 2- year 4- year
Source: National Center for Education Statistics (2012). The Condition of Education. Washington, DC: Author.
Percentage of 16- to 24-year old Full-Time Students Who Were Employed, October 2010
Laura W. Perna
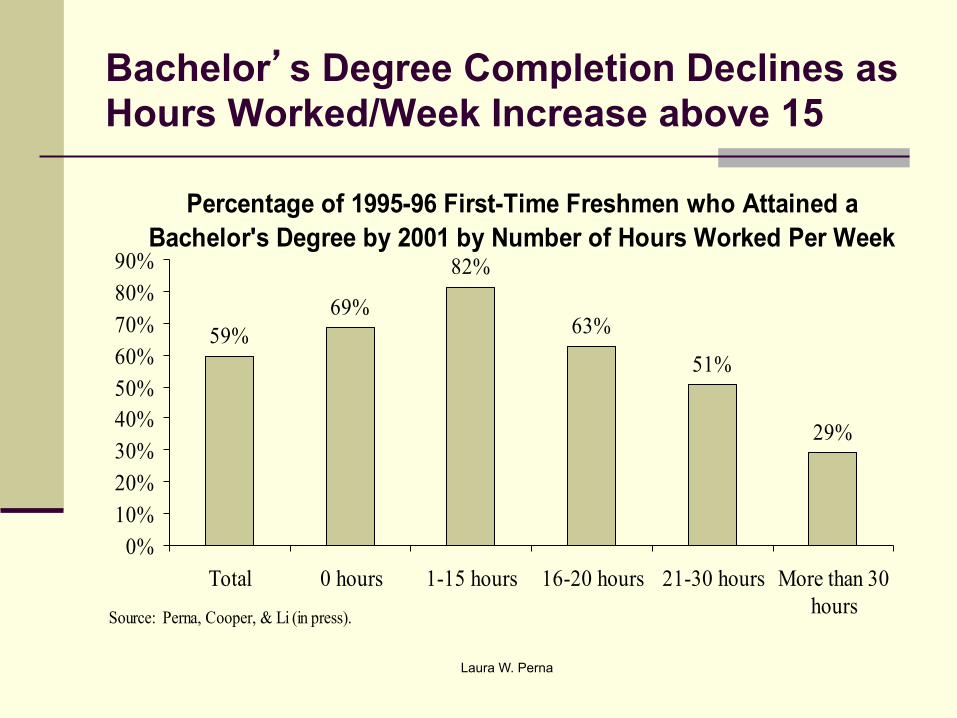
Bachelor’s Degree Completion Declines as Hours Worked/Week Increase above 15
59%69%
82%
63%
51%
29%
0%10%20%30%40%50%60%70%80%90%
Total 0 hours 1-15 hours 16-20 hours 21-30 hours More than 30hoursSource: Perna, Cooper, & Li (in press).
Percentage of 1995-96 First-Time Freshmen who Attained a Bachelor's Degree by 2001 by Number of Hours Worked Per Week
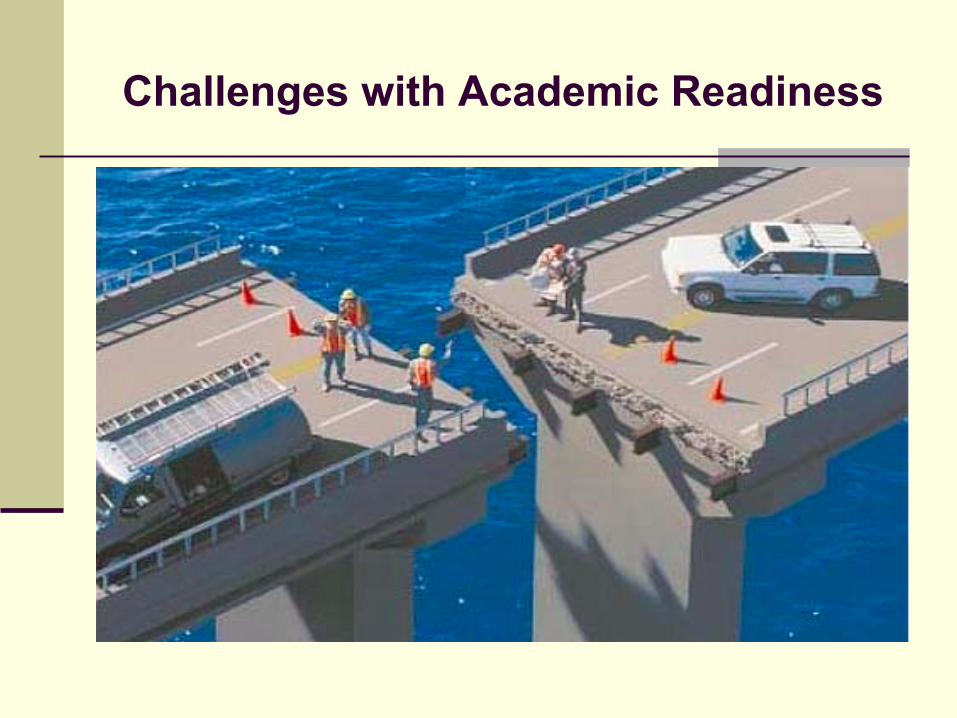
Challenges with Academic Readiness
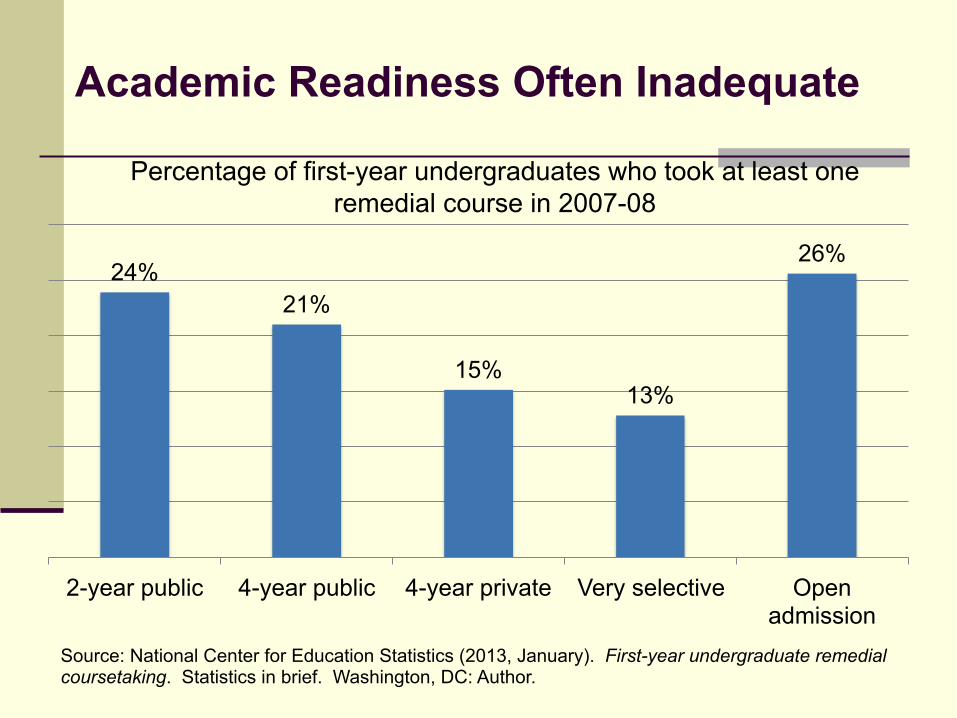
Academic Readiness Often Inadequate
24% 21%
15% 13%
26%
2-year public 4-year public 4-year private Very selective Open admission
Percentage of first-year undergraduates who took at least one remedial course in 2007-08
Source: National Center for Education Statistics (2013, January). First-year undergraduate remedial coursetaking. Statistics in brief. Washington, DC: Author.
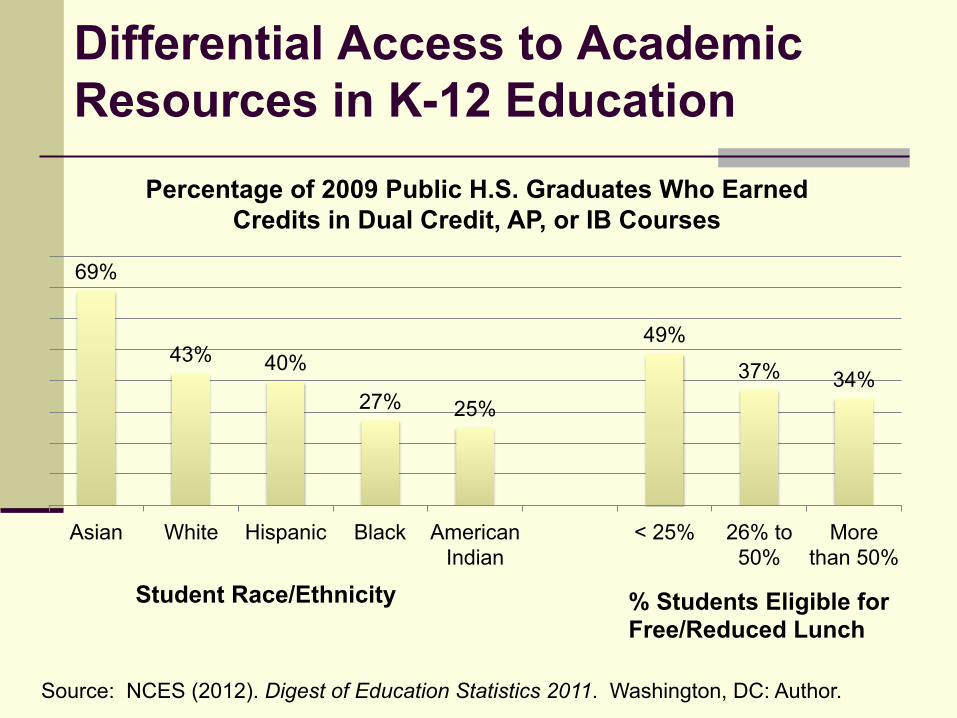
Differential Access to Academic Resources in K-12 Education
69%
43% 40%
27% 25%
49%
37% 34%
Asian White Hispanic Black American Indian
< 25% 26% to 50%
More than 50%
Percentage of 2009 Public H.S. Graduates Who Earned Credits in Dual Credit, AP, or IB Courses
Student Race/Ethnicity % Students Eligible for Free/Reduced Lunch
Source: NCES (2012). Digest of Education Statistics 2011. Washington, DC: Author.
Laura W. Perna
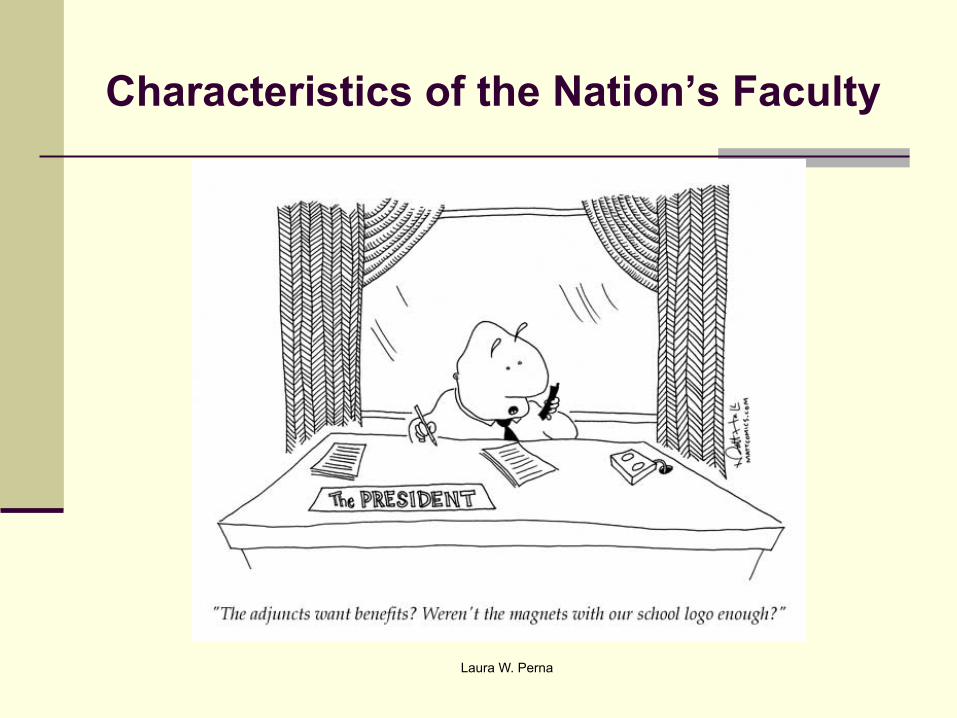
Characteristics of the Nation’s Faculty
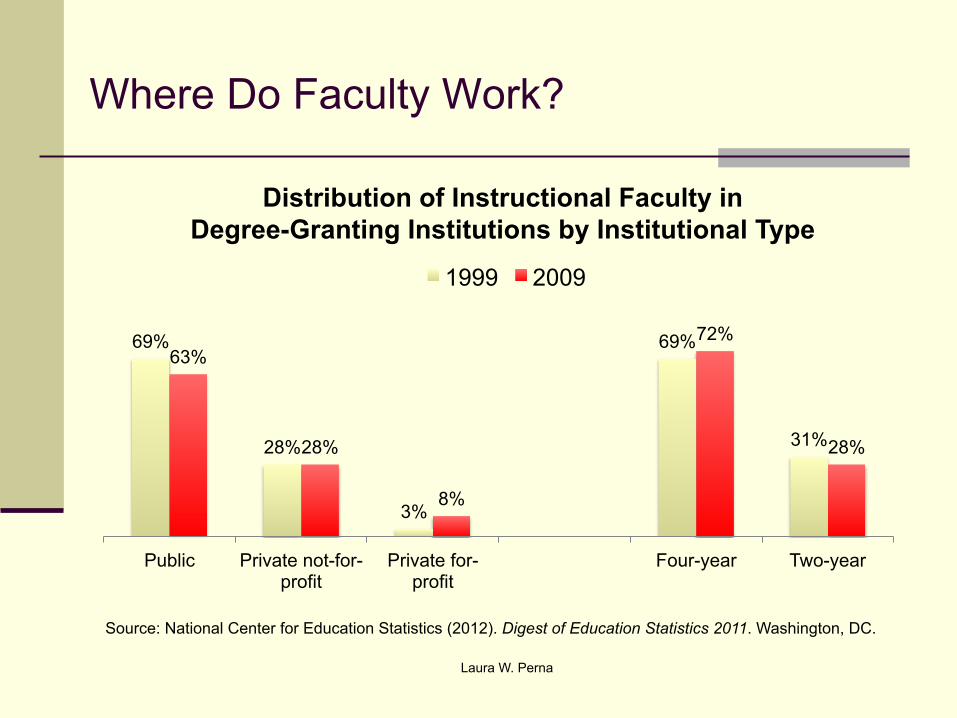
Where Do Faculty Work?
69%
28%
3%
69%
31%
63%
28%
8%
72%
28%
Public Private not-for-profit
Private for-profit
Four-year Two-year
Distribution of Instructional Faculty in Degree-Granting Institutions by Institutional Type
1999 2009
Source: National Center for Education Statistics (2012). Digest of Education Statistics 2011. Washington, DC.
Laura W. Perna
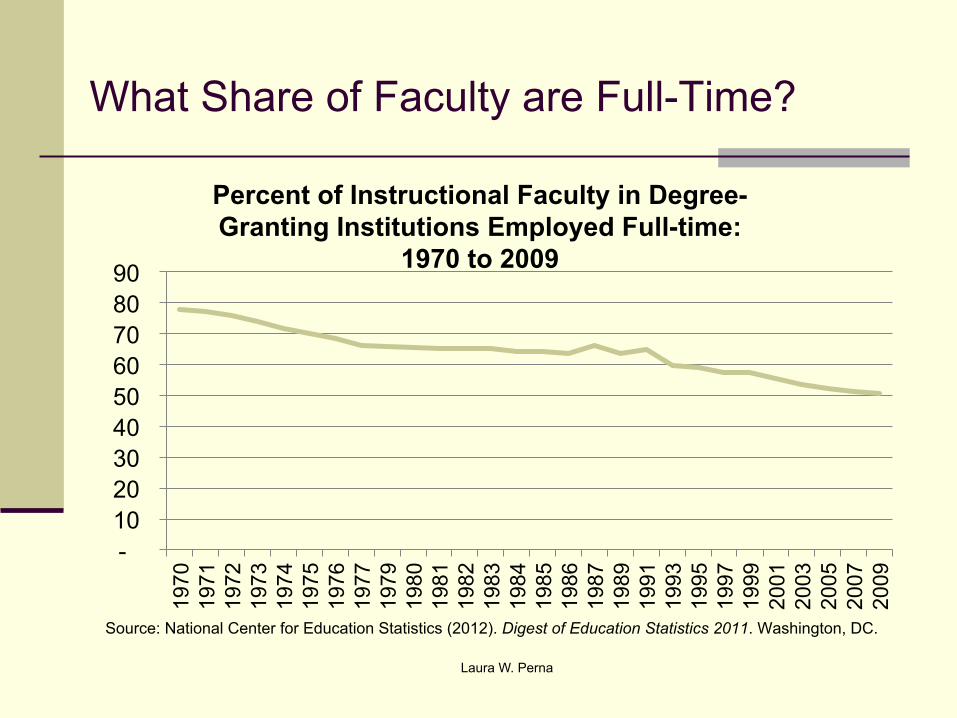
What Share of Faculty are Full-Time?
- 10 20 30 40 50 60 70 80 90
1970
19
71
1972
19
73
1974
19
75
1976
19
77
1979
19
80
1981
19
82
1983
19
84
1985
19
86
1987
19
89
1991
19
93
1995
19
97
1999
20
01
2003
20
05
2007
20
09
Percent of Instructional Faculty in Degree-Granting Institutions Employed Full-time:
1970 to 2009
Source: National Center for Education Statistics (2012). Digest of Education Statistics 2011. Washington, DC.
Laura W. Perna

Average Salaries of Full-Time Faculty
0 10,000 20,000 30,000 40,000 50,000 60,000 70,000 80,000 90,000
1970
19
75
1979
19
80
1981
19
82
1984
19
85
1987
19
89
1990
19
91
1992
19
93
1994
19
95
1996
19
97
1998
19
99
2001
20
02
2003
20
04
2005
20
06
2007
20
08
2009
20
10
Average Salary of Full-Time Instructional Faculty on 9-Month Contracts in Degree-Granting
Institutions, 1970 to 2010 (constant 2009 dollars)
Public 4-year Private 4-year
Source: National Center for Education Statistics (2012). Digest of Education Statistics 2011. Washington, DC.
Laura W. Perna
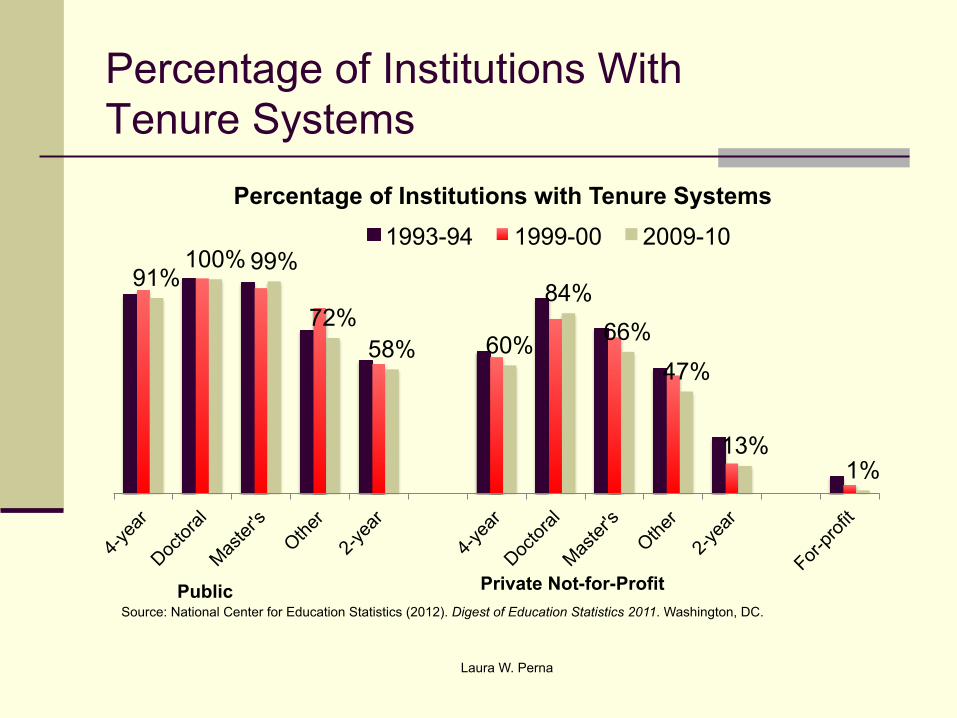
Percentage of Institutions With Tenure Systems
91% 100% 99%
72% 58% 60%
84% 66%
47%
13% 1%
Percentage of Institutions with Tenure Systems 1993-94 1999-00 2009-10
Source: National Center for Education Statistics (2012). Digest of Education Statistics 2011. Washington, DC.
Public Private Not-for-Profit
Laura W. Perna
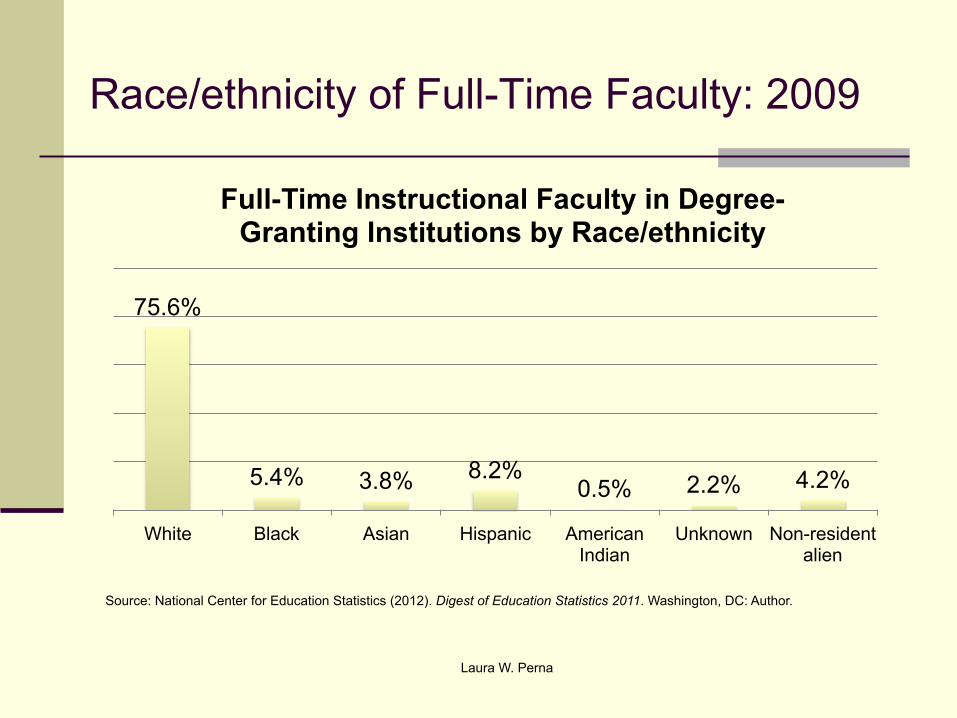
Race/ethnicity of Full-Time Faculty: 2009
75.6%
5.4% 3.8% 8.2% 0.5% 2.2% 4.2%
White Black Asian Hispanic American Indian
Unknown Non-resident alien
Full-Time Instructional Faculty in Degree-Granting Institutions by Race/ethnicity
Source: National Center for Education Statistics (2012). Digest of Education Statistics 2011. Washington, DC: Author.
Laura W. Perna
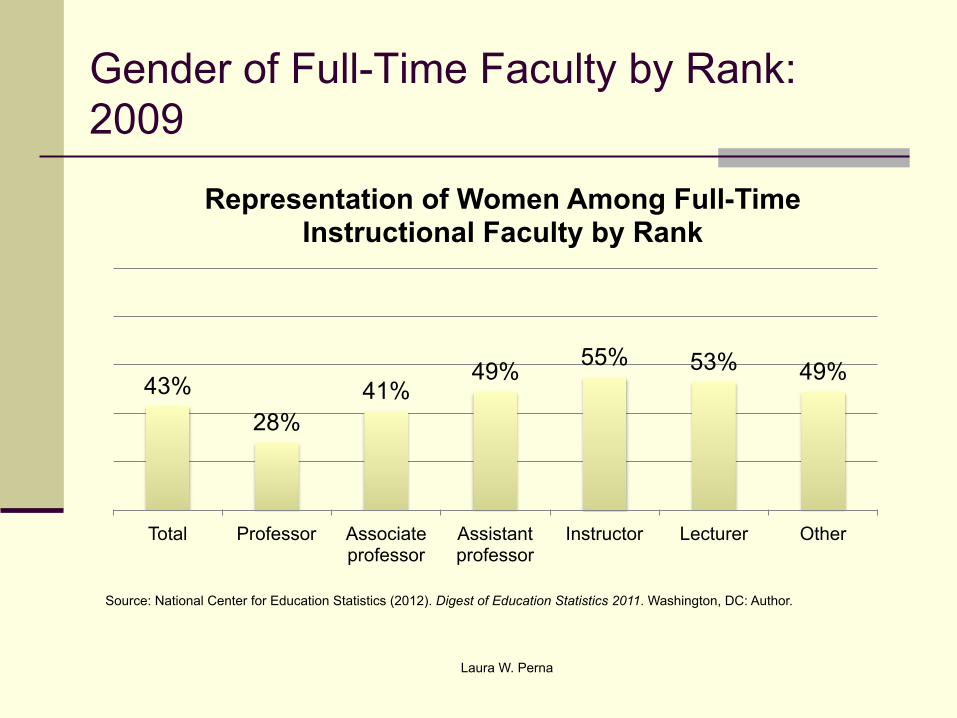
Gender of Full-Time Faculty by Rank: 2009
43% 28%
41% 49% 55% 53% 49%
Total Professor Associate professor
Assistant professor
Instructor Lecturer Other
Representation of Women Among Full-Time Instructional Faculty by Rank
Source: National Center for Education Statistics (2012). Digest of Education Statistics 2011. Washington, DC: Author.
Laura W. Perna
New Technology
Laura W. Perna
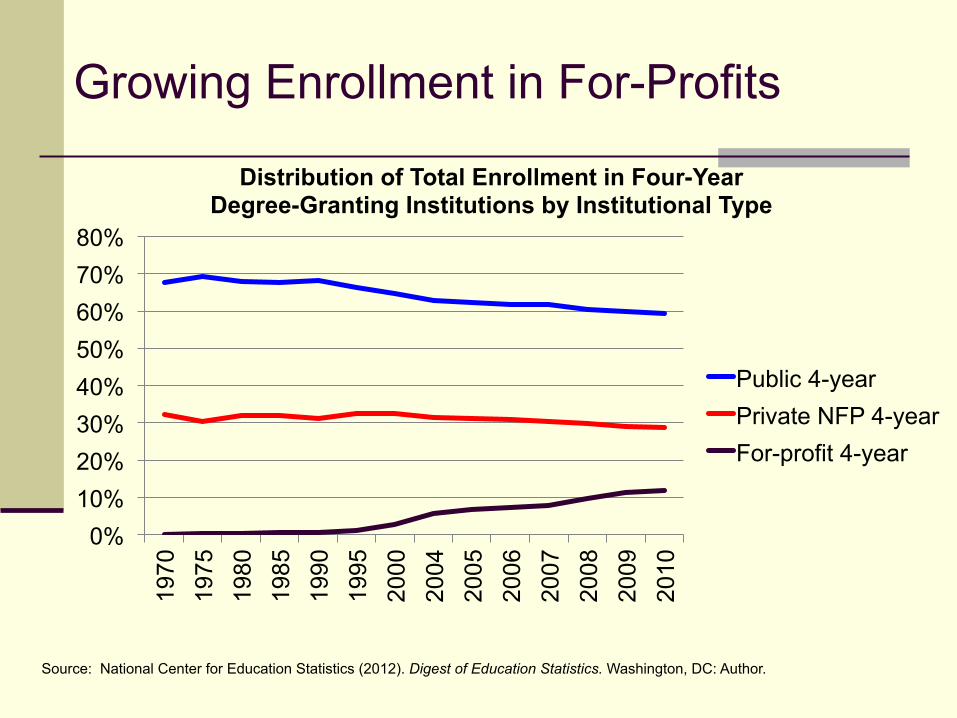
Growing Enrollment in For-Profits
0% 10% 20% 30% 40% 50% 60% 70% 80%
1970
19
75
1980
19
85
1990
19
95
2000
20
04
2005
20
06
2007
20
08
2009
20
10
Public 4-year Private NFP 4-year For-profit 4-year
Source: National Center for Education Statistics (2012). Digest of Education Statistics. Washington, DC: Author.
Distribution of Total Enrollment in Four-Year Degree-Granting Institutions by Institutional Type
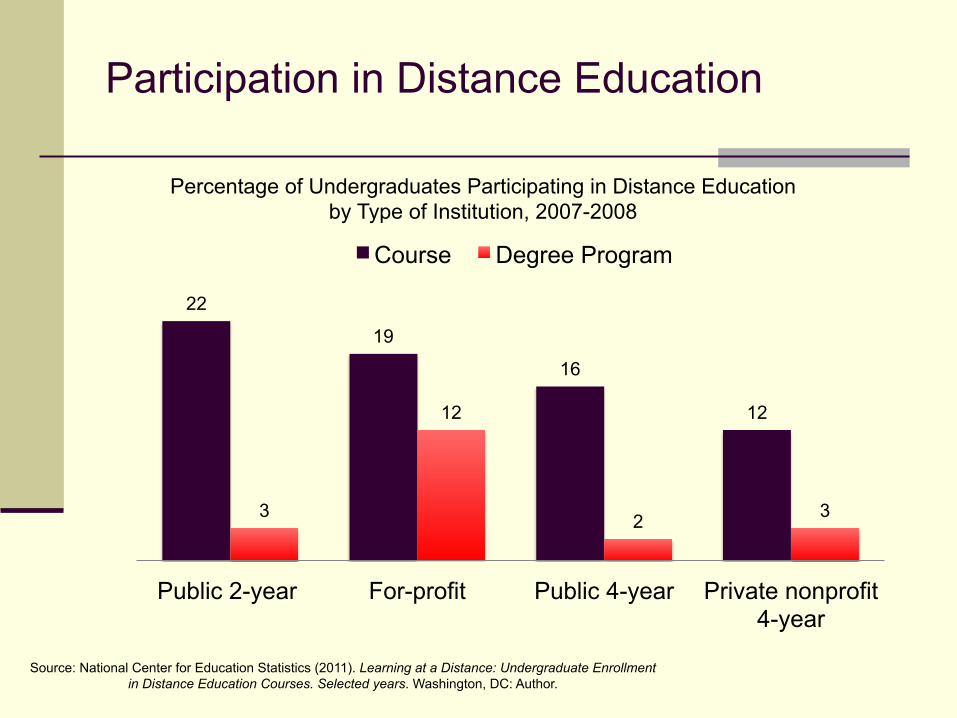
Participation in Distance Education
22
19
16
12
3
12
2 3
Public 2-year For-profit Public 4-year Private nonprofit 4-year
Course Degree Program
Percentage of Undergraduates Participating in Distance Education by Type of Institution, 2007-2008
Source: National Center for Education Statistics (2011). Learning at a Distance: Undergraduate Enrollment in Distance Education Courses. Selected years. Washington, DC: Author.
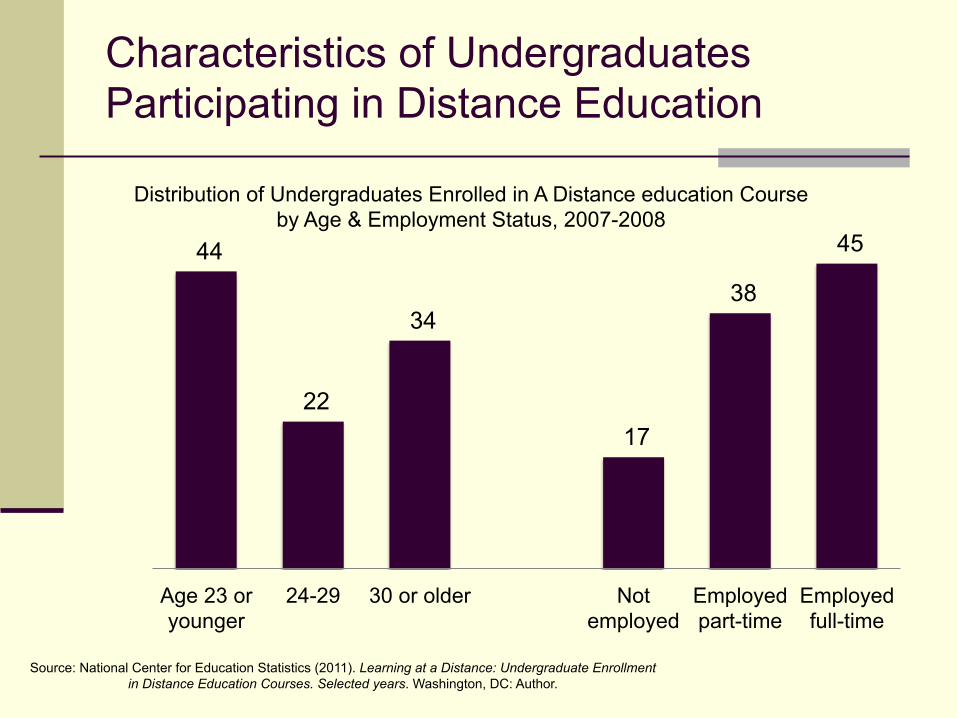
Characteristics of Undergraduates Participating in Distance Education
44
22
34
17
38
45
Age 23 or younger
24-29 30 or older Not employed
Employed part-time
Employed full-time
Distribution of Undergraduates Enrolled in A Distance education Course by Age & Employment Status, 2007-2008
Source: National Center for Education Statistics (2011). Learning at a Distance: Undergraduate Enrollment in Distance Education Courses. Selected years. Washington, DC: Author.
Globalization
Laura W. Perna
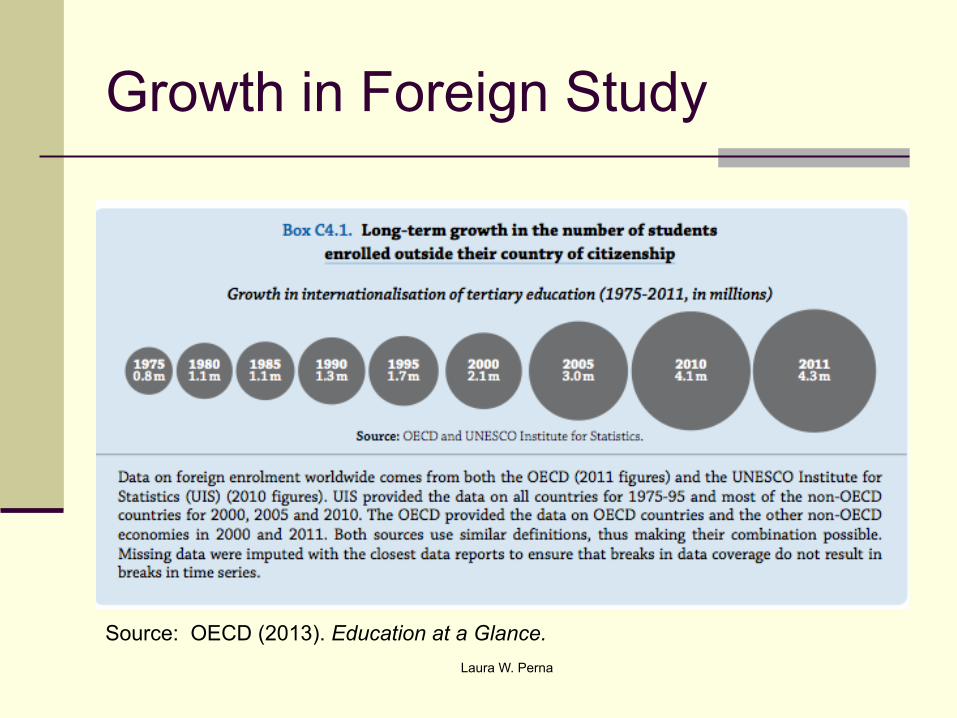
Growth in Foreign Study
Laura W. Perna
Source: OECD (2013). Education at a Glance.
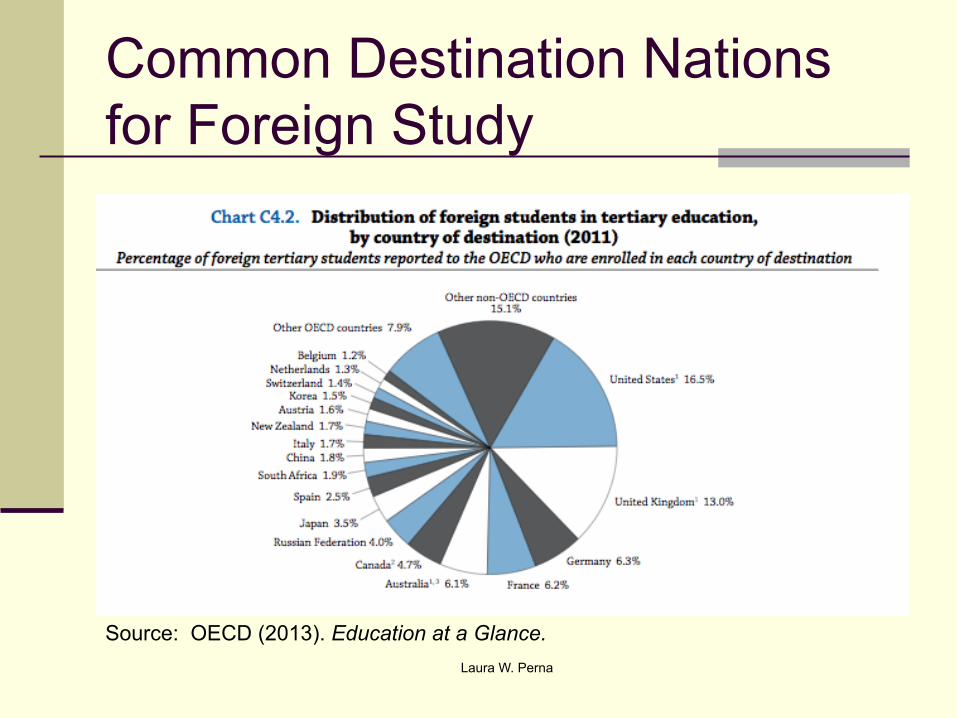
Common Destination Nations for Foreign Study
Laura W. Perna
Source: OECD (2013). Education at a Glance.
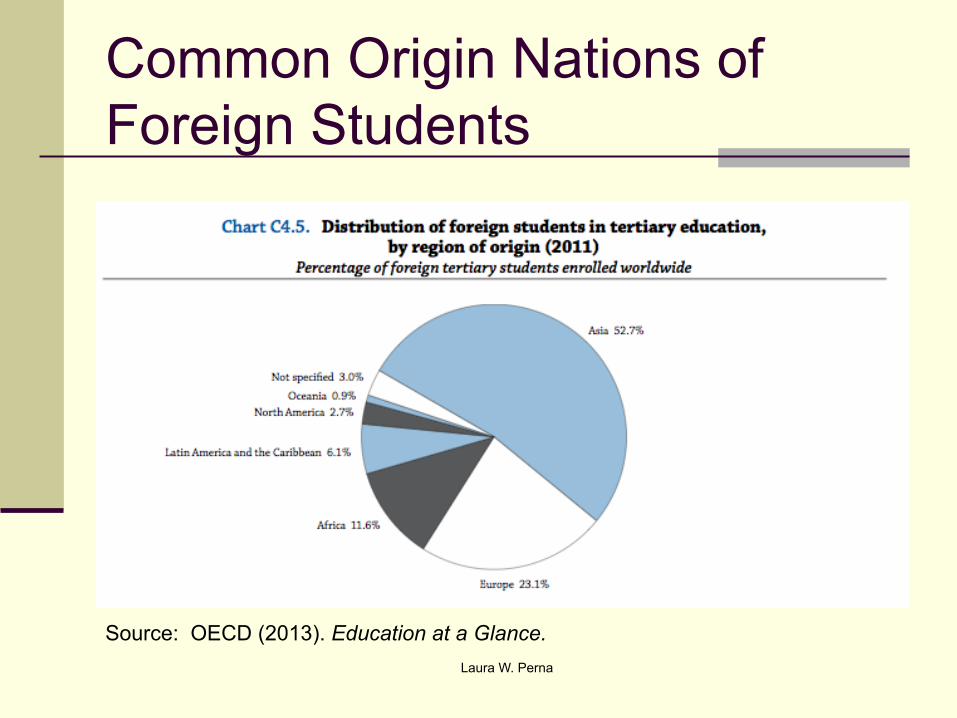
Common Origin Nations of Foreign Students
Laura W. Perna
Source: OECD (2013). Education at a Glance.

Laura W. Perna