plan design trends in higher education
TRANSCRIPT

©2003 – 2013 Multnomah Group, Inc. All Rights Reserved.
Plan Design Trends in Higher EducationWork on the front allows participants to stop working at the end
PLAN DESIGN TRENDS IN HIGHER EDUCATION2
Erik Daley, CFAErik is the Managing Principal for Multnomah Group. He is a member of Multnomah Group’s Investment Committee and leads the firm’s tax-exempt practice, focusing on higher education and healthcare organizations. Erik consults regularly with clients on a variety of retirement plan related topics to help manage their fiduciary risks. He is a national speaker on retirement plan issues.
Prior to founding the Multnomah Group in 2003, Erik served as a Vice President of Retirement Services and led the Portland, OR practice of a national retirement services firm. In that position Erik was a founding member of the firm’s national Investment Committee and had oversight for business development in the western United States.
Erik is a member of the CFA Institute, the CFA Society of Portland, the CFA Society of Seattle, the American Society of Pension Professionals and Actuaries, the Portland Chapter of the Western Pension & Benefits Council, and the Society for Human Resource Management. Erik holds a B.B.A. from the University of Iowa.
PLAN DESIGN TRENDS IN HIGHER EDUCATION3
Agenda• Compensation Model in Higher Education• Defined Benefit to Defined Contribution Transition Impacts• Defined Contribution Plan Lifecycle• Plan Design
• Young Savers
• Accumulators
• Pre-Retirees• Plan Services• Investment Structures• Employee Education Needs• 5 Steps to Creating a True Retirement Plan

PLAN DESIGN TRENDS IN HIGHER EDUCATION4
Compensation Model in Higher EducationOn average, 75% of the costs to run a college are related to personnel expenses
• A significant portion of that cost is attributable to benefits- Retirement- Health
Faculty salaries are especially expensive• Business
• EngineeringCosts go beyond direct compensation and benefits
• Paid time off for research
• Graduate assistants to support research
• Equipment and facilities to attract talentTenure
• Shifting faculty needs
• Increasing labor cost
PLAN DESIGN TRENDS IN HIGHER EDUCATION5
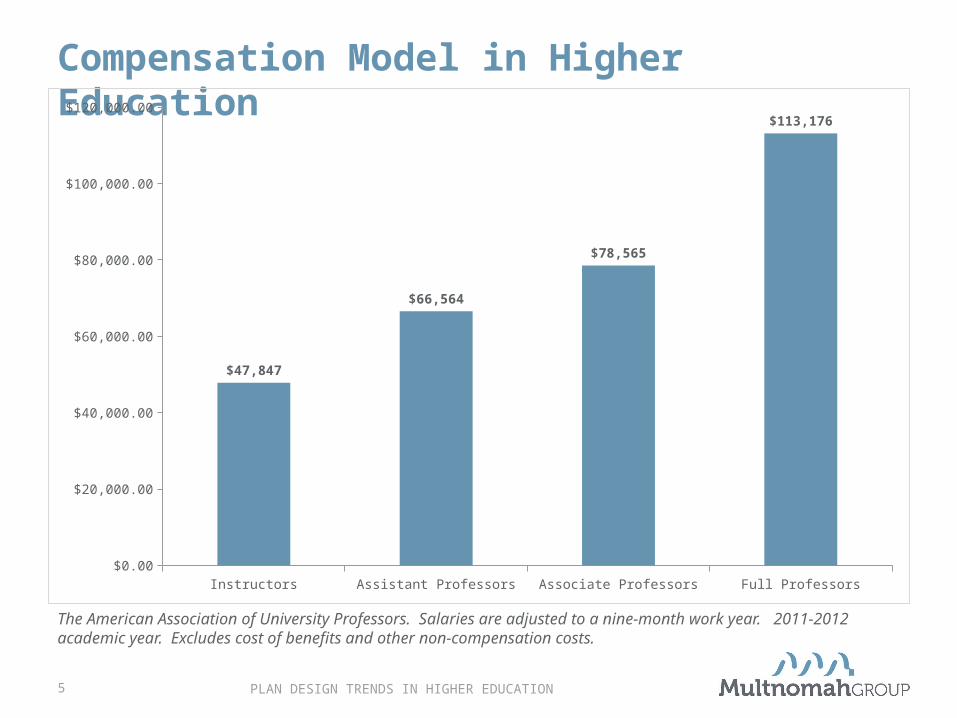
Compensation Model in Higher Education
Instructors Assistant Professors Associate Professors Full Professors$0.00
$20,000.00
$40,000.00
$60,000.00
$80,000.00
$100,000.00
$120,000.00
$47,847
$66,564
$78,565
$113,176
The American Association of University Professors. Salaries are adjusted to a nine-month work year. 2011-2012 academic year. Excludes cost of benefits and other non-compensation costs.

PLAN DESIGN TRENDS IN HIGHER EDUCATION6
Change in Model for Retirement Savings
Defined Benefit Plans Defined Contribution Plans
Primarily employer funded, with occasional required participant contributions
FundingMix of employer and employee
contributions
Employer directed Investment Strategy Participant directed
Participants determine how much income they need to replace and work to the goal of achieving that level of benefit
Evaluation MetricParticipants focus on generating a sum of
assets that will become the source of meeting retirement expenses
High Plan Sponsor Volatility Low
Participants are protected against investment and longevity risk Participant “Safety” Each participant must individually ensure
their retirement preparedness
1National Institute on Retirement Security. Retirement Readiness – What Difference Does a Pension Make?
85% Retirement Readiness1 51% Retirement Readiness1

PLAN DESIGN TRENDS IN HIGHER EDUCATION7
Impact of the TransitionEmployees whose primary retirement plan is a DC plan tend to retire one to two years later, than employees covered by a pension plan
Center for Retirement Research, “The Recent Trend Towards Later Retirement,” March 2007
Individuals covered only by a DB plan are 87% more likely to retire in any given year that individuals only covered by a DC plan.
Rui Yao and Eric Park, University of Missouri, “Do Market Returns Affect Retirement Timing?” 2011
A 1% increase in the S&P 500 Index in any given year increases the probability that the pre-retiree will retire by 2.5%
Rui Yao and Eric Park, University of Missouri, “Do Market Returns Affect Retirement Timing?” 2011
Delayed retirements may also increase employers’ healthcare costs. Healthcare costs for a 65-year-old worker are twice those of a worker between the ages of 45 and 54
U.S. Department of Health and Human Services, “National Health Care Expenditure Sheet.” Data as of 2004
The ability to retain young talent is impacted by the prospect of career and professional advancement

PLAN DESIGN TRENDS IN HIGHER EDUCATION8
Lifecycle of a Defined Contribution Plan
•Young•Lower income•Direct competition for earned income
Young Savers
•Mid career•Highly productive
•Financially secure
Accumulators
•Accomplished•Experienced•Concluded costs of establishing a family / life
Pre-Retirees
1. Begin the retirement savings process
2. Reward engagement and patience
3. Affirm the commitment to beginning the savings process
1. Demonstrate the progress towards retirement readiness
2. Reduce the impact of leakage on retirement readiness
3. Begin educating on what retirement is
1. Provide extensive access to financial planning and advice
2. Focus on retirement plan as a tool for securing retirement rather than a wealth accumulation instrument
3. Identify opportunities to incent retirement

PLAN DESIGN TRENDS IN HIGHER EDUCATION9
Designing the Best Defined Contribution PlanPlan Forward
1. Benefit Plan Design
2. Plan Provider Services
3. Participant Education

PLAN DESIGN TRENDS IN HIGHER EDUCATION10
Benefit Plan DesignHigher education is damaged by their high employer contribution rates to defined contribution plans
Below 6% 6%-8% 8%-10% 10%-12% 12%+0%
5%
10%
15%
20%
25%
30%
35%
40%
6%
20%
27%
31%
16%16%
9%
20%
35%
20%
Distribution of Mandatory Employer Core Contributions1
Public Plans Peer GroupPrivate Plans Peer Group
1Plan Design in Higher Education: Best Practices for Improving Retirement Readiness

PLAN DESIGN TRENDS IN HIGHER EDUCATION11
Benefit Plan Design – Young Savers
Young Savers
Accumulators
Pre-Retirees
Nearly all defined contribution plans require an employee to defer salary to derive adequate retirement benefits
• A general rule of thumb is 10-15% total to generate adequate income replacement
1. Employee Mandatory Contributions2. Automatic Enrollment and Automatic Escalation3. Adopting a Hybrid Match Formula

PLAN DESIGN TRENDS IN HIGHER EDUCATION12
Benefit Plan Design – Young SaversEmployee Mandatory Contributions
Automatic Enrollment and Automatic Escalation
Adopting a Hybrid Match Formula
Pros 100% adoption. Unlike nearly every other option, mandatory means mandatory and all participants (and the sponsor) benefit as a result.
Fundamentally does not change the “contract” between participant and plan sponsor. Plan participants are provided an option to opt-out based on their needs, but many participants elect to automatically enrolled and thereby become participants.
In some instances, a hybrid match formula may reduce the cost of contributions by the sponsor. Participants may be incented to “engage” in their retirement planning process.
Cons Employees may eventually perceive employee mandatory contributions as an additional employer contribution thereby reducing the perceived value of their compensation verses peers.
While automatic enrollment can be instituted in such a way to address current employees who are not deferring, it is most typical to begin automatic enrollment prospectively thereby reducing its potential impact on current participants.
Impact of the change may not be as significant as the political cost of adopting. Further, the lowest paid employees will likely see their retirement preparedness decline, which may not meet the social justice policies of the sponsor.
Implementation Very difficult. The perceived compensation takeaway will be considerable for most institutions.
Relatively easy. Employees surveyed generally support the implementation of automatic enrollment, especially when it does not impact them. Older payroll systems can be challenging to customize in a manner supportive of automatic increase and enrollment features.
Difficult. Taking current contributions made by the sponsor and making them contingent is seen as a takeaway; even in instances where the potential contribution grows.

PLAN DESIGN TRENDS IN HIGHER EDUCATION13
Higher Education Lags Behind Other Industries in Usage of Automated Plan Features1
Automatic EnrollmentAnnual Increase
Program
Higher Education <5% <5%
Not-for-Profit Healthcare 29% 49%
Corporate 22% 76%
1Plan Design in Higher Education: Best Practices for Improving Retirement Readiness
PLAN DESIGN TRENDS IN HIGHER EDUCATION14
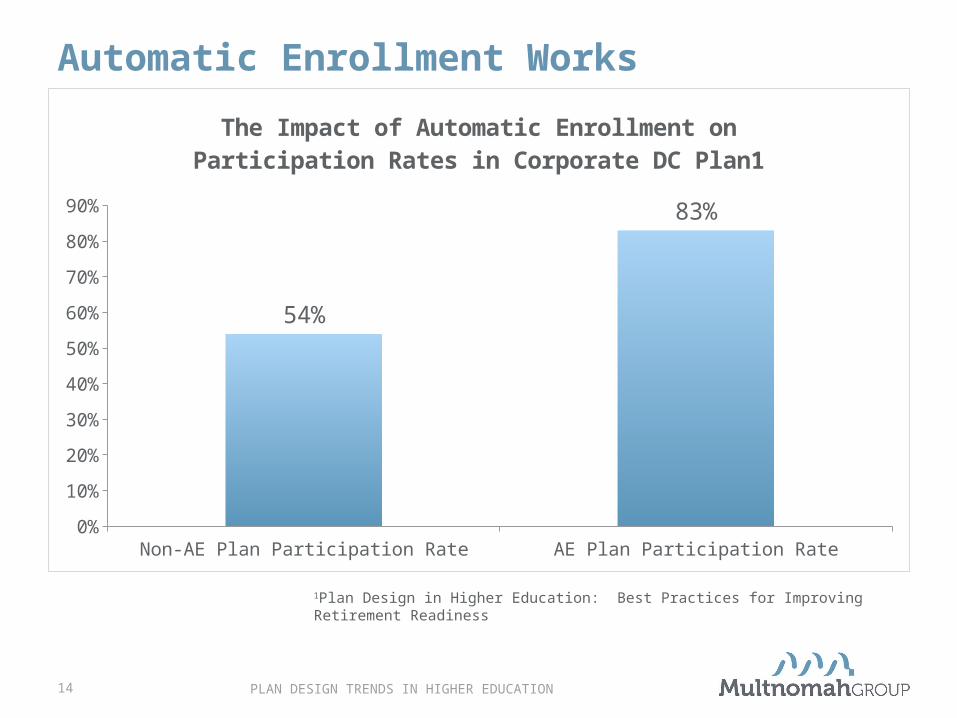
Automatic Enrollment Works
Non-AE Plan Participation Rate AE Plan Participation Rate0%
10%
20%
30%
40%
50%
60%
70%
80%
90%
54%
83%
The Impact of Automatic Enrollment on Participation Rates in Corporate DC Plan1
1Plan Design in Higher Education: Best Practices for Improving Retirement Readiness

PLAN DESIGN TRENDS IN HIGHER EDUCATION15
Benefit Plan Design – Accumulators
Young Savers
Accumulators
Pre-Retirees
“Neither a borrower or a lender be”
1. Plan Rollovers2. Retirement Plan Loans3. Hardship Withdrawals

PLAN DESIGN TRENDS IN HIGHER EDUCATION16
Retirement LeakageOnly 20% of employees who take a lump-sum distribution roll proceeds into a tax-qualified IRA or retirement plan account
GAO
Participants age 35-45 are more likely to borrow – and when they do, are more likely to take the maximum – as compared to their younger and older counterparts
Borrowing from Yourself: The Determinants of 401(k) Loan Patterns
Estimated participant loan default rate from July 2011 – May 2012 was 17.4%Navigant Economics
Prevailing plan interest rate is tied to Prime (3.25%)
Hardship distributions are much less prevalent (typically less than 2% annually)
PLAN DESIGN TRENDS IN HIGHER EDUCATION17
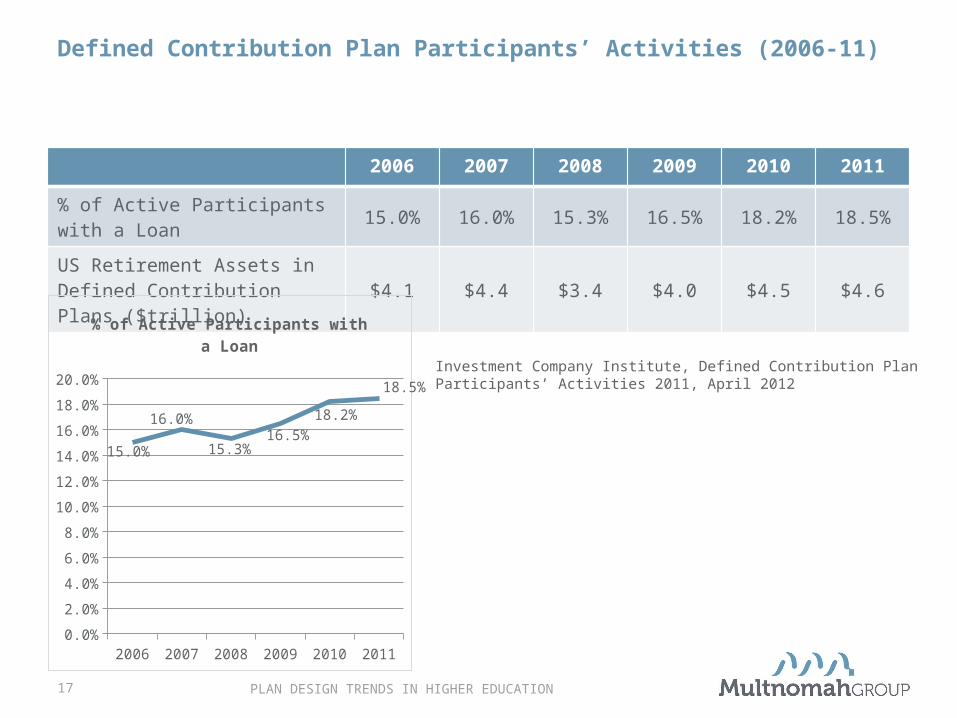
Defined Contribution Plan Participants’ Activities (2006-11)
2006 2007 2008 2009 2010 2011
% of Active Participants with a Loan
15.0% 16.0% 15.3% 16.5% 18.2% 18.5%
US Retirement Assets in Defined Contribution Plans ($trillion)
$4.1 $4.4 $3.4 $4.0 $4.5 $4.6
2006 2007 2008 2009 2010 20110.0%
2.0%
4.0%
6.0%
8.0%
10.0%
12.0%
14.0%
16.0%
18.0%
20.0%
15.0%
16.0%
15.3%16.5%
18.2%
18.5%
% of Active Participants with a Loan
Investment Company Institute, Defined Contribution Plan Participants’ Activities 2011, April 2012

PLAN DESIGN TRENDS IN HIGHER EDUCATION18
Benefit Plan Design – Pre-Retirees
Young Savers
Accumulators
Pre-Retirees
Help participants keep their eyes on the prize
1. In-service plan distributions2. Early retirement windows
PLAN DESIGN TRENDS IN HIGHER EDUCATION19
In-Service Plan DistributionsPlans routinely provide older employees (59 ½ - 65) the ability to begin taking distributions from their retirement plan
1. Maintain a focus on retirement2. In-service distributions should ideally be tied to phased retirement programs
with committed dates of retirement
403(b) plans are flexible in allowing employers to make post-severance contributions to a retirement plan. Plan sponsors should be judicious with the utilization of these features
3. Early retirement needs to be highly targeted4. Utilization of early retirement may shape expectations about future
availability and alter normal plan behavior
PLAN DESIGN TRENDS IN HIGHER EDUCATION20
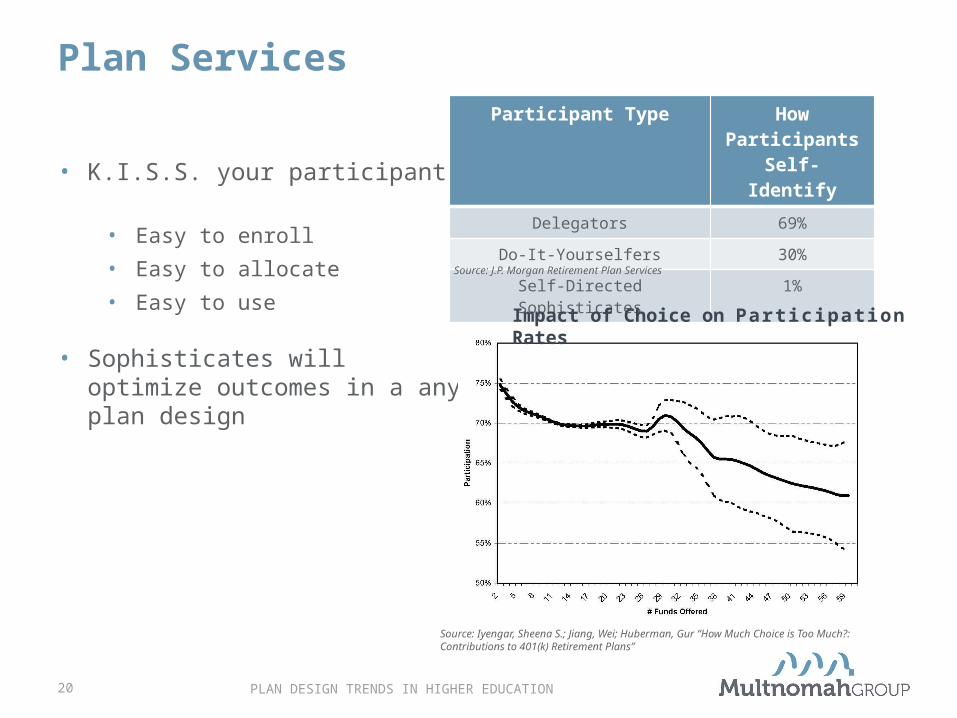
Plan Services
• K.I.S.S. your participants• Easy to enroll
• Easy to allocate
• Easy to use
• Sophisticates will optimize outcomes in a any plan design
Participant Type How Participants Self-Identify
Delegators 69%
Do-It-Yourselfers 30%
Self-Directed Sophisticates 1%
Source: J.P. Morgan Retirement Plan Services
Impact of Choice on Part icipat ion Rates
Source: Iyengar, Sheena S.; Jiang, Wei; Huberman, Gur “How Much Choice is Too Much?: Contributions to 401(k) Retirement Plans”

PLAN DESIGN TRENDS IN HIGHER EDUCATION21
Investors Fail to Track the Market
Series10.00%
1.00%
2.00%
3.00%
4.00%
5.00%
6.00%
7.00%
8.00%
9.00%
10.00%
3.83%
9.14%
1.01%
6.89%
2.57%
Avg. Equity Investor S&P 500 Index Avg. Fixed Income Investor Barclays Agg Bond Index Inflation
Source: Dalbar, Inc. 2011 Quantitative Analysis of Investor Behavior
Annualized Returns for the 20 Years Ended 12/31/2010
PLAN DESIGN TRENDS IN HIGHER EDUCATION22
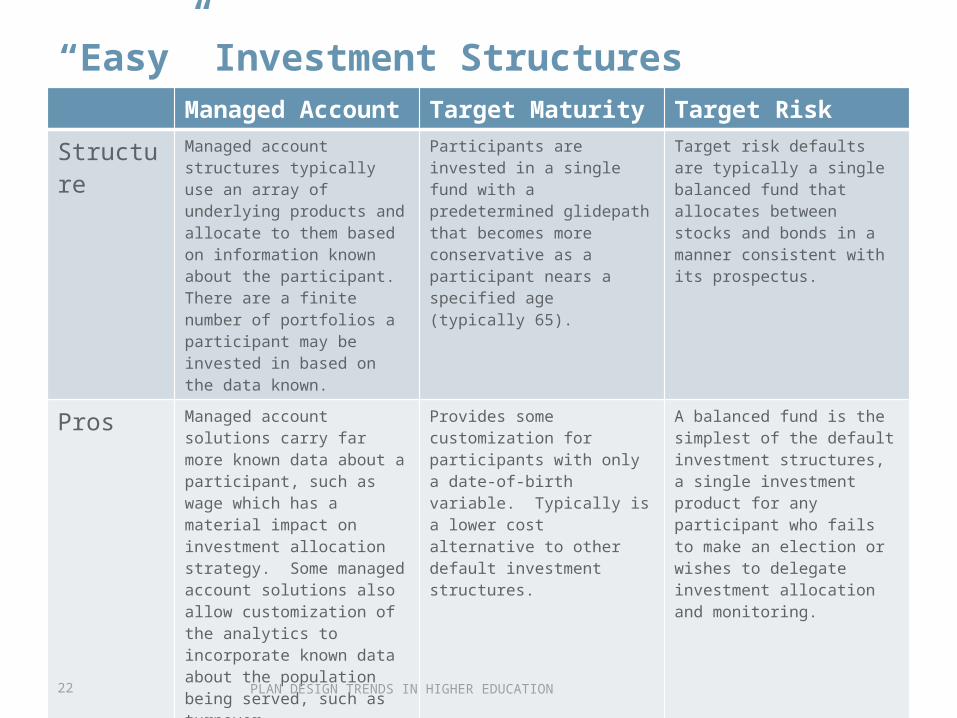
Managed Account Target Maturity Target Risk
Structure Managed account structures typically use an array of underlying products and allocate to them based on information known about the participant. There are a finite number of portfolios a participant may be invested in based on the data known.
Participants are invested in a single fund with a predetermined glidepath that becomes more conservative as a participant nears a specified age (typically 65).
Target risk defaults are typically a single balanced fund that allocates between stocks and bonds in a manner consistent with its prospectus.
Pros Managed account solutions carry far more known data about a participant, such as wage which has a material impact on investment allocation strategy. Some managed account solutions also allow customization of the analytics to incorporate known data about the population being served, such as turnover.
Provides some customization for participants with only a date-of-birth variable. Typically is a lower cost alternative to other default investment structures.
A balanced fund is the simplest of the default investment structures, a single investment product for any participant who fails to make an election or wishes to delegate investment allocation and monitoring.
Cons Can be a more expensive total cost of ownership as investment product costs are compounded by a managed account fee.
Age is an important factor in driving asset allocation strategy, but not the exclusive factor. Additionally, target date funds are typically closed solutions.
Target risk solutions invariable provide too much volatility for older works and too little equity exposure for younger workers.
“Easy” Investment Structures

PLAN DESIGN TRENDS IN HIGHER EDUCATION23
Investment Returns Cannot Fix Savings Problems
Percentile Single Target-Date Fund
Managed Account
All Other Participants
Mean 3.93% 3.65% 3.76%
5th 3.62% 2.20% -0.02%
25th 3.62% 3.08% 2.66%
50th 3.90% 3.66% 3.80%
75th 3.90% 4.22% 4.64%
95th 4.65% 5.06% 8.09%
Source: Vanguard 2011 “Participants During the Financial Crisis: Total Returns 2005-2010”
5 Year Annualized Returns (Period Ending 12/31/2010)

PLAN DESIGN TRENDS IN HIGHER EDUCATION24
Education has Limits“…policy makers should be very concerned that retirement education does not increase the likelihood that financially vulnerable groups – women, persons without a college degree, and particularly persons with lower incomes – will save their distributions”
U.S. Social Security Administration Office of Policy. “Does Retirement Education Teach People to Save Pension Distributions?”
Peer behavior may be as or more impactful on participant savings behavior than employee education
E. Duflo, E. Saez / Journal of Public Economics 85 (2002)

PLAN DESIGN TRENDS IN HIGHER EDUCATION25
Employee Education TipsDuring Enrollment1. Focus education on financial literacy and savings behaviors2. Deemphasize the importance of investment selection on retirement plan
participation3. Do not require education as a predecessor to participation4. Appreciate the importance of peer group behavior and leadership in
furthering retirement plan performance
During Accumulation5. Begin educating on external factors on retirement (healthcare, insurance,
social security, etc.)6. Highlight the effectiveness of current behaviors and the culture of savings
and participation7. Provide access to additional personal education resources to validate
savings goals and structure

PLAN DESIGN TRENDS IN HIGHER EDUCATION26
Pre-Retiree NeedsViewing the participant as a whole
1. Bringing retirement plan projections to a fine point• External assets
• Spousal income
• Spending needs
• Healthcare costs/resources
• Understanding federal and state resources
2. Advice for participants on how to secure and protect accumulated savings• Asset allocation
• Liquidity constraints
• Comprehensive retirement planning
3. Transitioning accumulations to income• Annuity options
• Income planning

PLAN DESIGN TRENDS IN HIGHER EDUCATION27
The Optimal Higher Education Plan Design
Easy to Start
Leak-proof
Safe to Leave
1. Automatic Enrollment and investment
2. Automatic escalation towards full retirement preparedness
1. Limit loans2. Limit hardships3. Encourage retirement
rollover
1. Extensive education, planning, and projections
2. Focus on retirement as the goal
PLAN DESIGN TRENDS IN HIGHER EDUCATION28
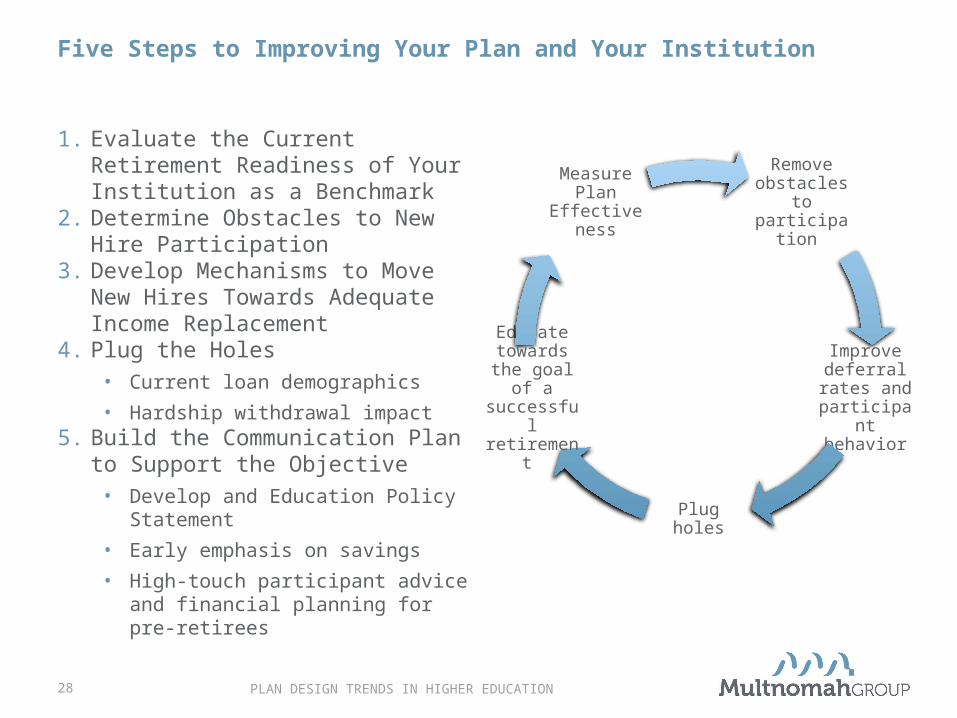
Five Steps to Improving Your Plan and Your Institution
1. Evaluate the Current Retirement Readiness of Your Institution as a Benchmark
2. Determine Obstacles to New Hire Participation
3. Develop Mechanisms to Move New Hires Towards Adequate Income Replacement
4. Plug the Holes• Current loan demographics
• Hardship withdrawal impact5. Build the Communication Plan to
Support the Objective• Develop and Education Policy
Statement
• Early emphasis on savings
• High-touch participant advice and financial planning for pre-retirees
Remove obstacles to participation
Improve deferral rates
and participant behavior
Plug holes
Educate towards the
goal of a successful retirement
Measure Plan
Effectiveness

PLAN DESIGN TRENDS IN HIGHER EDUCATION29
DisclosuresMultnomah Group, Inc. is an Oregon corporation and SEC registered investment adviser.
Investment performance and returns are based on historical information and are not a guarantee of future performance. Investing contains risk. Some asset classes involve significantly higher risk because of the nature of the investments and the low liquidity/high volatility of the securities.
Any information and materials contained herein or on our website are provided for general informational purposes only and are not intended to be comprehensive for any particular subject. Multnomah Group utilizes information from third party sources believed to be reliable but not guaranteed, and as a result, information is provided to you "as is." We do not represent, guarantee, or provide any warranties (either express or implied) regarding the completeness, accuracy, or currency of information or its suitability for any particular purpose. Multnomah Group shall not be liable to you or any third party resulting from any use or misuse of information provided.
Receipt of information or materials provided herein or on our website does not create an adviser-client relationship between Multnomah Group and you. Multnomah Group does not provide tax or legal advice or opinions. You should consult with your own tax or legal adviser for advice about your specific situation.