traffic collision statistics 2006 - digital...
TRANSCRIPT
TRAFFICCOLLISIONSTATISTICSPolice-attendedInjury and Fatal Collisions
British Columbia 2006

Canadian Cataloguing in Publication DataMain entry under title:British Columbia traffic collision statistics/ Motor Vehicle Branch. -- 1994- Annual Title from cover. Continues: Traffic accident statistics. ISSN 0847-1517. ISSN 1203-8008 = British Columbia traffic collision statistics 1. Traffic accidents - British Columbia - Statistics - Periodicals. I. British Columbia. Motor-Vehicle Branch.HE5614.5.C3B74 363.12_52_09711021C96-960010-0

IntroductionAttention: Important changes for 2006The 2006 publication reflects an important change in thecounting of a fatal collision resulting from a revision of theexclusion criteria, a reconciliation of fatalities in the TrafficAccident System with those in the Coroners' database and asubsequent cleaning of the data. In past years, collisions onindustrial roads and some collisions on forestry roadsinvolving private vehicles were eligible for inclusion in theTraffic Accident System. These fatal collisions wereexcluded in 2006. In addition, a reconciliation with fatalities in the Coroners' database resulted in identification ofadditional ineligible cases where death occurred off-road, on private property or was due to natural causes. These fatalcollisions have always been ineligible according to thecriteria laid out in the Traffic Accident Reporting PoliceProcedures Manual. However previous years' data were not cleaned. The 2006 fatal collision and fatality counts aretherefore lower than they would have been in the absence ofthe revised process and are not directly comparable withpublished counts for previous years. Previous years' dataare undergoing reconciliation and cleaning and will berevised in future publications. Chapter 17 Police Jurisdiction Report was revised in 2006 to include all collision reports received, both attended andunattended.OverviewBritish Columbia’s Traffic Accident System compiles andmaintains information on all traffic collisions in the provincereported to the police. Traffic collision information is used todetermine collision trends over time and to identify problemfactors (e.g., driver, vehicle, environmental). The informationsupports road safety programs and enforcement campaigns suchas CounterAttack and Operation Impact. It is used to evaluateprovincial road safety initiatives, for monitoring of commercialvehicle collision trends and commercial vehicle safetyprograms; for identification of highway locations which mayrequire improvement; for highway planning; and for guiding the development of new policies and programs to reduce thefrequency and severity of collisions in the province.Data extracted from the system are used in planning andresearch by the Insurance Corporation of British Columbia(ICBC), provincial government ministries and by the federalgovernment. The Ministry of Transportation and municipalengineering departments across the province rely on trafficcollision data to assist in the planning, design and improvementof roads and highways. The Royal Canadian Mounted Police(RCMP) and municipal police forces also use the data to assistin determining law enforcement priorities and locations to target traffic enforcement.
Data collection and processingMotor vehicle collisions are reportable in British Columbia ifthey result in personal injury or death or aggregate propertydamage in excess of $1,000 ($600 for a motorcycle). Thedamage level thresholds were amended on January 1, 1991 from a previous level of $400. A driver is required to report acollision to police within 24 hours of occurrence (48 hours ifthe collision occurred outside a municipality).The Traffic Accident Police Investigation Report (MV6020,formerly known as MV104) is completed by a police officer oremployee. When a police officer attends a collision, the reportis most often completed at the scene. In many policejurisdictions, the police do not attend all reportable collisions; in the case of unattended collisions, a driver is required to reportthe collision to a police station if it meets the injury or aggregate damage criteria. These collision reports are referred to as“unattended” or “self-reports.” Some police jurisdictions nolonger accept self-reports at the counter, with the result thatthese “reportable” collisions do not get recorded and are lost tothe system. In most cases, these are non-injury collisions. Thepolice forward completed MV6020s to the ICBC office inVictoria. ICBC staff review and microfilm the forms and thenenter the data into an Oracle database. In 1996, significant changes took place in police reporting ofcollisions. Many police agencies changed their standards orpractices for collision reporting, thus resulting in fewer reported collisions overall, in particular those involving property damage only or minor injury. A few jurisdictions even suspended thesubmission of all MV104s to MVB/ICBC. Such changesrendered year to year comparisons of annual collision statisticsuntenable. By January 1999, all police jurisdictions hadresumed full submission of completed collision reports,although police attendance at collisions has remained wellbelow pre-1996 levels. The reporting level appears to havestabilised since 1999.This publicationIn order to maintain this report as a consistent source of annualcollisions statistics, information provided includes onlypolice-attended personal injury and fatal collisions. Thedecision to exclude property damage only collisions andunattended collisions was due to the changes in collisionreporting standards and practices by the police, resulting in adeclining number of self-reported collisions. Following thepractice of reports for the past several years, the 2006 AnnualTraffic Collision Statistics Report has been based onpolice-reported injury collisions and all fatal collisions. A verysmall number of unattended fatal collisions are included.. British Columbia Collision Statistics - police attended injury and fatal collisions I
ii
Introduction British Columbia Collision Statistics - police attended injury and fatal collisions
If you have questions regarding the contents of this publication, please contact: Insurance Corporation of British Columbia Road Safety Research P.O. Box 3750 Victoria, British Columbia V8W 3Y5Telephone: (250) 414-7923 Fax: (250) 978-8025
Since the annual collision frequencies have stabilized in the past several years, some sections in this report now include a 5-yearsummary bar chart to demonstrate the changes in the five yearperiod. This publication is based on data extracted from the TrafficAccident System on December 2, 2007. Due to the dynamicnature of the database, all numbers reported in this publicationmay be subject to changes over time.
Further InformationWe hope that this publication will provide you with the answersyou are seeking about collisions in British Columbia. Theultimate goal is to increase public awareness of the importanceof safe driving and to contribute to improved traffic safety onBritish Columbia’s roads and highways. Better informationleads to better solutions.
ContentsSECTION 1 – Summary Statistics & Historical Trends · · · · · · · · · · · · · · · · · · · · · · · · · · · 1Table 1.01 – Long term traffic collision and casualty statistics · · · · · · · · · · · · · · · · · · · · · · · · · · · · · · · · · · 2Figure 1.01 – Twenty year reported traffic fatality trend: 1987 - 2006 · · · · · · · · · · · · · · · · · · · · · · · · · · · · · · 2Figure 1.02 – Ten year reported collision trend: 1997 - 2006 · · · · · · · · · · · · · · · · · · · · · · · · · · · · · · · · · · · 3Table 1.02 – Summary statistics: Collisions and victims· · · · · · · · · · · · · · · · · · · · · · · · · · · · · · · · · · · · · · 3Table 1.03 – Summary population statistics: BC population, drivers and vehicles · · · · · · · · · · · · · · · · · · · · · · · · 4Table 1.04 – Reported collisions by police attendance: 1997 – 2006 · · · · · · · · · · · · · · · · · · · · · · · · · · · · · · · 4Figure 1.03 – Property damage only collisions by police attendance · · · · · · · · · · · · · · · · · · · · · · · · · · · · · · · 5Figure 1.04 – Injury collisions by police attendance · · · · · · · · · · · · · · · · · · · · · · · · · · · · · · · · · · · · · · · · 5Figure 1.05 – Total number of collisions by police attendance · · · · · · · · · · · · · · · · · · · · · · · · · · · · · · · · · · 5SECTION 2 – Time of Occurrence in 2006 Collisions · · · · · · · · · · · · · · · · · · · · · · · · · · · · 7Table 2.01 – Collisions and victims by month· · · · · · · · · · · · · · · · · · · · · · · · · · · · · · · · · · · · · · · · · · · 8Figure 2.01 – Distribution of collisions and victims by month · · · · · · · · · · · · · · · · · · · · · · · · · · · · · · · · · · 8Figure 2.02 – Distribution of collisions and victims by day of week · · · · · · · · · · · · · · · · · · · · · · · · · · · · · · · 8Table 2.02 – Collisions and victims by day of week · · · · · · · · · · · · · · · · · · · · · · · · · · · · · · · · · · · · · · · 9Table 2.03 – Collisions and victims by collision hour · · · · · · · · · · · · · · · · · · · · · · · · · · · · · · · · · · · · · · 9Figure 2.03 – Distribution of casualty collisions and victims by collision hour · · · · · · · · · · · · · · · · · · · · · · · · · 10Table 2.04 – Victims in 2006 holiday collisions · · · · · · · · · · · · · · · · · · · · · · · · · · · · · · · · · · · · · · · · · 10SECTION 3 – Contributing Factors in 2006 Collisions · · · · · · · · · · · · · · · · · · · · · · · · · · 11Table 3.01 – Frequency of contributing factors in collisions by category · · · · · · · · · · · · · · · · · · · · · · · · · · · · 12Figure 3.01 – Top five human condition contributing factors in casualty collisions · · · · · · · · · · · · · · · · · · · · · · · 12Figure 3.02 – Top five human action contributing factors in casualty collisions · · · · · · · · · · · · · · · · · · · · · · · · · 12Table 3.02 – Frequency of human condition factors in injury and fatal collisions · · · · · · · · · · · · · · · · · · · · · · · 13Table 3.03 – Frequency of human action factors in injury and fatal collisions· · · · · · · · · · · · · · · · · · · · · · · · · · 13Table 3.04 – Frequency of environmental factors in injury and fatal collisions · · · · · · · · · · · · · · · · · · · · · · · · · 14Figure 3.03 – Top five environmental factors in casualty collisions · · · · · · · · · · · · · · · · · · · · · · · · · · · · · · · 14Table 3.05 – Frequency of vehicle factors in injury and fatal collisions · · · · · · · · · · · · · · · · · · · · · · · · · · · · · 15Figure 3.04 – Top five vehicle condition factors in casualty collisions· · · · · · · · · · · · · · · · · · · · · · · · · · · · · · 15Table 3.06 – Contributing factors in collisions in order of magnitude: By number of collisions · · · · · · · · · · · · · · · · 16Figure 3.05 – Top ten contributing factors in collisions by percentage of total collisions · · · · · · · · · · · · · · · · · · · · 16Table 3.07 – Contributing factors in fatal collisions in order of magnitude: By number of collisions · · · · · · · · · · · · · · 17Figure 3.06 – Top five contributing factors in fatal collisions by percentage of total fatal collisions · · · · · · · · · · · · · · 17SECTION 4 – Victims in 2006 Collisions · · · · · · · · · · · · · · · · · · · · · · · · · · · · · · · · · · 19Table 4.01 – Victims injured by road user class by month · · · · · · · · · · · · · · · · · · · · · · · · · · · · · · · · · · · · 20Figure 4.01 – Classification of injured victims by road user class · · · · · · · · · · · · · · · · · · · · · · · · · · · · · · · · 20Table 4.02 – Victims killed by road user class by month · · · · · · · · · · · · · · · · · · · · · · · · · · · · · · · · · · · · · 21Figure 4.02 – Classification of victims killed by road user class · · · · · · · · · · · · · · · · · · · · · · · · · · · · · · · · · 21Table 4.03 – Victims injured by road user class and age · · · · · · · · · · · · · · · · · · · · · · · · · · · · · · · · · · · · · 22Table 4.04 – Victims killed by road user class and age · · · · · · · · · · · · · · · · · · · · · · · · · · · · · · · · · · · · · · 23Table 4.05 – Victims Injured by age and gender · · · · · · · · · · · · · · · · · · · · · · · · · · · · · · · · · · · · · · · · · 24Figure 4.03 – Number of injured victims by age and gender · · · · · · · · · · · · · · · · · · · · · · · · · · · · · · · · · · · 24Table 4.06 – Victims killed by age and gender · · · · · · · · · · · · · · · · · · · · · · · · · · · · · · · · · · · · · · · · · · 25Figure 4.04 – Number of victims killed by age and gender · · · · · · · · · · · · · · · · · · · · · · · · · · · · · · · · · · · 25Table 4.07 – Injury class and injury status · · · · · · · · · · · · · · · · · · · · · · · · · · · · · · · · · · · · · · · · · · · · 25Table 4.08 – Location of most severe injury and injury type (fatal and non-fatal injuries) · · · · · · · · · · · · · · · · · · · 26Table 4.09 – Victims by location of most severe injury · · · · · · · · · · · · · · · · · · · · · · · · · · · · · · · · · · · · · 26Table 4.10 – Victims by injury type · · · · · · · · · · · · · · · · · · · · · · · · · · · · · · · · · · · · · · · · · · · · · · · 26
iii

SECTION 5 - Motor Vehicle Drivers in 2006 Collisions · · · · · · · · · · · · · · · · · · · · · · · · · · 27Figure – Licensed driver population by age · · · · · · · · · · · · · · · · · · · · · · · · · · · · · · · · · · · · · · · · · · · 27Table 5.01 – Comparison of licensed drivers and drivers involved in injury and fatal collisions by age · · · · · · · · · · · · · 28Table 5.02 – Age and gender of drivers involved in collisions · · · · · · · · · · · · · · · · · · · · · · · · · · · · · · · · · · 29Table 5.03 – BC driver licence class by driver type: Drivers involved in injury collisions · · · · · · · · · · · · · · · · · · · 30Table 5.04 – BC driver licence class by driver type: Drivers involved in fatal collisions · · · · · · · · · · · · · · · · · · · · 30Table 5.05 – Definitions of BC driver licence classes · · · · · · · · · · · · · · · · · · · · · · · · · · · · · · · · · · · · · · 30SECTION 6 – Vehicles in 2006 Collisions · · · · · · · · · · · · · · · · · · · · · · · · · · · · · · · · · · 31Table 6.01 – Number of vehicles involved in collisions by month · · · · · · · · · · · · · · · · · · · · · · · · · · · · · · · · 31Table 6.02 – Number of vehicles involved in collisions by vehicle use · · · · · · · · · · · · · · · · · · · · · · · · · · · · · 31Table 6.03 – Collisions by vehicle type · · · · · · · · · · · · · · · · · · · · · · · · · · · · · · · · · · · · · · · · · · · · · 32Table 6.04 – Number of vehicles involved in collisions by vehicle type · · · · · · · · · · · · · · · · · · · · · · · · · · · · · 32Table 6.05 – Vehicles involved in collisions by vehicle use and type · · · · · · · · · · · · · · · · · · · · · · · · · · · · · · 33Table 6.06 – Stolen vehicles in 2006 collisions by month · · · · · · · · · · · · · · · · · · · · · · · · · · · · · · · · · · · · 34SECTION 7 – Occupant Restraint Use in 2006 Collisions · · · · · · · · · · · · · · · · · · · · · · · · · 35Table 7.01 – Type of restraint used by driver · · · · · · · · · · · · · · · · · · · · · · · · · · · · · · · · · · · · · · · · · · · 35Table 7.02 – Type of restraint used by passengers · · · · · · · · · · · · · · · · · · · · · · · · · · · · · · · · · · · · · · · · 35Table 7.03 – Restraint used by victims injured in collisions by position in vehicle · · · · · · · · · · · · · · · · · · · · · · · 36Table 7.04 – Restraint used by victims killed in collisions by position in vehicle · · · · · · · · · · · · · · · · · · · · · · · · 36Table 7.05 – Driver age by restraint use for drivers injured · · · · · · · · · · · · · · · · · · · · · · · · · · · · · · · · · · · 37Table 7.06 – Driver age by restraint use for drivers killed · · · · · · · · · · · · · · · · · · · · · · · · · · · · · · · · · · · · 38Figure 7.01 – Restraint use by drivers injured · · · · · · · · · · · · · · · · · · · · · · · · · · · · · · · · · · · · · · · · · · 39Figure 7.02 – Restraint use by drivers killed · · · · · · · · · · · · · · · · · · · · · · · · · · · · · · · · · · · · · · · · · · · 39Table 7.07 – Passenger age by restraint use for injured passengers · · · · · · · · · · · · · · · · · · · · · · · · · · · · · · · 40Table 7.08 – Passenger age by restraint use for passengers killed · · · · · · · · · · · · · · · · · · · · · · · · · · · · · · · · 41Figure 7.03 – Restraint use by injured passengers · · · · · · · · · · · · · · · · · · · · · · · · · · · · · · · · · · · · · · · · 42Figure 7.04 – Restraint use by passengers killed · · · · · · · · · · · · · · · · · · · · · · · · · · · · · · · · · · · · · · · · · 42Table 7.09 – Ejection of drivers and injury outcome in casualty collisions· · · · · · · · · · · · · · · · · · · · · · · · · · · · 43Table 7.10 – Ejection of passengers and injury outcome in casualty collisions· · · · · · · · · · · · · · · · · · · · · · · · · · 43Table 7.11 – Restraint use and occupant ejection for vehicle occupants · · · · · · · · · · · · · · · · · · · · · · · · · · · · · 43Table 7.12 – Restraint use by victims injured by vehicle type · · · · · · · · · · · · · · · · · · · · · · · · · · · · · · · · · · 44Table 7.13 – Restraint use by victims killed by vehicle type · · · · · · · · · · · · · · · · · · · · · · · · · · · · · · · · · · · 45SECTION 8 – Environmental Conditions and Collision Context · · · · · · · · · · · · · · · · · · · · · 47Table 8.01 – Collisions by road surface type · · · · · · · · · · · · · · · · · · · · · · · · · · · · · · · · · · · · · · · · · · · 47Table 8.02 – Collisions by roadway surface condition · · · · · · · · · · · · · · · · · · · · · · · · · · · · · · · · · · · · · · 47Table 8.03 – Collisions by lighting condition· · · · · · · · · · · · · · · · · · · · · · · · · · · · · · · · · · · · · · · · · · · 48Table 8.04 – Collisions by weather condition· · · · · · · · · · · · · · · · · · · · · · · · · · · · · · · · · · · · · · · · · · · 48Table 8.05 – Collisions by land usage · · · · · · · · · · · · · · · · · · · · · · · · · · · · · · · · · · · · · · · · · · · · · · 48Table 8.06 – Collisions by collision location · · · · · · · · · · · · · · · · · · · · · · · · · · · · · · · · · · · · · · · · · · · 48Table 8.07 – Collisions by road jurisdiction · · · · · · · · · · · · · · · · · · · · · · · · · · · · · · · · · · · · · · · · · · · 49Table 8.08 – Collisions by speed limit · · · · · · · · · · · · · · · · · · · · · · · · · · · · · · · · · · · · · · · · · · · · · · 49Table 8.09 – Collisions by advisory speed limit · · · · · · · · · · · · · · · · · · · · · · · · · · · · · · · · · · · · · · · · · 49Figure 8.01 – Proportion of fatal to total casualty collisions by speed limit · · · · · · · · · · · · · · · · · · · · · · · · · · · 50Table 8.10 – Collisions by traffic control device · · · · · · · · · · · · · · · · · · · · · · · · · · · · · · · · · · · · · · · · · 50Table 8.11 – Collisions at intersection by traffic control device · · · · · · · · · · · · · · · · · · · · · · · · · · · · · · · · · 50Table 8.12 – Traffic control device and collision location · · · · · · · · · · · · · · · · · · · · · · · · · · · · · · · · · · · · 51Table 8.13 – Fatal collision by regular speed limit and advisory speed limit · · · · · · · · · · · · · · · · · · · · · · · · · · · 51Table 8.14 – Injury collision by regular speed limit and advisory speed limit · · · · · · · · · · · · · · · · · · · · · · · · · · 52SECTION 9 – Collision Configurations in 2006· · · · · · · · · · · · · · · · · · · · · · · · · · · · · · · 53Figure – Single and multiple vehicle collisions by collision type· · · · · · · · · · · · · · · · · · · · · · · · · · · · · · · · · 53Table 9.01 – Collisions by primary collision occurrence · · · · · · · · · · · · · · · · · · · · · · · · · · · · · · · · · · · · · 53Table 9.02 – Single vehicle collisions by primary collision occurrence · · · · · · · · · · · · · · · · · · · · · · · · · · · · · 53Table 9.03 – Non-single vehicle collisions by primary collision occurrence · · · · · · · · · · · · · · · · · · · · · · · · · · · 54Table 9.04 – Multi-vehicle collisions by primary collision occurrence · · · · · · · · · · · · · · · · · · · · · · · · · · · · · 54SECTION 10 – Alcohol Related Collisions in 2006 · · · · · · · · · · · · · · · · · · · · · · · · · · · · · 55iv
Table 10.01 – Alcohol related collisions and victims by month · · · · · · · · · · · · · · · · · · · · · · · · · · · · · · · · · 56Figure 10.01 – Alcohol related collisions: Collisions and victims by month · · · · · · · · · · · · · · · · · · · · · · · · · · · 56Table 10.02 – Alcohol related collisions by alcohol factors and month · · · · · · · · · · · · · · · · · · · · · · · · · · · · · 57Table 10.03 – Victims in alcohol related collisions by alcohol factors and month · · · · · · · · · · · · · · · · · · · · · · · · 57Table 10.04 – Alcohol related injury collisions by day of week and hour of collision · · · · · · · · · · · · · · · · · · · · · · 58Figure 10.02 – Distribution of alcohol related collisions and victims by collision hour · · · · · · · · · · · · · · · · · · · · · 59Figure 10.03 – Distribution of alcohol related collisions and victims by day of week · · · · · · · · · · · · · · · · · · · · · · 59Table 10.05 – Alcohol related fatal collisions by day of week and hour of collision · · · · · · · · · · · · · · · · · · · · · · 60Figure 10.04 – Drinking drivers involved in alcohol related collisions by driver age and gender · · · · · · · · · · · · · · · · 61Figure 10.05 – Non drinking drivers involved in alcohol related collisions · · · · · · · · · · · · · · · · · · · · · · · · · · · 61Table 10.06 – Drinking drivers involved in alcohol related collisions by driver age and gender · · · · · · · · · · · · · · · · 62Table 10.07 – Drivers in alcohol-related collisions by age and gender – Non drinking drivers · · · · · · · · · · · · · · · · · 62Table 10.08 – Drinking drivers involved in alcohol related collisions compared to all licensed drivers by age · · · · · · · · · 63Table 10.09 – Victims injured in alcohol related collisions by victim age and road user class · · · · · · · · · · · · · · · · · · 64Table 10.10 – Victims killed in alcohol related collisions by victim age and road user class · · · · · · · · · · · · · · · · · · 65Table 10.11 – Victims injured in alcohol-related collisions in drinking drivers’ vehicles by victim age and road user class (orwhere pedestrian was drinking) · · · · · · · · · · · · · · · · · · · · · · · · · · · · · · · · · · · · · · · · · · · · · · · 66Figure 10.06 – Victims injured in alcohol related collisions · · · · · · · · · · · · · · · · · · · · · · · · · · · · · · · · · · · 67Figure 10.07 – Victims killed in alcohol related collisions · · · · · · · · · · · · · · · · · · · · · · · · · · · · · · · · · · · · 67Table 10.12 – Victims killed in alcohol-related collisions in drinking drivers’ vehicles by victim age and road user class (orwhere pedestrian was drinking) · · · · · · · · · · · · · · · · · · · · · · · · · · · · · · · · · · · · · · · · · · · · · · · 68Table 10.13 – Victims injured by victim age and road user class for victims not in drinking driver’s vehicle in alcohol related collisions · · · · · · · · · · · · · · · · · · · · · · · · · · · · · · · · · · · · · · · · · · · · · · · · · · 69Table 10.14 – Victims killed by victim age and road user class for victims not in drinking driver’s vehicle · · · · · · · · · · 70SECTION 11 – Speed Related Collisions in 2006 · · · · · · · · · · · · · · · · · · · · · · · · · · · · · · 71Table 11.01 – Speed related collisions and victims by month · · · · · · · · · · · · · · · · · · · · · · · · · · · · · · · · · · 72Figure 11.01 – Speed type in speed related collisions by month · · · · · · · · · · · · · · · · · · · · · · · · · · · · · · · · · 72Table 11.02 – Speed related injury collisions by speed factors and month · · · · · · · · · · · · · · · · · · · · · · · · · · · · 73Table 11.03 – Victims in speed related collisions by speed factors and month · · · · · · · · · · · · · · · · · · · · · · · · · · 73Table 11.04 – Speed related injury collisions by day of week and hour of collision · · · · · · · · · · · · · · · · · · · · · · · 74Table 11.05 – Speed related fatal collisions by day of week and by hour of collisions· · · · · · · · · · · · · · · · · · · · · · 75Figure 11.02 – Speed related collisions and victims by collision hour · · · · · · · · · · · · · · · · · · · · · · · · · · · · · · 76Figure 11.03 – Speed related collisions and victims by day of week · · · · · · · · · · · · · · · · · · · · · · · · · · · · · · · 76Table 11.06 – Age and gender of speeding drivers involved in speed related collisions · · · · · · · · · · · · · · · · · · · · · 77Table 11.07 – Age and gender of non-speeding drivers involved in speed related collisions· · · · · · · · · · · · · · · · · · · 77Figure 11.04 – Speeding drivers involved in speed related collisions · · · · · · · · · · · · · · · · · · · · · · · · · · · · · · 78Figure 11.05 – Drivers not in speeding vehicles involved in speed related collisions · · · · · · · · · · · · · · · · · · · · · · 78Table 11.08 – Licensed drivers and drivers involved in speed related collisions (speeding drivers only) by age · · · · · · · · 79Table 11.09 – Victims injured by victim age and road user class in speed related collisions · · · · · · · · · · · · · · · · · · · 80Table 11.10 – Victims killed by victim age and road user class in speed related collisions · · · · · · · · · · · · · · · · · · · 81Table 11.11 – Victims injured in speeding vehicles by victim age and road user class· · · · · · · · · · · · · · · · · · · · · · 82Table 11.12 – Victims killed in speeding vehicles by victim age and road user class · · · · · · · · · · · · · · · · · · · · · · 83Figure 11.06 – Victims injured in speed related collisions in/not in speeding vehicles· · · · · · · · · · · · · · · · · · · · · · 84Figure 11.07 – Victims killed in speed related collisions in/not in speeding vehicles · · · · · · · · · · · · · · · · · · · · · · 84Table 11.13 – Victims injured in speed related collisions by victim age and road user class not in speeding vehicles · · · · · 85Table 11.14 – Victims killed in speed related collisions by victim age and road user class not in speeding vehicles · · · · · · 86Table 11.15 – Speed related collisions by speed limit and road jurisdiction – City/Municipal street· · · · · · · · · · · · · · · 86Table 11.16 – Speed related collisions by speed limit and road jurisdiction – Provincial highway · · · · · · · · · · · · · · · 87Table 11.17 – Speed related collisions by speed limit and road jurisdiction – Rural road · · · · · · · · · · · · · · · · · · · · 87SECTION 12 – Motorcycles in 2006 Collisions · · · · · · · · · · · · · · · · · · · · · · · · · · · · · · · 89Table 12.01 – Motorcycle collisions and victims by month · · · · · · · · · · · · · · · · · · · · · · · · · · · · · · · · · · · 90Figure 12.01 – Motorcycle collisions and victims by month · · · · · · · · · · · · · · · · · · · · · · · · · · · · · · · · · · · 90Table 12.02 – Contributing factors in motorcycle collisions – Motorcycle driver factors only: By number of collisions · · · · 91Table 12.03 – Contributing factors in motorcycle collisions – Other driver factors only: By number of collisions · · · · · · · 91Table 12.04 – Motorcycle collisions by primary collision occurrence · · · · · · · · · · · · · · · · · · · · · · · · · · · · · · 92Table 12.05 – Pre-collision action by collision type in motorcycle collisions: Motorcycle drivers· · · · · · · · · · · · · · · · 92Table 12.06 – Pre-collision action by collision type in motorcycle collisions: Other drivers· · · · · · · · · · · · · · · · · · · 92Table 12.07 – Collision location by collision type in motorcycle collisions · · · · · · · · · · · · · · · · · · · · · · · · · · · 92v

Table 12.08 – Motorcycle collisions by roadway surface condition · · · · · · · · · · · · · · · · · · · · · · · · · · · · · · · 93Table 12.09 – Motorcycle collisions by lighting condition · · · · · · · · · · · · · · · · · · · · · · · · · · · · · · · · · · · · 93Table 12.10 – Motorcycle collisions by weather condition · · · · · · · · · · · · · · · · · · · · · · · · · · · · · · · · · · · · 93Table 12.11 – Motorcycle collisions by collision hour · · · · · · · · · · · · · · · · · · · · · · · · · · · · · · · · · · · · · · 93Table 12.12 – Motorcycle collisions by driver age – Motorcycle drivers only · · · · · · · · · · · · · · · · · · · · · · · · · · 94Table 12.13 – Motorcycle collisions by driver age – Other driver involved · · · · · · · · · · · · · · · · · · · · · · · · · · · 94Figure 12.02 – Drivers involved in motorcycle collisions by age group – Motorcycle drivers only · · · · · · · · · · · · · · · 95Figure 12.03 – Drivers involved in motorcycle collisions by age group – Other drivers involved · · · · · · · · · · · · · · · · 95Table 12.14 – Motorcycle drivers and passengers injured and killed by helmet use and location of injury · · · · · · · · · · · 96Table 12.15 – Motorcycle drivers and passengers injured and killed by helmet usage and injury type· · · · · · · · · · · · · · 97Figure 12.04 – Percent of victims with head injury among helmeted and non-helmeted motorcycle drivers and passengers · · 98Figure 12.05 – Killed victims as a proportion of total casualties by helmet usage · · · · · · · · · · · · · · · · · · · · · · · · 98Table 12.16 – Helmet usage by motorcycle drivers and passengers · · · · · · · · · · · · · · · · · · · · · · · · · · · · · · · 98SECTION 13 – Pedestrians in 2006 Collisions · · · · · · · · · · · · · · · · · · · · · · · · · · · · · · · 99Table 13.01 – Pedestrian collisions and victims by month · · · · · · · · · · · · · · · · · · · · · · · · · · · · · · · · · · · 100Figure 13.01 – Pedestrian collisions and victims by month (includes both pedestrians and occupants of involved motor vehicles) · · · · · · · · · · · · · · · · · · · · · · · · · · · · · · · · · · · · · · · · · · · · · · · · · 100Table 13.02 – Pedestrian collisions by pedestrian action and pedestrian location · · · · · · · · · · · · · · · · · · · · · · · · 101Figure 13.02 – Pedestrian collisions by collision location· · · · · · · · · · · · · · · · · · · · · · · · · · · · · · · · · · · · 101Figure 13.03 – Pedestrian collisions by day of week · · · · · · · · · · · · · · · · · · · · · · · · · · · · · · · · · · · · · · 101Table 13.03 – Pedestrian injury collisions by day of week and hour of collision · · · · · · · · · · · · · · · · · · · · · · · · 102Table 13.04 – Pedestrian fatal collisions by day of week and hour of collision · · · · · · · · · · · · · · · · · · · · · · · · · 103Table 13.05 – Pedestrian victims injured by age and gender · · · · · · · · · · · · · · · · · · · · · · · · · · · · · · · · · · 104Figure 13.04 – Pedestrians injured by gender and age group · · · · · · · · · · · · · · · · · · · · · · · · · · · · · · · · · · 104Figure 13.05 – Pedestrians killed by gender and age group · · · · · · · · · · · · · · · · · · · · · · · · · · · · · · · · · · · 104Table 13.06 – Pedestrian victims killed by age and gender · · · · · · · · · · · · · · · · · · · · · · · · · · · · · · · · · · · 105Table 13.07 – Contributing factors in pedestrian collisions – Pedestrian factors only: By number of collisions · · · · · · · · 105Table 13.08 – Contributing factors in pedestrian collisions – Other driver factors only: By number of collisions · · · · · · · 106Table 13.09 – Pedestrians injured and killed by location of injury · · · · · · · · · · · · · · · · · · · · · · · · · · · · · · · 106Table 13.10 – Pedestrians injured and killed by type of injury · · · · · · · · · · · · · · · · · · · · · · · · · · · · · · · · · 106Table 13.11 – Pedestrians injured and killed by age and pedestrian action · · · · · · · · · · · · · · · · · · · · · · · · · · · 107SECTION 14 – Bicycles in 2006 Collisions · · · · · · · · · · · · · · · · · · · · · · · · · · · · · · · · · 109Table 14.01 – Bicycle collisions and victims by month · · · · · · · · · · · · · · · · · · · · · · · · · · · · · · · · · · · · · 110Figure 14.01 – Bicycle collisions and victims by month · · · · · · · · · · · · · · · · · · · · · · · · · · · · · · · · · · · · 110Table 14.02 – Contributing factors in bicycle collisions – Bicycle driver factors only · · · · · · · · · · · · · · · · · · · · · 111Table 14.03 – Contributing factors in bicycle collisions– Other driver factors only · · · · · · · · · · · · · · · · · · · · · · 111Table 14.04 – Bicycle collisions by primary collision occurrence· · · · · · · · · · · · · · · · · · · · · · · · · · · · · · · · 112Table 14.05 – Pre-collision action by collision type in bicycle collisions – Bicycles only · · · · · · · · · · · · · · · · · · · 112Table 14.06 – Pre-collision action by collision type in bicycle collisions – Other Vehicles · · · · · · · · · · · · · · · · · · 113Table 14.07 – Collision location of bicycle collisions · · · · · · · · · · · · · · · · · · · · · · · · · · · · · · · · · · · · · · 113Table 14.08 – Bicycle collisions by roadway surface condition · · · · · · · · · · · · · · · · · · · · · · · · · · · · · · · · · 113Table 14.09 – Bicycle collisions by lighting condition · · · · · · · · · · · · · · · · · · · · · · · · · · · · · · · · · · · · · 114Table 14.10 – Bicycle collisions by weather condition · · · · · · · · · · · · · · · · · · · · · · · · · · · · · · · · · · · · · 114Table 14.11 – Bicycle collisions by collision hour · · · · · · · · · · · · · · · · · · · · · · · · · · · · · · · · · · · · · · · 114Table 14.12 – Bicycle drivers involved in collisions by age· · · · · · · · · · · · · · · · · · · · · · · · · · · · · · · · · · · 115Table 14.13 – Bicycle drivers injured in bicycle collisions by age and gender · · · · · · · · · · · · · · · · · · · · · · · · 115Figure 14.02 – Bicycle drivers injured in bicycle collisions by age and gender · · · · · · · · · · · · · · · · · · · · · · · · · 116Table 14.14 – Bicycle drivers killed by age and gender in bicycle collisions · · · · · · · · · · · · · · · · · · · · · · · · · · 116Figure 14.03 – Percent of victims with head injury among helmeted and non-helmeted bicycle drivers in collisions · · · · · 116Table 14.15 – Bicycle drivers injured and killed by helmet usage and location of injury · · · · · · · · · · · · · · · · · · · · 116SECTION 15 – Commercial Vehicles, Emergency Vehicles, Taxis and School Buses in Collisions · · 117Table 15.01 – Commercial vehicle collisions and victims by month · · · · · · · · · · · · · · · · · · · · · · · · · · · · · · 118Figure 15.01 – Commercial vehicle collisions and victims by month · · · · · · · · · · · · · · · · · · · · · · · · · · · · · 118Table 15.02 – Contributing factors in commercial vehicle collisions – Commercial vehicle driver factors only: By number of collisions · · · · · · · · · · · · · · · · · · · · · · · · · · · · · · · · · · · · · · · · · · · · · · · · · · · 119vi

Figure 15.02 – Top five contributing factors in commercial vehicle collisions (commercial vehicle driver factors only) as a percentage of total commercial vehicle collisions · · · · · · · · · · · · · · 119Table 15.03 – Contributing factors in commercial vehicle collisions – Other driver factors only: By number of collisions · · 120Figure 15.03 – Top five contributing factors in commercial vehicle collisions (other driver factors only) as a percentage of total commercial vehicle collisions· · · · · · · · · · · · · · · · · · · · · · · · · · · · · · · · · · · · 120Table 15.04 – Vehicle factors in commercial vehicle collisions: Commercial vehicle factors only · · · · · · · · · · · · · · · 120Table 15.05 – Number of commercial vehicles involved in collisions by vehicle type · · · · · · · · · · · · · · · · · · · · · 121Table 15.06 – Commercial vehicle collisions by primary collision occurrence · · · · · · · · · · · · · · · · · · · · · · · · · 121Table 15.07 – Collision location of commercial vehicle collisions · · · · · · · · · · · · · · · · · · · · · · · · · · · · · · · 121Table 15.08 – BC driver licence class of commercial vehicle drivers by vehicle type: injury collisions · · · · · · · · · · · · 122Table 15.09 – BC driver licence class of commercial vehicle drivers by vehicle type: fatal collisions · · · · · · · · · · · · · 122Table 15.10 – Emergency vehicle, taxi and school bus collisions by month · · · · · · · · · · · · · · · · · · · · · · · · · · 123Table 15.11 – Victims in emergency vehicle, taxi and school bus collisions by month · · · · · · · · · · · · · · · · · · · · · 123Table 15.12 – Contributing factors in emergency vehicle collisions – Emergency vehicle driver factors only: By number ofcollisions · · · · · · · · · · · · · · · · · · · · · · · · · · · · · · · · · · · · · · · · · · · · · · · · · · · · · · · · · · · 124Table 15.13 – Contributing factors in emergency vehicle collisions – Other vehicle driver factors only: By number of collisions· · · · · · · · · · · · · · · · · · · · · · · · · · · · · · · · · · · · · · · · · · · · · · · · · · · · · · · · · · · · · · · · 124Table 15.14 – Contributing factors in taxi collisions – Taxi driver factors only: By number of collisions · · · · · · · · · · · 125Table 15.15 – Contributing factors in taxi collisions – Other vehicle driver factors only: By number of collisions · · · · · · 125Table 15.16 – Contributing factors in school bus collisions – School bus driver factors only: By number of collisions · · · · 126Table 15.17 – Contributing factors in school bus collisions – Other vehicle driver factors only: By number of collisions · · · 126Table 15.18 – Emergency vehicle, taxi and school bus collisions by primary collision occurrence· · · · · · · · · · · · · · · 127SECTION 16 – Heavy Commercial Vehicles in 2006 Collisions · · · · · · · · · · · · · · · · · · · · · 129Table 16.01 – Heavy Commercial vehicle collisions and victims by month · · · · · · · · · · · · · · · · · · · · · · · · · · 130Figure 16.01 – Heavy commercial vehicle collisions and victims by month · · · · · · · · · · · · · · · · · · · · · · · · · · 130Figure 16.02 – Top five contributing factors in heavy commercial vehicle collisions:Heavy commercial vehicle driver factors only· · · · · · · · · · · · · · · · · · · · · · · · · · · · · · · · · · · · · · · · 130Table 16.02 – Contributing factors in heavy commercial vehicle collisions – Heavy Commercial vehicle driverfactors only: By number of collisions · · · · · · · · · · · · · · · · · · · · · · · · · · · · · · · · · · · · · · · · · · · · 131Table 16.03 – Contributing factors in heavy commercial vehicle collisions – Other driver factors only: By number of collisions · · · · · · · · · · · · · · · · · · · · · · · · · · · · · · · · · · · · · · · · · · · · · · · · · · · 131Figure 16.03 – Top five contributing factors in heavy commercial vehicle collisions:Other vehicle driver factors only· · · · · · · · · · · · · · · · · · · · · · · · · · · · · · · · · · · · · · · · · · · · · · · 132Table 16.04 – Vehicle factors in heavy commercial vehicle collisions: Heavy commercial vehicles only · · · · · · · · · · · 132Table 16.05 – Heavy commercial vehicle collisions by primary collision occurrence · · · · · · · · · · · · · · · · · · · · · 132Table 16.06 – Collision location of heavy commercial vehicle collisions · · · · · · · · · · · · · · · · · · · · · · · · · · · · 132Table 16.07 – Heavy commercial vehicle collisions by roadway surface condition· · · · · · · · · · · · · · · · · · · · · · · 133Table 16.08 – Heavy commercial vehicle collisions by lighting condition · · · · · · · · · · · · · · · · · · · · · · · · · · · 133Table 16.09 – Heavy commercial vehicle collisions by weather condition · · · · · · · · · · · · · · · · · · · · · · · · · · · 133Table 16.10 – Driver age in heavy commercial vehicle collisions:Heavy commercial vehicle drivers only · · · · · · · · · · 133Table 16.11 – BC driver licence class of heavy commercial vehicle drivers by vehicle type: Injury collisions· · · · · · · · · 134Table 16.12 – BC driver licence class of heavy commercial vehicle drivers by vehicle type: Fatal collisions · · · · · · · · · 134SECTION 17 – Police Jurisdiction Reports · · · · · · · · · · · · · · · · · · · · · · · · · · · · · · · · 135Table 17.01 – Collisions and victims by police jurisdiction in Southeast District (RCMP) · · · · · · · · · · · · · · · · · · · 135Table 17.02 – Collisions and victims by police jurisdiction in North District (RCMP) · · · · · · · · · · · · · · · · · · · · · 136Table 17.03 – Collisions and victims by police jurisdiction in Lower Mainland District (RCMP) · · · · · · · · · · · · · · · 137Table 17.04 – Collisions and victims by police jurisdiction in Island District (RCMP) · · · · · · · · · · · · · · · · · · · · · 138Table 17.05 – Collisions and victims by police jurisdiction – Indpendent Forces· · · · · · · · · · · · · · · · · · · · · · · · 139Table 17.06 – Collisions and victims by police jurisdiction – Other Forces and Locations · · · · · · · · · · · · · · · · · · · 139Table 17.07 – Collisions and victims by police jurisdiction – First Nation Police Forces· · · · · · · · · · · · · · · · · · · · 139
vii

viii British Columbia Collision Statistics - police attended injury and fatal collisions

GlossaryAbility Impaired by AlcoholThe police officer has evidence that alcohol impaired theindividual’s driving ability. The level of impairment will bereflected in the fact the individual received a 24 hour suspension or was charged with impaired driving. Ability Impaired by DrugsThe police officer has evidence that drugs impaired theindividual’s driving ability. The level of impairment will bereflected in the fact the individual received a 24 hour suspension or was charged with impaired driving.Ability Impaired by MedicationThe police officer has evidence that medication impaired theindividual’s driving ability. This is used when a person hastaken medication legally for medicinal purposes. The level ofimpairment will be reflected in the fact the individual received a 24 hour suspension or was charged with impaired driving.Advisory Speed ZoneThis speed is posted as an “advisory” change to the overallPosted/Not Posted Speed Limit that is always in effect. e.g. atsharp curves.Air BagInflatable safety device usually stored in vehicle dashboard orsteering wheel/column. Upon impact, bag is released andinflated to cushion vehicle occupants and prevent serious injury.Alcohol SuspectedThe police officer has some evidence to suspect the individualmay have consumed alcohol but does not have enough evidence to prove impairment. The driver is not given a 24 hoursuspension or charged with impaired driving.A.T.V.All Terrain Vehicle: any type of vehicle propelled by motorizedpower and capable of travel on or off a highway as defined inthe HIGHWAY ACT and that is designated as an All TerrainVehicle by regulation under the ALL TERRAIN VEHICLEACT.Bicycle“Cycle Bi/Tri” 2 or 3 wheeled, pedal driven vehicle.Child RestraintFederally approved child safety seat.CollisionThe encounter of a moving vehicle with another moving vehicle or with a fixed object. Reportable in British Columbia wheninjury or death occurs or when greater than $1,000 aggregateproperty damage is sustained; in the case of a motorcycle whengreater than $600 in damage is sustained.
Comb. Unit Truck/HeavyCombination Unit - Truck/Heavy: truck and trailer unit over10,900 kg.Comb. Unit /Truck/LightCombination Unit - Truck/Light: truck and trailer unit, trailerunder 4,600 kg, and total not over 10,900 kg.Comb. Unit Tractor TrailerCombination Unit - Tractor Trailer: tractor and semi-trailer unit, over 10,900 kg.Comb. Unit Tractor/Trailer & PupCombination Unit - Tractor Trailer & Pup: tractor andsemi-trailer and pup trailer (pup = 4 wheel trailer).Commercial VehicleA vehicle licensed as such under the COMMERCIALTRANSPORT ACT and used primarily for commercial/business purposes. Communication/Video EquipmentThis includes any one or two way communication equipmentsuch as a cellular phone, C.B. Radio, Palm devices, computers,A.M./F.M. Radio/ tape deck/C.D. players and any videoequipment such as a DVD player, T.V., Mapping program.ConstructionRoad maintenance, and/or construction on roadway whichcontributes to collision.Contributing FactorThose circumstances or events that the attending police officerperceives to directly contribute to a traffic collision.Drugs SuspectedThe police officer has some evidence to suspect the individualmay have consumed drugs but does not have enough evidenceto prove impairment. The driver is not given a 24 hoursuspension or charged with impaired driving. Fatal Collision Any motor vehicle or other road vehicle collision occurring on a 'public highway' as defined in the MOTOR VEHICLE ACTwhich results in fatal injuries to one or more persons and thesepersons are deceased within 30 days of the collision.General Construction Vehicle Backhoe, bulldozer, crawler, digger, excavator, forklift, loader,mower, skidder, trencher.Internal/External DistractionTo cause to turn away from the focus of driving. To divertattention away from driving.ix
Log Truck & Pole TrailerTractor or Truck and Pole trailer. Used in combination to haullogs.Mini VanA vehicle that is a van in body type and can be used as apassenger vehicle.Minor InjuryClassified as abrasions, bruises, and lacerations and wasimmediately released from hospital (same day).Modified VehicleA vehicle which deviates from the manufacturer’sspecifications.MopedVehicle capable of being operated by pedals and is equippedwith a motor under 50 cc (any class driver’s licence or specialclass 6). Moped on flat surface not to exceed 50 km/h underpower.Motor VehicleA mechanically or electrically powered device not operatedupon rails, upon which or by which any person or property maybe transported or drawn upon a highway.Excludes: devices used solely to move persons or propertywithin the confines of a building and its premises, such as anelectric baggage or mail truck used solely within an industrialplant. The exclusion does not apply if these devices are in usedoutside the confines of a building and its environs.Obstruction/debrisDebris on travelled portion of roadway which contributes to atraffic collision.Oversize VehicleA vehicle more than 12.5 metres in length with width greaterthan 2.6 metres, and height greater than 4.15 metres.Off HighwayPrivate place, field, bush, etc., All Terrain Vehicles on privateroad indicated by signs. Distinguished from Ran off/lefthighway (see below).Panel VanA vehicle that is a van in body type that is designed or usedprimarily for the transportation of property within a closedcontainer.Power BicycleA power-assisted bicycle requires the use of pedals, and themotor is only permitted to provide assistance to the rider. These vehicles are classed as limited speed motorcycles. Both gas and battery powered models are available.Ran off/Left HighwayWhere a vehicle travelling on a roadway, in the course of anaccident, leaves the roadway.Road Construction VehicleGrader, paver, roller.
Safety EquipmentSeatbelts, motorcycle helmets, airbags, child restraints.Safety Equipment UsedThis field is defined as the type of safety equipment that avehicle occupant was using at the time of an accident. Dataorigin: Safety equipment is found on the MV6020 in the All Involved section, column #12.Serious InjuryClassified as victim required stay “overnight at hospital.”Single Unit Truck/HeavySingle Unit Truck/Heavy: single unit truck over 10,900 kg.Single Unit Truck/Light (Pickup Truck)Single Unit Truck/Light: single unit truck up to 10,900 kg. Special Speed ZoneThis speed is posted as a “special” change to the overallPosted/Not Posted Speed Limit that is always in effect. i.e., atconstruction zones.Speed ZoneThe primary speed limit on section of roadway where a collision occurred.Sport Utility VehicleOtherwise known as an SUV, a sport utility vehicle is a stationwagon by body style but is identified as an SUV by themanufacturer.TrailerA vehicle that is at any time drawn upon a highway by a motorvehicle Trailers include: All trailers 700 kg GVW or less including tar kettles, mixers,welders, toolsheds, towing dollies, and so on.Recreation type trailers - tent, camper, travel, or other similardesign in excess of 700 kg GVW.House trailers designed, constructed and equipped for humanhabitation or occupancy including use for industrial,professional, or commercial purposes in excess of 700 kg GVW.Trailers designed to carry recreational equipment for personaluse. All trailers excess of 700 kg GVW designed to transport freight, lumber or other goods regardless of whether the goods are forresale or for private use or used for commercial purposesincluding: !""""" a dolly when pulled unattached from a trailer box (pup trailer), !"""""" a welder, compressor, or trailer of a similar design, !"""""" a flatdeck, high boy, van, or other semi trailer, ! a tool shed, ! a pole, pipe, or other similar type of trailer, ! a trailer pulled by a “Farm Truck.”x
Trailers do not include: an implement of husbandry, a side car attached to a motorcycle, or a disabled motor vehiclethat is towed by a tow car.Note: Commercial and Non-Commercial trailers are not distinguished from each other on the Traffic Accident Report.VehicleA device in, upon, or by which a person or thing is, or may betransported or drawn upon a highway, except a device designedto be moved by human power or used exclusively uponstationary rails or tracks. Bicycles are included with vehicleswhen a collision involves a bicycle and a motor vehicle.Windows ObstructedAny window in a vehicle that obstructed the driver’s visionbecause of items like window stickers, foggy or frosty windowsor similar window related obstructions that prevented a clearview.5th Wheel TrailerA 5th wheel Trailer is connected to the towing vehicle with aplate and pin not to be confused with a trailer connected to thetowing vehicle with a ball and chain.Note: This section has been updated with definitions from the Traffic AccidentReporting Police Procedures Manual, revised February, 2006.
British Columbia Collision Statistics - police attended injury and fatal collisions xi

xii

British Columbia Collision Statistics - police attended injury and fatal collisions 1
Summary Statistics & Historical Trends SECTION 1Reporting Police-reported collisions do not include all reportable collisions in the province. This is particularly the case since 1996 whenmajor changes in police reporting occurred. Police in somemunicipalities began to attend only collisions of a more seriousnature and some discontinued accepting self-reports at thecounter. These changes have had a profound impact on the total number of collisions recorded in the BC traffic collisiondatabase. The numbers of reported collisions (property damageonly and personal injury) have been under reported from 1995on. From 1996 to 1998, some fatal collisions may also havegone unreported.From 1995 to 1996, total reported collisions dropped by 19%(from 93,490 to 75,288). From 1996 to 1997, they fell by afurther 37% (to 47,495). During these years, a handful of police jurisdictions ceased to submit collisions report forms altogether. Fortunately, from 1999, the police reporting level has stabilisedand all police jurisdictions submit completed MV6020 forms. The long-term traffic collision trends were also affected by anofficial reporting level change that occurred on January 1, 1991. On that date the minimum reporting levels for property damageonly traffic collisions were increased from $400 to $1,000 forvehicles, and to $600 for motorcycles. As a result, there weremore than 55,000 fewer property damage only collisionsreported in 1991 than in the previous year. Official criteria forpersonal injury and fatal collision reporting have not changed. To illustrate trends in reporting, this chaptershows all collisions in the database, includingproperty damage only and self-reports. In allother chapters of this book, all tables and graphsrefer to only police-attended injury collisions andfatal collisions (attended and unattended).
Summary StatisticsCollisions*In 2006, 50,192 traffic collisions were reported. There were19,849 injury collisions and 370 fatal collisions. Of allcollisions, 45,178 (90.0%) were attended by police.Fatalities* The total reported number of fatally injured victims was 413. On average a fatality occurred every 21.2 hours in 2006. Injuries*The number of people reported injured in 2006 was 27,556compared to 28,763 in 2005. On average, 79 people werereported injured each day in 2006.Drivers LicensedIn 2006, there were 2,955,879 actively licensed drivers holdinga BC driver’s licence. This number includes 1,518,191 malesand 1,435,279 females. Note that the definition of licenseddriver has been changed to include only active licensed drivers. Driver counts reported prior to the 1999 publication cannot becompared with the counts reported in the current publication. In 2005, there were 2,912,935 actively licensed drivers. Vehicles LicensedIn 2006, there were 3,721,162 licensed vehicles, an increase ofabout 1.8% over 2005.Note: * Collision and victim counts are updated for 2002 to 2005. Thereforethey may be different than were stated in 2005 edition. Note that the 2006figure reflects the application of exclusion criteria not applied in previous years.Thus the apparent large drop in fatalities is at least partly due to differences indefinition. See note page i.

2 British Columbia Collision Statistics - police attended injury and fatal collisions
SECTION 1 – Summary Statistics & Historical TrendsTable 1.01 – Long term traffic collision and casualty statisticsCollisions VictimsYear Property Damage Only Injury Fatal Total Injured Killed Total1987 84,630 29,194 542 114,366 41,291 622 41,9131988 101,277 30,935 535 132,747 44,161 615 44,7761989 111,300 33,062 491 144,853 47,471 587 48,0581990 122,291 35,073 567 157,931 50,569 654 51,2231991 66,563 32,975 463 100,001 47,383 537 47,9201992 62,331 33,328 419 96,078 48,435 473 48,9081993 60,984 32,393 442 93,819 46,952 512 47,4641994 63,362 33,337 458 97,157 48,299 534 48,8331995 60,398 32,681 411 93,490 47,474 493 47,9671996 47,783 27,145 357 75,285 40,201 407 40,6081997 26,094 21,077 341 47,512 31,542 391 31,9331998 22,115 19,975 367 42,457 29,950 421 30,3711999 20,997 20,006 377 41,380 30,031 415 30,4462000 22,255 20,018 379 42,652 29,938 424 30,3622001 25,318 20,218 371 45,907 29,655 416 30,0712002 27,158 20,117 410 47,685 29,374 466 29,8402003 28,596 20,938 405 49,939 30,795 453 31,2482004 28,811 20,305 408 49,524 29,207 440 29,6472005 29,815 20,378 406 50,599 28,763 459 29,2222006 29,973 19,849 370 50,192 27,556 413 27,969Note:1) This table is based on total reported collisions, both police attended and unattended.2) Numbers for 1996 to 2006 are updated.3) On January 1, 1991, the minimum reporting level for property damage collisions was increased from $400 to $1,000. This has significantly reduced the number of accidents reported in 1991. Figure 1.01 – Twenty year reported traffic fatality trend: 1987 – 2006
Fatality Trend: 1987 – 2006
0100200300400500600700
1987 1988 1989 1990 1991 1992 1993 1994 1995 1996 1997 1998 1999 2000 2001 2002 2003 2004 2005 2006

British Columbia Collision Statistics - police attended injury and fatal collisions 3
SECTION 1 – Summary Statistics & Historical TrendsFigure 1.02 – Ten year reported collision trend: 1997 – 2006
Note: Graph is based on total reported collisions, both police attended and unattended.0
10,00020,00030,00040,00050,00060,000
1997 1998 1999 2000 2001 2002 2003 2004 2005 2006
Table 1.02 – Summary statistics: Collisions and victims 1 % Change22002 2003 2004 2005 2006 03 – 02 04 – 03 05 – 04 06 – 05CollisionsProperty Damage Only 27,158 28,596 28,811 29,815 29,973 5.29% 0.75% 3.48% 0.53%Injury 20,117 20,938 20,305 20,378 19,849 4.08% -3.02% 0.36% -2.60%Fatal 410 405 408 406 370 -1.22% 0.74% -0.49% -8.87%Total Reported Collisions 47,685 49,939 49,524 50,599 50,192 4.73% -0.83% 2.17% -0.80% Victims Number of Persons Injured 29,374 30,795 29,207 28,763 27,556 4.84% -5.16% -1.52% -4.20%Number of Persons Killed 466 453 440 459 413 -2.79% -2.87% 4.32% -10.02%Total Victims 29,840 31,248 29,647 29,222 27,969 4.72% -5.12% -1.43% -4.29%Note:1) This table is based on total reported collisions, both police attended and unattended.2) The percentage change may reflect changes in number of collisions reported by the police, as well as the change in actual number of collisions which occurred.

4 British Columbia Collision Statistics - police attended injury and fatal collisions
SECTION 1 – Summary Statistics & Historical TrendsTable 1.03 – Summary population statistics: BC population, drivers and vehicles2002 2003 2004 2005 2006 03- 02 04- 03 05- 04 06- 05
B.C. Population 4,115,000 4,155,000 4,203,000 4,260,000 4,320,000 0.97% 1.16% 1.36% 1.41%Drivers LicensedMale Drivers 1,445,571 1,462,778 1,474,654 1,498,356 1,518,191 1.19% 0.81% 1.61% 1.32%Female Drivers 1,357,120 1,372,550 1,384,110 1,412,065 1,435,279 1.14% 0.84% 2.02% 1.64%Unknown 136 2,322 2,480 2,514 2,409Total 2,802,827 2,837,650 2,861,244 2,912,935 2,955,879 1.24% 0.83% 1.81% 1.47%Vehicles LicensedPassenger Vehicles 2,241,717 2,279,356 2,321,288 2,374,924 2,385,341 1.68% 1.84% 2.31% 0.44%Commercial Vehicles 747,827 751,665 760,042 775,981 799,080 0.51% 1.11% 2.10% 2.98%Trailers 379,535 386,286 400,512 419,816 444,897 1.78% 3.68% 4.82% 5.97%Motorcycles 69,136 73,258 77,670 83,218 91,844 5.96% 6.02% 7.14% 10.37%Total 3,438,215 3,490,565 3,559,512 3,653,939 3,721,162 1.52% 1.98% 2.65% 1.84%Notes: 1) B.C. population estimates are based on population projection as of July 1, 2007 by Statistics Canada.2) Driver counts from publications prior to 1999 can not be compared with the revised driver counts shown above. 3) Starting from 2003, the active driver count was obtained from Business Information Warehouse. Prior to 2003, the count was obtained from Driver Licensing System data extract. This change resulted in higher counts with gender unknown.4) Licensed vehicles were those that had an active policy during 2006, including duplicate counts of vehicles that were licensed more than once during the year. Table 1.04 – Reported collisions by police attendance: 1997 – 20061997 1998 1999 2000 2001 2002 2003 2004 2005 2006Police Attended CollisionsProperty Damage Only 18,001 17,494 17,207 18,381 20,445 22,526 23,867 24,186 25,118 25,895Injury 18,371 18,008 18,207 18,232 18,347 18,581 19,539 19,071 19,310 18,915Fatal 340 367 376 378 369 410 405 407 403 368Total attended collisions 36,712 35,869 35,790 36,991 39,161 41,517 43,811 43,664 44,831 45,178Police Unattended CollisionsProperty Damage Only 8,093 4,621 3,790 3,874 4,873 4,632 4,729 4,625 4,697 4,078Injury 2,706 1,967 1,799 1,786 1,871 1,536 1,399 1,234 1,068 934Fatal 1 0 1 1 2 0 0 1 3 2Total unattended collisions 10,800 6,588 5,590 5,661 6,746 6,168 6,128 5,860 5,768 5,014Total Fatal Collisions 341 367 377 379 371 410 405 408 406 370Total Collisions 47,512 42,457 41,380 42,652 45,907 47,685 49,939 49,524 50,599 50,192Total Victims 31,933 30,371 30,446 30,362 30,071 29,840 31,248 29,647 29,222 27,969Note:1) Collisions which are neither attended by police nor driver self-reported do not get recorded in the database.2) The 2006 fatal collision counts and fatality counts are lower than they would be in the absence of the fatality re-definition and are not comparable to prior years (See page vii). No changes have been made to the reporting of injury collisions.

British Columbia Collision Statistics - police attended injury and fatal collisions 5
Summary Statistics & Historical Trends–SECTION 1 Figure 1.03 – Property damage only collisions by police attendance
05,000
10,00015,00020,00025,00030,000
1997 1998 1999 2000 2001 2002 2003 2004 2005 2006
Police Attended CollisionsPolice Unattended Collisions
Figure 1.04 – Injury collisions by police attendance
02,5005,0007,500
10,00012,50015,00017,50020,00022,500
1997 1998 1999 2000 2001 2002 2003 2004 2005 2006
Police Attended CollisionsPolice Unattended Collisions
Figure 1.05 – Total number of collisions by police attendance
05,000
10,00015,00020,00025,00030,00035,00040,00045,00050,000
1997 1998 1999 2000 2001 2002 2003 2004 2005 2006
Total attended collisionsTotal unattended collisions
6 British Columbia Collision Statistics - police attended injury and fatal collisions
SECTION 1 – Summary Statistics & Historical Trends

British Columbia Collision Statistics - police attended injury and fatal collisions 7
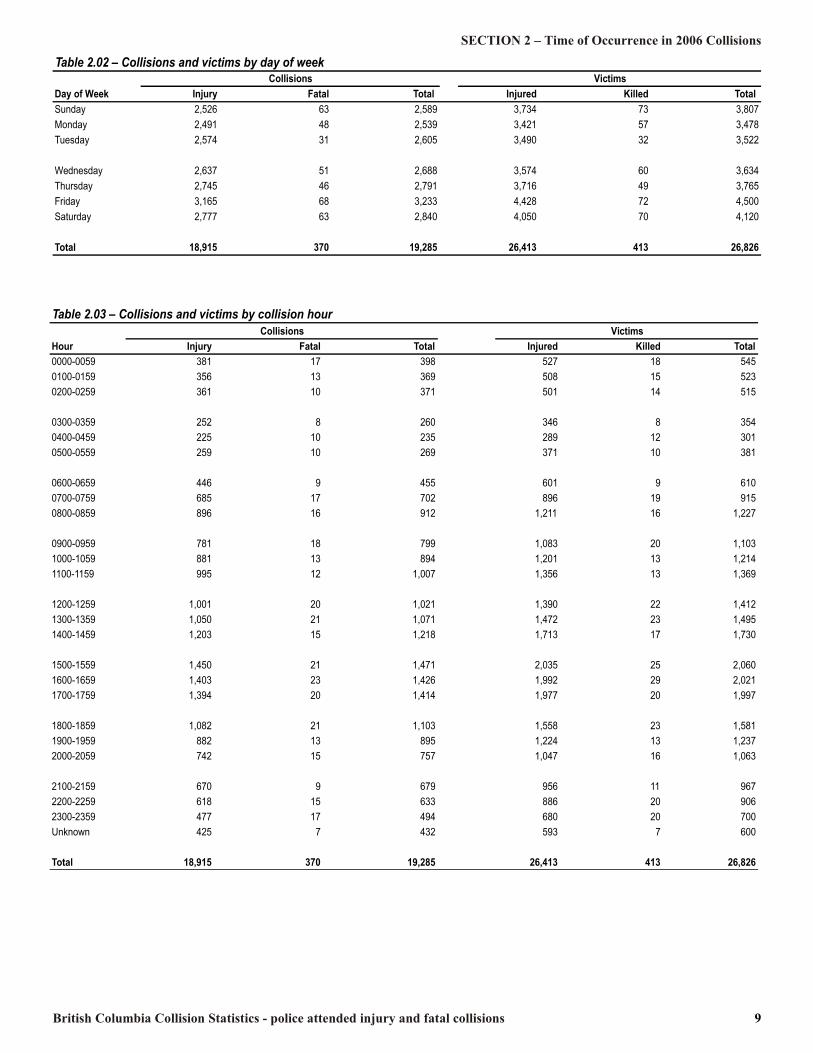
Time of Occurrence in 2006 Collisions SECTION 2The highest number of reported casualty collisions (thoseinvolving injury or fatality) occurred in November of 2006(1,833 collisions). The lowest number of casualty collisions(1,317) occurred in February of 2006.The highest casualty (persons injured and killed) count occurred in July of 2006 (2,513 casualties). The lowest count occurred in February of 2006 (1,806). July experienced the highest numberof fatalities (44). May and December had the lowest (27).As in previous years, more casualty collisions happened onFriday (16.8%) than on any other day of the week. Next highest was Saturday (14.7%). Monday had the fewest casualtycollisions (13.4%).
The greatest number of injury collisions occurred between thehours of 3 pm and 4 pm in 2006 (7.7% of all personal injurycollisions). Close to 28.2% of all injury collisions occurredbetween 3 pm and 7 pm (i.e. the evening rush hour). The highest number of fatal collisions happened between 4 pmand 5 pm in 2006 (6.2% of all fatal collisions). Victims in collisions during the holiday periods in 2006 madeup about 9.1% of the total casualties in police attendedcollisions. The Christmas holiday weekend recorded the highest number of casualties including 350 injured and 3 killed.

8 British Columbia Collision Statistics - police attended injury and fatal collisions
SECTION 2 – Time of Occurrence in 2006 Collisions
Figure 2.02 Distribution of casualty collisions and victims by day of weekSunMonTueWedThuFriSat
Number of Collisions/Victims
05001,0001,5002,0002,5003,0003,5004,0004,5005,000
Sun Mon Tue Wed Thu Fri Sat
CollisionsVictims
Table 2.01 – Collisions and victims by month Collisions VictimsMonth Injury Fatal Total Injured Killed TotalJanuary 1,694 33 1,727 2,346 42 2,388February 1,290 27 1,317 1,778 28 1,806March 1,417 28 1,445 1,974 31 2,005April 1,413 28 1,441 1,980 32 2,012May 1,506 25 1,531 2,132 27 2,159June 1,567 39 1,606 2,265 41 2,306July 1,731 40 1,771 2,469 44 2,513August 1,695 33 1,728 2,450 36 2,486September 1,589 29 1,618 2,158 30 2,188October 1,627 34 1,661 2,183 42 2,225November 1,804 29 1,833 2,456 33 2,489December 1,582 25 1,607 2,222 27 2,249Total 18,915 370 19,285 26,413 413 26,826
Figure 2.01 – Distribution of casualty collisions and victims by month
MayJunJulAugSepOctNovDec
Number of Collisions/Victims
0500
1,0001,5002,0002,5003,000
Jan Feb Mar Apr May Jun Jul Aug Sep Oct Nov Dec
CollisionsVictims
British Columbia Collision Statistics - police attended injury and fatal collisions 9
SECTION 2 – Time of Occurrence in 2006 CollisionsTable 2.02 – Collisions and victims by day of week Collisions VictimsDay of Week Injury Fatal Total Injured Killed Total Sunday 2,526 63 2,589 3,734 73 3,807Monday 2,491 48 2,539 3,421 57 3,478Tuesday 2,574 31 2,605 3,490 32 3,522Wednesday 2,637 51 2,688 3,574 60 3,634Thursday 2,745 46 2,791 3,716 49 3,765Friday 3,165 68 3,233 4,428 72 4,500Saturday 2,777 63 2,840 4,050 70 4,120Total 18,915 370 19,285 26,413 413 26,826Table 2.03 – Collisions and victims by collision hour Collisions VictimsHour Injury Fatal Total Injured Killed Total0000-0059 381 17 398 527 18 5450100-0159 356 13 369 508 15 5230200-0259 361 10 371 501 14 5150300-0359 252 8 260 346 8 3540400-0459 225 10 235 289 12 3010500-0559 259 10 269 371 10 3810600-0659 446 9 455 601 9 6100700-0759 685 17 702 896 19 9150800-0859 896 16 912 1,211 16 1,2270900-0959 781 18 799 1,083 20 1,1031000-1059 881 13 894 1,201 13 1,2141100-1159 995 12 1,007 1,356 13 1,3691200-1259 1,001 20 1,021 1,390 22 1,4121300-1359 1,050 21 1,071 1,472 23 1,4951400-1459 1,203 15 1,218 1,713 17 1,7301500-1559 1,450 21 1,471 2,035 25 2,0601600-1659 1,403 23 1,426 1,992 29 2,0211700-1759 1,394 20 1,414 1,977 20 1,9971800-1859 1,082 21 1,103 1,558 23 1,5811900-1959 882 13 895 1,224 13 1,2372000-2059 742 15 757 1,047 16 1,0632100-2159 670 9 679 956 11 9672200-2259 618 15 633 886 20 9062300-2359 477 17 494 680 20 700Unknown 425 7 432 593 7 600Total 18,915 370 19,285 26,413 413 26,826

10 British Columbia Collision Statistics - police attended injury and fatal collisions
SECTION 2 – Time of Occurrence in 2006 Collisions Figure 2.03 – Distribution of casualty collisions and victims by collision hour
6am7am8am9am10am11am12pm1pm2pm3pm4pm5pm6pm7pm8pm
Number of Collisions/Victims
0500
1,0001,5002,0002,500
12am 1am 2am 3am 4am 5am 6am 7am 8am 9am 10am 11am 12pm 1pm 2pm 3pm 4pm 5pm 6pm 7pm 8pm 9pm 10pm 11pmUnknown
Collisions Victims
Table 2.04 – Victims in 2006 holiday collisionsHoliday Period Injured Killed TotalEaster (April 13 to April 17) 338 5 343Victoria Day (May 19 to May 22) 286 3 289Canada Day (June 30 to July 3) 271 5 276B.C. Day (August 4 to August 7) 283 5 288Labour Day (September 1 to September 4) 227 3 230Thanksgiving (October 6 to October 9) 188 3 191Remembrance Day (November 10 to November 13) 254 6 260Christmas (December 22 to December 26) 350 3 353New Years 06/07 (December 29 to January 1) 202 1 203Total 2,399 34 2,433Note: Holiday periods were calculated from 1800 of the first day to 2400 of the last day. For example, Easter holiday period was calculated starting from 1800 onApril 13 to 2400 on April 17. Some holidays may occur on a weekend one yearbut not on a weekend in other years. This will affect year to year comparisons.
British Columbia Collision Statistics - police attended injury and fatal collisions 11
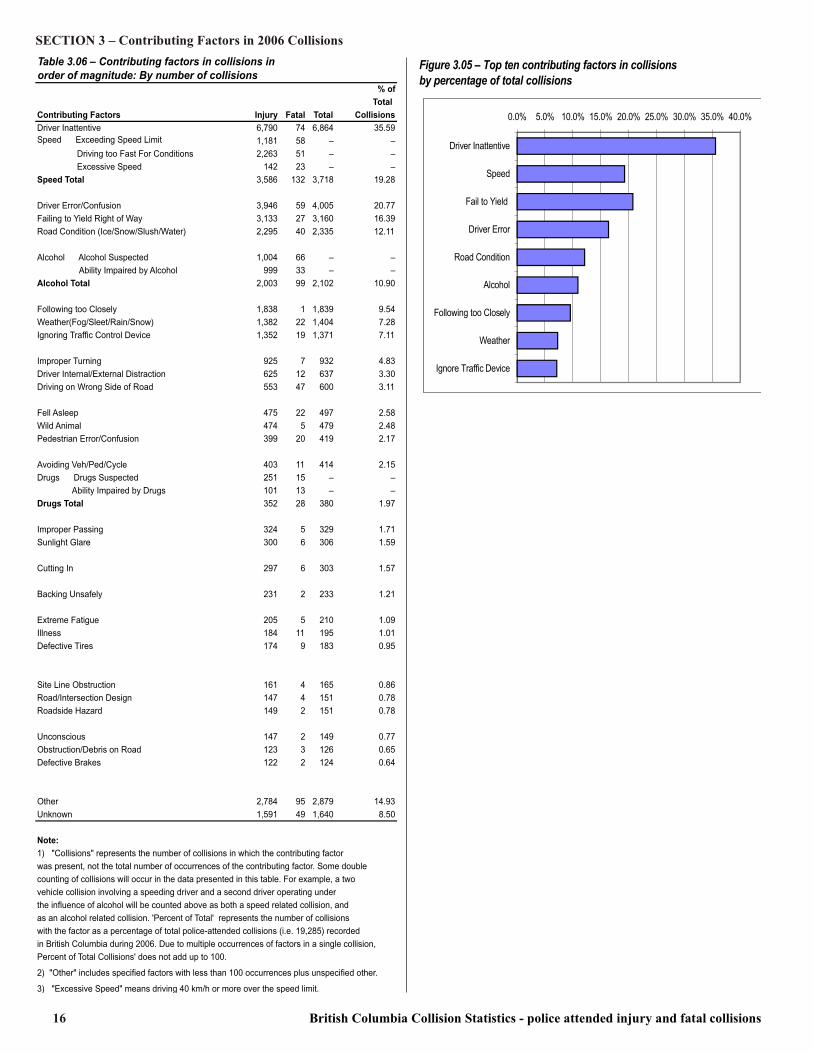
Contributing Factors in 2006 Collisions SECTION 3The BC traffic accident database recognizes that a collision isoften the result of an interaction of events or situations. Contributing factors are those circumstances, events orbehaviors that the attending police officer judges to contributeto a traffic collision. Procedure for reporting contributing factors In this document all contributing factors assigned to drivers arereflected in the presentation of the data. The report does notdifferentiate between whether the factors are listed as first,second, third or fourth. For example, a collision could resultfrom a combination of “ability impaired by alcohol” (factor 1),“driving too fast for conditions” (factor 2) “road condition”(factor 3) and “headlights defective” (factor 4) on the part ofDriver 1 and “failure to yield right of way” (factor 1) and “roadintersection design” (factor 2) assigned to Driver 2. This totalssix different contributing factors assigned to the same collisionand represents the complete information available from theTraffic Accident System on the role of contributing factors inthat collision. Tables 3.01 to 3.05 and Figures 3.01 to 3.04present the number of factors in 2006 collisions. In addition to the tables and graphs that consider factors, tablesthat display the same data in terms of collisions are alsopresented. These include Tables 3.06 and 3.07 and Figure 3.05and 3.06. These tables and figures display the number ofcollisions in which a contributing factor was present and not thetotal number of occurrences of that factor. For example, if“impaired by alcohol” was a factor assigned to both drivers inthe same collision, in these tables, it would be counted just oncefor that collision. If at least one driver was also assigned asecond factor (e.g., exceeding speed limit), the collision wouldbe counted again under “speed”. To demonstrate the differencebetween counting factors and counting collisions, we can seethat the contributing factor, “driver inattentive” was recorded in
6,864 collisions (Table 3.06); however, there were 7,285occurrences of “driver inattentive” in the database (Table 3.02). In other words, 7,285 drivers involved in collisions were notedas having been “driver inattentive”. Those same 7,285 driverswere involved in 6,864 collisions because some collisionsinvolved more than one inattentive driver. Contributing factors summary In 2006, 36,631 contributing factors were attributed to 19,285reported casualty collisions. Of all contributing factors assigned to collisions during 2006,81.5% involved human action or condition; 16.9% were relatedto environmental conditions; 1.6% involved vehicle condition. The top five most frequently reported contributing factors in2006 injury collisions (as a percentage of total injury collisions)were, in order of magnitude:(1) Driver inattentive (35.6%); (2) Speed (19.3%); (3) Driver error/confusion (20.8%); (4) Failing to yield to the right of way (16.4%); (5) Road Condition (12.1%).The top five most frequently reported contributing factors in2006 fatal collisions (as a percentage of total fatal collisions)were, in order of magnitude:(1) Speed (35.7%); (2) Alcohol (26.8%); (3) Driver inattentive (20.0%); (4) Driver error/Confusion (16.0%); (5) Driving on wrong side of road (12.7%).Note: a) Speed includes Exceeding speed limit, Excessive speed over 40km/hr, and Driving too fast for conditions; b) Alcohol includes Alcoholsuspected and ability impaired by alcohol.

12 British Columbia Collision Statistics - police attended injury and fatal collisions
SECTION 3 – Contributing Factors in 2006 Collisions
Figure 3.02 – Top five human action contributing factorsin casualty collisions23.03 20.79
17.6411.01 7.81
0.05.0
10.015.020.025.0
Driver Error Speeding Fail to Yield Follow tooClosely IgnoreTrafficDevice
Percent of Total Human Action Factors
Figure 3.01 – Top five human condition contributing factorsin casulalty collisions62.59
18.205.63 4.28 2.290
10203040506070
DriverInattentive Alcohol DriverDistraction Fell Asleep DrugsSuspected
Percent of Total Human Condition FactorsTable 3.01 – Frequency of contributing factors 1in collisions by category Contributing Factor Total % of TotalCategory Injury Fatal Factors FactorsHuman Action 17,871 358 18,229 49.76Human Condition 11,382 258 11,640 31.78Environmental Condition 6,065 108 6,173 16.85Vehicle Factor 567 22 589 1.61Total 35,885 746 36,631 100%Note: There were 36,631 contributing factors attributed to 19,285 police attended casualty collisions in 2006. 'Frequency' represents the total number of occurrences of the contributing factors, not the number of collisions in whichthe contributing factors were present.

British Columbia Collision Statistics - police attended injury and fatal collisions 13
Contributing Factors in 2006 Collisions – SECTION 3Table 3.03 – Frequency of human action factors 1 in injury and fatal collisions % of HumanHuman Action % of allAction Factors Injury Fatal Total Factors Factors2Driver Error/Confusion 4,136 62 4,198 23.03 11.46Speed Exceeding Speed Limit 1,198 62 1,260 – – Driving too Fast For Conditions 2,311 51 2,362 – – Excessive Speed3 145 23 168 – –Speed Total 3,654 136 3,790 20.79 10.35Failing to Yield Right of Way 3,187 28 3,215 17.64 8.78Following too Closely 2,006 1 2,007 11.01 5.48Ignoring Traffic Control Device 1,403 20 1,423 7.81 3.88Improper Turning 936 7 943 5.17 2.57Driving on Wrong Side of Road 560 48 608 3.34 1.66Avoiding Veh/Ped/Cycle 453 11 464 2.55 1.27Pedestrian Error/Confusion 425 25 450 2.47 1.23Improper Passing 331 5 336 1.84 0.92Cutting In 302 6 308 1.69 0.84Backing Unsafely 237 2 239 1.31 0.65Failing to Signal 76 0 76 0.42 0.21Ignoring Officer/Flagman/Guard 66 1 67 0.37 0.18Use of Comunication/Video Equipment 53 2 55 0.30 0.15Failure to Secure Stopped Vehicle 46 4 50 0.27 0.14Total 17,871 358 18,229 100% 49.76%Note:1) There were 36,631 contributing factors attributed to 19,285 police attended casualty collisions in 2006. 'Frequency' represents the total number of occurrences of the contributing factors, not the number of collisions in whichthe contributing factors were present. 2) "All factors" refers to all four categories of contributing factors (see Table 3.01). In other words, "Percent of All Factors" shows the percentage each "HumanAction Factor" accounted for across all four categories of contributing factors.3) "Excessive Speed" means driving 40 km/h or more over the speed limit.
Table 3.02 – Frequency of human condition factors 1in injury and fatal collisions % ofHuman % ofHuman Condition AllCondition Factor Injury Fatal Total Factors Factors2Driver Inattentive 7,210 75 7,285 62.59 19.89Alcohol Ability Impaired by Alcohol 1,006 33 1,039 – – Alcohol Suspected 1,013 66 1,079 – –Alcohol Total 2,019 99 2,118 18.20 5.78Driver Internal/External Distraction 643 12 655 5.63 1.79Fell Asleep 476 22 498 4.28 1.36Drugs Suspected 252 15 267 2.29 0.73Extreme Fatigue 205 5 210 1.80 0.57Illness 184 11 195 1.68 0.53Unconscious 150 2 152 1.31 0.41Ability Impaired by Drugs 102 13 115 0.99 0.31Physical Disability 73 1 74 0.64 0.20Ability Impaired by Medication 59 1 60 0.52 0.16Deceased Prior to Collision 9 2 11 0.09 0.03Total 11,382 258 11,640 100% 31.78%Note:1) There were 36,631 contributing factors attributed to 19,285 police attended casualty collisions in 2006. 'Frequency' represents the total number of occurrences of the contributing factors, not the number of collisions in whichthe contributing factors were present. 2) "All factors" refers to all four categories of contributing factors (see Table 3.01). In other words, "Percent of All Factors" shows the percentage each "HumanCondition Factor" accounted for across all four categories of contributing factors.
14 British Columbia Collision Statistics - police attended injury and fatal collisions
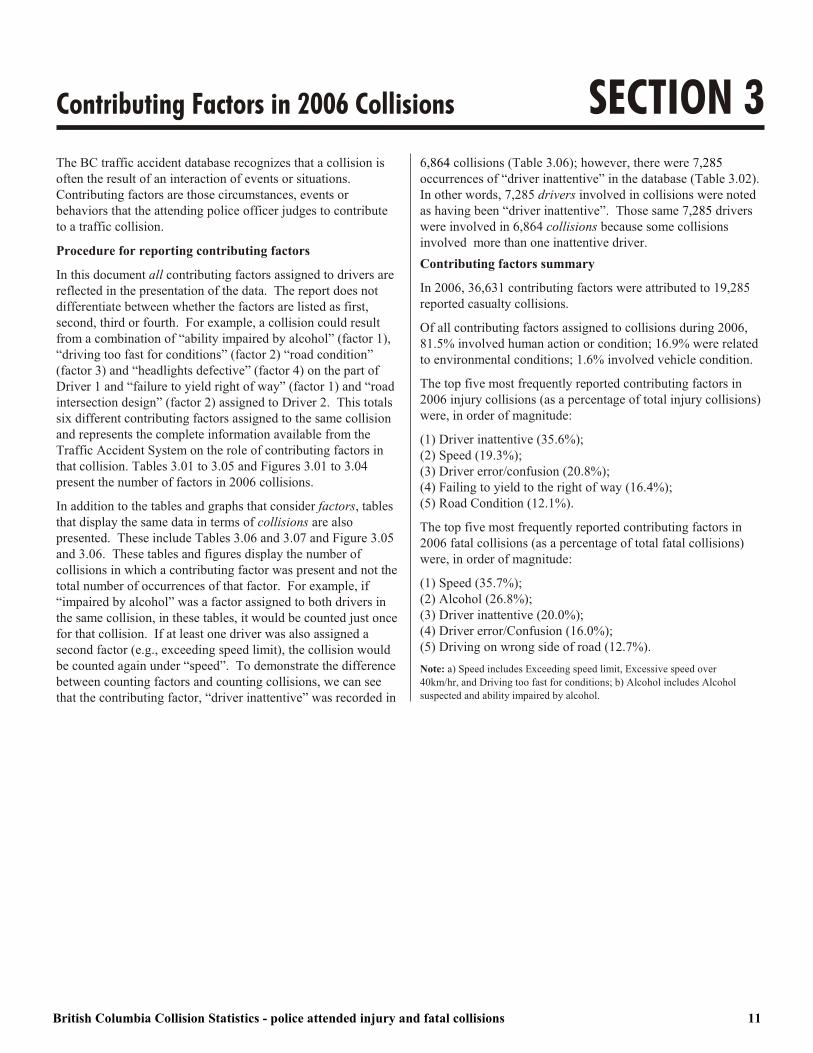
SECTION 3 – Contributing Factors in 2006 CollisionsTable 3.04 – Frequency of environmental factors 1in injury and fatal collisions % of Environ-Environmental mental % of allFactors Injury Fatal Total Factors Factors2Road Condition (Ice/Snow/Slush/Water) 2,594 46 2,640 42.77 7.21Weather(Fog/Sleet/Rain/Snow) 1,634 30 1,664 26.96 4.54Wild Animal 484 6 490 7.94 1.34Sunlight Glare 329 6 335 5.43 0.91Site Line Obstruction 186 4 190 3.08 0.52Road/Intersection Design 176 4 180 2.92 0.49Roadside Hazard 169 2 171 2.77 0.47Obstruction/Debris on Road 131 5 136 2.20 0.37Previous Traffic Collision 85 1 86 1.39 0.23Defective/Inoperative Traffic Control Device 73 2 75 1.21 0.20Roadway Surface Defects 73 1 74 1.20 0.20Domestic Animal 50 0 50 0.81 0.14Artificial Glare 41 1 42 0.68 0.11Insufficient Worksite/Construction Traffic Control 40 0 40 0.65 0.11Total 6,065 108 6,173 100% 16.85%Note:1) There were 36,631 contributing factors attributed to 19,285 police attended casualty collisions in 2006. 'Frequency' represents the total number of occurrences of the contributing factors, not the number of collisions in whichthe contributing factors were present. 2) "All factors" refers to all four categories of contributing factors (see Table 3.01). In other words, "Percent of All Factors" shows the percentage each "EnvironmentalFactor" accounted for across all four categories of contributing factors.
Figure 3.03 – Top five environmental factors in casualty collisions42.77
26.96
7.94 5.43 3.0805
1015202530354045
Road Cond. Weather Wild animal Sunlight Glare Site LineObstruction
Percent of Total Environmental Factors
British Columbia Collision Statistics - police attended injury and fatal collisions 15
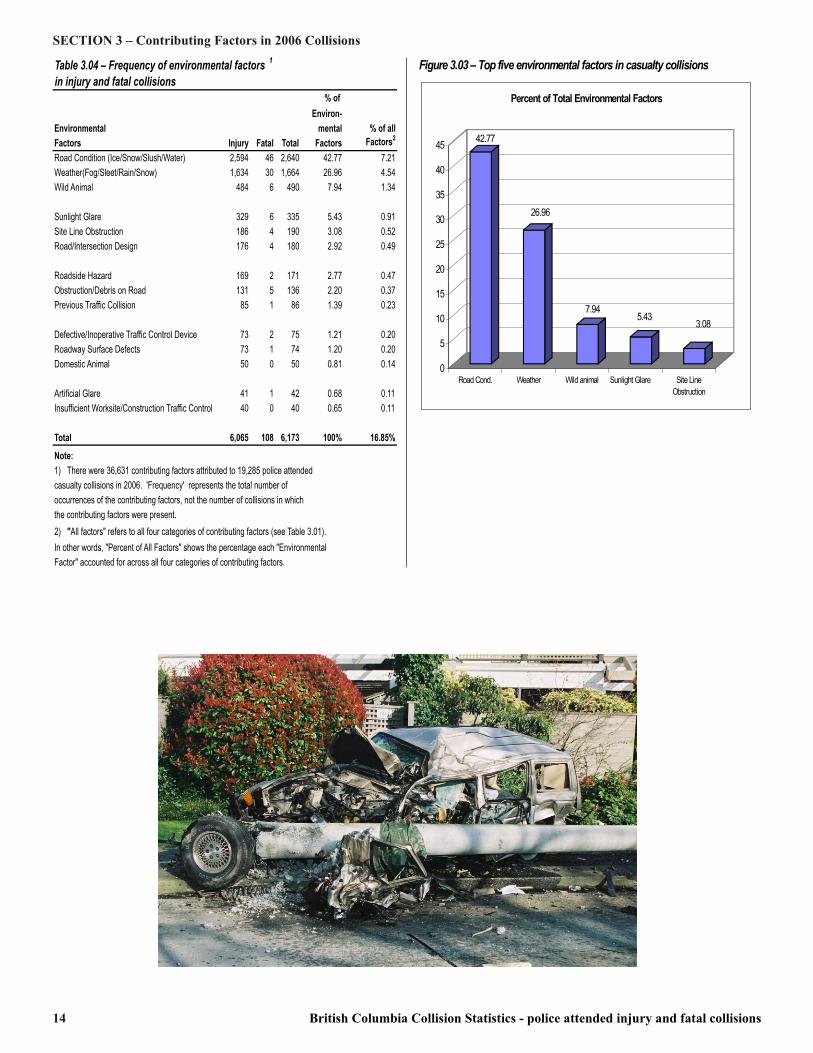
Contributing Factors in 2006 Collisions – SECTION 3Table 3.05 – Frequency of vehicle condition factors 1 in injuryand fatal collisions % ofVehicle Vehicle % of allCondition Factors Injury Fatal Total Factors Factors2Defective Tires 174 9 183 31.07 0.50Defective Brakes 123 2 125 21.22 0.34Defective Headlights 39 2 41 6.96 0.11Insecure Load 31 2 33 5.60 0.09Defective Steering 32 0 32 5.43 0.09Windows Obstructed 31 1 32 5.43 0.09No Driver 28 3 31 5.26 0.08Defective Engine 22 0 22 3.74 0.06Defective Accelerator 21 0 21 3.57 0.06Defective Tow Hitch 14 0 14 2.38 0.04Trailer Brakes out of Adjustment/Inoperative 10 1 11 1.87 0.03Defective Brakelights 9 0 9 1.53 0.02Defective Suspension 9 0 9 1.53 0.02Oversize Vehicle 8 0 8 1.36 0.02Dangerous Goods 4 1 5 0.85 0.01Defective Turn Signals 5 0 5 0.85 0.01Illegal Vehicle Modifications 5 0 5 0.85 0.01Defective Windshield 2 1 3 0.51 0.01Total 567 22 589 100% 1.61%Note:1) There were 36,631 contributing factors attributed to 19,285 police attended casualty collisions in 2006. 'Frequency' represents the total number of occurrences of the contributing factors, not the number of collisions in whichthe contributing factors were present. 2) "All factors" refers to all four categories of contributing factors (see Table 3.01). In other words, "Percent of All Factors" shows the percentage each "VehicleCondition Factor" accounted for across all four categories of contributing factors.
Figure 3.04 – Top five vehicle condition factors in casualty collisionsDefective HeadlightsInsecure Load Defective SteeringWindows Obstructed
31.0721.22
6.96 5.60 5.43 5.430.005.00
10.0015.0020.0025.0030.0035.00
Defective TiresDefective Brakes
Defective Headlights Insecure LoadDefective Steering
Windows Obstructed
Percent of Total Vehicle Factors
16 British Columbia Collision Statistics - police attended injury and fatal collisions
SECTION 3 – Contributing Factors in 2006 Collisions Figure 3.05 – Top ten contributing factors in collisions by percentage of total collisions
Driver InattentiveSpeedingFail to Yield Driver ErrorRoad Condition
0.0% 5.0% 10.0% 15.0% 20.0% 25.0% 30.0% 35.0% 40.0%Driver Inattentive
SpeedFail to Yield Driver Error
Road ConditionAlcohol
Following too CloselyWeather
Ignore Traffic Device
Table 3.06 – Contributing factors in collisions inorder of magnitude: By number of collisions % ofTotal Contributing Factors Injury Fatal Total CollisionsDriver Inattentive 6,790 74 6,864 35.59Speed Exceeding Speed Limit 1,181 58 – – Driving too Fast For Conditions 2,263 51 – – Excessive Speed 142 23 – –Speed Total 3,586 132 3,718 19.28Driver Error/Confusion 3,946 59 4,005 20.77Failing to Yield Right of Way 3,133 27 3,160 16.39Road Condition (Ice/Snow/Slush/Water) 2,295 40 2,335 12.11Alcohol Alcohol Suspected 1,004 66 – – Ability Impaired by Alcohol 999 33 – –Alcohol Total 2,003 99 2,102 10.90Following too Closely 1,838 1 1,839 9.54Weather(Fog/Sleet/Rain/Snow) 1,382 22 1,404 7.28Ignoring Traffic Control Device 1,352 19 1,371 7.11Improper Turning 925 7 932 4.83Driver Internal/External Distraction 625 12 637 3.30Driving on Wrong Side of Road 553 47 600 3.11Fell Asleep 475 22 497 2.58Wild Animal 474 5 479 2.48Pedestrian Error/Confusion 399 20 419 2.17Avoiding Veh/Ped/Cycle 403 11 414 2.15Drugs Drugs Suspected 251 15 – – Ability Impaired by Drugs 101 13 – –Drugs Total 352 28 380 1.97Improper Passing 324 5 329 1.71Sunlight Glare 300 6 306 1.59Cutting In 297 6 303 1.57Backing Unsafely 231 2 233 1.21Extreme Fatigue 205 5 210 1.09Illness 184 11 195 1.01Defective Tires 174 9 183 0.95Site Line Obstruction 161 4 165 0.86Road/Intersection Design 147 4 151 0.78Roadside Hazard 149 2 151 0.78Unconscious 147 2 149 0.77Obstruction/Debris on Road 123 3 126 0.65Defective Brakes 122 2 124 0.64Other 2,784 95 2,879 14.93Unknown 1,591 49 1,640 8.50Note:1) "Collisions" represents the number of collisions in which the contributing factor was present, not the total number of occurrences of the contributing factor. Some double counting of collisions will occur in the data presented in this table. For example, a two vehicle collision involving a speeding driver and a second driver operating underthe influence of alcohol will be counted above as both a speed related collision, andas an alcohol related collision. 'Percent of Total' represents the number of collisions with the factor as a percentage of total police-attended collisions (i.e. 19,285) recordedin British Columbia during 2006. Due to multiple occurrences of factors in a single collision,Percent of Total Collisions' does not add up to 100.2) "Other" includes specified factors with less than 100 occurrences plus unspecified other.3) "Excessive Speed" means driving 40 km/h or more over the speed limit.
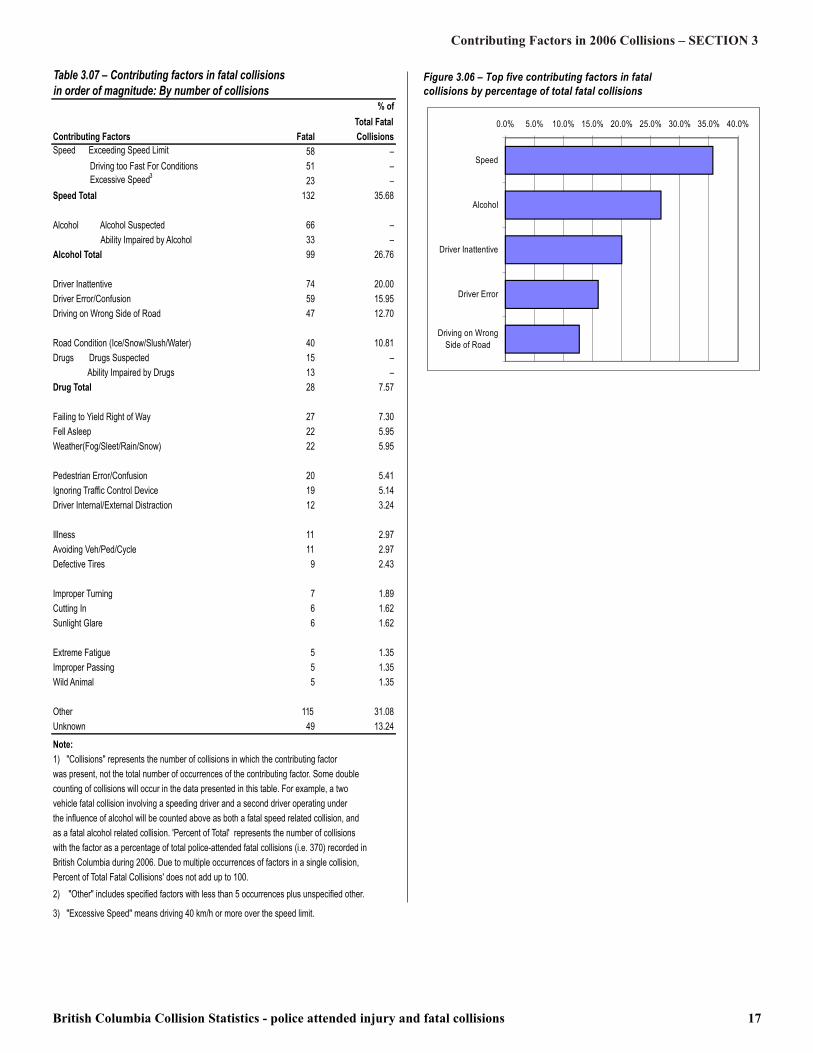
British Columbia Collision Statistics - police attended injury and fatal collisions 17
Contributing Factors in 2006 Collisions – SECTION 3Table 3.07 – Contributing factors in fatal collisionsin order of magnitude: By number of collisions % ofTotal FatalContributing Factors Fatal CollisionsSpeed Exceeding Speed Limit 58 – Driving too Fast For Conditions 51 – Excessive Speed3 23 –Speed Total 132 35.68Alcohol Alcohol Suspected 66 – Ability Impaired by Alcohol 33 –Alcohol Total 99 26.76Driver Inattentive 74 20.00Driver Error/Confusion 59 15.95Driving on Wrong Side of Road 47 12.70Road Condition (Ice/Snow/Slush/Water) 40 10.81Drugs Drugs Suspected 15 – Ability Impaired by Drugs 13 –Drug Total 28 7.57Failing to Yield Right of Way 27 7.30Fell Asleep 22 5.95Weather(Fog/Sleet/Rain/Snow) 22 5.95Pedestrian Error/Confusion 20 5.41Ignoring Traffic Control Device 19 5.14Driver Internal/External Distraction 12 3.24Illness 11 2.97Avoiding Veh/Ped/Cycle 11 2.97Defective Tires 9 2.43Improper Turning 7 1.89Cutting In 6 1.62Sunlight Glare 6 1.62Extreme Fatigue 5 1.35Improper Passing 5 1.35Wild Animal 5 1.35Other 115 31.08Unknown 49 13.24Note:1) "Collisions" represents the number of collisions in which the contributing factor was present, not the total number of occurrences of the contributing factor. Some double counting of collisions will occur in the data presented in this table. For example, a two vehicle fatal collision involving a speeding driver and a second driver operating underthe influence of alcohol will be counted above as both a fatal speed related collision, andas a fatal alcohol related collision. 'Percent of Total' represents the number of collisions with the factor as a percentage of total police-attended fatal collisions (i.e. 370) recorded inBritish Columbia during 2006. Due to multiple occurrences of factors in a single collision,Percent of Total Fatal Collisions' does not add up to 100.2) "Other" includes specified factors with less than 5 occurrences plus unspecified other.3) "Excessive Speed" means driving 40 km/h or more over the speed limit.
Figure 3.06 – Top five contributing factors in fatalcollisions by percentage of total fatal collisions0.0% 5.0% 10.0% 15.0% 20.0% 25.0% 30.0% 35.0% 40.0%
SpeedAlcohol
Driver InattentiveDriver Error
Driving on WrongSide of Road

18 British Columbia Collision Statistics - police attended injury and fatal collisions
SECTION 3 – Contributing Factors in 2006 Collisions

British Columbia Collision Statistics - police attended injury and fatal collisions 19
Victims in 2006 Collisions SECTION 4In 2006, the number of persons killed in police-attended trafficcollisions in British Columbia was 413. The number of personsreported injured in police attended collisions was 26,413. Male victims made up 52.9% of all casualties (persons injuredor killed), compared to previous year’s 53.5%. Females madeup 46.6%, while the remaining 0.5% was unidentified as togender. Of all fatally injured victims in 2006, 71.4% were male (295victims), and 27.9% (115 victims) were female. The distribution of fatally injured victims among the variousroad user class categories in 2006 was:(1) Drivers (47.0%) (2) Passengers (22.3%) (3) Pedestrians (16.9%)
(4) Bicycle drivers (2.9%) (5) Motorcycle Drivers (9.9%) (6) Motorcycle Passengers (0.5%) Of all persons reported injured in 2006, 14.0% were betweenthe ages of 16 and 20, compared to 14.4% in 2005. There were 13.1% between the ages of 21 and 25, same as in 2005. Theproportion of victims aged 6 to 15 was 4.7% (compared to 4.9% in 2005) and 1.0% for those aged 5 and under. Of all persons killed in 2006, 13.3% were between the ages of16 and 20, (compared to 10.7% in 2005); 10.9% were betweenthe ages of 21 and 25. The proportion of victims aged 6 to 15was 2.4% in 2006. The number of children killed aged five andunder was 4 (1.0%).

20 British Columbia Collision Statistics - police attended injury and fatal collisions
SECTION 4 – Victims in 2006 CollisionsTable 4.01 – Victims injured by road user class and monthBicycle Bicycle Motorcycle Motorcycle Total % of Month Driver Passenger Hanging on Pedestrian Driver Passenger Driver Passenger Other Unknown Victims TotalJanuary 1,442 601 4 221 57 1 14 1 2 3 2,346 8.88February 1,077 459 0 154 54 5 19 3 3 4 1,778 6.73March 1,245 499 2 139 47 6 24 3 4 5 1,974 7.47April 1,152 514 3 133 69 8 83 10 6 2 1,980 7.50May 1,228 554 2 142 83 5 100 5 9 4 2,132 8.07June 1,225 603 4 147 124 1 140 16 3 2 2,265 8.58July 1,314 693 10 131 124 0 165 23 3 6 2,469 9.35August 1,302 681 6 125 103 0 198 29 0 6 2,450 9.28September 1,183 519 2 156 117 0 153 15 10 3 2,158 8.17October 1,304 566 2 156 93 1 57 3 1 0 2,183 8.26November 1,511 635 3 228 60 0 14 0 2 3 2,456 9.30December 1,294 686 2 183 49 0 7 0 1 0 2,222 8.41Total 15,277 7,010 40 1,915 980 27 974 108 44 38 26,413 100%
Injured Victims26,413 (100%)
Bicyclists1,007 (3.8%) Vehicle Occupants22,327 (84.5%)Pedestrians1,915 (7.3%) Unknown/Other82 (0.3%) Motorcyclists1,082 (4.1%)Bicycle Drivers980 Bicycle Passengers27 Vehicle Drivers15,277 Vehicle Passengers7,010 Hanging On Outside40 Motorcycle Drivers974 Motorcycle Passengers108
Figure 4.01 Classification of Injured Victims by Road User Class
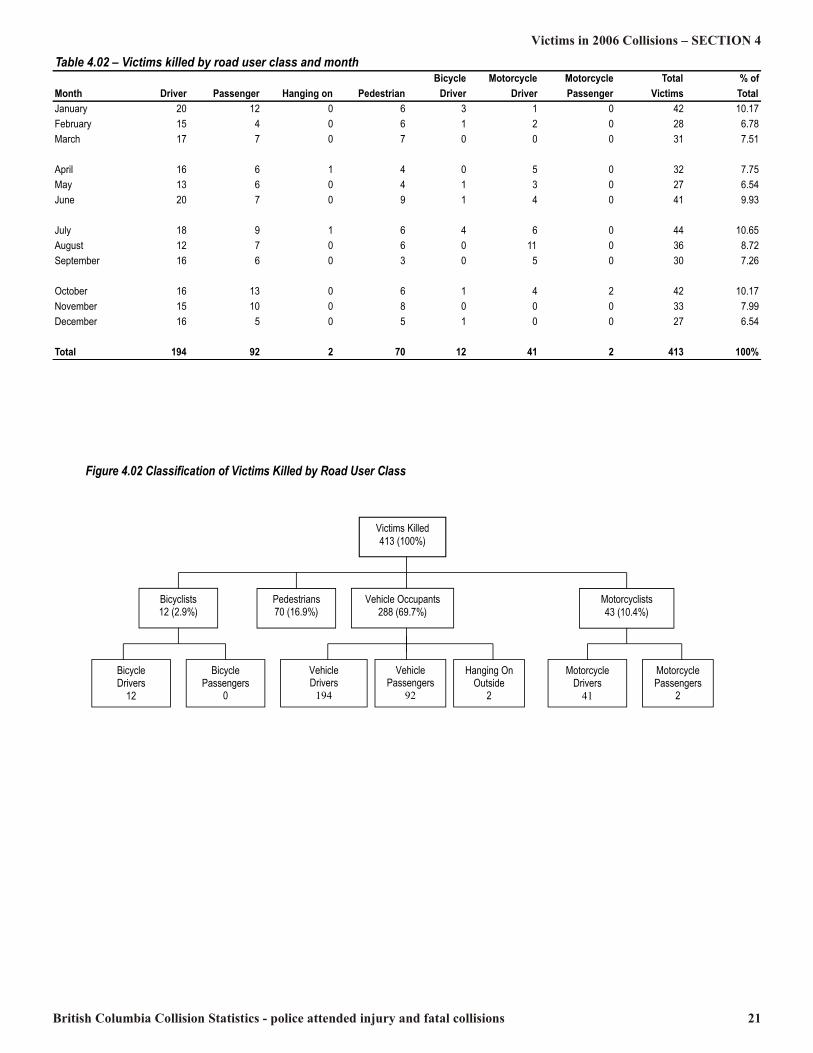
British Columbia Collision Statistics - police attended injury and fatal collisions 21
Victims in 2006 Collisions – SECTION 4Table 4.02 – Victims killed by road user class and month Bicycle Motorcycle Motorcycle Total % ofMonth Driver Passenger Hanging on Pedestrian Driver Driver Passenger Victims TotalJanuary 20 12 0 6 3 1 0 42 10.17February 15 4 0 6 1 2 0 28 6.78March 17 7 0 7 0 0 0 31 7.51April 16 6 1 4 0 5 0 32 7.75May 13 6 0 4 1 3 0 27 6.54June 20 7 0 9 1 4 0 41 9.93July 18 9 1 6 4 6 0 44 10.65August 12 7 0 6 0 11 0 36 8.72September 16 6 0 3 0 5 0 30 7.26October 16 13 0 6 1 4 2 42 10.17November 15 10 0 8 0 0 0 33 7.99December 16 5 0 5 1 0 0 27 6.54Total 194 92 2 70 12 41 2 413 100%
Figure 4.02 Classification of Victims Killed by Road User Class
Victims Killed 413 (100%) Bicyclists 12 (2.9%) Vehicle Occupants 288 (69.7%) Pedestrians 70 (16.9%) Motorcyclists 43 (10.4%)
Bicycle Drivers 12 Bicycle Passengers 0 Vehicle Drivers 194
Vehicle Passengers 92 Hanging On Outside 2
Motorcycle Drivers 41 Motorcycle Passengers 2
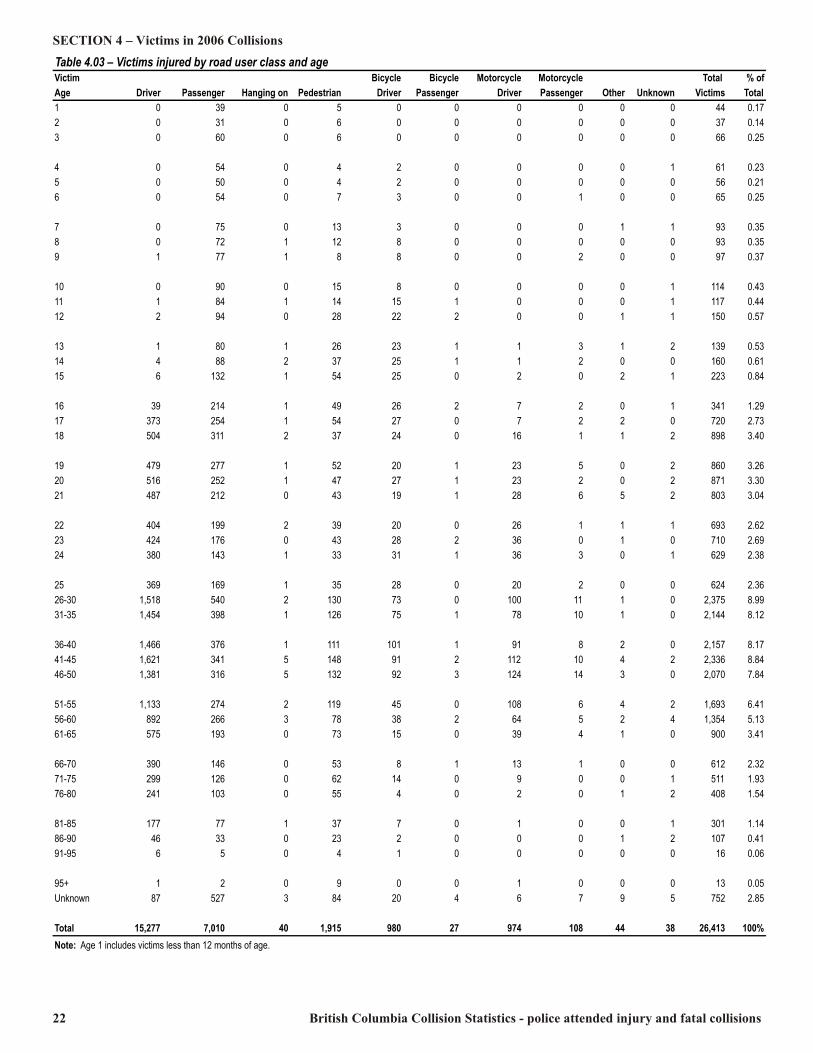
22 British Columbia Collision Statistics - police attended injury and fatal collisions
SECTION 4 – Victims in 2006 CollisionsTable 4.03 – Victims injured by road user class and ageVictim Bicycle Bicycle Motorcycle Motorcycle Total % ofAge Driver Passenger Hanging on Pedestrian Driver Passenger Driver Passenger Other Unknown Victims Total1 0 39 0 5 0 0 0 0 0 0 44 0.172 0 31 0 6 0 0 0 0 0 0 37 0.143 0 60 0 6 0 0 0 0 0 0 66 0.254 0 54 0 4 2 0 0 0 0 1 61 0.235 0 50 0 4 2 0 0 0 0 0 56 0.216 0 54 0 7 3 0 0 1 0 0 65 0.257 0 75 0 13 3 0 0 0 1 1 93 0.358 0 72 1 12 8 0 0 0 0 0 93 0.359 1 77 1 8 8 0 0 2 0 0 97 0.3710 0 90 0 15 8 0 0 0 0 1 114 0.4311 1 84 1 14 15 1 0 0 0 1 117 0.4412 2 94 0 28 22 2 0 0 1 1 150 0.5713 1 80 1 26 23 1 1 3 1 2 139 0.5314 4 88 2 37 25 1 1 2 0 0 160 0.6115 6 132 1 54 25 0 2 0 2 1 223 0.8416 39 214 1 49 26 2 7 2 0 1 341 1.2917 373 254 1 54 27 0 7 2 2 0 720 2.7318 504 311 2 37 24 0 16 1 1 2 898 3.4019 479 277 1 52 20 1 23 5 0 2 860 3.2620 516 252 1 47 27 1 23 2 0 2 871 3.3021 487 212 0 43 19 1 28 6 5 2 803 3.0422 404 199 2 39 20 0 26 1 1 1 693 2.6223 424 176 0 43 28 2 36 0 1 0 710 2.6924 380 143 1 33 31 1 36 3 0 1 629 2.3825 369 169 1 35 28 0 20 2 0 0 624 2.3626-30 1,518 540 2 130 73 0 100 11 1 0 2,375 8.9931-35 1,454 398 1 126 75 1 78 10 1 0 2,144 8.1236-40 1,466 376 1 111 101 1 91 8 2 0 2,157 8.1741-45 1,621 341 5 148 91 2 112 10 4 2 2,336 8.8446-50 1,381 316 5 132 92 3 124 14 3 0 2,070 7.8451-55 1,133 274 2 119 45 0 108 6 4 2 1,693 6.4156-60 892 266 3 78 38 2 64 5 2 4 1,354 5.1361-65 575 193 0 73 15 0 39 4 1 0 900 3.4166-70 390 146 0 53 8 1 13 1 0 0 612 2.3271-75 299 126 0 62 14 0 9 0 0 1 511 1.9376-80 241 103 0 55 4 0 2 0 1 2 408 1.5481-85 177 77 1 37 7 0 1 0 0 1 301 1.1486-90 46 33 0 23 2 0 0 0 1 2 107 0.4191-95 6 5 0 4 1 0 0 0 0 0 16 0.0695+ 1 2 0 9 0 0 1 0 0 0 13 0.05Unknown 87 527 3 84 20 4 6 7 9 5 752 2.85Total 15,277 7,010 40 1,915 980 27 974 108 44 38 26,413 100%Note: Age 1 includes victims less than 12 months of age.
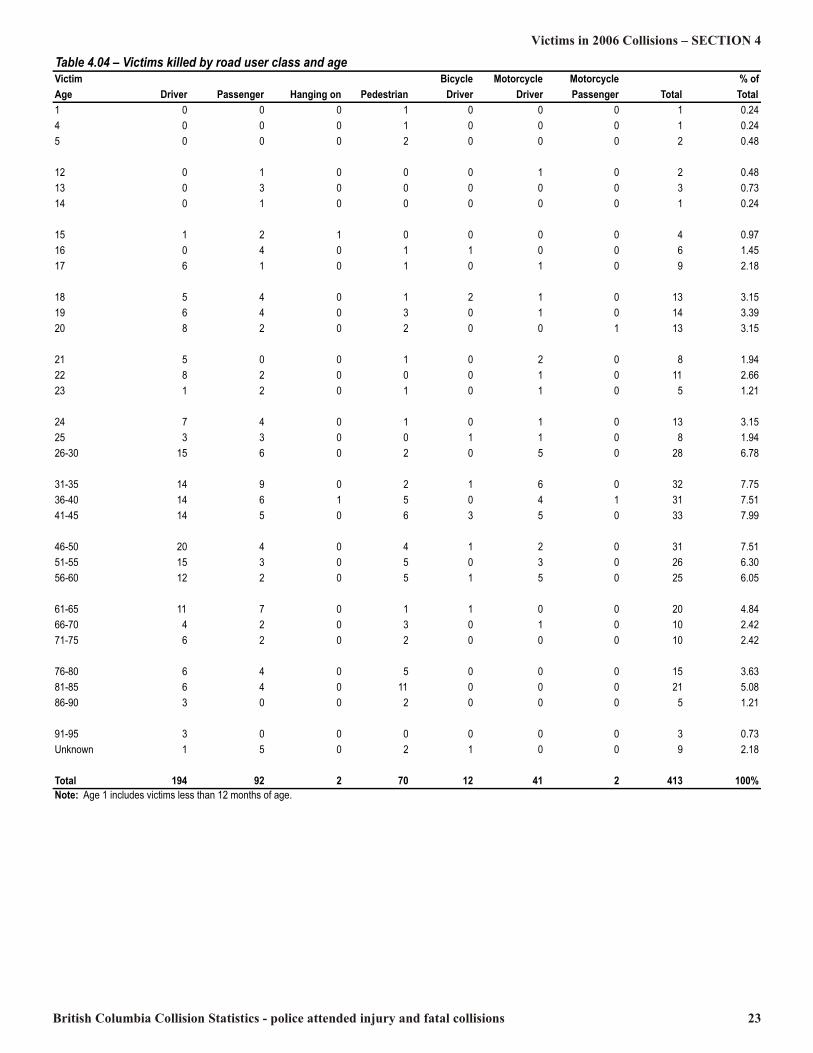
British Columbia Collision Statistics - police attended injury and fatal collisions 23
Victims in 2006 Collisions – SECTION 4Table 4.04 – Victims killed by road user class and ageVictim Bicycle Motorcycle Motorcycle % ofAge Driver Passenger Hanging on Pedestrian Driver Driver Passenger Total Total1 0 0 0 1 0 0 0 1 0.244 0 0 0 1 0 0 0 1 0.245 0 0 0 2 0 0 0 2 0.4812 0 1 0 0 0 1 0 2 0.4813 0 3 0 0 0 0 0 3 0.7314 0 1 0 0 0 0 0 1 0.2415 1 2 1 0 0 0 0 4 0.9716 0 4 0 1 1 0 0 6 1.4517 6 1 0 1 0 1 0 9 2.1818 5 4 0 1 2 1 0 13 3.1519 6 4 0 3 0 1 0 14 3.3920 8 2 0 2 0 0 1 13 3.1521 5 0 0 1 0 2 0 8 1.9422 8 2 0 0 0 1 0 11 2.6623 1 2 0 1 0 1 0 5 1.2124 7 4 0 1 0 1 0 13 3.1525 3 3 0 0 1 1 0 8 1.9426-30 15 6 0 2 0 5 0 28 6.7831-35 14 9 0 2 1 6 0 32 7.7536-40 14 6 1 5 0 4 1 31 7.5141-45 14 5 0 6 3 5 0 33 7.9946-50 20 4 0 4 1 2 0 31 7.5151-55 15 3 0 5 0 3 0 26 6.3056-60 12 2 0 5 1 5 0 25 6.0561-65 11 7 0 1 1 0 0 20 4.8466-70 4 2 0 3 0 1 0 10 2.4271-75 6 2 0 2 0 0 0 10 2.4276-80 6 4 0 5 0 0 0 15 3.6381-85 6 4 0 11 0 0 0 21 5.0886-90 3 0 0 2 0 0 0 5 1.2191-95 3 0 0 0 0 0 0 3 0.73Unknown 1 5 0 2 1 0 0 9 2.18Total 194 92 2 70 12 41 2 413 100%Note: Age 1 includes victims less than 12 months of age.
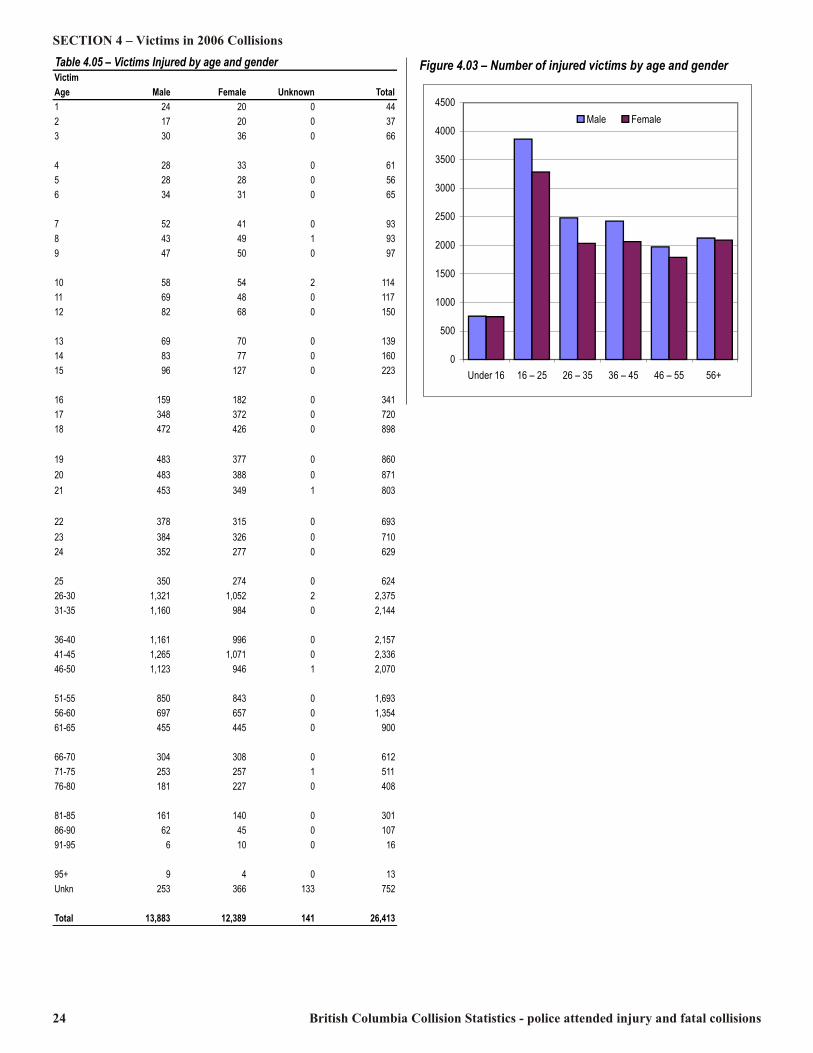
24 British Columbia Collision Statistics - police attended injury and fatal collisions
SECTION 4 – Victims in 2006 CollisionsTable 4.05 – Victims Injured by age and genderVictimAge Male Female Unknown Total1 24 20 0 442 17 20 0 373 30 36 0 664 28 33 0 615 28 28 0 566 34 31 0 657 52 41 0 938 43 49 1 939 47 50 0 9710 58 54 2 11411 69 48 0 11712 82 68 0 15013 69 70 0 13914 83 77 0 16015 96 127 0 22316 159 182 0 34117 348 372 0 72018 472 426 0 89819 483 377 0 86020 483 388 0 87121 453 349 1 80322 378 315 0 69323 384 326 0 71024 352 277 0 62925 350 274 0 62426-30 1,321 1,052 2 2,37531-35 1,160 984 0 2,14436-40 1,161 996 0 2,15741-45 1,265 1,071 0 2,33646-50 1,123 946 1 2,07051-55 850 843 0 1,69356-60 697 657 0 1,35461-65 455 445 0 90066-70 304 308 0 61271-75 253 257 1 51176-80 181 227 0 40881-85 161 140 0 30186-90 62 45 0 10791-95 6 10 0 1695+ 9 4 0 13Unkn 253 366 133 752Total 13,883 12,389 141 26,413
Figure 4.03 – Number of injured victims by age and gender
0500
10001500200025003000350040004500
Under 16 16 – 25 26 – 35 36 – 45 46 – 55 56+
Male Female
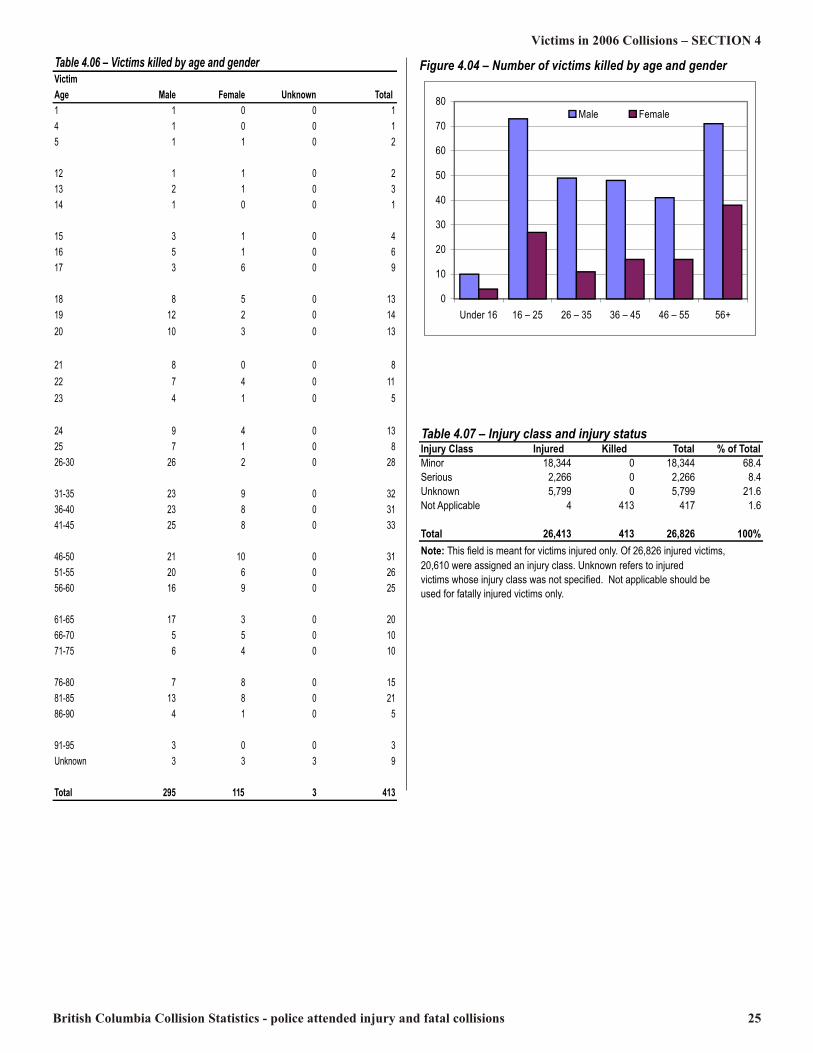
British Columbia Collision Statistics - police attended injury and fatal collisions 25
Victims in 2006 Collisions – SECTION 4Table 4.06 – Victims killed by age and genderVictimAge Male Female Unknown Total 1 1 0 0 14 1 0 0 15 1 1 0 212 1 1 0 213 2 1 0 314 1 0 0 115 3 1 0 416 5 1 0 617 3 6 0 918 8 5 0 1319 12 2 0 1420 10 3 0 1321 8 0 0 822 7 4 0 1123 4 1 0 524 9 4 0 1325 7 1 0 826-30 26 2 0 2831-35 23 9 0 3236-40 23 8 0 3141-45 25 8 0 3346-50 21 10 0 3151-55 20 6 0 2656-60 16 9 0 2561-65 17 3 0 2066-70 5 5 0 1071-75 6 4 0 1076-80 7 8 0 1581-85 13 8 0 2186-90 4 1 0 591-95 3 0 0 3Unknown 3 3 3 9Total 295 115 3 413
Figure 4.04 – Number of victims killed by age and gender
01020304050607080
Under 16 16 – 25 26 – 35 36 – 45 46 – 55 56+
Male Female
Table 4.07 – Injury class and injury statusInjury Class Injured Killed Total % of TotalMinor 18,344 0 18,344 68.4Serious 2,266 0 2,266 8.4Unknown 5,799 0 5,799 21.6Not Applicable 4 413 417 1.6Total 26,413 413 26,826 100%Note: This field is meant for victims injured only. Of 26,826 injured victims,20,610 were assigned an injury class. Unknown refers to injuredvictims whose injury class was not specified. Not applicable should beused for fatally injured victims only.

26 British Columbia Collision Statistics - police attended injury and fatal collisions
SECTION 4 – Victims in 2006 CollisionsTable 4.08 – Location of most severe injury and injury type (fatal and non-fatal injuries) Elbow Knee/ Face/ Shoulder Lower Abdomen Hip/Upper Lower Entire Injury Type Head Nose Eye Neck Chest Back Upper Arm Arm/Hand Pelvis Leg Leg/foot Body Unknown TotalWhiplash 416 33 16 5,512 250 1,233 220 30 39 23 44 194 127 8,137Bruises 813 282 26 621 1,108 679 682 596 287 465 1,140 294 105 7,098Abrasion 623 367 19 196 150 135 193 518 47 99 465 77 45 2,934Lacerations 700 320 22 54 32 26 53 348 16 25 123 55 21 1,795Fracture 141 49 5 59 169 71 157 266 71 144 405 177 15 1,729Bleeding 521 343 15 43 42 15 37 144 26 12 78 107 13 1,396Concussion 462 2 0 49 18 15 10 5 5 2 5 26 16 615Dislocation 6 2 0 12 2 24 112 28 2 11 41 4 2 246Burns 3 2 0 3 7 5 8 24 0 1 7 17 3 80Drowning 3 1 0 12 2 2 1 0 0 0 2 10 5 38Amputations 5 2 0 2 2 0 1 5 0 0 4 3 2 26Other 31 6 1 32 30 34 19 19 16 8 18 30 27 271Unknown 216 56 1 358 171 272 121 82 57 47 140 73 867 2,461Total 3,940 1,465 105 6,953 1,983 2,511 1,614 2,065 566 837 2,472 1,067 1,248 26,826Note: Injury type was recorded by the attending police officer and may not be confirmed by medical examination. Non-observable injuries may be based on victim's testimony only.
Table 4.10 – Victims by injury typeInjury Type Injured Killed TotalWhiplash 8,133 4 8,137Bruises 7,083 15 7,098Abrasion 2,929 5 2,934Lacerations 1,773 22 1,795Fracture 1,560 169 1,729Bleeding 1,307 89 1,396Concussion 593 22 615Dislocation 242 4 246Burns 69 11 80Drowning 24 14 38Amputations 20 6 26Other 244 27 271Unknown 2,436 25 2,461Total 26,413 413 26,826Note: Injury type was determined by the attending police officer andmay not always be confirmed by medical examination. Non-observable injuries may be based on victim's testimony only.
Table 4.09 – Victims by location of most severe injuryInjury Location Injured Killed TotalNeck 6,931 22 6,953Head 3,783 157 3,940Back 2,510 1 2,511Knee/Lower Leg/Foot 2,468 4 2,472Elbow/Lower Arm/Hand 2,065 0 2,065Chest 1,950 33 1,983Shoulder/Upper Arm 1,613 1 1,614Face/Nose 1,462 3 1,465Entire Body 903 164 1,067Hip/Upper Leg 834 3 837Abdomen/Pelvis 558 8 566Eye 105 0 105Unknown 1,231 17 1,248Total 26,413 413 26,826
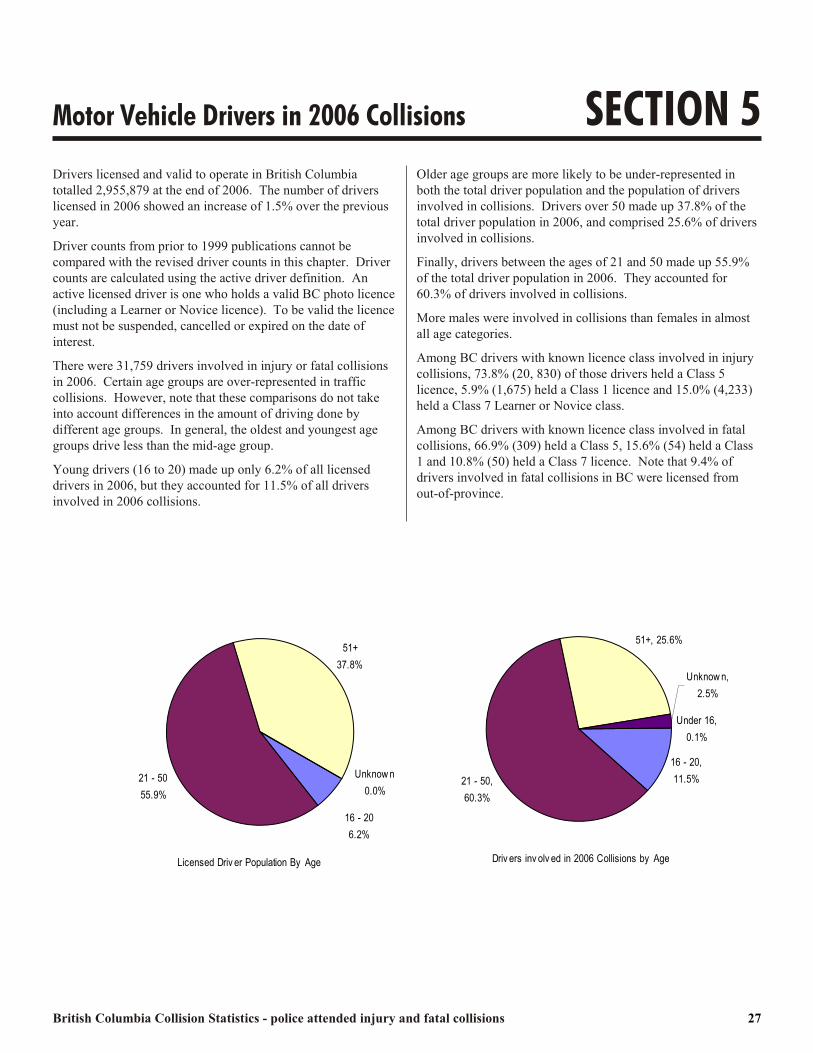
British Columbia Collision Statistics - police attended injury and fatal collisions 27
Motor Vehicle Drivers in 2006 Collisions SECTION 5Drivers licensed and valid to operate in British Columbiatotalled 2,955,879 at the end of 2006. The number of driverslicensed in 2006 showed an increase of 1.5% over the previousyear.Driver counts from prior to 1999 publications cannot becompared with the revised driver counts in this chapter. Drivercounts are calculated using the active driver definition. Anactive licensed driver is one who holds a valid BC photo licence (including a Learner or Novice licence). To be valid the licence must not be suspended, cancelled or expired on the date ofinterest.There were 31,759 drivers involved in injury or fatal collisionsin 2006. Certain age groups are over-represented in trafficcollisions. However, note that these comparisons do not takeinto account differences in the amount of driving done bydifferent age groups. In general, the oldest and youngest agegroups drive less than the mid-age group.Young drivers (16 to 20) made up only 6.2% of all licenseddrivers in 2006, but they accounted for 11.5% of all driversinvolved in 2006 collisions.
Older age groups are more likely to be under-represented inboth the total driver population and the population of driversinvolved in collisions. Drivers over 50 made up 37.8% of thetotal driver population in 2006, and comprised 25.6% of driversinvolved in collisions. Finally, drivers between the ages of 21 and 50 made up 55.9%of the total driver population in 2006. They accounted for60.3% of drivers involved in collisions.More males were involved in collisions than females in almostall age categories. Among BC drivers with known licence class involved in injurycollisions, 73.8% (20, 830) of those drivers held a Class 5licence, 5.9% (1,675) held a Class 1 licence and 15.0% (4,233)held a Class 7 Learner or Novice class. Among BC drivers with known licence class involved in fatalcollisions, 66.9% (309) held a Class 5, 15.6% (54) held a Class1 and 10.8% (50) held a Class 7 licence. Note that 9.4% ofdrivers involved in fatal collisions in BC were licensed fromout-of-province.
Licensed Driv er Population By Age16 - 206.2%
51+37.8%
Unknow n0.0%21 - 5055.9%Driv ers inv olv ed in 2006 Collisions by Age
Under 16, 0.1%16 - 20, 11.5%21 - 50, 60.3%
51+, 25.6%Unknow n, 2.5%
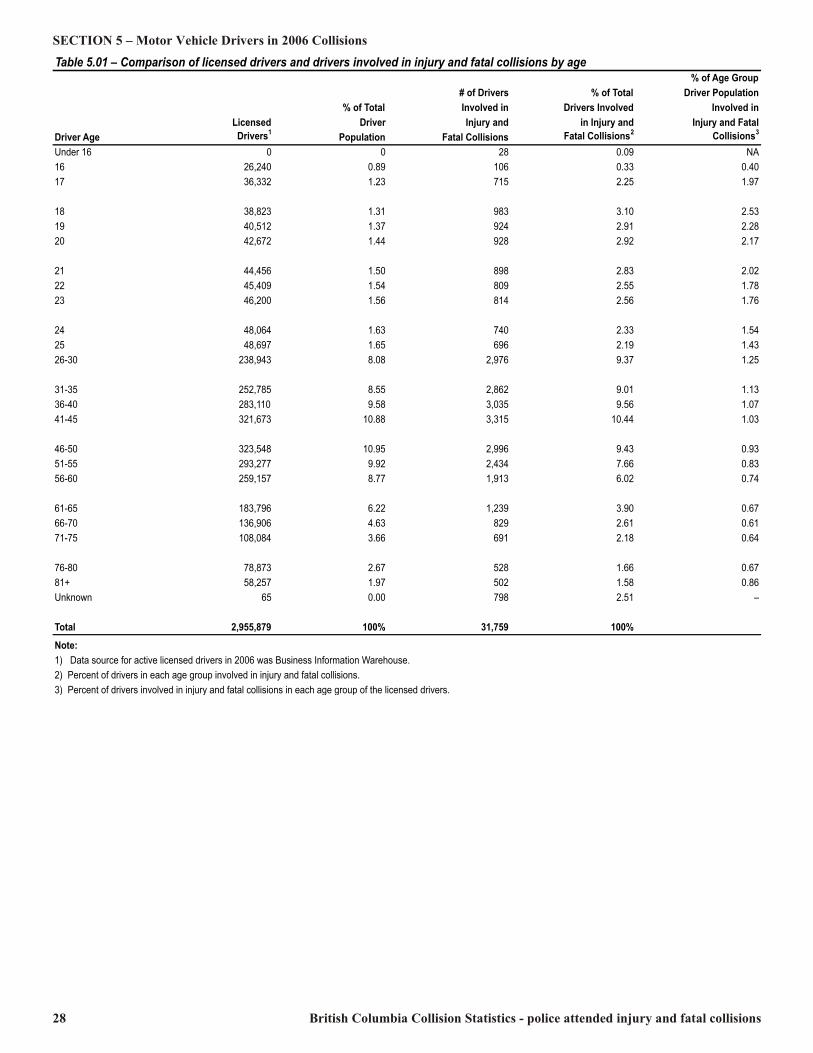
28 British Columbia Collision Statistics - police attended injury and fatal collisions
SECTION 5 – Motor Vehicle Drivers in 2006 CollisionsTable 5.01 – Comparison of licensed drivers and drivers involved in injury and fatal collisions by age % of Age Group# of Drivers % of Total Driver Population% of Total Involved in Drivers Involved Involved inLicensed Driver Injury and in Injury and Injury and FatalDriver Age Drivers1 Population Fatal Collisions Fatal Collisions2 Collisions3Under 16 0 0 28 0.09 NA16 26,240 0.89 106 0.33 0.4017 36,332 1.23 715 2.25 1.9718 38,823 1.31 983 3.10 2.5319 40,512 1.37 924 2.91 2.2820 42,672 1.44 928 2.92 2.1721 44,456 1.50 898 2.83 2.0222 45,409 1.54 809 2.55 1.7823 46,200 1.56 814 2.56 1.7624 48,064 1.63 740 2.33 1.5425 48,697 1.65 696 2.19 1.4326-30 238,943 8.08 2,976 9.37 1.2531-35 252,785 8.55 2,862 9.01 1.1336-40 283,110 9.58 3,035 9.56 1.0741-45 321,673 10.88 3,315 10.44 1.0346-50 323,548 10.95 2,996 9.43 0.9351-55 293,277 9.92 2,434 7.66 0.8356-60 259,157 8.77 1,913 6.02 0.7461-65 183,796 6.22 1,239 3.90 0.6766-70 136,906 4.63 829 2.61 0.6171-75 108,084 3.66 691 2.18 0.6476-80 78,873 2.67 528 1.66 0.6781+ 58,257 1.97 502 1.58 0.86Unknown 65 0.00 798 2.51 –Total 2,955,879 100% 31,759 100%Note: 1) Data source for active licensed drivers in 2006 was Business Information Warehouse. 2) Percent of drivers in each age group involved in injury and fatal collisions.3) Percent of drivers involved in injury and fatal collisions in each age group of the licensed drivers.
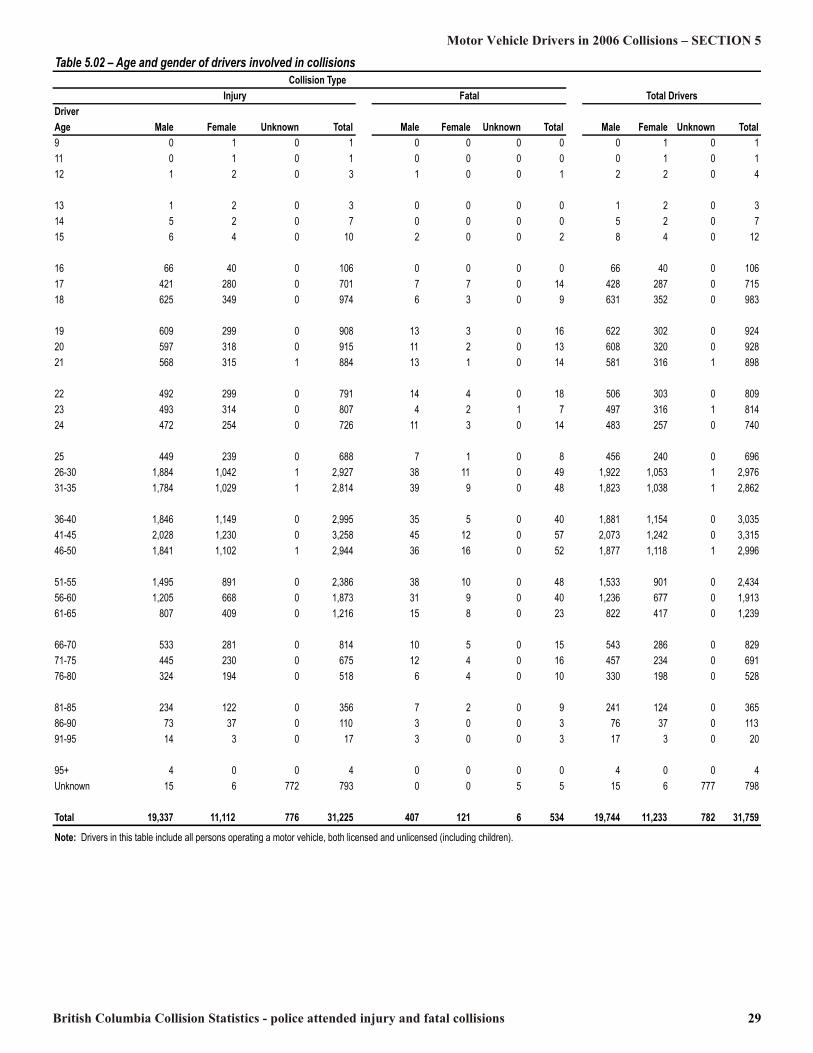
British Columbia Collision Statistics - police attended injury and fatal collisions 29
Motor Vehicle Drivers in 2006 Collisions – SECTION 5Table 5.02 – Age and gender of drivers involved in collisions Collision TypeInjury Fatal Total DriversDriverAge Male Female Unknown Total Male Female Unknown Total Male Female Unknown Total9 0 1 0 1 0 0 0 0 0 1 0 111 0 1 0 1 0 0 0 0 0 1 0 112 1 2 0 3 1 0 0 1 2 2 0 413 1 2 0 3 0 0 0 0 1 2 0 314 5 2 0 7 0 0 0 0 5 2 0 715 6 4 0 10 2 0 0 2 8 4 0 1216 66 40 0 106 0 0 0 0 66 40 0 10617 421 280 0 701 7 7 0 14 428 287 0 71518 625 349 0 974 6 3 0 9 631 352 0 98319 609 299 0 908 13 3 0 16 622 302 0 92420 597 318 0 915 11 2 0 13 608 320 0 92821 568 315 1 884 13 1 0 14 581 316 1 89822 492 299 0 791 14 4 0 18 506 303 0 80923 493 314 0 807 4 2 1 7 497 316 1 81424 472 254 0 726 11 3 0 14 483 257 0 74025 449 239 0 688 7 1 0 8 456 240 0 69626-30 1,884 1,042 1 2,927 38 11 0 49 1,922 1,053 1 2,97631-35 1,784 1,029 1 2,814 39 9 0 48 1,823 1,038 1 2,86236-40 1,846 1,149 0 2,995 35 5 0 40 1,881 1,154 0 3,03541-45 2,028 1,230 0 3,258 45 12 0 57 2,073 1,242 0 3,31546-50 1,841 1,102 1 2,944 36 16 0 52 1,877 1,118 1 2,99651-55 1,495 891 0 2,386 38 10 0 48 1,533 901 0 2,43456-60 1,205 668 0 1,873 31 9 0 40 1,236 677 0 1,91361-65 807 409 0 1,216 15 8 0 23 822 417 0 1,23966-70 533 281 0 814 10 5 0 15 543 286 0 82971-75 445 230 0 675 12 4 0 16 457 234 0 69176-80 324 194 0 518 6 4 0 10 330 198 0 52881-85 234 122 0 356 7 2 0 9 241 124 0 36586-90 73 37 0 110 3 0 0 3 76 37 0 11391-95 14 3 0 17 3 0 0 3 17 3 0 2095+ 4 0 0 4 0 0 0 0 4 0 0 4Unknown 15 6 772 793 0 0 5 5 15 6 777 798Total 19,337 11,112 776 31,225 407 121 6 534 19,744 11,233 782 31,759Note: Drivers in this table include all persons operating a motor vehicle, both licensed and unlicensed (including children).
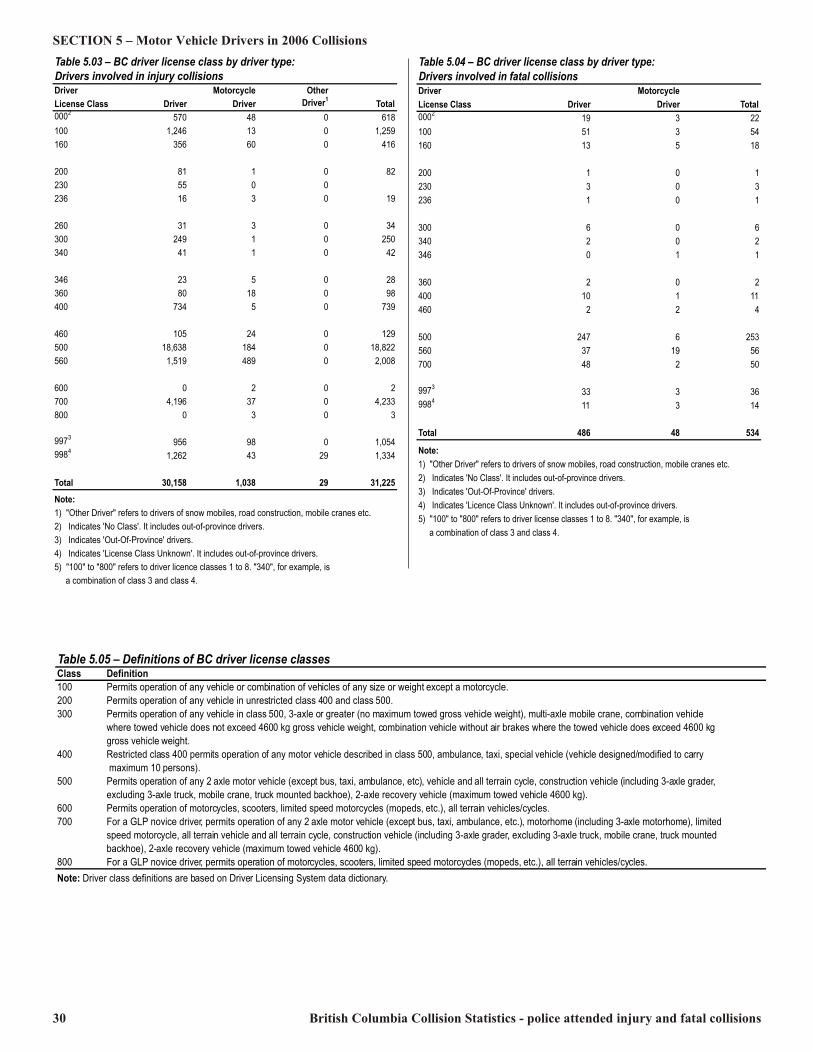
30 British Columbia Collision Statistics - police attended injury and fatal collisions
SECTION 5 – Motor Vehicle Drivers in 2006 Collisions Table 5.04 – BC driver license class by driver type: Drivers involved in fatal collisionsDriver Motorcycle License Class Driver Driver Total0002 19 3 22100 51 3 54160 13 5 18200 1 0 1230 3 0 3236 1 0 1300 6 0 6340 2 0 2346 0 1 1360 2 0 2400 10 1 11460 2 2 4500 247 6 253560 37 19 56700 48 2 509973 33 3 369984 11 3 14Total 486 48 534Note:1) "Other Driver" refers to drivers of snow mobiles, road construction, mobile cranes etc.2) Indicates 'No Class'. It includes out-of-province drivers.3) Indicates 'Out-Of-Province' drivers.4) Indicates 'Licence Class Unknown'. It includes out-of-province drivers.5) "100" to "800" refers to driver license classes 1 to 8. "340", for example, is a combination of class 3 and class 4.
Table 5.03 – BC driver license class by driver type: Drivers involved in injury collisionsDriver Motorcycle Other License Class Driver Driver Driver1 Total0002 570 48 0 618100 1,246 13 0 1,259160 356 60 0 416200 81 1 0 82230 55 0 0236 16 3 0 19260 31 3 0 34300 249 1 0 250340 41 1 0 42346 23 5 0 28360 80 18 0 98400 734 5 0 739460 105 24 0 129500 18,638 184 0 18,822560 1,519 489 0 2,008600 0 2 0 2700 4,196 37 0 4,233800 0 3 0 39973 956 98 0 1,0549984 1,262 43 29 1,334Total 30,158 1,038 29 31,225Note:1) "Other Driver" refers to drivers of snow mobiles, road construction, mobile cranes etc.2) Indicates 'No Class'. It includes out-of-province drivers.3) Indicates 'Out-Of-Province' drivers.4) Indicates 'License Class Unknown'. It includes out-of-province drivers.5) "100" to "800" refers to driver licence classes 1 to 8. "340", for example, is a combination of class 3 and class 4.
Table 5.05 – Definitions of BC driver license classesClass Definition100 Permits operation of any vehicle or combination of vehicles of any size or weight except a motorcycle. 200 Permits operation of any vehicle in unrestricted class 400 and class 500.300 Permits operation of any vehicle in class 500, 3-axle or greater (no maximum towed gross vehicle weight), multi-axle mobile crane, combination vehicle where towed vehicle does not exceed 4600 kg gross vehicle weight, combination vehicle without air brakes where the towed vehicle does exceed 4600 kg gross vehicle weight.400 Restricted class 400 permits operation of any motor vehicle described in class 500, ambulance, taxi, special vehicle (vehicle designed/modified to carry maximum 10 persons).500 Permits operation of any 2 axle motor vehicle (except bus, taxi, ambulance, etc), vehicle and all terrain cycle, construction vehicle (including 3-axle grader, excluding 3-axle truck, mobile crane, truck mounted backhoe), 2-axle recovery vehicle (maximum towed vehicle 4600 kg).600 Permits operation of motorcycles, scooters, limited speed motorcycles (mopeds, etc.), all terrain vehicles/cycles. 700 For a GLP novice driver, permits operation of any 2 axle motor vehicle (except bus, taxi, ambulance, etc.), motorhome (including 3-axle motorhome), limited speed motorcycle, all terrain vehicle and all terrain cycle, construction vehicle (including 3-axle grader, excluding 3-axle truck, mobile crane, truck mountedbackhoe), 2-axle recovery vehicle (maximum towed vehicle 4600 kg). 800 For a GLP novice driver, permits operation of motorcycles, scooters, limited speed motorcycles (mopeds, etc.), all terrain vehicles/cycles. Note: Driver class definitions are based on Driver Licensing System data dictionary.
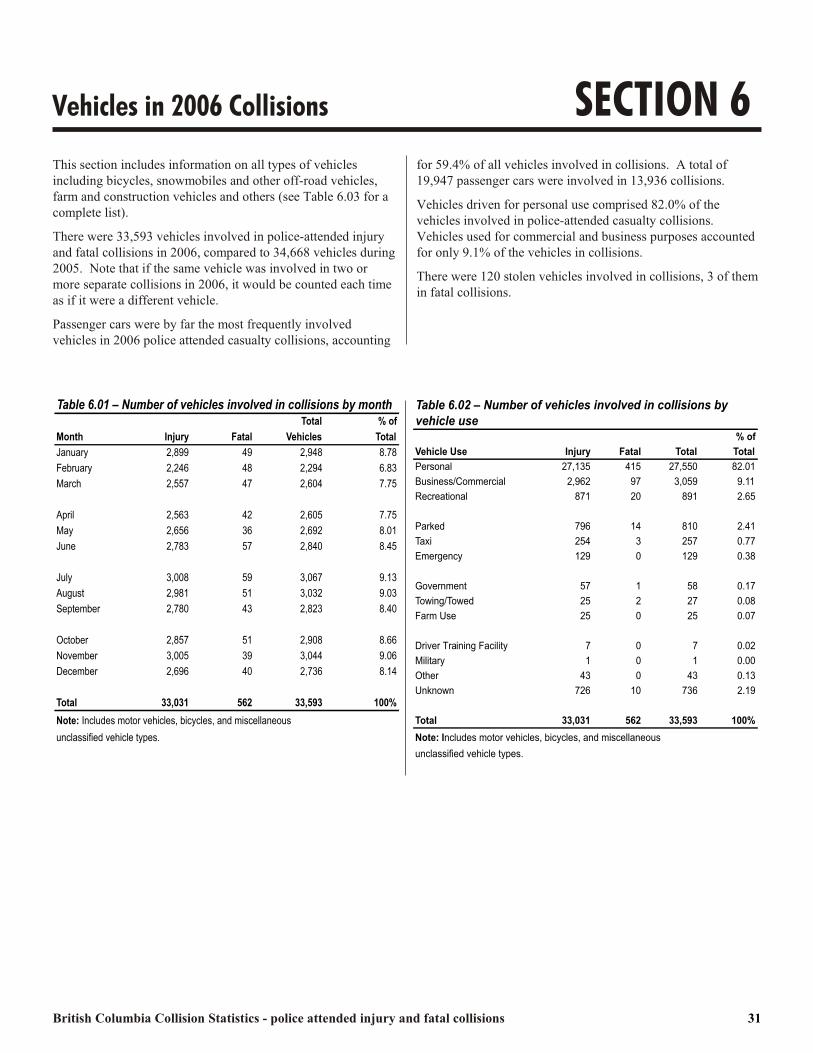
British Columbia Collision Statistics - police attended injury and fatal collisions 31
Vehicles in 2006 Collisions SECTION 6 This section includes information on all types of vehiclesincluding bicycles, snowmobiles and other off-road vehicles,farm and construction vehicles and others (see Table 6.03 for acomplete list). There were 33,593 vehicles involved in police-attended injuryand fatal collisions in 2006, compared to 34,668 vehicles during 2005. Note that if the same vehicle was involved in two ormore separate collisions in 2006, it would be counted each timeas if it were a different vehicle. Passenger cars were by far the most frequently involvedvehicles in 2006 police attended casualty collisions, accounting
for 59.4% of all vehicles involved in collisions. A total of19,947 passenger cars were involved in 13,936 collisions. Vehicles driven for personal use comprised 82.0% of thevehicles involved in police-attended casualty collisions. Vehicles used for commercial and business purposes accountedfor only 9.1% of the vehicles in collisions. There were 120 stolen vehicles involved in collisions, 3 of them in fatal collisions.
Table 6.01 – Number of vehicles involved in collisions by month Total % ofMonth Injury Fatal Vehicles TotalJanuary 2,899 49 2,948 8.78February 2,246 48 2,294 6.83March 2,557 47 2,604 7.75April 2,563 42 2,605 7.75May 2,656 36 2,692 8.01June 2,783 57 2,840 8.45July 3,008 59 3,067 9.13August 2,981 51 3,032 9.03September 2,780 43 2,823 8.40October 2,857 51 2,908 8.66November 3,005 39 3,044 9.06December 2,696 40 2,736 8.14Total 33,031 562 33,593 100%Note: Includes motor vehicles, bicycles, and miscellaneous unclassified vehicle types.
Table 6.02 – Number of vehicles involved in collisions by vehicle use % ofVehicle Use Injury Fatal Total TotalPersonal 27,135 415 27,550 82.01Business/Commercial 2,962 97 3,059 9.11Recreational 871 20 891 2.65Parked 796 14 810 2.41Taxi 254 3 257 0.77Emergency 129 0 129 0.38Government 57 1 58 0.17Towing/Towed 25 2 27 0.08Farm Use 25 0 25 0.07Driver Training Facility 7 0 7 0.02Military 1 0 1 0.00Other 43 0 43 0.13Unknown 726 10 736 2.19Total 33,031 562 33,593 100%Note: Includes motor vehicles, bicycles, and miscellaneous unclassified vehicle types.
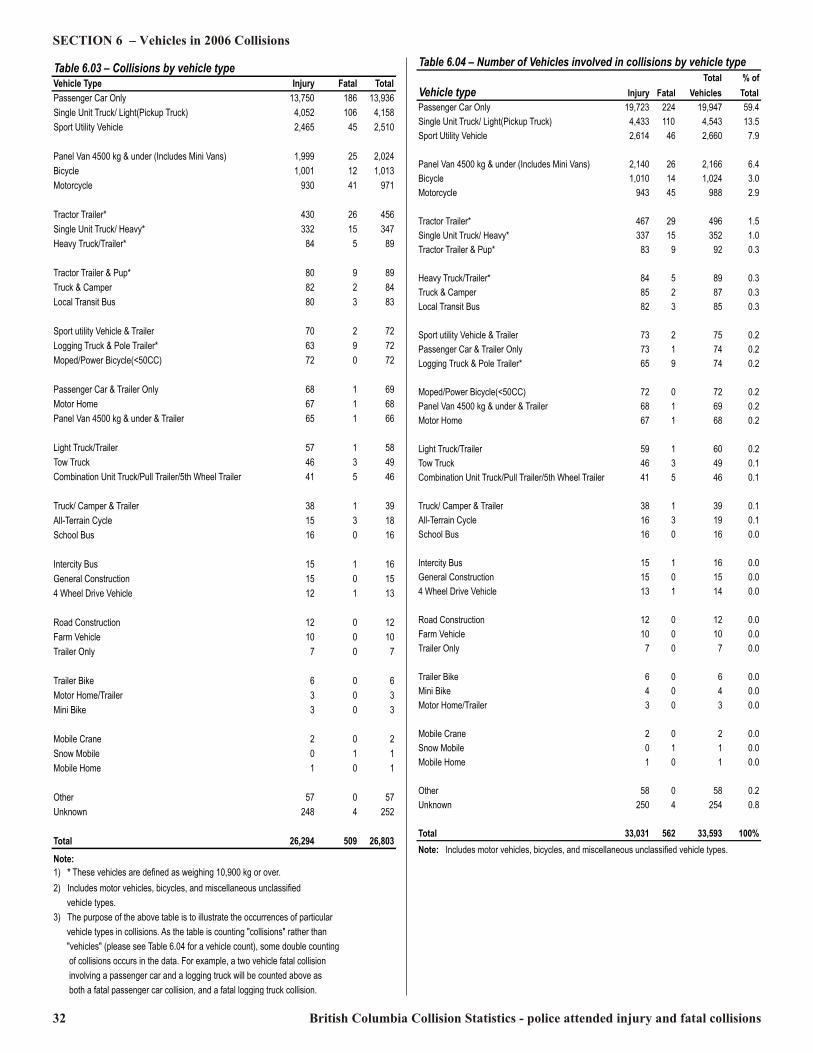
32 British Columbia Collision Statistics - police attended injury and fatal collisions
SECTION 6 – Vehicles in 2006 CollisionsTable 6.03 – Collisions by vehicle type Vehicle Type Injury Fatal TotalPassenger Car Only 13,750 186 13,936Single Unit Truck/ Light(Pickup Truck) 4,052 106 4,158Sport Utility Vehicle 2,465 45 2,510Panel Van 4500 kg & under (Includes Mini Vans) 1,999 25 2,024Bicycle 1,001 12 1,013Motorcycle 930 41 971Tractor Trailer* 430 26 456Single Unit Truck/ Heavy* 332 15 347Heavy Truck/Trailer* 84 5 89Tractor Trailer & Pup* 80 9 89Truck & Camper 82 2 84Local Transit Bus 80 3 83Sport utility Vehicle & Trailer 70 2 72Logging Truck & Pole Trailer* 63 9 72Moped/Power Bicycle(<50CC) 72 0 72Passenger Car & Trailer Only 68 1 69Motor Home 67 1 68Panel Van 4500 kg & under & Trailer 65 1 66Light Truck/Trailer 57 1 58Tow Truck 46 3 49Combination Unit Truck/Pull Trailer/5th Wheel Trailer 41 5 46Truck/ Camper & Trailer 38 1 39All-Terrain Cycle 15 3 18School Bus 16 0 16Intercity Bus 15 1 16General Construction 15 0 154 Wheel Drive Vehicle 12 1 13Road Construction 12 0 12Farm Vehicle 10 0 10Trailer Only 7 0 7Trailer Bike 6 0 6Motor Home/Trailer 3 0 3Mini Bike 3 0 3Mobile Crane 2 0 2Snow Mobile 0 1 1Mobile Home 1 0 1Other 57 0 57Unknown 248 4 252Total 26,294 509 26,803Note:1) * These vehicles are defined as weighing 10,900 kg or over.2) Includes motor vehicles, bicycles, and miscellaneous unclassified vehicle types.3) The purpose of the above table is to illustrate the occurrences of particular vehicle types in collisions. As the table is counting "collisions" rather than "vehicles" (please see Table 6.04 for a vehicle count), some double counting of collisions occurs in the data. For example, a two vehicle fatal collision involving a passenger car and a logging truck will be counted above as both a fatal passenger car collision, and a fatal logging truck collision.
Table 6.04 – Number of Vehicles involved in collisions by vehicle typeTotal % ofVehicle type Injury Fatal Vehicles TotalPassenger Car Only 19,723 224 19,947 59.4Single Unit Truck/ Light(Pickup Truck) 4,433 110 4,543 13.5Sport Utility Vehicle 2,614 46 2,660 7.9Panel Van 4500 kg & under (Includes Mini Vans) 2,140 26 2,166 6.4Bicycle 1,010 14 1,024 3.0Motorcycle 943 45 988 2.9Tractor Trailer* 467 29 496 1.5Single Unit Truck/ Heavy* 337 15 352 1.0Tractor Trailer & Pup* 83 9 92 0.3Heavy Truck/Trailer* 84 5 89 0.3Truck & Camper 85 2 87 0.3Local Transit Bus 82 3 85 0.3Sport utility Vehicle & Trailer 73 2 75 0.2Passenger Car & Trailer Only 73 1 74 0.2Logging Truck & Pole Trailer* 65 9 74 0.2Moped/Power Bicycle(<50CC) 72 0 72 0.2Panel Van 4500 kg & under & Trailer 68 1 69 0.2Motor Home 67 1 68 0.2Light Truck/Trailer 59 1 60 0.2Tow Truck 46 3 49 0.1Combination Unit Truck/Pull Trailer/5th Wheel Trailer 41 5 46 0.1Truck/ Camper & Trailer 38 1 39 0.1All-Terrain Cycle 16 3 19 0.1School Bus 16 0 16 0.0Intercity Bus 15 1 16 0.0General Construction 15 0 15 0.04 Wheel Drive Vehicle 13 1 14 0.0Road Construction 12 0 12 0.0Farm Vehicle 10 0 10 0.0Trailer Only 7 0 7 0.0Trailer Bike 6 0 6 0.0Mini Bike 4 0 4 0.0Motor Home/Trailer 3 0 3 0.0Mobile Crane 2 0 2 0.0Snow Mobile 0 1 1 0.0Mobile Home 1 0 1 0.0Other 58 0 58 0.2Unknown 250 4 254 0.8Total 33,031 562 33,593 100%Note: Includes motor vehicles, bicycles, and miscellaneous unclassified vehicle types.
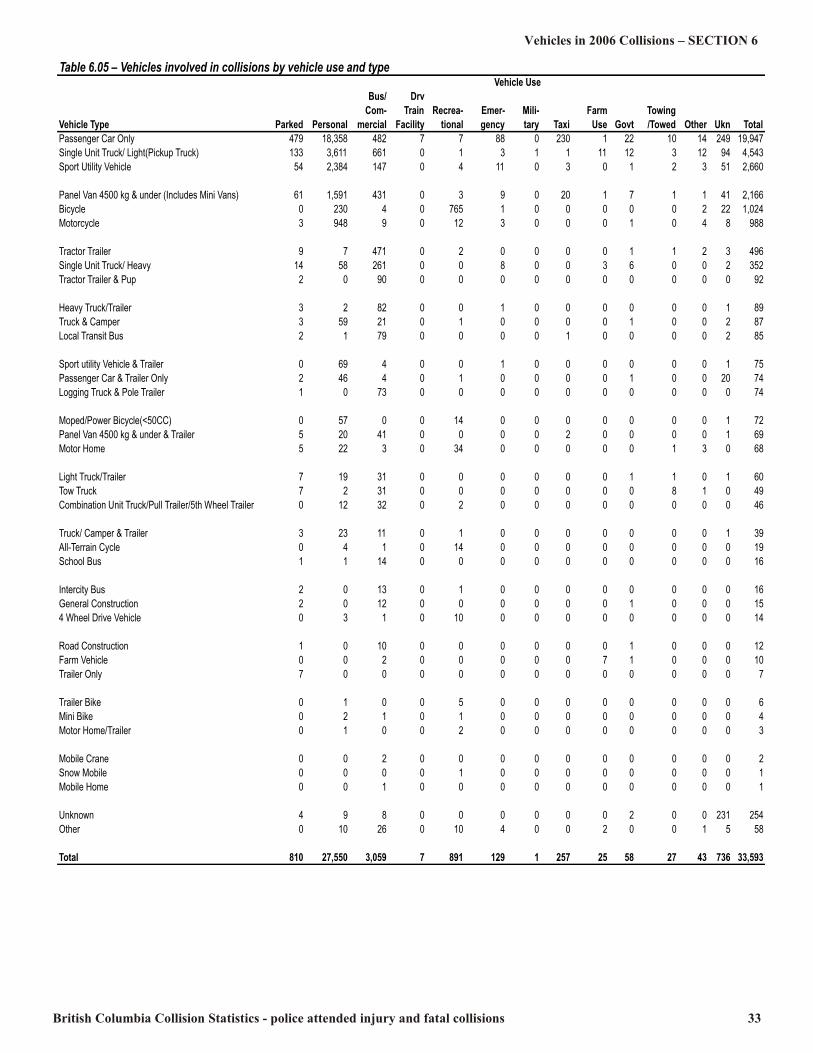
British Columbia Collision Statistics - police attended injury and fatal collisions 33
Vehicles in 2006 Collisions – SECTION 6 Table 6.05 – Vehicles involved in collisions by vehicle use and type Vehicle UseBus/ Drv Com- Train Recrea- Emer- Mili- Farm TowingVehicle Type Parked Personal mercial Facility tional gency tary Taxi Use Govt /Towed Other Ukn TotalPassenger Car Only 479 18,358 482 7 7 88 0 230 1 22 10 14 249 19,947Single Unit Truck/ Light(Pickup Truck) 133 3,611 661 0 1 3 1 1 11 12 3 12 94 4,543Sport Utility Vehicle 54 2,384 147 0 4 11 0 3 0 1 2 3 51 2,660Panel Van 4500 kg & under (Includes Mini Vans) 61 1,591 431 0 3 9 0 20 1 7 1 1 41 2,166Bicycle 0 230 4 0 765 1 0 0 0 0 0 2 22 1,024Motorcycle 3 948 9 0 12 3 0 0 0 1 0 4 8 988Tractor Trailer 9 7 471 0 2 0 0 0 0 1 1 2 3 496Single Unit Truck/ Heavy 14 58 261 0 0 8 0 0 3 6 0 0 2 352Tractor Trailer & Pup 2 0 90 0 0 0 0 0 0 0 0 0 0 92Heavy Truck/Trailer 3 2 82 0 0 1 0 0 0 0 0 0 1 89Truck & Camper 3 59 21 0 1 0 0 0 0 1 0 0 2 87Local Transit Bus 2 1 79 0 0 0 0 1 0 0 0 0 2 85Sport utility Vehicle & Trailer 0 69 4 0 0 1 0 0 0 0 0 0 1 75Passenger Car & Trailer Only 2 46 4 0 1 0 0 0 0 1 0 0 20 74Logging Truck & Pole Trailer 1 0 73 0 0 0 0 0 0 0 0 0 0 74Moped/Power Bicycle(<50CC) 0 57 0 0 14 0 0 0 0 0 0 0 1 72Panel Van 4500 kg & under & Trailer 5 20 41 0 0 0 0 2 0 0 0 0 1 69Motor Home 5 22 3 0 34 0 0 0 0 0 1 3 0 68Light Truck/Trailer 7 19 31 0 0 0 0 0 0 1 1 0 1 60Tow Truck 7 2 31 0 0 0 0 0 0 0 8 1 0 49Combination Unit Truck/Pull Trailer/5th Wheel Trailer 0 12 32 0 2 0 0 0 0 0 0 0 0 46Truck/ Camper & Trailer 3 23 11 0 1 0 0 0 0 0 0 0 1 39All-Terrain Cycle 0 4 1 0 14 0 0 0 0 0 0 0 0 19School Bus 1 1 14 0 0 0 0 0 0 0 0 0 0 16Intercity Bus 2 0 13 0 1 0 0 0 0 0 0 0 0 16General Construction 2 0 12 0 0 0 0 0 0 1 0 0 0 154 Wheel Drive Vehicle 0 3 1 0 10 0 0 0 0 0 0 0 0 14Road Construction 1 0 10 0 0 0 0 0 0 1 0 0 0 12Farm Vehicle 0 0 2 0 0 0 0 0 7 1 0 0 0 10Trailer Only 7 0 0 0 0 0 0 0 0 0 0 0 0 7Trailer Bike 0 1 0 0 5 0 0 0 0 0 0 0 0 6Mini Bike 0 2 1 0 1 0 0 0 0 0 0 0 0 4Motor Home/Trailer 0 1 0 0 2 0 0 0 0 0 0 0 0 3Mobile Crane 0 0 2 0 0 0 0 0 0 0 0 0 0 2Snow Mobile 0 0 0 0 1 0 0 0 0 0 0 0 0 1Mobile Home 0 0 1 0 0 0 0 0 0 0 0 0 0 1Unknown 4 9 8 0 0 0 0 0 0 2 0 0 231 254Other 0 10 26 0 10 4 0 0 2 0 0 1 5 58Total 810 27,550 3,059 7 891 129 1 257 25 58 27 43 736 33,593
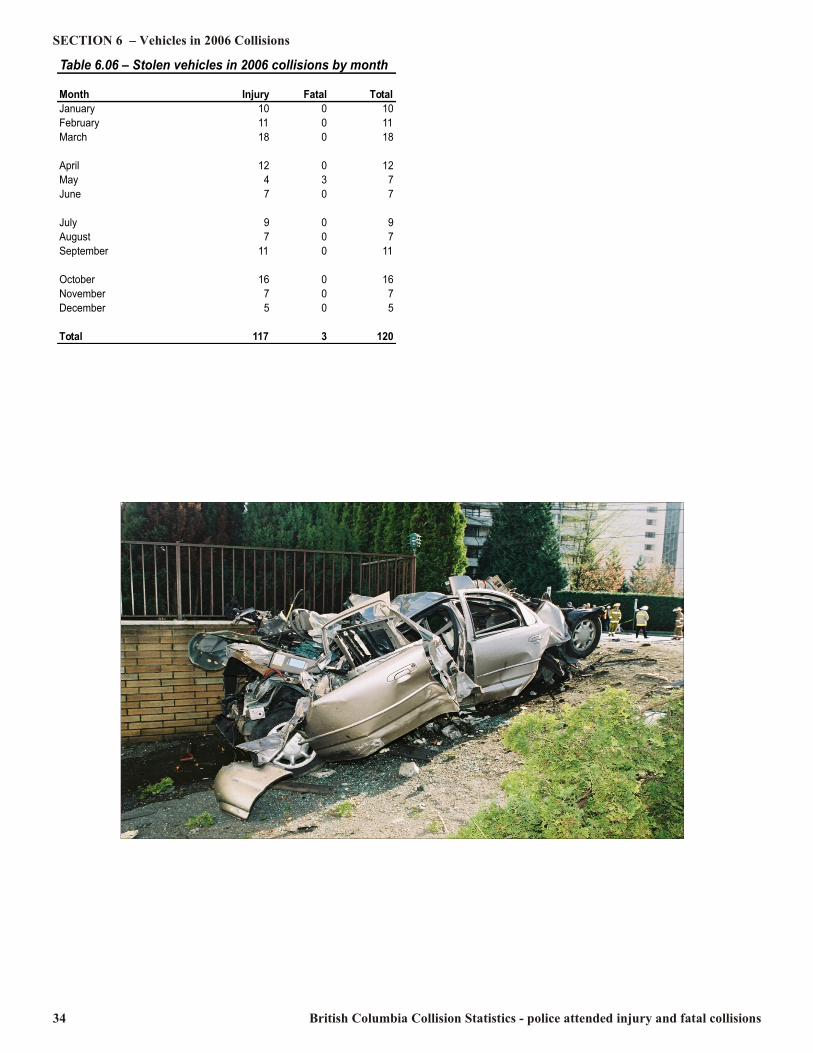
34 British Columbia Collision Statistics - police attended injury and fatal collisions
SECTION 6 – Vehicles in 2006 CollisionsTable 6.06 – Stolen vehicles in 2006 collisions by monthMonth Injury Fatal TotalJanuary 10 0 10February 11 0 11March 18 0 18April 12 0 12May 4 3 7June 7 0 7July 9 0 9August 7 0 7September 11 0 11October 16 0 16November 7 0 7December 5 0 5Total 117 3 120

British Columbia Collision Statistics - police attended injury and fatal collisions 35
Occupant Restraint Use in 2006 Collisions SECTION 7The use of seat belts by motor vehicle drivers and passengershas been mandatory in British Columbia since 1977. In March1985, child restraint legislation was passed, making itcompulsory for children 18 kg and under to be secured in anapproved child restraint. In police-attended injury collisions where driver restraint usewas known, 90.4% of injured drivers were wearing a lap andharness (standard lap and shoulder belt assembly). Only 58.8%of drivers killed were wearing a lap and harness. Among victims killed in passenger cars, 35.8% wereunrestrained whereas for victims killed in light trucks, 57.1%were unrestrained. The tables and graphs in this section strongly indicate theeffectiveness of occupant restraints in reducing casualties. In2006, 80.5% of the drivers involved in casualty collisions whodid not use restraints were injured or killed, while 51.7% ofthose who used the standard lap and harness restraint systemwere injured or killed.
Similarly, among vehicle passengers involved in casualtycollisions, 79.4% of those not using a restraint were injured orkilled compared to 47.3% using the standard lap and harnessassembly. Among 811 passengers in child restraints, 169(20.8%) were injured and none was killed. Note that these datainclude only casualty collisions (those in which at least oneperson was killed or injured). Therefore the data do not address the overall effectiveness of safety devices in preventing injuryacross all levels of crash severity.Statistics on occupants ejected from vehicles show that ejectioncarries a very high risk of injury or death. Among ejected orpartially ejected drivers, 22.4% were killed and another 71.4%were injured. Similarly, 16.9% of ejected or partially ejectedpassengers were killed and 76.5% were injured. Child restraintapparently were effective in preventing children from beinginjured or killed in crashes.
Table 7.01 – Type of restraint used by driversNot % Safety Equipment Injured Injured Killed Total TotalLap & Harness with no Air Bag Deployed 10,917 9,660 64 20,641 67.47Lap & harness & Air Bag Deployed 1,240 3,247 40 4,527 14.80Lap Belt Only 601 560 2 1,163 3.80No Restraint Used 128 569 61 758 2.48Air Bag Deployed(No Restraint Used) 37 164 8 209 0.68Position Not Equipped 28 24 0 52 0.17Restraint Inoperative/Broken 14 27 0 41 0.13Misuse of Restraint 3 10 2 15 0.05Child Restraint Used 2 0 0 2 0.01Other 5 14 0 19 0.06Unknown 2,175 974 15 3,164 10.34Total 15,150 15,249 192 30,591 100%Note: Excludes occupants of motorcycles, snowmobiles and bicycles.
Table 7.02 – Type of restraint used by passengersNot %Safety Equipment Injured Injured Killed Total TotalLap & Harness with no Air Bag Deployed 4,801 4,334 26 9,161 64.30Lap & harness & Air Bag Deployed 452 1,064 18 1,534 10.77Lap Belt Only 465 379 2 846 5.94Child Restraint Used 642 169 0 811 5.69No Restraint Used 167 514 32 713 5.00Position Not Equipped 95 91 3 189 1.33Air Bag Deployed(No Restraint Used) 11 60 2 73 0.51Misuse of Restraint 3 7 0 10 0.07Restraint Inoperative/Broken 0 7 1 8 0.06Misuse of Child Restraint 3 5 0 8 0.06Other 2 18 0 20 0.14Unknown 439 427 9 875 6.14Total 7,080 7,075 93 14,248 100%Note: Excludes occupants of motorcycles, snowmobiles and bicycles.
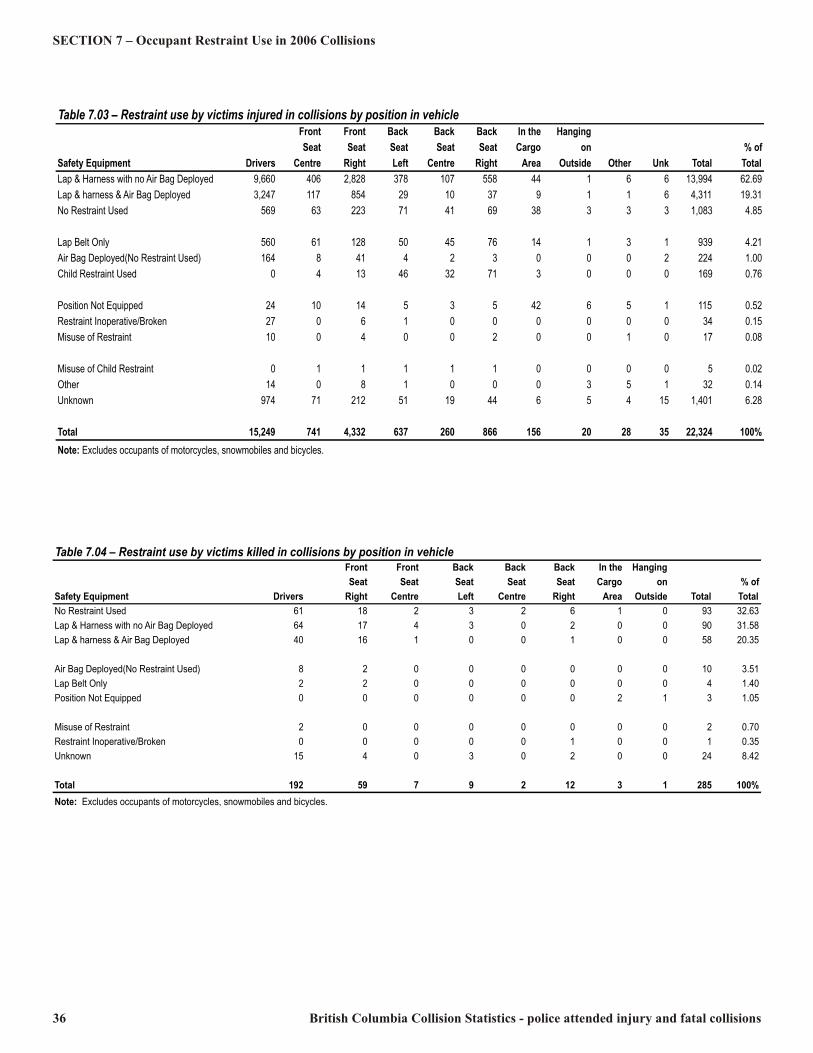
36 British Columbia Collision Statistics - police attended injury and fatal collisions
SECTION 7 – Occupant Restraint Use in 2006 Collisions
Table 7.04 – Restraint use by victims killed in collisions by position in vehicle Front Front Back Back Back In the Hanging Seat Seat Seat Seat Seat Cargo on % ofSafety Equipment Drivers Right Centre Left Centre Right Area Outside Total TotalNo Restraint Used 61 18 2 3 2 6 1 0 93 32.63Lap & Harness with no Air Bag Deployed 64 17 4 3 0 2 0 0 90 31.58Lap & harness & Air Bag Deployed 40 16 1 0 0 1 0 0 58 20.35Air Bag Deployed(No Restraint Used) 8 2 0 0 0 0 0 0 10 3.51Lap Belt Only 2 2 0 0 0 0 0 0 4 1.40Position Not Equipped 0 0 0 0 0 0 2 1 3 1.05Misuse of Restraint 2 0 0 0 0 0 0 0 2 0.70Restraint Inoperative/Broken 0 0 0 0 0 1 0 0 1 0.35Unknown 15 4 0 3 0 2 0 0 24 8.42Total 192 59 7 9 2 12 3 1 285 100%Note: Excludes occupants of motorcycles, snowmobiles and bicycles.
Table 7.03 – Restraint use by victims injured in collisions by position in vehicle Front Front Back Back Back In the Hanging Seat Seat Seat Seat Seat Cargo on % ofSafety Equipment Drivers Centre Right Left Centre Right Area Outside Other Unk Total TotalLap & Harness with no Air Bag Deployed 9,660 406 2,828 378 107 558 44 1 6 6 13,994 62.69Lap & harness & Air Bag Deployed 3,247 117 854 29 10 37 9 1 1 6 4,311 19.31No Restraint Used 569 63 223 71 41 69 38 3 3 3 1,083 4.85Lap Belt Only 560 61 128 50 45 76 14 1 3 1 939 4.21Air Bag Deployed(No Restraint Used) 164 8 41 4 2 3 0 0 0 2 224 1.00Child Restraint Used 0 4 13 46 32 71 3 0 0 0 169 0.76Position Not Equipped 24 10 14 5 3 5 42 6 5 1 115 0.52Restraint Inoperative/Broken 27 0 6 1 0 0 0 0 0 0 34 0.15Misuse of Restraint 10 0 4 0 0 2 0 0 1 0 17 0.08Misuse of Child Restraint 0 1 1 1 1 1 0 0 0 0 5 0.02Other 14 0 8 1 0 0 0 3 5 1 32 0.14Unknown 974 71 212 51 19 44 6 5 4 15 1,401 6.28Total 15,249 741 4,332 637 260 866 156 20 28 35 22,324 100%Note: Excludes occupants of motorcycles, snowmobiles and bicycles.

British Columbia Collision Statistics - police attended injury and fatal collisions 37
Occupant Restraint Use in 2006 Collisions – SECTION 7Table 7.05 – Driver age by restraint use for drivers injuredAir Bag Lap & Lap &No Deployed Restraint Harness & HarnessDriver Position Restraint Lap Belt No Rest Inoperative Air Bag No Air Bag Misuse of % ofAge Not Equipped Used Only Used /Broken Deployed Deployed Restraint Other Unknown Total Total9 0 0 1 0 0 0 0 0 0 0 1 0.0112 0 1 0 0 0 0 1 0 0 0 2 0.0113 0 0 0 0 0 0 0 0 0 1 1 0.0114 0 1 1 0 0 0 2 0 0 0 4 0.0315 0 1 0 0 0 1 3 0 0 1 6 0.0416 0 2 1 0 0 6 25 0 0 6 40 0.2617 2 16 10 3 2 81 234 0 0 22 370 2.4318 1 25 17 6 2 110 304 1 1 35 502 3.2919 0 25 15 7 0 114 285 0 0 32 478 3.1320 1 26 19 8 1 125 299 1 1 36 517 3.3921 0 18 13 8 1 125 287 1 1 32 486 3.1922 0 24 14 3 0 103 237 0 2 19 402 2.6423 1 17 17 4 2 101 254 1 0 26 423 2.7724 0 16 19 6 0 85 237 0 0 21 384 2.5225 0 22 10 3 1 78 223 0 1 30 368 2.4126-30 2 68 59 19 4 311 940 1 1 109 1,514 9.9331-35 1 55 50 15 2 307 925 0 1 98 1,454 9.5436-40 2 65 50 14 2 270 959 3 1 97 1,463 9.5941-45 1 65 55 21 0 306 1060 0 0 107 1,615 10.5946-50 2 25 62 18 4 272 905 2 3 85 1,378 9.0451-55 3 26 39 7 2 225 764 0 1 64 1,131 7.4256-60 4 23 46 9 2 173 588 0 0 47 892 5.8561-65 1 18 26 5 1 144 360 0 0 17 572 3.7566-70 1 4 17 2 0 102 245 0 0 19 390 2.5671-75 1 6 7 0 0 83 190 0 0 11 298 1.9576-80 0 6 8 1 0 59 159 0 0 8 241 1.5881-85 0 3 3 3 1 49 106 0 0 12 177 1.1686-90 0 1 0 0 0 11 33 0 0 1 46 0.3091-95 1 0 0 0 0 1 4 0 0 0 6 0.0495+ 0 0 0 0 0 0 1 0 0 0 1 0.01Unknown 0 10 1 2 0 5 30 0 1 38 87 0.57Total 24 569 560 164 27 3,247 9,660 10 14 974 15,249 99%Note: Excludes drivers of motorcycles, snowmobiles and bicycles.
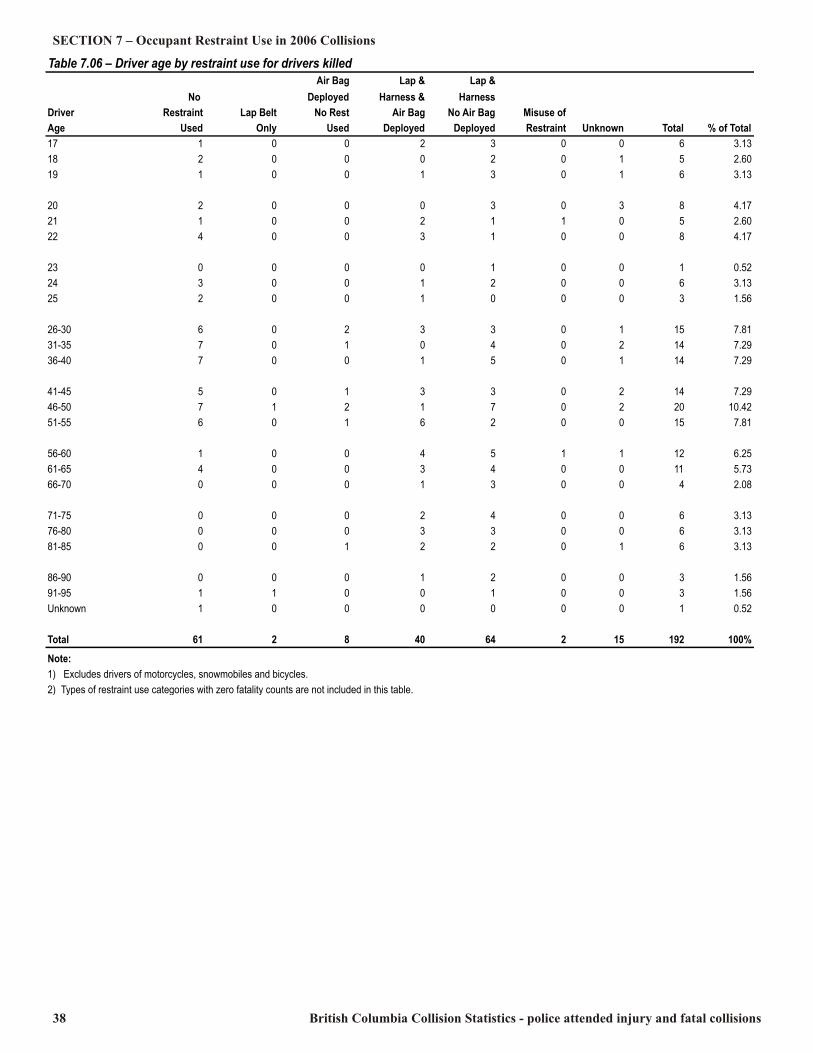
38 British Columbia Collision Statistics - police attended injury and fatal collisions
SECTION 7 – Occupant Restraint Use in 2006 CollisionsTable 7.06 – Driver age by restraint use for drivers killedAir Bag Lap & Lap &No Deployed Harness & HarnessDriver Restraint Lap Belt No Rest Air Bag No Air Bag Misuse ofAge Used Only Used Deployed Deployed Restraint Unknown Total % of Total17 1 0 0 2 3 0 0 6 3.1318 2 0 0 0 2 0 1 5 2.6019 1 0 0 1 3 0 1 6 3.1320 2 0 0 0 3 0 3 8 4.1721 1 0 0 2 1 1 0 5 2.6022 4 0 0 3 1 0 0 8 4.1723 0 0 0 0 1 0 0 1 0.5224 3 0 0 1 2 0 0 6 3.1325 2 0 0 1 0 0 0 3 1.5626-30 6 0 2 3 3 0 1 15 7.8131-35 7 0 1 0 4 0 2 14 7.2936-40 7 0 0 1 5 0 1 14 7.2941-45 5 0 1 3 3 0 2 14 7.2946-50 7 1 2 1 7 0 2 20 10.4251-55 6 0 1 6 2 0 0 15 7.8156-60 1 0 0 4 5 1 1 12 6.2561-65 4 0 0 3 4 0 0 11 5.7366-70 0 0 0 1 3 0 0 4 2.0871-75 0 0 0 2 4 0 0 6 3.1376-80 0 0 0 3 3 0 0 6 3.1381-85 0 0 1 2 2 0 1 6 3.1386-90 0 0 0 1 2 0 0 3 1.5691-95 1 1 0 0 1 0 0 3 1.56Unknown 1 0 0 0 0 0 0 1 0.52Total 61 2 8 40 64 2 15 192 100%Note: 1) Excludes drivers of motorcycles, snowmobiles and bicycles.2) Types of restraint use categories with zero fatality counts are not included in this table.

British Columbia Collision Statistics - police attended injury and fatal collisions 39
Occupant Restraint Use in 2006 Collisions – SECTION 7
Figure 7.02 – Restraint use by drivers killed
Note: Restrained includes Lap and harness with air bag deployed and Lap and harness with no air bag deployed.
Other45%
Restrained55%No Restraint Used72%
Lap Belt Only2%Air Bag Deployed No restraint Used9%Unknown17%
Figure 7.01 – Restraint use by drivers injured
Note: Restrained includes Lap and harness and air bag deployed and Lap and harness with no air bag deployed.
Other15%
Restrained84%
Position Not Equipped1%No Restraint Used24%
Unknown42%
Air Bag Deployed No restraint Used7%Lap Belt Only24%
Other1%Restraint Inoperative/Broken1%
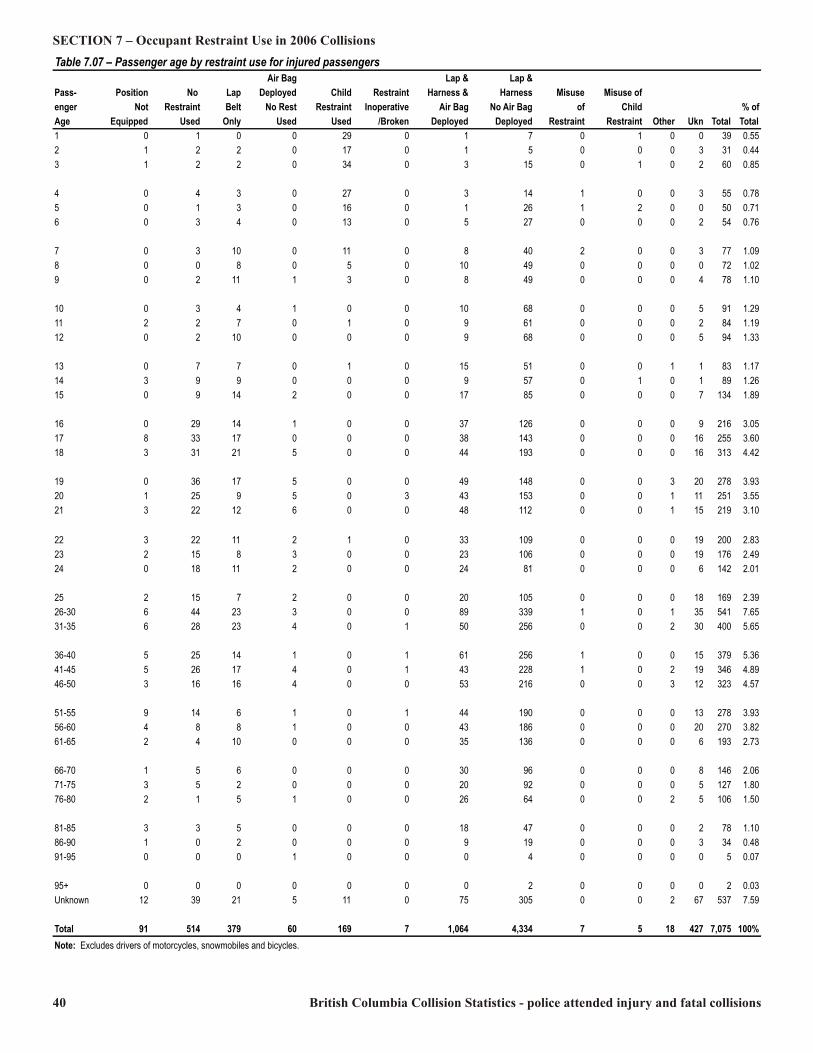
40 British Columbia Collision Statistics - police attended injury and fatal collisions
SECTION 7 – Occupant Restraint Use in 2006 CollisionsTable 7.07 – Passenger age by restraint use for injured passengersAir Bag Lap & Lap &Pass- Position No Lap Deployed Child Restraint Harness & Harness Misuse Misuse ofenger Not Restraint Belt No Rest Restraint Inoperative Air Bag No Air Bag of Child % ofAge Equipped Used Only Used Used /Broken Deployed Deployed Restraint Restraint Other Ukn Total Total1 0 1 0 0 29 0 1 7 0 1 0 0 39 0.552 1 2 2 0 17 0 1 5 0 0 0 3 31 0.443 1 2 2 0 34 0 3 15 0 1 0 2 60 0.854 0 4 3 0 27 0 3 14 1 0 0 3 55 0.785 0 1 3 0 16 0 1 26 1 2 0 0 50 0.716 0 3 4 0 13 0 5 27 0 0 0 2 54 0.767 0 3 10 0 11 0 8 40 2 0 0 3 77 1.098 0 0 8 0 5 0 10 49 0 0 0 0 72 1.029 0 2 11 1 3 0 8 49 0 0 0 4 78 1.1010 0 3 4 1 0 0 10 68 0 0 0 5 91 1.2911 2 2 7 0 1 0 9 61 0 0 0 2 84 1.1912 0 2 10 0 0 0 9 68 0 0 0 5 94 1.3313 0 7 7 0 1 0 15 51 0 0 1 1 83 1.1714 3 9 9 0 0 0 9 57 0 1 0 1 89 1.2615 0 9 14 2 0 0 17 85 0 0 0 7 134 1.8916 0 29 14 1 0 0 37 126 0 0 0 9 216 3.0517 8 33 17 0 0 0 38 143 0 0 0 16 255 3.6018 3 31 21 5 0 0 44 193 0 0 0 16 313 4.4219 0 36 17 5 0 0 49 148 0 0 3 20 278 3.9320 1 25 9 5 0 3 43 153 0 0 1 11 251 3.5521 3 22 12 6 0 0 48 112 0 0 1 15 219 3.1022 3 22 11 2 1 0 33 109 0 0 0 19 200 2.8323 2 15 8 3 0 0 23 106 0 0 0 19 176 2.4924 0 18 11 2 0 0 24 81 0 0 0 6 142 2.0125 2 15 7 2 0 0 20 105 0 0 0 18 169 2.3926-30 6 44 23 3 0 0 89 339 1 0 1 35 541 7.6531-35 6 28 23 4 0 1 50 256 0 0 2 30 400 5.6536-40 5 25 14 1 0 1 61 256 1 0 0 15 379 5.3641-45 5 26 17 4 0 1 43 228 1 0 2 19 346 4.8946-50 3 16 16 4 0 0 53 216 0 0 3 12 323 4.5751-55 9 14 6 1 0 1 44 190 0 0 0 13 278 3.9356-60 4 8 8 1 0 0 43 186 0 0 0 20 270 3.8261-65 2 4 10 0 0 0 35 136 0 0 0 6 193 2.7366-70 1 5 6 0 0 0 30 96 0 0 0 8 146 2.0671-75 3 5 2 0 0 0 20 92 0 0 0 5 127 1.8076-80 2 1 5 1 0 0 26 64 0 0 2 5 106 1.5081-85 3 3 5 0 0 0 18 47 0 0 0 2 78 1.1086-90 1 0 2 0 0 0 9 19 0 0 0 3 34 0.4891-95 0 0 0 1 0 0 0 4 0 0 0 0 5 0.0795+ 0 0 0 0 0 0 0 2 0 0 0 0 2 0.03Unknown 12 39 21 5 11 0 75 305 0 0 2 67 537 7.59Total 91 514 379 60 169 7 1,064 4,334 7 5 18 427 7,075 100%Note: Excludes drivers of motorcycles, snowmobiles and bicycles.
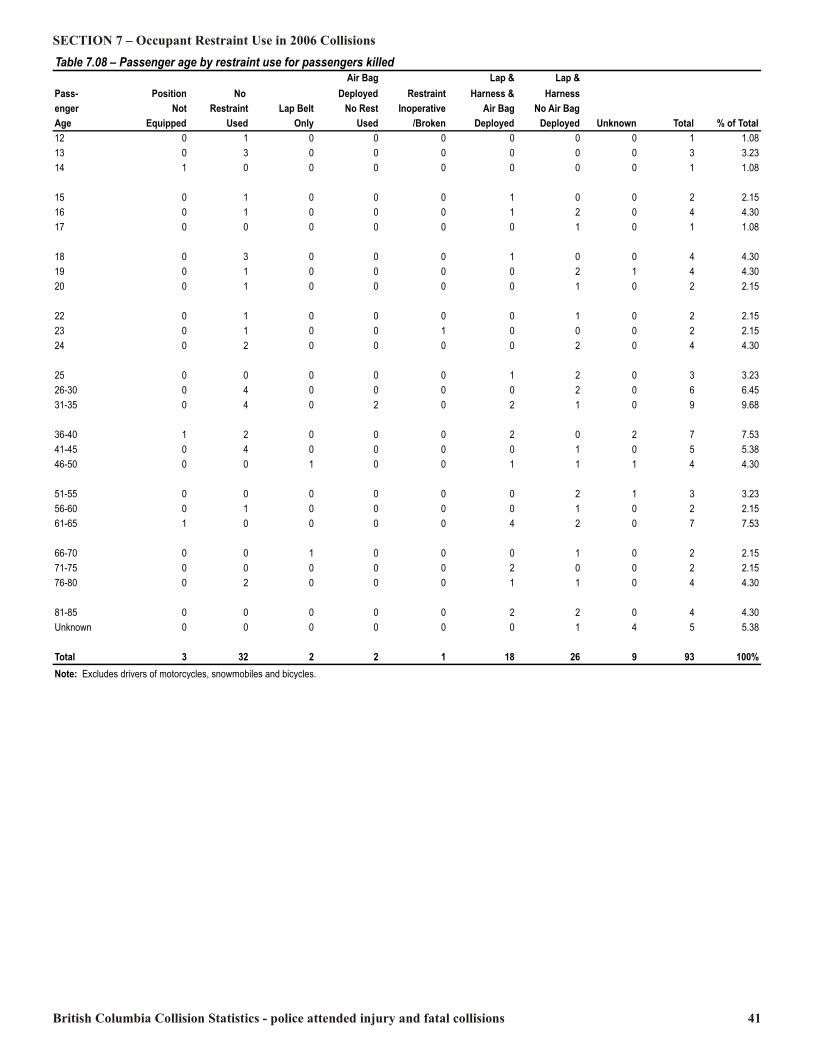
British Columbia Collision Statistics - police attended injury and fatal collisions 41
SECTION 7 – Occupant Restraint Use in 2006 CollisionsTable 7.08 – Passenger age by restraint use for passengers killedAir Bag Lap & Lap &Pass- Position No Deployed Restraint Harness & Harnessenger Not Restraint Lap Belt No Rest Inoperative Air Bag No Air BagAge Equipped Used Only Used /Broken Deployed Deployed Unknown Total % of Total12 0 1 0 0 0 0 0 0 1 1.0813 0 3 0 0 0 0 0 0 3 3.2314 1 0 0 0 0 0 0 0 1 1.0815 0 1 0 0 0 1 0 0 2 2.1516 0 1 0 0 0 1 2 0 4 4.3017 0 0 0 0 0 0 1 0 1 1.0818 0 3 0 0 0 1 0 0 4 4.3019 0 1 0 0 0 0 2 1 4 4.3020 0 1 0 0 0 0 1 0 2 2.1522 0 1 0 0 0 0 1 0 2 2.1523 0 1 0 0 1 0 0 0 2 2.1524 0 2 0 0 0 0 2 0 4 4.3025 0 0 0 0 0 1 2 0 3 3.2326-30 0 4 0 0 0 0 2 0 6 6.4531-35 0 4 0 2 0 2 1 0 9 9.6836-40 1 2 0 0 0 2 0 2 7 7.5341-45 0 4 0 0 0 0 1 0 5 5.3846-50 0 0 1 0 0 1 1 1 4 4.3051-55 0 0 0 0 0 0 2 1 3 3.2356-60 0 1 0 0 0 0 1 0 2 2.1561-65 1 0 0 0 0 4 2 0 7 7.5366-70 0 0 1 0 0 0 1 0 2 2.1571-75 0 0 0 0 0 2 0 0 2 2.1576-80 0 2 0 0 0 1 1 0 4 4.3081-85 0 0 0 0 0 2 2 0 4 4.30Unknown 0 0 0 0 0 0 1 4 5 5.38Total 3 32 2 2 1 18 26 9 93 100%Note: Excludes drivers of motorcycles, snowmobiles and bicycles.

42 British Columbia Collision Statistics - police attended injury and fatal collisions
Occupant Restraint Use in 2006 Collisions – SECTION 7Figure 7.03 – Restraint use by injured passengers
Note: Restrained includes lap and harness and air bag deployed, lap and harness with no air bag deployed, lap & harness and child restraint used
Other21%
Restrained79%
Position Not Equipped6%
No Restraint Used35%
Lap Belt Only25% Air Bag Deployed No restraint Used4%Restraint Inoperative/Broken0%Other1%
Unknown29%
Figure 7.04 – Restraint use by passengers killed
Note: Restrained includes lap and harness and air bag deployed and lap and harness with no air bag deployed.
Restrained47%Other53%
No Restraint Used72%Lap Belt Only4%Air Bag Deployed No restraint Used4%
Unknown20%

British Columbia Collision Statistics - police attended injury and fatal collisions 43
SECTION 7 – Occupant Restraint Use in 2006 CollisionsTable 7.09 – Ejection of drivers and injury outcome incasualty collisions Not Ejection Injured Injured Killed Total Not Ejected 14,948 15,089 158 30,195Partially Ejected 5 38 5 48Ejected 4 67 28 99Unknown 193 55 1 249Total 15,150 15,249 192 30,591Note: Excludes drivers of motorcycles, snowmobiles and bicycles.
Table 7.10 – Ejection of passengers and injury outcome incasualty collisions Not Ejection Injured Injured Killed Total Not Ejected 7,039 6,904 64 14,007Partially Ejected 3 28 4 35Ejected 8 99 24 131Unknown 30 44 1 75Total 7,080 7,075 93 14,248Note: Excludes occupants of motorcycles, snowmobiles and bicycles.
Table 7.11 – Restraint use and occupant ejection for vehicle occupants Not Partially Safety Equipment Ejected Ejected Ejected Ukn TotalLap & Harness with no Air Bag Deployed 29,749 13 19 21 29,802Lap & harness & Air Bag Deployed 6,045 4 7 5 6,061Lap Belt Only 1,996 5 6 2 2,009No Restraint Used 1,270 45 153 3 1,471Child Restraint Used 813 0 0 0 813Air Bag Deployed(No Restraint Used) 272 3 7 0 282Position Not Equipped 208 4 21 8 241Restraint Inoperative/Broken 47 0 2 0 49Misuse of Restraint 25 0 0 0 25Misuse of Child Restraint 8 0 0 0 8Other 33 1 2 3 39Unknown 3,736 8 13 282 4,039Total 44,202 83 230 324 44,839Note: Excludes occupants of motorcycles, snowmobiles and bicycles.

44 British Columbia Collision Statistics - police attended injury and fatal collisions
Occupant Restraint Use in 2006 Collisions – SECTION 7Table 7.12 – Restraint use by victims injured by vehicle type Air Bag Lap & Lap &Position No Deployed Child Restraint Harness & Harness Misuse ofNot Restraint Lap Belt No Rest Restraint Inoperative Air Bag No Air Bag Misuse of ChildVehicle Type Equipped Used Only Used Used /Broken Deployed Deployed Restraint Restraint Other Ukn TotalPassenger Car Only 30 583 610 167 101 26 3,267 9,441 12 2 18 908 15,165Single Unit Truck/ Light(Pickup Truck) 18 246 116 33 16 3 334 1,817 4 1 8 201 2,797Sport Utility Vehicle 9 94 78 15 23 3 359 1,259 1 1 1 110 1,953Panel Van 4500 kg & under (Includes Mini Vans) 9 67 75 8 26 2 279 879 0 1 2 87 1,435Tractor Trailer 12 33 5 1 0 0 10 151 0 0 0 27 239Single Unit Truck/ Heavy 0 18 9 0 0 0 9 95 0 0 0 20 151Truck & Camper 0 2 2 0 0 0 9 43 0 0 0 4 60Sport utility Vehicle & Trailer 0 3 2 0 0 0 5 47 0 0 0 0 57Motor Home 1 3 4 0 1 0 9 24 0 0 1 3 46Passenger Car & Trailer Only 0 2 4 0 0 0 3 32 0 0 0 4 45Logging Truck & Pole Trailer 0 8 10 0 0 0 1 19 0 0 0 5 43Tractor Trailer & Pup 0 8 2 0 0 0 1 29 0 0 0 2 42Panel Van 4500 kg & under & Trailer 0 1 2 0 0 0 8 27 0 0 0 1 39Local Transit Bus 20 4 6 0 0 0 0 7 0 0 0 2 39Truck/ Camper & Trailer 0 3 1 0 0 0 0 24 0 0 1 2 31Combination Unit Truck/Pull Trailer/5th Wheel Trailer 0 1 2 0 0 0 4 18 0 0 0 5 30Light Truck/Trailer 0 3 1 0 1 0 2 20 0 0 0 1 28Heavy Truck/Trailer 0 0 2 0 0 0 0 21 0 0 0 3 26Tow Truck 0 0 0 0 0 0 2 11 0 0 1 3 17School Bus 0 1 3 0 1 0 6 3 0 0 0 0 14Intercity Bus 8 0 1 0 0 0 0 0 0 0 0 0 94 Wheel Drive Vehicle 4 1 1 0 0 0 0 0 0 0 0 3 9Road Construction 1 0 0 0 0 0 0 3 0 0 0 1 5Farm Vehicle 1 1 1 0 0 0 0 1 0 0 0 0 4General Construction 0 1 1 0 0 0 0 2 0 0 0 0 4Motor Home/Trailer 0 0 0 0 0 0 0 1 0 0 0 0 1Mobile Crane 0 0 0 0 0 0 0 1 0 0 0 0 1Other 2 0 1 0 0 0 2 10 0 0 0 3 18UK 0 0 0 0 0 0 1 9 0 0 0 6 16Total 115 1,083 939 224 169 34 4,311 13,994 17 5 32 1,401 22,324Note: Excludes occupants of motorcycles, snowmobiles and bicycles.
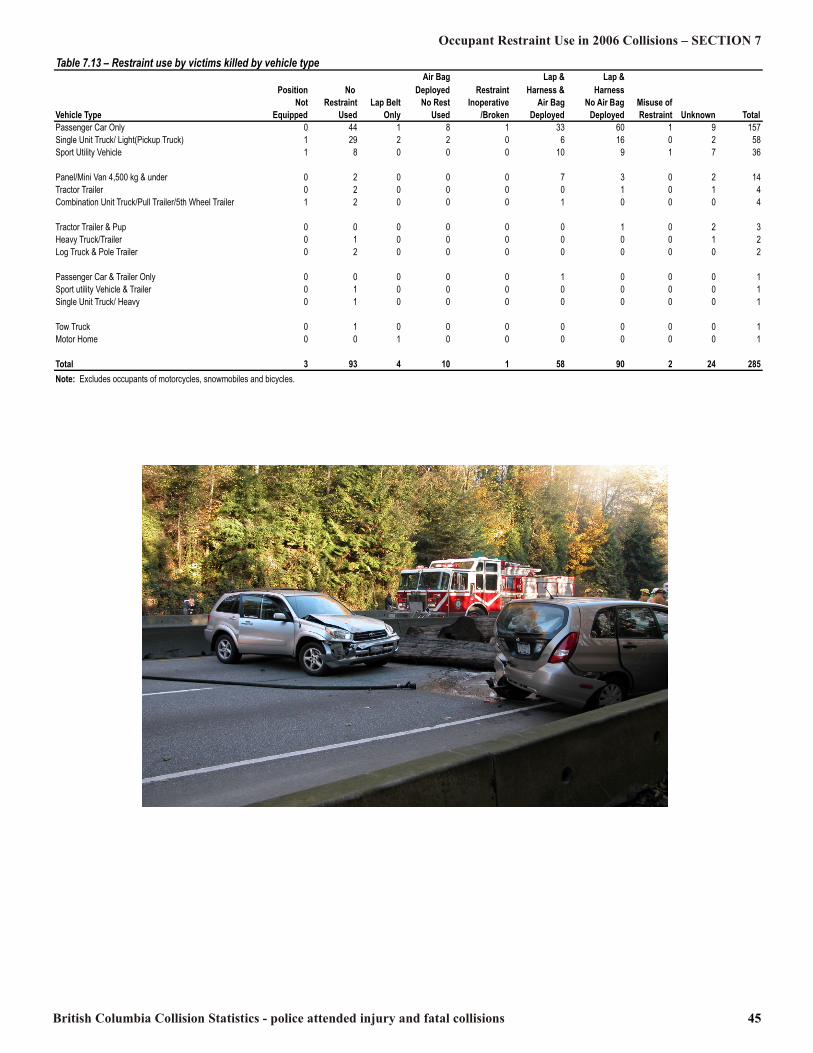
British Columbia Collision Statistics - police attended injury and fatal collisions 45
Occupant Restraint Use in 2006 Collisions – SECTION 7Table 7.13 – Restraint use by victims killed by vehicle type Air Bag Lap & Lap &Position No Deployed Restraint Harness & HarnessNot Restraint Lap Belt No Rest Inoperative Air Bag No Air Bag Misuse ofVehicle Type Equipped Used Only Used /Broken Deployed Deployed Restraint Unknown TotalPassenger Car Only 0 44 1 8 1 33 60 1 9 157Single Unit Truck/ Light(Pickup Truck) 1 29 2 2 0 6 16 0 2 58Sport Utility Vehicle 1 8 0 0 0 10 9 1 7 36Panel/Mini Van 4,500 kg & under 0 2 0 0 0 7 3 0 2 14Tractor Trailer 0 2 0 0 0 0 1 0 1 4Combination Unit Truck/Pull Trailer/5th Wheel Trailer 1 2 0 0 0 1 0 0 0 4Tractor Trailer & Pup 0 0 0 0 0 0 1 0 2 3Heavy Truck/Trailer 0 1 0 0 0 0 0 0 1 2Log Truck & Pole Trailer 0 2 0 0 0 0 0 0 0 2Passenger Car & Trailer Only 0 0 0 0 0 1 0 0 0 1Sport utility Vehicle & Trailer 0 1 0 0 0 0 0 0 0 1Single Unit Truck/ Heavy 0 1 0 0 0 0 0 0 0 1Tow Truck 0 1 0 0 0 0 0 0 0 1Motor Home 0 0 1 0 0 0 0 0 0 1Total 3 93 4 10 1 58 90 2 24 285Note: Excludes occupants of motorcycles, snowmobiles and bicycles.
46 British Columbia Collision Statistics - police attended injury and fatal collisions
SECTION 7 – Occupant Restraint Use in 2006 Collisions

British Columbia Collision Statistics - police attended injury and fatal collisions 47
Environmental Conditions and Collision Context SECTION 8The environmental conditions that are reported in policeattended casualty collisions do not vary greatly from year toyear. Environmental factors were reported to contribute to16.9% of the collisions in which factors were reported in 2006. This figure was 16.1% in 2005.In general, the degree to which certain environmental conditions are represented in collisions reflects the degree to which theseconditions are found in the overall environment. For example,the majority of collisions occur on asphalt roads because asphalt is the predominant road surface in the province.In 2006, of the 19,285 casualty collisions, 96.0% occurred onasphalt roads; 63.4% happened in daylight; 62.3% took place on dry road surfaces and 51.8% occurred under clear weatherconditions. More than half of the injury collisions in 2006 took place inurban residential areas or business or shopping districts. Thesetwo areas accounted for 56.7% of all 2006 injury collisions. In
fatal collisions, about 31.6% occurred in agricultural orundeveloped areas while urban residential and business orshopping districts together accounted for 30.0% of the fatalcollisions. A little more than one half of all casualty collisions (56.8%)took place on roads where the speed limit is 50 km/h. This islikely because a 50 km/h speed limit applies to the largestdistance of roads in the province. Speed limits of 80 km/h andgreater accounted for 23.2% of all injury collisions and 50.3%of all fatal collisions.In 2006, 56.8% of all casualty collisions occurred in locationswithout traffic control devices and 15.8% of these collisionstook place at intersections. Locations with illuminated trafficsignals accounted for 19.0% of all 2006 casualty collisions andlocations with stops signs accounted for 11.7%. Overall, 41.8% of casualty collisions occurred at intersections.
Table 8.01 – Collisions by road surface type % ofRoad Surface Type Injury Fatal Total TotalAsphalt 18,153 351 18,504 95.95Gravel 436 15 451 2.34Concrete 175 1 176 0.91Earth 64 3 67 0.35Oiled Gravel 15 0 15 0.08Wood 11 0 11 0.06Brick/Stone 9 0 9 0.05Other 3 0 3 0.02Unknown 49 0 49 0.25Total 18,915 370 19,285 100%
Table 8.02 – Collisions by roadway surface condition Road % ofSurface Injury Fatal Total TotalDry 11,767 250 12,017 62.31Wet 5,196 79 5,275 27.35Ice 833 18 851 4.41Snow 648 11 659 3.42Slush 349 3 352 1.83Muddy 35 2 37 0.19Other 7 1 8 0.04Unknown 80 6 86 0.45Total 18,915 370 19,285 100%
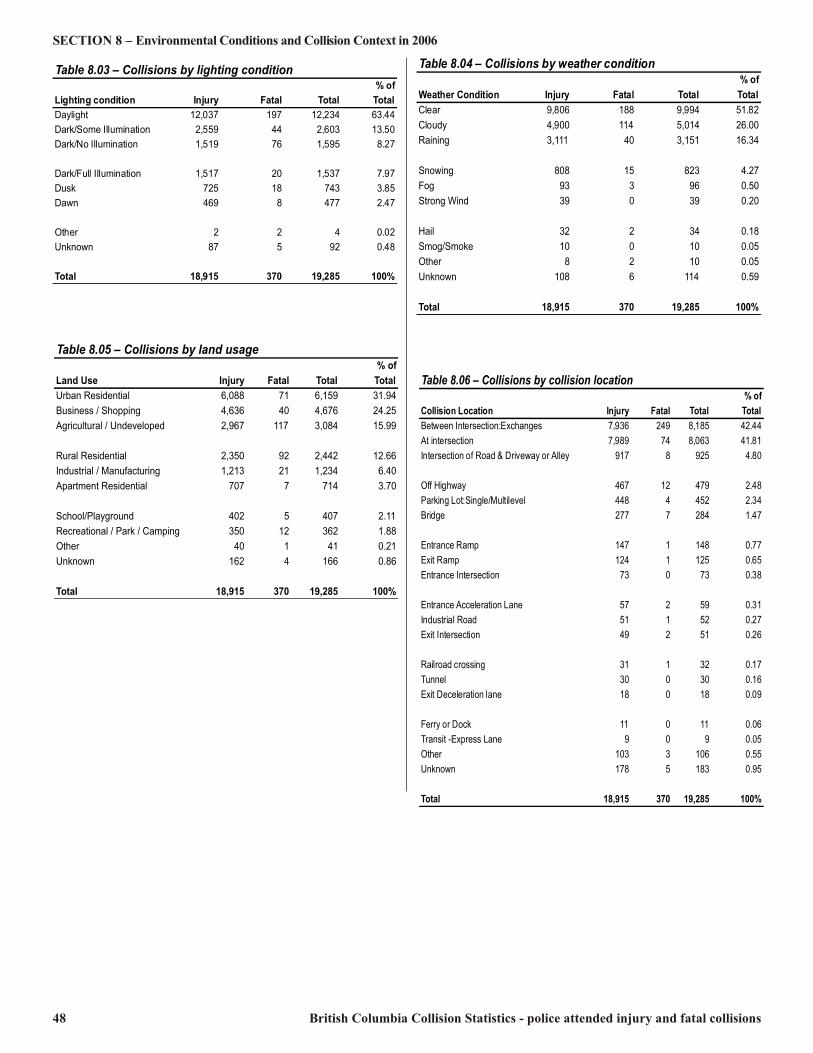
48 British Columbia Collision Statistics - police attended injury and fatal collisions
SECTION 8 – Environmental Conditions and Collision Context in 2006
Table 8.05 – Collisions by land usage % ofLand Use Injury Fatal Total TotalUrban Residential 6,088 71 6,159 31.94Business / Shopping 4,636 40 4,676 24.25Agricultural / Undeveloped 2,967 117 3,084 15.99Rural Residential 2,350 92 2,442 12.66Industrial / Manufacturing 1,213 21 1,234 6.40Apartment Residential 707 7 714 3.70School/Playground 402 5 407 2.11Recreational / Park / Camping 350 12 362 1.88Other 40 1 41 0.21Unknown 162 4 166 0.86Total 18,915 370 19,285 100%
Table 8.04 – Collisions by weather condition % ofWeather Condition Injury Fatal Total TotalClear 9,806 188 9,994 51.82Cloudy 4,900 114 5,014 26.00Raining 3,111 40 3,151 16.34Snowing 808 15 823 4.27Fog 93 3 96 0.50Strong Wind 39 0 39 0.20Hail 32 2 34 0.18Smog/Smoke 10 0 10 0.05Other 8 2 10 0.05Unknown 108 6 114 0.59Total 18,915 370 19,285 100%
Table 8.03 – Collisions by lighting condition % ofLighting condition Injury Fatal Total TotalDaylight 12,037 197 12,234 63.44Dark/Some Illumination 2,559 44 2,603 13.50Dark/No Illumination 1,519 76 1,595 8.27Dark/Full Illumination 1,517 20 1,537 7.97Dusk 725 18 743 3.85Dawn 469 8 477 2.47Other 2 2 4 0.02Unknown 87 5 92 0.48Total 18,915 370 19,285 100%
Table 8.06 – Collisions by collision location % ofCollision Location Injury Fatal Total TotalBetween Intersection:Exchanges 7,936 249 8,185 42.44At intersection 7,989 74 8,063 41.81Intersection of Road & Driveway or Alley 917 8 925 4.80Off Highway 467 12 479 2.48Parking Lot:Single/Multilevel 448 4 452 2.34Bridge 277 7 284 1.47Entrance Ramp 147 1 148 0.77Exit Ramp 124 1 125 0.65Entrance Intersection 73 0 73 0.38Entrance Acceleration Lane 57 2 59 0.31Industrial Road 51 1 52 0.27Exit Intersection 49 2 51 0.26Railroad crossing 31 1 32 0.17Tunnel 30 0 30 0.16Exit Deceleration lane 18 0 18 0.09Ferry or Dock 11 0 11 0.06Transit -Express Lane 9 0 9 0.05Other 103 3 106 0.55Unknown 178 5 183 0.95Total 18,915 370 19,285 100%
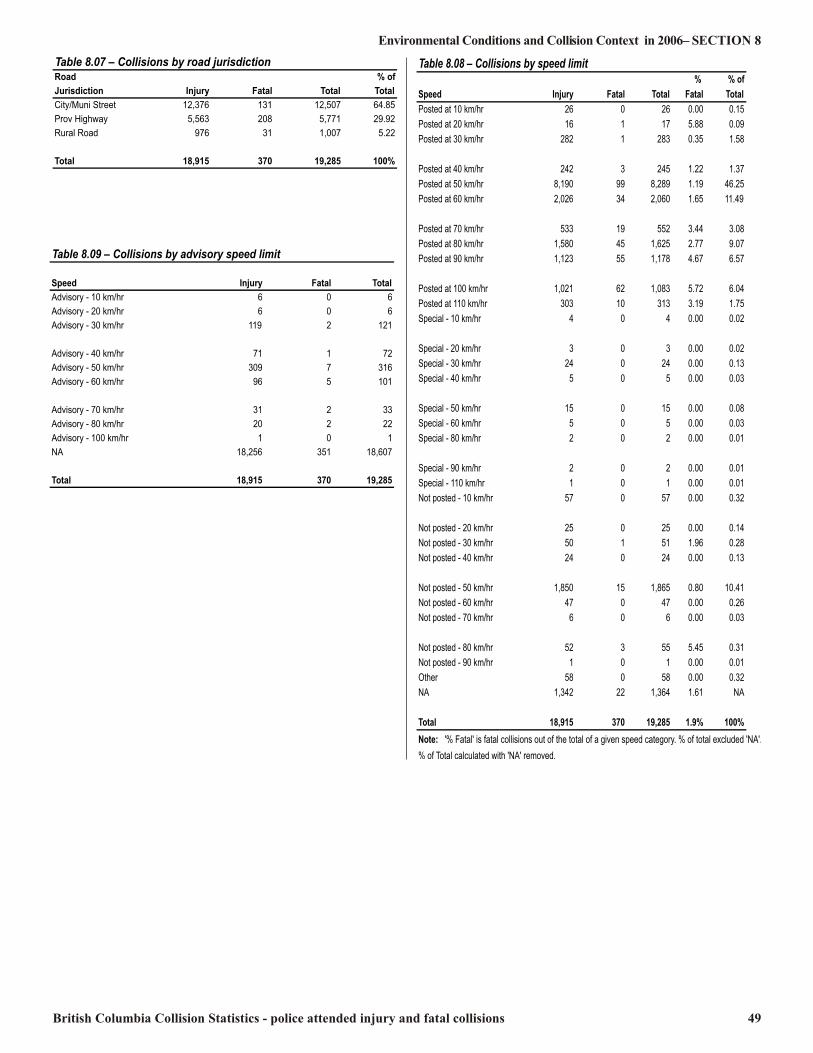
British Columbia Collision Statistics - police attended injury and fatal collisions 49
Environmental Conditions and Collision Context in 2006– SECTION 8
Table 8.09 – Collisions by advisory speed limit Speed Injury Fatal TotalAdvisory - 10 km/hr 6 0 6Advisory - 20 km/hr 6 0 6Advisory - 30 km/hr 119 2 121Advisory - 40 km/hr 71 1 72Advisory - 50 km/hr 309 7 316Advisory - 60 km/hr 96 5 101Advisory - 70 km/hr 31 2 33Advisory - 80 km/hr 20 2 22Advisory - 100 km/hr 1 0 1NA 18,256 351 18,607Total 18,915 370 19,285
Table 8.08 – Collisions by speed limit % % ofSpeed Injury Fatal Total Fatal TotalPosted at 10 km/hr 26 0 26 0.00 0.15Posted at 20 km/hr 16 1 17 5.88 0.09Posted at 30 km/hr 282 1 283 0.35 1.58Posted at 40 km/hr 242 3 245 1.22 1.37Posted at 50 km/hr 8,190 99 8,289 1.19 46.25Posted at 60 km/hr 2,026 34 2,060 1.65 11.49Posted at 70 km/hr 533 19 552 3.44 3.08Posted at 80 km/hr 1,580 45 1,625 2.77 9.07Posted at 90 km/hr 1,123 55 1,178 4.67 6.57Posted at 100 km/hr 1,021 62 1,083 5.72 6.04Posted at 110 km/hr 303 10 313 3.19 1.75Special - 10 km/hr 4 0 4 0.00 0.02Special - 20 km/hr 3 0 3 0.00 0.02Special - 30 km/hr 24 0 24 0.00 0.13Special - 40 km/hr 5 0 5 0.00 0.03Special - 50 km/hr 15 0 15 0.00 0.08Special - 60 km/hr 5 0 5 0.00 0.03Special - 80 km/hr 2 0 2 0.00 0.01Special - 90 km/hr 2 0 2 0.00 0.01Special - 110 km/hr 1 0 1 0.00 0.01Not posted - 10 km/hr 57 0 57 0.00 0.32Not posted - 20 km/hr 25 0 25 0.00 0.14Not posted - 30 km/hr 50 1 51 1.96 0.28Not posted - 40 km/hr 24 0 24 0.00 0.13Not posted - 50 km/hr 1,850 15 1,865 0.80 10.41Not posted - 60 km/hr 47 0 47 0.00 0.26Not posted - 70 km/hr 6 0 6 0.00 0.03Not posted - 80 km/hr 52 3 55 5.45 0.31Not posted - 90 km/hr 1 0 1 0.00 0.01Other 58 0 58 0.00 0.32NA 1,342 22 1,364 1.61 NATotal 18,915 370 19,285 1.9% 100%Note: '% Fatal' is fatal collisions out of the total of a given speed category. % of total excluded 'NA'.% of Total calculated with 'NA' removed.
Table 8.07 – Collisions by road jurisdictionRoad % ofJurisdiction Injury Fatal Total TotalCity/Muni Street 12,376 131 12,507 64.85Prov Highway 5,563 208 5,771 29.92Rural Road 976 31 1,007 5.22Total 18,915 370 19,285 100%

50 British Columbia Collision Statistics - police attended injury and fatal collisions
SECTION 8 – Environmental Conditions and Collision Context in 2006
Table 8.10 – Collisions by traffic control device Control Device Injury Fatal Total % of TotalNone 10,660 287 10,947 56.76Stop Sign 2,233 20 2,253 11.68Yield Sign 292 2 294 1.52Officer/Flagman/School Guard 84 1 85 0.44Railroad Crossing Sign 34 0 34 0.18Lane Use Turn Control Sign 131 1 132 0.68Traffic Signal 3,642 19 3,661 18.98Traffic Signal with Advance Flashers 281 0 281 1.46Flashing Signal 173 5 178 0.92Lane Use Signal 21 0 21 0.11Not Applicable 915 16 931 4.83Other 80 3 83 0.43Unknown 369 16 385 2.00Total 18,915 370 19,285 100%
Figure 8.01 - Proportion of fatal to total casualty collisions by speed limit
1.12% 1.61%
3.41% 2.85%
5.15%4.66%
0.79%0.00%1.00%2.00%3.00%4.00%5.00%6.00%
Less Than 50 km/hr 50 km/hr 60 km/hr 70 km/hr 80 km/hr 90 km/hr Greater Than 90km/hr
Table 8.11 – Collisions at intersection by traffic control deviceControl Device Injury Fatal Total % of TotalTraffic Signal 3,329 17 3,346 41.50Stop Sign 2,025 19 2,044 25.35None 1,708 22 1,730 21.46Traffic Signal with Advance Flashers 256 0 256 3.17Yield Sign 177 1 178 2.21Flashing Signal 153 4 157 1.95Lane Use Turn Control Sign 58 1 59 0.73Officer/Flagman/School Guard 25 1 26 0.32Lane Use Signal 10 0 10 0.12Railroad Crossing Sign 4 0 4 0.05Other 56 3 59 0.73Unknown 188 6 194 2.41Total 7,989 74 8,063 100
Table 8.10 – Collisions by traffic control device Control Device Injury Fatal Total % of TotalNone 10,660 287 10,947 56.76Stop Sign 2,233 20 2,253 11.68Yield Sign 292 2 294 1.52Officer/Flagman/School Guard 84 1 85 0.44Railroad Crossing Sign 34 0 34 0.18Lane Use Turn Control Sign 131 1 132 0.68Traffic Signal 3,642 19 3,661 18.98Traffic Signal with Advance Flashers 281 0 281 1.46Flashing Signal 173 5 178 0.92Lane Use Signal 21 0 21 0.11Not Applicable 915 16 931 4.83Other 80 3 83 0.43Unknown 369 16 385 2.00Total 18,915 370 19,285 100%
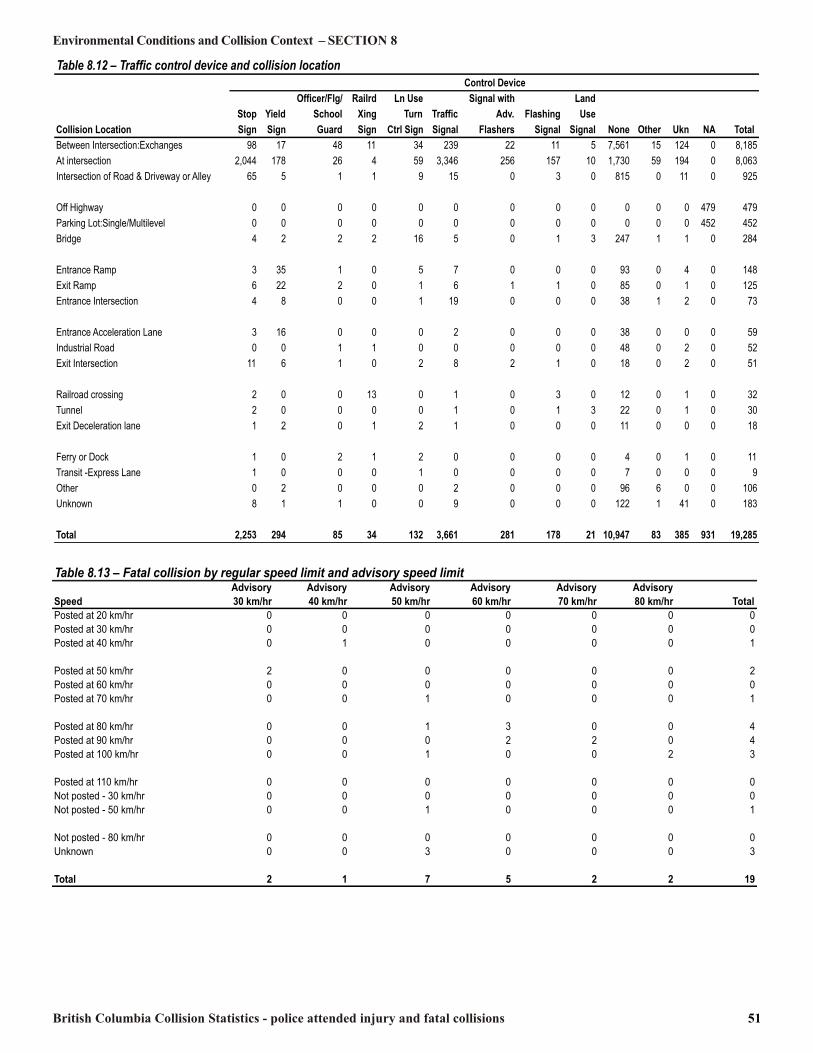
British Columbia Collision Statistics - police attended injury and fatal collisions 51
Environmental Conditions and Collision Context – SECTION 8Table 8.12 – Traffic control device and collision location Control Device Officer/Flg/ Railrd Ln Use Signal with LandStop Yield School Xing Turn Traffic Adv. Flashing UseCollision Location Sign Sign Guard Sign Ctrl Sign Signal Flashers Signal Signal None Other Ukn NA Total Between Intersection:Exchanges 98 17 48 11 34 239 22 11 5 7,561 15 124 0 8,185At intersection 2,044 178 26 4 59 3,346 256 157 10 1,730 59 194 0 8,063Intersection of Road & Driveway or Alley 65 5 1 1 9 15 0 3 0 815 0 11 0 925Off Highway 0 0 0 0 0 0 0 0 0 0 0 0 479 479Parking Lot:Single/Multilevel 0 0 0 0 0 0 0 0 0 0 0 0 452 452Bridge 4 2 2 2 16 5 0 1 3 247 1 1 0 284Entrance Ramp 3 35 1 0 5 7 0 0 0 93 0 4 0 148Exit Ramp 6 22 2 0 1 6 1 1 0 85 0 1 0 125Entrance Intersection 4 8 0 0 1 19 0 0 0 38 1 2 0 73Entrance Acceleration Lane 3 16 0 0 0 2 0 0 0 38 0 0 0 59Industrial Road 0 0 1 1 0 0 0 0 0 48 0 2 0 52Exit Intersection 11 6 1 0 2 8 2 1 0 18 0 2 0 51Railroad crossing 2 0 0 13 0 1 0 3 0 12 0 1 0 32Tunnel 2 0 0 0 0 1 0 1 3 22 0 1 0 30Exit Deceleration lane 1 2 0 1 2 1 0 0 0 11 0 0 0 18Ferry or Dock 1 0 2 1 2 0 0 0 0 4 0 1 0 11Transit -Express Lane 1 0 0 0 1 0 0 0 0 7 0 0 0 9Other 0 2 0 0 0 2 0 0 0 96 6 0 0 106Unknown 8 1 1 0 0 9 0 0 0 122 1 41 0 183Total 2,253 294 85 34 132 3,661 281 178 21 10,947 83 385 931 19,285Table 8.13 – Fatal collision by regular speed limit and advisory speed limit Advisory Advisory Advisory Advisory Advisory AdvisorySpeed 30 km/hr 40 km/hr 50 km/hr 60 km/hr 70 km/hr 80 km/hr TotalPosted at 20 km/hr 0 0 0 0 0 0 0Posted at 30 km/hr 0 0 0 0 0 0 0Posted at 40 km/hr 0 1 0 0 0 0 1Posted at 50 km/hr 2 0 0 0 0 0 2Posted at 60 km/hr 0 0 0 0 0 0 0Posted at 70 km/hr 0 0 1 0 0 0 1Posted at 80 km/hr 0 0 1 3 0 0 4Posted at 90 km/hr 0 0 0 2 2 0 4Posted at 100 km/hr 0 0 1 0 0 2 3Posted at 110 km/hr 0 0 0 0 0 0 0Not posted - 30 km/hr 0 0 0 0 0 0 0Not posted - 50 km/hr 0 0 1 0 0 0 1Not posted - 80 km/hr 0 0 0 0 0 0 0Unknown 0 0 3 0 0 0 3Total 2 1 7 5 2 2 19

52 British Columbia Collision Statistics - police attended injury and fatal collisions
SECTION 8 – Environmental Conditions and Collision Context Table 8.14 – Injury collision by regular speed limit and advisory speed limit Advisory Advisory Advisory Advisory Advisory Advisory Advisory Advisory AdvisorySpeed 10 km/hr 20 km/hr 30 km/hr 40 km/hr 50 km/hr 60 km/hr 70 km/hr 80 km/hr 100 km/hr TotalPosted at 10 km/hr 0 0 0 0 1 0 0 1 0 2Posted at 20 km/hr 0 0 0 0 0 0 0 0 0 0Posted at 30 km/hr 0 0 4 0 0 0 0 0 0 4Posted at 40 km/hr 0 0 0 0 11 0 0 1 0 12Posted at 50 km/hr 0 3 53 12 70 1 1 0 0 140Posted at 60 km/hr 0 0 11 13 7 12 0 0 0 43Posted at 70 km/hr 0 0 1 5 9 2 2 0 0 19Posted at 80 km/hr 0 0 13 27 23 51 5 5 0 124Posted at 90 km/hr 0 0 1 2 11 13 17 0 0 44Posted at 100 km/hr 2 0 1 1 4 6 4 10 0 28Posted at 110 km/hr 0 0 0 0 1 0 0 0 0 1Special - 10 km/hr 1 0 0 0 0 0 0 0 0 1Special - 20 km/hr 0 0 0 0 0 0 0 0 0 0Special - 30 km/hr 0 0 1 0 0 0 0 0 0 1Special - 40 km/hr 0 0 0 0 0 0 0 0 0 0Special - 50 km/hr 0 0 0 0 2 0 0 0 0 2Special - 60 km/hr 0 0 0 0 1 0 0 0 0 1Special - 80 km/hr 0 0 0 0 0 0 0 0 0 0Special - 90 km/hr 0 0 0 0 0 0 0 0 0 0Special - 110 km/hr 0 0 0 0 0 0 0 0 0 0Not posted - 10 km/hr 1 0 0 0 5 0 0 0 0 6Not posted - 20 km/hr 0 0 0 0 0 0 0 0 0 0Not posted - 30 km/hr 0 0 3 0 0 0 0 0 0 3Not posted - 40 km/hr 0 0 0 0 0 0 0 0 0 0Not posted - 50 km/hr 0 1 9 1 33 0 0 0 0 44Not posted - 60 km/hr 0 0 0 0 1 0 0 0 0 1Not posted - 70 km/hr 0 0 0 0 0 0 0 0 0 0Not posted - 80 km/hr 0 0 0 1 0 1 0 0 0 2Not posted - 90 km/hr 0 0 0 0 0 0 0 0 0 0Other 0 0 2 0 4 0 0 0 0 6Unknown 2 2 20 9 126 10 2 3 1 175Total 6 6 119 71 309 96 31 20 1 659
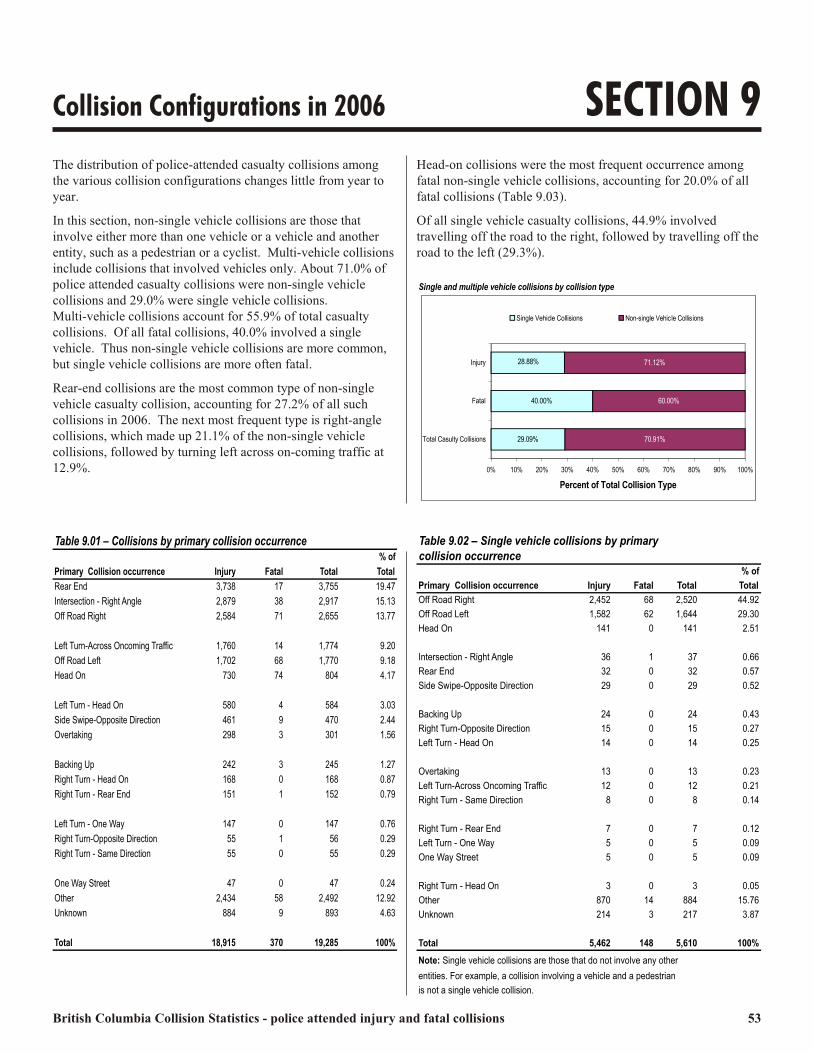
British Columbia Collision Statistics - police attended injury and fatal collisions 53
Collision Configurations in 2006 SECTION 9The distribution of police-attended casualty collisions amongthe various collision configurations changes little from year toyear.In this section, non-single vehicle collisions are those thatinvolve either more than one vehicle or a vehicle and anotherentity, such as a pedestrian or a cyclist. Multi-vehicle collisionsinclude collisions that involved vehicles only. About 71.0% ofpolice attended casualty collisions were non-single vehiclecollisions and 29.0% were single vehicle collisions. Multi-vehicle collisions account for 55.9% of total casualtycollisions. Of all fatal collisions, 40.0% involved a singlevehicle. Thus non-single vehicle collisions are more common,but single vehicle collisions are more often fatal.Rear-end collisions are the most common type of non-singlevehicle casualty collision, accounting for 27.2% of all suchcollisions in 2006. The next most frequent type is right-anglecollisions, which made up 21.1% of the non-single vehiclecollisions, followed by turning left across on-coming traffic at12.9%.
Head-on collisions were the most frequent occurrence amongfatal non-single vehicle collisions, accounting for 20.0% of allfatal collisions (Table 9.03). Of all single vehicle casualty collisions, 44.9% involvedtravelling off the road to the right, followed by travelling off the road to the left (29.3%).
Table 9.01 – Collisions by primary collision occurrence % ofPrimary Collision occurrence Injury Fatal Total TotalRear End 3,738 17 3,755 19.47Intersection - Right Angle 2,879 38 2,917 15.13Off Road Right 2,584 71 2,655 13.77Left Turn-Across Oncoming Traffic 1,760 14 1,774 9.20Off Road Left 1,702 68 1,770 9.18Head On 730 74 804 4.17Left Turn - Head On 580 4 584 3.03Side Swipe-Opposite Direction 461 9 470 2.44Overtaking 298 3 301 1.56Backing Up 242 3 245 1.27Right Turn - Head On 168 0 168 0.87Right Turn - Rear End 151 1 152 0.79Left Turn - One Way 147 0 147 0.76Right Turn-Opposite Direction 55 1 56 0.29Right Turn - Same Direction 55 0 55 0.29One Way Street 47 0 47 0.24Other 2,434 58 2,492 12.92Unknown 884 9 893 4.63Total 18,915 370 19,285 100%
Table 9.02 – Single vehicle collisions by primarycollision occurrence % ofPrimary Collision occurrence Injury Fatal Total TotalOff Road Right 2,452 68 2,520 44.92Off Road Left 1,582 62 1,644 29.30Head On 141 0 141 2.51Intersection - Right Angle 36 1 37 0.66Rear End 32 0 32 0.57Side Swipe-Opposite Direction 29 0 29 0.52Backing Up 24 0 24 0.43Right Turn-Opposite Direction 15 0 15 0.27Left Turn - Head On 14 0 14 0.25Overtaking 13 0 13 0.23Left Turn-Across Oncoming Traffic 12 0 12 0.21Right Turn - Same Direction 8 0 8 0.14Right Turn - Rear End 7 0 7 0.12Left Turn - One Way 5 0 5 0.09One Way Street 5 0 5 0.09Right Turn - Head On 3 0 3 0.05Other 870 14 884 15.76Unknown 214 3 217 3.87Total 5,462 148 5,610 100%Note: Single vehicle collisions are those that do not involve any other entities. For example, a collision involving a vehicle and a pedestrian is not a single vehicle collision.
Single and multiple vehicle collisions by collision type
29.09% 70.91%60.00%40.00%
28.88% 71.12%
0% 10% 20% 30% 40% 50% 60% 70% 80% 90% 100%Total Casulty Collisions
FatalInjury
Percent of Total Collision Type
Single Vehicle Collisions Non-single Vehicle Collisions

54 British Columbia Collision Statistics - police attended injury and fatal collisions
SECTION 9 – Collision Configurations in 2006Table 9.03 – Non-single vehicle collisions by primary collision occurrence % ofPrimary Collision Occurrence Injury Fatal Total TotalRear End 3,706 17 3,723 27.22Intersection - Right Angle 2,843 37 2,880 21.06Left Turn-Across Oncoming Traffic 1,748 14 1,762 12.88Head On 589 74 663 4.85Left Turn - Head On 566 4 570 4.17Side Swipe-Opposite Direction 432 9 441 3.22Overtaking 285 3 288 2.11Backing Up 218 3 221 1.62Right Turn - Head On 165 0 165 1.21Right Turn - Rear End 144 1 145 1.06Left Turn - One Way 142 0 142 1.04Off Road Right 132 3 135 0.99Off Road Left 120 6 126 0.92Right Turn - Same Direction 47 0 47 0.34One Way Street 42 0 42 0.31Right Turn-Opposite Direction 40 1 41 0.30Other 1,564 44 1,608 11.76Unknown 670 6 676 4.94Total 13,453 222 13,675 100%Note: Non-single vehicle collisions are those that involve either more than onevehicle or a vehicle and another entity, such as a pedestrian or a cyclist.
Table 9.04 – Multi-vehicle collisions by primary collision occurrence % ofPrimary Collision Occurrence Injury Fatal Total TotalRear End 3,618 12 3,630 33.68Intersection - Right Angle 2,273 22 2,295 21.29Left Turn-Across Oncoming Traffic 1,490 11 1,501 13.93Head On 497 62 559 5.19Left Turn - Head On 476 3 479 4.44Side Swipe-Opposite Direction 369 6 375 3.48Overtaking 229 3 232 2.15Left Turn - One Way 116 0 116 1.08Off Road Right 114 2 116 1.08Off Road Left 108 6 114 1.06Right Turn - Rear End 94 0 94 0.87Backing Up 92 0 92 0.85One Way Street 36 0 36 0.33Right Turn - Head On 32 0 32 0.30Right Turn-Opposite Direction 23 0 23 0.21Right Turn - Same Direction 18 0 18 0.17Other 652 12 664 6.16Unknown 401 1 402 3.73Total 10,638 140 10,778 100%Note: Unlike Table 9.03, this table does not include collisions that involveda vehicle and another entity such as a pedestrian or a cyclist.
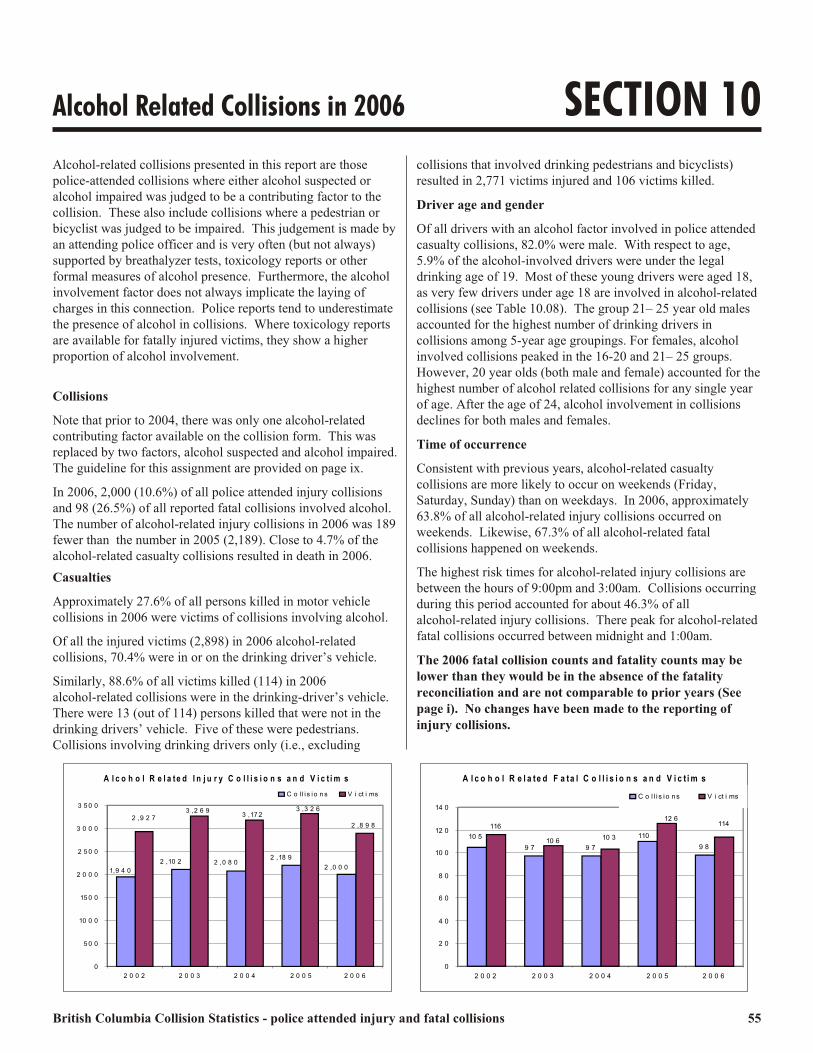
British Columbia Collision Statistics - police attended injury and fatal collisions 55
Alcohol Related Collisions in 2006 SECTION 10Alcohol-related collisions presented in this report are thosepolice-attended collisions where either alcohol suspected oralcohol impaired was judged to be a contributing factor to thecollision. These also include collisions where a pedestrian orbicyclist was judged to be impaired. This judgement is made by an attending police officer and is very often (but not always)supported by breathalyzer tests, toxicology reports or otherformal measures of alcohol presence. Furthermore, the alcoholinvolvement factor does not always implicate the laying ofcharges in this connection. Police reports tend to underestimatethe presence of alcohol in collisions. Where toxicology reportsare available for fatally injured victims, they show a higherproportion of alcohol involvement.CollisionsNote that prior to 2004, there was only one alcohol-relatedcontributing factor available on the collision form. This wasreplaced by two factors, alcohol suspected and alcohol impaired. The guideline for this assignment are provided on page ix.In 2006, 2,000 (10.6%) of all police attended injury collisionsand 98 (26.5%) of all reported fatal collisions involved alcohol. The number of alcohol-related injury collisions in 2006 was 189 fewer than the number in 2005 (2,189). Close to 4.7% of thealcohol-related casualty collisions resulted in death in 2006. Casualties Approximately 27.6% of all persons killed in motor vehiclecollisions in 2006 were victims of collisions involving alcohol. Of all the injured victims (2,898) in 2006 alcohol-relatedcollisions, 70.4% were in or on the drinking driver’s vehicle. Similarly, 88.6% of all victims killed (114) in 2006alcohol-related collisions were in the drinking-driver’s vehicle.There were 13 (out of 114) persons killed that were not in thedrinking drivers’ vehicle. Five of these were pedestrians.Collisions involving drinking drivers only (i.e., excluding
collisions that involved drinking pedestrians and bicyclists)resulted in 2,771 victims injured and 106 victims killed.Driver age and gender Of all drivers with an alcohol factor involved in police attendedcasualty collisions, 82.0% were male. With respect to age,5.9% of the alcohol-involved drivers were under the legaldrinking age of 19. Most of these young drivers were aged 18,as very few drivers under age 18 are involved in alcohol-relatedcollisions (see Table 10.08). The group 21– 25 year old malesaccounted for the highest number of drinking drivers incollisions among 5-year age groupings. For females, alcoholinvolved collisions peaked in the 16-20 and 21– 25 groups.However, 20 year olds (both male and female) accounted for the highest number of alcohol related collisions for any single yearof age. After the age of 24, alcohol involvement in collisionsdeclines for both males and females. Time of occurrence Consistent with previous years, alcohol-related casualtycollisions are more likely to occur on weekends (Friday,Saturday, Sunday) than on weekdays. In 2006, approximately63.8% of all alcohol-related injury collisions occurred onweekends. Likewise, 67.3% of all alcohol-related fatalcollisions happened on weekends. The highest risk times for alcohol-related injury collisions arebetween the hours of 9:00pm and 3:00am. Collisions occurringduring this period accounted for about 46.3% of allalcohol-related injury collisions. There peak for alcohol-relatedfatal collisions occurred between midnight and 1:00am. The 2006 fatal collision counts and fatality counts may belower than they would be in the absence of the fatalityreconciliation and are not comparable to prior years (Seepage i). No changes have been made to the reporting ofinjury collisions. A l c o h o l R e l a t e d I n j u r y C o l l i s i o n s a n d V i c t i m s
1,9 4 0 2 ,10 2 2 ,0 8 0 2 ,18 9 2 ,0 0 0
3 ,17 22 ,9 2 7 3 ,3 2 6 2 ,8 9 83 ,2 6 9
05 0 0
10 0 015 0 0
2 0 0 02 5 0 03 0 0 03 5 0 0
2 0 0 2 2 0 0 3 2 0 0 4 2 0 0 5 2 0 0 6
C o l l i s i o n s V i ct i ms A l c o h o l R e l a te d F a ta l C o l l i s i o n s a n d V i c t i m s
9 8116 11010 5 9 79 7
11410 310 612 6
02 04 06 08 0
10 012 014 0
2 0 0 2 2 0 0 3 2 0 0 4 2 0 0 5 2 0 0 6
C o l l i s io ns V i ct i ms

56 British Columbia Collision Statistics - police attended injury and fatal collisions
SECTION 10 – Alcohol Related Collisions in 2006
Figure 10.01 – Alcohol related collisions: Collisions and victims by monthNumber of Collisions/Victims
050
100150200250300350
Jan Feb Mar Apr May Jun Jul Aug Sep Oct Nov DecCollisions Victims
Table 10.01 – Alcohol related collisions and victims by monthCollisions VictimsMonth Injury Fatal Total Injured Killed TotalJanuary 136 11 147 195 14 209February 129 8 137 186 9 195March 148 8 156 211 10 221April 187 6 193 257 9 266May 162 10 172 222 10 232June 186 13 199 283 14 297July 205 6 211 318 6 324August 179 7 186 273 9 282September 161 4 165 219 4 223October 196 10 206 283 12 295November 154 8 162 222 10 232December 157 7 164 229 7 236Total 2,000 98 2,098 2,898 114 3,012Note: 1) Includes pedestrians with the alcohol factor who were responsible for the collision.2) Alcohol factors include Ability Impaired by Alcohol, and Alcohol Suspected.
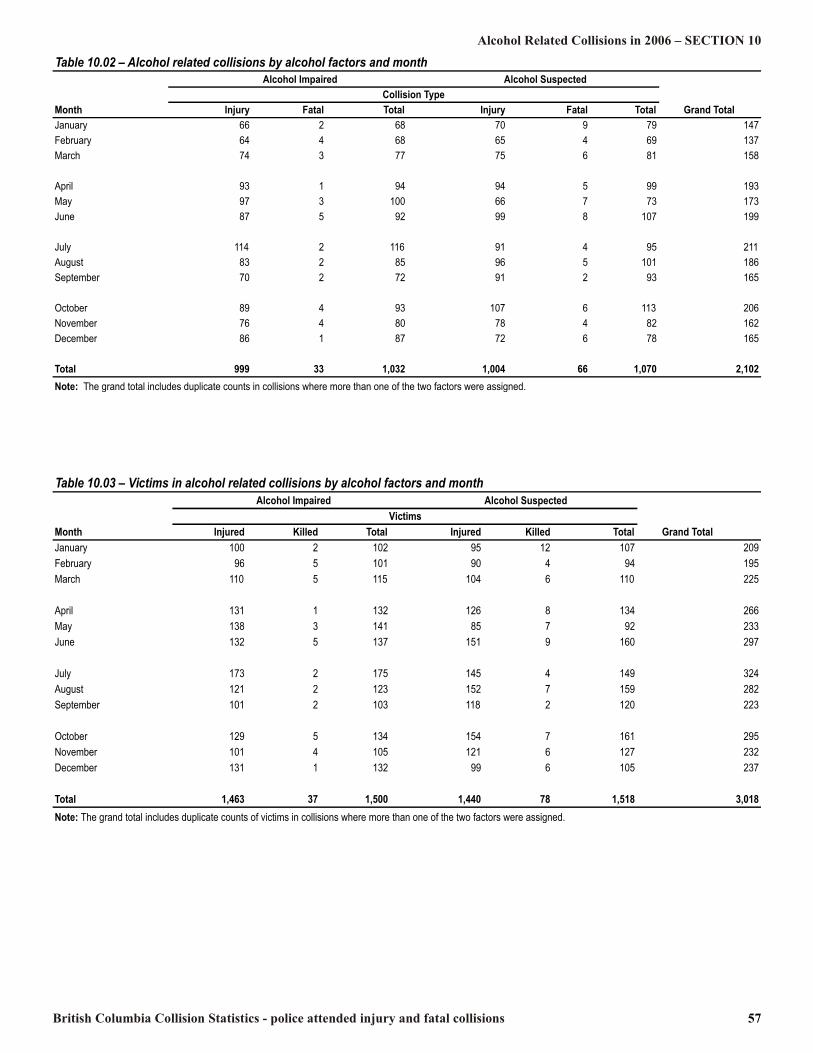
British Columbia Collision Statistics - police attended injury and fatal collisions 57
Alcohol Related Collisions in 2006 – SECTION 10Table 10.02 – Alcohol related collisions by alcohol factors and monthAlcohol Impaired Alcohol SuspectedCollision TypeMonth Injury Fatal Total Injury Fatal Total Grand TotalJanuary 66 2 68 70 9 79 147February 64 4 68 65 4 69 137March 74 3 77 75 6 81 158April 93 1 94 94 5 99 193May 97 3 100 66 7 73 173June 87 5 92 99 8 107 199July 114 2 116 91 4 95 211August 83 2 85 96 5 101 186September 70 2 72 91 2 93 165October 89 4 93 107 6 113 206November 76 4 80 78 4 82 162December 86 1 87 72 6 78 165Total 999 33 1,032 1,004 66 1,070 2,102Note: The grand total includes duplicate counts in collisions where more than one of the two factors were assigned.
Table 10.03 – Victims in alcohol related collisions by alcohol factors and monthAlcohol Impaired Alcohol SuspectedVictimsMonth Injured Killed Total Injured Killed Total Grand TotalJanuary 100 2 102 95 12 107 209February 96 5 101 90 4 94 195March 110 5 115 104 6 110 225April 131 1 132 126 8 134 266May 138 3 141 85 7 92 233June 132 5 137 151 9 160 297July 173 2 175 145 4 149 324August 121 2 123 152 7 159 282September 101 2 103 118 2 120 223October 129 5 134 154 7 161 295November 101 4 105 121 6 127 232December 131 1 132 99 6 105 237Total 1,463 37 1,500 1,440 78 1,518 3,018Note: The grand total includes duplicate counts of victims in collisions where more than one of the two factors were assigned.

58 British Columbia Collision Statistics - police attended injury and fatal collisions
SECTION 10 – Alcohol Related Collisions in 2006Table 10.04 – Alcohol related injury collisions by day of week and hour of collision % ofTime Sunday Monday Tuesday Wednesday Thursday Friday Saturday Total Total0000-0059 27 14 5 12 12 23 47 140 7.000100-0159 32 13 4 4 20 26 56 155 7.750200-0259 47 10 6 13 16 20 53 165 8.250300-0359 41 4 11 10 10 11 31 118 5.900400-0459 31 1 2 4 5 9 23 75 3.750500-0559 21 3 3 3 6 3 16 55 2.750600-0659 10 3 3 4 3 5 6 34 1.700700-0759 9 2 4 3 1 6 9 34 1.700800-0859 9 3 2 3 2 3 8 30 1.500900-0959 9 1 0 2 1 3 4 20 1.001000-1059 3 3 1 1 3 2 5 18 0.901100-1159 2 3 3 1 1 5 2 17 0.851200-1259 5 2 2 3 2 6 5 25 1.251300-1359 5 2 6 0 2 1 5 21 1.051400-1459 11 1 3 4 2 3 6 30 1.501500-1559 11 1 2 11 11 9 17 62 3.101600-1659 11 10 2 9 8 14 17 71 3.551700-1759 13 8 7 9 13 13 11 74 3.701800-1859 15 17 7 10 13 27 21 110 5.501900-1959 19 10 7 12 13 23 17 101 5.052000-2059 20 9 12 20 13 25 25 124 6.202100-2159 22 11 16 21 17 39 28 154 7.702200-2259 18 13 16 25 17 32 33 154 7.702300-2359 16 12 10 18 24 42 36 158 7.90Unknown 12 2 10 2 3 11 15 55 2.75Total 419 158 144 204 218 361 496 2,000 100%

British Columbia Collision Statistics - police attended injury and fatal collisions 59
Alcohol Related Collisions in 2006 – SECTION 10Figure 10.02 – Distribution of alcohol related collisions and victims by collision hour
Note: Includes both injury and fatal collisions and both injured and killed victims.
Number of Total Collisions/Total Victims
050
100150200250300
12am 1am 2am 3am 4am 5am 6am 7am 8am 9am 10am 11am 12pm 1pm 2pm 3pm 4pm 5pm 6pm 7pm 8pm 9pm 10pm 11pm
Total Collisions Total Victims
Figure 10.03 – Distribution of alcohol related collisions and victims by day of week
Note: Includes both injury and fatal collisions and both injured and killed victims.
Number of Total Collisions/Total Victims
0100200300400500600700800
Sun Mon Tue Wed Thu Fri Sat
Total Collisions Total Victims

60 British Columbia Collision Statistics - police attended injury and fatal collisions
SECTION 10 – Alcohol Related Collisions in 2006Table 10.05 – Alcohol related fatal collisions by day of week and hour of collision Total % ofTime Sunday Monday Tuesday Wednesday Thursday Friday Saturday Collisions Total0000-0059 2 2 1 1 2 1 3 12 12.240100-0159 1 1 0 0 1 3 1 7 7.140200-0259 1 0 0 0 0 2 5 8 8.160300-0359 1 0 2 0 0 0 0 3 3.060400-0459 5 0 0 1 0 0 1 7 7.140500-0559 2 0 0 0 0 0 0 2 2.040700-0759 0 0 0 1 0 0 1 2 2.040800-0859 3 0 0 0 0 0 2 5 5.100900-0959 0 0 0 0 0 1 1 2 2.041000-1059 0 0 0 0 1 0 0 1 1.021200-1259 1 0 0 0 1 1 0 3 3.061400-1459 2 0 0 1 0 0 0 3 3.061500-1559 1 0 0 1 0 0 0 2 2.041600-1659 0 0 1 0 0 1 1 3 3.061700-1759 1 0 0 0 0 2 1 4 4.081800-1859 1 2 0 1 0 1 1 6 6.121900-1959 1 0 1 0 2 1 0 5 5.102000-2059 1 1 0 0 2 1 1 6 6.122100-2159 1 1 0 1 0 1 1 5 5.102200-2259 0 2 0 1 0 1 1 5 5.102300-2359 3 0 0 0 1 1 2 7 7.14Total 27 9 5 8 10 17 22 98 100
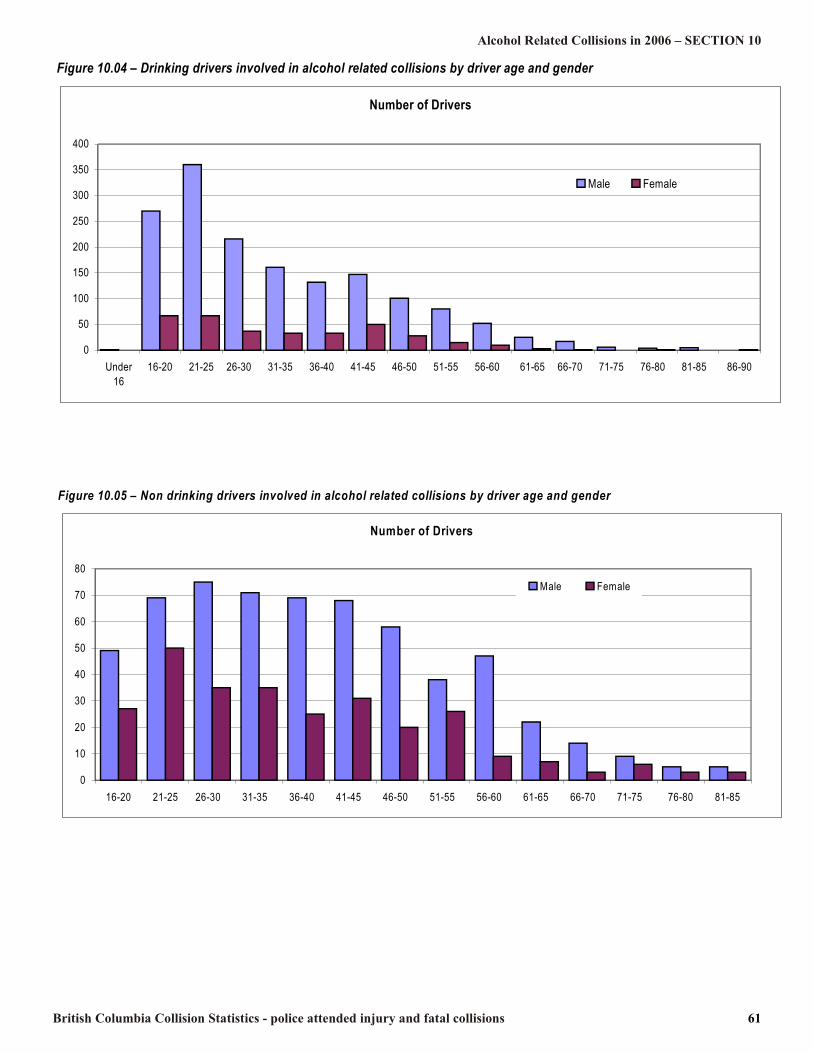
British Columbia Collision Statistics - police attended injury and fatal collisions 61
Alcohol Related Collisions in 2006 – SECTION 10Figure 10.04 – Drinking drivers involved in alcohol related collisions by driver age and genderNumber of Drivers
050100150200250300350400
Under16 16-20 21-25 26-30 31-35 36-40 41-45 46-50 51-55 56-60 61-65 66-70 71-75 76-80 81-85 86-90
Male Female
Figure 10.05 – Non drinking drivers involved in alcohol related collisions by driver age and gender Number of Drivers
01020304050607080
16-20 21-25 26-30 31-35 36-40 41-45 46-50 51-55 56-60 61-65 66-70 71-75 76-80 81-85
Male Female
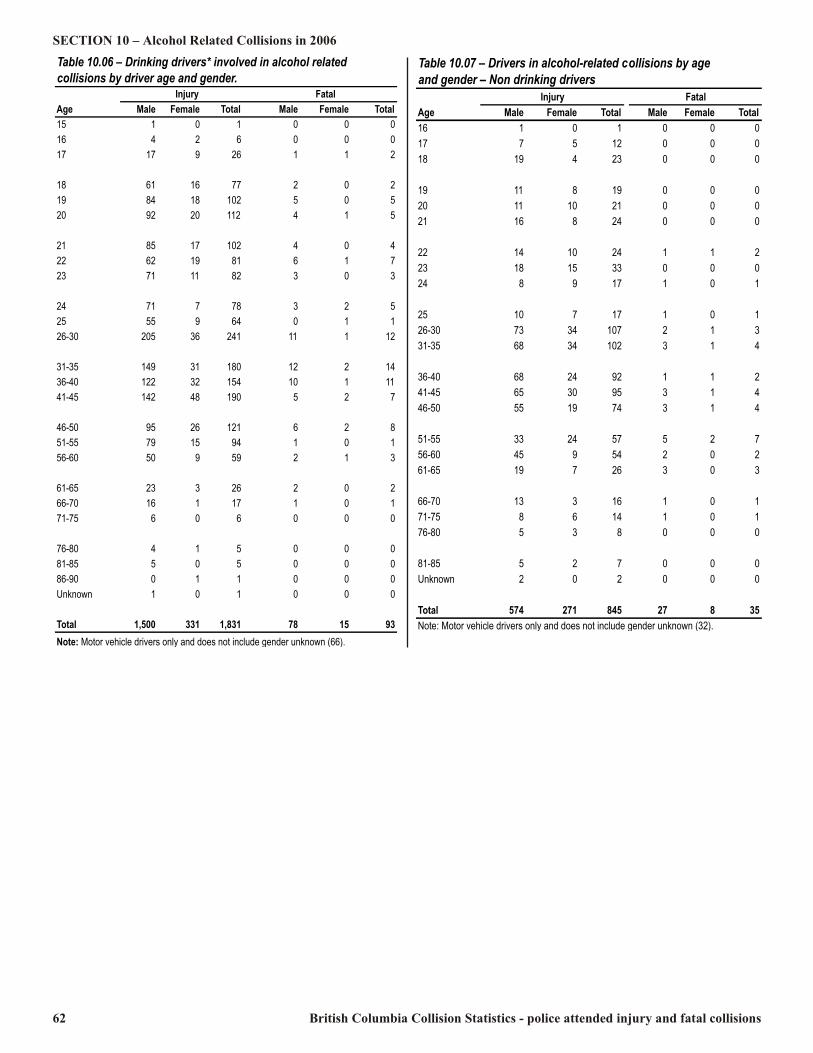
62 British Columbia Collision Statistics - police attended injury and fatal collisions
SECTION 10 – Alcohol Related Collisions in 2006Table 10.06 – Drinking drivers* involved in alcohol related collisions by driver age and gender.InjuryAge Male Female Total Male Female Total15 1 0 1 0 0 016 4 2 6 0 0 017 17 9 26 1 1 218 61 16 77 2 0 219 84 18 102 5 0 520 92 20 112 4 1 521 85 17 102 4 0 422 62 19 81 6 1 723 71 11 82 3 0 324 71 7 78 3 2 525 55 9 64 0 1 126-30 205 36 241 11 1 1231-35 149 31 180 12 2 1436-40 122 32 154 10 1 1141-45 142 48 190 5 2 746-50 95 26 121 6 2 851-55 79 15 94 1 0 156-60 50 9 59 2 1 361-65 23 3 26 2 0 266-70 16 1 17 1 0 171-75 6 0 6 0 0 076-80 4 1 5 0 0 081-85 5 0 5 0 0 086-90 0 1 1 0 0 0Unknown 1 0 1 0 0 0Total 1,500 331 1,831 78 15 93Note: Motor vehicle drivers only and does not include gender unknown (66).
FatalTable 10.07 – Drivers in alcohol-related collisions by age and gender – Non drinking driversInjury FatalAge Male Female Total Male Female Total16 1 0 1 0 0 017 7 5 12 0 0 018 19 4 23 0 0 019 11 8 19 0 0 020 11 10 21 0 0 021 16 8 24 0 0 022 14 10 24 1 1 223 18 15 33 0 0 024 8 9 17 1 0 125 10 7 17 1 0 126-30 73 34 107 2 1 331-35 68 34 102 3 1 436-40 68 24 92 1 1 241-45 65 30 95 3 1 446-50 55 19 74 3 1 451-55 33 24 57 5 2 756-60 45 9 54 2 0 261-65 19 7 26 3 0 366-70 13 3 16 1 0 171-75 8 6 14 1 0 176-80 5 3 8 0 0 081-85 5 2 7 0 0 0Unknown 2 0 2 0 0 0Total 574 271 845 27 8 35Note: Motor vehicle drivers only and does not include gender unknown (32).

British Columbia Collision Statistics - police attended injury and fatal collisions 63
Alcohol Related Collisions in 2006 – SECTION 10Table 10.08 – Drinking drivers involved in alcohol related collisions compared to all licensed drivers by age# of Drivers % of TotalActive % of Total Involved in Drivers InvolvedLicensed Driver Alcohol-related in Alcohol-relatedDriver Age Drivers Population Collisions Collisions2Under 16 0 0 1 0.0516 26,240 0.90 6 0.3017 36,332 1.28 28 1.4118 38,823 1.34 79 3.9719 40,512 1.44 107 5.3820 42,672 1.51 117 5.8821 44,456 1.56 106 5.3322 45,409 1.53 88 4.4223 46,200 1.59 85 4.2724 48,064 1.60 83 4.1725 48,697 1.61 65 3.2726-30 238,943 8.05 253 12.7131-35 252,785 8.85 194 9.7536-40 283,110 9.67 165 8.2941-45 321,673 11.20 197 9.9046-50 323,548 10.94 129 6.4851-55 293,277 9.78 95 4.7756-60 259,157 8.39 62 3.1261-65 183,796 6.06 28 1.4166-70 136,906 4.51 18 0.9071-75 108,084 3.66 6 0.3076-80 78,873 2.62 5 0.2581+ 58,257 1.91 6 0.30Unknown 65 0.00 67 3.37Total 2,955,879 100% 1,990 100%Note:1) Data source for active licensed drivers in 2006 was Business Information Warehouse. 2) Total number of collision involved drivers in the age group as a percentage of the total number of drivers involved in alcohol related collisions.

64 British Columbia Collision Statistics - police attended injury and fatal collisions
SECTION 10 – Alcohol Related Collisions in 2006Table 10.09 – Victims injured in alcohol related collisions by victim age and road user class Victim Hanging Bicycle Motorcycle MotorcycleAge Driver Passenger on Pedestrian Driver Driver Passenger Other Unknown Total1 0 1 0 0 0 0 0 0 0 12 0 4 0 0 0 0 0 0 0 43 0 2 0 0 0 0 0 0 0 24 0 3 0 0 0 0 0 0 0 35 0 1 0 0 0 0 0 0 0 16 0 2 0 0 0 0 0 0 0 27 0 3 0 0 0 0 0 0 0 38 0 7 0 0 1 0 0 0 0 89 0 5 0 0 0 0 0 0 0 510 0 3 0 1 0 0 0 0 0 411 0 6 0 1 1 0 0 0 0 812 0 5 0 0 0 0 0 0 0 513 0 3 0 0 0 0 0 0 0 314 0 10 0 4 0 0 0 0 0 1415 0 18 0 3 1 0 0 0 0 2216 4 33 0 7 0 0 0 0 0 4417 27 44 0 3 1 1 1 0 0 7718 62 54 1 4 0 0 1 0 0 12219 80 75 1 6 2 0 1 0 0 16520 96 56 1 6 2 3 0 0 0 16421 80 50 0 7 0 2 1 2 3 14522 65 45 0 3 1 2 0 0 0 11623 79 33 0 2 5 2 0 0 0 12124 63 31 0 7 4 2 0 0 0 10725 51 40 0 2 4 1 1 0 0 9926-30 228 88 0 11 2 9 1 0 1 34031-35 181 56 0 11 4 3 0 0 0 25536-40 147 48 0 9 10 4 0 0 1 21941-45 179 42 2 8 10 13 0 1 1 25646-50 102 19 0 18 9 10 0 0 0 15851-55 93 23 0 11 1 3 0 0 0 13156-60 56 16 0 2 0 3 1 0 0 7861-65 27 7 0 3 2 1 0 0 0 4066-70 19 7 0 3 1 0 0 0 0 3071-75 11 7 0 1 0 0 0 1 0 2076-80 5 3 0 0 0 0 0 0 0 881-85 7 1 0 0 0 0 0 0 0 886-90 1 2 0 0 0 0 0 0 0 395+ 0 0 0 1 0 0 0 0 0 1Unknown 23 73 0 5 0 0 2 0 3 106Total 1,686 926 5 139 61 59 9 4 9 2,898
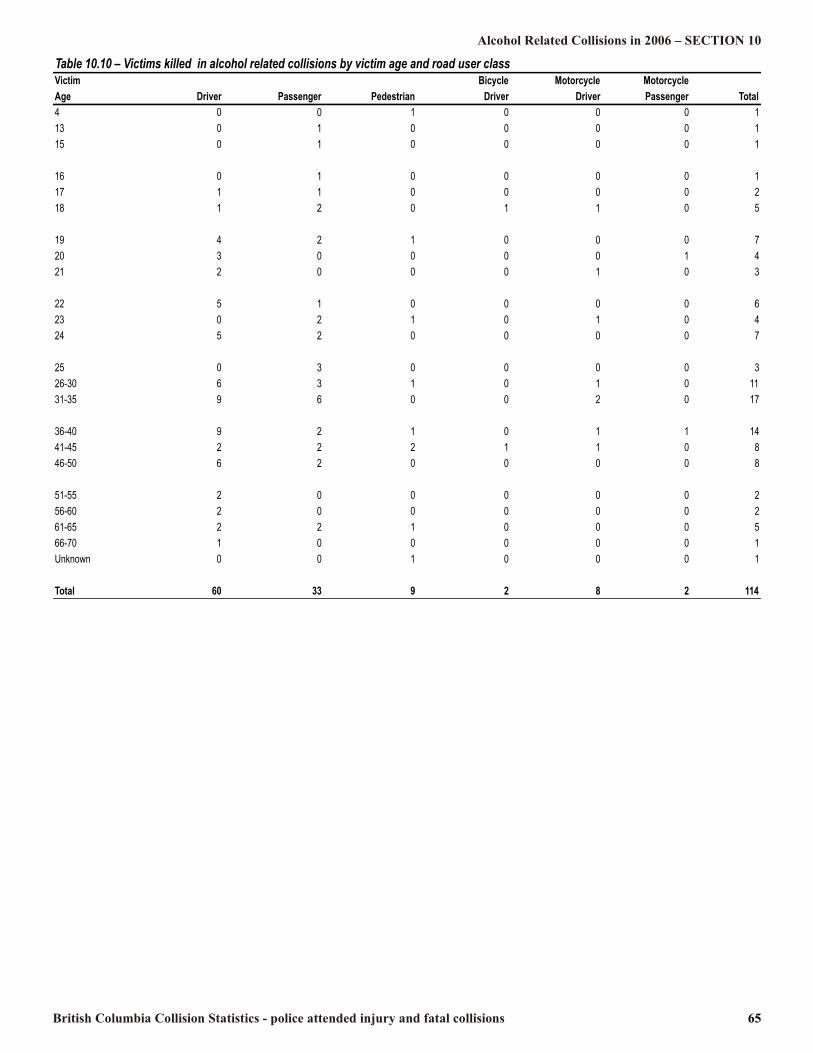
British Columbia Collision Statistics - police attended injury and fatal collisions 65
Alcohol Related Collisions in 2006 – SECTION 10Table 10.10 – Victims killed in alcohol related collisions by victim age and road user classVictim Bicycle Motorcycle MotorcycleAge Driver Passenger Pedestrian Driver Driver Passenger Total4 0 0 1 0 0 0 113 0 1 0 0 0 0 115 0 1 0 0 0 0 116 0 1 0 0 0 0 117 1 1 0 0 0 0 218 1 2 0 1 1 0 519 4 2 1 0 0 0 720 3 0 0 0 0 1 421 2 0 0 0 1 0 322 5 1 0 0 0 0 623 0 2 1 0 1 0 424 5 2 0 0 0 0 725 0 3 0 0 0 0 326-30 6 3 1 0 1 0 1131-35 9 6 0 0 2 0 1736-40 9 2 1 0 1 1 1441-45 2 2 2 1 1 0 846-50 6 2 0 0 0 0 851-55 2 0 0 0 0 0 256-60 2 0 0 0 0 0 261-65 2 2 1 0 0 0 566-70 1 0 0 0 0 0 1Unknown 0 0 1 0 0 0 1Total 60 33 9 2 8 2 114
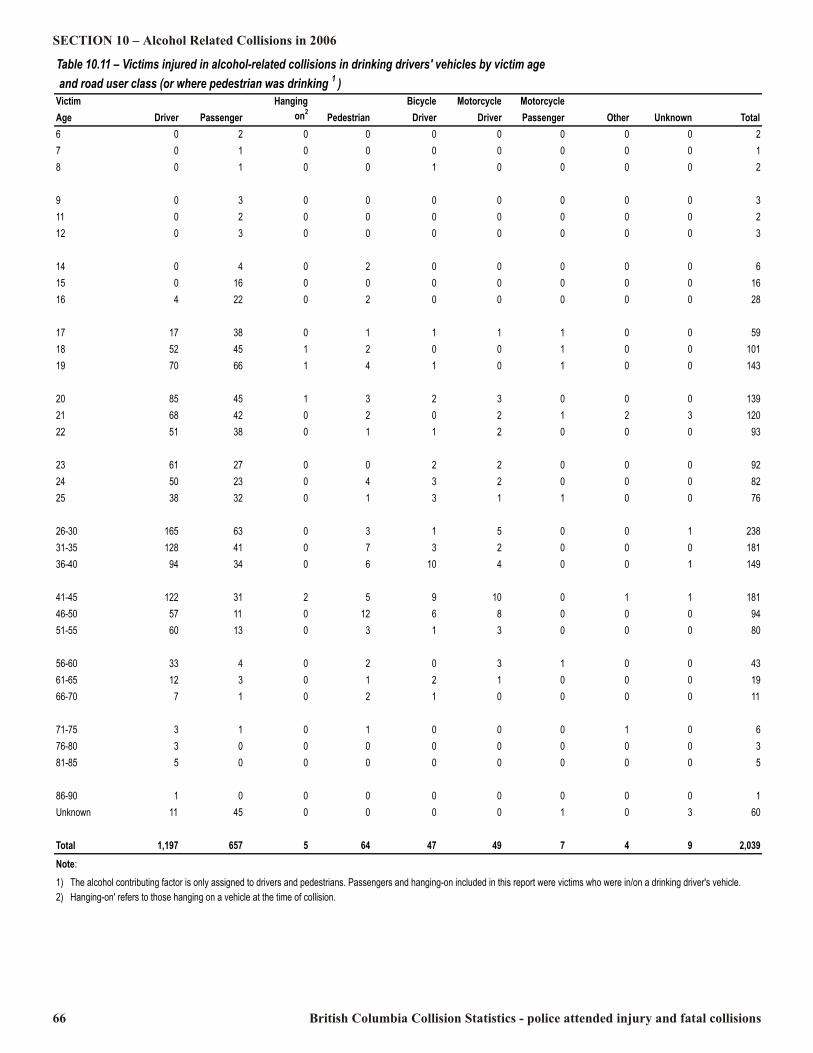
66 British Columbia Collision Statistics - police attended injury and fatal collisions
SECTION 10 – Alcohol Related Collisions in 2006Table 10.11 – Victims injured in alcohol-related collisions in drinking drivers' vehicles by victim age and road user class (or where pedestrian was drinking 1 )Victim Hanging Bicycle Motorcycle MotorcycleAge Driver Passenger on2 Pedestrian Driver Driver Passenger Other Unknown Total6 0 2 0 0 0 0 0 0 0 27 0 1 0 0 0 0 0 0 0 18 0 1 0 0 1 0 0 0 0 29 0 3 0 0 0 0 0 0 0 311 0 2 0 0 0 0 0 0 0 212 0 3 0 0 0 0 0 0 0 314 0 4 0 2 0 0 0 0 0 615 0 16 0 0 0 0 0 0 0 1616 4 22 0 2 0 0 0 0 0 2817 17 38 0 1 1 1 1 0 0 5918 52 45 1 2 0 0 1 0 0 10119 70 66 1 4 1 0 1 0 0 14320 85 45 1 3 2 3 0 0 0 13921 68 42 0 2 0 2 1 2 3 12022 51 38 0 1 1 2 0 0 0 9323 61 27 0 0 2 2 0 0 0 9224 50 23 0 4 3 2 0 0 0 8225 38 32 0 1 3 1 1 0 0 7626-30 165 63 0 3 1 5 0 0 1 23831-35 128 41 0 7 3 2 0 0 0 18136-40 94 34 0 6 10 4 0 0 1 14941-45 122 31 2 5 9 10 0 1 1 18146-50 57 11 0 12 6 8 0 0 0 9451-55 60 13 0 3 1 3 0 0 0 8056-60 33 4 0 2 0 3 1 0 0 4361-65 12 3 0 1 2 1 0 0 0 1966-70 7 1 0 2 1 0 0 0 0 1171-75 3 1 0 1 0 0 0 1 0 676-80 3 0 0 0 0 0 0 0 0 381-85 5 0 0 0 0 0 0 0 0 586-90 1 0 0 0 0 0 0 0 0 1Unknown 11 45 0 0 0 0 1 0 3 60Total 1,197 657 5 64 47 49 7 4 9 2,039Note: 1) The alcohol contributing factor is only assigned to drivers and pedestrians. Passengers and hanging-on included in this report were victims who were in/on a drinking driver's vehicle.2) Hanging-on' refers to those hanging on a vehicle at the time of collision.
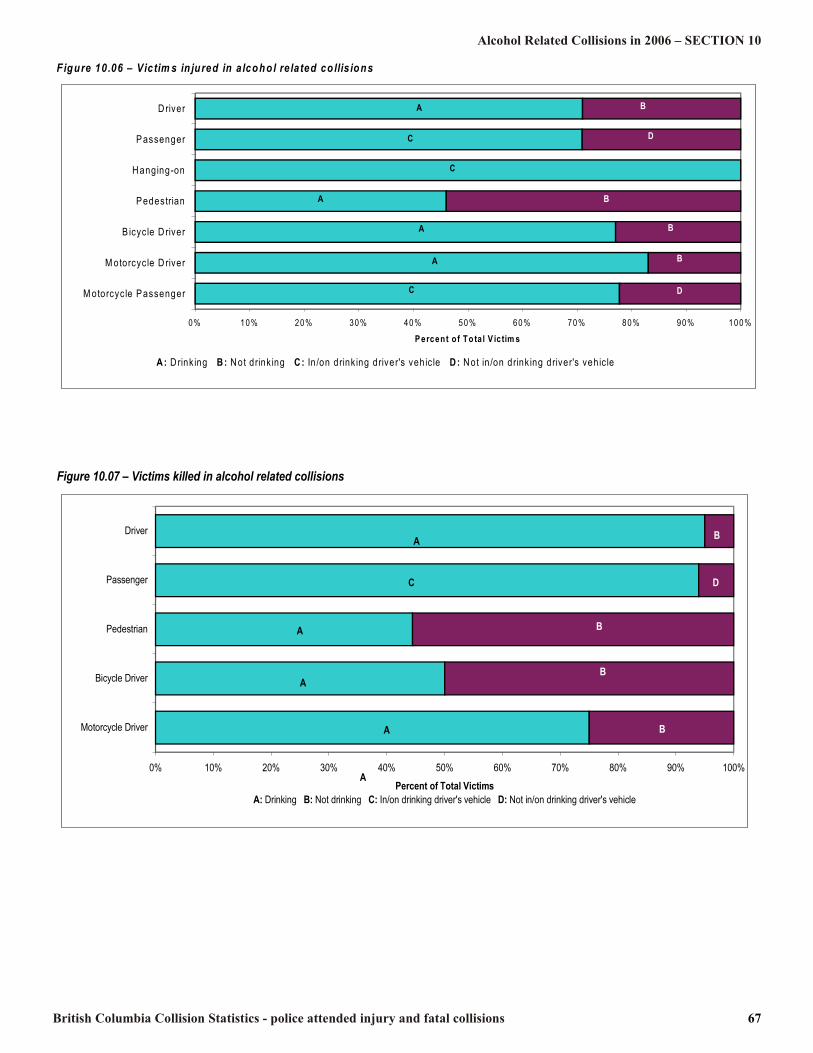
British Columbia Collision Statistics - police attended injury and fatal collisions 67
Alcohol Related Collisions in 2006 – SECTION 10Figure 10.06 – Victim s in jured in a lcohol re lated co llis ions
BC D
0% 10% 20% 30% 40% 50% 60% 70% 80% 90% 100%M otorcyc le Passenger
M otorcycle D riverB icycle D river
PedestrianHanging-onPassenger
Driver
P ercent of To ta l V ictim sA: D rink ing B : Not drink ing C : In /on drink ing driver's vehic le D : Not in /on drink ing driver's vehic le
AC
C
ADCB
B
BD
BA
A
Figure 10.07 – Victims killed in alcohol related collisions
D
0% 10% 20% 30% 40% 50% 60% 70% 80% 90% 100%Motorcycle Driver
Bicycle DriverPedestrianPassenger
Driver
Percent of Total VictimsA: Drinking B: Not drinking C: In/on drinking driver's vehicle D: Not in/on drinking driver's vehicle
BA
A
A B
AC
B
BD
AB
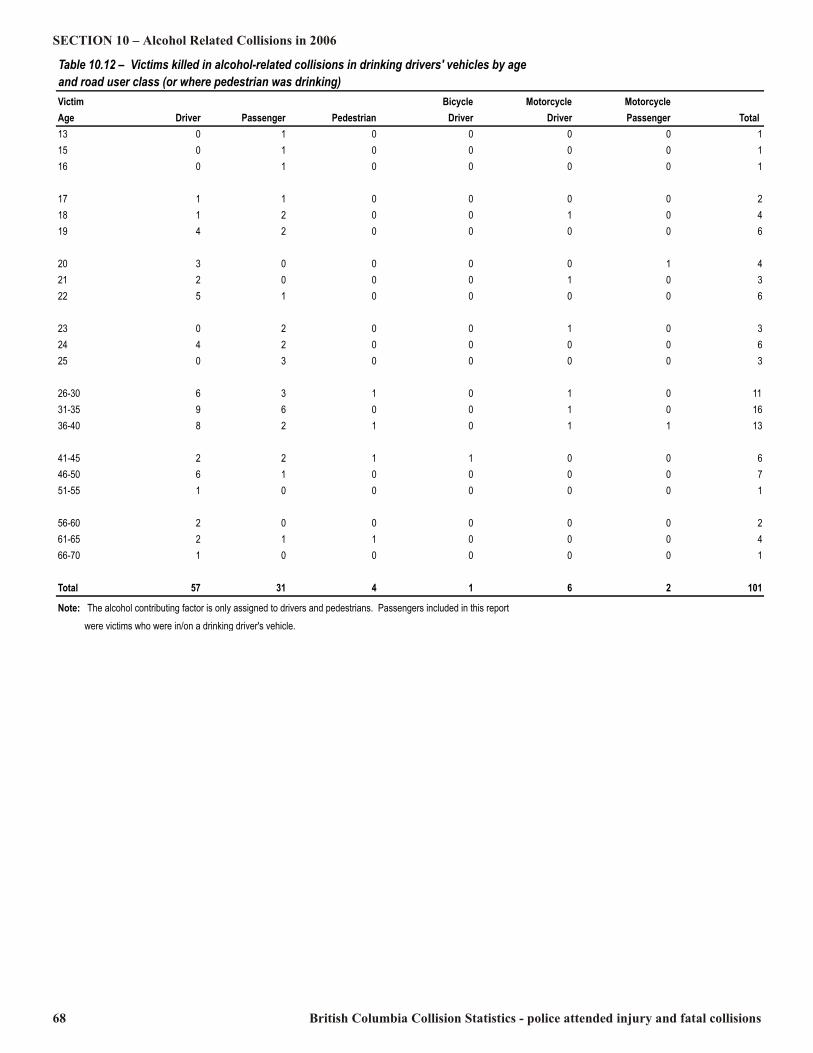
68 British Columbia Collision Statistics - police attended injury and fatal collisions
SECTION 10 – Alcohol Related Collisions in 2006Table 10.12 – Victims killed in alcohol-related collisions in drinking drivers' vehicles by age and road user class (or where pedestrian was drinking)Victim Bicycle Motorcycle MotorcycleAge Driver Passenger Pedestrian Driver Driver Passenger Total 13 0 1 0 0 0 0 115 0 1 0 0 0 0 116 0 1 0 0 0 0 117 1 1 0 0 0 0 218 1 2 0 0 1 0 419 4 2 0 0 0 0 620 3 0 0 0 0 1 421 2 0 0 0 1 0 322 5 1 0 0 0 0 623 0 2 0 0 1 0 324 4 2 0 0 0 0 625 0 3 0 0 0 0 326-30 6 3 1 0 1 0 1131-35 9 6 0 0 1 0 1636-40 8 2 1 0 1 1 1341-45 2 2 1 1 0 0 646-50 6 1 0 0 0 0 751-55 1 0 0 0 0 0 156-60 2 0 0 0 0 0 261-65 2 1 1 0 0 0 466-70 1 0 0 0 0 0 1Total 57 31 4 1 6 2 101Note: The alcohol contributing factor is only assigned to drivers and pedestrians. Passengers included in this report were victims who were in/on a drinking driver's vehicle.
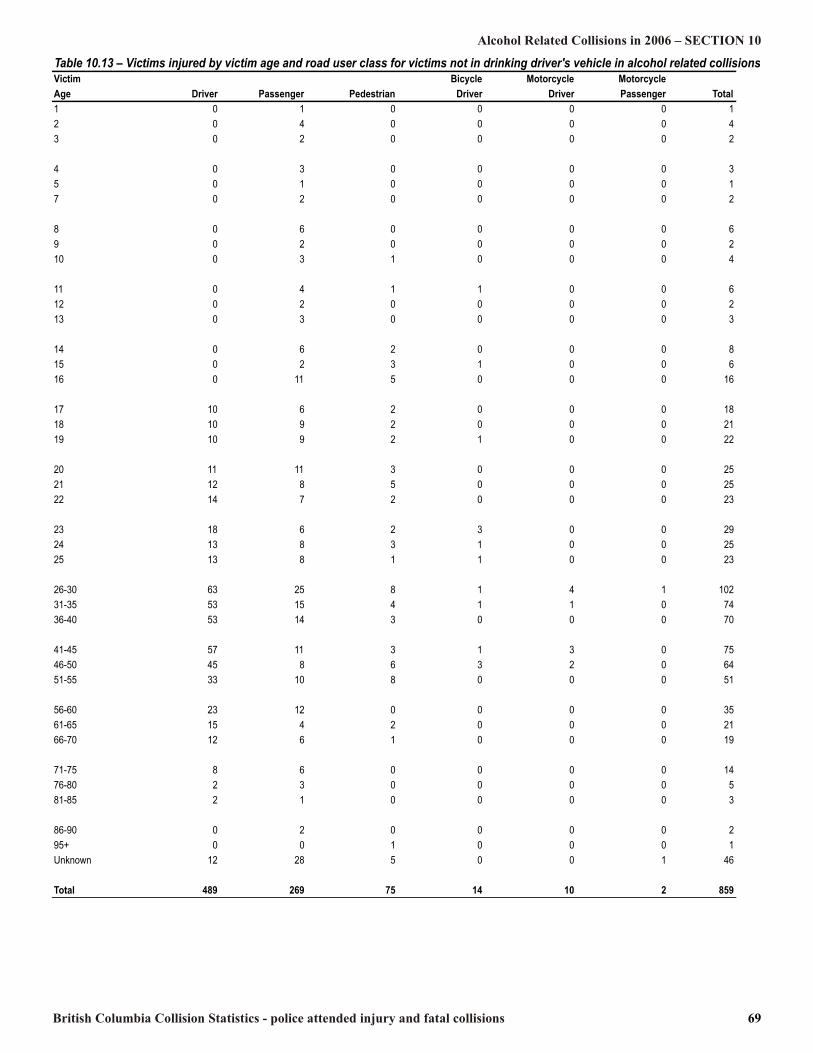
British Columbia Collision Statistics - police attended injury and fatal collisions 69
Alcohol Related Collisions in 2006 – SECTION 10Table 10.13 – Victims injured by victim age and road user class for victims not in drinking driver's vehicle in alcohol related collisionsVictim Bicycle Motorcycle MotorcycleAge Driver Passenger Pedestrian Driver Driver Passenger Total1 0 1 0 0 0 0 12 0 4 0 0 0 0 43 0 2 0 0 0 0 24 0 3 0 0 0 0 35 0 1 0 0 0 0 17 0 2 0 0 0 0 28 0 6 0 0 0 0 69 0 2 0 0 0 0 210 0 3 1 0 0 0 411 0 4 1 1 0 0 612 0 2 0 0 0 0 213 0 3 0 0 0 0 314 0 6 2 0 0 0 815 0 2 3 1 0 0 616 0 11 5 0 0 0 1617 10 6 2 0 0 0 1818 10 9 2 0 0 0 2119 10 9 2 1 0 0 2220 11 11 3 0 0 0 2521 12 8 5 0 0 0 2522 14 7 2 0 0 0 2323 18 6 2 3 0 0 2924 13 8 3 1 0 0 2525 13 8 1 1 0 0 2326-30 63 25 8 1 4 1 10231-35 53 15 4 1 1 0 7436-40 53 14 3 0 0 0 7041-45 57 11 3 1 3 0 7546-50 45 8 6 3 2 0 6451-55 33 10 8 0 0 0 5156-60 23 12 0 0 0 0 3561-65 15 4 2 0 0 0 2166-70 12 6 1 0 0 0 1971-75 8 6 0 0 0 0 1476-80 2 3 0 0 0 0 581-85 2 1 0 0 0 0 386-90 0 2 0 0 0 0 295+ 0 0 1 0 0 0 1Unknown 12 28 5 0 0 1 46Total 489 269 75 14 10 2 859
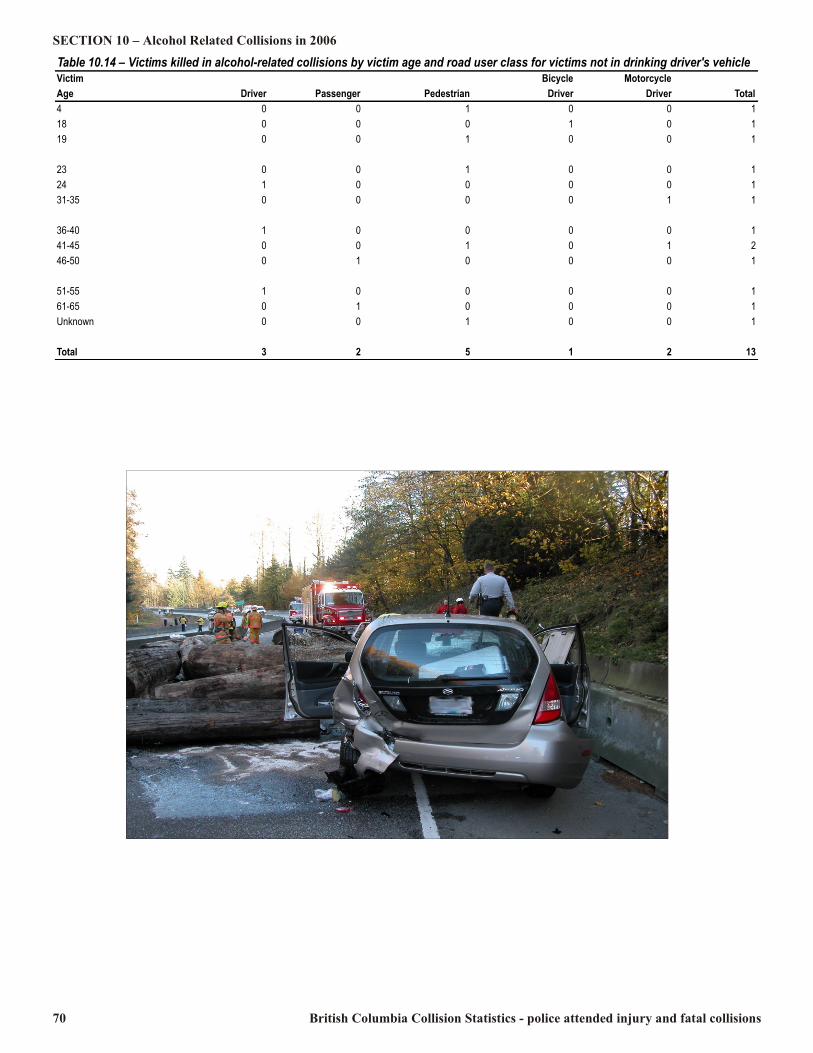
70 British Columbia Collision Statistics - police attended injury and fatal collisions
SECTION 10 – Alcohol Related Collisions in 2006Table 10.14 – Victims killed in alcohol-related collisions by victim age and road user class for victims not in drinking driver's vehicleVictim Bicycle MotorcycleAge Driver Passenger Pedestrian Driver Driver Total4 0 0 1 0 0 118 0 0 0 1 0 119 0 0 1 0 0 123 0 0 1 0 0 124 1 0 0 0 0 131-35 0 0 0 0 1 136-40 1 0 0 0 0 141-45 0 0 1 0 1 246-50 0 1 0 0 0 151-55 1 0 0 0 0 161-65 0 1 0 0 0 1Unknown 0 0 1 0 0 1Total 3 2 5 1 2 13
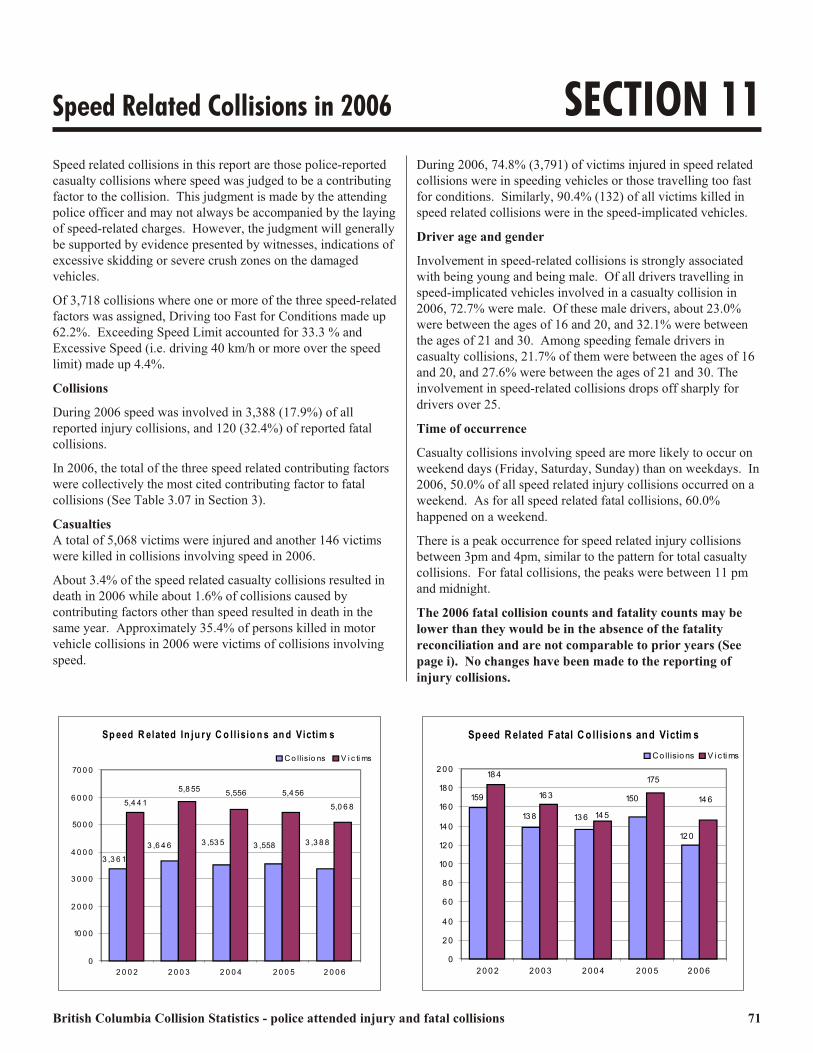
British Columbia Collision Statistics - police attended injury and fatal collisions 71
Speed Related Collisions in 2006 SECTION 11Speed related collisions in this report are those police-reportedcasualty collisions where speed was judged to be a contributingfactor to the collision. This judgment is made by the attendingpolice officer and may not always be accompanied by the laying of speed-related charges. However, the judgment will generally be supported by evidence presented by witnesses, indications ofexcessive skidding or severe crush zones on the damagedvehicles.Of 3,718 collisions where one or more of the three speed-related factors was assigned, Driving too Fast for Conditions made up62.2%. Exceeding Speed Limit accounted for 33.3 % andExcessive Speed (i.e. driving 40 km/h or more over the speedlimit) made up 4.4%.Collisions During 2006 speed was involved in 3,388 (17.9%) of allreported injury collisions, and 120 (32.4%) of reported fatalcollisions. In 2006, the total of the three speed related contributing factorswere collectively the most cited contributing factor to fatalcollisions (See Table 3.07 in Section 3). CasualtiesA total of 5,068 victims were injured and another 146 victimswere killed in collisions involving speed in 2006.About 3.4% of the speed related casualty collisions resulted indeath in 2006 while about 1.6% of collisions caused bycontributing factors other than speed resulted in death in thesame year. Approximately 35.4% of persons killed in motorvehicle collisions in 2006 were victims of collisions involvingspeed.
During 2006, 74.8% (3,791) of victims injured in speed relatedcollisions were in speeding vehicles or those travelling too fastfor conditions. Similarly, 90.4% (132) of all victims killed inspeed related collisions were in the speed-implicated vehicles. Driver age and gender Involvement in speed-related collisions is strongly associatedwith being young and being male. Of all drivers travelling inspeed-implicated vehicles involved in a casualty collision in2006, 72.7% were male. Of these male drivers, about 23.0%were between the ages of 16 and 20, and 32.1% were betweenthe ages of 21 and 30. Among speeding female drivers incasualty collisions, 21.7% of them were between the ages of 16and 20, and 27.6% were between the ages of 21 and 30. Theinvolvement in speed-related collisions drops off sharply fordrivers over 25.Time of occurrenceCasualty collisions involving speed are more likely to occur onweekend days (Friday, Saturday, Sunday) than on weekdays. In 2006, 50.0% of all speed related injury collisions occurred on aweekend. As for all speed related fatal collisions, 60.0%happened on a weekend. There is a peak occurrence for speed related injury collisionsbetween 3pm and 4pm, similar to the pattern for total casualtycollisions. For fatal collisions, the peaks were between 11 pmand midnight.The 2006 fatal collision counts and fatality counts may belower than they would be in the absence of the fatalityreconciliation and are not comparable to prior years (Seepage i). No changes have been made to the reporting ofinjury collisions. Sp eed R elated In ju ry C o l l isio n s an d Victim s
5,4 4 1
3 ,3 6 1 3 ,6 4 6 3 ,53 5 3 ,558 3 ,3 8 85,556 5,4 56 5,0 6 85,8 55
010 0 0
2 0 0 03 0 0 04 0 0 050 0 06 0 0 070 0 0
2 0 0 2 2 0 0 3 2 0 0 4 2 0 0 5 2 0 0 6
C o llisio ns V i c ti msSp eed R elated Fatal C o ll isions and Victim s
12 0150159 13 613 8 14 614 5
18 4 16 3 175
02 04 06 08 010 012 014 016 018 02 0 0
2 0 0 2 2 0 0 3 2 0 0 4 2 0 0 5 2 0 0 6
Co llisio ns V i c ti ms
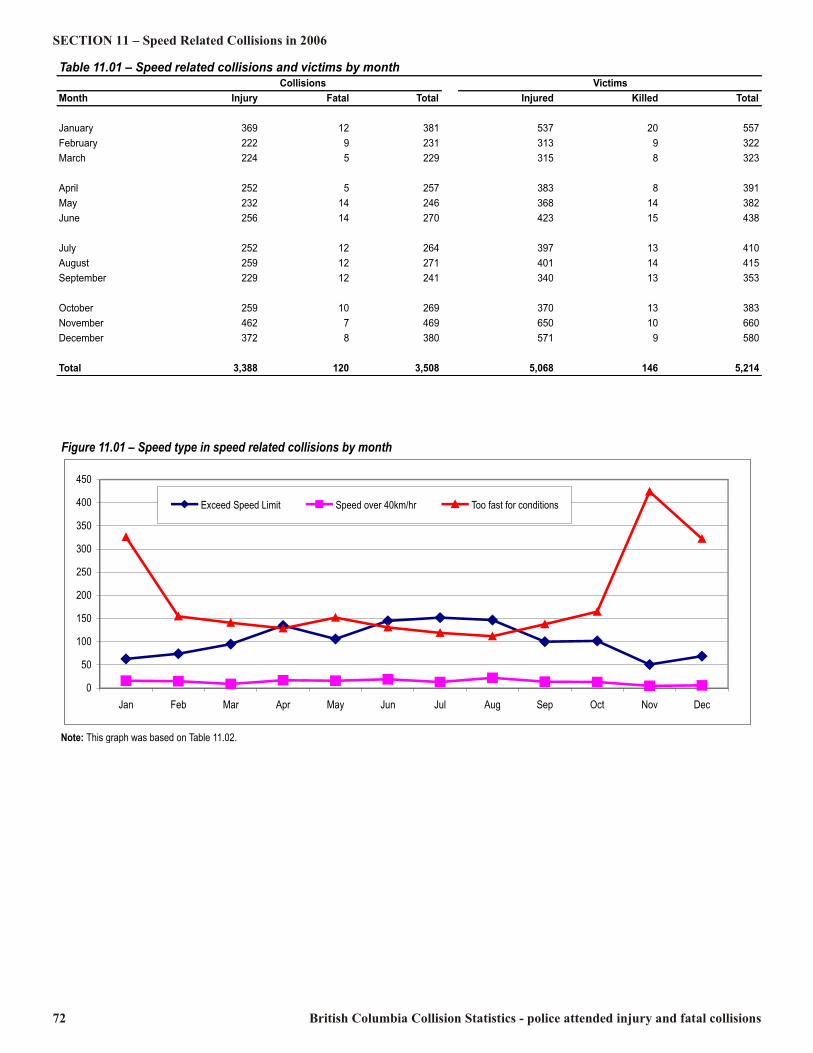
72 British Columbia Collision Statistics - police attended injury and fatal collisions
SECTION 11 – Speed Related Collisions in 2006Table 11.01 – Speed related collisions and victims by month Collisions VictimsMonth Injury Fatal Total Injured Killed TotalJanuary 369 12 381 537 20 557February 222 9 231 313 9 322March 224 5 229 315 8 323April 252 5 257 383 8 391May 232 14 246 368 14 382June 256 14 270 423 15 438July 252 12 264 397 13 410August 259 12 271 401 14 415September 229 12 241 340 13 353October 259 10 269 370 13 383November 462 7 469 650 10 660December 372 8 380 571 9 580Total 3,388 120 3,508 5,068 146 5,214
Figure 11.01 – Speed type in speed related collisions by month
Note: This graph was based on Table 11.02.050100150200250300350400450
Jan Feb Mar Apr May Jun Jul Aug Sep Oct Nov Dec
Exceed Speed Limit Speed over 40km/hr Too fast for conditions
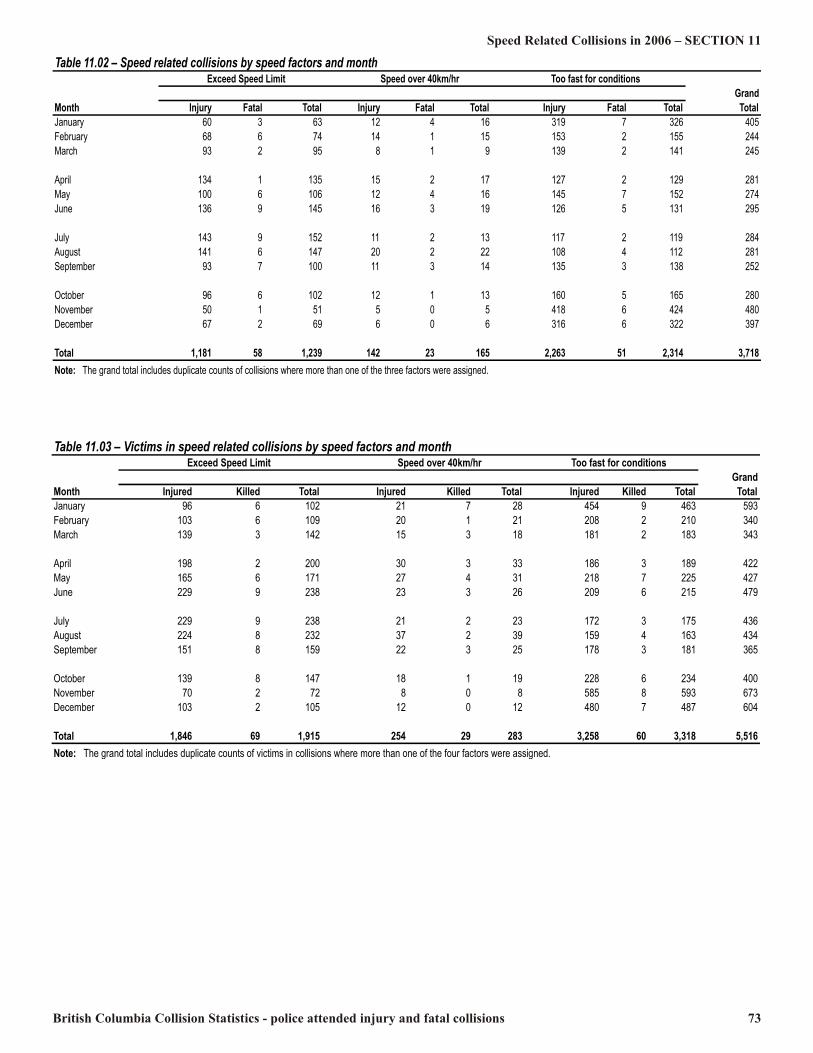
British Columbia Collision Statistics - police attended injury and fatal collisions 73
Speed Related Collisions in 2006 – SECTION 11Table 11.02 – Speed related collisions by speed factors and monthExceed Speed Limit Speed over 40km/hr Too fast for conditions GrandMonth Injury Fatal Total Injury Fatal Total Injury Fatal Total TotalJanuary 60 3 63 12 4 16 319 7 326 405February 68 6 74 14 1 15 153 2 155 244March 93 2 95 8 1 9 139 2 141 245April 134 1 135 15 2 17 127 2 129 281May 100 6 106 12 4 16 145 7 152 274June 136 9 145 16 3 19 126 5 131 295July 143 9 152 11 2 13 117 2 119 284August 141 6 147 20 2 22 108 4 112 281September 93 7 100 11 3 14 135 3 138 252October 96 6 102 12 1 13 160 5 165 280November 50 1 51 5 0 5 418 6 424 480December 67 2 69 6 0 6 316 6 322 397Total 1,181 58 1,239 142 23 165 2,263 51 2,314 3,718Note: The grand total includes duplicate counts of collisions where more than one of the three factors were assigned.
Table 11.03 – Victims in speed related collisions by speed factors and monthExceed Speed Limit Speed over 40km/hr Too fast for conditions GrandMonth Injured Killed Total Injured Killed Total Injured Killed Total TotalJanuary 96 6 102 21 7 28 454 9 463 593February 103 6 109 20 1 21 208 2 210 340March 139 3 142 15 3 18 181 2 183 343April 198 2 200 30 3 33 186 3 189 422May 165 6 171 27 4 31 218 7 225 427June 229 9 238 23 3 26 209 6 215 479July 229 9 238 21 2 23 172 3 175 436August 224 8 232 37 2 39 159 4 163 434September 151 8 159 22 3 25 178 3 181 365October 139 8 147 18 1 19 228 6 234 400November 70 2 72 8 0 8 585 8 593 673December 103 2 105 12 0 12 480 7 487 604Total 1,846 69 1,915 254 29 283 3,258 60 3,318 5,516Note: The grand total includes duplicate counts of victims in collisions where more than one of the four factors were assigned.

74 British Columbia Collision Statistics - police attended injury and fatal collisions
SECTION 11 – Speed Related Collisions in 2006Table 11.04 – Speed related injury collisions by day of week and hour of collision Total % of Time Sunday Monday Tuesday Wednesday Thursday Friday Saturday Collisions Total0000-0059 21 9 11 9 14 19 28 111 3.280100-0159 16 17 9 6 10 18 28 104 3.070200-0259 26 8 8 8 7 20 37 114 3.360300-0359 28 7 4 7 5 15 8 74 2.180400-0459 18 2 6 7 9 9 21 72 2.130500-0559 7 6 6 6 13 6 17 61 1.800600-0659 11 13 12 13 8 22 12 91 2.690700-0759 17 22 23 15 17 17 22 133 3.930800-0859 18 28 30 34 23 28 22 183 5.400900-0959 29 19 13 20 20 22 21 144 4.251000-1059 32 13 11 20 17 19 16 128 3.781100-1159 29 19 19 22 23 17 29 158 4.661200-1259 26 24 23 12 28 24 11 148 4.371300-1359 29 23 15 16 24 20 28 155 4.571400-1459 24 30 13 27 21 28 25 168 4.961500-1559 33 27 22 26 36 24 33 201 5.931600-1659 26 30 17 29 26 33 29 190 5.611700-1759 39 30 20 24 29 27 27 196 5.791800-1859 26 18 20 21 27 32 21 165 4.871900-1959 28 20 17 20 20 34 24 163 4.812000-2059 24 20 18 20 13 25 25 145 4.282100-2159 17 11 22 19 17 24 20 130 3.842200-2259 18 20 9 21 28 21 22 139 4.102300-2359 16 11 15 11 20 33 29 135 3.98Unknown 18 11 9 6 10 19 7 80 2.36Total 576 438 372 419 465 556 562 3,388 100%
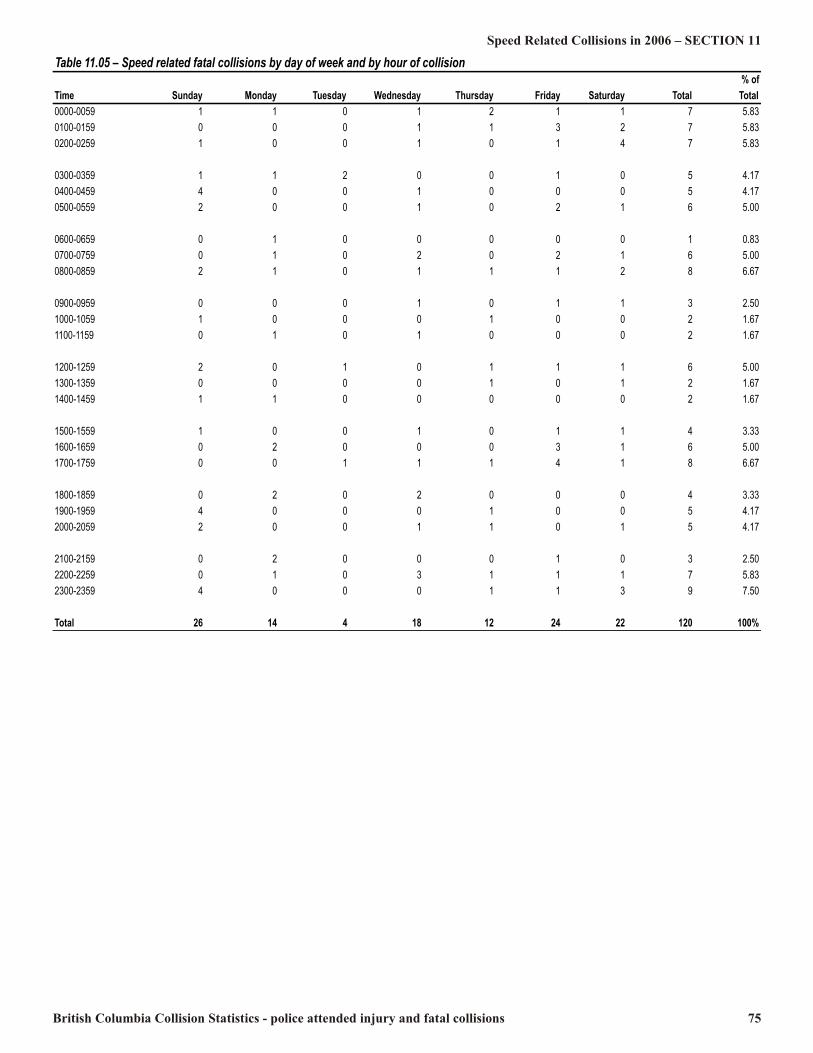
British Columbia Collision Statistics - police attended injury and fatal collisions 75
Speed Related Collisions in 2006 – SECTION 11Table 11.05 – Speed related fatal collisions by day of week and by hour of collision % ofTime Sunday Monday Tuesday Wednesday Thursday Friday Saturday Total Total0000-0059 1 1 0 1 2 1 1 7 5.830100-0159 0 0 0 1 1 3 2 7 5.830200-0259 1 0 0 1 0 1 4 7 5.830300-0359 1 1 2 0 0 1 0 5 4.170400-0459 4 0 0 1 0 0 0 5 4.170500-0559 2 0 0 1 0 2 1 6 5.000600-0659 0 1 0 0 0 0 0 1 0.830700-0759 0 1 0 2 0 2 1 6 5.000800-0859 2 1 0 1 1 1 2 8 6.670900-0959 0 0 0 1 0 1 1 3 2.501000-1059 1 0 0 0 1 0 0 2 1.671100-1159 0 1 0 1 0 0 0 2 1.671200-1259 2 0 1 0 1 1 1 6 5.001300-1359 0 0 0 0 1 0 1 2 1.671400-1459 1 1 0 0 0 0 0 2 1.671500-1559 1 0 0 1 0 1 1 4 3.331600-1659 0 2 0 0 0 3 1 6 5.001700-1759 0 0 1 1 1 4 1 8 6.671800-1859 0 2 0 2 0 0 0 4 3.331900-1959 4 0 0 0 1 0 0 5 4.172000-2059 2 0 0 1 1 0 1 5 4.172100-2159 0 2 0 0 0 1 0 3 2.502200-2259 0 1 0 3 1 1 1 7 5.832300-2359 4 0 0 0 1 1 3 9 7.50Total 26 14 4 18 12 24 22 120 100%
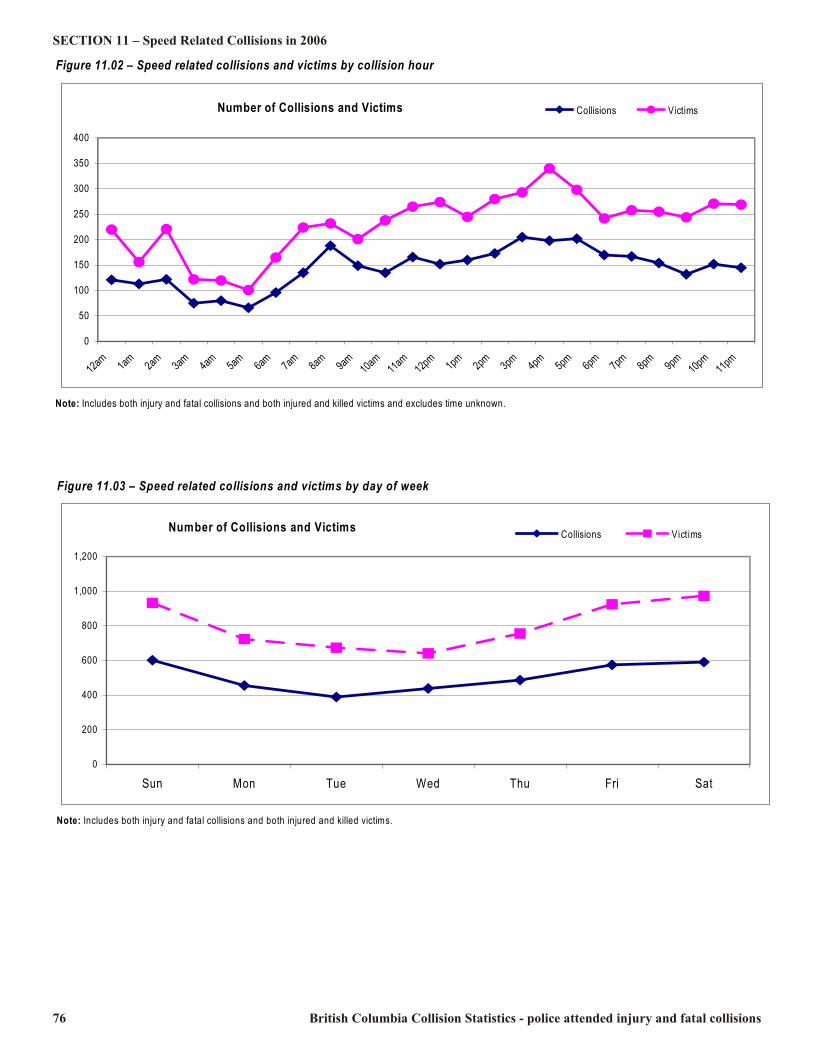
76 British Columbia Collision Statistics - police attended injury and fatal collisions
SECTION 11 – Speed Related Collisions in 2006Figure 11.02 – Speed related collisions and victims by collision hour
Note: Includes both injury and fatal collisions and both injured and killed victims and excludes time unknown.
Number of Collisions and Victims
050100150200250300350400
12am 1am 2am 3am 4am 5am 6am 7am 8am 9am 10am 11am 12pm 1pm 2pm 3pm 4pm 5pm 6pm 7pm 8pm 9pm 10pm 11pm
Collisions Victims
Figure 11.03 – Speed related collisions and victims by day of week
Note: Includes both injury and fatal collisions and both injured and killed victims.
Number of Collisions and Victims
0200400600800
1,0001,200
Sun Mon Tue Wed Thu Fri Sat
Collisions Victims

British Columbia Collision Statistics - police attended injury and fatal collisions 77
Speed Related Collisions in 2006 – SECTION 11Table 11.06 – Age and gender of speeding drivers involvedin speed related collisionsInjury FatalDriver Age Male Female Total Male Female Total11 0 1 1 0 0 012 0 1 1 0 0 013 1 1 2 0 0 014 1 0 1 0 0 015 2 1 3 1 0 116 17 7 24 0 0 017 107 62 169 3 3 618 150 43 193 3 3 619 144 46 190 7 1 820 147 41 188 5 1 621 131 49 180 7 0 722 94 33 127 4 2 623 91 34 125 2 1 324 83 29 112 3 1 425 82 20 102 1 0 126-30 306 92 398 12 2 1431-35 216 78 294 16 1 1736-40 196 90 286 10 1 1141-45 198 85 283 8 2 1046-50 145 73 218 2 3 551-55 118 60 178 3 0 356-60 83 30 113 5 2 761-65 51 21 72 1 0 166-70 30 12 42 1 2 371-75 17 3 20 0 1 176-80 17 7 24 1 1 281-85 7 2 9 0 0 086-90 4 1 5 0 0 095+ 1 0 1 0 0 0Unknown 4 5 9 1 0 1Total 2,443 927 3,370 96 27 123Note: Vehicle drivers only. Excludes drivers with gender unknown.
Table 11.07 – Age and gender of nonspeeding drivers involvedin speed related collisionsInjury FatalDriver Age Male Female Total Male Female Total16 0 2 2 0 0 017 15 9 24 0 0 018 13 11 24 0 0 019 15 9 24 0 0 020 11 12 23 0 0 021 20 15 35 0 0 022 14 12 26 2 0 223 22 16 38 0 0 024 17 16 33 1 0 125 18 5 23 1 0 126-30 94 49 143 5 1 631-35 101 58 159 4 1 536-40 105 57 162 6 0 641-45 109 61 170 7 4 1146-50 121 70 191 4 2 651-55 85 41 126 3 3 656-60 64 30 94 1 1 261-65 43 18 61 1 1 266-70 31 18 49 1 0 171-75 30 19 49 1 1 276-80 18 5 23 0 0 081-85 9 3 12 0 0 086-90 0 2 2 0 0 0Unknown 2 1 3 0 0 0Total 957 539 1,496 37 14 51Note: Vehicle drivers only. Excludes drivers with gender unknown.

78 British Columbia Collision Statistics - police attended injury and fatal collisions
SECTION 11 – Speed Related Collisions in 2006Figure 11.04 – Drivers of speeding vehicles in speed related collisions
Note: Speeding vehicles refer to vehicles exceeding speed limit, in excess of 40km/hour over speed limit and those travelling too fast for conditions.
Number of drivers
0100200300400500600700
Under 16 16-20 21-25 26-30 31-35 36-40 41-45 46-50 51-55 56-60 61-65 66-70 71-75 76-80 81-85 86-90 95+ Unknown
Male Female
Figure 11.05 – Drivers not in speeding vehicles involved in speed related collisions
Note: Speeding vehicles refer to vehicles exceeding speed lim it, in excess of 40km /hour over speed lim it and those travelling too fast for conditions.
Num ber of drivers
020406080
100120140
16-20 21-25 26-30 31-35 36-40 41-45 46-50 51-55 56-60 61-65 66-70 71-75 76-80 81-85 86-90
M ale Fem ale

British Columbia Collision Statistics - police attended injury and fatal collisions 79
Speed Related Collisions in 2006 – SECTION 11Table 11.08 – Licensed drivers and drivers involved in speed related collisions (speeding vehicle drivers only) by age # of Drivers % of Total% of Total Involved in Drivers InvolvedLicensed Driver speed related in speed relatedDriver Age Drivers Population Collisions Collisions2Under 161 0 0 9 0.2616 26,240 0.89 24 0.6917 36,332 1.23 175 5.0118 38,823 1.31 199 5.7019 40,512 1.37 198 5.6720 42,672 1.44 194 5.5521 44,456 1.50 187 5.3522 45,409 1.54 133 3.8123 46,200 1.56 128 3.6624 48,064 1.63 116 3.3225 48,697 1.65 103 2.9526-30 238,943 8.08 412 11.8031-35 252,785 8.55 311 8.9036-40 283,110 9.58 297 8.5041-45 321,673 10.88 293 8.3946-50 323,548 10.95 223 6.3851-55 293,277 9.92 181 5.1856-60 259,157 8.77 120 3.4461-65 183,796 6.22 73 2.0966-70 136,906 4.63 45 1.2971-75 108,084 3.66 21 0.6076-80 78,873 2.67 26 0.7481+ 58,257 1.97 15 0.43Unknown 65 0.00 10 0.29Total 2,955,879 100% 3,493 100%Note:1) Data source for active licensed drivers in 2006 was Business Information Warehouse. 2) Total number of collision involved drivers in the age group as a percentage of the total number of drivers involved in speed related collisions.
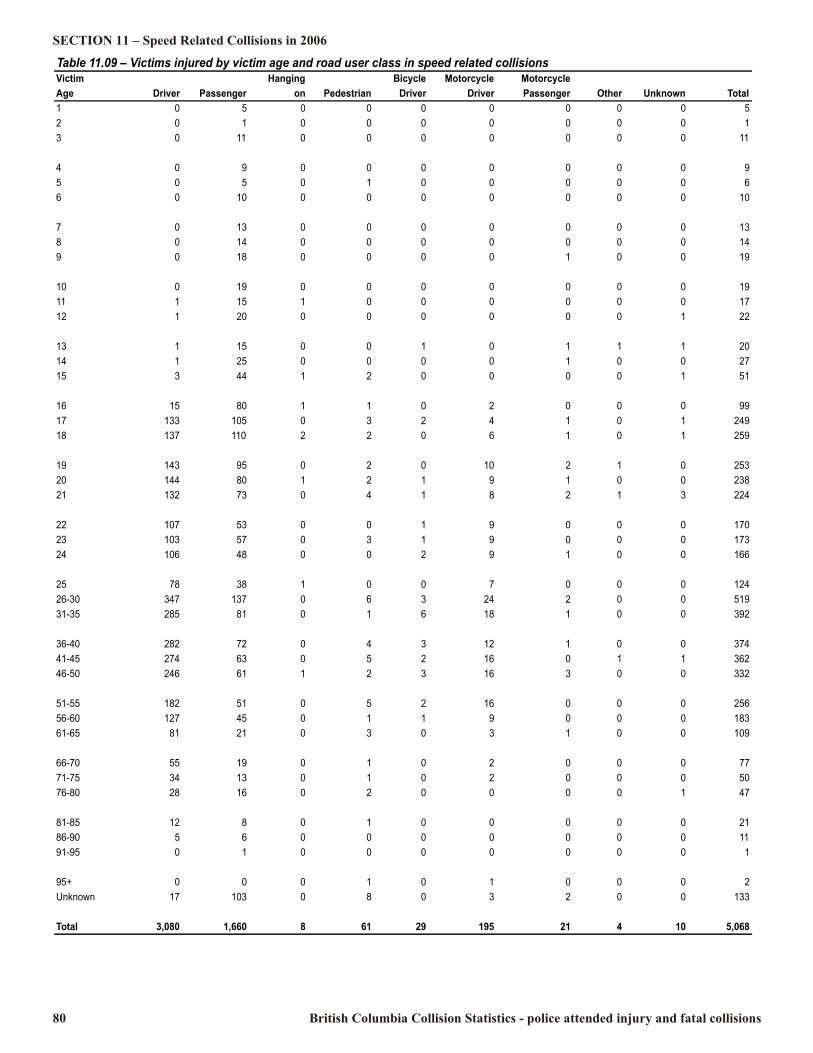
80 British Columbia Collision Statistics - police attended injury and fatal collisions
SECTION 11 – Speed Related Collisions in 2006Table 11.09 – Victims injured by victim age and road user class in speed related collisionsVictim Hanging Bicycle Motorcycle MotorcycleAge Driver Passenger on Pedestrian Driver Driver Passenger Other Unknown Total1 0 5 0 0 0 0 0 0 0 52 0 1 0 0 0 0 0 0 0 13 0 11 0 0 0 0 0 0 0 114 0 9 0 0 0 0 0 0 0 95 0 5 0 1 0 0 0 0 0 66 0 10 0 0 0 0 0 0 0 107 0 13 0 0 0 0 0 0 0 138 0 14 0 0 0 0 0 0 0 149 0 18 0 0 0 0 1 0 0 1910 0 19 0 0 0 0 0 0 0 1911 1 15 1 0 0 0 0 0 0 1712 1 20 0 0 0 0 0 0 1 2213 1 15 0 0 1 0 1 1 1 2014 1 25 0 0 0 0 1 0 0 2715 3 44 1 2 0 0 0 0 1 5116 15 80 1 1 0 2 0 0 0 9917 133 105 0 3 2 4 1 0 1 24918 137 110 2 2 0 6 1 0 1 25919 143 95 0 2 0 10 2 1 0 25320 144 80 1 2 1 9 1 0 0 23821 132 73 0 4 1 8 2 1 3 22422 107 53 0 0 1 9 0 0 0 17023 103 57 0 3 1 9 0 0 0 17324 106 48 0 0 2 9 1 0 0 16625 78 38 1 0 0 7 0 0 0 12426-30 347 137 0 6 3 24 2 0 0 51931-35 285 81 0 1 6 18 1 0 0 39236-40 282 72 0 4 3 12 1 0 0 37441-45 274 63 0 5 2 16 0 1 1 36246-50 246 61 1 2 3 16 3 0 0 33251-55 182 51 0 5 2 16 0 0 0 25656-60 127 45 0 1 1 9 0 0 0 18361-65 81 21 0 3 0 3 1 0 0 10966-70 55 19 0 1 0 2 0 0 0 7771-75 34 13 0 1 0 2 0 0 0 5076-80 28 16 0 2 0 0 0 0 1 4781-85 12 8 0 1 0 0 0 0 0 2186-90 5 6 0 0 0 0 0 0 0 1191-95 0 1 0 0 0 0 0 0 0 195+ 0 0 0 1 0 1 0 0 0 2Unknown 17 103 0 8 0 3 2 0 0 133Total 3,080 1,660 8 61 29 195 21 4 10 5,068
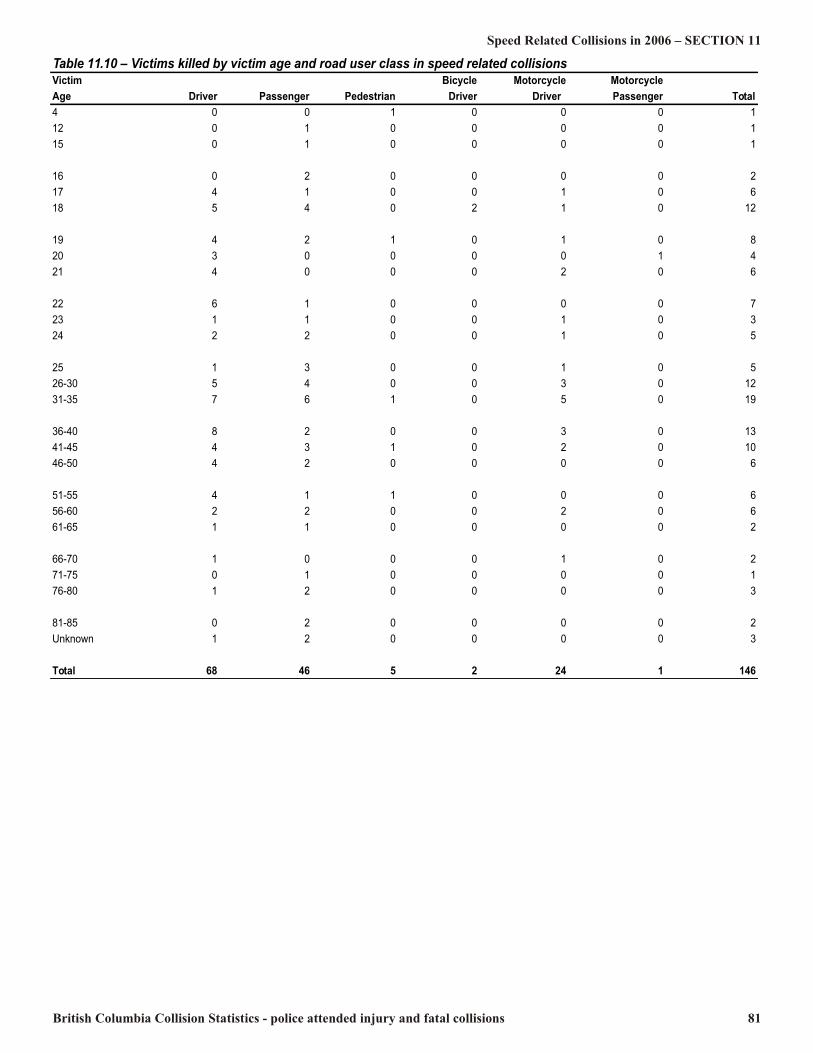
British Columbia Collision Statistics - police attended injury and fatal collisions 81
Speed Related Collisions in 2006 – SECTION 11Table 11.10 – Victims killed by victim age and road user class in speed related collisionsVictim Bicycle Motorcycle MotorcycleAge Driver Passenger Pedestrian Driver Driver Passenger Total4 0 0 1 0 0 0 112 0 1 0 0 0 0 115 0 1 0 0 0 0 116 0 2 0 0 0 0 217 4 1 0 0 1 0 618 5 4 0 2 1 0 1219 4 2 1 0 1 0 820 3 0 0 0 0 1 421 4 0 0 0 2 0 622 6 1 0 0 0 0 723 1 1 0 0 1 0 324 2 2 0 0 1 0 525 1 3 0 0 1 0 526-30 5 4 0 0 3 0 1231-35 7 6 1 0 5 0 1936-40 8 2 0 0 3 0 1341-45 4 3 1 0 2 0 1046-50 4 2 0 0 0 0 651-55 4 1 1 0 0 0 656-60 2 2 0 0 2 0 661-65 1 1 0 0 0 0 266-70 1 0 0 0 1 0 271-75 0 1 0 0 0 0 176-80 1 2 0 0 0 0 381-85 0 2 0 0 0 0 2Unknown 1 2 0 0 0 0 3Total 68 46 5 2 24 1 146

82 British Columbia Collision Statistics - police attended injury and fatal collisions
SECTION 11 – Speed Related Collisions in 2006Table 11.11 – Victims injured in speeding vehicles by victim age and road user classVictim Bicycle Motorcycle Motorcycle Age Driver Passenger Hanging on Driver Driver Passenger Other Unknown Total1 0 2 0 0 0 0 0 0 22 0 1 0 0 0 0 0 0 13 0 6 0 0 0 0 0 0 64 0 4 0 0 0 0 0 0 45 0 2 0 0 0 0 0 0 26 0 4 0 0 0 0 0 0 47 0 7 0 0 0 0 0 0 78 0 8 0 0 0 0 0 0 89 0 11 0 0 0 1 0 0 1210 0 13 0 0 0 0 0 0 1311 1 12 1 0 0 0 0 0 1412 1 12 0 0 0 0 0 1 1413 1 9 0 1 0 1 1 1 1414 1 21 0 0 0 1 0 0 2315 3 40 1 0 0 0 0 1 4516 15 69 1 0 2 0 0 0 8717 119 92 0 2 4 1 0 1 21918 128 98 1 0 5 1 0 0 23319 133 84 0 0 9 2 1 0 22920 132 72 1 1 9 1 0 0 21621 115 63 0 1 7 2 1 3 19222 91 44 0 0 9 0 0 0 14423 80 50 0 1 9 0 0 0 14024 83 38 0 2 7 1 0 0 13125 64 35 1 0 7 0 0 0 10726-30 270 109 0 2 24 2 0 0 40731-35 196 60 0 3 18 1 0 0 27836-40 192 47 0 3 11 1 0 0 25441-45 188 43 0 1 12 0 1 1 24646-50 141 39 0 3 16 3 0 0 20251-55 119 32 0 0 14 0 0 0 16556-60 81 30 0 0 8 0 0 0 11961-65 53 16 0 0 3 1 0 0 7366-70 26 5 0 0 2 0 0 0 3371-75 14 5 0 0 1 0 0 0 2076-80 17 8 0 0 0 0 0 0 2581-85 6 5 0 0 0 0 0 0 1186-90 4 3 0 0 0 0 0 0 791-95 0 1 0 0 0 0 0 0 195+ 0 0 0 0 1 0 0 0 1Unknown 9 69 0 0 2 2 0 0 82Total 2,283 1,269 6 20 180 21 4 8 3,791Note: Speeding vehicles refer to vehicles exceeding speed limit, in excess of 40km/hour over speed limit and those travelling too fast for conditions.

British Columbia Collision Statistics - police attended injury and fatal collisions 83
Speed Related Collisions in 2006 – SECTION 11Table 11.12 – Victims killed in speeding vehiclesby victim age and road user class Victim Bicycle Motorcycle Motorcycle Age Driver Passenger Driver Driver Passenger Total12 0 1 0 0 0 115 0 1 0 0 0 116 0 2 0 0 0 217 4 1 0 1 0 618 5 4 1 1 0 1119 4 2 0 1 0 720 3 0 0 0 1 421 4 0 0 2 0 622 5 1 0 0 0 623 1 1 0 1 0 324 2 2 0 1 0 525 0 3 0 1 0 426-30 5 3 0 3 0 1131-35 6 6 0 5 0 1736-40 8 2 0 3 0 1341-45 4 3 0 2 0 946-50 4 1 0 0 0 551-55 2 1 0 0 0 356-60 2 2 0 2 0 661-65 1 1 0 0 0 266-70 1 0 0 1 0 271-75 0 1 0 0 0 176-80 1 2 0 0 0 381-85 0 1 0 0 0 1Unknown 1 2 0 0 0 3Total 63 43 1 24 1 132Note: Speeding vehicles refer to vehicles exceeding speed limit, in excess of 40km/hour over speed limit and those travelling too fast for conditions.
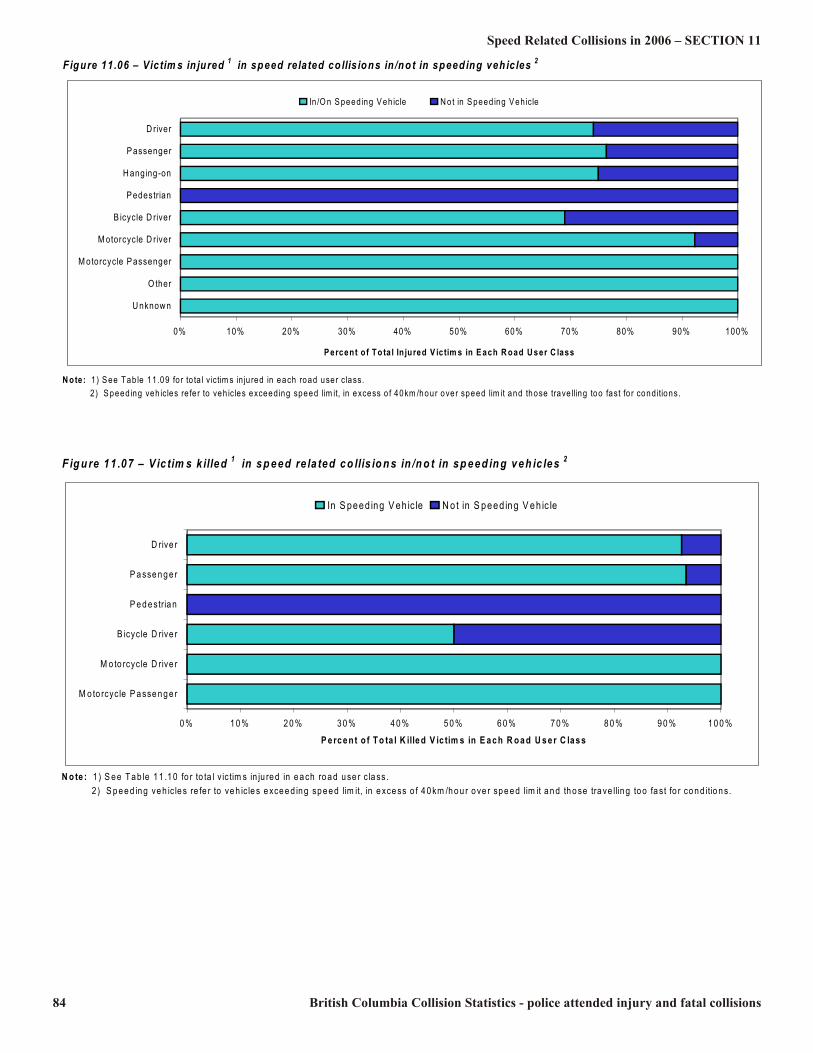
84 British Columbia Collision Statistics - police attended injury and fatal collisions
Speed Related Collisions in 2006 – SECTION 11Figure 11.06 – Victim s in jured 1 in speed re lated co llis ions in /not in speed ing veh ic les 2
N ote: 1 ) S ee Tab le 11 .09 fo r to ta l victim s in ju red in each road user class. 2 ) S peed ing veh icles re fe r to veh icles exceed ing speed lim it, in excess o f 40km /hour over speed lim it and those trave lling too fast fo r cond itions.
0% 10% 20% 30% 40% 50% 60% 70% 80% 90% 100%U nknow nO therM otorcycle P assengerM otorcycle D riverB icycle D riverP edestrianH anging-onP assengerD river
P ercent of To ta l In jured V ic tim s in E ach R oad U ser C lass
In /O n S peed ing V eh icle N ot in S peed ing V eh icle
F ig u re 11 .07 – V ic tim s k illed 1 in sp eed re la ted co llis io n s in /n o t in sp eed in g veh ic les 2
N o te : 1 ) S e e T a b le 1 1 .1 0 fo r to ta l v ic tim s in ju re d in e a ch ro a d u se r c la ss. 2 ) S p e e d in g ve h ic le s re fe r to ve h ic le s e xce e d in g sp e e d lim it, in e xce ss o f 4 0 km /h o u r o ve r sp e e d lim it a n d th o se tra ve llin g to o fa st fo r co n d itio n s.
0 % 1 0 % 2 0 % 3 0 % 4 0 % 5 0 % 6 0 % 7 0 % 8 0 % 9 0 % 1 0 0 %M o to rcyc le P a sse n g e r
M o to rcyc le D rive rB icyc le D rive r
P e d e stria nP a sse n g e r
D rive r
P e rc e n t o f T o ta l K ille d V ic tim s in E a c h R o a d U s e r C la s s
In S peed ing V eh ic le N o t in S peed ing V eh ic le

British Columbia Collision Statistics - police attended injury and fatal collisions 85
Speed Related Collisions in 2006 – SECTION 11Table 11.13 – Victims injured in speed related collisions by victim age and road user class not in speeding vehiclesVictim Bicycle Motorcycle Age Driver Passenger Hanging on Pedestrian Driver Driver Unknown Total1 0 3 0 0 0 0 0 33 0 5 0 0 0 0 0 54 0 5 0 0 0 0 0 55 0 3 0 1 0 0 0 46 0 6 0 0 0 0 0 67 0 6 0 0 0 0 0 68 0 6 0 0 0 0 0 69 0 7 0 0 0 0 0 710 0 6 0 0 0 0 0 611 0 3 0 0 0 0 0 312 0 8 0 0 0 0 0 813 0 6 0 0 0 0 0 614 0 4 0 0 0 0 0 415 0 4 0 2 0 0 0 616 0 11 0 1 0 0 0 1217 14 13 0 3 0 0 0 3018 9 12 1 2 0 1 1 2619 10 11 0 2 0 1 0 2420 12 8 0 2 0 0 0 2221 17 10 0 4 0 1 0 3222 16 9 0 0 1 0 0 2623 23 7 0 3 0 0 0 3324 23 10 0 0 0 2 0 3525 14 3 0 0 0 0 0 1726-30 77 28 0 6 1 0 0 11231-35 89 21 0 1 3 0 0 11436-40 90 25 0 4 0 1 0 12041-45 86 20 0 5 1 4 0 11646-50 105 22 1 2 0 0 0 13051-55 63 19 0 5 2 2 0 9156-60 46 15 0 1 1 1 0 6461-65 28 5 0 3 0 0 0 3666-70 29 14 0 1 0 0 0 4471-75 20 8 0 1 0 1 0 3076-80 11 8 0 2 0 0 1 2281-85 6 3 0 1 0 0 0 1086-90 1 3 0 0 0 0 0 495+ 0 0 0 1 0 0 0 1Unknown 8 34 0 8 0 1 0 51Total 797 391 2 61 9 15 2 1,277

86 British Columbia Collision Statistics - police attended injury and fatal collisions
SECTION 11 – Speed Related Collisions in 2006Table 11.14 – Victims killed in speed related collisions by victim ageand road user class not in speeding vehiclesVictimAge Driver Passenger Pedestrian Bicycle Driver Total4 0 0 1 0 118 0 0 0 1 119 0 0 1 0 122 1 0 0 0 125 1 0 0 0 126-30 0 1 0 0 131-35 1 0 1 0 241-45 0 0 1 0 146-50 0 1 0 0 151-55 2 0 1 0 381-85 0 1 0 0 1Total 5 3 5 1 14Note: Speeding vehicles refer to vehicles exceeding speed limit, in excess of 40km/hour over speed limit and those travelling too fast for conditions.
Table 11.15 – Speed related collisions by speed limit and road jurisdiction – City/Municipal streetSpeedLimit Injury Fatal TotalPosted at 10 km/hr 1 0 1Posted at 20 km/hr 3 0 3Posted at 30 km/hr 45 1 46Posted at 40 km/hr 21 2 23Posted at 50 km/hr 905 26 931Posted at 60 km/hr 221 4 225Posted at 70 km/hr 45 2 47Posted at 80 km/hr 59 1 60Posted at 90 km/hr 10 0 10Posted at 100 km/hr 8 1 9Posted at 110 km/hr 3 0 3Special - 30 km/hr 3 0 3Special - 40 km/hr 1 0 1Not posted - 10 km/hr 3 0 3Not posted - 20 km/hr 2 0 2Not posted - 30 km/hr 6 0 6Not posted - 40 km/hr 3 0 3Not posted - 50 km/hr 204 3 207Not posted - 60 km/hr 5 0 5Not posted - 70 km/hr 1 0 1Not posted - 80 km/hr 2 1 3Other 3 0 3Unknown 121 1 122Total 1,675 42 1,717
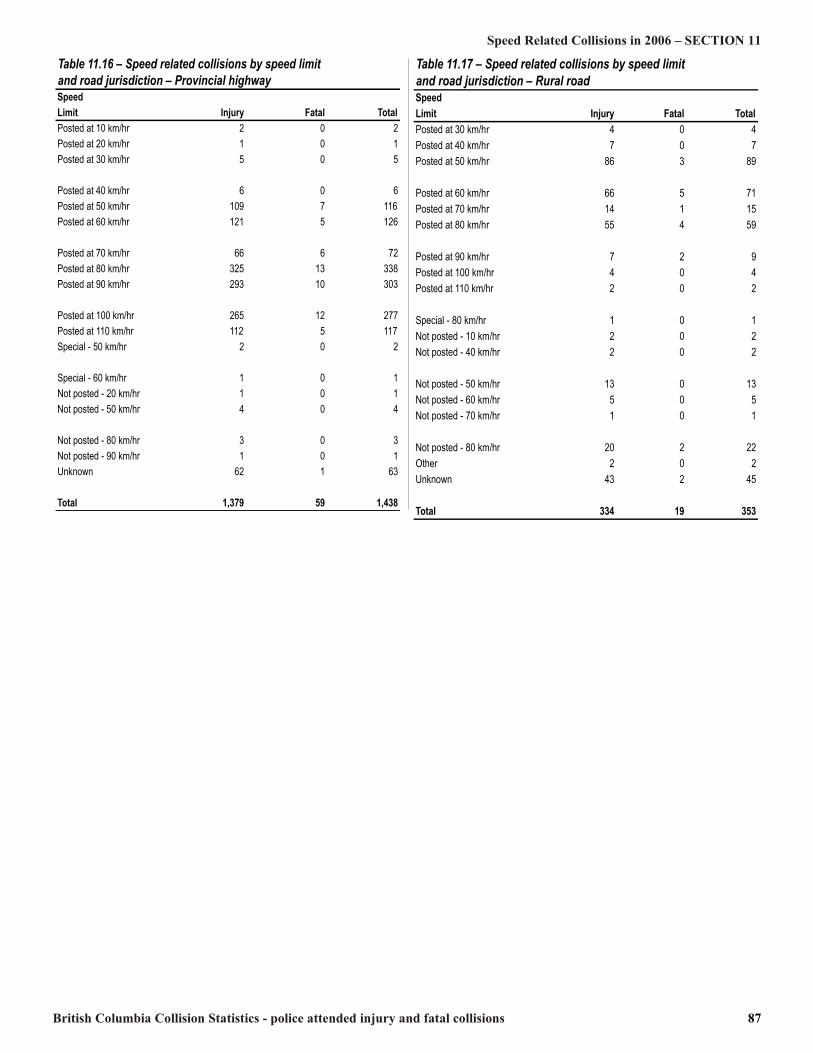
British Columbia Collision Statistics - police attended injury and fatal collisions 87
Speed Related Collisions in 2006 – SECTION 11Table 11.16 – Speed related collisions by speed limit and road jurisdiction – Provincial highway SpeedLimit Injury Fatal TotalPosted at 10 km/hr 2 0 2Posted at 20 km/hr 1 0 1Posted at 30 km/hr 5 0 5Posted at 40 km/hr 6 0 6Posted at 50 km/hr 109 7 116Posted at 60 km/hr 121 5 126Posted at 70 km/hr 66 6 72Posted at 80 km/hr 325 13 338Posted at 90 km/hr 293 10 303Posted at 100 km/hr 265 12 277Posted at 110 km/hr 112 5 117Special - 50 km/hr 2 0 2Special - 60 km/hr 1 0 1Not posted - 20 km/hr 1 0 1Not posted - 50 km/hr 4 0 4Not posted - 80 km/hr 3 0 3Not posted - 90 km/hr 1 0 1Unknown 62 1 63Total 1,379 59 1,438
Table 11.17 – Speed related collisions by speed limit and road jurisdiction – Rural roadSpeedLimit Injury Fatal TotalPosted at 30 km/hr 4 0 4Posted at 40 km/hr 7 0 7Posted at 50 km/hr 86 3 89Posted at 60 km/hr 66 5 71Posted at 70 km/hr 14 1 15Posted at 80 km/hr 55 4 59Posted at 90 km/hr 7 2 9Posted at 100 km/hr 4 0 4Posted at 110 km/hr 2 0 2Special - 80 km/hr 1 0 1Not posted - 10 km/hr 2 0 2Not posted - 40 km/hr 2 0 2 Not posted - 50 km/hr 13 0 13Not posted - 60 km/hr 5 0 5Not posted - 70 km/hr 1 0 1Not posted - 80 km/hr 20 2 22Other 2 0 2Unknown 43 2 45Total 334 19 353
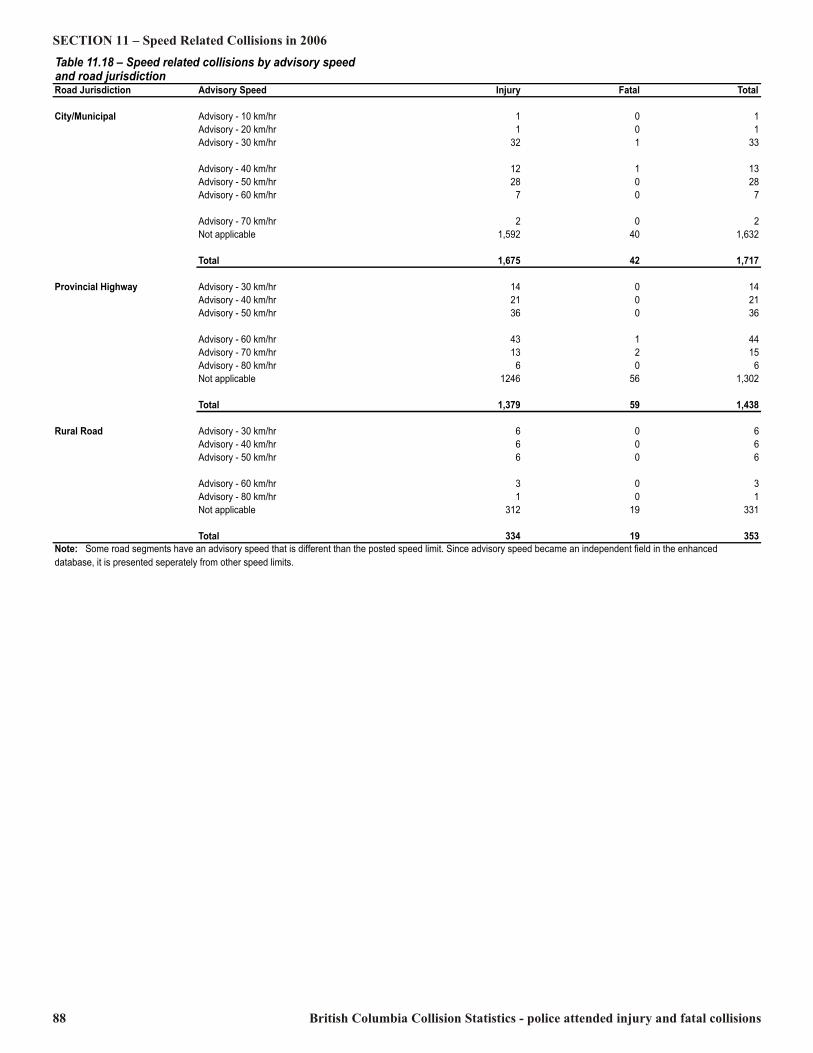
88 British Columbia Collision Statistics - police attended injury and fatal collisions
SECTION 11 – Speed Related Collisions in 2006Table 11.18 – Speed related collisions by advisory speedand road jurisdictionRoad Jurisdiction Advisory Speed Injury Fatal Total City/Municipal Advisory - 10 km/hr 1 0 1Advisory - 20 km/hr 1 0 1Advisory - 30 km/hr 32 1 33Advisory - 40 km/hr 12 1 13Advisory - 50 km/hr 28 0 28Advisory - 60 km/hr 7 0 7Advisory - 70 km/hr 2 0 2Not applicable 1,592 40 1,632Total 1,675 42 1,717
Provincial Highway Advisory - 30 km/hr 14 0 14Advisory - 40 km/hr 21 0 21Advisory - 50 km/hr 36 0 36Advisory - 60 km/hr 43 1 44Advisory - 70 km/hr 13 2 15Advisory - 80 km/hr 6 0 6Not applicable 1246 56 1,302Total 1,379 59 1,438
Rural Road Advisory - 30 km/hr 6 0 6Advisory - 40 km/hr 6 0 6Advisory - 50 km/hr 6 0 6Advisory - 60 km/hr 3 0 3Advisory - 80 km/hr 1 0 1Not applicable 312 19 331Total 334 19 353Note: Some road segments have an advisory speed that is different than the posted speed limit. Since advisory speed became an independent field in the enhanceddatabase, it is presented seperately from other speed limits.
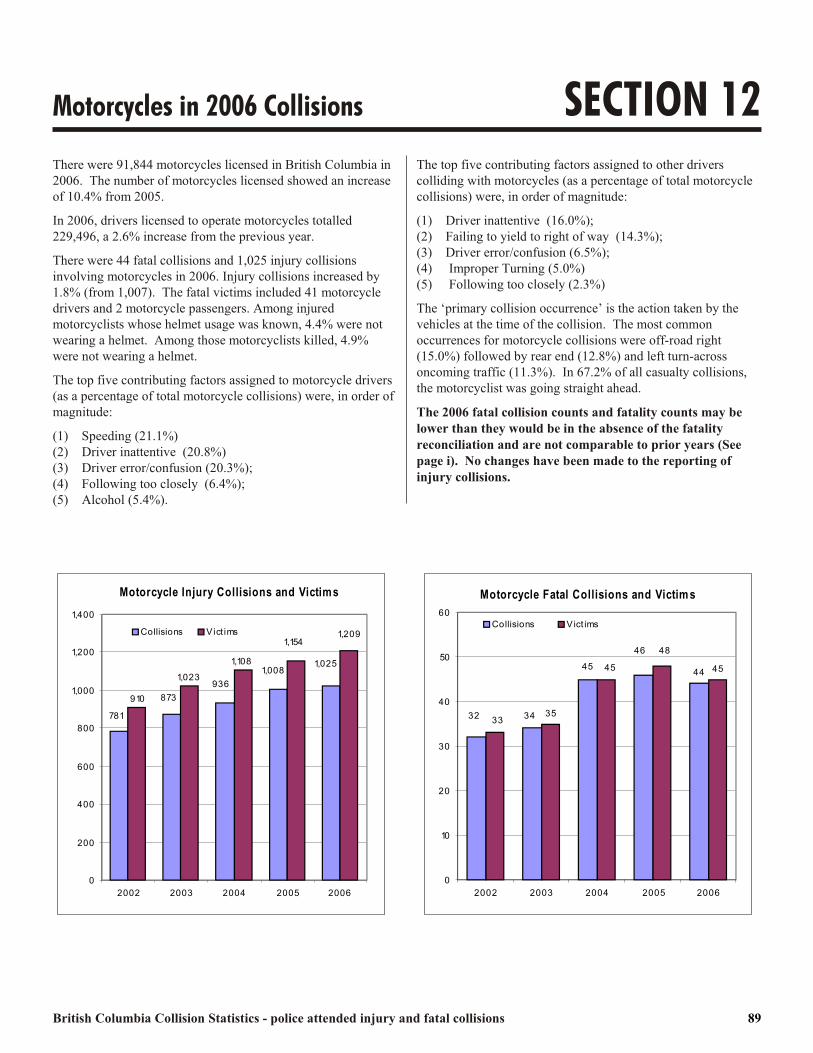
British Columbia Collision Statistics - police attended injury and fatal collisions 89
Motorcycles in 2006 Collisions SECTION 12There were 91,844 motorcycles licensed in British Columbia in2006. The number of motorcycles licensed showed an increaseof 10.4% from 2005. In 2006, drivers licensed to operate motorcycles totalled229,496, a 2.6% increase from the previous year. There were 44 fatal collisions and 1,025 injury collisionsinvolving motorcycles in 2006. Injury collisions increased by1.8% (from 1,007). The fatal victims included 41 motorcycledrivers and 2 motorcycle passengers. Among injuredmotorcyclists whose helmet usage was known, 4.4% were notwearing a helmet. Among those motorcyclists killed, 4.9%were not wearing a helmet. The top five contributing factors assigned to motorcycle drivers(as a percentage of total motorcycle collisions) were, in order ofmagnitude:(1) Speeding (21.1%) (2) Driver inattentive (20.8%) (3) Driver error/confusion (20.3%); (4) Following too closely (6.4%); (5) Alcohol (5.4%).
The top five contributing factors assigned to other driverscolliding with motorcycles (as a percentage of total motorcyclecollisions) were, in order of magnitude:(1) Driver inattentive (16.0%); (2) Failing to yield to right of way (14.3%);(3) Driver error/confusion (6.5%); (4) Improper Turning (5.0%) (5) Following too closely (2.3%)The ‘primary collision occurrence’ is the action taken by thevehicles at the time of the collision. The most commonoccurrences for motorcycle collisions were off-road right(15.0%) followed by rear end (12.8%) and left turn-acrossoncoming traffic (11.3%). In 67.2% of all casualty collisions,the motorcyclist was going straight ahead.The 2006 fatal collision counts and fatality counts may belower than they would be in the absence of the fatalityreconciliation and are not comparable to prior years (Seepage i). No changes have been made to the reporting ofinjury collisions.
Motorcycle Injury Collisions and Victims
781 873 936 1,008 1,0251,1541,023910
1,1081,209
0200400600800
1,0001,2001,400
2002 2003 2004 2005 2006
Collisions Vict imsMotorcycle Fatal Collisions and Victim s
44 454532
46
3445
3533
48
0102030405060
2002 2003 2004 2005 2006
Collisions Vict ims
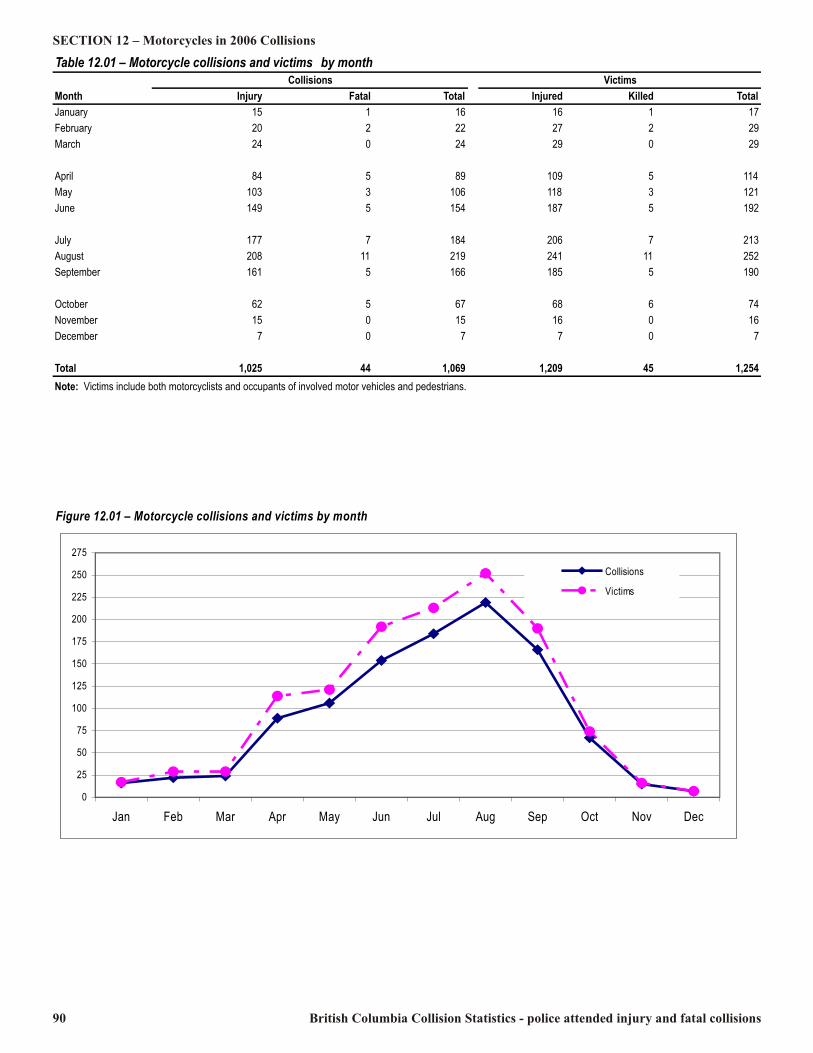
90 British Columbia Collision Statistics - police attended injury and fatal collisions
SECTION 12 – Motorcycles in 2006 CollisionsTable 12.01 – Motorcycle collisions and victims by monthCollisions VictimsMonth Injury Fatal Total Injured Killed TotalJanuary 15 1 16 16 1 17February 20 2 22 27 2 29March 24 0 24 29 0 29April 84 5 89 109 5 114May 103 3 106 118 3 121June 149 5 154 187 5 192July 177 7 184 206 7 213August 208 11 219 241 11 252September 161 5 166 185 5 190October 62 5 67 68 6 74November 15 0 15 16 0 16December 7 0 7 7 0 7Total 1,025 44 1,069 1,209 45 1,254Note: Victims include both motorcyclists and occupants of involved motor vehicles and pedestrians.
Figure 12.01 – Motorcycle collisions and victims by month
0255075100125150175200225250275
Jan Feb Mar Apr May Jun Jul Aug Sep Oct Nov Dec
CollisionsVictims
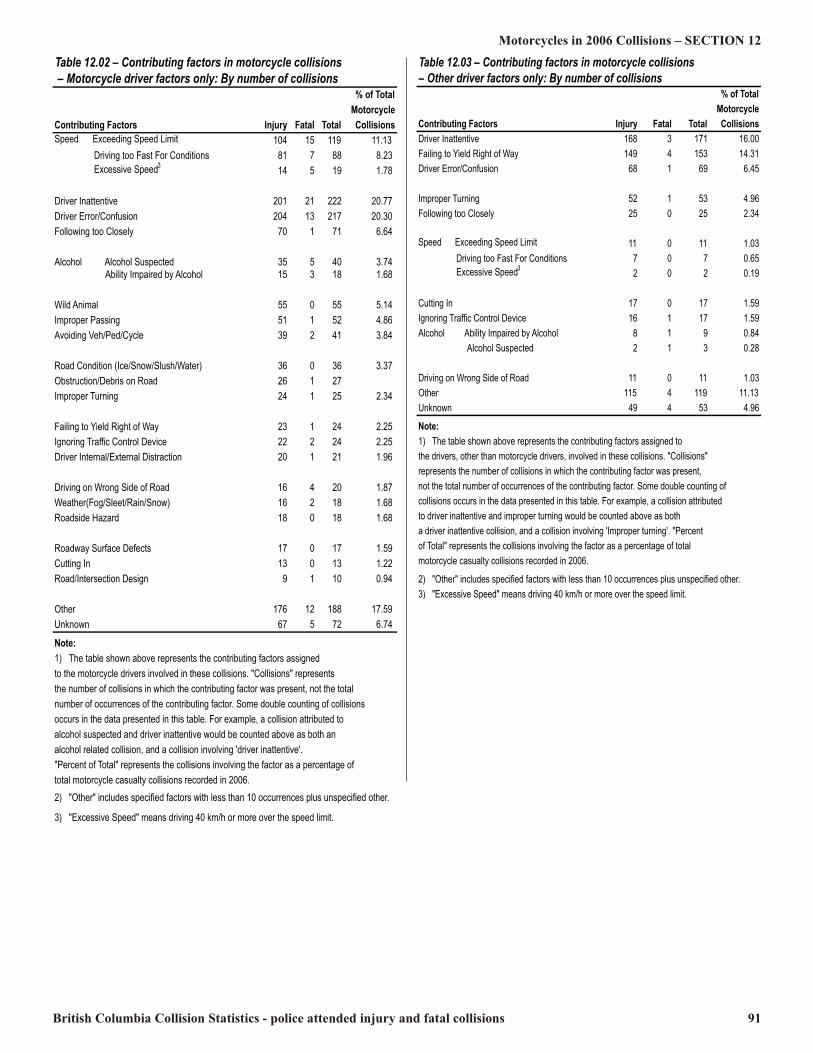
British Columbia Collision Statistics - police attended injury and fatal collisions 91
Motorcycles in 2006 Collisions – SECTION 12Table 12.03 – Contributing factors in motorcycle collisions – Other driver factors only: By number of collisions % of TotalMotorcycleContributing Factors Injury Fatal Total CollisionsDriver Inattentive 168 3 171 16.00Failing to Yield Right of Way 149 4 153 14.31Driver Error/Confusion 68 1 69 6.45Improper Turning 52 1 53 4.96Following too Closely 25 0 25 2.34Speed Exceeding Speed Limit 11 0 11 1.03 Driving too Fast For Conditions 7 0 7 0.65 Excessive Speed3 2 0 2 0.19Cutting In 17 0 17 1.59Ignoring Traffic Control Device 16 1 17 1.59Alcohol Ability Impaired by Alcohol 8 1 9 0.84 Alcohol Suspected 2 1 3 0.28Driving on Wrong Side of Road 11 0 11 1.03Other 115 4 119 11.13Unknown 49 4 53 4.96Note:1) The table shown above represents the contributing factors assigned tothe drivers, other than motorcycle drivers, involved in these collisions. "Collisions" represents the number of collisions in which the contributing factor was present, not the total number of occurrences of the contributing factor. Some double counting ofcollisions occurs in the data presented in this table. For example, a collision attributedto driver inattentive and improper turning would be counted above as both a driver inattentive collision, and a collision involving 'Improper turning'. "Percent of Total" represents the collisions involving the factor as a percentage of total motorcycle casualty collisions recorded in 2006.2) "Other" includes specified factors with less than 10 occurrences plus unspecified other.3) "Excessive Speed" means driving 40 km/h or more over the speed limit.
Table 12.02 – Contributing factors in motorcycle collisions – Motorcycle driver factors only: By number of collisions % of TotalMotorcycleContributing Factors Injury Fatal Total CollisionsSpeed Exceeding Speed Limit 104 15 119 11.13 Driving too Fast For Conditions 81 7 88 8.23 Excessive Speed3 14 5 19 1.78Driver Inattentive 201 21 222 20.77Driver Error/Confusion 204 13 217 20.30Following too Closely 70 1 71 6.64Alcohol Alcohol Suspected 35 5 40 3.74 Ability Impaired by Alcohol 15 3 18 1.68Wild Animal 55 0 55 5.14Improper Passing 51 1 52 4.86Avoiding Veh/Ped/Cycle 39 2 41 3.84Road Condition (Ice/Snow/Slush/Water) 36 0 36 3.37Obstruction/Debris on Road 26 1 27Improper Turning 24 1 25 2.34Failing to Yield Right of Way 23 1 24 2.25Ignoring Traffic Control Device 22 2 24 2.25Driver Internal/External Distraction 20 1 21 1.96Driving on Wrong Side of Road 16 4 20 1.87Weather(Fog/Sleet/Rain/Snow) 16 2 18 1.68Roadside Hazard 18 0 18 1.68Roadway Surface Defects 17 0 17 1.59Cutting In 13 0 13 1.22Road/Intersection Design 9 1 10 0.94Other 176 12 188 17.59Unknown 67 5 72 6.74Note:1) The table shown above represents the contributing factors assigned to the motorcycle drivers involved in these collisions. "Collisions" representsthe number of collisions in which the contributing factor was present, not the total number of occurrences of the contributing factor. Some double counting of collisions occurs in the data presented in this table. For example, a collision attributed to alcohol suspected and driver inattentive would be counted above as both an alcohol related collision, and a collision involving 'driver inattentive'."Percent of Total" represents the collisions involving the factor as a percentage oftotal motorcycle casualty collisions recorded in 2006.2) "Other" includes specified factors with less than 10 occurrences plus unspecified other.3) "Excessive Speed" means driving 40 km/h or more over the speed limit.
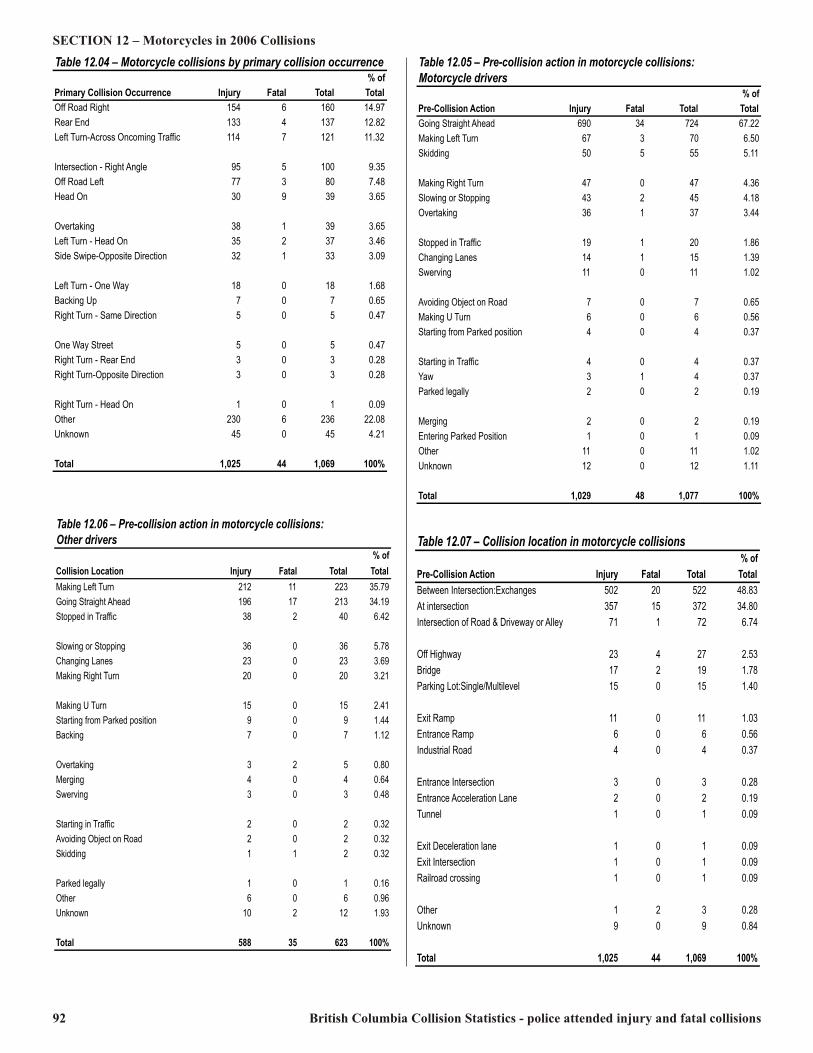
92 British Columbia Collision Statistics - police attended injury and fatal collisions
SECTION 12 – Motorcycles in 2006 Collisions Table 12.05 – Pre-collision action in motorcycle collisions: Motorcycle drivers % ofPre-Collision Action Injury Fatal Total TotalGoing Straight Ahead 690 34 724 67.22Making Left Turn 67 3 70 6.50Skidding 50 5 55 5.11Making Right Turn 47 0 47 4.36Slowing or Stopping 43 2 45 4.18Overtaking 36 1 37 3.44Stopped in Traffic 19 1 20 1.86Changing Lanes 14 1 15 1.39Swerving 11 0 11 1.02Avoiding Object on Road 7 0 7 0.65Making U Turn 6 0 6 0.56Starting from Parked position 4 0 4 0.37Starting in Traffic 4 0 4 0.37Yaw 3 1 4 0.37Parked legally 2 0 2 0.19Merging 2 0 2 0.19Entering Parked Position 1 0 1 0.09Other 11 0 11 1.02Unknown 12 0 12 1.11Total 1,029 48 1,077 100%
Table 12.04 – Motorcycle collisions by primary collision occurrence% ofPrimary Collision Occurrence Injury Fatal Total TotalOff Road Right 154 6 160 14.97Rear End 133 4 137 12.82Left Turn-Across Oncoming Traffic 114 7 121 11.32Intersection - Right Angle 95 5 100 9.35Off Road Left 77 3 80 7.48Head On 30 9 39 3.65Overtaking 38 1 39 3.65Left Turn - Head On 35 2 37 3.46Side Swipe-Opposite Direction 32 1 33 3.09Left Turn - One Way 18 0 18 1.68Backing Up 7 0 7 0.65Right Turn - Same Direction 5 0 5 0.47One Way Street 5 0 5 0.47Right Turn - Rear End 3 0 3 0.28Right Turn-Opposite Direction 3 0 3 0.28Right Turn - Head On 1 0 1 0.09Other 230 6 236 22.08Unknown 45 0 45 4.21Total 1,025 44 1,069 100%Table 12.06 – Pre-collision action in motorcycle collisions:Other drivers % ofCollision Location Injury Fatal Total TotalMaking Left Turn 212 11 223 35.79Going Straight Ahead 196 17 213 34.19Stopped in Traffic 38 2 40 6.42Slowing or Stopping 36 0 36 5.78Changing Lanes 23 0 23 3.69Making Right Turn 20 0 20 3.21Making U Turn 15 0 15 2.41Starting from Parked position 9 0 9 1.44Backing 7 0 7 1.12Overtaking 3 2 5 0.80Merging 4 0 4 0.64Swerving 3 0 3 0.48Starting in Traffic 2 0 2 0.32Avoiding Object on Road 2 0 2 0.32Skidding 1 1 2 0.32Parked legally 1 0 1 0.16Other 6 0 6 0.96Unknown 10 2 12 1.93Total 588 35 623 100%
Table 12.07 – Collision location in motorcycle collisions % ofPre-Collision Action Injury Fatal Total TotalBetween Intersection:Exchanges 502 20 522 48.83At intersection 357 15 372 34.80Intersection of Road & Driveway or Alley 71 1 72 6.74Off Highway 23 4 27 2.53Bridge 17 2 19 1.78Parking Lot:Single/Multilevel 15 0 15 1.40Exit Ramp 11 0 11 1.03Entrance Ramp 6 0 6 0.56Industrial Road 4 0 4 0.37Entrance Intersection 3 0 3 0.28Entrance Acceleration Lane 2 0 2 0.19Tunnel 1 0 1 0.09Exit Deceleration lane 1 0 1 0.09Exit Intersection 1 0 1 0.09Railroad crossing 1 0 1 0.09Other 1 2 3 0.28Unknown 9 0 9 0.84Total 1,025 44 1,069 100%
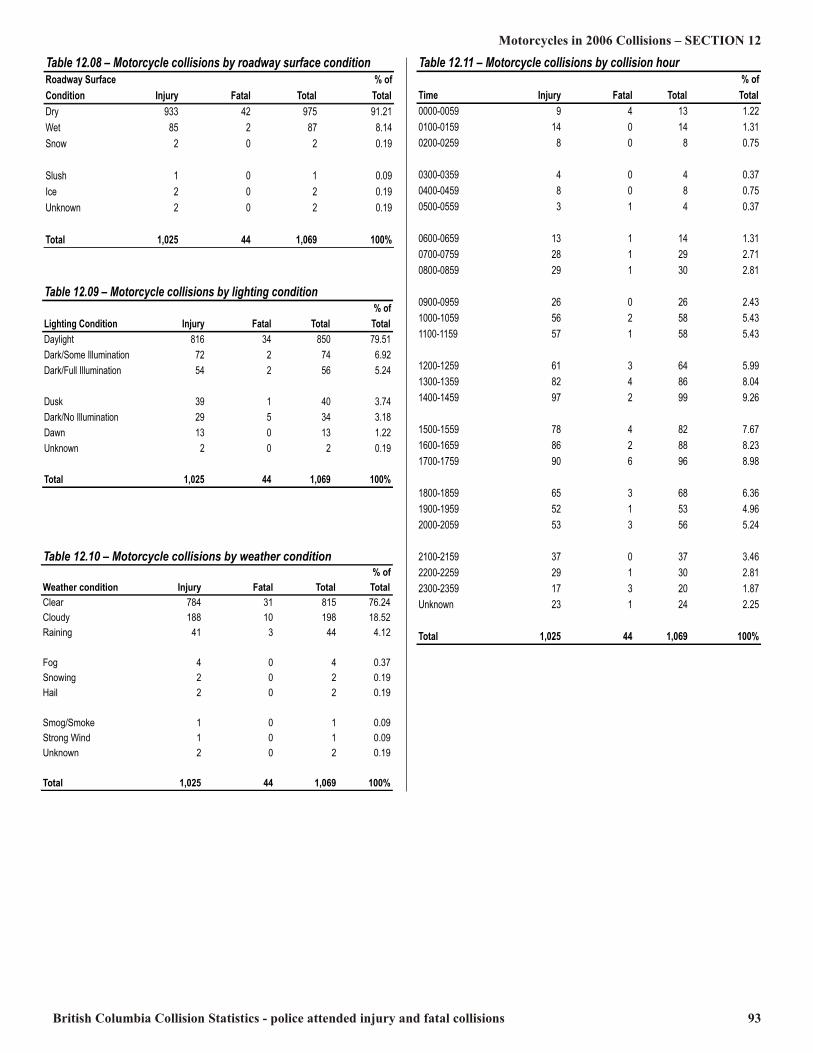
British Columbia Collision Statistics - police attended injury and fatal collisions 93
Motorcycles in 2006 Collisions – SECTION 12Table 12.08 – Motorcycle collisions by roadway surface conditionRoadway Surface % ofCondition Injury Fatal Total TotalDry 933 42 975 91.21Wet 85 2 87 8.14Snow 2 0 2 0.19Slush 1 0 1 0.09Ice 2 0 2 0.19Unknown 2 0 2 0.19Total 1,025 44 1,069 100%
Table 12.11 – Motorcycle collisions by collision hour % ofTime Injury Fatal Total Total0000-0059 9 4 13 1.220100-0159 14 0 14 1.310200-0259 8 0 8 0.750300-0359 4 0 4 0.370400-0459 8 0 8 0.750500-0559 3 1 4 0.370600-0659 13 1 14 1.310700-0759 28 1 29 2.710800-0859 29 1 30 2.810900-0959 26 0 26 2.431000-1059 56 2 58 5.431100-1159 57 1 58 5.431200-1259 61 3 64 5.991300-1359 82 4 86 8.041400-1459 97 2 99 9.261500-1559 78 4 82 7.671600-1659 86 2 88 8.231700-1759 90 6 96 8.981800-1859 65 3 68 6.361900-1959 52 1 53 4.962000-2059 53 3 56 5.242100-2159 37 0 37 3.462200-2259 29 1 30 2.812300-2359 17 3 20 1.87Unknown 23 1 24 2.25Total 1,025 44 1,069 100%
Table 12.09 – Motorcycle collisions by lighting condition % ofLighting Condition Injury Fatal Total TotalDaylight 816 34 850 79.51Dark/Some Illumination 72 2 74 6.92Dark/Full Illumination 54 2 56 5.24Dusk 39 1 40 3.74Dark/No Illumination 29 5 34 3.18Dawn 13 0 13 1.22Unknown 2 0 2 0.19Total 1,025 44 1,069 100%
Table 12.10 – Motorcycle collisions by weather condition % ofWeather condition Injury Fatal Total TotalClear 784 31 815 76.24Cloudy 188 10 198 18.52Raining 41 3 44 4.12Fog 4 0 4 0.37Snowing 2 0 2 0.19Hail 2 0 2 0.19Smog/Smoke 1 0 1 0.09Strong Wind 1 0 1 0.09Unknown 2 0 2 0.19Total 1,025 44 1,069 100%
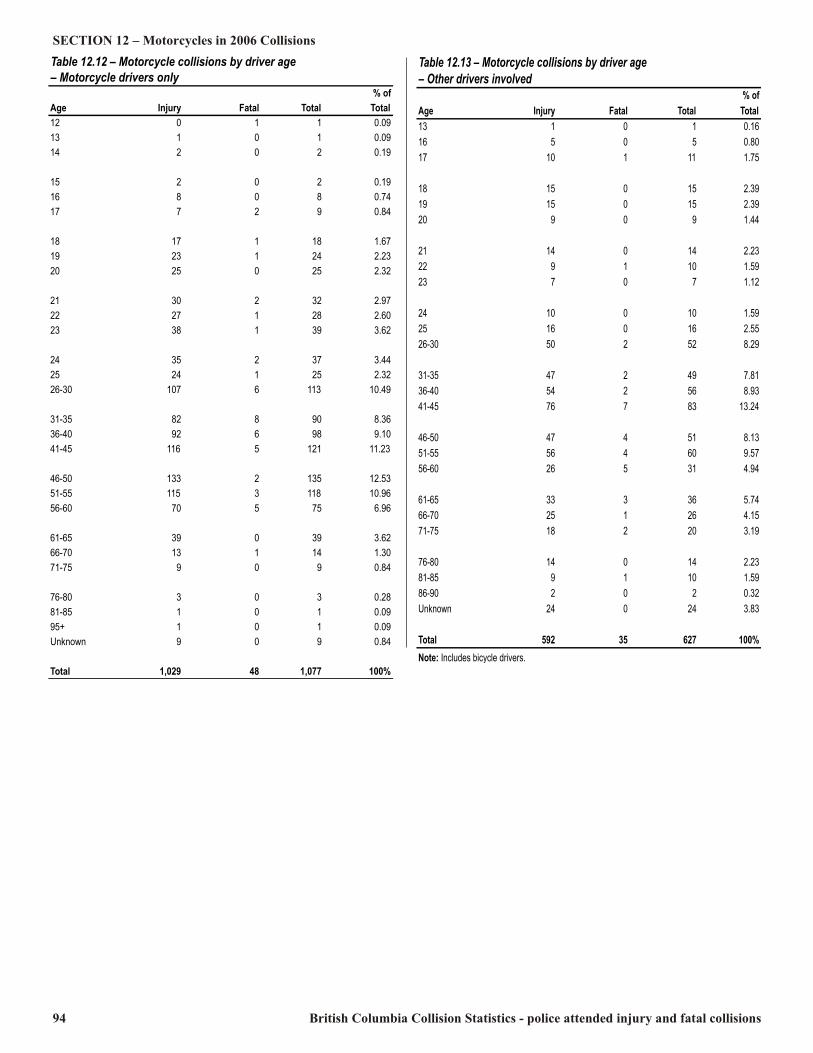
94 British Columbia Collision Statistics - police attended injury and fatal collisions
SECTION 12 – Motorcycles in 2006 CollisionsTable 12.12 – Motorcycle collisions by driver age – Motorcycle drivers only % ofAge Injury Fatal Total Total12 0 1 1 0.0913 1 0 1 0.0914 2 0 2 0.1915 2 0 2 0.1916 8 0 8 0.7417 7 2 9 0.8418 17 1 18 1.6719 23 1 24 2.2320 25 0 25 2.3221 30 2 32 2.9722 27 1 28 2.6023 38 1 39 3.6224 35 2 37 3.4425 24 1 25 2.3226-30 107 6 113 10.4931-35 82 8 90 8.3636-40 92 6 98 9.1041-45 116 5 121 11.2346-50 133 2 135 12.5351-55 115 3 118 10.9656-60 70 5 75 6.9661-65 39 0 39 3.6266-70 13 1 14 1.3071-75 9 0 9 0.8476-80 3 0 3 0.2881-85 1 0 1 0.0995+ 1 0 1 0.09Unknown 9 0 9 0.84Total 1,029 48 1,077 100%
Table 12.13 – Motorcycle collisions by driver age– Other drivers involved % ofAge Injury Fatal Total Total13 1 0 1 0.1616 5 0 5 0.8017 10 1 11 1.7518 15 0 15 2.3919 15 0 15 2.3920 9 0 9 1.4421 14 0 14 2.2322 9 1 10 1.5923 7 0 7 1.1224 10 0 10 1.5925 16 0 16 2.5526-30 50 2 52 8.2931-35 47 2 49 7.8136-40 54 2 56 8.9341-45 76 7 83 13.2446-50 47 4 51 8.1351-55 56 4 60 9.5756-60 26 5 31 4.9461-65 33 3 36 5.7466-70 25 1 26 4.1571-75 18 2 20 3.1976-80 14 0 14 2.2381-85 9 1 10 1.5986-90 2 0 2 0.32Unknown 24 0 24 3.83Total 592 35 627 100%Note: Includes bicycle drivers.
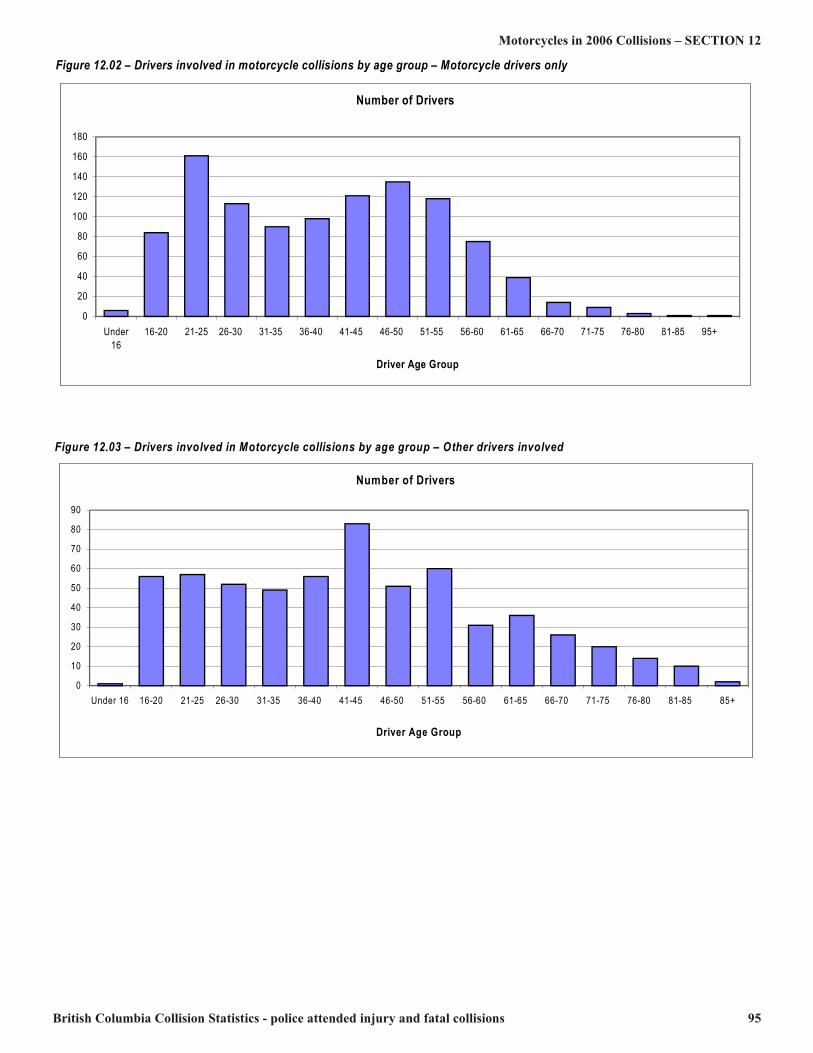
British Columbia Collision Statistics - police attended injury and fatal collisions 95
Motorcycles in 2006 Collisions – SECTION 12Figure 12.02 – Drivers involved in motorcycle collisions by age group – Motorcycle drivers onlyNumber of Drivers
020406080100120140160180
Under16 16-20 21-25 26-30 31-35 36-40 41-45 46-50 51-55 56-60 61-65 66-70 71-75 76-80 81-85 95+ Driver Age Group
Figure 12.03 – Drivers involved in Motorcycle collisions by age group – Other drivers involvedNumber of Drivers
0102030405060708090
Under 16 16-20 21-25 26-30 31-35 36-40 41-45 46-50 51-55 56-60 61-65 66-70 71-75 76-80 81-85 85+Driver Age Group

96 British Columbia Collision Statistics - police attended injury and fatal collisions
SECTION 12 – Motorcycles in 2006 CollisionsTable 12.14 – Motorcycle drivers and passengers injured and killed by helmet use and location of most severe injuryInjured KilledSafety Injury Total TotalEquipment Location Drivers Passengers Injured % Total Drivers Passengers Killed % TotalHelmet Head 65 3 68 7.77 11 2 13 33.33Face/Nose 23 3 26 2.97 0 0 0 0.00Eye 2 0 2 0.23 0 0 0 0.00
Neck 27 7 34 3.89 3 0 3 7.69Chest 26 2 28 3.20 3 0 3 7.69Back 55 8 63 7.20 0 0 0 0.00Shoulder/Upper Arm 110 6 116 13.26 0 0 0 0.00Elbow/Lower Arm/Hand 111 15 126 14.40 0 0 0 0.00Abdomen/Pelvis 27 2 29 3.31 0 0 0 0.00Hip/Upper Leg 65 3 68 7.77 0 0 0 0.00Knee/Lower Leg/Foot 200 20 220 25.14 1 0 1 2.56Entire Body 57 8 65 7.43 18 0 18 46.15Unknown 23 7 30 3.43 1 0 1 2.56Total 791 84 875 100% 37 2 39 100% No Helmet Head 9 2 11 27.50 1 0 1 50.00Face/Nose 1 0 1 2.50 0 0 0 0.00Eye 1 0 1 2.50 0 0 0 0.00Neck 2 0 2 5.00 0 0 0 0.00Chest 3 0 3 7.50 0 0 0 0.00Back 4 1 5 12.50 0 0 0 0.00Shoulder/Upper Arm 1 1 2 5.00 0 0 0 0.00Elbow/Lower Arm/Hand 4 0 4 10.00 0 0 0 0.00Hip/Upper Leg 2 2 4 10.00 0 0 0 0.00Knee/Lower Leg/Foot 4 0 4 10.00 0 0 0 0.00Entire Body 1 0 1 2.50 1 0 1 50.00Unknown 1 1 2 5.00 0 0 0 0.00Total 33 7 40 100% 2 0 2 100% Unknown Head 15 1 16 9.58 0 0 0 0.00Face/Nose 4 0 4 2.40 0 0 0 0.00Neck 9 0 9 5.39 0 0 0 0.00Chest 6 0 6 3.59 0 0 0 0.00Back 9 0 9 5.39 0 0 0 0.00Shoulder/Upper Arm 21 0 21 12.57 0 0 0 0.00Elbow/Lower Arm/Hand 19 2 21 12.57 0 0 0 0.00Abdomen/Pelvis 3 1 4 2.40 0 0 0 0.00Hip/Upper Leg 12 0 12 7.19 0 0 0 0.00Knee/Lower Leg/Foot 34 12 46 27.54 0 0 0 0.00Entire Body 11 1 12 7.19 2 0 2 100.00Unknown 7 0 7 4.19 0 0 0 0.00Total 150 17 167 100% 2 0 2 100% Note: Includes occupants on parked motorcycle.

British Columbia Collision Statistics - police attended injury and fatal collisions 97
Motorcycles in 2006 Collisions – SECTION 12Table 12.15 – Motorcycle drivers and passengers injured and killed by helmet use and injury type InjuredSafety Injury Total TotalEquipment Type Drivers Passengers Injured % Total Drivers Passengers Killed % TotalHelmet Abrasion 171 22 193 22.06 0 0 0 0.00Bruises 166 20 186 21.26 0 0 0 0.00Lacerations 43 10 53 6.06 1 0 1 2.56Bleeding 50 6 56 6.40 6 0 6 15.38Fracture 201 10 211 24.11 21 1 22 56.41Dislocation 29 1 30 3.43 0 0 0 0.00Burns 3 1 4 0.46 0 0 0 0.00Amputations 1 0 1 0.11 2 0 2 5.13Concussion 27 0 27 3.09 0 0 0 0.00Drowning 1 0 1 0.11 0 0 0 0.00Whiplash 29 5 34 3.89 0 0 0 0.00Other 12 1 13 1.49 5 0 5 12.82Unknown 58 8 66 7.54 2 1 3 7.69Total 791 84 875 100 37 2 39 100 No Helmet Abrasion 5 0 5 12.50 0 0 0 0.00Bruises 5 2 7 17.50 0 0 0 0.00Lacerations 4 3 7 17.50 1 0 1 50.00Bleeding 4 0 4 10.00 0 0 0 0.00Fracture 10 0 10 25.00 1 0 1 50.00Concussion 1 0 1 2.50 0 0 0 0.00Whiplash 2 1 3 7.50 0 0 0 0.00Unknown 2 1 3 7.50 0 0 0 0.00Total 33 7 40 100 2 0 2 100 Unknown Abrasion 31 7 38 22.75 0 0 0 0.00Bruises 32 2 34 20.36 0 0 0 0.00Lacerations 3 2 5 2.99 0 0 0 0.00Bleeding 12 0 12 7.19 1 0 1 50.00Fracture 38 2 40 23.95 1 0 1 50.00Dislocation 6 0 6 3.59 0 0 0 0.00Burns 2 0 2 1.20 0 0 0 0.00Concussion 5 0 5 2.99 0 0 0 0.00Whiplash 5 0 5 2.99 0 0 0 0.00Other 3 0 3 1.80 0 0 0 0.00Unknown 13 4 17 10.18 0 0 0 0.00Total 150 17 167 100 2 0 2 100
Grand Total 974 108 1,082 41 2 43Note: Includes occupants on parked motorcycle.
Killed

98 British Columbia Collision Statistics - police attended injury and fatal collisions
SECTION 12 – Motorcycles in 2006 Collisions
Figure 12.05 – Killed victims as a proportion of total casualties by helmet usage
Note: Includes motorcycle riders and passengers only
4.8%4.3%
0.0%1.0%2.0%3.0%4.0%5.0%6.0%7.0%8.0%9.0%10.0%
Helmet No Helmet
PercentofTot
alVictims
Table 12.16 – Helmet usage by motorcycle drivers and passengersNot Injured InjuredSafety Total % ofEquipment Drivers Passengers Total Drivers Passengers Total Drivers Passengers Total Involved Total InvolvedHelmet 36 6 42 791 84 875 37 2 39 956 79.73No Helmet 4 0 4 33 7 40 2 0 2 46 3.84Unknown 28 0 28 150 17 167 2 0 2 197 16.43Total 68 6 74 974 108 1,082 41 2 43 1,199 100%Note: This report does not include occupants of other vehicles in motorcycle collisions.
Killed
Figure 12.04 – Percent of victims with head injury among helmeted and nonhelmeted motorcycle drivers and passengers
Note: Location of injury includes both head and entire body.
17.94%30.95%
0%5%10%15%20%25%30%35%
Helmet No Helmet
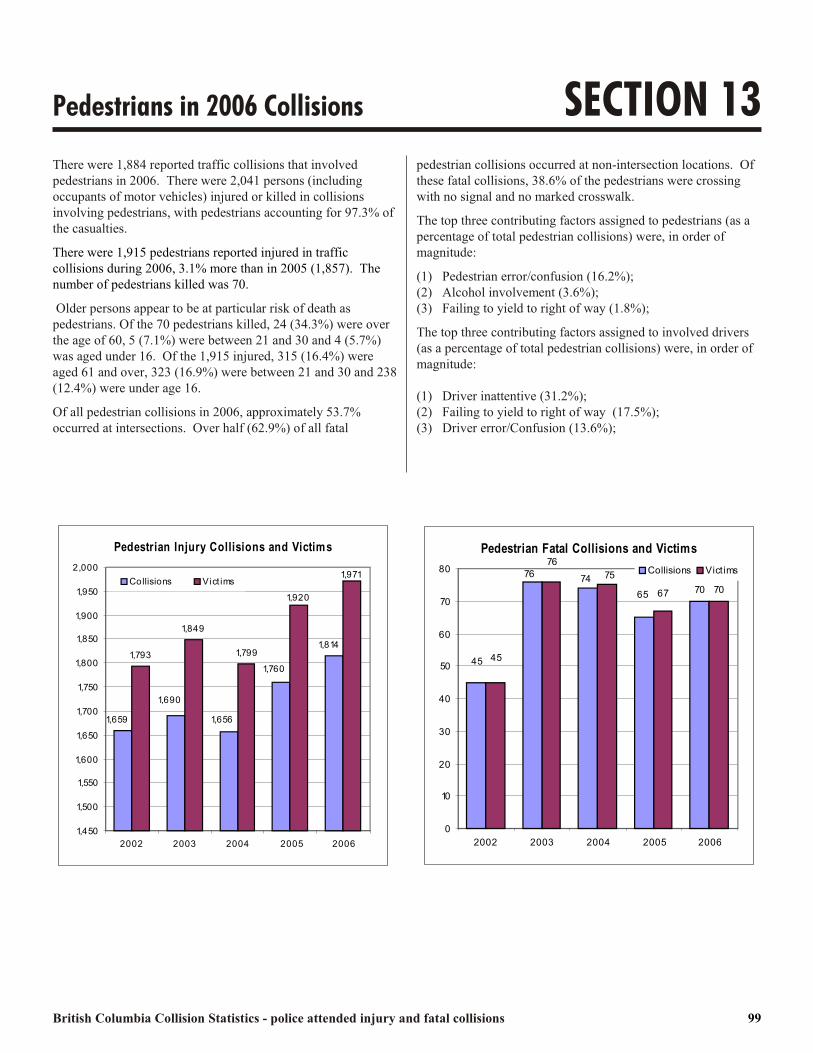
British Columbia Collision Statistics - police attended injury and fatal collisions 99
Pedestrians in 2006 Collisions SECTION 13There were 1,884 reported traffic collisions that involvedpedestrians in 2006. There were 2,041 persons (includingoccupants of motor vehicles) injured or killed in collisionsinvolving pedestrians, with pedestrians accounting for 97.3% ofthe casualties. There were 1,915 pedestrians reported injured in trafficcollisions during 2006, 3.1% more than in 2005 (1,857). Thenumber of pedestrians killed was 70. Older persons appear to be at particular risk of death aspedestrians. Of the 70 pedestrians killed, 24 (34.3%) were overthe age of 60, 5 (7.1%) were between 21 and 30 and 4 (5.7%)was aged under 16. Of the 1,915 injured, 315 (16.4%) wereaged 61 and over, 323 (16.9%) were between 21 and 30 and 238 (12.4%) were under age 16. Of all pedestrian collisions in 2006, approximately 53.7%occurred at intersections. Over half (62.9%) of all fatal
pedestrian collisions occurred at non-intersection locations. Ofthese fatal collisions, 38.6% of the pedestrians were crossingwith no signal and no marked crosswalk. The top three contributing factors assigned to pedestrians (as apercentage of total pedestrian collisions) were, in order ofmagnitude:(1) Pedestrian error/confusion (16.2%);(2) Alcohol involvement (3.6%);(3) Failing to yield to right of way (1.8%); The top three contributing factors assigned to involved drivers(as a percentage of total pedestrian collisions) were, in order ofmagnitude: (1) Driver inattentive (31.2%); (2) Failing to yield to right of way (17.5%); (3) Driver error/Confusion (13.6%);
Pedestrian Injury Collisions and Victims
1,7931,849
1,799 1,8141,760
1,6561,6901,659
1,920 1,971
1,4501,5001,5501,6001,6501,7001,7501,8001,8501,9001,950
2,000
2002 2003 2004 2005 2006
Collisions Vict imsPedestrian Fatal Collisions and Victims
70 70
45
657476
45
677576
01020304050607080
2002 2003 2004 2005 2006
Collisions Vict ims
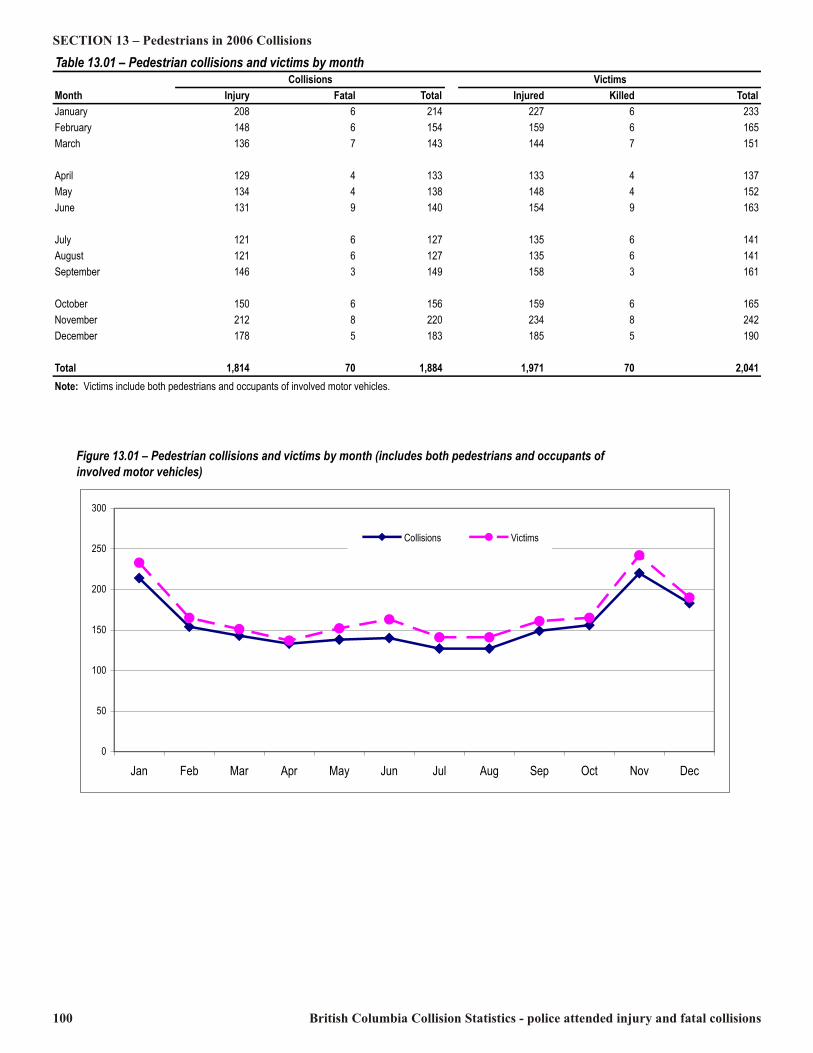
100 British Columbia Collision Statistics - police attended injury and fatal collisions
SECTION 13 – Pedestrians in 2006 CollisionsTable 13.01 – Pedestrian collisions and victims by monthCollisions VictimsMonth Injury Fatal Total Injured Killed TotalJanuary 208 6 214 227 6 233February 148 6 154 159 6 165March 136 7 143 144 7 151April 129 4 133 133 4 137May 134 4 138 148 4 152June 131 9 140 154 9 163July 121 6 127 135 6 141August 121 6 127 135 6 141September 146 3 149 158 3 161October 150 6 156 159 6 165November 212 8 220 234 8 242December 178 5 183 185 5 190Total 1,814 70 1,884 1,971 70 2,041Note: Victims include both pedestrians and occupants of involved motor vehicles.
Figure 13.01 – Pedestrian collisions and victims by month (includes both pedestrians and occupants ofinvolved motor vehicles)
050
100150200250300
Jan Feb Mar Apr May Jun Jul Aug Sep Oct Nov Dec
Collisions Victims

British Columbia Collision Statistics - police attended injury and fatal collisions 101
Pedestrians in 2006 Collisions – SECTION 13Table 13.02 – Pedestrian collisions by pedestrian action and pedestrian locationAt Intersection Not at Intersection Unknown TotalPedestrian Action Injury Fatal Total Injury Fatal Total Injury Fatal Total CollisionsCrossing-No Signal No Marked Crosswalk 136 5 141 265 17 282 0 0 0 423Crossing with Signal 392 2 394 8 0 8 2 0 2 404Crossing - No Signal- Marked Crosswalk 200 4 204 35 0 35 0 0 0 239Crossing Against Signal 110 5 115 7 0 7 1 0 1 123Standing/Walking on Sidewalk 28 0 28 71 2 73 3 0 3 104Emerging from from/behind parked vehicle 5 0 5 87 3 90 2 0 2 97Walking along Highway-with Traffic 8 1 9 48 3 51 0 0 0 60Walking along Highway - Against Traffic 6 0 6 32 6 38 0 0 0 44Working in Roadway 8 1 9 26 1 27 2 0 2 38Adult Getting on/Off Vehicle 3 0 3 18 1 19 1 0 1 23Playing in Roadway 1 0 1 13 0 13 2 0 2 16Pushing/Working on a Vehicle 0 0 0 7 2 9 0 0 0 9Child Getting on/Off School Bus 1 0 1 2 0 2 0 0 0 3Other 61 2 63 130 7 137 8 1 9 209Unknown 30 2 32 22 2 24 33 3 36 92Total 989 22 1,011 771 44 815 54 4 58 1,884Figure 13.02 – Pedestrian collisions by collision location
At Intersection54%Not at Intersection43%
Unknown3%
Figure 13.03 – Pedestrian collisions by day of week
Note: Includes both injury and fatal collisions. 0
50100150200250300350
Sun Mon Tue Wed Thu Fri Sat

102 British Columbia Collision Statistics - police attended injury and fatal collisions
SECTION 13 – Pedestrians in 2006 CollisionsTable 13.03 – Pedestrian injury collisions by day of week and hour of collision % ofTime Sunday Monday Tuesday Wednesday Thursday Friday Saturday Total Total0000-0059 10 0 3 6 3 4 7 33 1.820100-0159 7 2 0 1 3 2 8 23 1.270200-0259 10 2 0 2 2 5 13 34 1.870300-0359 5 0 2 0 0 0 1 8 0.440400-0459 3 0 0 1 0 0 5 9 0.500500-0559 1 1 0 3 2 5 3 15 0.830600-0659 1 8 8 7 3 5 1 33 1.820700-0759 3 7 14 9 14 10 3 60 3.310800-0859 3 21 10 19 24 17 4 98 5.400900-0959 3 11 7 9 13 16 3 62 3.421000-1059 4 15 18 10 11 21 13 92 5.071100-1159 8 12 17 15 13 14 13 92 5.071200-1259 11 7 15 19 12 18 15 97 5.351300-1359 4 15 21 18 9 15 15 97 5.351400-1459 8 15 19 18 19 16 7 102 5.621500-1559 8 22 29 21 30 18 4 132 7.281600-1659 8 13 24 22 18 20 12 117 6.451700-1759 22 18 26 30 26 25 10 157 8.651800-1859 16 17 24 15 20 22 17 131 7.221900-1959 15 12 21 12 20 12 16 108 5.952000-2059 16 14 12 16 14 15 6 93 5.132100-2159 7 7 12 12 15 22 14 89 4.912200-2259 7 7 6 11 8 9 6 54 2.982300-2359 3 4 2 4 6 16 7 42 2.32Unknown 5 5 3 4 4 10 5 36 1.98Total 188 235 293 284 289 317 208 1,814 100%

British Columbia Collision Statistics - police attended injury and fatal collisions 103
Pedestrians in 2006 Collisions – SECTION 13Table 13.04 – Pedestrian fatal collisions by day of week and hour of collision % ofTime Sunday Monday Tuesday Wednesday Thursday Friday Saturday Total Total0000-0059 2 2 0 1 0 0 1 6 8.570300-0359 1 1 1 0 0 0 1 4 5.710400-0459 0 1 0 0 0 0 0 1 1.430500-0559 0 0 1 0 0 0 0 1 1.430700-0759 1 0 0 2 0 0 0 3 4.290800-0859 0 1 0 0 0 1 0 2 2.860900-0959 0 1 1 2 1 0 3 8 11.431000-1059 0 0 1 0 0 0 0 1 1.431100-1159 0 1 0 1 1 0 0 3 4.291200-1259 0 0 1 0 2 0 2 5 7.141300-1359 1 0 0 0 0 0 0 1 1.431500-1559 0 0 2 1 1 1 1 6 8.571600-1659 0 0 0 1 0 1 1 3 4.291700-1759 2 1 0 0 0 2 0 5 7.141800-1859 1 0 1 1 2 1 1 7 10.001900-1959 0 0 0 0 2 1 0 3 4.292000-2059 2 1 0 0 0 0 0 3 4.292200-2259 1 2 0 0 1 1 0 5 7.142300-2359 0 1 0 1 0 0 0 2 2.86Unknown 0 0 0 1 0 0 0 1 1.43Total 11 12 8 11 10 8 10 70 100%

104 British Columbia Collision Statistics - police attended injury and fatal collisions
SECTION 13 – Pedestrians in 2006 Collisions Figure 13.04 – Pedestrians injured by gender and age group
050
100150200250300350
Under 16 16 – 25 26 – 35 36 – 55 56+
Male FemaleTable 13.05 – Pedestrian victims injured by age and gender % ofAge Male Female Unknown Total Total1 1 4 0 5 0.262 4 2 0 6 0.313 1 5 0 6 0.314 2 2 0 4 0.215 1 3 0 4 0.216 6 1 0 7 0.377 7 6 0 13 0.688 4 8 0 12 0.639 6 2 0 8 0.4210 9 5 1 14 0.7311 9 5 0 14 0.7312 16 12 0 28 1.4613 12 14 0 26 1.3614 16 21 0 37 1.9315 26 28 0 54 2.8216 24 25 0 49 2.5617 30 24 0 54 2.8218 14 23 0 37 1.9319 26 26 0 52 2.7220 17 30 0 47 2.4521 20 23 0 43 2.2522 24 15 0 39 2.0423 18 25 0 43 2.2524 17 16 0 33 1.7225 20 15 0 35 1.8326-30 65 65 0 130 6.7931-35 64 62 0 126 6.5836-40 60 51 0 111 5.8041-45 88 60 0 148 7.7346-50 82 50 0 132 6.8951-55 57 62 0 119 6.2156-60 42 36 0 78 4.0761-65 35 38 0 73 3.8166-70 33 20 0 53 2.7771-75 34 27 1 61 3.1976-80 26 29 0 55 2.8781-85 17 20 0 37 1.9386-90 15 8 0 23 1.2091-95 2 2 0 4 0.2195+ 6 3 0 9 0.47Unknown 32 35 17 67 3.50Total 988 908 19 1,915 100%
Figure 13.05. – Pedestrians killed by gender and age group
0246810121416
Under 16 16 – 25 26 – 35 36 – 55 56+
Male Female
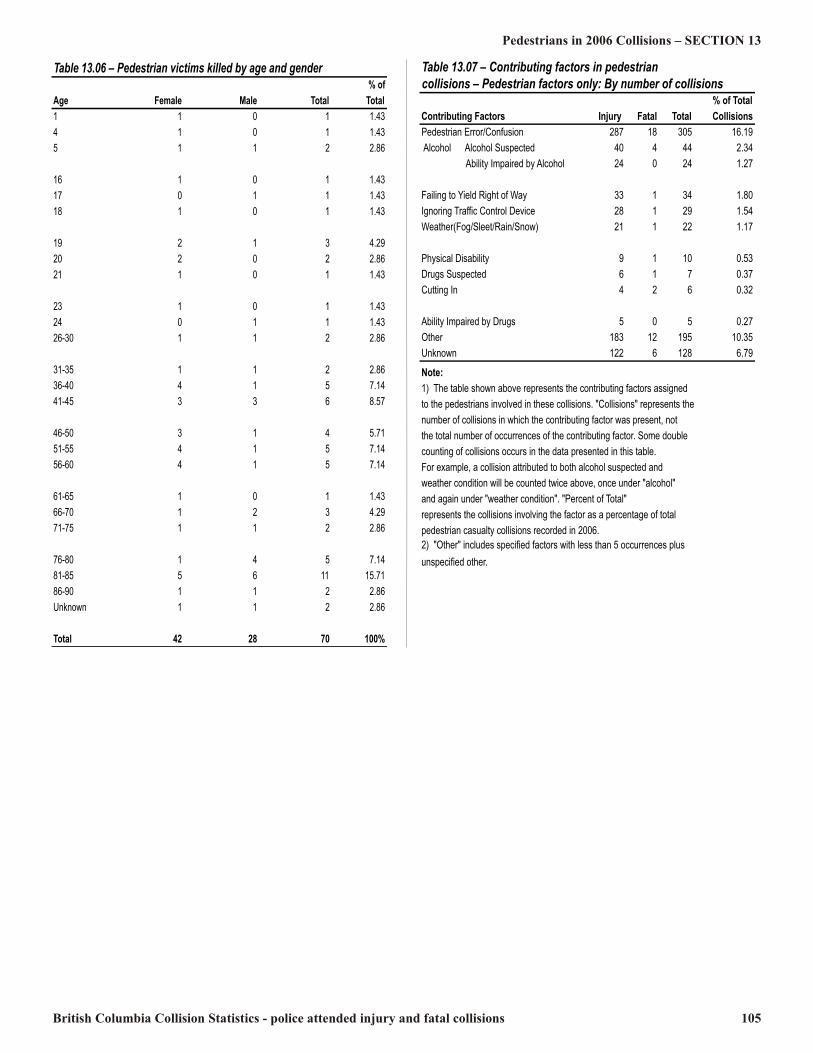
British Columbia Collision Statistics - police attended injury and fatal collisions 105
Pedestrians in 2006 Collisions – SECTION 13Table 13.06 – Pedestrian victims killed by age and gender % ofAge Female Male Total Total1 1 0 1 1.434 1 0 1 1.435 1 1 2 2.8616 1 0 1 1.4317 0 1 1 1.4318 1 0 1 1.4319 2 1 3 4.2920 2 0 2 2.8621 1 0 1 1.4323 1 0 1 1.4324 0 1 1 1.4326-30 1 1 2 2.8631-35 1 1 2 2.8636-40 4 1 5 7.1441-45 3 3 6 8.5746-50 3 1 4 5.7151-55 4 1 5 7.1456-60 4 1 5 7.1461-65 1 0 1 1.4366-70 1 2 3 4.2971-75 1 1 2 2.8676-80 1 4 5 7.1481-85 5 6 11 15.7186-90 1 1 2 2.86Unknown 1 1 2 2.86Total 42 28 70 100%
Table 13.07 – Contributing factors in pedestrian collisions – Pedestrian factors only: By number of collisions % of TotalContributing Factors Injury Fatal Total CollisionsPedestrian Error/Confusion 287 18 305 16.19 Alcohol Alcohol Suspected 40 4 44 2.34 Ability Impaired by Alcohol 24 0 24 1.27Failing to Yield Right of Way 33 1 34 1.80Ignoring Traffic Control Device 28 1 29 1.54Weather(Fog/Sleet/Rain/Snow) 21 1 22 1.17Physical Disability 9 1 10 0.53Drugs Suspected 6 1 7 0.37Cutting In 4 2 6 0.32Ability Impaired by Drugs 5 0 5 0.27Other 183 12 195 10.35Unknown 122 6 128 6.79Note:1) The table shown above represents the contributing factors assignedto the pedestrians involved in these collisions. "Collisions" represents the number of collisions in which the contributing factor was present, notthe total number of occurrences of the contributing factor. Some doublecounting of collisions occurs in the data presented in this table.For example, a collision attributed to both alcohol suspected and weather condition will be counted twice above, once under "alcohol" and again under "weather condition". "Percent of Total" represents the collisions involving the factor as a percentage of totalpedestrian casualty collisions recorded in 2006.2) "Other" includes specified factors with less than 5 occurrences plusunspecified other.

106 British Columbia Collision Statistics - police attended injury and fatal collisions
SECTION 13 – Pedestrians in 2006 CollisionsTable 13.08 – Contributing factors in pedestrian collisions – Other driver factors only: By number of collisions % ofContributing Factors Injury Fatal Total TotalDriver Inattentive 586 9 595 31.58Failing to Yield Right of Way 326 4 330 17.52Driver Error/Confusion 249 7 256 13.59Weather(Fog/Sleet/Rain/Snow) 209 5 214 11.36Backing Unsafely 91 1 92 4.88Road Condition (Ice/Snow/Slush/Water) 89 2 91 4.83Pedestrian Error/Confusion 67 5 72 3.82Alcohol Ability Impaired by Alcohol 33 3 36 1.91 Alcohol Suspected 32 2 34 1.80Sunlight Glare 61 3 64 3.40Ignoring Traffic Control Device 57 1 58 3.08Speed Exceeding Speed Limit 33 0 33 1.75 Driving too Fast For Conditions 18 5 23 1.22 Excessive Speed 1 0 1 0.05Driver Internal/External Distraction 49 4 53 2.81Improper Turning 37 0 37 1.96Avoiding Veh/Ped/Cycle 26 5 31 1.65Site Line Obstruction 23 2 25 1.33Artificial Glare 16 1 17 0.90Ignoring Officer/Flagman/Guard 15 1 16 0.85Road/Intersection Design 12 0 12 0.64Other 296 25 321 17.04Unknown 204 9 213 11.31Note:1) The table shown above represents the contributing factors assignedto the pedestrians involved in these collisions. "Collisions" represents the number of collisions in which the contributing factor was present, notthe total number of occurrences of the contributing factor. Some doublecounting of collisions occurs in the data presented in this table.For example, a collision attributed to both alcohol suspected and weather condition will be counted twice above, once under "alcohol" and again under "weather condition". "Percent of Total" represents the collisions involving the factor as a percentage of totalpedestrian casualty collisions recorded in 2006.2) "Other" includes specified factors with less than 10 occurrences plusunspecified other.3) "Excessive Speed" means driving 40 km/h or more over the speed limit.
Table 13.09 – Pedestrians injured and killed by location of injuryInjury Location Injured Killed TotalKnee/Lower Leg/Foot 566 1 567Head 312 41 353Hip/Upper Leg 250 1 251Elbow/Lower Arm/Hand 169 0 169Shoulder/Upper Arm 114 0 114Back 104 0 104Entire Body 65 14 79Face/Nose 53 0 53Abdomen/Pelvis 46 4 50Neck 47 0 47Chest 39 6 45Eye 8 0 8Unknown 142 3 145Total 1,915 70 1,985
Table 13.10 – Pedestrians injured and killed by type of injuryInjury Type Injured Killed TotalBruises 744 2 746Fracture 278 27 305Abrasion 289 1 290Lacerations 110 2 112Bleeding 83 20 103Concussion 68 6 74Whiplash 60 0 60Dislocation 20 2 22Amputations 2 1 3Burns 2 0 2Other 18 4 22Unknown 241 5 246Total 1,915 70 1,985
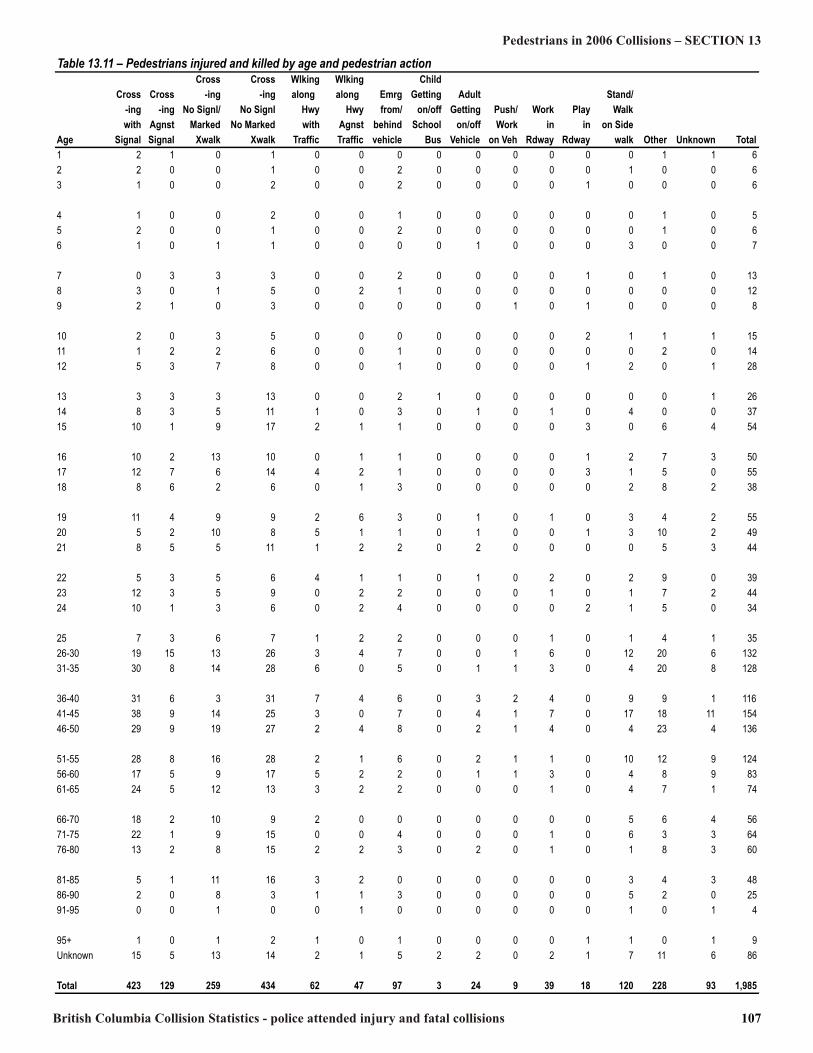
British Columbia Collision Statistics - police attended injury and fatal collisions 107
Pedestrians in 2006 Collisions – SECTION 13Table 13.11 – Pedestrians injured and killed by age and pedestrian action Cross Cross Wlking Wlking Child Cross Cross -ing -ing along along Emrg Getting Adult Stand/ -ing -ing No Signl/ No Signl Hwy Hwy from/ on/off Getting Push/ Work Play Walk with Agnst Marked No Marked with Agnst behind School on/off Work in in on Side Age Signal Signal Xwalk Xwalk Traffic Traffic vehicle Bus Vehicle on Veh Rdway Rdway walk Other Unknown Total1 2 1 0 1 0 0 0 0 0 0 0 0 0 1 1 62 2 0 0 1 0 0 2 0 0 0 0 0 1 0 0 63 1 0 0 2 0 0 2 0 0 0 0 1 0 0 0 64 1 0 0 2 0 0 1 0 0 0 0 0 0 1 0 55 2 0 0 1 0 0 2 0 0 0 0 0 0 1 0 66 1 0 1 1 0 0 0 0 1 0 0 0 3 0 0 77 0 3 3 3 0 0 2 0 0 0 0 1 0 1 0 138 3 0 1 5 0 2 1 0 0 0 0 0 0 0 0 129 2 1 0 3 0 0 0 0 0 1 0 1 0 0 0 810 2 0 3 5 0 0 0 0 0 0 0 2 1 1 1 1511 1 2 2 6 0 0 1 0 0 0 0 0 0 2 0 1412 5 3 7 8 0 0 1 0 0 0 0 1 2 0 1 2813 3 3 3 13 0 0 2 1 0 0 0 0 0 0 1 2614 8 3 5 11 1 0 3 0 1 0 1 0 4 0 0 3715 10 1 9 17 2 1 1 0 0 0 0 3 0 6 4 5416 10 2 13 10 0 1 1 0 0 0 0 1 2 7 3 5017 12 7 6 14 4 2 1 0 0 0 0 3 1 5 0 5518 8 6 2 6 0 1 3 0 0 0 0 0 2 8 2 3819 11 4 9 9 2 6 3 0 1 0 1 0 3 4 2 5520 5 2 10 8 5 1 1 0 1 0 0 1 3 10 2 4921 8 5 5 11 1 2 2 0 2 0 0 0 0 5 3 4422 5 3 5 6 4 1 1 0 1 0 2 0 2 9 0 3923 12 3 5 9 0 2 2 0 0 0 1 0 1 7 2 4424 10 1 3 6 0 2 4 0 0 0 0 2 1 5 0 3425 7 3 6 7 1 2 2 0 0 0 1 0 1 4 1 3526-30 19 15 13 26 3 4 7 0 0 1 6 0 12 20 6 13231-35 30 8 14 28 6 0 5 0 1 1 3 0 4 20 8 12836-40 31 6 3 31 7 4 6 0 3 2 4 0 9 9 1 11641-45 38 9 14 25 3 0 7 0 4 1 7 0 17 18 11 15446-50 29 9 19 27 2 4 8 0 2 1 4 0 4 23 4 13651-55 28 8 16 28 2 1 6 0 2 1 1 0 10 12 9 12456-60 17 5 9 17 5 2 2 0 1 1 3 0 4 8 9 8361-65 24 5 12 13 3 2 2 0 0 0 1 0 4 7 1 7466-70 18 2 10 9 2 0 0 0 0 0 0 0 5 6 4 5671-75 22 1 9 15 0 0 4 0 0 0 1 0 6 3 3 6476-80 13 2 8 15 2 2 3 0 2 0 1 0 1 8 3 6081-85 5 1 11 16 3 2 0 0 0 0 0 0 3 4 3 4886-90 2 0 8 3 1 1 3 0 0 0 0 0 5 2 0 2591-95 0 0 1 0 0 1 0 0 0 0 0 0 1 0 1 495+ 1 0 1 2 1 0 1 0 0 0 0 1 1 0 1 9Unknown 15 5 13 14 2 1 5 2 2 0 2 1 7 11 6 86Total 423 129 259 434 62 47 97 3 24 9 39 18 120 228 93 1,985

108 British Columbia Collision Statistics - police attended injury and fatal collisions
SECTION 13 – Pedestrians in 2006 Collisions

British Columbia Collision Statistics - police attended injury and fatal collisions 109
Bicycles in 2006 Collisions SECTION 14A bicycle collision is reportable in British Columbia if it resultsin injury or death and involves at least one motor vehicle. There were 1,013 bicycle collisions reported in 2006, a decrease of 2.9% over 2005 collisions. These collisions resulted in 1,041 casualties (including occupants of motor vehicles). Of these1,041 victims, 980 were injured bicycle drivers, and 12 werebicycle drivers killed. Six of the 12 bicycle drivers killed during 2006 were notwearing a bicycle helmet. Ten bicycle drivers killed were male. Males represented approximately 74.6% of the bicycle driversinjured. Of 980 bicycle drivers injured, 144 (14.7%) wereunder age 16, and 51 (5.2%) over 60.Of all injured bicycle drivers, about 46.3% (454) of them werewearing helmets, 37.0% (363) were not wearing helmets and16.6% (163) were unknown as to helmet use. BC requirescyclists of all ages to wear a helmet. Among non-helmeted injury victims, 22.9% suffered headinjuries or injuries to the entire body, while 15.4% of thehelmeted injury victims had head injuries or injuries to entirebody. The five top contributing factors assigned to bicycle drivers (asa percentage of total bicycle collisions) were, in order ofmagnitude:
(1) Driver inattentive (21.1%); (2) Driving on the wrong side of the road (12.6%); (3) Driver error/confusion (12.3%); (4) Failing to yield to right of way (10.0%); (5) Ignoring traffic control device (6.8%).The five top contributing factors assigned to other drivers (as apercentage of total bicycle collisions) were, in order ofmagnitude:(1) Driver inattentive (25.1%); (2) Failing to yield to right of way (14.5%); (3) Driver error/Confusion (11.7%); (4) Improper turning (4.5%); (5) Site Line obstruction (4.4%).More than half (57.1%) of all bicycle collisions took place atintersections. The most common configuration was intersection– right angle, which accounted for 32.5% of bicycle collisions. The road surface condition was dry for 79.9% of bicyclecollisions and 74.2% occurred in daylight. The highestfrequency collision time period for bicycle collisions is 3:00 pmto 6:00 pm. There were 296 (29.2%) bicycle collisions that took place between these hours.
B icyc le In ju r y C o l l is io n s an d V ic tim s
9 6 31,0 18
1,0 6 51,0 2 9
9 3 3
1,0 3 61,0 0 2
8 9 1
1,0 0 1
9 0 8
8 0 08 509 0 09 50
1,0 0 01,0 501,10 0
2 0 0 2 2 0 0 3 2 0 0 4 2 0 0 5 2 0 0 6
C o ll is io ns V i ct i m sB icycle F ata l C o l l i s io n s an d V ic tim s
6 7 7 7
12
6 7 7 7
12
02468
101214
2 0 0 2 2 0 0 3 2 0 0 4 2 0 0 5 2 0 0 6
C o ll is io ns V i ct i m s
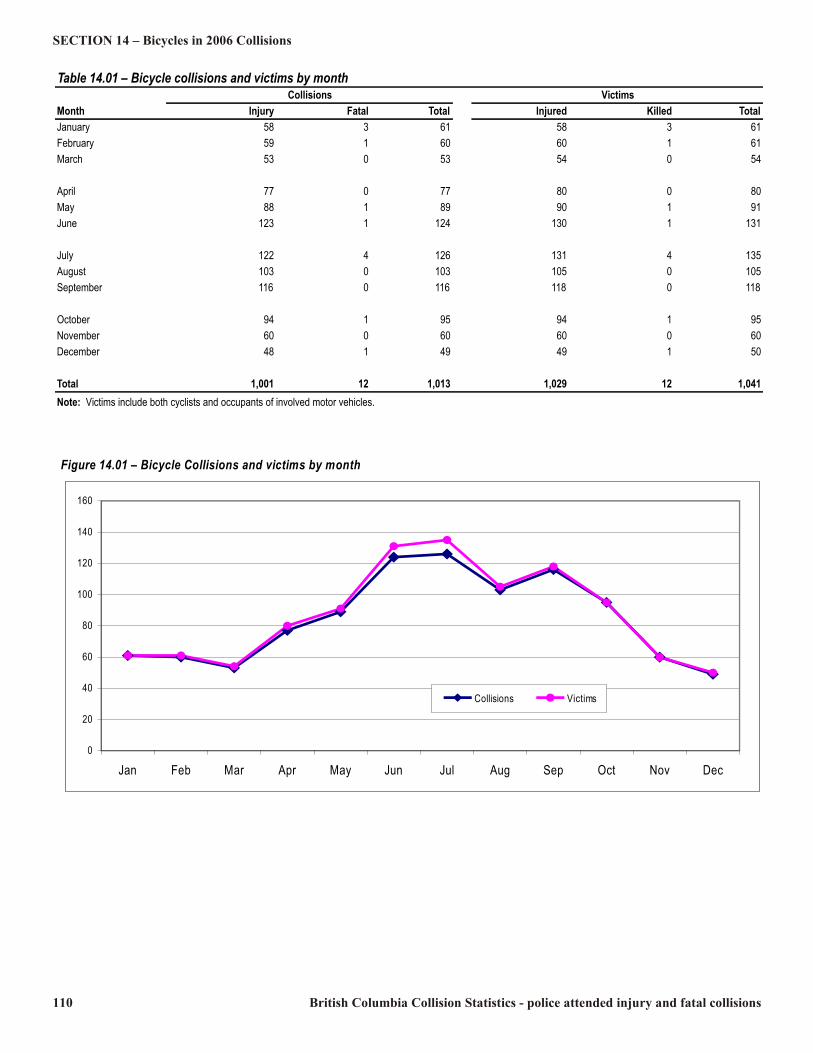
110 British Columbia Collision Statistics - police attended injury and fatal collisions
SECTION 14 – Bicycles in 2006 CollisionsTable 14.01 – Bicycle collisions and victims by monthCollisions VictimsMonth Injury Fatal Total Injured Killed TotalJanuary 58 3 61 58 3 61February 59 1 60 60 1 61March 53 0 53 54 0 54April 77 0 77 80 0 80May 88 1 89 90 1 91June 123 1 124 130 1 131July 122 4 126 131 4 135August 103 0 103 105 0 105September 116 0 116 118 0 118October 94 1 95 94 1 95November 60 0 60 60 0 60December 48 1 49 49 1 50Total 1,001 12 1,013 1,029 12 1,041Note: Victims include both cyclists and occupants of involved motor vehicles.Figure 14.01 – Bicycle Collisions and victims by month
020406080
100120140160
Jan Feb Mar Apr May Jun Jul Aug Sep Oct Nov DecCollisions Victims
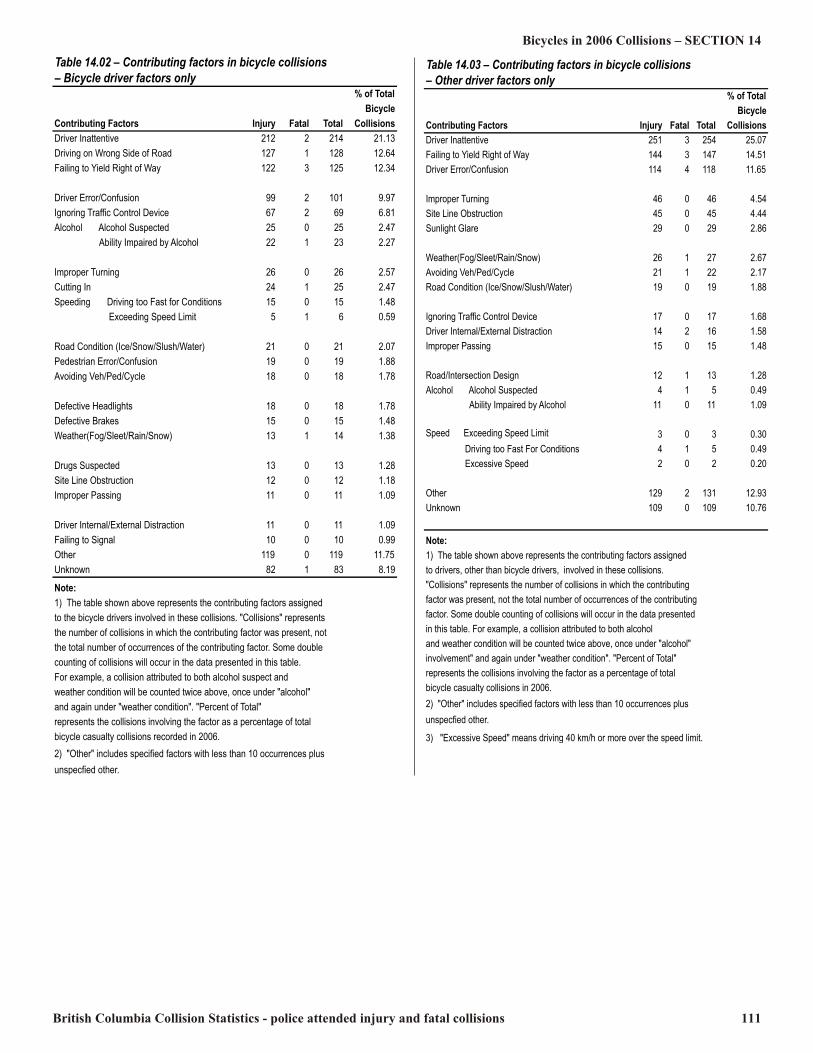
British Columbia Collision Statistics - police attended injury and fatal collisions 111
Bicycles in 2006 Collisions – SECTION 14Table 14.02 – Contributing factors in bicycle collisions– Bicycle driver factors only % of TotalBicycleContributing Factors Injury Fatal Total CollisionsDriver Inattentive 212 2 214 21.13Driving on Wrong Side of Road 127 1 128 12.64Failing to Yield Right of Way 122 3 125 12.34Driver Error/Confusion 99 2 101 9.97Ignoring Traffic Control Device 67 2 69 6.81Alcohol Alcohol Suspected 25 0 25 2.47 Ability Impaired by Alcohol 22 1 23 2.27Improper Turning 26 0 26 2.57Cutting In 24 1 25 2.47Speeding Driving too Fast for Conditions 15 0 15 1.48 Exceeding Speed Limit 5 1 6 0.59Road Condition (Ice/Snow/Slush/Water) 21 0 21 2.07Pedestrian Error/Confusion 19 0 19 1.88Avoiding Veh/Ped/Cycle 18 0 18 1.78Defective Headlights 18 0 18 1.78Defective Brakes 15 0 15 1.48Weather(Fog/Sleet/Rain/Snow) 13 1 14 1.38Drugs Suspected 13 0 13 1.28Site Line Obstruction 12 0 12 1.18Improper Passing 11 0 11 1.09Driver Internal/External Distraction 11 0 11 1.09Failing to Signal 10 0 10 0.99Other 119 0 119 11.75Unknown 82 1 83 8.19Note:1) The table shown above represents the contributing factors assignedto the bicycle drivers involved in these collisions. "Collisions" representsthe number of collisions in which the contributing factor was present, notthe total number of occurrences of the contributing factor. Some doublecounting of collisions will occur in the data presented in this table.For example, a collision attributed to both alcohol suspect and weather condition will be counted twice above, once under "alcohol" and again under "weather condition". "Percent of Total" represents the collisions involving the factor as a percentage of totalbicycle casualty collisions recorded in 2006.2) "Other" includes specified factors with less than 10 occurrences plusunspecfied other.
Table 14.03 – Contributing factors in bicycle collisions– Other driver factors only % of TotalBicycleContributing Factors Injury Fatal Total CollisionsDriver Inattentive 251 3 254 25.07Failing to Yield Right of Way 144 3 147 14.51Driver Error/Confusion 114 4 118 11.65Improper Turning 46 0 46 4.54Site Line Obstruction 45 0 45 4.44Sunlight Glare 29 0 29 2.86Weather(Fog/Sleet/Rain/Snow) 26 1 27 2.67Avoiding Veh/Ped/Cycle 21 1 22 2.17Road Condition (Ice/Snow/Slush/Water) 19 0 19 1.88Ignoring Traffic Control Device 17 0 17 1.68Driver Internal/External Distraction 14 2 16 1.58Improper Passing 15 0 15 1.48Road/Intersection Design 12 1 13 1.28Alcohol Alcohol Suspected 4 1 5 0.49 Ability Impaired by Alcohol 11 0 11 1.09Speed Exceeding Speed Limit 3 0 3 0.30 Driving too Fast For Conditions 4 1 5 0.49 Excessive Speed 2 0 2 0.20Other 129 2 131 12.93Unknown 109 0 109 10.76Note:1) The table shown above represents the contributing factors assignedto drivers, other than bicycle drivers, involved in these collisions."Collisions" represents the number of collisions in which the contributingfactor was present, not the total number of occurrences of the contributingfactor. Some double counting of collisions will occur in the data presentedin this table. For example, a collision attributed to both alcohol and weather condition will be counted twice above, once under "alcohol" involvement" and again under "weather condition". "Percent of Total" represents the collisions involving the factor as a percentage of totalbicycle casualty collisions in 2006.2) "Other" includes specified factors with less than 10 occurrences plusunspecfied other.3) "Excessive Speed" means driving 40 km/h or more over the speed limit.
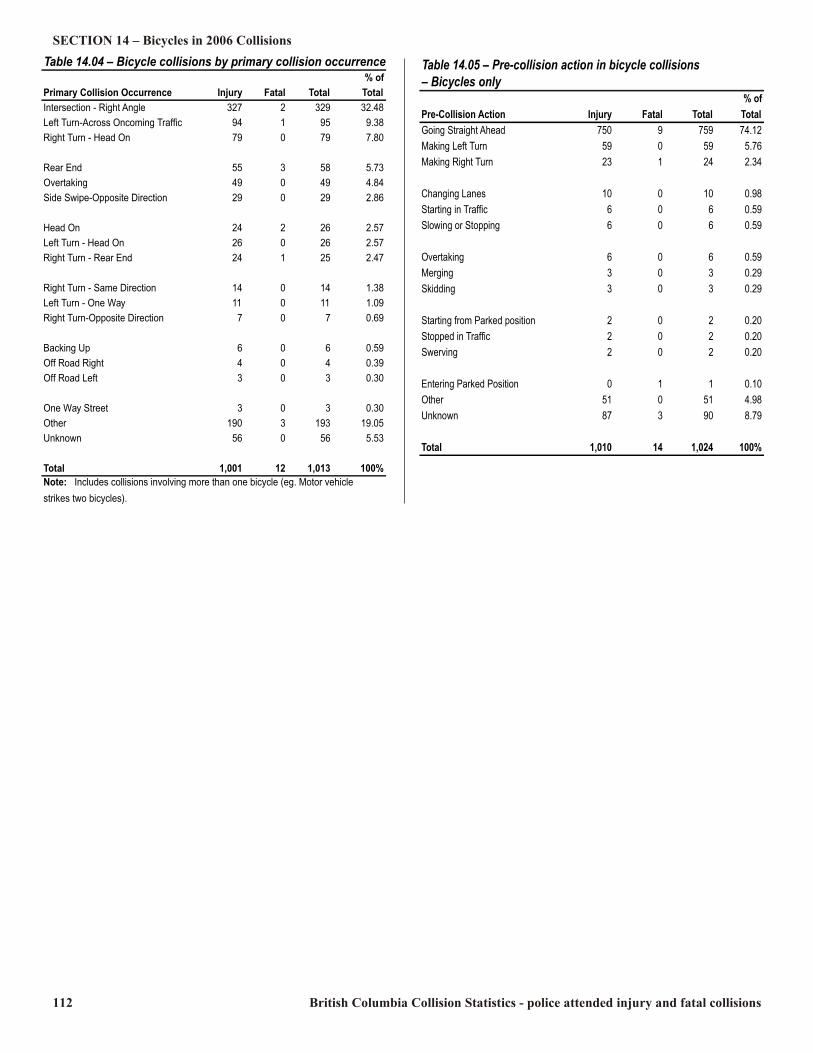
112 British Columbia Collision Statistics - police attended injury and fatal collisions
SECTION 14 – Bicycles in 2006 CollisionsTable 14.04 – Bicycle collisions by primary collision occurrence% ofPrimary Collision Occurrence Injury Fatal Total TotalIntersection - Right Angle 327 2 329 32.48Left Turn-Across Oncoming Traffic 94 1 95 9.38Right Turn - Head On 79 0 79 7.80Rear End 55 3 58 5.73Overtaking 49 0 49 4.84Side Swipe-Opposite Direction 29 0 29 2.86Head On 24 2 26 2.57Left Turn - Head On 26 0 26 2.57Right Turn - Rear End 24 1 25 2.47Right Turn - Same Direction 14 0 14 1.38Left Turn - One Way 11 0 11 1.09Right Turn-Opposite Direction 7 0 7 0.69Backing Up 6 0 6 0.59Off Road Right 4 0 4 0.39Off Road Left 3 0 3 0.30One Way Street 3 0 3 0.30Other 190 3 193 19.05Unknown 56 0 56 5.53Total 1,001 12 1,013 100%Note: Includes collisions involving more than one bicycle (eg. Motor vehiclestrikes two bicycles).
Table 14.05 – Pre-collision action in bicycle collisions – Bicycles only % ofPre-Collision Action Injury Fatal Total TotalGoing Straight Ahead 750 9 759 74.12Making Left Turn 59 0 59 5.76Making Right Turn 23 1 24 2.34Changing Lanes 10 0 10 0.98Starting in Traffic 6 0 6 0.59Slowing or Stopping 6 0 6 0.59Overtaking 6 0 6 0.59Merging 3 0 3 0.29Skidding 3 0 3 0.29Starting from Parked position 2 0 2 0.20Stopped in Traffic 2 0 2 0.20Swerving 2 0 2 0.20Entering Parked Position 0 1 1 0.10Other 51 0 51 4.98Unknown 87 3 90 8.79Total 1,010 14 1,024 100%
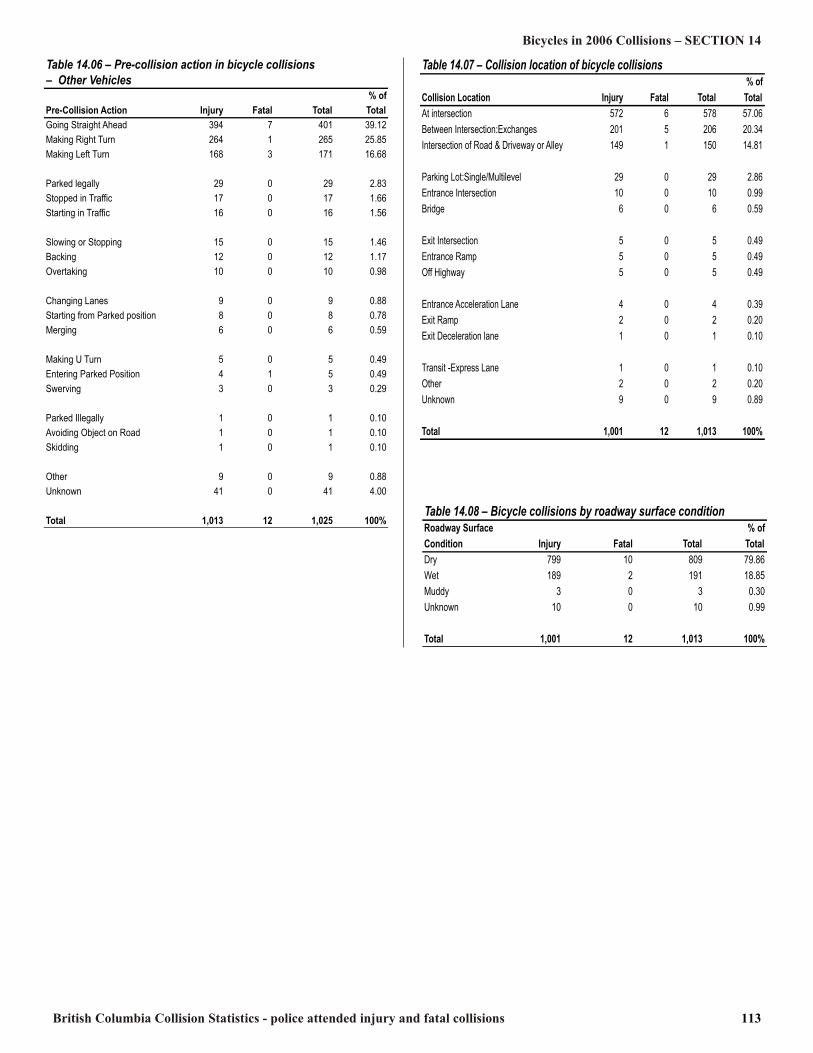
British Columbia Collision Statistics - police attended injury and fatal collisions 113
Bicycles in 2006 Collisions – SECTION 14Table 14.06 – Pre-collision action in bicycle collisions – Other Vehicles % ofPre-Collision Action Injury Fatal Total TotalGoing Straight Ahead 394 7 401 39.12Making Right Turn 264 1 265 25.85Making Left Turn 168 3 171 16.68Parked legally 29 0 29 2.83Stopped in Traffic 17 0 17 1.66Starting in Traffic 16 0 16 1.56Slowing or Stopping 15 0 15 1.46Backing 12 0 12 1.17Overtaking 10 0 10 0.98Changing Lanes 9 0 9 0.88Starting from Parked position 8 0 8 0.78Merging 6 0 6 0.59Making U Turn 5 0 5 0.49Entering Parked Position 4 1 5 0.49Swerving 3 0 3 0.29Parked Illegally 1 0 1 0.10Avoiding Object on Road 1 0 1 0.10Skidding 1 0 1 0.10Other 9 0 9 0.88Unknown 41 0 41 4.00Total 1,013 12 1,025 100%
Table 14.07 – Collision location of bicycle collisions % ofCollision Location Injury Fatal Total TotalAt intersection 572 6 578 57.06Between Intersection:Exchanges 201 5 206 20.34Intersection of Road & Driveway or Alley 149 1 150 14.81Parking Lot:Single/Multilevel 29 0 29 2.86Entrance Intersection 10 0 10 0.99Bridge 6 0 6 0.59Exit Intersection 5 0 5 0.49Entrance Ramp 5 0 5 0.49Off Highway 5 0 5 0.49Entrance Acceleration Lane 4 0 4 0.39Exit Ramp 2 0 2 0.20Exit Deceleration lane 1 0 1 0.10Transit -Express Lane 1 0 1 0.10Other 2 0 2 0.20Unknown 9 0 9 0.89Total 1,001 12 1,013 100%
Table 14.08 – Bicycle collisions by roadway surface conditionRoadway Surface % ofCondition Injury Fatal Total TotalDry 799 10 809 79.86Wet 189 2 191 18.85Muddy 3 0 3 0.30Unknown 10 0 10 0.99Total 1,001 12 1,013 100%
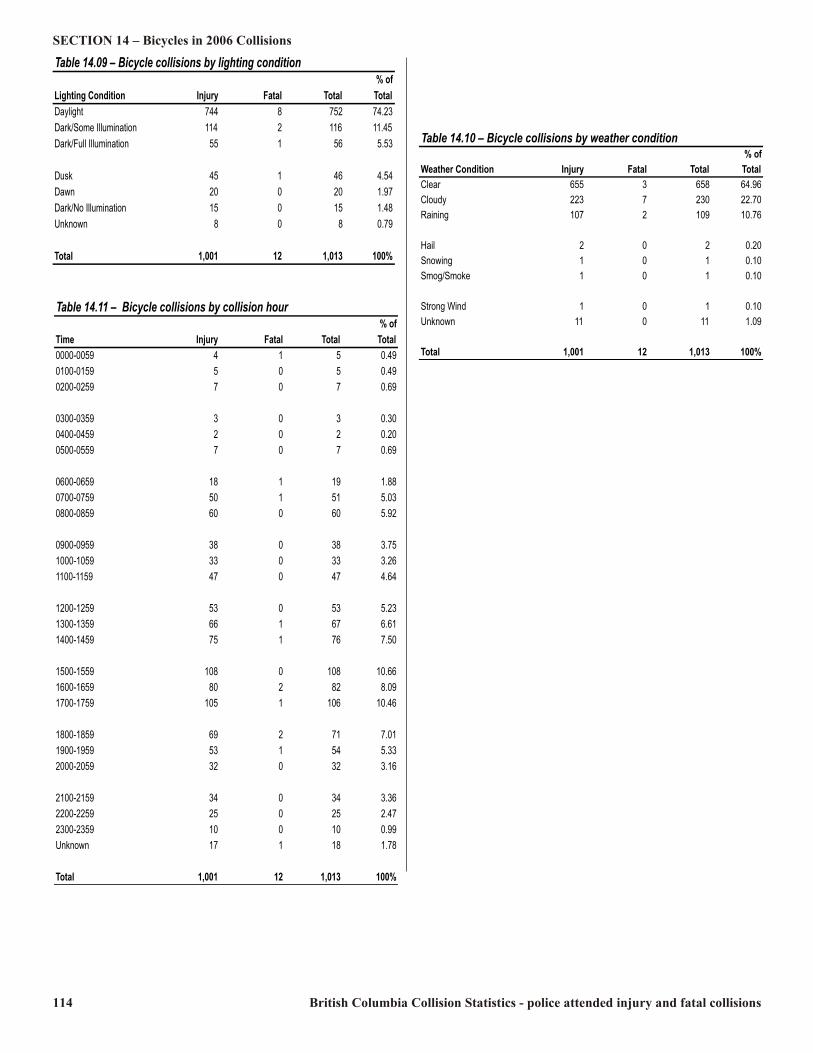
114 British Columbia Collision Statistics - police attended injury and fatal collisions
SECTION 14 – Bicycles in 2006 CollisionsTable 14.09 – Bicycle collisions by lighting condition % ofLighting Condition Injury Fatal Total TotalDaylight 744 8 752 74.23Dark/Some Illumination 114 2 116 11.45Dark/Full Illumination 55 1 56 5.53Dusk 45 1 46 4.54Dawn 20 0 20 1.97Dark/No Illumination 15 0 15 1.48Unknown 8 0 8 0.79Total 1,001 12 1,013 100%
Table 14.10 – Bicycle collisions by weather condition % ofWeather Condition Injury Fatal Total TotalClear 655 3 658 64.96Cloudy 223 7 230 22.70Raining 107 2 109 10.76Hail 2 0 2 0.20Snowing 1 0 1 0.10Smog/Smoke 1 0 1 0.10Strong Wind 1 0 1 0.10Unknown 11 0 11 1.09Total 1,001 12 1,013 100%
Table 14.11 – Bicycle collisions by collision hour % ofTime Injury Fatal Total Total0000-0059 4 1 5 0.490100-0159 5 0 5 0.490200-0259 7 0 7 0.690300-0359 3 0 3 0.300400-0459 2 0 2 0.200500-0559 7 0 7 0.690600-0659 18 1 19 1.880700-0759 50 1 51 5.030800-0859 60 0 60 5.920900-0959 38 0 38 3.751000-1059 33 0 33 3.261100-1159 47 0 47 4.641200-1259 53 0 53 5.231300-1359 66 1 67 6.611400-1459 75 1 76 7.501500-1559 108 0 108 10.661600-1659 80 2 82 8.091700-1759 105 1 106 10.461800-1859 69 2 71 7.011900-1959 53 1 54 5.332000-2059 32 0 32 3.162100-2159 34 0 34 3.362200-2259 25 0 25 2.472300-2359 10 0 10 0.99Unknown 17 1 18 1.78Total 1,001 12 1,013 100%
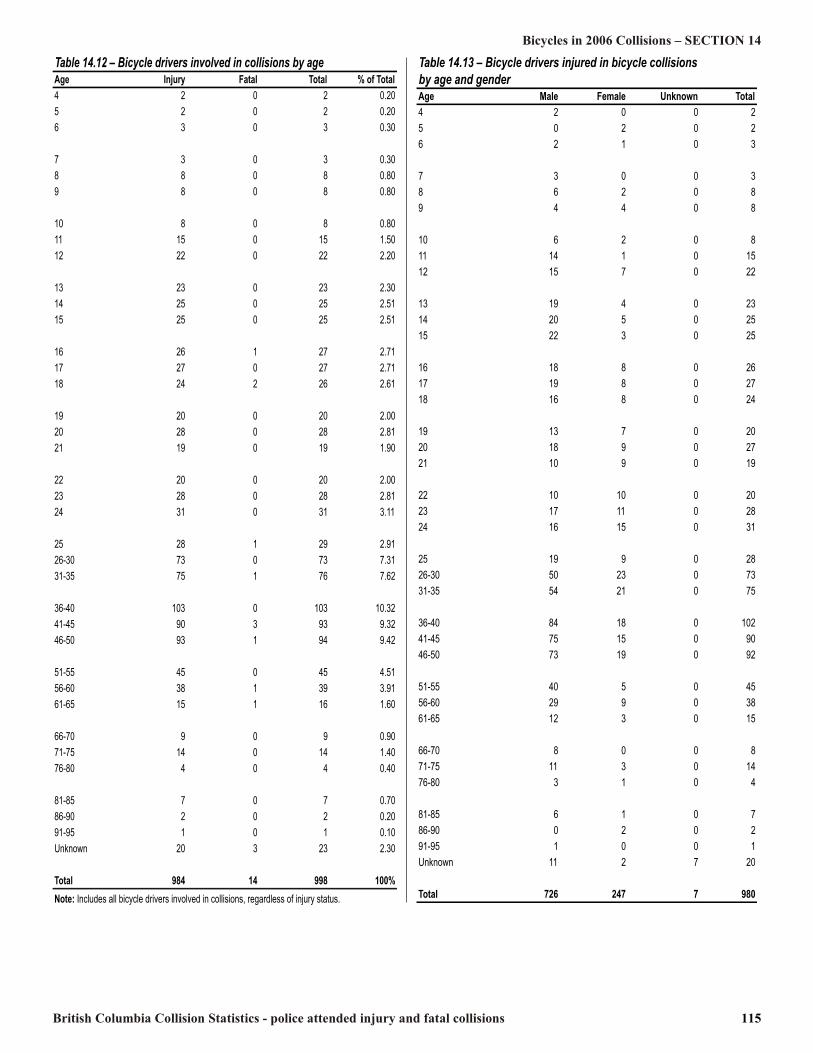
British Columbia Collision Statistics - police attended injury and fatal collisions 115
Bicycles in 2006 Collisions – SECTION 14Table 14.13 – Bicycle drivers injured in bicycle collisionsby age and genderAge Male Female Unknown Total4 2 0 0 25 0 2 0 26 2 1 0 37 3 0 0 38 6 2 0 89 4 4 0 810 6 2 0 811 14 1 0 1512 15 7 0 2213 19 4 0 2314 20 5 0 2515 22 3 0 2516 18 8 0 2617 19 8 0 2718 16 8 0 2419 13 7 0 2020 18 9 0 2721 10 9 0 1922 10 10 0 2023 17 11 0 2824 16 15 0 3125 19 9 0 2826-30 50 23 0 7331-35 54 21 0 7536-40 84 18 0 10241-45 75 15 0 9046-50 73 19 0 9251-55 40 5 0 4556-60 29 9 0 3861-65 12 3 0 1566-70 8 0 0 871-75 11 3 0 1476-80 3 1 0 481-85 6 1 0 786-90 0 2 0 291-95 1 0 0 1Unknown 11 2 7 20Total 726 247 7 980
Table 14.12 – Bicycle drivers involved in collisions by ageAge Injury Fatal Total % of Total4 2 0 2 0.205 2 0 2 0.206 3 0 3 0.307 3 0 3 0.308 8 0 8 0.809 8 0 8 0.8010 8 0 8 0.8011 15 0 15 1.5012 22 0 22 2.2013 23 0 23 2.3014 25 0 25 2.5115 25 0 25 2.5116 26 1 27 2.7117 27 0 27 2.7118 24 2 26 2.6119 20 0 20 2.0020 28 0 28 2.8121 19 0 19 1.9022 20 0 20 2.0023 28 0 28 2.8124 31 0 31 3.1125 28 1 29 2.9126-30 73 0 73 7.3131-35 75 1 76 7.6236-40 103 0 103 10.3241-45 90 3 93 9.3246-50 93 1 94 9.4251-55 45 0 45 4.5156-60 38 1 39 3.9161-65 15 1 16 1.6066-70 9 0 9 0.9071-75 14 0 14 1.4076-80 4 0 4 0.4081-85 7 0 7 0.7086-90 2 0 2 0.2091-95 1 0 1 0.10Unknown 20 3 23 2.30Total 984 14 998 100%Note: Includes all bicycle drivers involved in collisions, regardless of injury status.
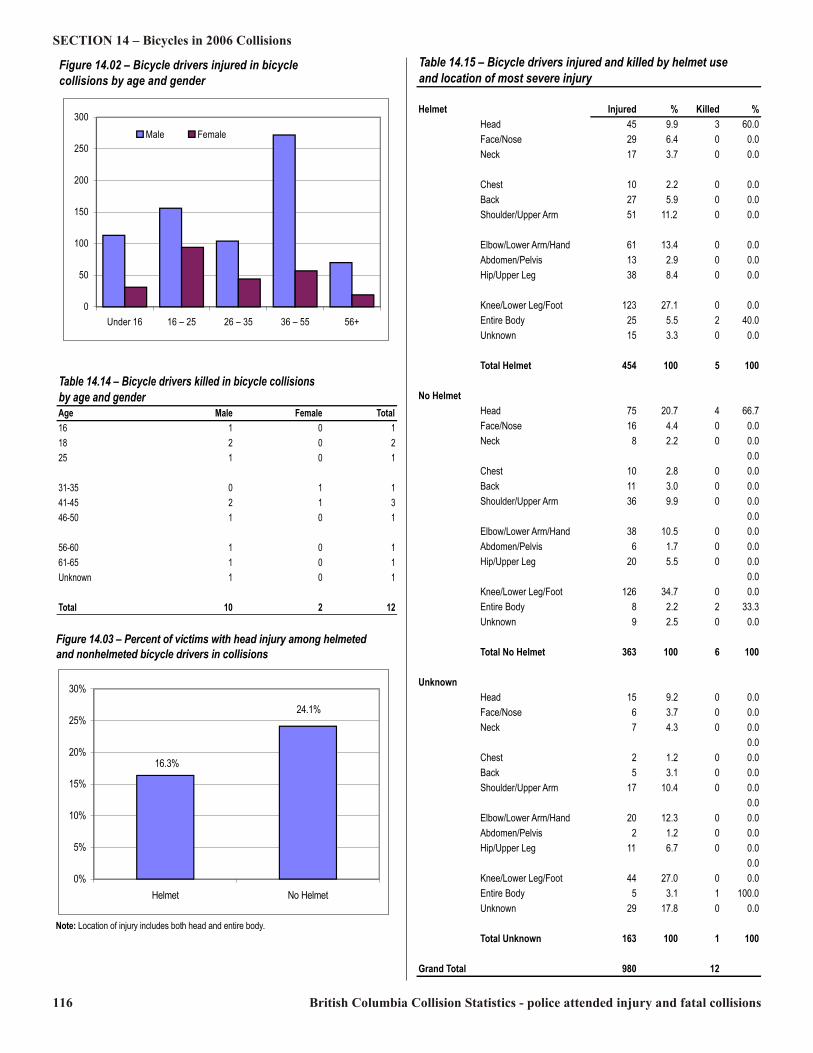
116 British Columbia Collision Statistics - police attended injury and fatal collisions
SECTION 14 – Bicycles in 2006 CollisionsFigure 14.02 – Bicycle drivers injured in bicyclecollisions by age and gender
050
100150200250300
Under 16 16 – 25 26 – 35 36 – 55 56+
Male Female
Table 14.15 – Bicycle drivers injured and killed by helmet useand location of most severe injuryHelmet Injured % Killed %Head 45 9.9 3 60.0Face/Nose 29 6.4 0 0.0Neck 17 3.7 0 0.0
Chest 10 2.2 0 0.0Back 27 5.9 0 0.0Shoulder/Upper Arm 51 11.2 0 0.0Elbow/Lower Arm/Hand 61 13.4 0 0.0Abdomen/Pelvis 13 2.9 0 0.0Hip/Upper Leg 38 8.4 0 0.0Knee/Lower Leg/Foot 123 27.1 0 0.0Entire Body 25 5.5 2 40.0Unknown 15 3.3 0 0.0Total Helmet 454 100 5 100
No Helmet Head 75 20.7 4 66.7Face/Nose 16 4.4 0 0.0Neck 8 2.2 0 0.00.0Chest 10 2.8 0 0.0Back 11 3.0 0 0.0Shoulder/Upper Arm 36 9.9 0 0.00.0Elbow/Lower Arm/Hand 38 10.5 0 0.0Abdomen/Pelvis 6 1.7 0 0.0Hip/Upper Leg 20 5.5 0 0.00.0Knee/Lower Leg/Foot 126 34.7 0 0.0Entire Body 8 2.2 2 33.3Unknown 9 2.5 0 0.0Total No Helmet 363 100 6 100 Unknown Head 15 9.2 0 0.0Face/Nose 6 3.7 0 0.0Neck 7 4.3 0 0.00.0Chest 2 1.2 0 0.0Back 5 3.1 0 0.0Shoulder/Upper Arm 17 10.4 0 0.00.0Elbow/Lower Arm/Hand 20 12.3 0 0.0Abdomen/Pelvis 2 1.2 0 0.0Hip/Upper Leg 11 6.7 0 0.00.0Knee/Lower Leg/Foot 44 27.0 0 0.0Entire Body 5 3.1 1 100.0Unknown 29 17.8 0 0.0Total Unknown 163 100 1 100
Grand Total 980 12
Table 14.14 – Bicycle drivers killed in bicycle collisionsby age and genderAge Male Female Total16 1 0 118 2 0 225 1 0 131-35 0 1 141-45 2 1 346-50 1 0 156-60 1 0 161-65 1 0 1Unknown 1 0 1Total 10 2 12Figure 14.03 – Percent of victims with head injury among helmetedand nonhelmeted bicycle drivers in collisions
Note: Location of injury includes both head and entire body.
24.1%16.3%
0%5%
10%15%20%25%30%
Helmet No Helmet
British Columbia Collision Statistics - police attended injury and fatal collisions 117
Commercial Vehicles, Emergency Vehicles, Taxis and School Buses in Collisions Section 15Definition of Commercial VehicleCommercial vehicles in this section include the followingvehicles under 10,900 kilograms: single unit trucks/light,combination unit trucks/light and tow truck. In addition,vehicles 10,900 kilograms and over include: single unittrucks/heavy; combination unit trucks/heavy, combination unittractors or trailers, combination unit tractors or trailers and pups, log trucks and pole trailers, local transit bus and intercity bus.Starting in 2004, three more types of vehicles were added in this section: panel/mini van 4,500 kg and under, panel van 4,500 kg and under plus trailer and combination unit truck/pull trailer/5thwheel trailer. Please note that this publication has used three definitions ofcommercial vehicles so far. Publications up to 1998 used one. Between 1999 and 2003, another version was used. Since 2004, a new version has been in use. As a result, comparisons ofcommercial vehicle collisions are only appropriate within thetime period when the same definition was employed. Summary Statistics There were 2,261 reported casualty collisions involvingcommercial vehicles during 2006. Of these collisions, 2,171were personal injury collisions and 90 were fatal collisions.The five top contributing factors assigned to commercial vehicle drivers (as a percentage of total commercial vehicle collisions)were, in order of magnitude:(1) Driver inattentive (23.0%); (2) Speeding (13.4%); (3) Road Condition (11.9%); (4) Driver error/confusion (11.7%); (5) Following too closely (8.1%).The five top contributing factors assigned to other drivers (as apercentage of total commercial vehicle collisions) were, in order of magnitude:(1) Driver inattentive (28.9%); (2) Driver error/confusion (15.4%); (3) Speeding (14.2%); (4) Failing to yield right of way (12.1%); (5) Road condition (11.1%).
Emergency Vehicle, Taxi and School Bus CollisionsAn emergency vehicle is defined, in this report, as any vehicleused to carry rescue or first aid equipment or driven by amember of a fire department, a peace officer or a constable,whether or not actually responding to an emergency. It includes ambulance, police or fire vehicle. In 2006, there were 120 emergency vehicle collisions, none was a fatal collision. These collisions resulted in 163 victims. The top three contributing factors assigned to emergencyvehicle drivers were, in order of magnitude:(1) Road condition (7.5%); (2) Failing to yield right of way (5.0%); (2) Driver inattentive (5.0%); (2) Driver distraction (5.0%); (3) Ignoring traffic control device (3.3%); (3) Weather (3.3%). In 2006, 3,224 taxis were licensed at least once for service.There were 252 casualty collisions involving taxis in the sameyear. Of which 3 were fatal. These collisions resulted in 377casualties . The top three contributing factors assigned to taxi drivers were,in order of magnitude:(1) Driver inattentive (18.7%); (2) Failing to yield right of way (11.9%); (3) Speeding (6.4%).A school bus is defined, for the purpose of this report, as amotor vehicle licensed to convey children to or from school. A total of 16 casualty collisions involving school buses occurred during 2006. These collisions resulted in 32 people beinginjured. Fourteen of the 32 victims were in the school bus, 17were in other vehicles and 1 was a pedestrian. There was nofatal collision involving a school bus in 2006. The 2006 fatal collision counts and fatality counts may belower than they would be in the absence of the fatalityreconciliation and are not comparable to prior years (Seepage i). No changes have been made to the reporting ofinjury collisions.

118 British Columbia Collision Statistics - police attended injury and fatal collisions
SECTION 15 – Commercial Vehicles, Emergency Vehicles, Taxis and School Buses in Collisions
Table 15.01 – Commercial vehicle collisions and victims by monthCollisions VictimsMonth Injury Fatal Total Injured Killed TotalJanuary 212 7 219 295 8 303February 168 5 173 221 6 227March 160 5 165 226 5 231April 137 7 144 199 7 206May 137 7 144 205 8 213June 173 8 181 226 8 234July 191 9 200 266 11 277August 192 11 203 264 11 275September 169 8 177 238 9 247October 210 6 216 275 9 284November 224 7 231 324 8 332December 198 10 208 280 11 291Total 2,171 90 2,261 3,019 101 3,120
F ig u re 15 .01 – C o m m erc ia l veh ic le co llis io n s an d v ic tim s b y m o n th
050
100150200250300350
Jan F eb M ar A p r M ay Jun Ju l A u g S e p O ct N ov D ec
C o llis ions V i ct i ms
C o m m e r c i a l V e h i c l e I n j u r y C o l l i s i o n s a n d V i c t i m s2 ,9 9 1 3 ,0 19
2 ,1712 ,1532 ,0 17
3 ,10 7
050 0
10 0 0150 0
2 0 0 02 50 03 0 0 03 50 0
2 0 0 4 2 0 0 5 2 0 0 6
C o l l is io ns V i ct i msC o m m e r c i a l V e h i c l e F a ta l C o l l i s i o n s a n d V i c t i m s
9 69 2 9 0
10 7 10 610 1
80859095
100105110
2 0 0 4 2 0 0 5 2 0 0 6
C o l l is io ns V i ct i ms

British Columbia Collision Statistics - police attended injury and fatal collisions 119
Commercial Vehicles, Emergency Vehicles, Taxis and School Buses in Collisions – SECTION 15 Figure 15.02 – Top five contributing factors in commercial vehicle collisions (commercial vehicle driver factors only) as apercentage of total commercial vehicle collisions0.0% 5.0% 10.0% 15.0% 20.0% 25.0%
Driver InattentiveSpeed
DriverError/ConfusionRoad Condition
Follow too Closely
Table 15.02 – Contributing factors in commercial vehicle collisions – Commercial vehicle driver factors only: By number of collisions % of Total CommercialVehicleContributing Factors Injury Fatal Total CollisionsDriver Inattentive 515 4 519 22.95Speed Exceeding Speed Limit 68 4 72 3.18 Driving too Fast For Conditions 224 4 228 10.08 Excessive Speed 3 0 3 0.13Road Condition (Ice/Snow/Slush/Water) 266 4 270 11.94Driver Error/Confusion 258 7 265 11.72Following too Closely 184 0 184 8.14Failing to Yield Right of Way 157 2 159 7.03Weather(Fog/Sleet/Rain/Snow) 141 5 146 6.46Alcohol Alcohol Suspected 45 4 49 2.17 Ability Impaired by Alcohol 38 4 42 1.86Ignoring Traffic Control Device 79 4 83 3.67Improper Turning 53 1 54 2.39Fell Asleep 47 0 47 2.08Driver Internal/External Distraction 45 2 47 2.08Driving on Wrong Side of Road 38 4 42 1.86Avoiding Veh/Ped/Cycle 40 2 42 1.86Wild Animal 33 2 35 1.55Improper Passing 27 0 27 1.19Cutting In 25 0 25 1.11Backing Unsafely 25 0 25 1.11Road/Intersection Design 22 1 23 1.02Insecure Load 20 2 22 0.97Defective Brakes 20 2 22 0.97Extreme Fatigue 17 2 19 0.84Sunlight Glare 16 2 18 0.80Drugs Suspected 15 1 16 0.71Failing to Signal 15 0 15 0.66Defective Tires 15 0 15 0.66Site Line Obstruction 13 1 14 0.62Previous Traffic Collision 13 1 14 0.62Unconscious 12 1 13 0.57Roadside Hazard 13 0 13 0.57Illness 11 0 11 0.49Other 242 18 260 11.50Unknown 111 7 118 5.22Note:1) The table shown above represents the contributing factors assigned to thecommercial vehicle drivers involved in these collisions. "Collisions" represents the number of collisions in which the contributing factor was present, not the total number of occurrences of the contributing factor. Some double counting of collisions occursin this table. For example, a collision attributed to alcohol suspectedand exceeding speed limit would be counted above as both an alcohol relatedcollision, and a collision involving speeding. "Percent of Total"represents the collisions involving the factor as a percentage of total commercial vehiclecasualty collisions recorded in 2006.2) "Other" includes specified factors with less than 10 occurrences plus unspecified other..3) "Excessive Speed" means driving 40 km/h or more over the speed limit.
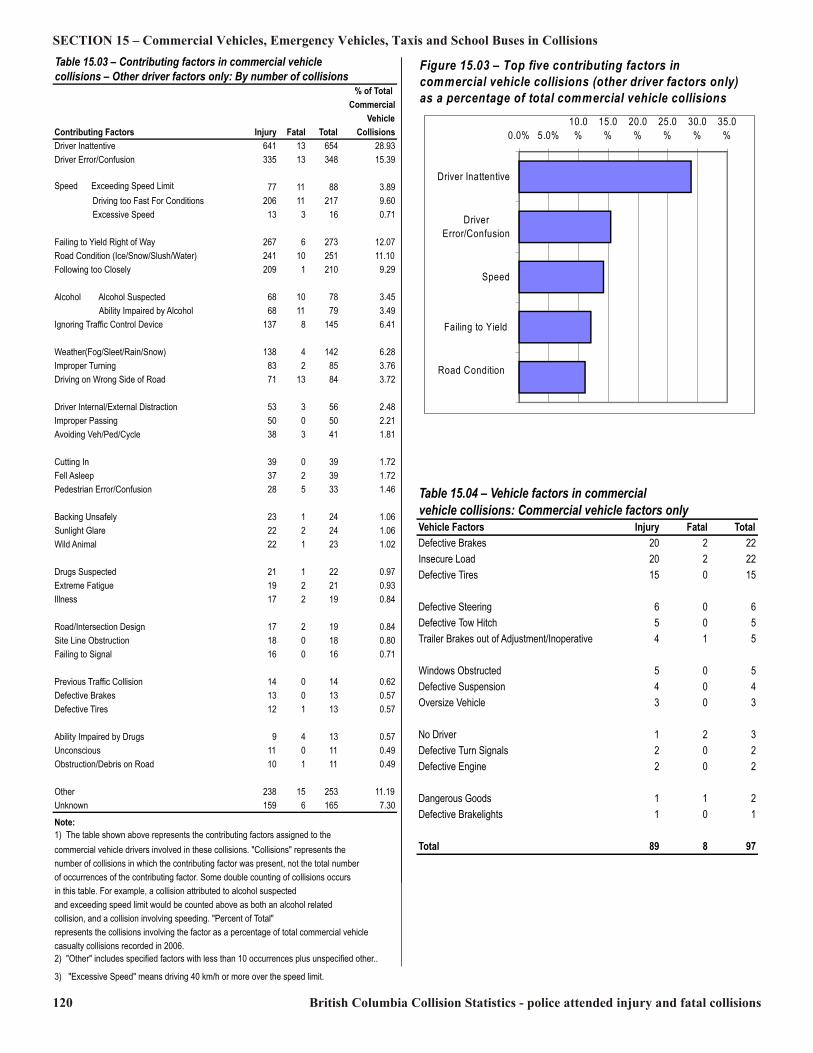
120 British Columbia Collision Statistics - police attended injury and fatal collisions
SECTION 15 – Commercial Vehicles, Emergency Vehicles, Taxis and School Buses in Collisions Figure 15.03 – Top five contributing factors incommercial vehicle collisions (other driver factors only) as a percentage of total commercial vehicle collisions0.0% 5.0% 10.0% 15.0% 20.0% 25.0% 30.0% 35.0%
Driver InattentiveDriverError/Confusion
SpeedFailing to Yield
Road Condition
Table 15.03 – Contributing factors in commercial vehicle collisions – Other driver factors only: By number of collisions % of Total CommercialVehicleContributing Factors Injury Fatal Total CollisionsDriver Inattentive 641 13 654 28.93Driver Error/Confusion 335 13 348 15.39Speed Exceeding Speed Limit 77 11 88 3.89 Driving too Fast For Conditions 206 11 217 9.60 Excessive Speed 13 3 16 0.71Failing to Yield Right of Way 267 6 273 12.07Road Condition (Ice/Snow/Slush/Water) 241 10 251 11.10Following too Closely 209 1 210 9.29Alcohol Alcohol Suspected 68 10 78 3.45 Ability Impaired by Alcohol 68 11 79 3.49Ignoring Traffic Control Device 137 8 145 6.41Weather(Fog/Sleet/Rain/Snow) 138 4 142 6.28Improper Turning 83 2 85 3.76Driving on Wrong Side of Road 71 13 84 3.72Driver Internal/External Distraction 53 3 56 2.48Improper Passing 50 0 50 2.21Avoiding Veh/Ped/Cycle 38 3 41 1.81Cutting In 39 0 39 1.72Fell Asleep 37 2 39 1.72Pedestrian Error/Confusion 28 5 33 1.46Backing Unsafely 23 1 24 1.06Sunlight Glare 22 2 24 1.06Wild Animal 22 1 23 1.02Drugs Suspected 21 1 22 0.97Extreme Fatigue 19 2 21 0.93Illness 17 2 19 0.84Road/Intersection Design 17 2 19 0.84Site Line Obstruction 18 0 18 0.80Failing to Signal 16 0 16 0.71Previous Traffic Collision 14 0 14 0.62Defective Brakes 13 0 13 0.57Defective Tires 12 1 13 0.57Ability Impaired by Drugs 9 4 13 0.57Unconscious 11 0 11 0.49Obstruction/Debris on Road 10 1 11 0.49Other 238 15 253 11.19Unknown 159 6 165 7.30Note:1) The table shown above represents the contributing factors assigned to thecommercial vehicle drivers involved in these collisions. "Collisions" represents the number of collisions in which the contributing factor was present, not the total number of occurrences of the contributing factor. Some double counting of collisions occursin this table. For example, a collision attributed to alcohol suspectedand exceeding speed limit would be counted above as both an alcohol relatedcollision, and a collision involving speeding. "Percent of Total"represents the collisions involving the factor as a percentage of total commercial vehiclecasualty collisions recorded in 2006.2) "Other" includes specified factors with less than 10 occurrences plus unspecified other..3) "Excessive Speed" means driving 40 km/h or more over the speed limit.
Table 15.04 – Vehicle factors in commercialvehicle collisions: Commercial vehicle factors onlyVehicle Factors Injury Fatal TotalDefective Brakes 20 2 22Insecure Load 20 2 22Defective Tires 15 0 15Defective Steering 6 0 6Defective Tow Hitch 5 0 5Trailer Brakes out of Adjustment/Inoperative 4 1 5Windows Obstructed 5 0 5Defective Suspension 4 0 4Oversize Vehicle 3 0 3No Driver 1 2 3Defective Turn Signals 2 0 2Defective Engine 2 0 2Dangerous Goods 1 1 2Defective Brakelights 1 0 1Total 89 8 97
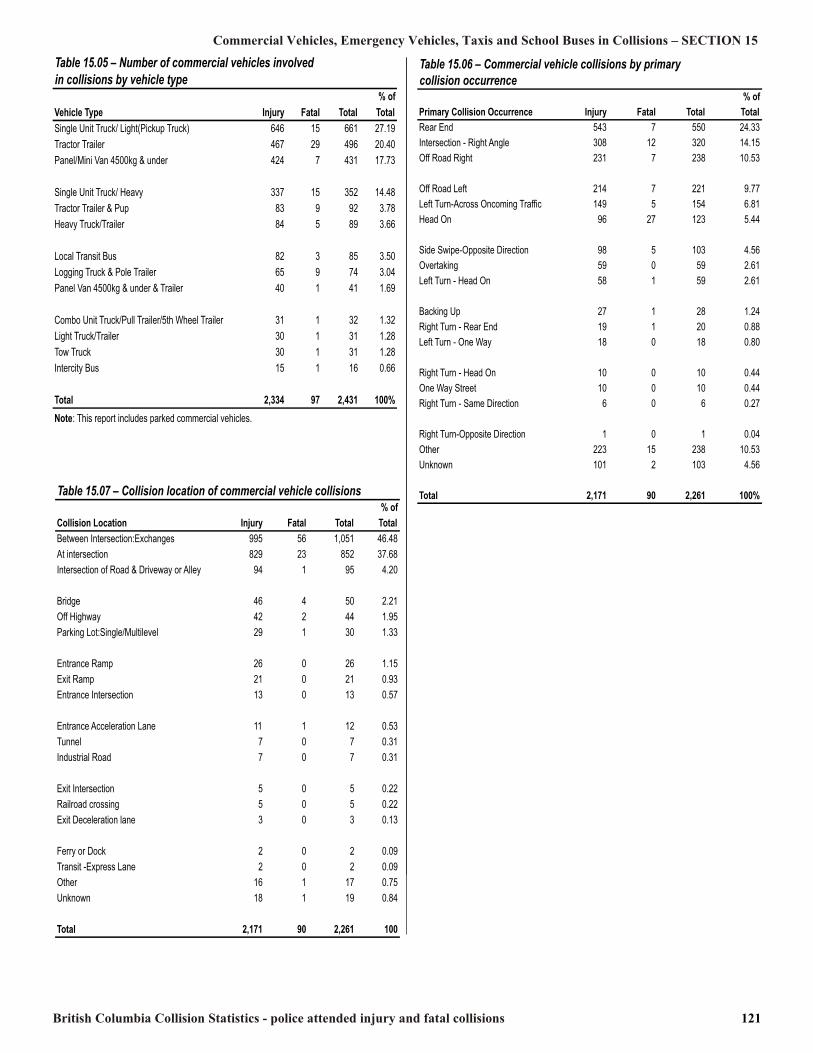
British Columbia Collision Statistics - police attended injury and fatal collisions 121
Commercial Vehicles, Emergency Vehicles, Taxis and School Buses in Collisions – SECTION 15 Table 15.05 – Number of commercial vehicles involved in collisions by vehicle type % ofVehicle Type Injury Fatal Total TotalSingle Unit Truck/ Light(Pickup Truck) 646 15 661 27.19Tractor Trailer 467 29 496 20.40Panel/Mini Van 4500kg & under 424 7 431 17.73Single Unit Truck/ Heavy 337 15 352 14.48Tractor Trailer & Pup 83 9 92 3.78Heavy Truck/Trailer 84 5 89 3.66Local Transit Bus 82 3 85 3.50Logging Truck & Pole Trailer 65 9 74 3.04Panel Van 4500kg & under & Trailer 40 1 41 1.69Combo Unit Truck/Pull Trailer/5th Wheel Trailer 31 1 32 1.32Light Truck/Trailer 30 1 31 1.28Tow Truck 30 1 31 1.28Intercity Bus 15 1 16 0.66Total 2,334 97 2,431 100%Note: This report includes parked commercial vehicles.
Table 15.06 – Commercial vehicle collisions by primary collision occurrence % ofPrimary Collision Occurrence Injury Fatal Total TotalRear End 543 7 550 24.33Intersection - Right Angle 308 12 320 14.15Off Road Right 231 7 238 10.53Off Road Left 214 7 221 9.77Left Turn-Across Oncoming Traffic 149 5 154 6.81Head On 96 27 123 5.44Side Swipe-Opposite Direction 98 5 103 4.56Overtaking 59 0 59 2.61Left Turn - Head On 58 1 59 2.61Backing Up 27 1 28 1.24Right Turn - Rear End 19 1 20 0.88Left Turn - One Way 18 0 18 0.80Right Turn - Head On 10 0 10 0.44One Way Street 10 0 10 0.44Right Turn - Same Direction 6 0 6 0.27Right Turn-Opposite Direction 1 0 1 0.04Other 223 15 238 10.53Unknown 101 2 103 4.56Total 2,171 90 2,261 100%Table 15.07 – Collision location of commercial vehicle collisions % ofCollision Location Injury Fatal Total TotalBetween Intersection:Exchanges 995 56 1,051 46.48At intersection 829 23 852 37.68Intersection of Road & Driveway or Alley 94 1 95 4.20
Bridge 46 4 50 2.21Off Highway 42 2 44 1.95Parking Lot:Single/Multilevel 29 1 30 1.33Entrance Ramp 26 0 26 1.15Exit Ramp 21 0 21 0.93Entrance Intersection 13 0 13 0.57Entrance Acceleration Lane 11 1 12 0.53Tunnel 7 0 7 0.31Industrial Road 7 0 7 0.31Exit Intersection 5 0 5 0.22Railroad crossing 5 0 5 0.22Exit Deceleration lane 3 0 3 0.13Ferry or Dock 2 0 2 0.09Transit -Express Lane 2 0 2 0.09Other 16 1 17 0.75Unknown 18 1 19 0.84Total 2,171 90 2,261 100

122 British Columbia Collision Statistics - police attended injury and fatal collisions
SECTION 15 – Commercial Vehicles, Emergency Vehicles, Taxis and School Buses in Collisions
Table 15.09 – BC driver licence class of commercial vehicle drivers by vehicle type: Fatal collisionsVehicle Type 100 160 200 230 300 360 500 560 000 Other TotalPanel Van 4500kg & under & 0 0 0 1 1 0 3 1 0 1 7Panel Van 4500kg & under & Trailer 0 0 0 0 0 0 1 0 0 0 1Single Unit Truck/ Light(Pickup Truck) 1 1 0 0 0 1 8 3 0 1 15Single Unit Truck/ Heavy 2 1 0 0 1 0 5 0 0 6 15Light Truck/Trailer 1 0 0 0 0 0 0 0 0 0 1Heavy Truck/Trailer 3 0 0 0 0 0 1 0 0 1 5Tractor Trailer 18 4 0 0 0 0 0 0 0 7 29Tractor Trailer & Pup 5 3 0 0 0 0 0 0 0 1 9Logging Truck & Pole Trailer 8 0 0 0 0 0 0 0 1 0 9Tow Truck 0 0 0 0 0 0 1 0 0 0 1Combo Unit Truck/Pull Trailer/5th Wheel Trailer 1 0 0 0 0 0 0 0 0 0 1Local Transit Bus 1 0 1 1 0 0 0 0 0 0 3Intercity Bus 1 0 0 0 0 0 0 0 0 0 1Total 41 9 1 2 2 1 19 4 1 17 97Note:1) This table lists all combinations of valid BC licence classes. 2) "100" to "800" refers to driver licence classes 1 to 8. "340", for example, is a combination of class 3 and class 4.3) "000" indicates no class. It includes out-of-province drivers.4) For a description of BC driver licence classes, see Table 5.05.5) 'Other' includes out-of-province driver licence classes or unidentified driver licence classes.
Driver License Class
Table 15.08 – BC driver licence class of commercial vehicle drivers by vehicle type: Injury collisionsDriver License ClassVehicle Type 100 160 200 230 236 260 300 340 346 360 400 460 500 560 700 000 Other TotalSingle Unit Truck/ Light(Pickup Truck) 36 18 0 0 1 2 18 0 2 8 10 3 367 69 60 6 46 10Tractor Trailer 258 67 0 0 0 0 1 0 0 0 0 0 5 0 1 3 132 6Panel/Mini Van 4500kg & under 21 3 2 1 1 0 6 1 0 1 15 1 288 30 34 4 16 27Single Unit Truck/ Heavy 64 17 2 3 2 0 35 3 2 5 8 2 127 20 16 1 30 25Heavy Truck/Trailer 41 10 1 0 0 0 0 1 1 0 1 0 6 1 2 0 20 6Tractor Trailer & Pup 53 16 0 0 0 0 0 0 0 0 0 0 0 1 0 0 13 8Local Transit Bus 12 7 26 9 2 12 0 0 0 0 8 0 1 1 0 0 4 4Logging Truck & Pole Trailer 52 10 0 0 0 0 0 0 0 0 0 0 0 0 0 0 3 2Panel Van 4500kg & under & Trailer 2 2 0 0 0 0 1 0 0 0 1 1 25 3 3 0 2 2Combo Unit Truck/Pull Trailer/5th Wheel Trailer 10 3 0 0 0 0 1 0 0 0 0 0 8 1 0 0 8 1Light Truck/Trailer 8 3 0 0 0 0 2 0 1 1 1 0 10 0 2 0 2 0Tow Truck 4 2 0 0 0 0 0 0 0 1 1 0 17 4 0 0 1 1Intercity Bus 4 2 0 1 0 0 0 0 0 0 2 0 0 0 0 0 6 0Total 565 160 31 14 6 14 64 5 6 16 47 7 854 130 118 14 283 2,334Note:1) This table lists all combinations of valid BC licence classes. Out-of-province drivers are all grouped under "Other". 2) "100" to "800" refers to driver licence classes 1 to 8. "340", for example, is a combination of class 3 and class 4.3) "000" indicates no class. It includes out-of-province drivers.4) For a description of BC driver licence classes, see Table 5.05.5) 'Other' includes out-of-province driver licence classes or unidentified driver licence classes.
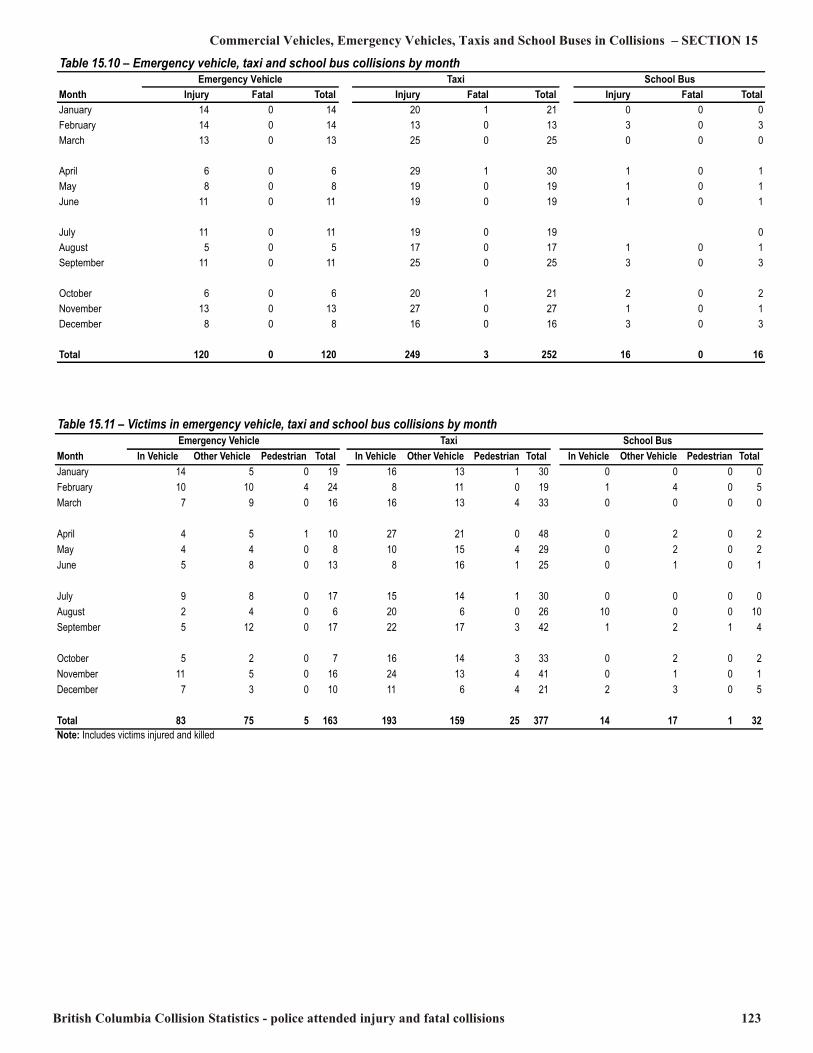
British Columbia Collision Statistics - police attended injury and fatal collisions 123
Commercial Vehicles, Emergency Vehicles, Taxis and School Buses in Collisions – SECTION 15 Table 15.10 – Emergency vehicle, taxi and school bus collisions by monthEmergency Vehicle Taxi School BusMonth Injury Fatal Total Injury Fatal Total Injury Fatal TotalJanuary 14 0 14 20 1 21 0 0 0February 14 0 14 13 0 13 3 0 3March 13 0 13 25 0 25 0 0 0April 6 0 6 29 1 30 1 0 1May 8 0 8 19 0 19 1 0 1June 11 0 11 19 0 19 1 0 1July 11 0 11 19 0 19 0August 5 0 5 17 0 17 1 0 1September 11 0 11 25 0 25 3 0 3October 6 0 6 20 1 21 2 0 2November 13 0 13 27 0 27 1 0 1December 8 0 8 16 0 16 3 0 3Total 120 0 120 249 3 252 16 0 16
Table 15.11 – Victims in emergency vehicle, taxi and school bus collisions by monthEmergency Vehicle Taxi School BusMonth In Vehicle Other Vehicle Pedestrian Total In Vehicle Other Vehicle Pedestrian Total In Vehicle Other Vehicle Pedestrian TotalJanuary 14 5 0 19 16 13 1 30 0 0 0 0February 10 10 4 24 8 11 0 19 1 4 0 5March 7 9 0 16 16 13 4 33 0 0 0 0April 4 5 1 10 27 21 0 48 0 2 0 2May 4 4 0 8 10 15 4 29 0 2 0 2June 5 8 0 13 8 16 1 25 0 1 0 1July 9 8 0 17 15 14 1 30 0 0 0 0August 2 4 0 6 20 6 0 26 10 0 0 10September 5 12 0 17 22 17 3 42 1 2 1 4October 5 2 0 7 16 14 3 33 0 2 0 2November 11 5 0 16 24 13 4 41 0 1 0 1December 7 3 0 10 11 6 4 21 2 3 0 5Total 83 75 5 163 193 159 25 377 14 17 1 32Note: Includes victims injured and killed

124 British Columbia Collision Statistics - police attended injury and fatal collisions
SECTION 15 – Commercial Vehicles, Emergency Vehicles, Taxis and School Buses in Collisions Table 15.12 – Contributing factors in emergency vehiclecollisions – Emergency vehicle driver factors only: By number of collisions % of TotalEmergencyVehicleContributing factors Injury Fatal Total CollisionsRoad Condition (Ice/Snow/Slush/Water) 9 0 9 7.50Failing to Yield Right of Way 6 0 6 5.00Driver Inattentive 6 0 6 5.00Driver Internal/External Distraction 6 0 6 5.00Ignoring Traffic Control Device 4 0 4 3.33Weather(Fog/Sleet/Rain/Snow) 4 0 4 3.33Following too Closely 3 0 3 2.50Improper Turning 3 0 3 2.50Driving too Fast for Conditions 3 0 3 2.50Site Line Obstruction 3 0 3 2.50Driving on Wrong Side of Road 2 0 2 1.67Driver Error/Confusion 2 0 2 1.67Sunlight Glare 2 0 2 1.67Obstruction/Debris on Road 2 0 2 1.67Wild Animal 2 0 2 1.67Backing Unsafely 1 0 1 0.83Cutting In 1 0 1 0.83Improper Passing 1 0 1 0.83Illness 1 0 1 0.83Avoiding Veh/Ped/Cycle 1 0 1 0.83Use of Comunication/Video Equipment 1 0 1 0.83Defective Tires 1 0 1 0.83Insufficient Worksite/Construction Traffic Control 1 0 1 0.83Road/Intersection Design 1 0 1 0.83Roadside Hazard 1 0 1 0.83Other 26 0 26 21.67Unknown 9 0 9 7.50Note: The table shown above represents the contributing factors assigned to theemergency vehicle drivers involved in these collisions. "Collisions" representsthe number of collisions in which the contributing factor was present, not the total number of occurrences of the contributing factor. Some double counting of collisionsoccurs in this table. For example, a collision attributed to weather and driver inattentivewould be counted above as both a weather related collision and a inattentive collision."Percent of Total" represents the collisions involving the factor as a percentage of total emergency vehicle casualty collisions recorded in 2006.
Table 15.13 – Contributing factors in emergency vehiclecollisions – Other vehicle driver factors only: By number of collisions % of TotalEmergencyVehicleContributing factors Injury Fatal Total CollisionsFailing to Yield Right of Way 21 0 21 17.50Driver Inattentive 16 0 16 13.33Driver Error/Confusion 12 0 12 10.00Following too Closely 8 0 8 6.67Speeding Exceeding Speed Limit 2 0 2 1.67 Driving too Fast for Conditions 6 0 6 5.00Alcohol Suspected 5 0 5 4.17Alcohol Alcohol Suspected 3 0 3 2.50 Ability Impaired by Alcohol 7 0 7 5.83Ignoring Officer/Flagman/Guard 6 0 6 5.00Backing Unsafely 5 0 5 4.17Driving on Wrong Side of Road 4 0 4 3.33Driver Internal/External Distraction 4 0 4 3.33Pedestrian Error/Confusion 3 0 3 2.50Improper Turning 3 0 3 2.50Drugs Suspected 3 0 3 2.50Road Condition (Ice/Snow/Slush/Water) 2 0 2 1.67Sunlight Glare 2 0 2 1.67Cutting In 1 0 1 0.83Extreme Fatigue 1 0 1 0.83Failing to Signal 1 0 1 0.83Improper Passing 1 0 1 0.83Avoiding Veh/Ped/Cycle 1 0 1 0.83Defective Tires 1 0 1 0.83Weather(Fog/Sleet/Rain/Snow) 1 0 1 0.83Insufficient Worksite/Construction Traffic Control 1 0 1 0.83Road/Intersection Design 1 0 1 0.83Ability Impaired by Drugs 1 0 1 0.83Other 16 0 16 13.33Unknown 11 0 11 9.17Note:1) The table shown above represents the contributing factors assigned toother drivers involved in these collisions. "Collisions" representsthe number of collisions in which the contributing factor was present, not the total number of occurrences of the contributing factor. Some double counting of collisionsoccurs in this table. For example, a collision attributed to weather and exceeding speed limitwould be counted above as both a weather related collision and a speed related collisions."Percent of Total" represents the collisions involving the factor as a percentage of total emergency vehicle casualty collisions recorded in 2006.

British Columbia Collision Statistics - police attended injury and fatal collisions 125
Commercial Vehicles, Emergency Vehicles, Taxis and School Buses in Collisions – SECTION 15 Table 15.14 – Contributing factors in taxi collisions– Taxi driver factors only: By number of collisions % of TotalTaxiContributing factors Injury Fatal Total CollisionsDriver Inattentive 46 1 47 18.65Failing to Yield Right of Way 30 0 30 11.90Speeding Exceeding Speed Limit 7 0 7 2.78 Driving too Fast for Conditions 9 0 9 3.57Road Condition (Ice/Snow/Slush/Water) 13 0 13 5.16Driver Error/Confusion 11 0 11 4.37Ignoring Traffic Control Device 9 0 9 3.57Following too Closely 8 0 8 3.17Improper Turning 8 0 8 3.17Weather(Fog/Sleet/Rain/Snow) 8 0 8 3.17Alcohol Alcohol Suspected 3 0 3 1.19 Ability Impaired by Alcohol 1 0 1 0.40Fell Asleep 3 0 3 1.19Driving on Wrong Side of Road 3 0 3 1.19Avoiding Veh/Ped/Cycle 3 0 3 1.19Site Line Obstruction 3 0 3 1.19Backing Unsafely 2 0 2 0.79Extreme Fatigue 2 0 2 0.79Use of Comunication/Video Equipment 2 0 2 0.79Artificial Glare 1 1 2 0.79Cutting In 1 0 1 0.40Failing to Signal 1 0 1 0.40Improper Passing 1 0 1 0.40Illness 1 0 1 0.40Pedestrian Error/Confusion 0 1 1 0.40Failure to Secure Stopped Vehicle 0 1 1 0.40Defective Brakes 1 0 1 0.40Sunlight Glare 1 0 1 0.40Wild Animal 1 0 1 0.40Insufficient Worksite/Construction Traffic Control 1 0 1 0.40Road/Intersection Design 1 0 1 0.40Ability Impaired by Drugs 1 0 1 0.40Driver Internal/External Distraction 1 0 1 0.40Other 19 1 20 7.94Unknown 29 0 29 11.51Note: The table shown above represents the contributing factors assigned to thetaxi drivers involved in these collisions. "Collisions" represents the numberof collisions in which the contributing factor was present, not the total numberof occurrences of the contributing factor. Some double counting of collisionsoccurs in this table. For example, a collision attributed to weather and exceeding speed limit would be counted above as both a weather related collision and a speed relatedcollision. "Percent of Total" represents the collisions involving the factor as a percentageof total taxi casualty collisions recorded in 2006.
Table 15.15 – Contributing factors in taxi collisions– Other vehicle driver factors only: By number of collisions 1 % of TotalTaxiContributing factors Injury Fatal Total CollisionsDriver Inattentive 59 1 60 23.81Failing to Yield Right of Way 36 0 36 14.29Driver Error/Confusion 33 0 33 13.10Ignoring Traffic Control Device 23 0 23 9.13Alcohol Alcohol Suspected 7 1 8 3.17 Ability Impaired by Alcohol 11 0 11 4.37Following too Closely 17 0 17 6.75Speeding Exceeding Speed Limit 5 0 5 1.98 Driving too Fast for Conditions 9 0 9 3.57Improper Turning 11 0 11 4.37Road Condition (Ice/Snow/Slush/Water) 11 0 11 4.37Pedestrian Error/Confusion 7 0 7 2.78Driver Internal/External Distraction 6 0 6 2.38Avoiding Veh/Ped/Cycle 5 0 5 1.98Cutting In 4 0 4 1.59Driving on Wrong Side of Road 4 0 4 1.59Weather(Fog/Sleet/Rain/Snow) 4 0 4 1.59Extreme Fatigue 3 0 3 1.19Fell Asleep 3 0 3 1.19Sunlight Glare 3 0 3 1.19Drugs Suspected 3 0 3 1.19Failing to Signal 2 0 2 0.79Improper Passing 2 0 2 0.79Ignoring Officer/Flagman/Guard 2 0 2 0.79Site Line Obstruction 2 0 2 0.79Backing Unsafely 1 0 1 0.40Defective Brakes 1 0 1 0.40Defective Headlights 1 0 1 0.40Defective Tires 1 0 1 0.40Previous Traffic Collision 1 0 1 0.40Wild Animal 1 0 1 0.40Insufficient Worksite/Construction Traffic Control 1 0 1 0.40Road/Intersection Design 1 0 1 0.40Roadside Hazard 1 0 1 0.40Defective/Inoperative Traffic Control Device 1 0 1 0.40Ability Impaired by Medication 1 0 1 0.40Other 22 0 22 8.73Unknown 28 0 28 11.11Note: The table shown above represents the contributing factors assigned to drivers,other than taxi drivers, involved in these collisions. "Collisions" represents the numberof collisions in which the contributing factor was present, not the total numberof occurrences of the contributing factor. Some double counting of collisionsoccurs in this table. For example, a collision attributed to weather and exceeding speed limit would be counted above as both a weather related collision and a speed relatedcollision. "Percent of Total" represents the collisions involving the factor as a percentageof total taxi casualty collisions recorded in 2006.
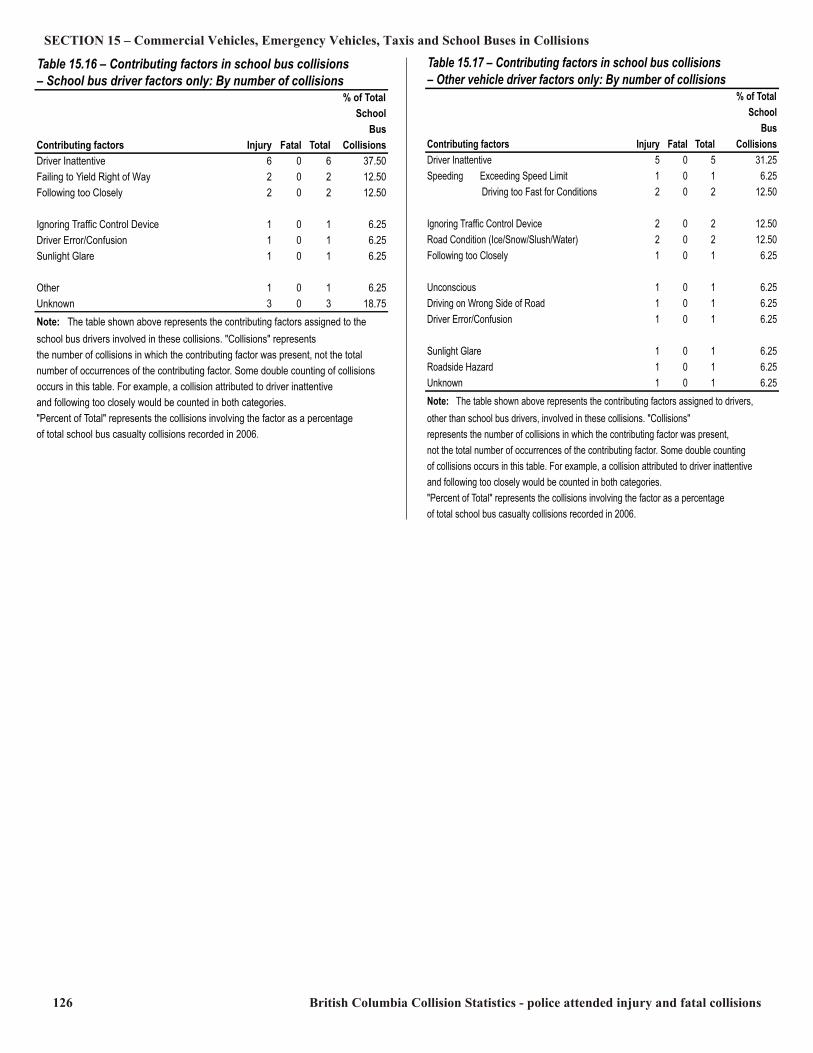
126 British Columbia Collision Statistics - police attended injury and fatal collisions
SECTION 15 – Commercial Vehicles, Emergency Vehicles, Taxis and School Buses in Collisions Table 15.16 – Contributing factors in school bus collisions– School bus driver factors only: By number of collisions% of TotalSchoolBusContributing factors Injury Fatal Total CollisionsDriver Inattentive 6 0 6 37.50Failing to Yield Right of Way 2 0 2 12.50Following too Closely 2 0 2 12.50Ignoring Traffic Control Device 1 0 1 6.25Driver Error/Confusion 1 0 1 6.25Sunlight Glare 1 0 1 6.25Other 1 0 1 6.25Unknown 3 0 3 18.75Note: The table shown above represents the contributing factors assigned to theschool bus drivers involved in these collisions. "Collisions" representsthe number of collisions in which the contributing factor was present, not the total number of occurrences of the contributing factor. Some double counting of collisionsoccurs in this table. For example, a collision attributed to driver inattentive and following too closely would be counted in both categories."Percent of Total" represents the collisions involving the factor as a percentageof total school bus casualty collisions recorded in 2006.
Table 15.17 – Contributing factors in school bus collisions– Other vehicle driver factors only: By number of collisions % of TotalSchoolBusContributing factors Injury Fatal Total CollisionsDriver Inattentive 5 0 5 31.25Speeding Exceeding Speed Limit 1 0 1 6.25 Driving too Fast for Conditions 2 0 2 12.50Ignoring Traffic Control Device 2 0 2 12.50Road Condition (Ice/Snow/Slush/Water) 2 0 2 12.50Following too Closely 1 0 1 6.25Unconscious 1 0 1 6.25Driving on Wrong Side of Road 1 0 1 6.25Driver Error/Confusion 1 0 1 6.25Sunlight Glare 1 0 1 6.25Roadside Hazard 1 0 1 6.25Unknown 1 0 1 6.25Note: The table shown above represents the contributing factors assigned to drivers, other than school bus drivers, involved in these collisions. "Collisions" represents the number of collisions in which the contributing factor was present, not the total number of occurrences of the contributing factor. Some double countingof collisions occurs in this table. For example, a collision attributed to driver inattentive and following too closely would be counted in both categories."Percent of Total" represents the collisions involving the factor as a percentageof total school bus casualty collisions recorded in 2006.
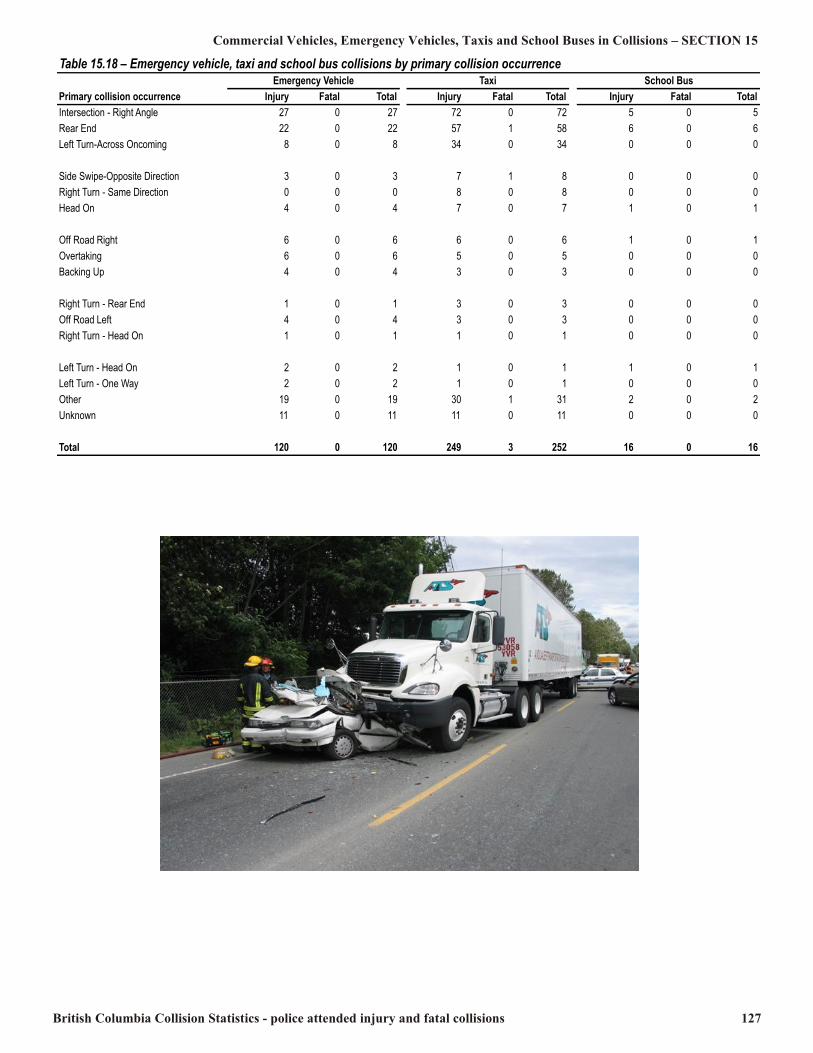
British Columbia Collision Statistics - police attended injury and fatal collisions 127
Commercial Vehicles, Emergency Vehicles, Taxis and School Buses in Collisions – SECTION 15 Table 15.18 – Emergency vehicle, taxi and school bus collisions by primary collision occurrenceEmergency Vehicle Taxi School BusPrimary collision occurrence Injury Fatal Total Injury Fatal Total Injury Fatal TotalIntersection - Right Angle 27 0 27 72 0 72 5 0 5Rear End 22 0 22 57 1 58 6 0 6Left Turn-Across Oncoming 8 0 8 34 0 34 0 0 0Side Swipe-Opposite Direction 3 0 3 7 1 8 0 0 0Right Turn - Same Direction 0 0 0 8 0 8 0 0 0Head On 4 0 4 7 0 7 1 0 1Off Road Right 6 0 6 6 0 6 1 0 1Overtaking 6 0 6 5 0 5 0 0 0Backing Up 4 0 4 3 0 3 0 0 0Right Turn - Rear End 1 0 1 3 0 3 0 0 0Off Road Left 4 0 4 3 0 3 0 0 0Right Turn - Head On 1 0 1 1 0 1 0 0 0Left Turn - Head On 2 0 2 1 0 1 1 0 1Left Turn - One Way 2 0 2 1 0 1 0 0 0Other 19 0 19 30 1 31 2 0 2Unknown 11 0 11 11 0 11 0 0 0Total 120 0 120 249 3 252 16 0 16
128 British Columbia Collision Statistics - police attended injury and fatal collisions
– Commercial Vehicles, Emergency Vehicles, Taxis and School Buses in Collisions SECTION 15
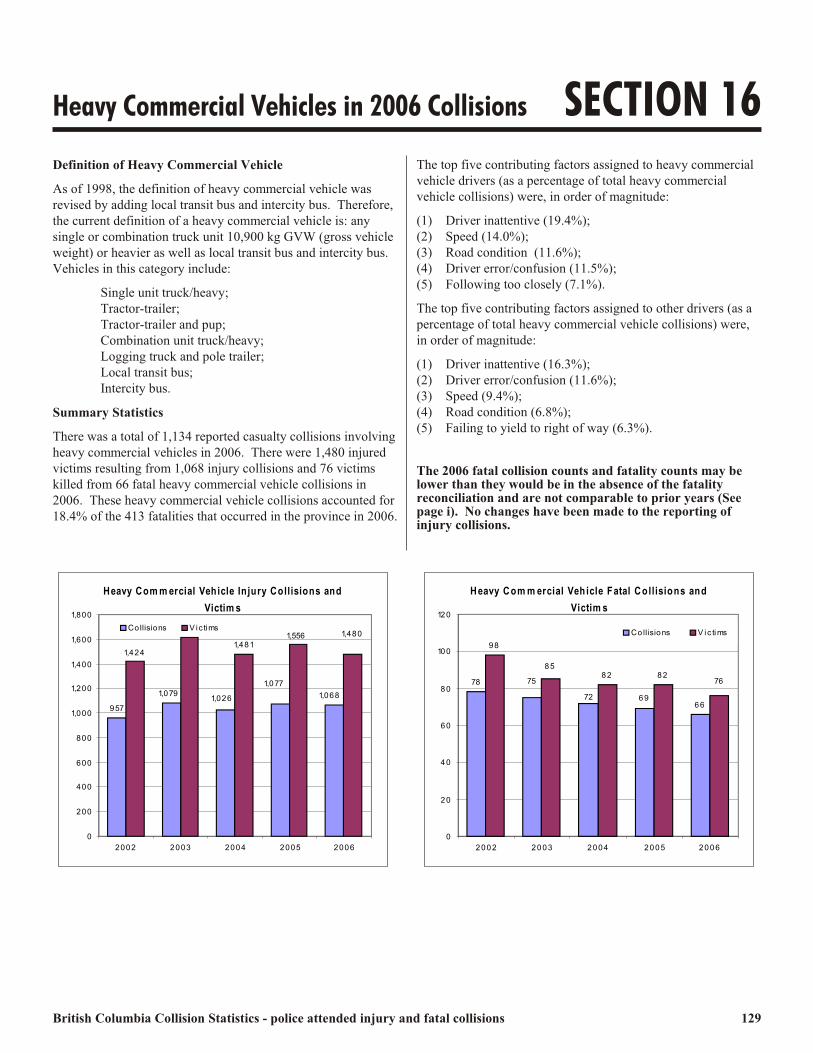
British Columbia Collision Statistics - police attended injury and fatal collisions 129
Heavy Commercial Vehicles in 2006 Collisions SECTION 16Definition of Heavy Commercial VehicleAs of 1998, the definition of heavy commercial vehicle wasrevised by adding local transit bus and intercity bus. Therefore,the current definition of a heavy commercial vehicle is: anysingle or combination truck unit 10,900 kg GVW (gross vehicleweight) or heavier as well as local transit bus and intercity bus. Vehicles in this category include:Single unit truck/heavy; Tractor-trailer; Tractor-trailer and pup; Combination unit truck/heavy; Logging truck and pole trailer; Local transit bus; Intercity bus.Summary StatisticsThere was a total of 1,134 reported casualty collisions involving heavy commercial vehicles in 2006. There were 1,480 injuredvictims resulting from 1,068 injury collisions and 76 victimskilled from 66 fatal heavy commercial vehicle collisions in2006. These heavy commercial vehicle collisions accounted for 18.4% of the 413 fatalities that occurred in the province in 2006.
The top five contributing factors assigned to heavy commercialvehicle drivers (as a percentage of total heavy commercialvehicle collisions) were, in order of magnitude:(1) Driver inattentive (19.4%); (2) Speed (14.0%); (3) Road condition (11.6%); (4) Driver error/confusion (11.5%); (5) Following too closely (7.1%).The top five contributing factors assigned to other drivers (as apercentage of total heavy commercial vehicle collisions) were,in order of magnitude:(1) Driver inattentive (16.3%);(2) Driver error/confusion (11.6%); (3) Speed (9.4%); (4) Road condition (6.8%); (5) Failing to yield to right of way (6.3%).The 2006 fatal collision counts and fatality counts may belower than they would be in the absence of the fatalityreconciliation and are not comparable to prior years (Seepage i). No changes have been made to the reporting ofinjury collisions.
Heavy Com m ercial Vehicle Injury Collisions and Victim s
957
1,615 1,4811,079 1,026 1,077 1,068
1,556 1,4801,424
0200400600800
1,0001,2001,4001,6001,800
2002 2003 2004 2005 2006
Collisions V ic timsHeavy Com m ercial Veh icle Fatal Collisions and Victim s
7866
9882 8275 72 69 7685
020406080
100120
2002 2003 2004 2005 2006
Co llisions V ic tims

130 British Columbia Collision Statistics - police attended injury and fatal collisions
SECTION 16 – Heavy Commercial Vehicles in 2006 CollisionsTable 16.01 – Heavy Commercial vehicle collisions and victims by monthCollisions Victims in Heavy Commercial Vehicles All Other Victims TotalMonth Injury Fatal Total Injured Killed Total Injured Killed Total VictimsJanuary 102 4 106 52 0 52 90 5 95 147February 93 3 96 49 1 50 72 2 74 124March 75 4 79 37 0 37 62 4 66 103April 66 5 71 42 3 45 58 2 60 105May 63 4 67 30 0 30 55 5 60 90June 85 5 90 32 0 32 69 5 74 106July 75 8 83 25 0 25 82 10 92 117August 89 7 96 44 2 46 81 5 86 132September 88 7 95 53 1 54 78 7 85 139October 105 5 110 51 0 51 85 8 93 144November 125 6 131 72 2 74 120 5 125 199December 102 8 110 62 3 65 79 6 85 150Total 1,068 66 1,134 549 12 561 931 64 995 1,556
Figure 16.01 – Heavy commercial vehicle collisions and victims by month
020406080100120140160180200220
Jan Feb Mar Apr May Jun Jul Aug Sep Oct Nov DecCollisions Victims
Figure 16.02 – Top five contributing factors in heavy commercial vehicle collisions: Heavy commercial vehicle driver factors only0.0% 5.0% 10.0% 15.0% 20.0% 25.0%
Driver inattentiveSpeed
Road ConditionDriver Error
Following too closely

British Columbia Collision Statistics - police attended injury and fatal collisions 131
Heavy Commercial Vehicles in 2006 Collisions – SECTION 16Table 16.03 – Contributing factors in heavy commercialvehicle collisions – Other driver factors only: By number of collisions % of Total HeavyCommercialVehicleContributing Factors Injury Fatal Total CollisionsDriver Inattentive 178 7 185 16.31Driver Error/Confusion 125 7 132 11.64Speed Driving too Fast for Conditions 59 7 66 5.82 Exceeding Speed Limit 25 6 31 2.73 Excessive Speed 8 2 10 0.88Road Condition (Ice/Snow/Slush/Water) 69 8 77 6.79Failing to Yield Right of Way 69 2 71 6.26Alcohol Suspected 16 5 21 1.85Alcohol Alcohol Suspected 16 6 22 1.94 Ability Impaired by Alcohol 42 0 42 3.70Driving on Wrong Side of Road 31 10 41 3.62Ignoring Traffic Control Device 33 5 38 3.35Weather(Fog/Sleet/Rain/Snow) 36 2 38 3.35Improper Turning 28 2 30 2.65Improper Passing 27 0 27 2.38Cutting In 19 0 19 1.68Avoiding Veh/Ped/Cycle 17 0 17 1.50Driver Internal/External Distraction 10 2 12 1.06Fell Asleep 9 2 11 0.97Drugs Suspected 9 1 10 0.88Other 115 16 131 11.55Unknown 61 2 63 5.56Note:1) The table shown above represents the contributing factors assigned to drivers, other than heavy commercial vehicle drivers, involved in these collisions. "Collisions" represents the number of collisions in which the contributing factor was present, not thetotal number of occurrences of the contributing factor. Some double counting of collisions occurs in the data presented in this table. For example, a collision attributedto alcohol suspected and exceeding speed limit would be counted above as both an alcoholrelated collision, and a speed related collision. "Percent of Total"represents the collisions involving the factor as a percentage of total heavy commercial vehicle casualty collisions recorded in 2006.2) "Other" includes specified factors with less than 10 occurrences plus unspecified other.3) "Excessive Speed" means driving 40 km/h or more over the speed limit.
Table 16.02 – Contributing factors in heavy commercialvehicle collisions – Heavy Commercial vehicle driverfactors only: By number of collisions % of Total HeavyCommercialVehicleContributing Factors Injury Fatal Total CollisionsDriver Inattentive 218 2 220 19.40Speed Driving too Fast for Conditions 116 2 118 10.41 Exceeding Speed Limit 39 2 41 3.62Road Condition (Ice/Snow/Slush/Water) 129 2 131 11.55Driver Error/Confusion 125 5 130 11.46Following too Closely 80 0 80 7.05Weather(Fog/Sleet/Rain/Snow) 57 3 60 5.29Failing to Yield Right of Way 49 2 51 4.50Ignoring Traffic Control Device 26 3 29 2.56Avoiding Veh/Ped/Cycle 26 1 27 2.38Driving on Wrong Side of Road 23 3 26 2.29Fell Asleep 22 0 22 1.94Driver Internal/External Distraction 19 1 20 1.76Improper Turning 19 0 19 1.68Insecure Load 15 2 17 1.50Alcohol Alcohol Suspected 9 0 9 0.79 Ability Impaired by Alcohol 5 2 7 0.62Improper Passing 16 0 16 1.41Wild Animal 14 2 16 1.41Defective Brakes 12 2 14 1.23Cutting In 13 0 13 1.15Road/Intersection Design 12 1 13 1.15Roadside Hazard 11 0 11 0.97Extreme Fatigue 9 1 10 0.88Other 180 15 195 17.20Unknown 61 5 66 5.82Note:1) The table shown above represents the contributing factors assigned to theheavy commercial vehicle drivers involved in these collisions. "Collisions" representsthe number of collisions in which the contributing factor was present, not the total number of occurrences of the contributing factor. Some double counting of collisionsoccurs in this table. For example, a collision attributed to alcoholsuspected and exceeding speed limit would be counted above as both an alcoholrelated collision, and a speed related collision. "Percent of Total"represents the collisions involving the factor as a percentage of total heavy commercialvehicle casualty collisions recorded in 2006.2) "Other" includes specified factors with less than 10 occurrences plus unspecified other.
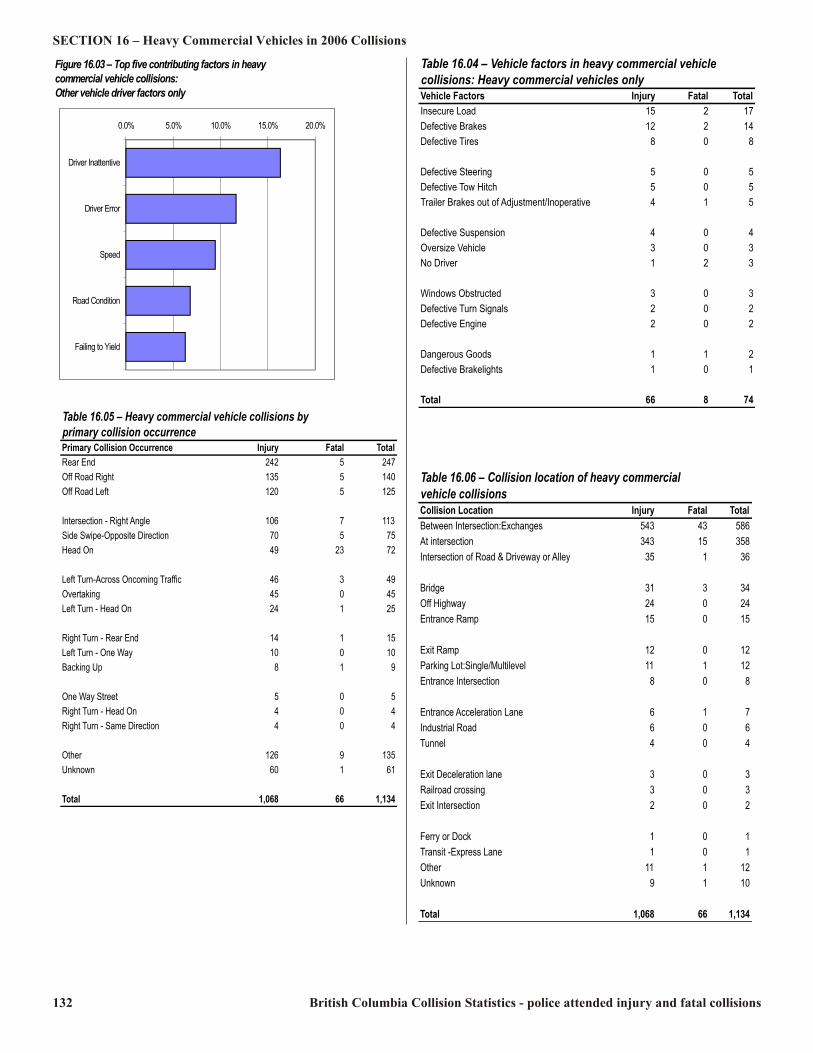
132 British Columbia Collision Statistics - police attended injury and fatal collisions
SECTION 16 – Heavy Commercial Vehicles in 2006 CollisionsFigure 16.03 – Top five contributing factors in heavycommercial vehicle collisions:Other vehicle driver factors only0.0% 5.0% 10.0% 15.0% 20.0%
Driver InattentiveDriver Error
SpeedRoad ConditionFailing to Yield
Table 16.04 – Vehicle factors in heavy commercial vehiclecollisions: Heavy commercial vehicles onlyVehicle Factors Injury Fatal TotalInsecure Load 15 2 17Defective Brakes 12 2 14Defective Tires 8 0 8Defective Steering 5 0 5Defective Tow Hitch 5 0 5Trailer Brakes out of Adjustment/Inoperative 4 1 5Defective Suspension 4 0 4Oversize Vehicle 3 0 3No Driver 1 2 3Windows Obstructed 3 0 3Defective Turn Signals 2 0 2Defective Engine 2 0 2Dangerous Goods 1 1 2Defective Brakelights 1 0 1Total 66 8 74Table 16.05 – Heavy commercial vehicle collisions by primary collision occurrencePrimary Collision Occurrence Injury Fatal TotalRear End 242 5 247Off Road Right 135 5 140Off Road Left 120 5 125
Intersection - Right Angle 106 7 113Side Swipe-Opposite Direction 70 5 75Head On 49 23 72Left Turn-Across Oncoming Traffic 46 3 49Overtaking 45 0 45Left Turn - Head On 24 1 25Right Turn - Rear End 14 1 15Left Turn - One Way 10 0 10Backing Up 8 1 9One Way Street 5 0 5Right Turn - Head On 4 0 4Right Turn - Same Direction 4 0 4Other 126 9 135Unknown 60 1 61Total 1,068 66 1,134
Table 16.06 – Collision location of heavy commercialvehicle collisionsCollision Location Injury Fatal TotalBetween Intersection:Exchanges 543 43 586At intersection 343 15 358Intersection of Road & Driveway or Alley 35 1 36Bridge 31 3 34Off Highway 24 0 24Entrance Ramp 15 0 15Exit Ramp 12 0 12Parking Lot:Single/Multilevel 11 1 12Entrance Intersection 8 0 8Entrance Acceleration Lane 6 1 7Industrial Road 6 0 6Tunnel 4 0 4Exit Deceleration lane 3 0 3Railroad crossing 3 0 3Exit Intersection 2 0 2Ferry or Dock 1 0 1Transit -Express Lane 1 0 1Other 11 1 12Unknown 9 1 10Total 1,068 66 1,134

British Columbia Collision Statistics - police attended injury and fatal collisions 133
Heavy Commercial Vehicles in 2006 Collisions – SECTION 16Table 16.07 – Heavy commercial vehicle collisions by roadway surface conditionRoadway Surface Condition Injury Fatal TotalDry 632 41 673Wet 251 11 262Muddy 5 0 5Snow 70 4 74Slush 35 1 36Ice 71 8 79Unknown 4 1 5Total 1,068 66 1,134
Table 16.09 – Heavy commercial vehicle collisions byweather conditionWeather Injury Fatal TotalClear 511 28 539Cloudy 318 24 342Raining 124 7 131Snowing 90 6 96Fog 15 1 16Hail 4 0 4Strong Wind 2 0 2Unknown 4 0 4Total 1,068 66 1,134
Table 16.08 – Heavy commercial vehicle collisions bylighting conditionLighting condition Injury Fatal TotalDaylight 738 39 777Dawn 45 2 47Dusk 22 2 24Dark/Full Illumination 49 3 52Dark/No Illumination 120 13 133Dark/Some Illumination 92 6 98Other 1 0 1Unknown 1 1 2Total 1,068 66 1,134
Table 16.10 – Driver age in heavy commercial vehicle collisions: Heavy commercial vehicle drivers onlyAge Injury Fatal Total17 1 0 118 2 0 219 8 0 820 12 0 1221 9 0 922 13 0 1323 10 0 1024 13 0 1325 25 1 2626-30 112 4 11631-35 123 9 13236-40 132 9 14141-45 166 16 18246-50 159 9 16851-55 128 7 13556-60 89 8 9761-65 52 2 5466-70 20 1 2171-75 8 0 881-85 1 0 1Unknown 50 5 55Total 1,133 71 1,204

134 British Columbia Collision Statistics - police attended injury and fatal collisions
SECTION 16 – Heavy Commercial Vehicles in 2006 Collisions
Table 16.12 – BC driver licence class of heavy commercial vehicle drivers by vehicle type: Fatal collisionsVehicle Type 100 160 200 300 500 000 Other TotalTractor Trailer 18 4 0 0 0 0 7 29Single Unit Truck/ Heavy 2 1 0 1 5 0 6 15Tractor Trailer & Pup 5 3 0 0 0 0 1 9Log Truck & Pole Trailer 8 0 0 0 0 1 0 9Heavy Truck/Trailer 3 0 0 0 1 0 1 5Local Transit Bus 1 0 1 0 0 0 1 3Intercity Bus 1 0 0 0 0 0 0 1Total 38 8 1 1 6 1 16 71Note:1) This table lists all combinations of valid B.C. licence classes. Out-of-province drivers are all grouped under "Other". 2) "100" to "560" refers to driver licence classes 1 to 5. "360", for example, is a combination of class 3 and class 6.3) For a description of BC driver licence classes, see Table 5.05.
Table 16.11 – BC driver licence class of heavy commercial vehicle drivers by vehicle type: Injury collisionsVehicle Type 100 160 200 230 260 300 340 346 360 400 460 500 560 700 000 Other TotalSingle Unit Truck/ Heavy 64 17 2 2 0 35 3 2 5 8 2 127 20 16 1 33 337Heavy Truck/Trailer 41 10 1 0 0 0 1 1 0 1 0 6 1 2 0 20 84Tractor Trailer 258 67 0 0 0 1 0 0 0 0 0 5 0 1 3 132 467Tractor Trailer & Pup 53 16 0 0 0 0 0 0 0 0 0 0 1 0 0 13 83Log Truck & Pole Trailer 52 10 0 0 0 0 0 0 0 0 0 0 0 0 0 3 65Local Transit Bus 12 7 26 2 12 0 0 0 0 8 0 1 1 0 0 13 82Intercity Bus 4 2 0 0 0 0 0 0 0 2 0 0 0 0 0 7 15Total 484 129 29 4 12 36 4 3 5 19 2 139 23 19 4 221 1,133Note:1) This table lists all combinations of valid BC licence classes. Out-of-province drivers are all grouped under "Other". 2) "100" to "700" refers to driver licence classes 1 to 7. "340", for example, is a combination of class 3 and class 43) For a description of BC driver licence classes, see Table 5.05.

British Columbia Collision Statistics - police attended injury and fatal collisions 135
Table 17.01 – Collisions and victims by police jurisdiction in Southeast District (RCMP)Collisions VictimsPDO Injury Fatal Injured Killed Attended Unattended Attended Unattended Total Attended Unattended TotalArmstrong Provincial 75 13 60 4 2 154 84 4 2 90Ashcroft Provincial 60 26 44 2 1 133 67 4 2 73Barriere Provincial 32 19 46 7 3 107 68 9 4 81Boundary-Grand Forks Provincial 69 44 48 7 4 172 77 14 5 96Boundary-Midway Provincial 41 22 31 3 2 99 44 6 2 52Castlegar Municipal 65 24 21 5 0 115 24 6 0 30Castlegar Provincial 66 24 55 2 3 150 86 3 3 92Chase Provincial 105 25 45 3 2 180 68 4 2 74Clearwater Provincial 2 2 1 0 3 8 3 0 4 7Clinton Provincial 40 23 44 4 1 112 71 4 1 76Coldstream Municipal 53 3 20 3 0 79 26 4 0 30Columbia Valley Provincial 145 110 56 7 2 320 82 8 2 92Cranbrook Municipal 145 50 52 5 2 254 73 5 3 81Cranbrook Provincial 133 49 73 5 4 264 102 6 5 113Creston Provincial 96 35 58 7 3 199 84 8 3 95Elk Valley Provincial (Sparwood) 57 25 19 1 2 104 28 1 3 32Elkford Provincial 23 15 3 1 1 43 3 1 1 5Enderby Provincial 90 20 49 6 2 167 66 8 2 76Falkland Provincial 31 9 27 0 1 68 38 0 1 39Fernie 27 12 12 1 0 52 14 1 0 15Fernie Provincial 53 29 35 5 3 125 53 8 3 64Golden/Field 7 2 5 1 0 15 9 1 0 10Golden/Field Provincial 175 68 90 15 3 351 152 18 3 173Kamloops Municipal 776 319 471 84 4 1,654 671 104 4 779Kaslo Provincial 19 10 16 1 0 46 22 1 0 23Kelowna Municipal 890 173 715 55 7 1,840 1,012 71 7 1,090Kelowna Provincial 351 49 290 21 4 715 404 26 4 434Keremeos Provincial 40 9 26 1 2 78 39 1 2 42Kimberley Municipal 35 11 15 1 0 62 18 1 0 19Kimberley Provincial 32 26 17 2 1 78 34 2 1 37Lake Country Municipal 74 10 55 3 2 144 81 3 2 86Lillooet Provincial 6 2 3 1 1 13 5 1 1 7Logan Lake Provincial 39 16 27 5 1 88 38 6 1 45Lumby Provincial 40 14 32 6 1 93 43 6 1 50Lytton Provincial 36 12 37 5 1 91 51 5 1 57Merritt Municipal 77 9 37 3 1 127 71 3 1 75Merritt Provincial 191 23 164 8 8 394 262 15 10 287Nakusp Provincial 29 18 30 2 0 79 41 3 0 44Nelson Provincial 86 30 53 4 0 173 70 5 0 75Penticton Municipal 283 17 118 4 1 423 157 4 1 162Penticton Provincial 120 7 73 4 2 206 99 7 2 108Princeton Provincial 139 32 77 5 2 255 116 5 2 123Revelstoke Municipal 60 26 22 3 1 112 30 5 1 36Revelstoke Provincial 100 39 72 6 4 221 118 8 7 133South Okanagan-Oliver Provincial 58 18 42 3 2 123 57 3 2 62South Okanagan-Osoyoos Provincial 72 24 49 5 1 151 67 8 1 76Salmo Provincial 54 16 36 3 2 111 47 4 2 53Salmon Arm Municipal 128 25 70 8 3 234 95 11 3 109Salmon Arm Provincial 67 14 51 5 1 138 68 5 1 74Sicamous Provincial 49 22 37 1 2 111 63 1 2 66Slocan Lake Provincial 12 8 15 1 1 37 16 1 1 18Spallumcheen Municipal 1 0 2 0 0 3 2 0 0 2Summerland Municipal 59 8 31 1 0 99 36 1 0 37T'Kumlups Provincial 120 53 107 6 8 294 157 8 10 175Trail Municipal 58 8 26 1 0 93 37 1 0 38Trail and Greater District Provincial 55 11 43 2 2 113 60 2 2 64Vernon Municipal 362 45 176 29 4 616 216 33 5 254Vernon Provincial 129 6 94 4 4 237 124 4 4 132Total 6,237 1,759 4,023 387 117 12,523 5,749 487 132 6,368
Police Jurisdiction Report SECTION 17
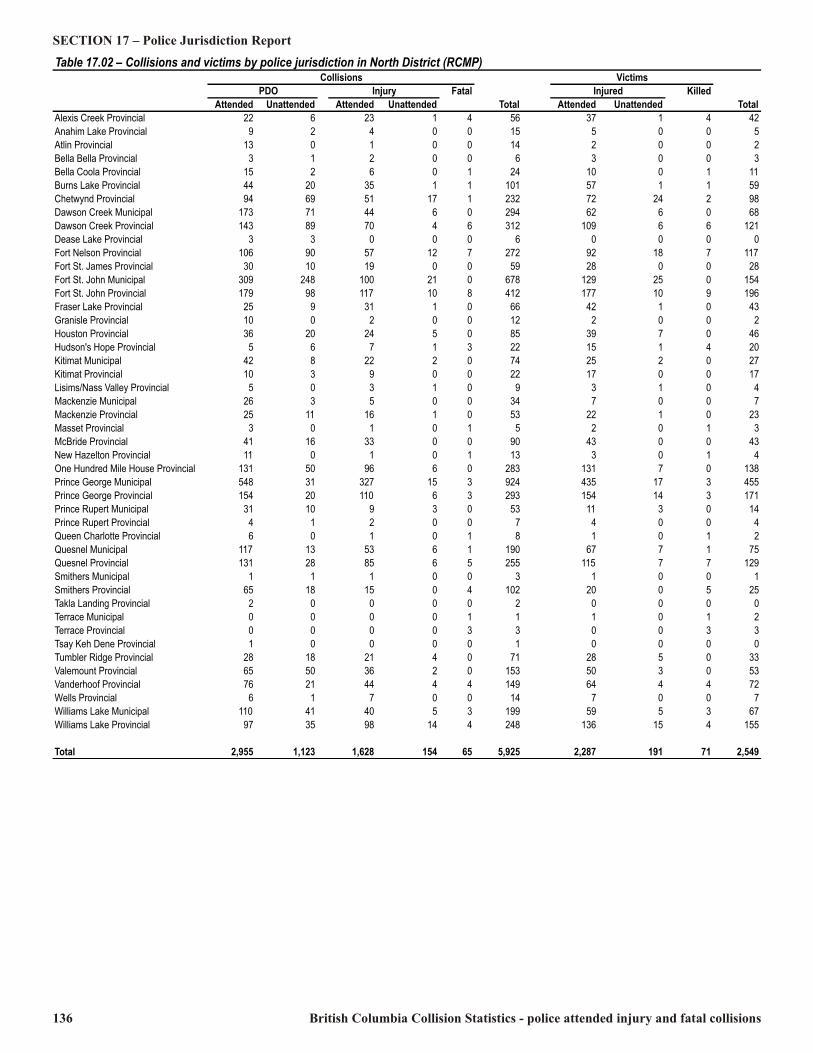
136 British Columbia Collision Statistics - police attended injury and fatal collisions
SECTION 17 – Police Jurisdiction ReportTable 17.02 – Collisions and victims by police jurisdiction in North District (RCMP)Collisions VictimsPDO Injury Fatal Injured Killed Attended Unattended Attended Unattended Total Attended Unattended TotalAlexis Creek Provincial 22 6 23 1 4 56 37 1 4 42Anahim Lake Provincial 9 2 4 0 0 15 5 0 0 5Atlin Provincial 13 0 1 0 0 14 2 0 0 2Bella Bella Provincial 3 1 2 0 0 6 3 0 0 3Bella Coola Provincial 15 2 6 0 1 24 10 0 1 11Burns Lake Provincial 44 20 35 1 1 101 57 1 1 59Chetwynd Provincial 94 69 51 17 1 232 72 24 2 98Dawson Creek Municipal 173 71 44 6 0 294 62 6 0 68Dawson Creek Provincial 143 89 70 4 6 312 109 6 6 121Dease Lake Provincial 3 3 0 0 0 6 0 0 0 0Fort Nelson Provincial 106 90 57 12 7 272 92 18 7 117Fort St. James Provincial 30 10 19 0 0 59 28 0 0 28Fort St. John Municipal 309 248 100 21 0 678 129 25 0 154Fort St. John Provincial 179 98 117 10 8 412 177 10 9 196Fraser Lake Provincial 25 9 31 1 0 66 42 1 0 43Granisle Provincial 10 0 2 0 0 12 2 0 0 2Houston Provincial 36 20 24 5 0 85 39 7 0 46Hudson's Hope Provincial 5 6 7 1 3 22 15 1 4 20Kitimat Municipal 42 8 22 2 0 74 25 2 0 27Kitimat Provincial 10 3 9 0 0 22 17 0 0 17Lisims/Nass Valley Provincial 5 0 3 1 0 9 3 1 0 4Mackenzie Municipal 26 3 5 0 0 34 7 0 0 7Mackenzie Provincial 25 11 16 1 0 53 22 1 0 23Masset Provincial 3 0 1 0 1 5 2 0 1 3McBride Provincial 41 16 33 0 0 90 43 0 0 43New Hazelton Provincial 11 0 1 0 1 13 3 0 1 4One Hundred Mile House Provincial 131 50 96 6 0 283 131 7 0 138Prince George Municipal 548 31 327 15 3 924 435 17 3 455Prince George Provincial 154 20 110 6 3 293 154 14 3 171Prince Rupert Municipal 31 10 9 3 0 53 11 3 0 14Prince Rupert Provincial 4 1 2 0 0 7 4 0 0 4Queen Charlotte Provincial 6 0 1 0 1 8 1 0 1 2Quesnel Municipal 117 13 53 6 1 190 67 7 1 75Quesnel Provincial 131 28 85 6 5 255 115 7 7 129Smithers Municipal 1 1 1 0 0 3 1 0 0 1Smithers Provincial 65 18 15 0 4 102 20 0 5 25Takla Landing Provincial 2 0 0 0 0 2 0 0 0 0Terrace Municipal 0 0 0 0 1 1 1 0 1 2Terrace Provincial 0 0 0 0 3 3 0 0 3 3Tsay Keh Dene Provincial 1 0 0 0 0 1 0 0 0 0Tumbler Ridge Provincial 28 18 21 4 0 71 28 5 0 33Valemount Provincial 65 50 36 2 0 153 50 3 0 53Vanderhoof Provincial 76 21 44 4 4 149 64 4 4 72Wells Provincial 6 1 7 0 0 14 7 0 0 7Williams Lake Municipal 110 41 40 5 3 199 59 5 3 67Williams Lake Provincial 97 35 98 14 4 248 136 15 4 155Total 2,955 1,123 1,628 154 65 5,925 2,287 191 71 2,549

137 British Columbia Collision Statistics - police attended injury and fatal collisions
SECTION 17 – Police Jurisdiction ReportTable 17.03 – Collisions and victims by police jurisdiction in Lower Mainland District (RCMP)Collisions VictimsPDO Injury Fatal Injured Killed Attended Unattended Attended Unattended Total Attended Unattended TotalAgassiz Provincial 65 1 65 1 2 134 94 1 2 97Boston Bar Provincial 14 1 18 1 0 34 24 1 0 25Bowen Island Provincial 9 1 7 1 0 18 8 1 0 9Burnaby Municipal 469 40 725 10 3 1,247 981 11 4 996Chilliwack Municipal 428 28 335 15 6 812 456 17 6 479Chilliwack Provincial 35 3 33 1 1 73 49 2 1 52Coquitlam Municipal 561 6 382 4 9 962 516 4 9 529Coquitlam Provincial 7 1 10 0 0 18 13 0 0 13Hope Municipal 49 6 35 3 0 93 46 4 0 50Hope Provincial 118 15 102 3 11 249 157 3 11 171Langley City Municipal 197 4 162 2 1 366 216 2 1 219Langley Township Municipal 589 6 408 5 4 1,012 556 5 5 566Maple Ridge Municipal 332 30 314 11 4 691 420 11 4 435Mission Municipal 236 10 163 4 4 417 235 5 4 244Mission Provincial 39 1 32 0 0 72 48 0 0 48North Vancouver City Municipal 331 24 154 12 2 523 192 13 2 207North Vancouver District Municipal 339 23 159 6 0 527 198 6 0 204Pemberton Provincial 30 9 22 0 0 61 28 0 0 28Pitt Meadows Municipal 89 7 50 1 1 148 64 1 1 66Port Coquitlam Municipal 202 11 178 7 2 400 245 8 2 255Richmond Municipal 388 54 388 8 10 848 508 12 12 532Ridge Meadows Provincial 19 0 12 0 0 31 15 0 0 15Sechelt Municipal 64 6 38 0 0 108 46 0 0 46Sechelt Provincial 75 6 56 0 5 142 78 0 6 84Squamish Municipal 92 8 65 5 2 172 88 5 2 95Squamish Provincial 90 5 50 1 0 146 75 1 0 76Sunshine Coast Provincial 38 4 28 2 0 72 36 2 0 38Surrey Municipal 1,879 37 1,829 33 19 3,797 2,735 42 24 2,801Surrey Provincial 0 1 0 0 0 1 0 0 0 0University Provincial 22 3 24 2 2 53 29 2 2 33Whistler Municipal 41 5 20 0 1 67 32 0 1 33Whistler Provincial 65 5 43 0 0 113 66 0 0 66White Rock Municipal 76 4 43 2 0 125 55 2 0 57Total 6,988 365 5,950 140 89 13,532 8,309 161 99 8,569

British Columbia Collision Statistics - police attended injury and fatal collisions 138
Police Jurisdiction Report – SECTION 17Table 17.04 – Collisions and victims by police jurisdiction in Island District (RCMP)Collisions VictimsPDO Injury Fatal Injured Killed Attended Unattended Attended Unattended Total Attended Unattended TotalAlert Bay Provincial 7 1 1 0 1 10 1 0 1 2Campbell River Municipal 210 33 117 13 1 374 147 17 1 165Campbell River Provincial 48 7 51 2 3 111 80 2 3 85Colwood Municipal 94 14 43 8 0 159 56 9 0 65Comox Municipal 28 3 34 3 0 68 45 3 0 48Comox Valley Provincial 149 13 105 8 4 279 144 8 4 156Courtenay Municipal 162 10 131 11 3 317 188 12 3 203Duncan Provincial 157 25 110 7 0 299 155 7 0 162Gabriola Island Provincial 21 3 16 3 1 44 20 3 1 24Ladysmith Municipal 46 10 16 0 0 72 21 0 0 21Ladysmith Provincial 68 8 34 1 1 112 44 1 1 46Lake Cowichan Provincial 58 5 36 0 1 100 53 0 1 54Langford Municipal 201 27 129 8 1 366 162 8 1 171Nanaimo Municipal 605 135 379 38 4 1,161 520 45 6 571Nanaimo Provincial 57 21 44 4 2 128 61 6 3 70Nootka Sound (Gold River) Provincial 17 7 14 2 0 40 21 3 0 24North Cowichan Municipal 188 19 150 13 1 371 210 17 1 228North Saanich Municipal 48 9 28 5 0 90 41 8 0 49Oceanside Provincial (Parksville) 159 16 129 1 5 310 179 1 5 185Outer Gulf Islands Provincial 16 7 11 2 1 37 23 3 2 28Parksville Municipal 95 5 56 1 0 157 65 1 0 66Port Alberni Municipal 143 22 80 5 0 250 108 5 0 113Port Alberni Provincial 68 9 53 4 1 135 87 4 2 93Port Alice Provincial 9 4 4 4 0 21 5 4 0 9Port Hardy Municipal 0 0 1 0 0 1 1 0 0 1Port Hardy Provincial 24 3 18 3 0 48 23 4 0 27Port McNeill Provincial 44 8 24 5 0 81 29 8 0 37Powell River Municipal 47 8 22 1 2 80 29 2 2 33Powell River Provincial 21 2 16 2 1 42 23 3 2 28Quadra Island Provincial 7 1 6 0 0 14 6 0 0 6Qualicum Beach Municipal 51 9 37 0 1 98 52 0 1 53Saltspring Island Provincial 59 16 60 3 1 139 87 3 1 91Sayward Provincial 40 2 32 0 3 77 54 0 4 58Shawnigan Lake Provincial 123 21 92 4 1 241 142 5 1 148Sidney Municipal 76 22 37 4 0 139 51 4 0 55Sidney Provincial 11 2 11 0 0 24 13 0 0 13Sooke Provincial 75 15 40 3 1 134 66 3 1 70Texada Island Provincial 2 0 2 3 0 7 5 5 0 10Tofino Provincial 31 8 12 1 0 52 17 1 0 18Ucluelet Provincial 44 12 40 2 1 99 74 2 2 78View Royal Municipal 90 5 57 2 0 154 67 3 0 70West Shore Provincial 67 6 29 1 1 104 42 2 1 45Total 3,466 553 2,307 177 42 6,545 3,217 212 50 3,479
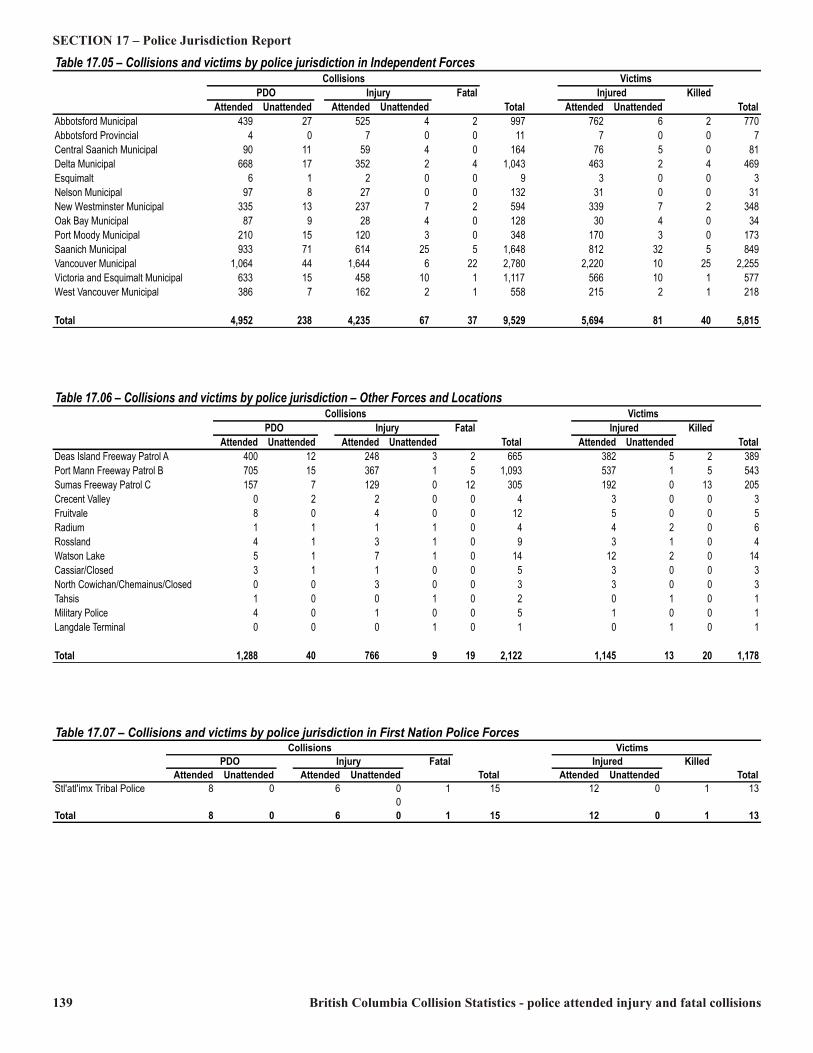
139 British Columbia Collision Statistics - police attended injury and fatal collisions
SECTION 17 – Police Jurisdiction ReportTable 17.05 – Collisions and victims by police jurisdiction in Independent ForcesCollisions VictimsPDO Injury Fatal Injured Killed Attended Unattended Attended Unattended Total Attended Unattended TotalAbbotsford Municipal 439 27 525 4 2 997 762 6 2 770Abbotsford Provincial 4 0 7 0 0 11 7 0 0 7Central Saanich Municipal 90 11 59 4 0 164 76 5 0 81Delta Municipal 668 17 352 2 4 1,043 463 2 4 469Esquimalt 6 1 2 0 0 9 3 0 0 3Nelson Municipal 97 8 27 0 0 132 31 0 0 31New Westminster Municipal 335 13 237 7 2 594 339 7 2 348Oak Bay Municipal 87 9 28 4 0 128 30 4 0 34Port Moody Municipal 210 15 120 3 0 348 170 3 0 173Saanich Municipal 933 71 614 25 5 1,648 812 32 5 849Vancouver Municipal 1,064 44 1,644 6 22 2,780 2,220 10 25 2,255Victoria and Esquimalt Municipal 633 15 458 10 1 1,117 566 10 1 577West Vancouver Municipal 386 7 162 2 1 558 215 2 1 218Total 4,952 238 4,235 67 37 9,529 5,694 81 40 5,815
Table 17.06 – Collisions and victims by police jurisdiction – Other Forces and LocationsCollisions VictimsPDO Injury Fatal Injured Killed Attended Unattended Attended Unattended Total Attended Unattended TotalDeas Island Freeway Patrol A 400 12 248 3 2 665 382 5 2 389Port Mann Freeway Patrol B 705 15 367 1 5 1,093 537 1 5 543Sumas Freeway Patrol C 157 7 129 0 12 305 192 0 13 205Crecent Valley 0 2 2 0 0 4 3 0 0 3Fruitvale 8 0 4 0 0 12 5 0 0 5Radium 1 1 1 1 0 4 4 2 0 6Rossland 4 1 3 1 0 9 3 1 0 4Watson Lake 5 1 7 1 0 14 12 2 0 14Cassiar/Closed 3 1 1 0 0 5 3 0 0 3North Cowichan/Chemainus/Closed 0 0 3 0 0 3 3 0 0 3Tahsis 1 0 0 1 0 2 0 1 0 1Military Police 4 0 1 0 0 5 1 0 0 1Langdale Terminal 0 0 0 1 0 1 0 1 0 1Total 1,288 40 766 9 19 2,122 1,145 13 20 1,178
Table 17.07 – Collisions and victims by police jurisdiction in First Nation Police ForcesCollisions VictimsPDO Injury Fatal Injured Killed Attended Unattended Attended Unattended Total Attended Unattended TotalStl'atl'imx Tribal Police 8 0 6 0 1 15 12 0 1 130Total 8 0 6 0 1 15 12 0 1 13