tract mapping with the american community survey
DESCRIPTION
Tract Mapping with the American Community Survey. Carol O. Rogers Deputy Director and CIO. Rachel Justis Geodemographic Analyst. What are the ACS 5-year estimates?. First-ever released December 14, 2010 NOT Census 2010 data - PowerPoint PPT PresentationTRANSCRIPT

Indiana Business Research Center March 1, 2011
TRACT MAPPING WITH THE AMERICAN COMMUNITY SURVEY
Carol O. RogersDeputy Director and CIO
Rachel JustisGeodemographic Analyst

Indiana Business Research Center March 1, 2011
What are the ACS 5-year estimates?
First-ever released December 14, 2010
• NOT Census 2010 data
• Data collected from January 1, 2005 to December 31, 2009 and are an average for the entire period.
• Available for every state, county, city, town, place, as well as for census tracts and block groups.

Indiana Business Research Center March 1, 2011
The estimates cover many topics
• Education
• Industry
• Place of work
• Travel time
• Heating fuel
• Type of home (bedrooms, age, bathrooms)
• Income, poverty
• Much more …

Indiana Business Research Center March 1, 2011
Are the estimates any good?
• Sure, if used properly.
• Users should pay attention to the margin of error.
• If it is bigger than the estimate, use caution.
• Useful for planning and context.

Indiana Business Research Center March 1, 2011
Margins of error get LARGER as the size of the population gets SMALLER
Travel Time to Work for Workers 16 or Older
Indiana Marion County Ohio County
Estimate MOE +/- Estimate MOE +/- Estimate MOE +/-
Less than 5 minutes 120,195 2,379 2% 9,946 861 9% 229 77 34%
5 to 9 minutes 360,077 4,197 1% 37,285 1,675 4% 300 92 31%
20 to 24 minutes 429,050 4,303 1% 80,890 2,078 3% 470 108 23%
25 to 29 minutes 189,177 2,981 2% 35,314 1,205 3% 184 84 46%
60 to 89 minutes 101,849 2,078 2% 8,286 668 8% 268 99 37%
90 or more minutes 50,480 1,607 3% 5,276 617 12% 57 42 74%

Indiana Business Research Center March 1, 2011
Fast Facts about Tracts
• 1,414 tracts statewide
• Relatively equal population
• Can cross city-town boundaries, but are completely contained in a single county
• Semi-permanent, but boundaries can change
File layout example:

Indiana Business Research Center March 1, 2011
Northeast Marion County Tract Changes
Marion Co Tract - 2010 Marion Co Tract - 2000
Marion Co Tract - 2010 Marion Co Tract - 200020002010
These tracts were combined
These tracts were split

Indiana Business Research Center March 1, 2011
A Closer Look at Kosciusko County

Indiana Business Research Center March 1, 2011
Linguistically Isolated Spanish-Speaking Households in Kosciusko County
TractNumber of Households
Margin of Error
Confidence Interval
9617 137 75 62-212
9624 94 80 14-174
9612 79 59 20-138
9618 74 59 15-133
9619 54 51 3-105
9620 53 50 3-103
9611 47 37 10-84
9621 47 55 0-102
9613 22 23 0-45
9622 17 21 0-38
TractNumber of Households
Margin of Error
Confidence Interval
9625 16 24 0-40
9623 13 23 0-36
9610 11 22 0-33
9609 0 119 0-119
9614 0 119 0-119
9615 0 119 0-119
9616 0 119 0-119
9626 0 119 0-119
9627 0 119 0-119
Indiana Business Research Center March 1, 2011
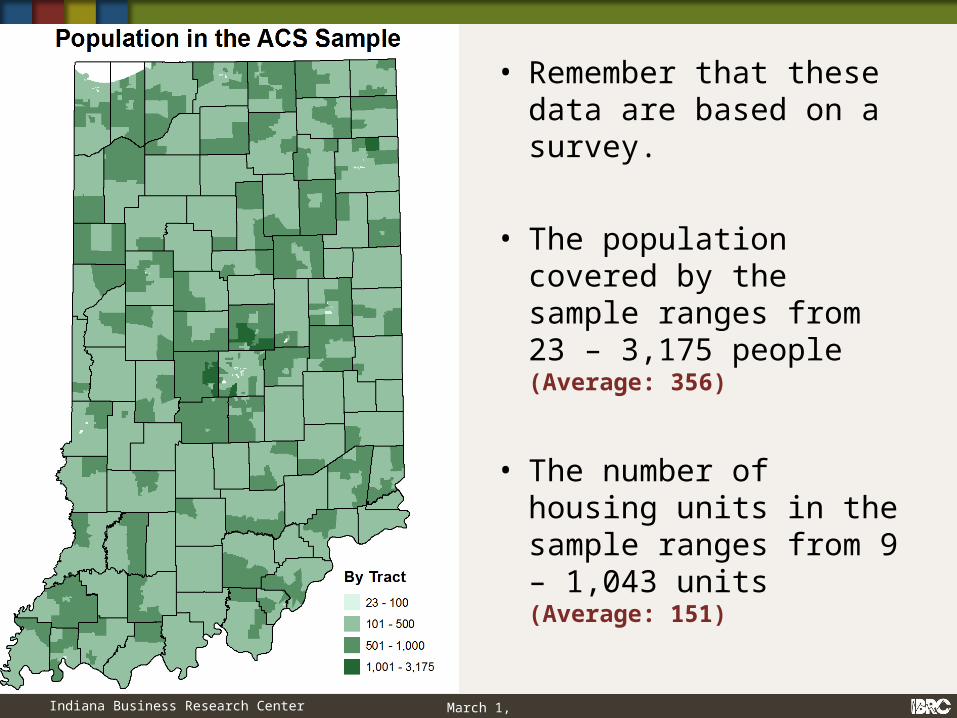
• Remember that these data are based on a survey.
• The population covered by the sample ranges from 23 – 3,175 people (Average: 356)
• The number of housing units in the sample ranges from 9 – 1,043 units (Average: 151)

Indiana Business Research Center March 1, 2011

Indiana Business Research Center March 1, 2011
Where does that leave us?
• Use the data, but don’t ignore the margins of error!

Indiana Business Research Center March 1, 2011
Census 2010
• Counts, not estimates
• But not much data:
population,age, race, sex, housing units vacant, occupied
www.stats.indiana.eduGo to the Census Topic Page

Indiana Business Research Center March 1, 2011
Obtaining the data
STATS Indiana www.stats.indiana.edu
American FactFinderFactfinder.census.gov
Or send requests to [email protected]