the warehouse productivity benchmark report - …€¦ · the warehouse productivity benchmark...
TRANSCRIPT
The Warehouse Productivity Benchmark Report
A Guide to Improved Warehouse and Distribution Center Performance
October 2006
The Warehouse Management Benchmark Report
All print and electronic rights are the property of Aberdeen Group © 2006. Aberdeen Group • i
Executive Summary
For many companies, improved warehouse and distribution center productivity remains a goal, not a reality. Although companies’ top focus in warehouse improvement is cutting logistics costs, 6 out of 10 respondents report that they have not been able to lower costs in the last two years. A majority of companies have also been unable to reduce customer order cycle times.
However, a segment of companies have been able to reduce both costs and cycle times. These top performers are leveraging more technology, have better data visibility, and work harder at cross-training their staffs.
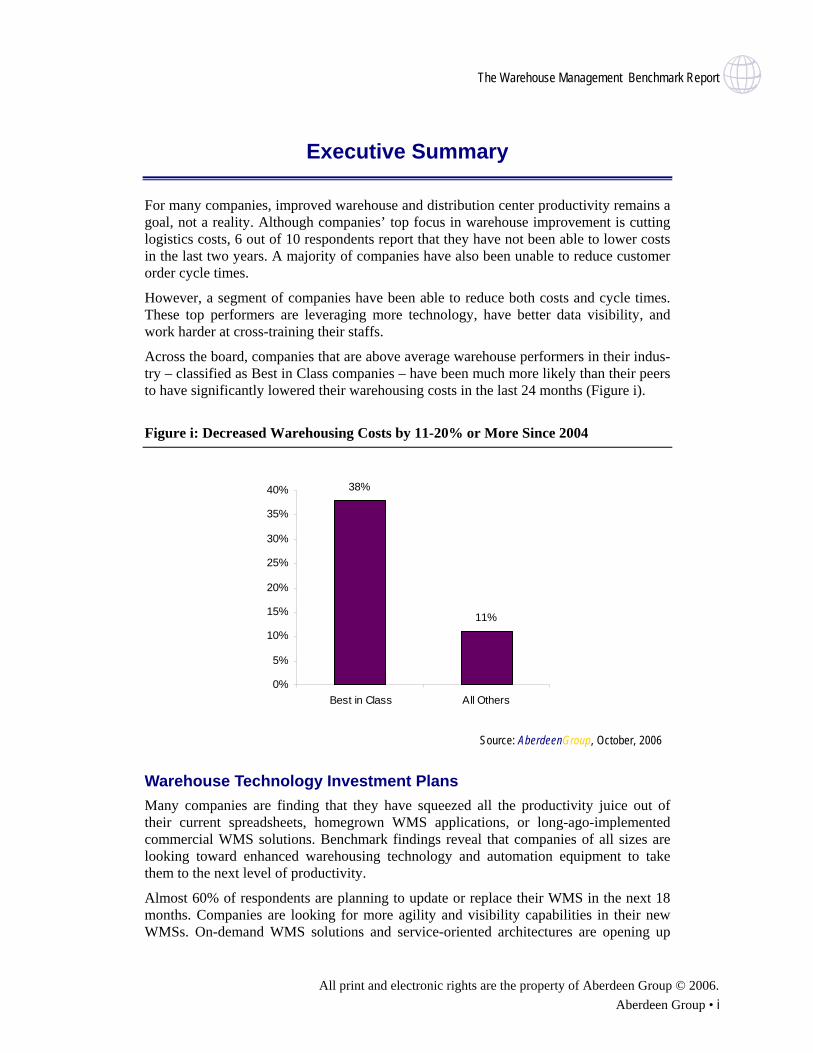
Across the board, companies that are above average warehouse performers in their indus-try – classified as Best in Class companies – have been much more likely than their peers to have significantly lowered their warehousing costs in the last 24 months (Figure i).
Figure i: Decreased Warehousing Costs by 11-20% or More Since 2004
38%
11%
0%
5%
10%
15%
20%
25%
30%
35%
40%
Best in Class All Others
Source: AberdeenGroup, October, 2006
Warehouse Technology Investment Plans Many companies are finding that they have squeezed all the productivity juice out of their current spreadsheets, homegrown WMS applications, or long-ago-implemented commercial WMS solutions. Benchmark findings reveal that companies of all sizes are looking toward enhanced warehousing technology and automation equipment to take them to the next level of productivity.
Almost 60% of respondents are planning to update or replace their WMS in the next 18 months. Companies are looking for more agility and visibility capabilities in their new WMSs. On-demand WMS solutions and service-oriented architectures are opening up
The Warehouse Managemet Benchmark Report
All print and electronic rights are the property of Aberdeen Group © 2006. ii • Aberdeen Group
new opportunities to harness the power of warehouse management software while mini-mizing IT integration and implementation challenges.
Recommendations for Action This report provides benchmarks and best practice examples for small, midsize, and large warehouse and distribution center operators. To improve warehouse performance, com-panies should be prioritizing:
• Actively moving toward an automated warehouse management system that pro-vides corporate visibility into warehouse activities and supports workflow agility
• Rolling out labor management planning and reporting capabilities
• Seeking to use slotting and warehouse layout tools, increased material handling automation, or experienced systems integrators to drive more productivity in confined warehouse footprints
• Focusing on warehouse analytics to improve productivity and gross margin man-agement
The Warehouse Management Benchmark Report
All print and electronic rights are the property of Aberdeen Group © 2006. Aberdeen Group
Table of Contents
Executive Summary .............................................................................................. i Warehouse Technology Investment Plans ...................................................... i Recommendations for Action..........................................................................ii
Chapter One: Issue at Hand.................................................................................1 Top Warehousing Pressures.......................................................................... 1 Warehouse Cost Challenges ......................................................................... 2 Order Cycle Time Challenges........................................................................ 3 Warehousing Productivity Challenges by Company Size .............................. 4 Ignored the Data in the Corner ...................................................................... 5 Pulling the Right Productivity Levers ............................................................. 5
Chapter Two: Key Business Value Findings .........................................................7 What Best in Class Do Differently.................................................................. 8
Technology Is Driving Best in Class Performance................................... 8 Best in Class Training Philosophies ........................................................ 8
Barriers to Improving Warehouse Productivity............................................... 8 Overcoming Productivity Barriers .................................................................. 9
Chapter Three: Implications & Analysis............................................................. 11 Moving Away from Spreadsheets and Custom Systems ............................. 12
Case Study: Productivity with Enhanced Automation............................ 12 WMS Upgrade Priorities .............................................................................. 13
Wanted: Systems that Support Warehouse Flexibility ........................... 14 Case Study: WMS Drives Flexibility ...................................................... 14
New On-Demand WMS Options.................................................................. 15 Adoption Plans for Warehouse Technology Extensions............................... 15
Analytics Offer Productivity Gains ......................................................... 16 Labor Management Becoming Important Across Industries .................. 16 Case Study: Driving Productivity with Labor Management.................... 17
Throughput Advances via Material Handling Automation............................. 18 Equipment Use Continues to Grow ....................................................... 18
Chapter Four: Recommendations for Action ......................................................19 Competitive Framework............................................................................... 20 Laggard Steps to Success........................................................................... 20
The Warehouse Management Benchmark Report
All print and electronic rights are the property of Aberdeen Group © 2006. Aberdeen Group
Table of Contents Industry Norm Steps to Success ................................................................. 21 Best in Class Next Steps ............................................................................. 21
Appendix A: Research Methodology ..................................................................23
Appendix B: Related Aberdeen Research & Tools .............................................24
About AberdeenGroup ......................................................................................25
The Warehouse Management Benchmark Report
All print and electronic rights are the property of Aberdeen Group © 2006. Aberdeen Group
Figures
Figure i: Decreased Warehousing Costs by 11-20% or More Since 2004 ............. i
Figure 1: Warehousing Pressures Driving Companies to Improve Operations.....2
Figure 2: Change in Warehousing Costs Since 2004 (adjusted for changes in sales volume) ................................................................2
Figure 3: Change in Customer Order Cycle Time Since 2004..............................4
Figure 4: Top Actions Being Planned or Taken to Improve Warehouse Operations............................................................................................................5
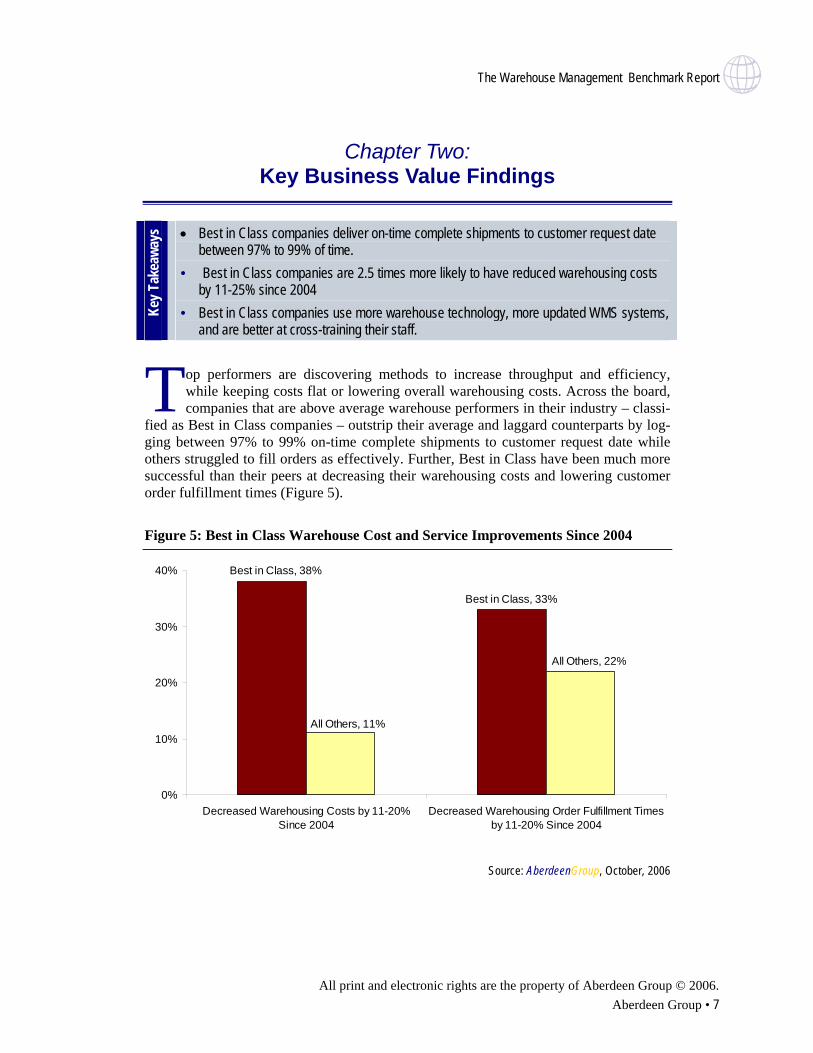
Figure 5: Best in Class Warehouse Cost and Service Improvements Since 2004 ...........................................................................................................7
Figure 6: Top Barriers to Better Warehouse Performance....................................9
Figure 7: Types and Ages of WMSs Used by Respondents ............................... 11
Figure 8: Warehouse Performance: In-House Developed and Custom WMS Users vs. Best of Breed Users ...........................................................................12
Figure 9: Companies’ WMS Upgrade and Implementation Plans.......................13
Figure 10: Top Motivations for Replacing a WMS...............................................14
Figure 11: Labor Management Technology Priorities .........................................17
Tables
Table 1: Warehouse Technology Adoption Rates ...............................................15
Table 2: Planned Warehousing Equipment Expenditures for the Next 18 Months.......................................................................................18
Table 3: Benefits Achieved Through IT Implementations....................................19
Table 4: Competitive Framework for Warehouse Management..........................20
The Warehouse Management Benchmark Report
All print and electronic rights are the property of Aberdeen Group © 2006. Aberdeen Group • 1
Chapter One: Issue at Hand
Key T
akea
ways
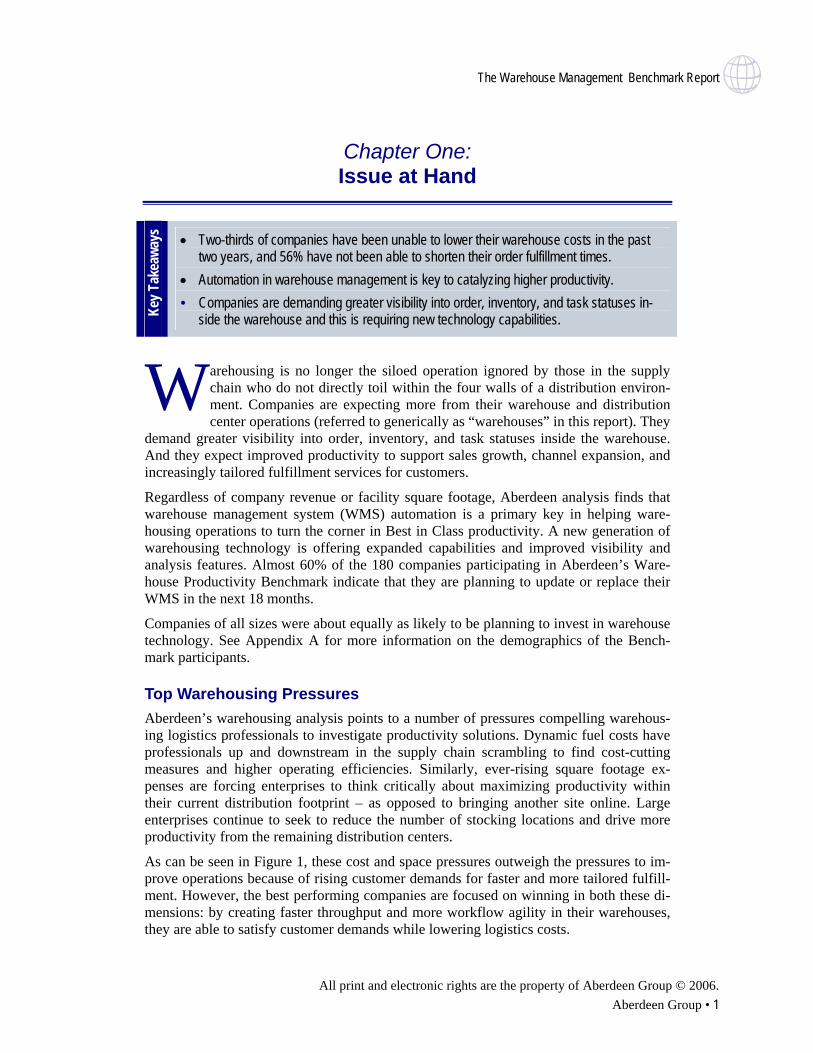
• Two-thirds of companies have been unable to lower their warehouse costs in the past two years, and 56% have not been able to shorten their order fulfillment times.
• Automation in warehouse management is key to catalyzing higher productivity. • Companies are demanding greater visibility into order, inventory, and task statuses in-
side the warehouse and this is requiring new technology capabilities.
arehousing is no longer the siloed operation ignored by those in the supply chain who do not directly toil within the four walls of a distribution environ-ment. Companies are expecting more from their warehouse and distribution center operations (referred to generically as “warehouses” in this report). They
demand greater visibility into order, inventory, and task statuses inside the warehouse. And they expect improved productivity to support sales growth, channel expansion, and increasingly tailored fulfillment services for customers.
W Regardless of company revenue or facility square footage, Aberdeen analysis finds that warehouse management system (WMS) automation is a primary key in helping ware-housing operations to turn the corner in Best in Class productivity. A new generation of warehousing technology is offering expanded capabilities and improved visibility and analysis features. Almost 60% of the 180 companies participating in Aberdeen’s Ware-house Productivity Benchmark indicate that they are planning to update or replace their WMS in the next 18 months.
Companies of all sizes were about equally as likely to be planning to invest in warehouse technology. See Appendix A for more information on the demographics of the Bench-mark participants.
Top Warehousing Pressures Aberdeen’s warehousing analysis points to a number of pressures compelling warehous-ing logistics professionals to investigate productivity solutions. Dynamic fuel costs have professionals up and downstream in the supply chain scrambling to find cost-cutting measures and higher operating efficiencies. Similarly, ever-rising square footage ex-penses are forcing enterprises to think critically about maximizing productivity within their current distribution footprint – as opposed to bringing another site online. Large enterprises continue to seek to reduce the number of stocking locations and drive more productivity from the remaining distribution centers.
As can be seen in Figure 1, these cost and space pressures outweigh the pressures to im-prove operations because of rising customer demands for faster and more tailored fulfill-ment. However, the best performing companies are focused on winning in both these di-mensions: by creating faster throughput and more workflow agility in their warehouses, they are able to satisfy customer demands while lowering logistics costs.
The Warehouse Management Benchmark Report
All print and electronic rights are the property of Aberdeen Group © 2006. 2 • AberdeenGroup
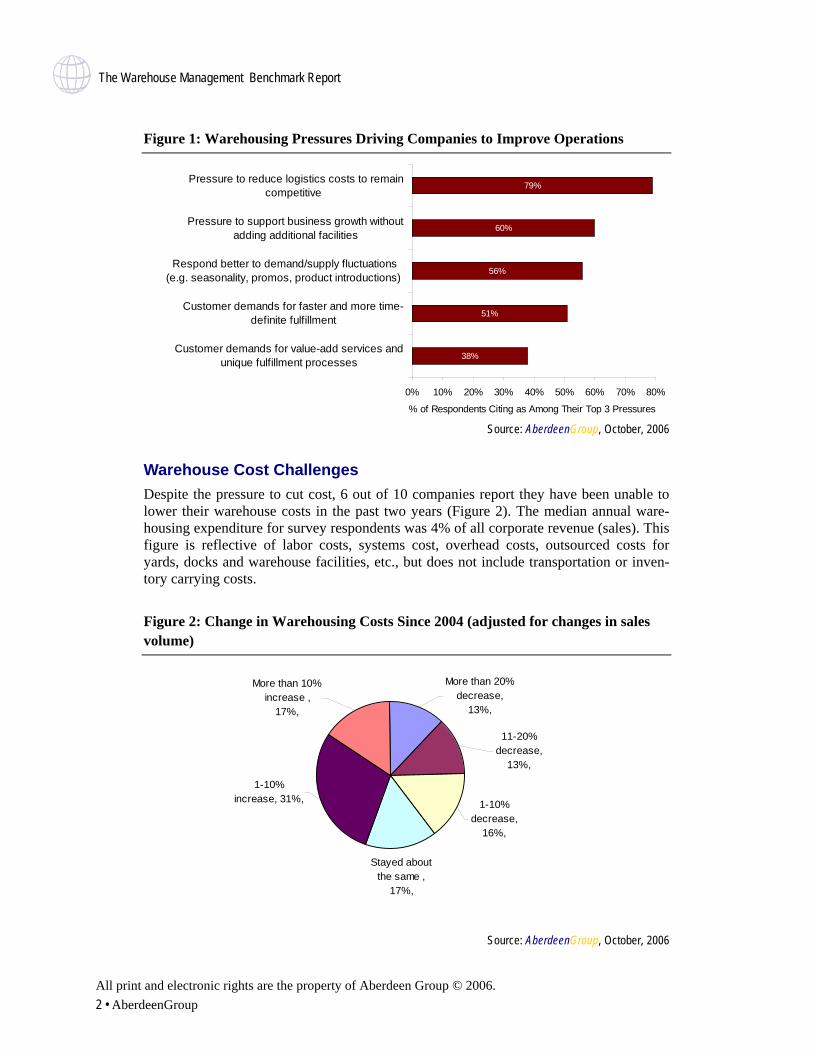
Figure 1: Warehousing Pressures Driving Companies to Improve Operations
38%
51%
56%
60%
79%
0% 10% 20% 30% 40% 50% 60% 70% 80%
Customer demands for value-add services andunique fulfillment processes
Customer demands for faster and more time-definite fulfillment
Respond better to demand/supply fluctuations(e.g. seasonality, promos, product introductions)
Pressure to support business growth withoutadding additional facilities
Pressure to reduce logistics costs to remaincompetitive
% of Respondents Citing as Among Their Top 3 Pressures
Source: AberdeenGroup, October, 2006
Warehouse Cost Challenges Despite the pressure to cut cost, 6 out of 10 companies report they have been unable to lower their warehouse costs in the past two years (Figure 2). The median annual ware-housing expenditure for survey respondents was 4% of all corporate revenue (sales). This figure is reflective of labor costs, systems cost, overhead costs, outsourced costs for yards, docks and warehouse facilities, etc., but does not include transportation or inven-tory carrying costs.
Figure 2: Change in Warehousing Costs Since 2004 (adjusted for changes in sales volume)
Stayed about the same ,
17%,
More than 20% decrease,
13%,
11-20% decrease,
13%,
1-10% decrease,
16%,
1-10% increase, 31%,
More than 10% increase ,
17%,
Source: AberdeenGroup, October, 2006
The Warehouse Management Benchmark Report
All print and electronic rights are the property of Aberdeen Group © 2006. Aberdeen Group • 3
Top cost performers – the 25% of companies that have been able to lower their ware-housing costs by more than 10% since 2004 – are taking some distinct actions. Compared to their lower-performing peers, they are more focused on:
• Creating an agile warehouse environment to support customer-specific demands
• Capturing warehouse metrics and activities and sharing them in real time
• Updating their current WMS system to take advantage of the new generation of technology that is service-oriented in nature and thus eager to integrate and re-configure
• Using warehouse dashboards and analytics technology, which they have im-plemented to a higher degree than their peers
• Formally cross-training associates on several tasks and equipment
• Investing in more material handling automation, especially carousels
Order Cycle Time Challenges An increasingly vital part of any warehouse operation is an enterprise’s ability to deliver on customer demands in a timely fashion. The ability to fulfill orders rapidly reflects on a warehouse’s overall operations – software, human capital, systems, equipment, etc. However, 58% of companies report that they have not been able to shorten their order fulfillment times since 2004. The median customer order cycle time for survey respon-dents is two days, from time of order receipt to warehouse shipment.
A supply chain manager at a mid-market medical supply was able to reduce order cycle times by conducting value stream mapping on the company’s customer order cycle times. By taking out non-value activities, the company not only reduced cycle times but also costs. The manager explains: “The reduction of inventory on hand has resulted in a total decrease in warehousing costs.”
In contrast, a supply chain manager for a large natural resources enterprise struggles to reduce cycle times for a variety of reasons. “The lack of synergy in some of our supply chain operations, the decision to increase client service levels, and resultant increasing inventory levels” are constant barriers to cycle time reduction, he says.
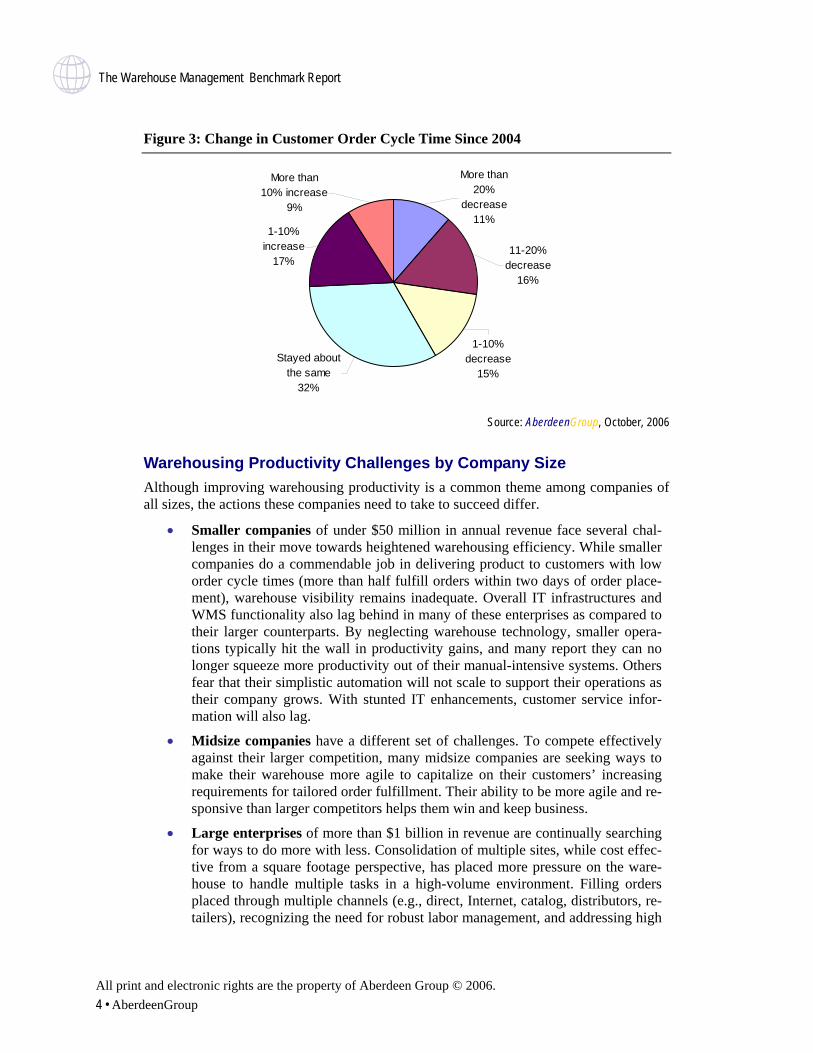
Top performers have been able to log impressive reductions in cycle times, with 11% reducing their cycle times by more than 20% (Figure 3). From time of order receipt to warehouse shipment, 23% of respondents accomplished this task in less than one day. Approximately 30% did this within two days, 16% within three to four days, and nearly a third took at least a full business week.
The Warehouse Management Benchmark Report
All print and electronic rights are the property of Aberdeen Group © 2006. 4 • AberdeenGroup
Figure 3: Change in Customer Order Cycle Time Since 2004
More than 10% increase
9%
1-10% increase
17%
Stayed about the same
32%
1-10% decrease
15%
11-20% decrease
16%
More than 20%
decrease11%
Source: AberdeenGroup, October, 2006
Warehousing Productivity Challenges by Company Size Although improving warehousing productivity is a common theme among companies of all sizes, the actions these companies need to take to succeed differ.
• Smaller companies of under $50 million in annual revenue face several chal-lenges in their move towards heightened warehousing efficiency. While smaller companies do a commendable job in delivering product to customers with low order cycle times (more than half fulfill orders within two days of order place-ment), warehouse visibility remains inadequate. Overall IT infrastructures and WMS functionality also lag behind in many of these enterprises as compared to their larger counterparts. By neglecting warehouse technology, smaller opera-tions typically hit the wall in productivity gains, and many report they can no longer squeeze more productivity out of their manual-intensive systems. Others fear that their simplistic automation will not scale to support their operations as their company grows. With stunted IT enhancements, customer service infor-mation will also lag.
• Midsize companies have a different set of challenges. To compete effectively against their larger competition, many midsize companies are seeking ways to make their warehouse more agile to capitalize on their customers’ increasing requirements for tailored order fulfillment. Their ability to be more agile and re-sponsive than larger competitors helps them win and keep business.
• Large enterprises of more than $1 billion in revenue are continually searching for ways to do more with less. Consolidation of multiple sites, while cost effec-tive from a square footage perspective, has placed more pressure on the ware-house to handle multiple tasks in a high-volume environment. Filling orders placed through multiple channels (e.g., direct, Internet, catalog, distributors, re-tailers), recognizing the need for robust labor management, and addressing high
The Warehouse Management Benchmark Report
All print and electronic rights are the property of Aberdeen Group © 2006. Aberdeen Group • 5
inventory volumes and SKU counts keeps large warehouse managers seeking the most efficient throughput strategies.
Ignored the Data in the Corner Compounding issues for companies of all sizes is a fundamental lack of the business ana-lyst role specific to the warehousing environment. By comparison, business analysts are common in manufacturing and other supply chain areas, helping to identify root causes of performance issues and analyzing alternate solutions. While there is no shortage of information available critiquing supply chains on the whole, assessing and continually improving warehouse performance has not received the same level of analysis focus at most organizations.
Says, the distribution manager of a large non-profit organization, “The warehousing function in my organization is put on the backburner – especially in terms of resources as compared to other areas of the supply chain.” He adds, “We’ve tried to tie into value-stream mapping to bring attention into the warehouse. But again, it comes down to re-source allocation and the warehouse has traditionally come up on the short end.”
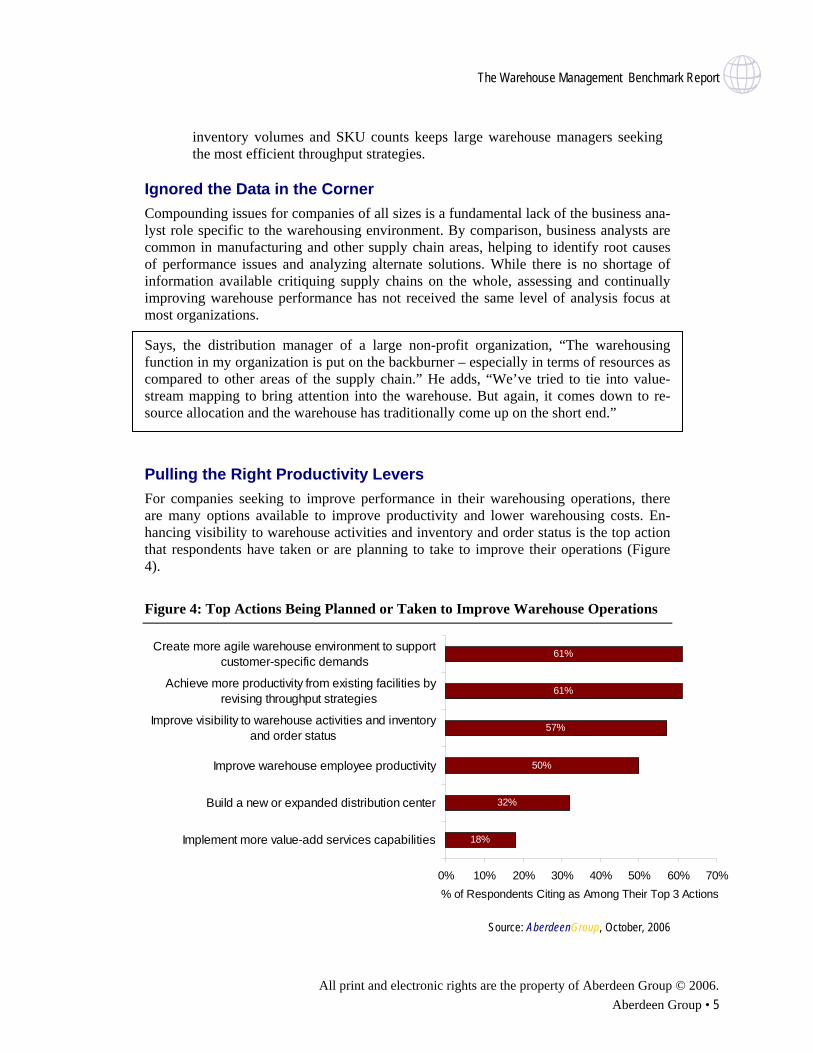
Pulling the Right Productivity Levers For companies seeking to improve performance in their warehousing operations, there are many options available to improve productivity and lower warehousing costs. En-hancing visibility to warehouse activities and inventory and order status is the top action that respondents have taken or are planning to take to improve their operations (Figure 4).
Figure 4: Top Actions Being Planned or Taken to Improve Warehouse Operations
18%
32%
50%
57%
61%
61%
0% 10% 20% 30% 40% 50% 60% 70%
Implement more value-add services capabilities
Build a new or expanded distribution center
Improve warehouse employee productivity
Improve visibility to warehouse activities and inventoryand order status
Achieve more productivity from existing facilities byrevising throughput strategies
Create more agile warehouse environment to supportcustomer-specific demands
% of Respondents Citing as Among Their Top 3 Actions
Source: AberdeenGroup, October, 2006
The Warehouse Management Benchmark Report
All print and electronic rights are the property of Aberdeen Group © 2006. 6 • AberdeenGroup
Today, only 14% of respondents have a company-wide view of real-time warehouse or-der status, labor status, and inventory, while 44% have limited real-time visibility but just for warehouse staff and managers. Nearly a quarter say they have no real-time visibility whatsoever into their warehousing and distributions operations. If an enterprise estab-lishes a visibility system in manufacturing and logistics but neglects the warehouse, the chain of communication is broken.
In most cases, gaining better visibility and executing on the other planned actions out-lined in Figure 4 is requiring warehouse managers to implement additional technology, including:
• Labor optimization software
• Materials handling automation
• RF, RFID, light-directed, or voice-directed technology
• WMS with visibility and key warehousing analytics
• Slotting and layout tools
• Increased cross docking or value-added services support
The Warehouse Management Benchmark Report
All print and electronic rights are the property of Aberdeen Group © 2006. Aberdeen Group • 7
Chapter Two: Key Business Value Findings
Key T
akea
ways
• Best in Class companies deliver on-time complete shipments to customer request date between 97% to 99% of time.
• Best in Class companies are 2.5 times more likely to have reduced warehousing costs by 11-25% since 2004
• Best in Class companies use more warehouse technology, more updated WMS systems, and are better at cross-training their staff.
op performers are discovering methods to increase throughput and efficiency, while keeping costs flat or lowering overall warehousing costs. Across the board, companies that are above average warehouse performers in their industry – classi-
fied as Best in Class companies – outstrip their average and laggard counterparts by log-ging between 97% to 99% on-time complete shipments to customer request date while others struggled to fill orders as effectively. Further, Best in Class have been much more successful than their peers at decreasing their warehousing costs and lowering customer order fulfillment times (Figure 5).
T
Figure 5: Best in Class Warehouse Cost and Service Improvements Since 2004
Best in Class, 33%
Best in Class, 38%
All Others, 22%
All Others, 11%
0%
10%
20%
30%
40%
Decreased Warehousing Costs by 11-20%Since 2004
Decreased Warehousing Order Fulfillment Timesby 11-20% Since 2004
Source: AberdeenGroup, October, 2006
The Warehouse Management Benchmark Report
All print and electronic rights are the property of Aberdeen Group © 2006. 8 • AberdeenGroup
What Best in Class Do Differently • The Best in Class point to an extensively proliferated warehouse visibility infrastruc-
ture that allows them to share information throughout their operation and across the company. Another respondent points to visibility as a means to improvement. A sen-ior vice president in supply at a large retailer indicates that “faster information access to critical users coupled with extended shipping-receiving hours,” led to a decrease in cycle times between 11-20%.
• The Best in Class are nearly twice as likely as Average and Laggards to comprehen-sively train warehouse associates on several tasks as opposed to ad hoc or no formal training.
• The Best in Class do not use spreadsheets to run their warehouses; rather, they rely on an automated WMS solution.
• The Best in Class are more than twice as likely to have an RFID tagging support sys-tem versus their peers, further indicating their belief in the importance of technology for high-performing, customer-centric warehouses.
Technology Is Driving Best in Class Performance In addition to using a WMS, the Best in Class are also more likely than their lower-performing peers to be using an up-to-date solution – typically only one to two versions old – ensuring that these enterprises have access to the latest productivity features from their WMS vendor.
The Best in Class have also invested in other types of warehouse technology that support agility and speedy throughput. The Best in Class, typically, have invested or plan to in-vest within 12 months in labor management capabilities, slotting, dashboard systems, RFID, and other technologies. The industry average companies and Laggards use these technologies to a much lower extent.
Best in Class Training Philosophies The Best in Class are also more likely to invest in employee cross-training. Top perform-ers routinely train employees on a number of tasks in the warehouse, allowing many as-sociates to respond to inventory fluctuations or other issues that may arise. Average per-formers have also done this to a smaller degree, primarily training their employees on an ad hoc basis. Laggards more rigidly tether associates to a discreet task within the ware-house environment.
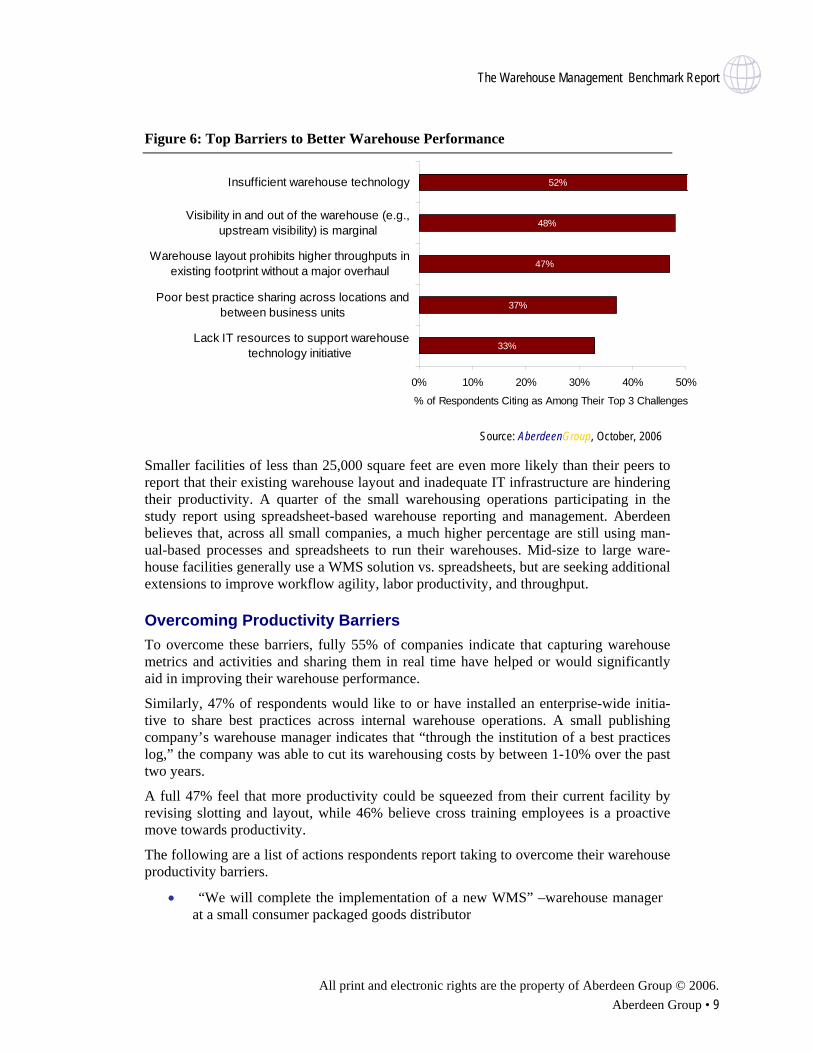
Barriers to Improving Warehouse Productivity Why haven’t more organizations been able to reduce their warehousing costs and im-prove productivity? As Figure 6 shows, the top cited barriers have to do with a lack of sufficient technology for warehouse automation and visibility. The concern over insuffi-cient technology holds true for respondents across all company sizes. In addition, nearly half of respondents say a top barrier to better warehouse performance is that throughput improvements would require a dramatic revamping of their physical warehouse layout. Innovators are working with systems integrators and others to devise new ways to over-come these obstacles.
The Warehouse Management Benchmark Report
All print and electronic rights are the property of Aberdeen Group © 2006. Aberdeen Group • 9
Figure 6: Top Barriers to Better Warehouse Performance
33%
37%
47%
48%
52%
0% 10% 20% 30% 40% 50%
Lack IT resources to support warehousetechnology initiative
Poor best practice sharing across locations andbetween business units
Warehouse layout prohibits higher throughputs inexisting footprint without a major overhaul
Visibility in and out of the warehouse (e.g.,upstream visibility) is marginal
Insufficient warehouse technology
% of Respondents Citing as Among Their Top 3 Challenges
Source: AberdeenGroup, October, 2006
Smaller facilities of less than 25,000 square feet are even more likely than their peers to report that their existing warehouse layout and inadequate IT infrastructure are hindering their productivity. A quarter of the small warehousing operations participating in the study report using spreadsheet-based warehouse reporting and management. Aberdeen believes that, across all small companies, a much higher percentage are still using man-ual-based processes and spreadsheets to run their warehouses. Mid-size to large ware-house facilities generally use a WMS solution vs. spreadsheets, but are seeking additional extensions to improve workflow agility, labor productivity, and throughput.
Overcoming Productivity Barriers To overcome these barriers, fully 55% of companies indicate that capturing warehouse metrics and activities and sharing them in real time have helped or would significantly aid in improving their warehouse performance.
Similarly, 47% of respondents would like to or have installed an enterprise-wide initia-tive to share best practices across internal warehouse operations. A small publishing company’s warehouse manager indicates that “through the institution of a best practices log,” the company was able to cut its warehousing costs by between 1-10% over the past two years.
A full 47% feel that more productivity could be squeezed from their current facility by revising slotting and layout, while 46% believe cross training employees is a proactive move towards productivity.
The following are a list of actions respondents report taking to overcome their warehouse productivity barriers.
• “We will complete the implementation of a new WMS” –warehouse manager at a small consumer packaged goods distributor
The Warehouse Management Benchmark Report
All print and electronic rights are the property of Aberdeen Group © 2006. 10 • AberdeenGroup
• “Following our WMS implementation, we are now normalizing and continuing to align data along with the staff training required to re-establish a new level of standards” –warehouse manager at mid-size industrial equipment manufacturer
• “We are working with consultants to redesign our warehouse layout and im-plement RF technology” –senior vice president at a small distribution enterprise
• “We are investing in training and consulting expertise to leverage our WMS solution” ” –warehouse manager at a large chemical processor
• “We are visiting efficient facilities [to learn best practices], and continue to re-quest IT support” –warehouse manager at a mid-size metals products manufac-turer
The Warehouse Management Benchmark Report
All print and electronic rights are the property of Aberdeen Group © 2006. Aberdeen Group • 11
Chapter Three: Implications & Analysis
Key T
akea
ways
• 43% of companies are operating a warehouse management system that is at least three software versions old.
• Companies using a best of breed WMS are 370% more likely than their spread-sheet-using peers to have decreased their warehousing costs by 11% or more in the past two years.
• Best of breed WMS users are outperforming in-house developed and custom WMS users across key warehouse performance metrics.
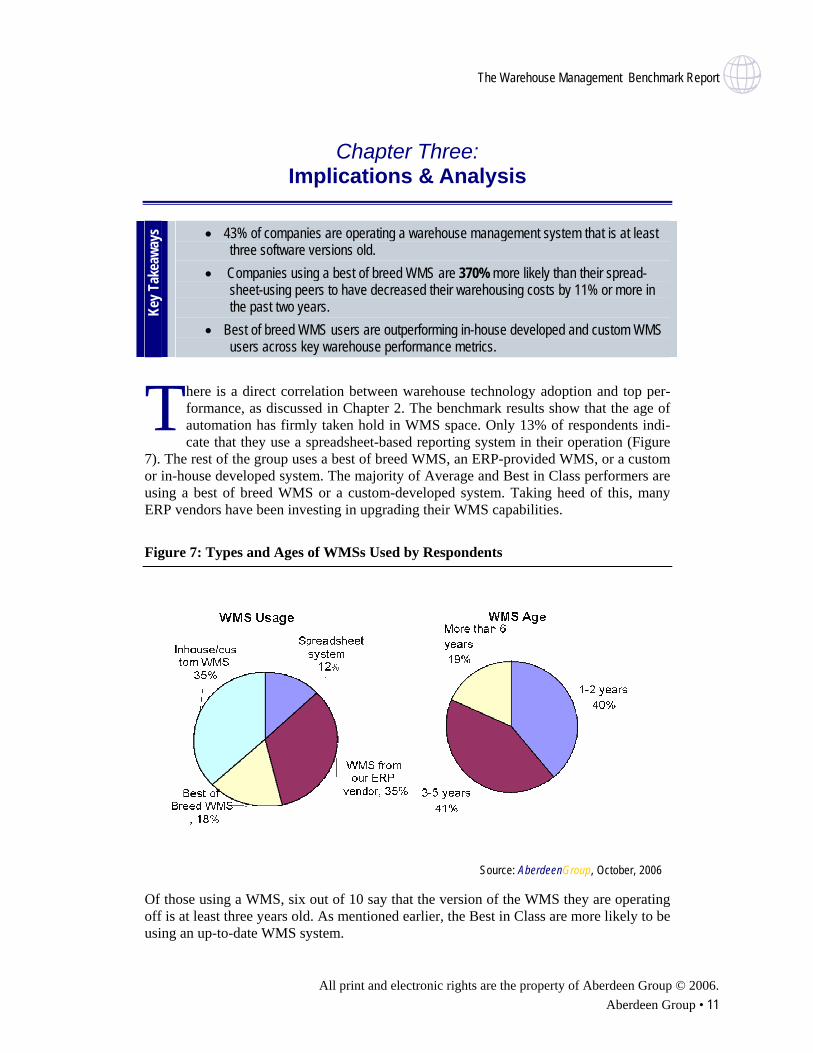
here is a direct correlation between warehouse technology adoption and top per-formance, as discussed in Chapter 2. The benchmark results show that the age of automation has firmly taken hold in WMS space. Only 13% of respondents indi-cate that they use a spreadsheet-based reporting system in their operation (Figure
7). The rest of the group uses a best of breed WMS, an ERP-provided WMS, or a custom or in-house developed system. The majority of Average and Best in Class performers are using a best of breed WMS or a custom-developed system. Taking heed of this, many ERP vendors have been investing in upgrading their WMS capabilities.
T
Figure 7: Types and Ages of WMSs Used by Respondents
Source: AberdeenGroup, October, 2006
Of those using a WMS, six out of 10 say that the version of the WMS they are operating off is at least three years old. As mentioned earlier, the Best in Class are more likely to be using an up-to-date WMS system.
The Warehouse Management Benchmark Report
All print and electronic rights are the property of Aberdeen Group © 2006. 12 • AberdeenGroup
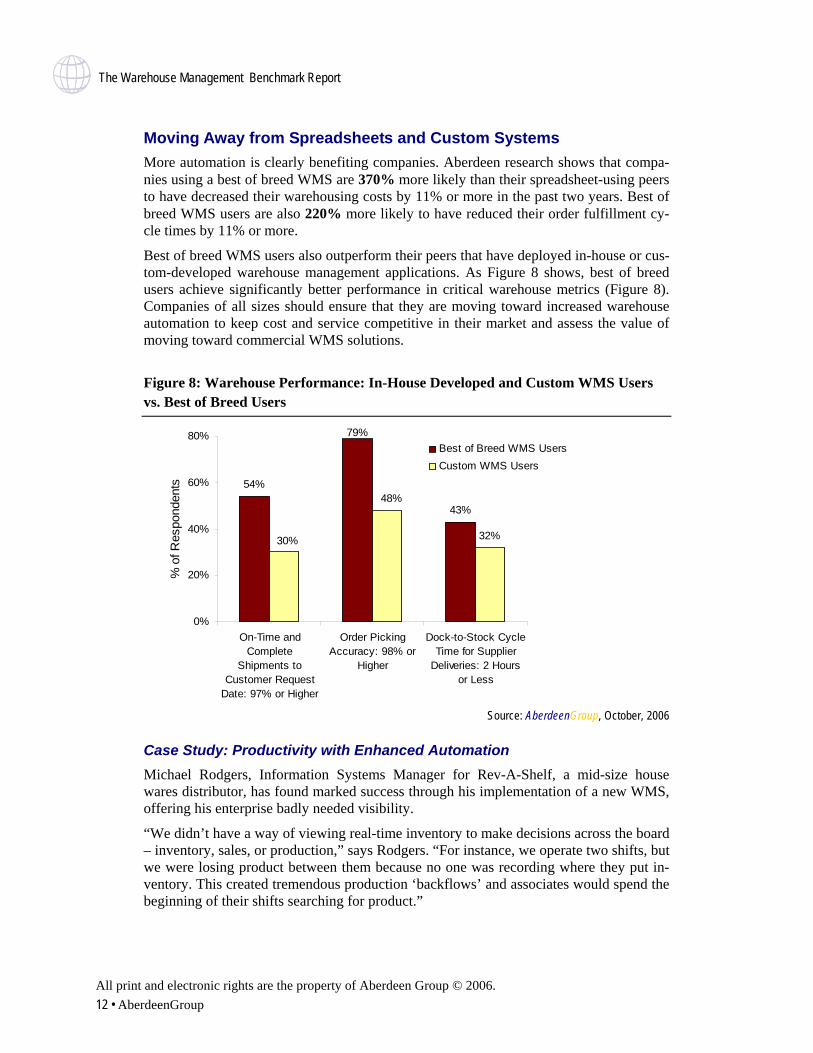
Moving Away from Spreadsheets and Custom Systems More automation is clearly benefiting companies. Aberdeen research shows that compa-nies using a best of breed WMS are 370% more likely than their spreadsheet-using peers to have decreased their warehousing costs by 11% or more in the past two years. Best of breed WMS users are also 220% more likely to have reduced their order fulfillment cy-cle times by 11% or more.
Best of breed WMS users also outperform their peers that have deployed in-house or cus-tom-developed warehouse management applications. As Figure 8 shows, best of breed users achieve significantly better performance in critical warehouse metrics (Figure 8). Companies of all sizes should ensure that they are moving toward increased warehouse automation to keep cost and service competitive in their market and assess the value of moving toward commercial WMS solutions.
Figure 8: Warehouse Performance: In-House Developed and Custom WMS Users vs. Best of Breed Users
54%
79%
43%
32%30%
48%
0%
20%
40%
60%
80%
On-Time andComplete
Shipments toCustomer Request
Date: 97% or Higher
Order PickingAccuracy: 98% or
Higher
Dock-to-Stock CycleTime for Supplier
Deliveries: 2 Hoursor Less
% o
f Res
pond
ents
Best of Breed WMS UsersCustom WMS Users
Source: AberdeenGroup, October, 2006
Case Study: Productivity with Enhanced Automation Michael Rodgers, Information Systems Manager for Rev-A-Shelf, a mid-size house wares distributor, has found marked success through his implementation of a new WMS, offering his enterprise badly needed visibility.
“We didn’t have a way of viewing real-time inventory to make decisions across the board – inventory, sales, or production,” says Rodgers. “For instance, we operate two shifts, but we were losing product between them because no one was recording where they put in-ventory. This created tremendous production ‘backflows’ and associates would spend the beginning of their shifts searching for product.”
The Warehouse Management Benchmark Report
All print and electronic rights are the property of Aberdeen Group © 2006. Aberdeen Group • 13
As a result of the lack of robust visibility and inventory control, the company had inven-tory write-offs at the end of each month and an inventory view accuracy around 86% – and the operation was run using spreadsheets.
To fix this challenge, Rev-A-Shelf implemented a WMS system that allowed it to create a more accurate inventory reading. “Now, we’re at 99.6% accuracy and no more large write-offs,” says Rodgers. “We have 100% accountability of who moves something. Also, we have been able to see some structural issues that prevented us from optimal flow. We corrected those issues as well and now are operating at higher throughput with great visibility.”
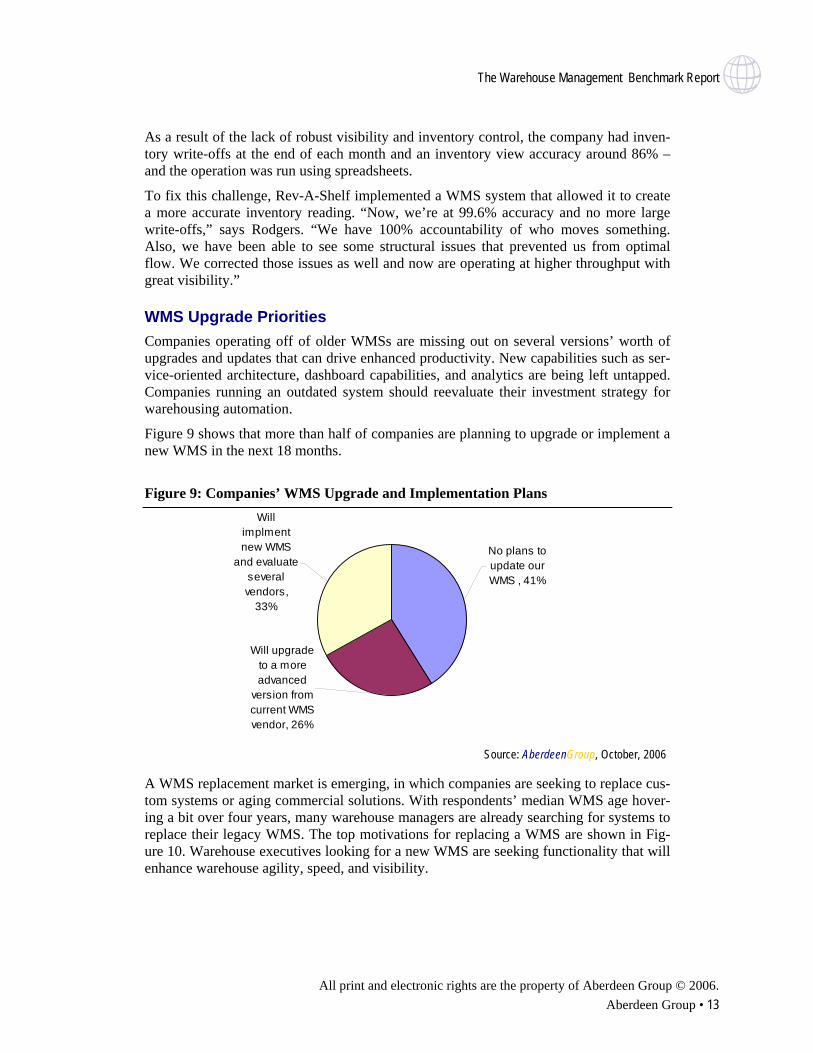
WMS Upgrade Priorities Companies operating off of older WMSs are missing out on several versions’ worth of upgrades and updates that can drive enhanced productivity. New capabilities such as ser-vice-oriented architecture, dashboard capabilities, and analytics are being left untapped. Companies running an outdated system should reevaluate their investment strategy for warehousing automation.
Figure 9 shows that more than half of companies are planning to upgrade or implement a new WMS in the next 18 months.
Figure 9: Companies’ WMS Upgrade and Implementation Plans Will
implment new WMS
and evaluate several vendors,
33%
Will upgrade to a more advanced
version from current WMS vendor, 26%
No plans to update our WMS , 41%
Source: AberdeenGroup, October, 2006
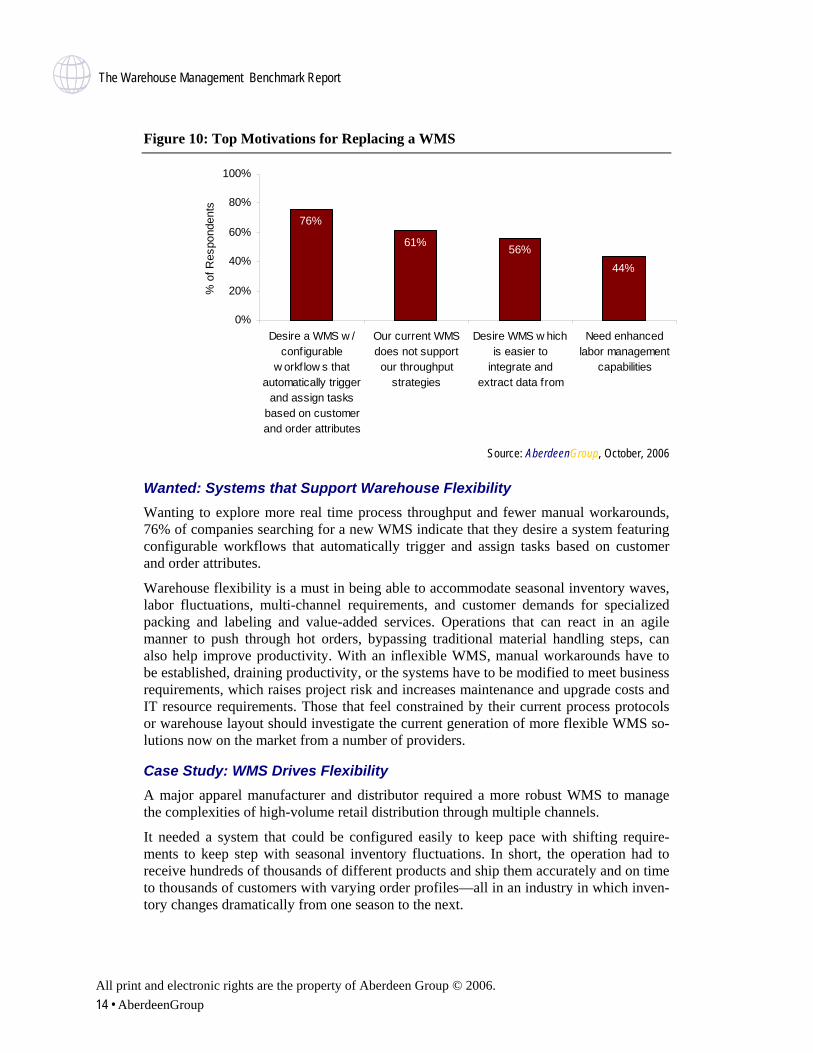
A WMS replacement market is emerging, in which companies are seeking to replace cus-tom systems or aging commercial solutions. With respondents’ median WMS age hover-ing a bit over four years, many warehouse managers are already searching for systems to replace their legacy WMS. The top motivations for replacing a WMS are shown in Fig-ure 10. Warehouse executives looking for a new WMS are seeking functionality that will enhance warehouse agility, speed, and visibility.
The Warehouse Management Benchmark Report
All print and electronic rights are the property of Aberdeen Group © 2006. 14 • AberdeenGroup
Figure 10: Top Motivations for Replacing a WMS
76%
61% 56%44%
0%
20%
40%
60%
80%
100%
Desire a WMS w /configurable
w orkf low s thatautomatically trigger
and assign tasksbased on customerand order attributes
Our current WMSdoes not supportour throughput
strategies
Desire WMS w hichis easier to
integrate andextract data from
Need enhancedlabor management
capabilities
% o
f Res
pond
ents
Source: AberdeenGroup, October, 2006
Wanted: Systems that Support Warehouse Flexibility Wanting to explore more real time process throughput and fewer manual workarounds, 76% of companies searching for a new WMS indicate that they desire a system featuring configurable workflows that automatically trigger and assign tasks based on customer and order attributes.
Warehouse flexibility is a must in being able to accommodate seasonal inventory waves, labor fluctuations, multi-channel requirements, and customer demands for specialized packing and labeling and value-added services. Operations that can react in an agile manner to push through hot orders, bypassing traditional material handling steps, can also help improve productivity. With an inflexible WMS, manual workarounds have to be established, draining productivity, or the systems have to be modified to meet business requirements, which raises project risk and increases maintenance and upgrade costs and IT resource requirements. Those that feel constrained by their current process protocols or warehouse layout should investigate the current generation of more flexible WMS so-lutions now on the market from a number of providers.
Case Study: WMS Drives Flexibility A major apparel manufacturer and distributor required a more robust WMS to manage the complexities of high-volume retail distribution through multiple channels.
It needed a system that could be configured easily to keep pace with shifting require-ments to keep step with seasonal inventory fluctuations. In short, the operation had to receive hundreds of thousands of different products and ship them accurately and on time to thousands of customers with varying order profiles—all in an industry in which inven-tory changes dramatically from one season to the next.
The Warehouse Management Benchmark Report
All print and electronic rights are the property of Aberdeen Group © 2006. Aberdeen Group • 15
The enterprise implemented a WMS that offered it the ability to adapt business processes and stay flexible in its ever-changing industry—a lesson the company had learned with the rigidity of its previous WMS.
“Companies need to consider what they want to do not just today, but down the road,” says the company’s senior vice president of distribution. “One of the things the platform offered was the ability to grow with our business. We're a very dynamic organization and have a lot of changes in our business practices.”
New On-Demand WMS Options While only a limited number of on-demand (also called “Software as a Service” or “hosted”) WMS solutions are currently available, there is considerable interest in the technology. More than 35% of respondents say they would investigate using an on-demand WMS for their operation, with more than 18% of those respondents indicating that they would consider on-demand software for their primary WMS. The remaining respondents showing interest would do so only for smaller stocking locations.
Thus far, the few on-demand WMS modules available have been designed with the smallest warehouse operations in mind. Billed at a monthly subscription (with an addi-tional nominal charge per transaction sometimes levied as well), on-demand WMSs typi-cally offer core functionality appropriate to smaller or less complex operations. Compa-nies with more complex functionality requirements should continue to pursue traditional on-premise WMS solutions.
An on-demand WMS can be an initial step for warehouse operators to transition away from spreadsheets and into the realm of warehouse automation. An advantage of the on-demand model is the assurance that users will always be operating the most current soft-ware version of their system – with no extra costs per upgrade. Further, smaller enter-prises will not have to retain in-house IT specialists for implementation or maintenance since those tasks are performed by the software vendor. Smaller warehouses still using spreadsheets and with limited in-house IT capabilities would do well to explore this op-tion.
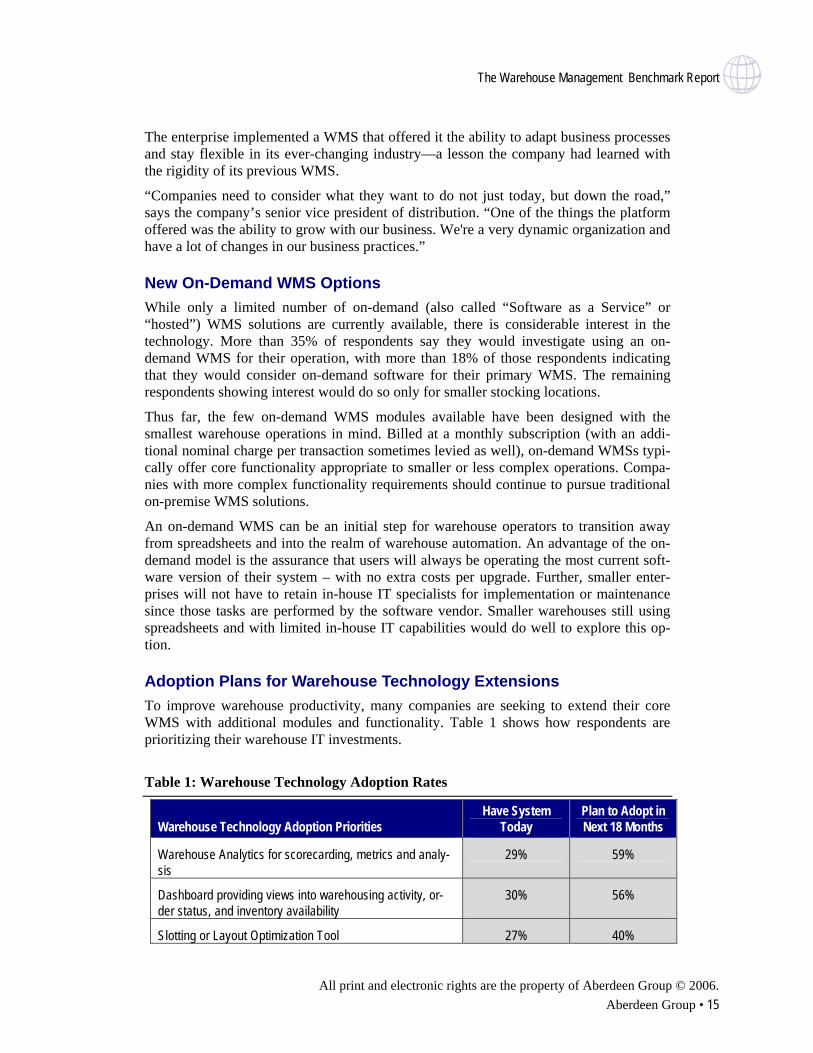
Adoption Plans for Warehouse Technology Extensions To improve warehouse productivity, many companies are seeking to extend their core WMS with additional modules and functionality. Table 1 shows how respondents are prioritizing their warehouse IT investments.
Table 1: Warehouse Technology Adoption Rates
Warehouse Technology Adoption Priorities Have System
Today Plan to Adopt in Next 18 Months
Warehouse Analytics for scorecarding, metrics and analy-sis
29% 59%
Dashboard providing views into warehousing activity, or-der status, and inventory availability
30% 56%
Slotting or Layout Optimization Tool 27% 40%
The Warehouse Management Benchmark Report
All print and electronic rights are the property of Aberdeen Group © 2006. 16 • AberdeenGroup
Cross-Docking and Flow Through Support 34% 35%
RFID Tagging support 12% 33%
Labor Management System 27% 29%
Voice-Directed Technology 11% 18% Source: AberdeenGroup, October, 2006
Analytics Offer Productivity Gains Of increasing importance to warehouse productivity is the utilization of analytics and metrics. As shown in Table 1, this is the top adoption priority for companies. The most innovative warehouse operators are mining their warehouse data to understand the true cost to serve each customer or order type and then putting in place programs that lead to improved gross margins. Historical data and projections of future order volume and ac-tivity are also being mined by companies to improve warehouse slotting and better plan labor workloads, staff training programs, and labor productivity metrics down to a task level.
Innovators are designating a “master scheduler/process engineer/lean expert” for the warehouse to help mine the data for performance improvement.
Best practices in warehouse analytics include:
• Disseminate warehouse data outside the warehouse walls to all appropriate trading partners
• Recognize that more data allows for better configuring of slotting, labor plan-ning, etc.
• Recognize data as a goldmine of information on the true costs to serve custom-ers and use it to help set better pricing and make better customer service deci-sions (e.g., If I waive the warehouse accessorial charge for this customer order, will the transaction still be profitable?)
• Seek warehouse technology solutions that let business analysts create reports, configure dashboards, and perform ad hoc analytics, rather than having to rely on the IT organization
• Provide visibility into warehouse operation status, costs, inventory availability, and cycle times to order takers upstream to improve order promising and order profitability decisions
Labor Management Becoming Important Across Industries A hot topic in warehousing today is the migrating of engineered labor standards – more commonly found in the retail sector – to the warehousing floor. No longer a simple punch-in time clock, warehouse executives are exploring software applications that will benchmark employees’ productivity over an established time period. By establishing a productivity trend, warehouse managers are able to identify the times of highest produc-tivity, the most appropriate positioning of floor associates, and recognize top perform-ance.
The Warehouse Management Benchmark Report
All print and electronic rights are the property of Aberdeen Group © 2006. Aberdeen Group • 17
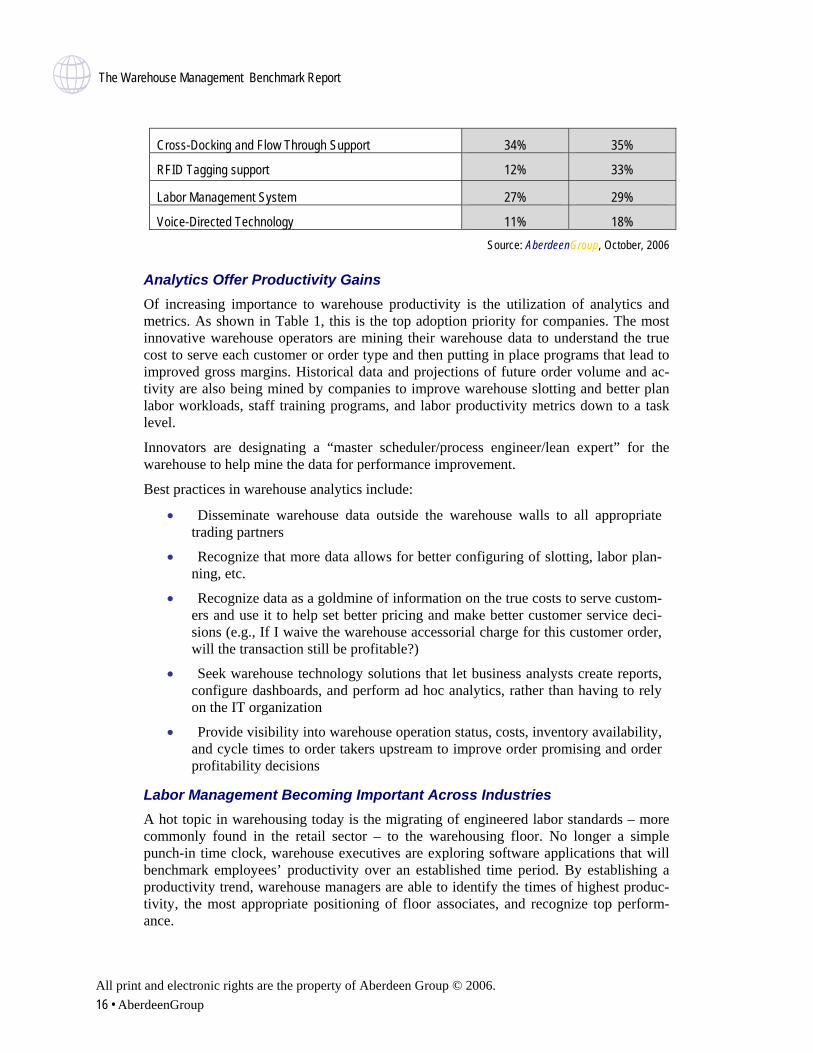
Roughly one-quarter of all respondents indicate that they currently operate a labor man-agement system in their warehouse environments today – with a slightly higher percent-age planning on doing so in the next 18 months. These enterprises are enticed by the promise of increased labor visibility and productivity that the module offers (Figure 11).
Figure 11: Labor Management Technology Priorities
76%72%
45%41%
31%
24%
0%
20%
40%
60%
80%
Laboroptimization
Reporting Support forincentive-based pay
Integratedtime and
attendance
Laborforecasting
Engineeredlabor
standards
% o
f Res
pond
ents
Con
side
ring
Labo
r Man
agem
ent
Source: AberdeenGroup, October, 2006
Case Study: Driving Productivity with Labor Management A mid-market auto parts distribution center productivity manager needed to take his or-ganization to the next level. “We identified that we needed labor standards to do this,” the manager explains. “We had historical averages but they weren’t scientific – they were based on our executives’ opinions. We chose a labor management suite that offered a discrete look at operations, instead of a stop watch look.”
The company implemented labor management software into its picking, shipping, receiv-ing and stocking departments. “We’ve had between 5-10% productivity improvements in all these areas and we’ve maintained this improved performance over time,” the DC manager explains. “We now have the data to continually refine our practices. We hold associates to the standard and issue corrective actions to help our employees reach par and have developed a standards-based bonus program to reward those going above and beyond.”
One of the areas in which labor management has made a significant difference in the warehouse planning process is in the company’s picking department. “We are now able to plan much better for where associates will be placed throughout the shift to respond to daily demands,” says the manager. “I know where I stand with labor in the beginning of the shift – and I know what we’ll need in terms of overtime before the shift begins based on labor trending analysis.”
The Warehouse Management Benchmark Report
All print and electronic rights are the property of Aberdeen Group © 2006. 18 • AberdeenGroup
Throughput Advances via Material Handling Automation Material handling automation cannot be overlooked in the drive toward increased ware-house productivity. The use of carousels, sorters, conveyors, put to light systems, and so on can be the key to improving productivity and eliminating the need to invest in addi-tional warehouse facilities. For instance, a major sporting goods retailer doubled its throughput volumes in the same facility due to productivity gains as a result of a WMS implementation and implementing material handling automation.
Innovators are now looking to Europe for additional ideas on how to use material han-dling equipment. European warehouses typically maximize space by evaluating square footage vertically. Their space constraints horizontally are far more rigid than what is typically found in the more sprawling U.S., which has led to innovative uses of material handling automation.
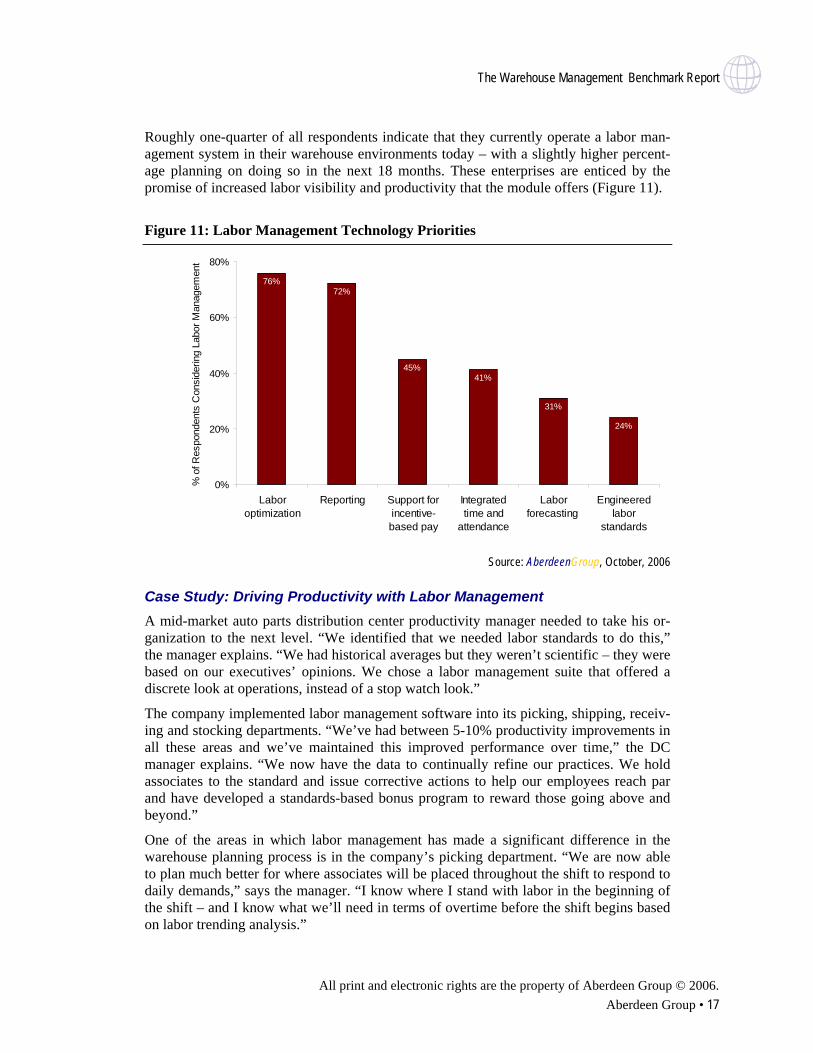
Equipment Use Continues to Grow Warehouse operators of all sizes are focused on acquiring additional warehouse equip-ment. Almost 60% of respondents indicate that they will invest in new or additional bar code scanning equipment in the next 18 months, with 53% looking to invest in additional lift trucks or related equipment.
Table 2: Planned Warehousing Equipment Expenditures for the Next 18 Months
Equipment Planned Expenditures
in Next 18 Months
Bar code scanning 58%
Lift truck additions/upgrades 53%
RF terminals 36%
Conveyor 29%
RFID infrastructure 25%
Automated storage and retrieval systems (AS/RS) 19%
Pick to light 17%
Source: AberdeenGroup, October, 2006
Smaller enterprises are more focused on investing in RF terminals and conveyors than their larger counterparts, yet only 9% indicate they are in the market for RFID infrastruc-ture. Fully half of all mid-size enterprises indicate that RFID is on their expenditure ra-dar, as are improvements to their lift truck fleet. Lift truck purchases are also on the radar of large enterprises (50%) while 75% say that they will invest in their bar code scanning initiatives.
The Warehouse Management Benchmark Report
All print and electronic rights are the property of Aberdeen Group © 2006. Aberdeen Group • 19
Chapter Four: Recommendations for Action
Key T
akea
ways
• Warehouse operations should assess the benefits of moving to a commercial WMS. • Robust warehouse visibility has a direct correlation to warehousing productivity ex-
cellence.
hose operations looking to ramp up performance in key areas such as cycle times, costs, visibility, and labor management need to undertake an end-to-end assess-ment of their current warehouse technology infrastructure.
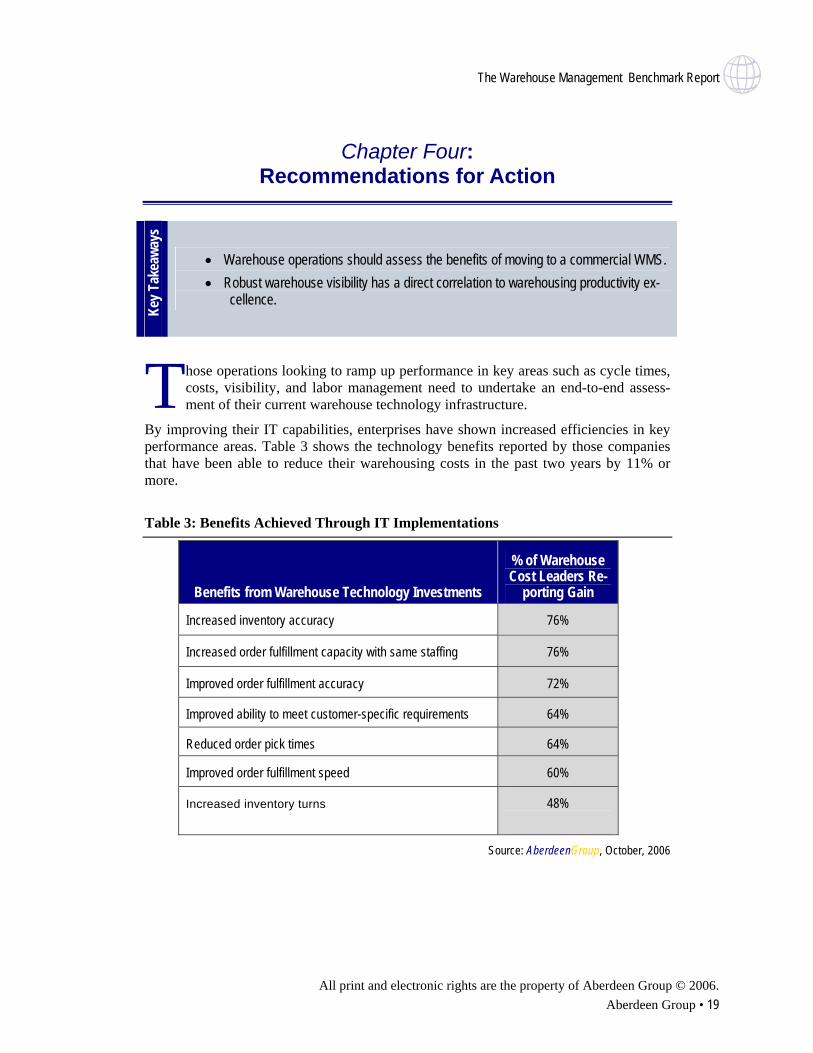
By improving their IT capabilities, enterprises have shown increased efficiencies in key performance areas. Table 3 shows the technology benefits reported by those companies that have been able to reduce their warehousing costs in the past two years by 11% or more.
T
Table 3: Benefits Achieved Through IT Implementations
Benefits from Warehouse Technology Investments
% of Warehouse Cost Leaders Re-
porting Gain
Increased inventory accuracy 76%
Increased order fulfillment capacity with same staffing 76%
Improved order fulfillment accuracy 72%
Improved ability to meet customer-specific requirements 64%
Reduced order pick times 64%
Improved order fulfillment speed 60%
Increased inventory turns 48%
Source: AberdeenGroup, October, 2006
The Warehouse Management Benchmark Report
All print and electronic rights are the property of Aberdeen Group © 2006. 20 • AberdeenGroup
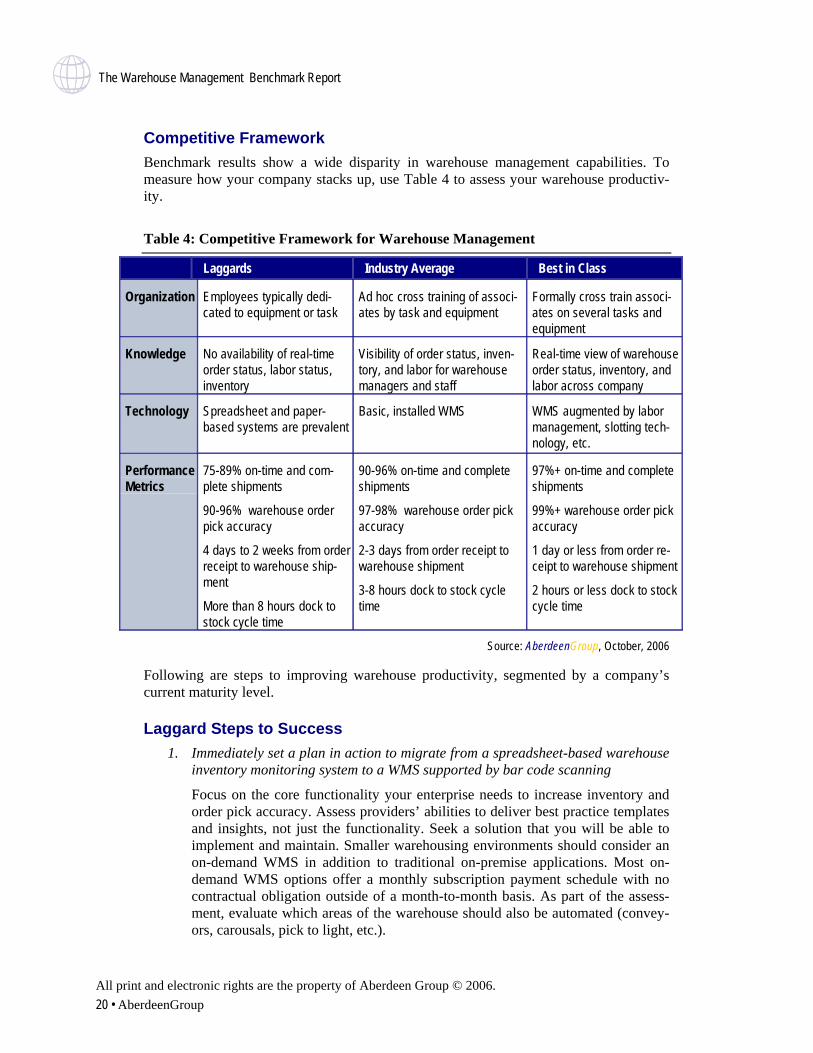
Competitive Framework Benchmark results show a wide disparity in warehouse management capabilities. To measure how your company stacks up, use Table 4 to assess your warehouse productiv-ity.
Table 4: Competitive Framework for Warehouse Management
Laggards Industry Average Best in Class
Organization Employees typically dedi-cated to equipment or task
Ad hoc cross training of associ-ates by task and equipment
Formally cross train associ-ates on several tasks and equipment
Knowledge No availability of real-time order status, labor status, inventory
Visibility of order status, inven-tory, and labor for warehouse managers and staff
Real-time view of warehouse order status, inventory, and labor across company
Technology Spreadsheet and paper-based systems are prevalent
Basic, installed WMS WMS augmented by labor management, slotting tech-nology, etc.
Performance Metrics
75-89% on-time and com-plete shipments
90-96% warehouse order pick accuracy
4 days to 2 weeks from order receipt to warehouse ship-ment
More than 8 hours dock to stock cycle time
90-96% on-time and complete shipments
97-98% warehouse order pick accuracy
2-3 days from order receipt to warehouse shipment
3-8 hours dock to stock cycle time
97%+ on-time and complete shipments
99%+ warehouse order pick accuracy
1 day or less from order re-ceipt to warehouse shipment
2 hours or less dock to stock cycle time
Source: AberdeenGroup, October, 2006
Following are steps to improving warehouse productivity, segmented by a company’s current maturity level.
Laggard Steps to Success 1. Immediately set a plan in action to migrate from a spreadsheet-based warehouse
inventory monitoring system to a WMS supported by bar code scanning
Focus on the core functionality your enterprise needs to increase inventory and order pick accuracy. Assess providers’ abilities to deliver best practice templates and insights, not just the functionality. Seek a solution that you will be able to implement and maintain. Smaller warehousing environments should consider an on-demand WMS in addition to traditional on-premise applications. Most on-demand WMS options offer a monthly subscription payment schedule with no contractual obligation outside of a month-to-month basis. As part of the assess-ment, evaluate which areas of the warehouse should also be automated (convey-ors, carousals, pick to light, etc.).
The Warehouse Management Benchmark Report
All print and electronic rights are the property of Aberdeen Group © 2006. Aberdeen Group • 21
2. Invest in formal training to allow for a more agile operation, able to adjust to in-ventory flow fluctuations
Laggards typically have warehousing employees dedicated to a specific task, without the wherewithal to perform elsewhere in the operation. Production met-rics indicate that Industry Average and Best in Class performers train their em-ployees in multiple disciplines, able to respond to throughput issues immediately. Avoid ad hoc training and develop a program that trains new hires in several fac-ets of the warehouse operation.
Industry Norm Steps to Success 1. Strongly consider technology investments outside of the core WMS functionality
Almost across the board, top performers have installed (or plan to do so in the near future) systems and practices that enhance cross docking, labor manage-ment, slotting, RFID support, and dashboards. Warehouse managers looking to enhance operations should analyze which areas of their operation demand the most attention and focus on those initially. It’s likely that a combination of a few technologies would prove more beneficial than an investment in a single produc-tivity application. As part of the process, evaluate where to make the next in-vestments in warehouse equipment.
2. Focus on enhancing visibility to support better communication up and down stream in the supply chain
Industry Average companies typically have comprehensive visibility for ware-house staff and managers only. The next step is to provide a company-wide view of real-time warehouse order status, labor status, and inventory. Also focus on sharing cost-to-serve information to help improve gross margins.
3. Make customer order on-time rates a top priority
Best in class performers fulfill their customer orders typically in less than one day. Average performers should establish processes and seek technology that fa-cilitates timely shipment.
4. Upgrade your WMS if older than four years
Although most vendors will support a legacy WMS, Aberdeen analysis finds that a significant percentage of Best in Class performers operate a WMS that is less than three years old. While legacy WMSs may function properly, there is no get-ting around the fact that the software running the system is several versions out-dated. Companies operating an older WMS often do not know what functionality they are missing out on that could drive improved productivity or enable more efficient support for seasonal inventory fluctuations or customer demands for tai-lored fulfillment services.
Best in Class Next Steps 1. Focus on using warehouse analytics to improve productivity and profitability
Best in Class warehouses are taking a cue from their manufacturing and supply chain peers and are investing in warehouse analytics. Analyze performance de-
The Warehouse Management Benchmark Report
All print and electronic rights are the property of Aberdeen Group © 2006. 22 • AberdeenGroup
fects, seasonal flow fluctuations, and the like to drive productivity and reliability. Evaluate the cost to serve customers and the cost to fulfill different categories of orders and share the information with the organization to improve gross margin management.
2. Evaluate emerging best practices for automation and don’t be restricted by ge-ography
Best in Class companies are continuing to use automation investments to drive more productivity. Look to innovations among other Best in Class warehouse operators and don’t limit these investigations to your own geographical region. For instance, American-based operations should look to European organizations for fresh material handling automation ideas.
3. Continue to expand your WMS technology into areas such as labor management, slotting optimization, RFID, dashboards, etc.
Few companies have fully tapped the power of WMS extensions. Fill in the gaps in your warehouse operations by evaluating the benefits of labor management modules, slotting and layout optimization, more advanced warehouse dashboards (including views for key stakeholders outside of the warehouse), voice-directed technology, etc.
The Warehouse Management Benchmark Report
All print and electronic rights are the property of Aberdeen Group © 2006. Aberdeen Group • 23
Appendix A: Research Methodology
etween September and October 2006, Aberdeen Group examined the technology priorities, productivity barriers, and plans for expansion of 180 warehouse man-agers at all size companies in various industry
Responding supply chain, logistics, and operations executives completed an online sur-vey that included questions designed to determine the following:
B • What correlation, if any, exists between newer warehouse management systems
and high productivity
• The role systems integration plays in lowering cycle times and heightening throughput
• Current and planned use of automation to aid inventory throughput
• The benefits, if any, that have been derived from undertaking an aggressive warehouse technology spending philosophy
Aberdeen supplemented this online survey effort with telephone interviews with select survey respondents, gathering additional information on warehouse management strate-gies, experiences, and results.
The study aimed to identify emerging best practices for warehouse management and pro-vide a framework by which readers could assess their own warehouse management capa-bilities.
Responding enterprises included the following:
• Job title/function: The research sample included respondents with the following job titles: procurement, supply chain, logistics executive or manager, manufac-turing/operations executive or manager, IT manager, CFO or other C-level offi-cer, and finance/accounting manager.
• Industry: The research sample included respondents from a variety of industries including automotive, chemical, medical equipment, construction/engineering, and retail and distribution.
• Geography: Nearly all study respondents were from North America, with most residing in the U.S. Remaining respondents were from the United Kingdom and the Asia-Pacific region.
• Company size: About 35% of respondents were from large enterprises (annual revenues above US$1 billion); 30% were from midsize enterprises (annual reve-nues between $50 million and $1 billion); and 35% of respondents were from small businesses (annual revenues of $50 million or less).
The Warehouse Management Benchmark Report
All print and electronic rights are the property of Aberdeen Group © 2006. 24 • AberdeenGroup
Appendix B: Related Aberdeen Research & Tools
Related Aberdeen research that forms a companion or reference to this report includes:
• The Transportation Management Benchmark Report (September 2006)
• Technology Strategies for Inventory Management (September 2006)
• The Supply Chain Innovators Benchmark Report (April 2006)
• The On Demand Tipping Point in Supply Chain (March 2006) Information on these and any other Aberdeen publications can be found at
www.Aberdeen.com.
The Warehouse Management Benchmark Report
All print and electronic rights are the property of Aberdeen Group © 2006. Aberdeen Group • 25
About AberdeenGroup
Our Mission To be the trusted advisor and business value research destination of choice for the Global Business Executive.
Our Approach Aberdeen delivers unbiased, primary research that helps enterprises derive tangible busi-ness value from technology-enabled solutions. Through continuous benchmarking and analysis of value chain practices, Aberdeen offers a unique mix of research, tools, and services to help Global Business Executives accomplish the following:
IMPROVE the financial and competitive position of their business now
PRIORITIZE operational improvement areas to drive immediate, tangible value to their business
LEVERAGE information technology for tangible business value. Aberdeen also offers selected solution providers fact-based tools and services to em-power and equip them to accomplish the following:
CREATE DEMAND, by reaching the right level of executives in companies where their solutions can deliver differentiated results
ACCELERATE SALES, by accessing executive decision-makers who need a solution and arming the sales team with fact-based differentiation around business impact
EXPAND CUSTOMERS, by fortifying their value proposition with inde-pendent fact-based research and demonstrating installed base proof points
Our History of Integrity Aberdeen was founded in 1988 to conduct fact-based, unbiased research that delivers tangible value to executives trying to advance their businesses with technology-enabled solutions.
Aberdeen's integrity has always been and always will be beyond reproach. We provide independent research and analysis of the dynamics underlying specific technology-enabled business strategies, market trends, and technology solutions. While some reports or portions of reports may be underwritten by corporate sponsors, Aberdeen's research findings are never influenced by any of these sponsors.
The Warehouse Management Benchmark Report
Aberdeen Group, Inc. 260 Franklin Street Boston, Massachusetts 02110-3112 USA
Telephone: 617 723 7890 Fax: 617 723 7897 www.aberdeen.com
© 2006 Aberdeen Group, Inc. All rights reserved October 2006
Founded in 1988, Aberdeen Group is the technology- driven research destination of choice for the global business executive. Aberdeen Group has over 100,000 research members in over 36 countries around the world that both participate in and direct the most comprehen-sive technology-driven value chain research in the market. Through its continued fact-based research, benchmarking, and actionable analysis, Aberdeen Group offers global business and technology executives a unique mix of actionable research, KPIs, tools, and services.
The information contained in this publication has been obtained from sources Aberdeen believes to be reliable, but is not guaranteed by Aberdeen. Aberdeen publications reflect the analyst’s judgment at the time and are subject to change without notice.
The trademarks and registered trademarks of the corporations mentioned in this publication are the property of their respective holders.