agricultural productivity -...
TRANSCRIPT
199
Fisheries
ABARESAgricultural commodities – vol. 3 no. 1 • March quarter 2013
Agricultural productivity
200 ABARESAgricultural commodities – vol. 3 no. 1 • March quarter 2013
Productivity in the broadacre and dairy industriesAstrid Dahl, Robert Leith and Emily Gray
Summary• Productivity in the broadacre industries has grown at an average rate of 1 per cent
a year between 1977–78 and 2010–11, while dairy productivity growth has averaged 1.6 per cent a year between 1978–79 and 2010–11.
• Overall resource use in most industries has declined over the long term, contributing to gains in productivity. An increase in production intensity in most industries, which has driven strong growth in materials consumption, has also boosted productivity.
• Broadacre productivity growth has slowed (becoming negative in the past decade), primarily because of drought-induced reductions in output across all industries. Growth has been increasingly underpinned by gains in livestock industries, while growth in cropping and mixed crop–livestock industries has declined.
• The broadacre productivity growth slowdown has also been associated with reduced public expenditure in research and development.
• Australia has maintained its productivity and competitiveness against key competitors over the long term. However, past productivity growth rates may become more challenging to maintain and may depend more on new advances in technology.
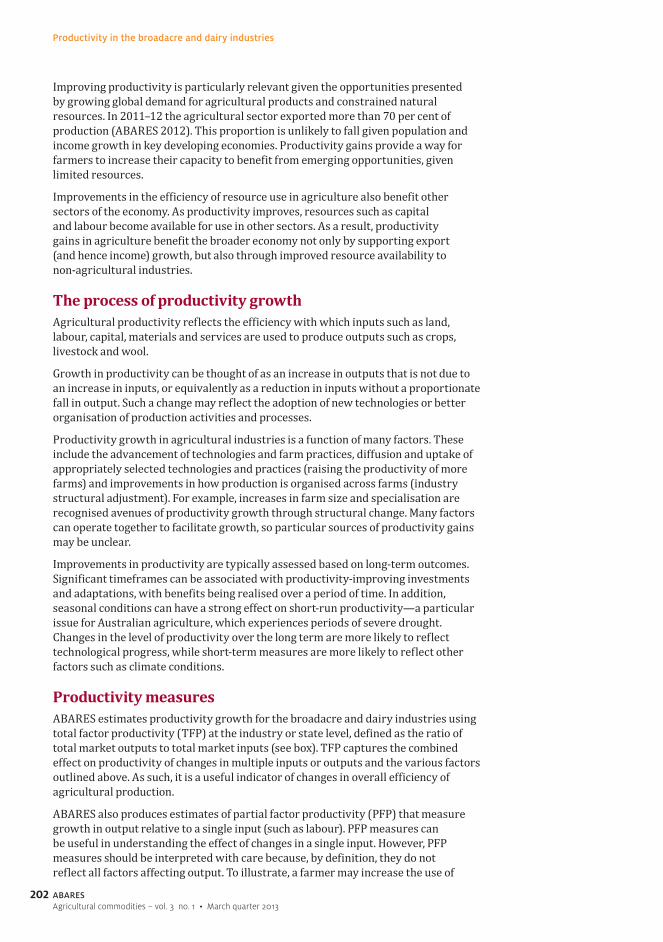
IntroductionLong-term growth in productivity has been central to the continued viability of agricultural industries in Australia. Higher productivity enables farmers to produce more output using fewer resources. For this reason productivity gains are critical in maintaining the competitiveness of Australian agricultural industries in global commodity markets, and are the main way that farmers can offset declines in agricultural terms of trade (the price of outputs relative to inputs), as have been observed over the past 30 years.
Australian agriculture has achieved notable productivity growth despite the challenges associated with a small, remote sector with a highly variable climate. This has enabled the sector to maintain and improve productivity, including relative to two key competitors, Canada and the United States (see box). In spite of the gains achieved, the competitiveness of Australian agriculture remains under pressure because growth in input costs has only been partly offset by growth in productivity. As a consequence, productivity growth is likely to remain a priority for the foreseeable future.

201
Productivity in the broadacre and dairy industries
ABARESAgricultural commodities – vol. 3 no. 1 • March quarter 2013
Broadacre total factor productivity and farmer terms of trade, 1977–78 to 2010–11
index
40
80
120
160
200
Financial year ended
Total factor productivityTerms of trade
Note: Farmer terms of trade relate to all Australian agriculture; total factor productivity relates to broadacre (non-irrigated) agriculture only.
201120051999199319871981
Australia’s international productivity performanceDeveloping an understanding of the drivers of long-term productivity growth is essential for continued efforts to foster productivity improvement. ABARES recently compared the long-term productivity performance of Australian agriculture to that of the agricultural sectors in Canada and the United States and assessed the drivers of productivity differences (Nossal & Sheng 2013). The project formed part of an international collaboration between ABARES, the United States Department of Agriculture and Agriculture and Agri-food Canada that developed internationally consistent productivity data.
The ABARES study found that, over the past five decades, agricultural productivity in Australia was lower than in Canada and the United States. However, Australian agriculture has maintained its productivity relative to the United States and has improved relative to Canada. Lower productivity suggests that Australian agriculture has faced relatively higher production costs and has been less competitive on world markets.
Country-specific factors have influenced differences in productivity. Climatic, geographic, economic and policy factors have shaped industry composition and inherent comparative advantages in agricultural production. For example, Australian agriculture has faced challenges associated with a small, remote sector with a highly variable climate.
Some factors have also been important for productivity growth in all three countries. In particular, capital deepening (an increase in the ratio of capital to labour inputs typically associated with labour saving technologies), increases in farm size and investment in agricultural research and development (R&D) appear to have been important common drivers of productivity growth.
202
Productivity in the broadacre and dairy industries
ABARESAgricultural commodities – vol. 3 no. 1 • March quarter 2013
Improving productivity is particularly relevant given the opportunities presented by growing global demand for agricultural products and constrained natural resources. In 2011–12 the agricultural sector exported more than 70 per cent of production (ABARES 2012). This proportion is unlikely to fall given population and income growth in key developing economies. Productivity gains provide a way for farmers to increase their capacity to benefit from emerging opportunities, given limited resources.
Improvements in the efficiency of resource use in agriculture also benefit other sectors of the economy. As productivity improves, resources such as capital and labour become available for use in other sectors. As a result, productivity gains in agriculture benefit the broader economy not only by supporting export (and hence income) growth, but also through improved resource availability to non-agricultural industries.
The process of productivity growthAgricultural productivity reflects the efficiency with which inputs such as land, labour, capital, materials and services are used to produce outputs such as crops, livestock and wool.
Growth in productivity can be thought of as an increase in outputs that is not due to an increase in inputs, or equivalently as a reduction in inputs without a proportionate fall in output. Such a change may reflect the adoption of new technologies or better organisation of production activities and processes.
Productivity growth in agricultural industries is a function of many factors. These include the advancement of technologies and farm practices, diffusion and uptake of appropriately selected technologies and practices (raising the productivity of more farms) and improvements in how production is organised across farms (industry structural adjustment). For example, increases in farm size and specialisation are recognised avenues of productivity growth through structural change. Many factors can operate together to facilitate growth, so particular sources of productivity gains may be unclear.
Improvements in productivity are typically assessed based on long-term outcomes. Significant timeframes can be associated with productivity-improving investments and adaptations, with benefits being realised over a period of time. In addition, seasonal conditions can have a strong effect on short-run productivity—a particular issue for Australian agriculture, which experiences periods of severe drought. Changes in the level of productivity over the long term are more likely to reflect technological progress, while short-term measures are more likely to reflect other factors such as climate conditions.
Productivity measuresABARES estimates productivity growth for the broadacre and dairy industries using total factor productivity (TFP) at the industry or state level, defined as the ratio of total market outputs to total market inputs (see box). TFP captures the combined effect on productivity of changes in multiple inputs or outputs and the various factors outlined above. As such, it is a useful indicator of changes in overall efficiency of agricultural production.
ABARES also produces estimates of partial factor productivity (PFP) that measure growth in output relative to a single input (such as labour). PFP measures can be useful in understanding the effect of changes in a single input. However, PFP measures should be interpreted with care because, by definition, they do not reflect all factors affecting output. To illustrate, a farmer may increase the use of
203
Productivity in the broadacre and dairy industries
ABARESAgricultural commodities – vol. 3 no. 1 • March quarter 2013
supplementary feed in order to increase beef production per hectare of land. Land productivity measures would show an improvement in this scenario; however, the offsetting effect of higher feed consumption is not taken into account. TFP measures take both effects into account and provide insight into overall production efficiency.
Productivity trends in broadacre industriesBroadacre productivity growth averaged 1 per cent a year over the period 1977–78 to 2010–11. This was a result of modest growth in total outputs (0.1 per cent a year on average) and a more substantial reduction in total input use (averaging 0.9 per cent a year).
The long-term decline in input use reflects widespread reductions across broadacre industries and input types, with the notable exceptions of materials use, which increased in most industries, and land use in cropping (an average increase of 1.3 per cent a year).
Labour use declined in all broadacre industries and has fallen at the highest rate of all inputs (2.1 per cent a year for all broadacre), largely because of significant labour reductions in mixed crop–livestock and sheep industries. Non-land capital use (which includes structures, plant and herd capital) has also fallen across all industries, although at a slower rate (1.8 per cent a year for all broadacre). The slower decline in capital use partly reflects an increase in the ratio of capital to labour (capital deepening) in cropping and beef industries, which has contributed to higher labour productivity and facilitated broadacre TFP growth.
ABARES index coverage and constructionABARES constructs various indexes of annual input growth, output growth, total factor productivity and partial factor productivity for key broadacre industries and the dairy industry. Broadacre indexes cover enterprises in cropping, mixed crop–livestock, beef and sheep industries. Indexes for overall broadacre also incorporate mixed beef–sheep enterprises (not reported separately).
These indexes are constructed using farm-level survey data collected through the Australian agricultural and grazing industries survey (AAGIS) and the Australian dairy industry survey (ADIS). Annual survey data extend from the present year back to 1977–78 for broadacre industries, and to 1978–79 for the dairy industry.
Each TFP index is constructed as a ratio of two indexes: an index of gross output quantity and an index of gross input quantity (for a more detailed description of the ABARES TFP index methodology see Zhao et al. 2012). Percentage growth in TFP from year to year reflects the difference between percentage growth in outputs and percentage growth in inputs. Long-term average annual growth rates are estimated by fitting an exponential trend line to the relevant index, so typically change from year to year as the series is updated.
ABARES has recently implemented a number of changes to its industry models and, as a result, some estimated growth rates of input, output and productivity published this year differ from previous estimates more substantially. In particular, changes to the dairy model have resulted in a significant upward revision of estimated average annual growth in dairy productivity. The model was updated to incorporate revisions to key price series (notably milk, fodder, fertiliser and fuel), interest rates and owner and operator wage expenses, as well as other less influential adjustments. In addition, results for the dairy industry are now presented on an industry aggregate basis rather than a farm-average basis (the reporting basis in prior years).
204
Productivity in the broadacre and dairy industries
ABARESAgricultural commodities – vol. 3 no. 1 • March quarter 2013
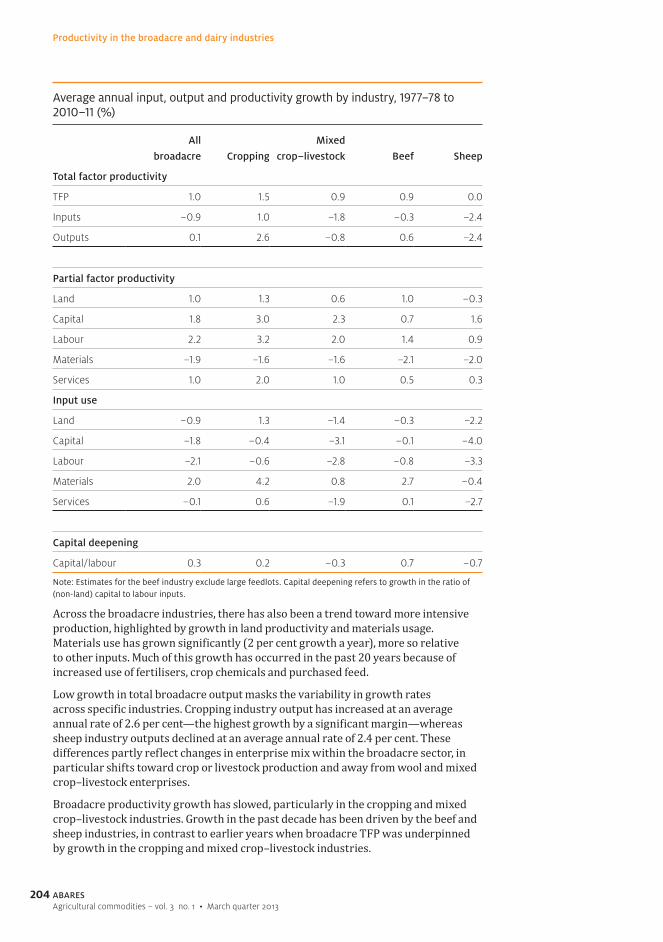
Across the broadacre industries, there has also been a trend toward more intensive production, highlighted by growth in land productivity and materials usage. Materials use has grown significantly (2 per cent growth a year), more so relative to other inputs. Much of this growth has occurred in the past 20 years because of increased use of fertilisers, crop chemicals and purchased feed.
Low growth in total broadacre output masks the variability in growth rates across specific industries. Cropping industry output has increased at an average annual rate of 2.6 per cent—the highest growth by a significant margin—whereas sheep industry outputs declined at an average annual rate of 2.4 per cent. These differences partly reflect changes in enterprise mix within the broadacre sector, in particular shifts toward crop or livestock production and away from wool and mixed crop–livestock enterprises.
Broadacre productivity growth has slowed, particularly in the cropping and mixed crop–livestock industries. Growth in the past decade has been driven by the beef and sheep industries, in contrast to earlier years when broadacre TFP was underpinned by growth in the cropping and mixed crop–livestock industries.
Average annual input, output and productivity growth by industry, 1977–78 to 2010–11 (%)
All
broadacre Cropping
Mixed
crop–livestock Beef Sheep
Total factor productivity
TFP 1.0 1.5 0.9 0.9 0.0
Inputs –0.9 1.0 –1.8 –0.3 –2.4
Outputs 0.1 2.6 –0.8 0.6 –2.4
Partial factor productivity
Land 1.0 1.3 0.6 1.0 –0.3
Capital 1.8 3.0 2.3 0.7 1.6
Labour 2.2 3.2 2.0 1.4 0.9
Materials –1.9 –1.6 –1.6 –2.1 –2.0
Services 1.0 2.0 1.0 0.5 0.3
Input use
Land –0.9 1.3 –1.4 –0.3 –2.2
Capital –1.8 –0.4 –3.1 –0.1 –4.0
Labour –2.1 –0.6 –2.8 –0.8 –3.3
Materials 2.0 4.2 0.8 2.7 –0.4
Services –0.1 0.6 –1.9 0.1 –2.7
Capital deepening
Capital/labour 0.3 0.2 –0.3 0.7 –0.7
Note: Estimates for the beef industry exclude large feedlots. Capital deepening refers to growth in the ratio of (non-land) capital to labour inputs.
205
Productivity in the broadacre and dairy industries
ABARESAgricultural commodities – vol. 3 no. 1 • March quarter 2013
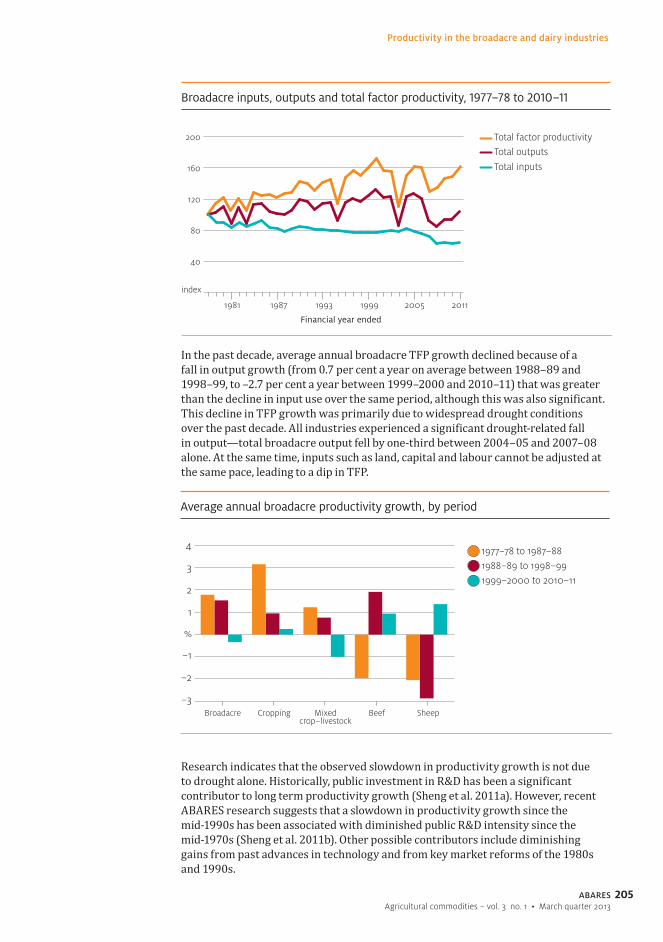
Broadacre inputs, outputs and total factor productivity, 1977–78 to 2010–11
index
40
80
120
160
200 Total factor productivityTotal outputs
Total inputs
Financial year ended
201120051999199319871981
In the past decade, average annual broadacre TFP growth declined because of a fall in output growth (from 0.7 per cent a year on average between 1988–89 and 1998–99, to –2.7 per cent a year between 1999–2000 and 2010–11) that was greater than the decline in input use over the same period, although this was also significant. This decline in TFP growth was primarily due to widespread drought conditions over the past decade. All industries experienced a significant drought-related fall in output—total broadacre output fell by one-third between 2004–05 and 2007–08 alone. At the same time, inputs such as land, capital and labour cannot be adjusted at the same pace, leading to a dip in TFP.
Research indicates that the observed slowdown in productivity growth is not due to drought alone. Historically, public investment in R&D has been a significant contributor to long term productivity growth (Sheng et al. 2011a). However, recent ABARES research suggests that a slowdown in productivity growth since the mid-1990s has been associated with diminished public R&D intensity since the mid-1970s (Sheng et al. 2011b). Other possible contributors include diminishing gains from past advances in technology and from key market reforms of the 1980s and 1990s.
Average annual broadacre productivity growth, by period
1999–2000 to 2010–111988–89 to 1998–991977–78 to 1987–88
%
–3
–2
–1
1
2
3
4
SheepBeefMixedcrop–livestock
CroppingBroadacre
206
Productivity in the broadacre and dairy industries
ABARESAgricultural commodities – vol. 3 no. 1 • March quarter 2013
CroppingCropping industry productivity increased at an average rate of 1.5 per cent a year between 1977–78 and 2010–11, the highest of the broadacre industries. During this period, total outputs increased on average by 2.6 per cent a year, while total input use increased by 1 per cent a year on average.
Long-term productivity gains have been achieved through the adoption of new technologies and management practices in the cropping industry (Hughes et al. 2011). This includes increased use of fertilisers, seed and crop chemicals, causing materials’ share of all cropping inputs to more than double since 1977–78. Increased yields have also come from the introduction of low-till and no-till farming and the introduction of new crop varieties (Dunlop et al. 2004). A shift in the 1980s and 1990s toward much larger and more efficient sowing and harvesting equipment has been another key contributor to higher productivity (Nossal et al. 2009).
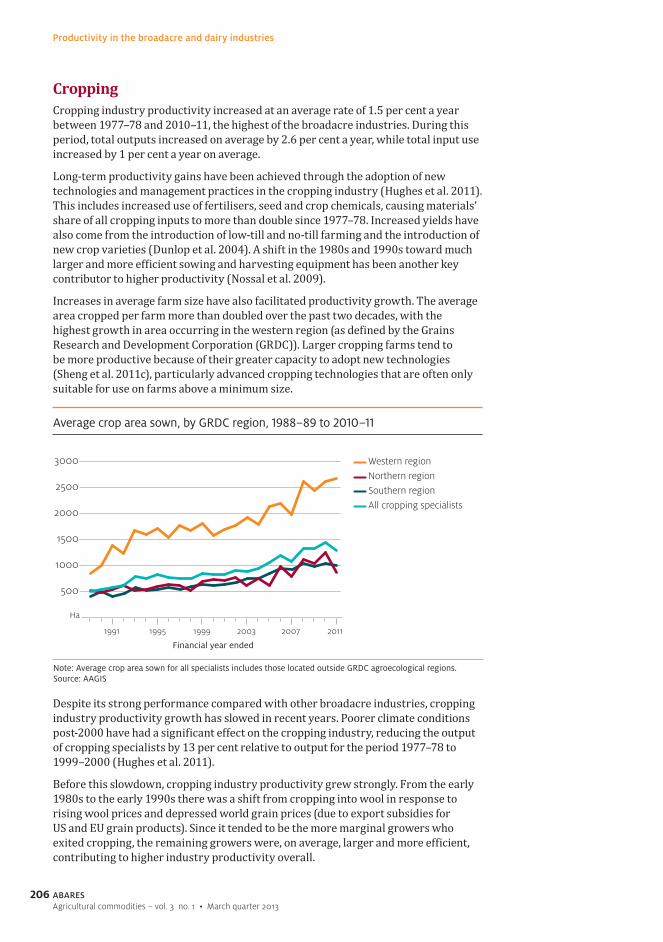
Increases in average farm size have also facilitated productivity growth. The average area cropped per farm more than doubled over the past two decades, with the highest growth in area occurring in the western region (as defined by the Grains Research and Development Corporation (GRDC)). Larger cropping farms tend to be more productive because of their greater capacity to adopt new technologies (Sheng et al. 2011c), particularly advanced cropping technologies that are often only suitable for use on farms above a minimum size.
Despite its strong performance compared with other broadacre industries, cropping industry productivity growth has slowed in recent years. Poorer climate conditions post-2000 have had a significant effect on the cropping industry, reducing the output of cropping specialists by 13 per cent relative to output for the period 1977–78 to 1999–2000 (Hughes et al. 2011).
Before this slowdown, cropping industry productivity grew strongly. From the early 1980s to the early 1990s there was a shift from cropping into wool in response to rising wool prices and depressed world grain prices (due to export subsidies for US and EU grain products). Since it tended to be the more marginal growers who exited cropping, the remaining growers were, on average, larger and more efficient, contributing to higher industry productivity overall.
Average crop area sown, by GRDC region, 1988–89 to 2010–11
Ha
Western regionNorthern region
All cropping specialistsSouthern region
Note: Average crop area sown for all specialists includes those located outside GRDC agroecological regions. Source: AAGIS
Financial year ended
500
1000
1500
2000
2500
3000
201120072003199919951991
207
Productivity in the broadacre and dairy industries
ABARESAgricultural commodities – vol. 3 no. 1 • March quarter 2013
However, the collapse of wool prices and the wool reserve price scheme in 1991, coupled with rising grain prices, saw a shift back to cropping by many farms and expansion of cropping in more marginal areas. Although the expansion of cropping areas may have increased productivity initially for a variety of reasons, grain growers have suggested that high productivity growth was not maintained on the new area being cropped, particularly in areas susceptible to drought (Jackson 2010).
Productivity growth rates are similar across the three GRDC agroecological regions, in spite of significant differences in climate, soil fertility, farm scale and variety of crops. Strong output growth alongside increased use of inputs has contributed to productivity growth in the southern (1.6 per cent a year on average) and western (1.5 per cent a year on average) cropping regions. In contrast, productivity growth in the northern region (1.7 per cent a year on average) was largely a result of relatively low output growth of 1.1 per cent a year on average, coupled with a decline in input use.
SheepThe sheep industry experienced TFP growth close to zero between 1977–78 and 2010–11, with output and input use both declining at an average annual rate of around 2.4 per cent. However, beginning in the mid 1990s there has been a notable turnaround in productivity growth, coinciding with a fundamental shift in industry focus away from wool and toward slaughter lamb production. In contrast to other broadacre industries, which have experienced a slowdown in productivity growth over the past decade, sheep industry productivity increased at an average rate of 1.4 per cent a year, compared with declines in productivity growth in earlier periods.
Average annual cropping productivity growth by GRDC region, 1977–78 to 2010–11 (%)
Productivity growth Output growth Input growth
Cropping specialists
All 1.5 2.6 1.0
Northern region 1.7 1.1 –0.5
Southern region 1.6 3.0 1.4
Western region 1.5 3.7 2.2
Note: Estimates for all cropping specialists include those located outside the GRDC agroecological regions.
Average annual sheep input, output and productivity growth by period (%)
Productivity growth Output growth Input growth
1977–78 to 1987–88 –2.1 5.2 7.3
1988–89 to 1998–99 –2.9 –10.4 –7.5
1999–2000 to 2010–11 1.4 –4.5 –5.8
208
Productivity in the broadacre and dairy industries
ABARESAgricultural commodities – vol. 3 no. 1 • March quarter 2013
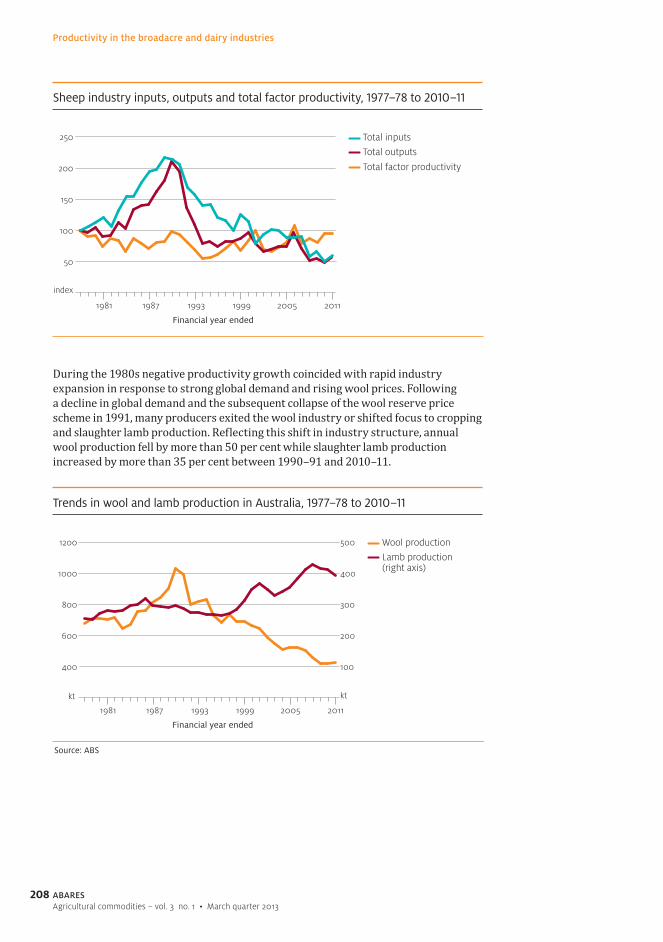
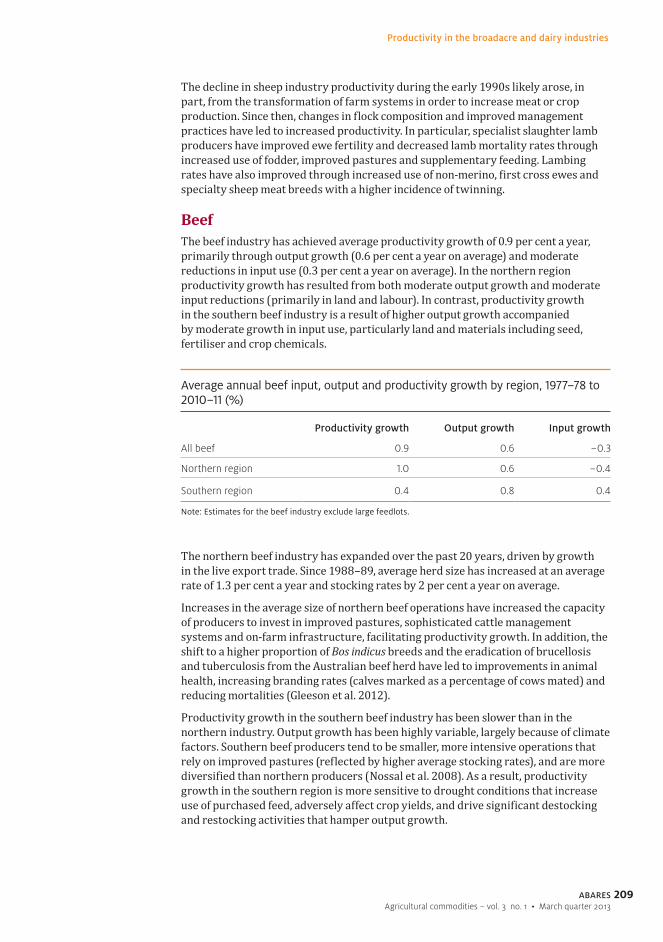
During the 1980s negative productivity growth coincided with rapid industry expansion in response to strong global demand and rising wool prices. Following a decline in global demand and the subsequent collapse of the wool reserve price scheme in 1991, many producers exited the wool industry or shifted focus to cropping and slaughter lamb production. Reflecting this shift in industry structure, annual wool production fell by more than 50 per cent while slaughter lamb production increased by more than 35 per cent between 1990–91 and 2010–11.
Sheep industry inputs, outputs and total factor productivity, 1977–78 to 2010–11
index
Total inputsTotal outputs
Total factor productivity
Financial year ended
201120051999199319871981
50
100
150
200
250
Trends in wool and lamb production in Australia, 1977–78 to 2010–11
kt
Wool productionLamb production(right axis)
Source: ABS
Financial year ended
201120051999199319871981
400
600
800
1000
1200
kt
100
200
300
400
500
209
Productivity in the broadacre and dairy industries
ABARESAgricultural commodities – vol. 3 no. 1 • March quarter 2013
The decline in sheep industry productivity during the early 1990s likely arose, in part, from the transformation of farm systems in order to increase meat or crop production. Since then, changes in flock composition and improved management practices have led to increased productivity. In particular, specialist slaughter lamb producers have improved ewe fertility and decreased lamb mortality rates through increased use of fodder, improved pastures and supplementary feeding. Lambing rates have also improved through increased use of non-merino, first cross ewes and specialty sheep meat breeds with a higher incidence of twinning.
BeefThe beef industry has achieved average productivity growth of 0.9 per cent a year, primarily through output growth (0.6 per cent a year on average) and moderate reductions in input use (0.3 per cent a year on average). In the northern region productivity growth has resulted from both moderate output growth and moderate input reductions (primarily in land and labour). In contrast, productivity growth in the southern beef industry is a result of higher output growth accompanied by moderate growth in input use, particularly land and materials including seed, fertiliser and crop chemicals.
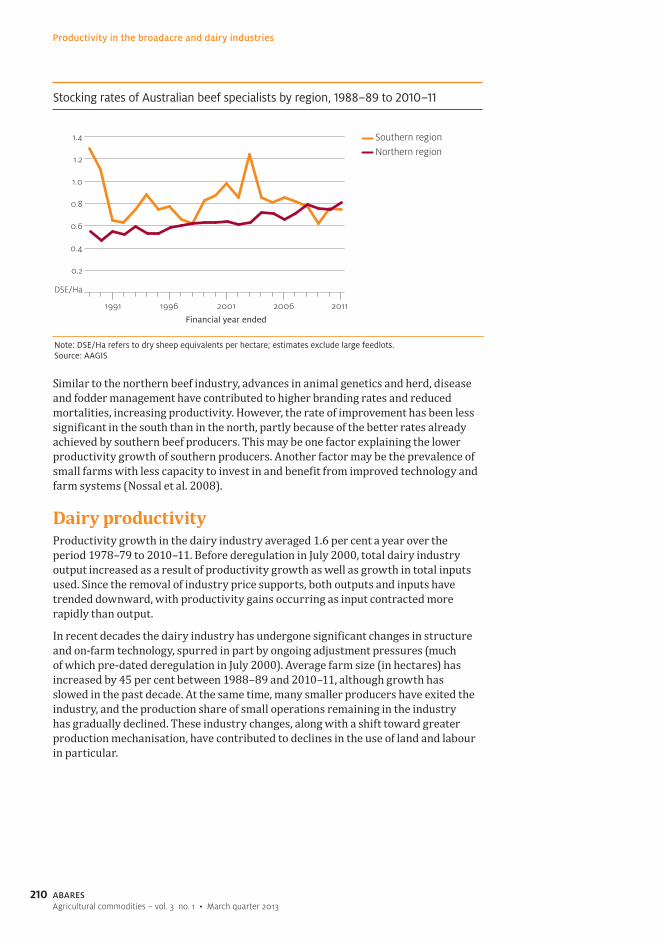
The northern beef industry has expanded over the past 20 years, driven by growth in the live export trade. Since 1988–89, average herd size has increased at an average rate of 1.3 per cent a year and stocking rates by 2 per cent a year on average.
Increases in the average size of northern beef operations have increased the capacity of producers to invest in improved pastures, sophisticated cattle management systems and on-farm infrastructure, facilitating productivity growth. In addition, the shift to a higher proportion of Bos indicus breeds and the eradication of brucellosis and tuberculosis from the Australian beef herd have led to improvements in animal health, increasing branding rates (calves marked as a percentage of cows mated) and reducing mortalities (Gleeson et al. 2012).
Productivity growth in the southern beef industry has been slower than in the northern industry. Output growth has been highly variable, largely because of climate factors. Southern beef producers tend to be smaller, more intensive operations that rely on improved pastures (reflected by higher average stocking rates), and are more diversified than northern producers (Nossal et al. 2008). As a result, productivity growth in the southern region is more sensitive to drought conditions that increase use of purchased feed, adversely affect crop yields, and drive significant destocking and restocking activities that hamper output growth.
Average annual beef input, output and productivity growth by region, 1977–78 to 2010–11 (%)
Productivity growth Output growth Input growth
All beef 0.9 0.6 –0.3
Northern region 1.0 0.6 –0.4
Southern region 0.4 0.8 0.4
Note: Estimates for the beef industry exclude large feedlots.
210
Productivity in the broadacre and dairy industries
ABARESAgricultural commodities – vol. 3 no. 1 • March quarter 2013
Similar to the northern beef industry, advances in animal genetics and herd, disease and fodder management have contributed to higher branding rates and reduced mortalities, increasing productivity. However, the rate of improvement has been less significant in the south than in the north, partly because of the better rates already achieved by southern beef producers. This may be one factor explaining the lower productivity growth of southern producers. Another factor may be the prevalence of small farms with less capacity to invest in and benefit from improved technology and farm systems (Nossal et al. 2008).
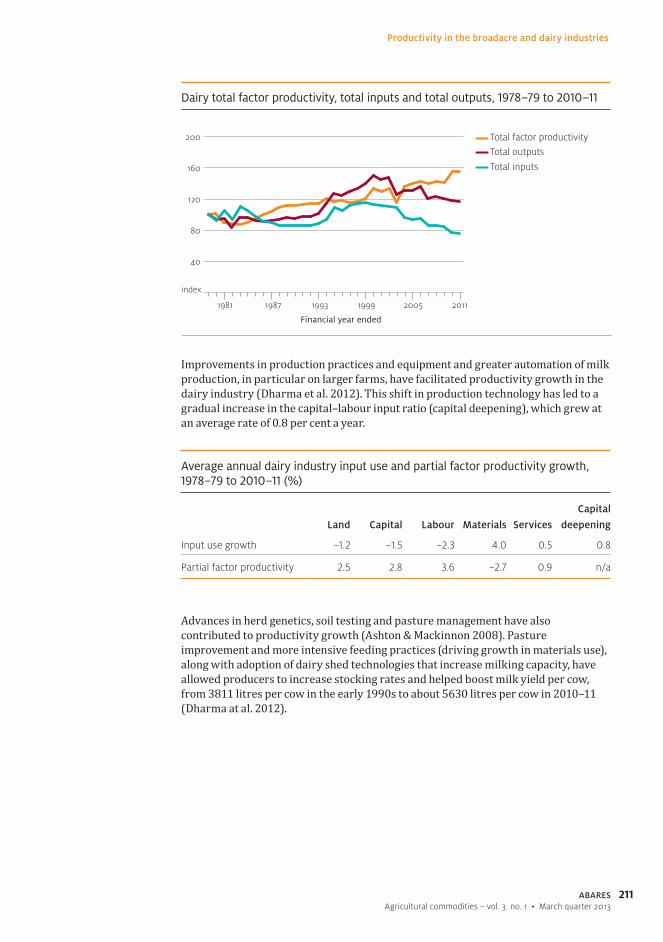
Dairy productivityProductivity growth in the dairy industry averaged 1.6 per cent a year over the period 1978–79 to 2010–11. Before deregulation in July 2000, total dairy industry output increased as a result of productivity growth as well as growth in total inputs used. Since the removal of industry price supports, both outputs and inputs have trended downward, with productivity gains occurring as input contracted more rapidly than output.
In recent decades the dairy industry has undergone significant changes in structure and on-farm technology, spurred in part by ongoing adjustment pressures (much of which pre-dated deregulation in July 2000). Average farm size (in hectares) has increased by 45 per cent between 1988–89 and 2010–11, although growth has slowed in the past decade. At the same time, many smaller producers have exited the industry, and the production share of small operations remaining in the industry has gradually declined. These industry changes, along with a shift toward greater production mechanisation, have contributed to declines in the use of land and labour in particular.
Stocking rates of Australian beef specialists by region, 1988–89 to 2010–11
DSE/Ha
Southern regionNorthern region
Note: DSE/Ha refers to dry sheep equivalents per hectare; estimates exclude large feedlots. Source: AAGIS
0.2
0.4
0.6
0.8
1.0
1.2
1.4
Financial year ended
20112006200119961991
211
Productivity in the broadacre and dairy industries
ABARESAgricultural commodities – vol. 3 no. 1 • March quarter 2013
Improvements in production practices and equipment and greater automation of milk production, in particular on larger farms, have facilitated productivity growth in the dairy industry (Dharma et al. 2012). This shift in production technology has led to a gradual increase in the capital–labour input ratio (capital deepening), which grew at an average rate of 0.8 per cent a year.
Advances in herd genetics, soil testing and pasture management have also contributed to productivity growth (Ashton & Mackinnon 2008). Pasture improvement and more intensive feeding practices (driving growth in materials use), along with adoption of dairy shed technologies that increase milking capacity, have allowed producers to increase stocking rates and helped boost milk yield per cow, from 3811 litres per cow in the early 1990s to about 5630 litres per cow in 2010–11 (Dharma at al. 2012).
Dairy total factor productivity, total inputs and total outputs, 1978–79 to 2010–11
index
40
80
120
160
200 Total factor productivityTotal outputs
Total inputs
Financial year ended
201120051999199319871981
Average annual dairy industry input use and partial factor productivity growth, 1978–79 to 2010–11 (%)
Land Capital Labour Materials Services
Capital
deepening
Input use growth –1.2 –1.5 –2.3 4.0 0.5 0.8
Partial factor productivity 2.5 2.8 3.6 –2.7 0.9 n/a
212
Productivity in the broadacre and dairy industries
ABARESAgricultural commodities – vol. 3 no. 1 • March quarter 2013
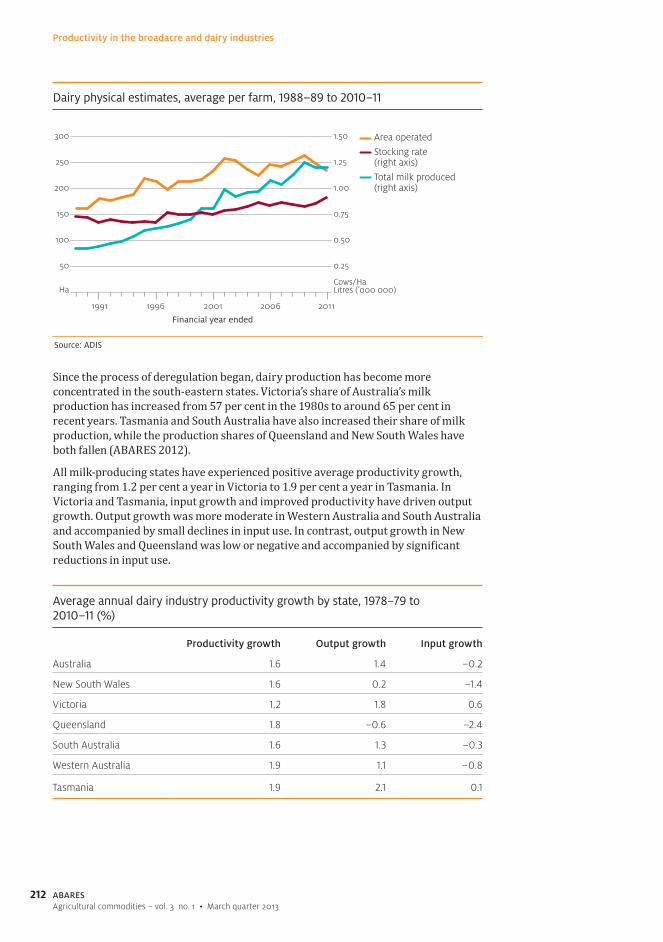
Since the process of deregulation began, dairy production has become more concentrated in the south-eastern states. Victoria’s share of Australia’s milk production has increased from 57 per cent in the 1980s to around 65 per cent in recent years. Tasmania and South Australia have also increased their share of milk production, while the production shares of Queensland and New South Wales have both fallen (ABARES 2012).
All milk-producing states have experienced positive average productivity growth, ranging from 1.2 per cent a year in Victoria to 1.9 per cent a year in Tasmania. In Victoria and Tasmania, input growth and improved productivity have driven output growth. Output growth was more moderate in Western Australia and South Australia and accompanied by small declines in input use. In contrast, output growth in New South Wales and Queensland was low or negative and accompanied by significant reductions in input use.
Average annual dairy industry productivity growth by state, 1978–79 to 2010–11 (%)
Productivity growth Output growth Input growth
Australia 1.6 1.4 –0.2
New South Wales 1.6 0.2 –1.4
Victoria 1.2 1.8 0.6
Queensland 1.8 –0.6 –2.4
South Australia 1.6 1.3 –0.3
Western Australia 1.9 1.1 –0.8
Tasmania 1.9 2.1 0.1
Dairy physical estimates, average per farm, 1988–89 to 2010–11
Ha
Area operatedStocking rate(right axis)Total milk produced(right axis)
Source: ADIS
Cows/HaLitres (’000 000)
0.25
0.50
0.75
1.00
1.25
1.50
100
150
200
250
300
50
Financial year ended
20112006200119961991
213
Productivity in the broadacre and dairy industries
ABARESAgricultural commodities – vol. 3 no. 1 • March quarter 2013
Beyond differences in dairy production systems and climate, ongoing ABARES research suggests that differences in initial productivity levels may partly explain differences across states in productivity growth. In particular, lower growth in Victoria may reflect its relatively high productivity in earlier years. In contrast, the high growth rate for some other states may reflect the greater scope for productivity gains following deregulation. For example, the use of quotas before deregulation provided incentives to farmers in New South Wales and Queensland to produce milk all year round, raising input requirements relative to more seasonal production systems in Victoria.
Sources of growth: past and futureProductivity growth is vital in supporting the viability of Australian agriculture. While Australian agriculture has been reasonably successful in maintaining its productivity and competitiveness against key competitors (Nossal & Sheng 2013), sustaining this position over the next five decades may be more challenging. High input costs and environmental pressures associated with land, water, biodiversity and climate change may constrain agricultural productivity improvements. Further, improvements that have yielded productivity gains in the past may have less potential to generate growth in the future.
Sources of growth and the role of governmentProductivity growth is an outcome of multiple processes that drive or facilitate improvements in both technology and organisation. Fundamentally, long-term growth is driven by technical change; that is, advances in production technologies and best practice that increase the productive capacity of limited resources. However, the performance of the industry as a whole reflects not only the current state of cutting edge technology, but also the degree to which available technologies are effectively selected, adapted and applied by individual farms. As a result, industry productivity can improve through the diffusion and appropriate uptake of available technologies, raising the productivity of those farms that are not industry leaders.
Productivity gains can also flow from better organisation of resources and activities between farms or industries (structural adjustment). An industry may become more efficient as farms expand, specialise, shift enterprises, or where less productive farms exit agriculture altogether, releasing resources for other farms or activities where productive potential is higher. Significant transitions in industry structure often go hand-in-hand with advances in technology or changes in the economic environment (for example, changes in market conditions or regulatory arrangements) that give rise to the need or opportunity for change. Consolidation in the dairy industry, spurred in part by deregulation, is one example where the adoption of new technology (specifically greater mechanisation and automation of production) has been accompanied by an increase in average farm size; both developments together contributing to productivity.
214
Productivity in the broadacre and dairy industries
ABARESAgricultural commodities – vol. 3 no. 1 • March quarter 2013
While shifts in productivity are an outcome of farmers’ decisions—to innovate, to adopt new technologies and practices, to expand or change activities—the farm operating environment is influenced by government policies and regulations. Governments may influence agricultural productivity by:• providing incentives for innovation—for example, through appropriate R&D and
intellectual property structures and by promoting open, competitive markets that drive innovation
• improving capacity for innovation—for example, through investment in education and channels for disseminating information
• removing undue constraints that inhibit structural adjustment or flexible farm management—for example, through reforms addressing restrictive (and distortionary) regulatory or tax mechanisms (Productivity Commission 2008).
Changing sources of growthBroadacre productivity growth over the past 30 years has been largely supported by growth in the cropping and mixed crop–livestock industries, and more recently by progress in livestock industries (beef and sheep). The observed slowdown in growth, particularly in cropping and mixed crop–livestock, has renewed interest in opportunities for future productivity gains and the feasibility of achieving growth rates similar to those observed in the past.
Several factors suggest that returning to historic growth rates (such as those observed in the 1980s and 1990s) may be challenging and may increasingly depend on new sources of productivity growth. A number of significant economic and regulatory reforms in the 1980s and 1990s spurred industry restructuring and contributed to productivity growth in agriculture over that period. At the same time, important advances in technology also contributed to growth, particularly in cropping and dairy industries. The degree to which similar gains can be achieved in the future through industry restructuring, better application of existing technologies or growth in other broadacre industries (such as livestock) is unclear. Rather, growth in the future is likely to depend to a greater extent on advances in technology.
Broadacre and dairy productivity have benefited from key market reforms in the 1980s and 1990s, including regulatory reform of specific agricultural industries. Important milestones include the dismantling of statutory marketing and price support schemes in agriculture (notably wool, dairy and wheat), labour market reforms, and phasing out of tariff protection of agricultural products. Australia experienced an economy-wide surge of productivity growth in the 1980s and 1990s, in part attributable to progressive economic reforms, which has since slowed both in agriculture and across the broader economy (Productivity Commission 2010).
These reforms substantially reduced distortions and disincentives that inhibit innovation, adjustment and consequently productivity growth. For example, removal of price supports in the dairy industry has undoubtedly played a role in developments such as industry consolidation, investment in new dairy technologies and concentration in key dairy-producing regions. To the extent that areas most critical to agriculture have been tackled, productivity growth arising from further market reform is likely to be more limited than in the past.
215
Productivity in the broadacre and dairy industries
ABARESAgricultural commodities – vol. 3 no. 1 • March quarter 2013
Cropping and dairy industries have also experienced significant ‘step-changes’ in technology over the past 30 years that, together with extensive structural adjustment, have contributed to agricultural productivity growth. Among other advances, the cropping industry has benefited from a transition toward larger and more efficient sowing and harvesting equipment. Similarly, the dairy industry has also seen a shift toward greater automation and mechanisation of production. In both cases, this has been accompanied by significant industry consolidation, production concentration and an increase in average farm size that has allowed farms to benefit from technologies not feasible at a smaller scale (Sheng et al. 2011c). Together, these developments have facilitated capital deepening, increased labour productivity and contributed to overall productivity.
It has been argued that much of the benefit to cropping industries from increased mechanisation, structural adjustment and from other key advances in past decades may have been realised (Jackson 2010; Mullen et al. 2012; Nossal et al. 2009). Australian growers have a strong culture of innovation and technology uptake and so tend to operate relatively efficiently (Hughes et al. 2011; Mullen et al. 2012). As a result, there may be limited scope in the near term for gains through structural adjustment and further adoption of existing technologies and best practice.
To the extent that further gains from structural adjustments and uptake of current technologies may decline, on-farm innovation and advances in key technologies may become even more important to productivity in the future. Mullen et al. (2012) identify several areas of technological development that are likely to have important ramifications for productivity in the future. These include advances in plant and animal genetics (supported by advances in bioinformatics and genomics), increasingly sophisticated information-based technologies that allow more precise (or remote) management of on-farm systems, and technologies that address growing requirements for energy and water efficiency.
Implications for policyAs Banks (2012) recently highlighted, there is no ‘silver bullet’ that will address domestic productivity challenges, but rather a need for a consistent productivity reform agenda that is applied consistently across jurisdictions. However, while there is potential for productivity-enhancing reform on many fronts, the challenges currently facing agricultural industries highlight the importance of several particular areas of government influence.
There is an ongoing role for government in enabling the advancement of key technologies through the promotion of an effective domestic research environment. It is also likely that, in order to fully capture the benefits of more sophisticated technologies and raise farm capacity for innovation and adoption, the need for skilled labour will increase. In addition, several areas of regulatory and market reform may be especially important to agricultural productivity. In particular, the design of environmental markets and regulatory arrangements has the potential to shape productivity outcomes.
Research and developmentProductivity relies heavily on the effectiveness of the R&D system to supply appropriate innovations to diverse agricultural producers. In Australia, governments have been the major funders of domestic R&D, which has contributed significantly to productivity gains in agriculture (see, for example, Sheng et al. 2011a).

216
Productivity in the broadacre and dairy industries
ABARESAgricultural commodities – vol. 3 no. 1 • March quarter 2013
The pursuit of an efficient R&D system remains an area that may yield significant benefits to agriculture. Ideally, an efficient R&D system maximises the payoffs to public R&D investments, while minimising transaction costs. As a rule, this will involve targeting public R&D toward areas where private investment is unlikely to be sufficient to realise desirable public (social, environmental and other) benefits (Productivity Commission 2011). First steps toward this objective include clarifying inherently difficult-to-measure public benefits and improving the quality of data available for monitoring and evaluation of rural R&D investments. Cuevas-Cubria et al. (2012) propose a measurement framework toward this end.
Public R&D strategies can be complemented by efforts to minimise avoidable uncertainty and other disincentives to private R&D. Areas that may warrant review include chemical registration processes, aspects of domestic intellectual property law and restrictions around genetically modified (GM) crops (Keogh & Potard 2011).
At present, regulatory approval by the Gene Technology Regulator does not assure a ‘clear path’ to market for new GM crop varieties in Australia, despite their potential benefits. Instead, state moratoria on commercial release of GM crops and a lack of public acceptance more broadly have reduced private sector investment (Statutory Review Panel 2006). Transparent and evidence-based decision-making by states can provide greater certainty for investors and minimise disincentives to private investment in research.
Given Australia’s small domestic capacity for R&D relative to larger economies, realising benefits from international research spillovers—another key source of new technologies (Sheng et al. 2011a)—should remain an industry priority. This includes enhancing access to advanced farm inputs developed overseas, as well as new services and practices that may be locally adapted. In addition, it includes ensuring domestic capacity to identify and exploit relevant spillovers to make best use of existing knowledge and accelerate innovation and productivity growth (Cohen & Levinthal 1989; Maredia & Byerlee 2000).
Further research could be useful in devising research strategies to take advantage of international agricultural innovation spillovers. This could include:• identifying the sources of R&D spillovers and the channels through which
Australian agricultural industries access the results of external research (such as licensing arrangements)
• reviewing the capacity of agricultural industries to maximise spillover benefits from external R&D, including their capacity to identify and exploit technologies developed in other industries and countries
• examining the implications of increasing spillover benefits from external R&D for domestic research capacity and productivity growth in the long term.
Innovative capacity and human capitalAs well as adopting new technologies, the ability of farms to effectively select, adapt and implement appropriate innovations is perhaps more important (Nossal & Lim 2011). Human capital—accumulated through education, training and extension—directly improves productivity growth by increasing innovation adoption and improving the ability of farmers to select and apply appropriate innovations for improving production efficiency (Nossal & Lim 2011).
217
Productivity in the broadacre and dairy industries
ABARESAgricultural commodities – vol. 3 no. 1 • March quarter 2013
In Australia, a number of issues limit the supply of skilled labour in rural industry, including reduced participation in vocational education and training and other tertiary courses, competition from other industries, declining rural populations and poor perceptions of agriculture as a career path (DAFF 2009).
Further collaboration between government and industry could assist in meeting diverse agricultural education and training needs. For example, as recommended by the GRDC, expanding regional extension networks to develop partnerships between farmers, agribusinesses and consultants could assist in expanding regional expertise (PISC 2011). Flexible learning channels are another area that may assist to increase farm productivity (Gray et al. 2012).
Regulation and market reformRemoving barriers to farmers’ ability to operate efficiently is a key area for governments aiming to improve Australian agricultural productivity and competitiveness, particularly in the presence of growing resource constraints. Valid policy and regulatory objectives (including economic, social and environmental) can often be met more cost-effectively with fewer unintended consequences. Where this is possible, there are significant benefits from further reform to remove perverse incentives and to enable greater flexibility in resource allocation.
Perhaps the most important developing area that has the potential to affect agricultural productivity is environmental regulation. Changing societal expectations regarding environmental outcomes and the role of agriculture in managing natural resources point to an increasing need to achieve outcomes at least cost. Regulatory arrangements and development of markets for environmental goods that provide flexibility of on-farm management options, and promote efficient use of natural resources, can support productivity and minimise costs arising from resource constraints (Davidson et al. 2006).
The significant reform of water regulation and implementation of improved water trading mechanisms in the Murray–Darling Basin has demonstrated the capacity for market mechanisms to improve the efficiency of resource use. For example, the ability to trade water allowed water to move between irrigated activities, significantly reducing the impact of the recent drought (Goesch et al. 2011). Effective use of water markets by environmental managers is also likely to be required if the socio-economic impacts of meeting the environmental objectives of the Basin Plan are to be minimised (Goesch et al. 2011).
Native vegetation management is also likely to remain an important area of government policy for the foreseeable future (State of the Environment Committee 2011). Past policies have had mixed success, imposing substantial costs on farms and government. A significant proportion of farmers also report that native vegetation regulations lack flexibility or are unclear. Future policies require research into how the cost of producing environmental services in agricultural landscapes can be reduced through more flexible approaches supported by greater transparency of program objectives and better environmental metrics (Harris-Adams et al. 2012). Developments in this direction include promising pilots of market-based approaches to eco-service provision (Mullen et al. 2012).
More broadly, agriculture can continue to benefit from ongoing microeconomic reforms that have the potential to benefit economy-wide productivity (Banks 2012). These include improved delivery, operation and regulation of infrastructure (freight networks and pricing being of particular importance to agriculture), taxation reform, and further reform in labour markets to reduce rigidities and increase labour mobility.
218
Productivity in the broadacre and dairy industries
ABARESAgricultural commodities – vol. 3 no. 1 • March quarter 2013
ReferencesABARE 2004, Australian beef industry productivity and financial report, ABARE Australian beef report 04.1, Australian Bureau of Agricultural and Resource Economics, Canberra.
ABARES 2012, Agricultural commodity statistics 2012, Australian Bureau of Agricultural and Resources Economics and Sciences, Canberra, December.
Ashton, D & Mackinnon, D 2008, Australian dairy industry: Use of technology and management practices on dairy farms, ABARE research report 08.12, Canberra, December.
Banks, G 2012, Productivity policies: the ‘to do’ list, Chairman’s speech to the Economic and Social Outlook Conference, ‘Securing the Future’, Melbourne, 1 November.
Cohen, W & Levinthan, D 1989, ‘Innovation and Learning: The Two Faces of R&D’, The Economic Journal, vol. 99, no. 397, pp. 569–596.
Cuevas-Cubria, C, Gibbs, C, Nossal, K, Gray, E, Oss-Emer, M, Lawson, K & Davidson, A 2012, Measuring and reporting trends relating to the performance of Australia’s rural RD&E system, ABARES report to client prepared for the Agricultural Productivity Division, Department of Agriculture, Fisheries and Forestry, Canberra, June.
DAFF 2009, Workforce, training and skills issues in agriculture, a report to the Primary Industries Ministerial Council by the Industries Development Committee Workforce, Training and Skills Working Group, Department of Agriculture, Fisheries and Forestry, Canberra, October.
Davidson, A, Lawson, K, Kokic, P, Elliston, L, Nossal, K, Beare, S & Fisher, BS 2006, Native vegetation management on broadacre farms in New South Wales: Impacts on productivity and returns, ABARE eReport 06.3, Canberra.
Dharma, S, Shafron, W & Oliver, M 2012, Australian dairy: Farm technology and management practices 2010–11, Australian Bureau of Agricultural and Resource Economics and Sciences, Canberra, August.
Dunlop, M, Turner, GM & Howden, SM 2004, Future sustainability of the Australian grains industry: a consultancy report prepared for the Grains Council of Australia and Grains Research and Development Corporation, CSIRO Sustainable Ecosystems, Canberra.
Gleeson, T, Martin, P & Mifsud, C 2012, Northern Australian beef industry: Assessment of risks and opportunities, ABARES report to client prepared for the Northern Australia Ministerial Forum, Canberra, May.
Goesch, T, Gibbs, C, Nguyen, N, Hughes, N, Sanders, O & Gooday, P 2011, The economic and social effects of the Murray–Darling Basin Plan: recent research and steps, Outlook conference paper, ABARES Outlook 2011, Canberra, 1–2 March.
Gray, E, Sheng, Y, Oss-Emer, M & Davidson, A 2012, ‘Agricultural productivity, trends and policies for growth’, Agricultural commodities, vol. 19, no. 1, March quarter, pp. 657–76, Australian Bureau of Agricultural and Resource Economics and Sciences, Canberra.
Harris-Adams, K, Townsend, P & Lawson, K 2012, Native vegetation management on agricultural land, ABARES research report 12.10, Canberra, November.
219
Productivity in the broadacre and dairy industries
ABARESAgricultural commodities – vol. 3 no. 1 • March quarter 2013
Hughes, N, Lawson, K, Davidson, A, Jackson, T & Sheng, Y 2011, Productivity pathways: climate adjusted production frontiers for the Australian broadacre cropping industry, ABARES research report 11.5, Canberra.
Jackson, T 2010, Harvesting productivity: ABARE-GRDC workshops on grains productivity growth, ABARE research report 10.6 to the Grains Research and Development Corporation, Canberra, May.
Keogh, M & Potard, G 2011, Private sector investment in agriculture research and development (R&D) in Australia, research report, Australian Farm Institute, Surry Hills, Australia.
Maredia, MK & Byerlee, K 2000, ‘Efficiency of research investments in the presence of international spillovers: wheat research in developing countries’, Agricultural Economics, vol. 22, pp. 1–16.
Martin, P 2012, Australian lamb: Financial performance of slaughter lamb producing farms 2009–10 to 2011–12, Australian Bureau of Agricultural and Resource Economics and Sciences, Canberra, June.
Mullen, J, Tester, M, Goddard, M, Goss, K, Carberry, P, Keating, B & Belotti, W 2012, Assessing the opportunities for achieving future productivity growth in Australian agriculture, Australian Farm Institute, Sydney.
Nossal, K & Lim, K 2011 Innovation and productivity in the Australian grains industry, ABARES research report 11.06, Canberra, July.
Nossal, K.& Sheng, Y 2013, Cross-country comparisons of agricultural productivity–An Australian perspective, ABARES report for the Rural Industries Research and Development Corporation, Canberra, March.
Nossal, K, Sheng, Y & Zhao, S 2008, Productivity in the beef cattle and slaughter lamb industries, ABARE research report 08.13 for Meat & Livestock Australia, Canberra, December.
Nossal, K, Zhao, S, Sheng, EY & Gunasekera, D 2009, ‘Productivity movements in Australian agriculture’, Australian commodities, vol. 16, no. 1, pp.206–216.
PISC 2011, Grains industry - National research, development and extension strategy, Primary Industries Standing Committee R&D sub-committee, April, Canberra.
Productivity Commission 2008, Annual Report 2007–08, Annual Report Series, Canberra.
—— 2010, Annual Report 2009–10, Annual Report Series, Canberra.
—— 2011, Rural Research and Development Corporations, report No. 52, Final Inquiry Report, Canberra.
Sheng, Y, Gray, EM, Mullen, JD & Davidson, A 2011a, Public investment in agricultural R&D and extension: an analysis of the static and dynamic effects on Australian broadacre productivity, Australian Bureau of Agricultural and Resource Economics and Sciences, Canberra.
Sheng, Y, Mullen, JD & Zhao, S 2011b, A turning point in agricultural productivity: consideration of the causes, ABARES research report 11.4 for the Grains Research and Development Corporation, Canberra, May.
220
Productivity in the broadacre and dairy industries
ABARESAgricultural commodities – vol. 3 no. 1 • March quarter 2013
Sheng, Y, Zhao, S & Nossal, K 2011c, ‘Productivity and farm size in Australian agriculture: reinvestigating the returns to scale’, ABARES conference paper 11.06, presented at the Australian Agricultural and Resource Economics Society Conference, Melbourne, 6–11 February.
State of the Environment Committee 2011, State of the Environment 2011: Independent report to the Australian Government Minister for Sustainability, Environment, Water, Population and Communities, Canberra.
Statutory Review Panel 2006, Statutory Review of the Gene Technology Act 2000 and the Gene Technology Agreement, Canberra.
Zhao, S, Sheng, Y & Gray, EM 2012, ‘Measuring productivity of the Australian broadacre and dairy industries: Concepts, methodology and data’, in KO Fuglie, SL Wang & VE Ball (eds), Productivity Growth in Agriculture: An International Perspective, CABI, Wallingford, pp. 73–107.