the two faces of r&d-based innovation in a small, open ... · the two faces of r&d-based...
TRANSCRIPT
1
Bye, Brita*, Taran Fæhn* and Leo Andreas Grünfeld**
The two faces of R&D-based innovation in a small, open economy. How to stimulate productivity?
Abstract: Research and development (R&D) play a pivotal role for firm productivity and competitiveness, not only through developing new and better products and processes, but also through increasing the firms’ capacity to learn. The latter role, or face, of R&D has largely been neglected in applied growth models. We include both faces in a general equilibrium model and analyse how productivity should be stimulated in a small, open economy. Accounting for the firms’ capacity to absorb knowledge from abroad reinforces the welfare arguments for public support to R&D. Export subsidies prove even more efficient in generating growth and welfare, particularly so if export of high-tech products is stimulated. Hence, endogenous international R&D spillovers represent a clear argument for strategic export promotion.
Keywords: Absorptive capacity, Computable general equilibrium model, Endogenous growth, Research and Development, Spillovers, Strategic trade policy, Two faces of R&D
JEL classification: C68, E62, H32, O38, O41
Acknowledgement: Financial support from the Norwegian Research Council programme RENERGI is greatly acknowledged.
* Statistics, Norway, ** Menon Business Economics, Norway
2
1. Introduction
Recent empirical studies show that national productivity and competitiveness rely on domestic as well
as foreign R&D. This insight represents the fundament on which the EU Lisbon strategy is built. The
international channel is particularly important to small countries, where the domestic knowledge pool
and the capacity to create novel patents, products, and processes, are limited. Besides preparing for
domestic innovations, recent empirical studies emphasise the role of domestic R&D in increasing the
capacity of firms to absorb knowledge spillovers from abroad. This duality is often referred to as the
two faces of R&D (Cohen and Levinthal, 1989). This realisation brings up the question of how
national policy can enhance the exploitation of the international knowledge stock. So far, most applied
models regard productivity growth as exogenous. The domestic innovation process has received some
attention in recent, closed-economy model studies; see Russo (2004), Alvarez-Palaez and Groth
(2005), and Steger (2005). However, the dynamics of the cross-border diffusion of technological
change, and its importance for small, open economies, have largely been neglected.
Our contribution is to analyse how and why productivity growth should be stimulated in a small and
open economy, where R&D investments contribute to learning from foreign sources. More
specifically, we model growth effects of trade and R&D policy within a dynamic computable general
equilibrium (CGE) model for Norway, where both faces of R&D are included. We are able to account
for both direct inter-linkages between the internal and external productivity growth processes via the
absorptive capacity effects, and indirect linkages through various incidence and equilibrium effects.
The CGE framework captures interactions among markets, intertemporal dependencies, and industrial
differences in terms of innovation rates, employment, and trade that are crucial to the outcomes of
public policy.
Important market imperfections and policy wedges that potentially interact with innovation policies
are quantified in accordance with empirical findings. Our modelling of domestic R&D-based
innovation has its origin in the models of Romer (1990) and descendants (e.g. Diao et al., 1999, Jones
and Williams, 2000, Alvarez-Pelaez and Groth, 2005, Steger, 2005). Domestic technological change
results from profit-maximising development of patents through R&D and high-tech capital production
based on these patents. Increased availability of R&D-based technology increases the productivity
within final goods production. The model accounts for the central welfare arguments for subsidising
the domestic innovation process: There are positive externaities from accumulated R&D, efficiency
effects of widening the variety spectre of capital goods, and pro-competitive effects of increasing
output in the imperfectly competitive high-tech capital markets. The model also includes external
3
negative effects when more firms and patents enter the markets, as these will tend to crowd out output
within each firm and increase aggregate fixed patent costs. These are isolated arguments for
discouraging innovations.1
In addition, we explicitly model the productivity spillover mechanisms across borders. Most of the
theoretical and empirical models with endogenous growth analyse large and closed economies without
any external sources of technological change. One exception is Diao et al. (1999), who model
absorption of international knowledge as a function of economy-wide capital import. This is to our
knowledge the first CGE study of productivity growth that endogenises externalities from cross-border
spillovers. More recently, new evidence on the absorption process has appeared, as surveyed in section
2. Our analysis adds to the existing model literature, first, by regarding both imports and exports as
essential transmission channels for international knowledge. Second, we have put effort into mapping
the variation among industries with respect to absorption and absorptive capacity. Where Diao et al.
(1999) channel all spillovers through the R&D industry, we let international knowledge affect the
productivity of final goods producers differently according to the industry-specific trade intensity.
Finally, we assume that the capacity of final goods firms to absorb knowledge from abroad depend on
the innovativeness of the industry, as documented in e.g. Griffith et al. (2004).
We analyse and compare two policy instruments that may stimulate productivity and competitiveness
of domestic firms. The first policy, an R&D subsidy, directly stimulates productivity, both through
spillovers among patent producers, and within final goods industries through efficiency effects of
widening the variety spectre of patents. In addition, the subsidy affects absorptive capacity of firms, by
increasing final goods industries’ innovativeness, that is their intensity and quality of patent-based
technology. The second policy is a subsidy to production of patent-based, high-tech capital in order to
promote export. This policy option directly stimulates the absorption externalities via trade benefiting
the firms. Besides, the subsidies indirectly stimulate R&D, which increases productivity through
domestic innovation and through reinforcing absorptive capacity. Trade theory predicts that export
subsidies reduce national welfare, unless they have the effect of reaping surplus from foreign
competitors or consumers. Although there are no such effects in our model, another welfare argument
for export subsidies applies when there is an interaction between spillovers from abroad and export
intensity. We investigate whether this is an empirically significant argument.
1 These impacts resemble, but are not identical to, the effects of creative destruction of existing goods and duplication externalities in patent races; see Aghion and Howitt (1992) and Jones and Williams (2000).
4
We find that the latter policy option proves the most successful in generating welfare by counteracting
market imperfections in the innovation and absorption processes. It generates somewhat less domestic
innovation than the direct R&D support. Nevertheless, the economic growth rate is kept at virtually
the same level thanks to a larger contribution from absorption processes, i.e. more effective
exploitation of international productivity spillovers. We decompose the growth and welfare effects in
order to quantify the partial contributions of absorption. The welfare outcome of R&D stimulation is
doubled when absorption effects are allowed. Real capital accumulation and GDP increase. However,
the GDP growth rate is hardly affected, because the increased growth through international spillovers
is nearly offset by an out-crowding of growth impetus from domestic innovation. The structural
implication of accounting for absorption is a more widespread growth, taking place in a larger number
of industries.
2. International knowledge spillovers
The idea that knowledge and technology have public goods features is by no means new. Marshall
(1891) pointed to the free exchange of knowledge between agents as one of the key forces behind
industrial development. Central economists like Gerschenkron (1962) and Abramowitz (1986) stress
the importance of learning and diffusion of knowledge as engines behind long-term growth, and
Romer (1986) and Lucas (1988) show how analytical growth models improve their empirical fit when
growth is endogenised through knowledge accumulation and externalities. The concept of knowledge
spillovers now also plays an important role in industrial organisation (see e.g. d’Aspremont and
Jacquemin, 1988 for a central contribution).
Knowledge spillovers require that knowledge is diffused by one agent and absorbed by another. If, for
instance, a technology or a competency is highly codified, the potential for spillovers is limited.
Similarly, if a firm has a low capacity to absorb external knowledge, spillovers will not play a central
role in productivity improvements. Several studies address how investments in knowledge increase the
capacity of firms, industries or countries to learn from the frontier; see Abramowitz (1986) and
Griffith et al. (2004). The latter study also allows for a counteracting effect, in that growth slows down
as you approach the frontier, because the learning gap tightens. Knowledge and technology flow
across countries through trade, migration, investment, and diffusion through the media. Keller (2004)
provides an excellent survey of the empirical literature on this subject over the last 10 to 15 years.
Imports appear to be one of the most robust channels of international knowledge spillovers. Coe and
Helpman (1995) find that the total factor productivity of OECD countries is strongly affected by their
5
openness to R&D-intensive imports. The smaller a country is, the more important is technology
imports as a source of overall growth. Similar results are reproduced in a series of studies. Keller
(2002) extends the framework of Coe and Helpman and shows that geographical distance has a strong
negative effect on spillovers through imports, disclosing that spillovers depend strongly on physical
and cultural proximity. Other studies have applied the same approach on more detailed cross-country
industry data (e.g. Crespo et al, 2002) and reveal the same strong effect of R&D, or alternatively
patent-intensive imports, on productivity. More recent studies also incorporate absorptive capacity
aspects in international learning through imports, showing that more R&D-intensive sectors are able to
learn more from R&D-intensive imports than less R&D-intensive sectors (see e.g. Grünfeld, 2002 with
relevance to Norway).
Export as a channel of knowledge spillovers has received less robust support, and the number of
studies is more limited. Yet, recent evidence identifies significant spillover effects from exporters to
domestic firms. Bernard and Jensen (1999, 2004) give strong support to the learning-by-exporting
effect, showing that exporters have a 0.8 per cent higher productivity growth after controlling for
exporter selection. However, it is not clear whether this effect relates to spillovers from other firms in
the export market or from scale effects as exporters find new markets. Girma and Görg (2000)
separate the effects of exports on exporters own productivity and the productivity of others in the
industry and identify spillovers. Alvarez and Lopez (2006) find strong spillover effects from exporters
to non-exporters in a highly detailed firm level study on Chile. In contrast, Clerides et al. (1998) find
no such evidence in a dataset for Colombia, Mexico, and Morocco. Surprisingly, there exist no studies
that apply the Coe and Helpman method to investigate the effects of export on the home country
productivity. Neither do there exist any studies of the interaction between spillovers through exports
and the absorptive capacity of firms.
Another potential channel for spillovers is foreign direct investments (FDI). Pottelsberghe and
Lichtenberg (2001) identify such spillovers on the macro level, while Damijan et al. (2004) find that
spillovers through inward FDI stands out as the most important contributor to productivity in 10
transition economies, based on firm-level data. In the case of Norway and Sweden, industry data
studies show no significant spillover effects from inward FDI (Grünfeld, 2002, Braconier et al. 2001),
but firm-level analysis and studies of worker mobility between multinationals and domestic firms
show significant spillovers (Karpaty and Lundberg, 2004 and Balsvik, 2006).
6
We model import and export intensity of industries as decisive to learning across borders. We exclude
FDI as a channel, based on the two Scandinavian studies reported above. The idea is that exposure to
international competitors provides information about their technology and competency. We explicitly
model the capacity of firms to absorb knowledge from abroad as a function of the innovativeness of
the industry, proxied by its intensity of patent-based, high-tech capital. The productivity effects of
investing in absorptive capacity have decreasing returns to scale, in order to account for catching-up
effects.
3. An open economy CGE model with innovation and absorptive
capacity
3.1. General features
The CGE model is a dynamic growth model with intertemporally optimising firms and households. It
gives a detailed description of the empirical tax, production, and final consumption structures. It
specifies 16 final goods industries and one high-tech industry producing R&D-based high-tech capital
goods. The final goods industries2 comprise one public and 15 private industries, which according to
the empirical input-output structure deliver to final markets and produce intermediates for each other.
The public sector collects taxes, distributes transfers, and purchases goods and services from the
industries and from abroad. The model fits a small, open economy and is calibrated for Norway.
International prices are determined at the world market, as is the interest rate. Financial savings are
endogenously determined, subject to a non-ponzi game restriction that prevents foreign net wealth
from exploding in the long term. The exchange rate serves as numeraire.
The model takes into consideration exogenous growth drivers through changes in demography and
international conditions, as well as several endogenous productivity growth mechanisms. First, the
productivity within R&D activity continuously grows because of dynamic spillovers from the
accumulated knowledge induced by previously patented R&D, though with decreasing returns as in
Jones (1995). Second, new high-tech capital varieties emerge based on the new patents, and due to
love of capital variety, the productivity of high-tech investments within final goods industries
increases with the number of patents. Third, the absorption of productivity improvements from abroad
depends on the industries’ extent of foreign trade and their reliance on patent-based, high-tech capital.
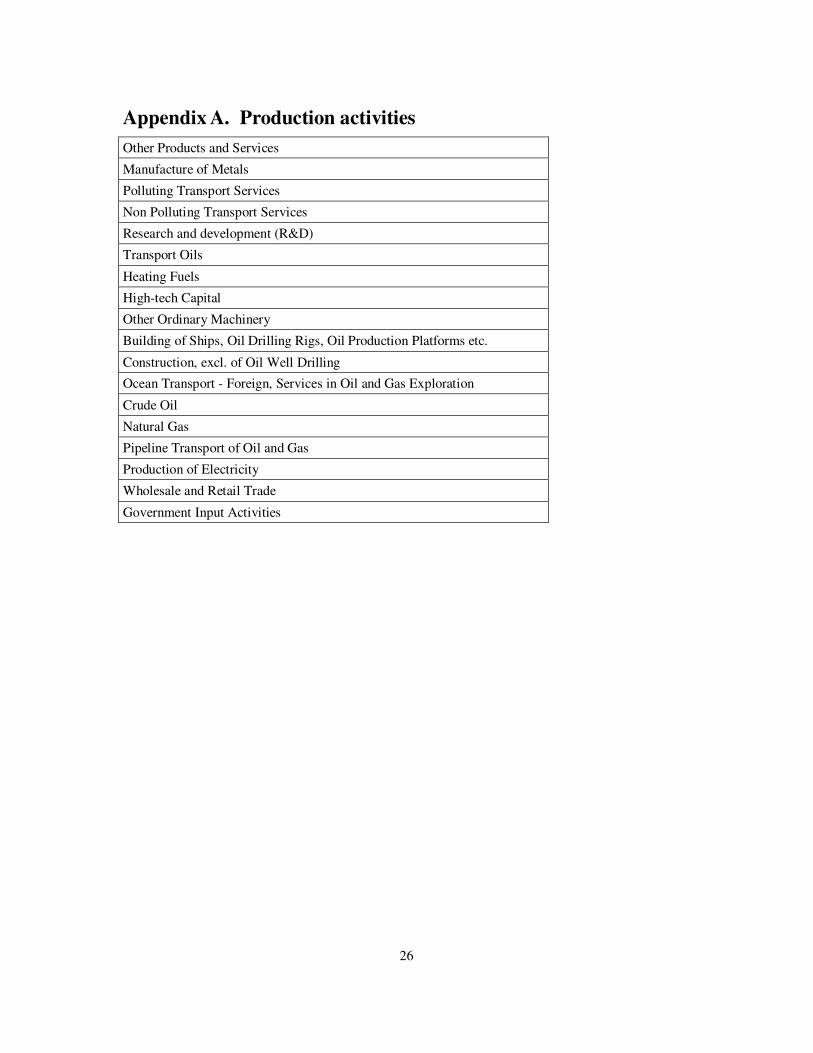
2 See appendix A for a list. The following industries are treated exogenously: the governmental sector, the offshore production of oil, gas and pipeline transport, and ocean transport.
7
Finally, productivity improves through accumulation of several types of real capital, which results
from the cash-flow maximisation of rational, forward-looking firms.
The following two subsections, 3.2. and 3.3., provide detailed descriptions of the parts of the model
that bring about productivity growth through absorption and domestic innovation, respectively.
Subsection 3.4. briefly outlines the remaining model mechanisms, including behavioural relations and
equilibrium and balanced-growth conditions. To simplify this model exposition, policy variables as
taxes and subsidies are disregarded. Appendix B provides a more thorough, aggregated presentation of
the equations determining firm and household behaviour, where the relevant policy variables are
included. Appendix C gives details on parameter values, as well as calibration and solution
procedures. See Bye et al. (2006)3 for a complete model documentation.
3.2. Productivity growth through absorption of international knowledge
In general terms, technology of firm i , irrespective of industry, can be represented by:
(1) ( )iii VFgX =
VFi is a nested Constant Elasticities of Substitution (CES) function of a number of inputs, see figure
B.1. in Appendix B. There are decreasing returns to scale in all industries.4 VFi can be represented by:
(2) ( )ττττ i
M
i
V
iiii VKKLfVF ,,,= .
Li, KV
i, KM
i, and Vi represent the firm’s input of labour, high-tech capital, other capital, and
intermediates, respectively. Factor inputs also depend on a factor-neutral, endogenous productivity
variable τ, which is assumed common to all firms in the industry, thus having no subscript. τ reflects
the firms’ absorption of productivity by learning from abroad:
(3) )( 210 BAAF
λλλτ ++=
τ responds to growth in the productivity level abroad, AF, according to an elasticity,
BA 210 λλλ ++ , λ0 ensures an autonomous effect of external productivity growth. The λ1 and λ2 -
parameters determine the relative influence of Α, an export-dependent term, and Β, an import-
dependent term, defined as follows:
(4) X
XHA
W
⋅= , 0'>H , 0'' <H
3 Available at http://www.ssb.no/emner/10/03/doc_200611/doc_200611.pdf. 4 The scale elasticity is equal for all industries, see also appendix B and C.
8
(5) HX
IHB ⋅=
The term Α account for the absorption elasticity’s dependence on the industry’s export, XW, as share of
output, X. The term B describes the corresponding dependence on industry imports, I, measured
relative to the deliveries of similar products from domestic firms within the industry, XH. The function
Η, represents the absorptive capacity of the firm. We model it as a function of the industry’s input
intensity of high-tech, patent-based capital, KV/VF, so that for industries engaging in foreign trade, the
firms’ capacities to learn from this interplay with foreign agents expand if the innovativeness of the
industry increases. There is decreasing returns to high-tech input intensity, which we ensure by the
following specification:
(6)
00
00
/
/
2
/
/
VFK
VFK
VFK
VFK
H
V
V
V
V
+
=ϕ
ϕ
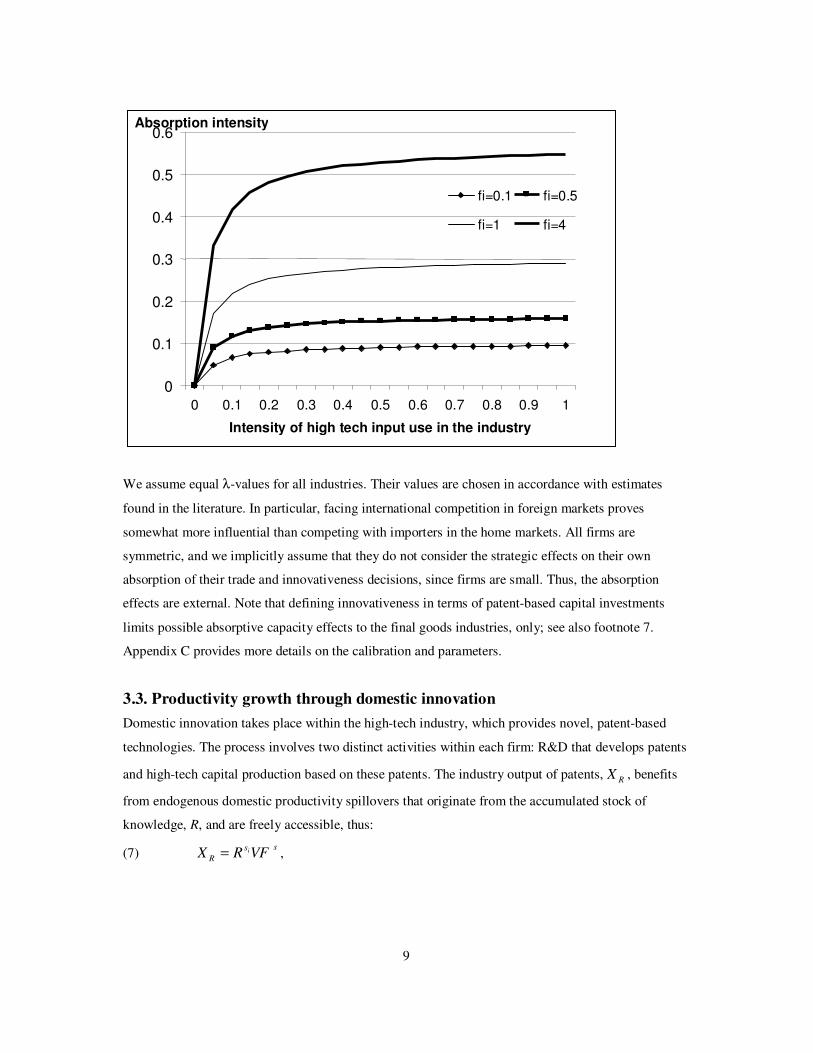
In figure 1 below, we plot the absorptive capacity on the vertical axis as a function of high-tech input
intensity and the size of the parameter, ϕ . Notice that since our CGE-model is inter-temporal, we are
concerned about how absorptive capacity evolves over time. The base year high-tech intensity,
denoted by 0, serves as a benchmark for the ability of an industry to improve its absorptive capacity. If
the intensity is high in the base year, an increase in absorptive capacity requires larger increases in the
use of high-tech inputs. This aspect of the model also contributes to control for base year variations in
absorptive capacity and input compositions.
9
We assume equal λ-values for all industries. Their values are chosen in accordance with estimates
found in the literature. In particular, facing international competition in foreign markets proves
somewhat more influential than competing with importers in the home markets. All firms are
symmetric, and we implicitly assume that they do not consider the strategic effects on their own
absorption of their trade and innovativeness decisions, since firms are small. Thus, the absorption
effects are external. Note that defining innovativeness in terms of patent-based capital investments
limits possible absorptive capacity effects to the final goods industries, only; see also footnote 7.
Appendix C provides more details on the calibration and parameters.
3.3. Productivity growth through domestic innovation
Domestic innovation takes place within the high-tech industry, which provides novel, patent-based
technologies. The process involves two distinct activities within each firm: R&D that develops patents
and high-tech capital production based on these patents. The industry output of patents, RX , benefits
from endogenous domestic productivity spillovers that originate from the accumulated stock of
knowledge, R, and are freely accessible, thus:
(7) ss
R VFRX i= ,
0
0.1
0.2
0.3
0.4
0.5
0.6
0 0.1 0.2 0.3 0.4 0.5 0.6 0.7 0.8 0.9 1
Intensity of high tech input use in the industry
Absorption intensity
fi=0.1 fi=0.5
fi=1 fi=4
10
where RXRR += −1 . The parameter s1 denotes the elasticity with respect to the domestic spillovers.
As suggested in Jones (1995), it is less than unity. 5 This productivity growth dynamics stemming from
R&D is external to the individual patent producer, who is too small to consider the effect of its own
output on the accumulated stock of patented knowledge. s <1 is the scale elasticity of the production
factors used for R&D. The development of a new patent represents a fixed establishment cost for a
new firm in the high-tech industry, who produces a new variety of the high-tech capital good, kV. The
variety production also involves variable costs of factor inputs. We assume identical cost structures for
all the firms.
The high-tech varieties are partly exported, partly delivered to domestic final good industries. The
input of each capital variety, V
ik , is represented by so-called Spence-Dixit-Stiglitz (love-of-variety)
preferences for a composite of the varieties, KV:
(8) ( )( ) ( )1
1
1 −
=
−
= ∑
kV
kV
kV
kVR
i
Vi
VkK
σσ
σσ
R is the accumulated number of high-tech capital varieties (and firms in the high-tech industry), and
σkV is the uniform elasticity of substitution applying to all pairs of capital varieties. The more varieties,
the higher is the productivity of the high tech capital within final goods industries. This love-of-variety
effect represents a second external productivity growth mechanism stemming from R&D. Again, the
high-tech firms are too small to consider their impact on the productivity of the aggregated composite,
KV. The input intensity of the high-tech composite within final good industry j, j
V
j VFK / , varies with
j and reflects its degree of innovativeness.6
3.4. Market behaviour, equilibrium and balanced growth
Market behaviour of firms:
Production is allocated to the foreign and domestic markets, which are segmented through a Constant-
Elasticity- of-Transformation (CET) technology. (All firms within an industry are identical, and firm
notation is suppressed):
5 s1 is 0.5. 6 In the R&D and high-tech capital production within the high-tech industry, input of Kv is per definition zero, in order to avoid cumulative love-of-variety multiplicators.
11
(9) ( ) ( )[ ] ρρρ1
WHXXX +=
The transformation elasticity ρ >0 implies costs of diverting deliveries between the two markets.7 By
assuming ρ=1/s we obtain separability between the export and home market supplies, see Holmøy and
Hægeland (1997). Each firm has perfect foresight and maximises the present value of the after-tax
cash flow. Except for the domestic high-tech capital market, competition is perfect, and the first-order
conditions equate prices with marginal costs within the two, segmented markets. The CET technology
implies that the ratio of export to domestic market deliveries is determined by the relative price
between them.
The high-tech-producing firms have market power in the domestic market. Maximisation of the
present value of the after-tax cash flow gives the following first-order conditions for deliveries to the
home market H
kiX :
(10) ( )1 s
H H ski ki ki
cP m X
s
−
= .
The monopoly price of capital variety i, H
kiP , is set as a mark- up, mki, on costs. 1
ki
ki
ki
mε
ε=
−, where εki
is the domestic demand elasticity for high-tech capital varieties. The price in the domestic market is
equal for all the capital varieties, and each variety is produced in equal quantities.
From the value maximisation of the representative firm, while using the fact that profit is equal for all
firms, the entry condition for each firm producing high-tech varieties can be deduced:
(11) ( )dteP trt
R ∫∞
−=
00
~π .
0RP is the fixed entry cost in period 0, or the shadow price of developing a patent in advance of
variety production. Firms are entering until the representative firm’s discounted net profits equal the
entry cost. In each period, new patents are produced and new firms will enter the high-tech markets.
Given that a firm has entered, the first-order condition in eq. (10) determines the domestic price of the
capital variety for given marginal costs and demand.
12
Except for labour and patent-based, high-tech capital, the factors of production are importable. An
Armington type CES aggregate of imported and homemade varieties of the same investment or
intermediate good defines them as imperfect substitutes, implying the following purchaser price, P, of
a composite good:
(12) ( ) HIHIHI IH
PPP σσσ υυ −−− +−= 1
1)1()1( )())(1( .
PH is the price of the domestic variety, PI is the respective, exogenous, import price, ν is the initial
import share, while σHI is the substitution elasticity (Armington elasticity) between the two varieties.
The Armington assumption implies that the shares of imports to home deliveries are determined by the
ratio of the domestic to the import prices.
Consumer behaviour
Consumption and saving result from the decision of an infinitely lived, perfectly foresighted
representative consumer that maximises intertemporal utility. The consumer chooses a consumption
path subject to an intertemporal budget constraint that requires the present value of consumption not to
exceed total wealth (current non-human wealth plus the present value of labour income and net
transfers). Labour supply is exogenous. We assume that the consumer's rate of time preferences equals
the exogenously given nominal interest rate for the entire time path. Total consumption is allocated
across 10 different goods and services according to a nested CES structure. The structure is given in
figure B.2 in appendix B. Each consumer good also consists of one imported and one domestically
produced variety according to an Armington function as in eq. (12).
Equilibrium conditions
The model is characterised by equilibrium in each period in all product markets and the labour market.
Intertemporal equilibrium requires fulfilment of two transversality conditions: the limit values of the
total discounted values of net foreign debt and of real capital, respectively, must both be zero. The
model is characterised by a path-dependent balanced growth path solution (or steady state solution),
see Sen and Turnovsky (1989) for a theoretical exposition. This implies that both the path and the
long-run stationary solution differ between simulated scenarios.
To ensure a long-run balanced growth path, the following conditions must be fulfilled: 1) The rate of
technological change for each input factor in each industry must converge to the same rate, g, so that
each industry grows at the same rate. 2) The growth in per capita consumption equals the same rate, g.
7 This, together with decreasing returns to scale of total factor use, so that s < 1, avoids complete specialisation of production
13
3) The population growth rate is constant. Along the transitional path the growth rate may vary. Bye et
al. (2006) give further details.
A balanced growth path also requires that the following equation is fulfilled:
(13) ( )
( )( )
( ) dg
pr
σθ 1
1
11
1 −+=
++
+
θ is the rate of time preferences, r is the nominal interest rate, p is the growth rate of the consumer
price index, and σd is the intertemporal elasticity of substitution. Together with equation (13), the
transversality condition regarding net foreign debt is fulfilled when the consumer finds the optimal
level of consumption, given the intertemporal budget constraint and the transversality condition.
Correspondingly, the transversality condition for the value of real capital is a restriction on the
determination of net investments by firms.
4. Policy analyses and numerical results
4.1. Design of the study
Previous sections have lined out what are the important channels for productivity growth and why
public intervention can be desirable. It is clear that in presence of many channels and externalities, the
outcomes of different stimuli are á priori difficult to predict. We analyse numerically two policy
options that affect productivity, but through dissimilar direct channels. The first, an R&D subsidy,
directly stimulates domestic innovation and by that, also the absorptive capacity of industries engaging
in trade. The other policy alternative is a support to trade, designed to affect absorption directly. Both
policy alternatives are implemented as ad valorem subsidy rates, which are introduced in the first
simulation year and kept constant onwards. The alternatives are made comparable by choosing subsidy
rates that generate equal subsidy values in discounted terms. Besides the direct effects, both policies
also affect productivity through several indirect channels, most importantly through the input-output
linkages and factor markets, including accumulation of real capital. We ask what policies perform best
in stimulating macro-economic growth and national welfare.
of tradeables.
14
To throw more light on the results, we quantify the respective contributions of the innovation and the
absorption mechanisms. We do this by studying the same policy changes within two different regimes.
The first includes both innovation and absorption responses and their direct and indirect interplay. We
use this full model to simulate our main projections of policy responses. We compare these projections
from the full model with simulations on a simpler model that illustrates a regime with domestic
innovation processes, only. This enables us to isolate the effects of accounting for endogenous
absorption of international spillovers. The productivity effects of endogenous real capital
accumulation are included in both regimes.
Section 4.2 presents the decomposition results for the first policy, the R&D subsidy. We report the
long-run effects (in 2060), when the economy has obtained stable growth rates. Most effects are
measured as percentage deviations from the reference path. Section 4.3 compares the results of the
policy alternatives.
4.2. Innovation and absorption effects of stimulating R&D
We introduce a constant 5.0 per cent ad valorem subsidy to production of new patents. The direct
effect is to shift marginal costs of R&D downwards. For a given shadow price of patents, supply
increases. The marginal willingness to invest in R&D is determined by the discounted future profit for
the last new firm entering the high-tech capital market, and it falls along with entry, as the market
share and profit of each variety producer fall. The marginal costs of R&D will perpetually shift
downwards as a result of dynamic, positive spillover effects from the accumulated knowledge stock.
In long-run equilibrium, R&D increases considerably, by 18.4 per cent, while the shadow price of
patents falls by 6.4 per cent compared to the reference; see Table 1. The number of capital varieties
increases by 8.7 per cent.
In the domestic market for high-tech capital, output within each firm falls as the demand for each
variety shifts downwards when the number of varieties increases. The output of each variety is further
downscaled as a response to increased factor prices. In the new long-run equilibrium, each firm’s
domestic deliveries fall by 3.9 per cent, while export deliveries fall by 5.2 per cent. The factor price
increases reflect higher scarcity. Wages increase by 2.1 per cent. Stronger factor market competition
from the newcomers in the high-tech capital market, as well as from R&D, is part of this picture, but
the main pressure comes from other final goods producers. Their rising demand reflects two
productivity effects. First, the productivity of the high-tech capital used in final goods industries
increases with the number of varieties. This is reflected in a fall in the capital price per efficiency unit
15
of 5.0 per cent, despite a slight rise in the price of each variety of 0.5 per cent. Second, final goods
producers face better circumstances for absorbing knowledge spillovers.
The absorption effects primarily take place within trade-intensive industries, and the export engine is
empirically the strongest. Absorption effects through export are self-enforcing before emptying out: In
isolation, higher export increases absorption, which again feeds back into higher export by improving
the productivity and competitiveness. Trade-intensive industries can make use of the increased patent
intensity of the economy, which both implies higher total deliveries of high-tech capital to the
domestic producers, and also increases the productivity of that capital because of love of variety. Both
these are components in the final industries’ innovativeness, i.e. their efficient input of high-tech
capital, which fuels their absorptive capacity. The most exposed and innovative final goods industries,
in Table 1 represented by Power-intensive manufacturing, increase their absorbed productivity growth
by 0.03 percentage point. Others, that are less exposed and innovative, face no accelerated growth in
absorption. Construction is a typical representative in this respect. We see the same within the high-
tech capital industry, which faces a slight slowdown in its absorbed productivity growth because the
share of export in total output falls.
All in all, GDP increases by 1.5 per cent and the long-run GDP growth rate increases by 0.05
percentage points. Productivity effects transform into an increase in long run export of 2.4 per cent and
of final consumption of 0.7 per cent. Consumption-smoothing behaviour implies that consumption
growth hardly changes, thus, the welfare gain of the reform amounts to 0.7 per cent, as well. In the
early periods of the transition path, the consumption increases at the expense of net export, and the
economy borrows financial capital from abroad. In the later periods, when the productivity growth has
widened the production capacity, serving debt through higher net export can be combined with
increased consumption.
In the explanations above, both domestic innovation and spillovers from abroad through absorption
processes play important parts. We decompose the industrial impacts, GDP growth, and welfare
changes by first leaving out the effects of absorption to examine the impacts of the domestic
innovation channel, before studying the additional effects of allowing absorption to interplay with
innovation, capital accumulation and other endogeneities in the model. The R&D subsidy rates are the
same, to make the results comparable.8 Table 1 reports the results of such decomposition.
8 The difference in public financing costs is neutralised by lumpsum taxation.
16
Both in case of endogenous and exogenous absorption, the R&D subsidy causes a shadow price
reduction of patents and a stimulation of R&D. Nevertheless, the expansion of patent production is
considerably weaker when absorptive capacity is endogenous. We have to understand the demand for
high-tech capital in order to explain this. We observe that both the home markets and the export
markets reduce their demand for the domestically produced high-tech capital when spillovers from
abroad are endogenised. The export deliveries are particularly affected. The explanation lies in
relatively sharp factor price increases when absorption effects are included. The effect on the wage
rate more than doubles. This reflects a considerable factor demand increase from the final goods
producers that face high productivity growth due to absorption. While higher wages induce
considerable rises in entry and variable costs of high-tech producers, the competitiveness of several
final good industries becomes less adversely affected. Power-intensive manufacturing is an illustrative
example; they intensively trade and invest in high-tech capital and become better at exploiting the
productivity growth abroad. The result is a clear crowding-out of the relatively labour-intensive
production of patents and high-tech capital when absorption effects are accounted for. This is
reinforced by the spillover dynamics in R&D, as less accumulated knowledge will spill over to present
R&D activity. When absorptive capacity effects are present, growth will slow down in the R&D and
high-tech producing part of the economy. It will no longer be the main GDP growth engine of the
economy. Rather, the growth stimulus of the subsidy will take place in a wider spectre of activities. In,
aggregate, however, GDP growth is only slightly higher..
The decomposition reveals that more than half of the total welfare gain from the reform is caused by
benefits from absorbed productivity. Recall that absorptive capacity is a common good that benefits
not only the firm that increases its trade or its high-tech input, but the entire industry. Such
externalities from trade and use of high-tech capital explain the welfare gain of the extra absorption.
However, it costs in terms of less domestic innovation. A smaller increase in the number of patents
and new varieties produces less positive spillovers through the knowledge stock (standing-on-
shoulders effect), and through the efficiency of high-tech capital due to love of variety. These are
counteracted by two positive welfare contributions in terms of smaller reductions of intra-firm
deliveries to the home markets, where they enjoy monopoly profits, and lower aggregate entry costs in
the high-tech industry in terms of patent expenditures (even though the patent shadow price increase
somewhat).
An additional negative contribution to welfare in the endogenous absorption case stems from the fact
that total savings fall, in spite of considerable real capital accumulation. As opposed to closed
17
economy models, national savings are separated from real capital investments by the possibility of
financial saving and borrowing. Both real and financial capital income taxation drives a wedge
between private and social returns to capital and renders savings too low from an intertemporal
efficiency point of view, and the reduction of savings reinforces this inefficiency. This negative effect
on welfare is, however, not sufficiently strong to outweigh the positive effects already addressed.
Consumption is considerably higher along the whole simulation path. Gross trade increases another
0.6 percentage points when endogenous absorption is accounted for. The main contributors to this
increase are higher export and import of consumption goods and power-intensive manufactures, in
addition to higher export of high-tech capital. The long-run solution is characterised by a higher level
of GDP and a slightly higher GDP growth, mirroring the productivity improvements from the
absorptive capacity mechanism.
18
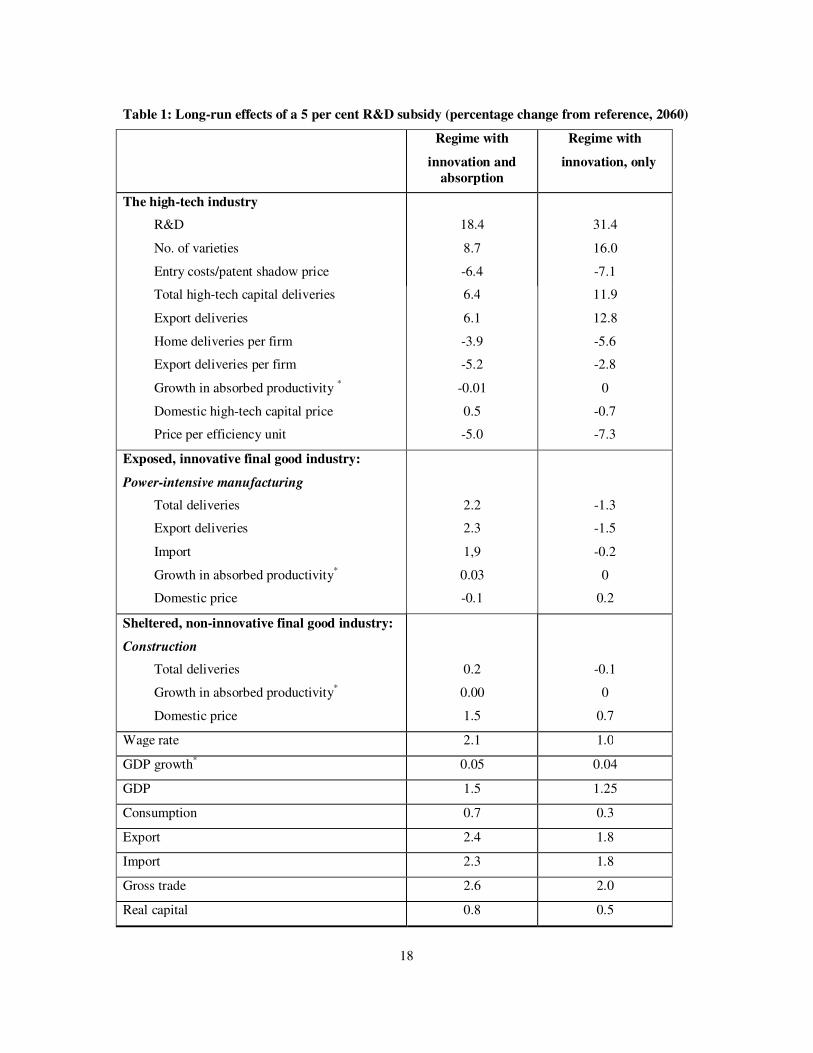
Table 1: Long-run effects of a 5 per cent R&D subsidy (percentage change from reference, 2060)
Regime with
innovation and
absorption
Regime with
innovation, only
The high-tech industry
R&D
No. of varieties
Entry costs/patent shadow price
18.4
8.7
-6.4
31.4
16.0
-7.1
Total high-tech capital deliveries
Export deliveries
Home deliveries per firm
Export deliveries per firm
Growth in absorbed productivity *
Domestic high-tech capital price
Price per efficiency unit
6.4
6.1
-3.9
-5.2
-0.01
0.5
-5.0
11.9
12.8
-5.6
-2.8
0
-0.7
-7.3
Exposed, innovative final good industry:
Power-intensive manufacturing
Total deliveries
Export deliveries
Import
Growth in absorbed productivity*
Domestic price
2.2
2.3
1,9
0.03
-0.1
-1.3
-1.5
-0.2
0
0.2
Sheltered, non-innovative final good industry:
Construction
Total deliveries
Growth in absorbed productivity*
Domestic price
0.2
0.00
1.5
-0.1
0
0.7
Wage rate 2.1 1.0
GDP growth* 0.05 0.04
GDP 1.5 1.25
Consumption 0.7 0.3
Export 2.4 1.8
Import 2.3 1.8
Gross trade 2.6 2.0
Real capital 0.8 0.5
19
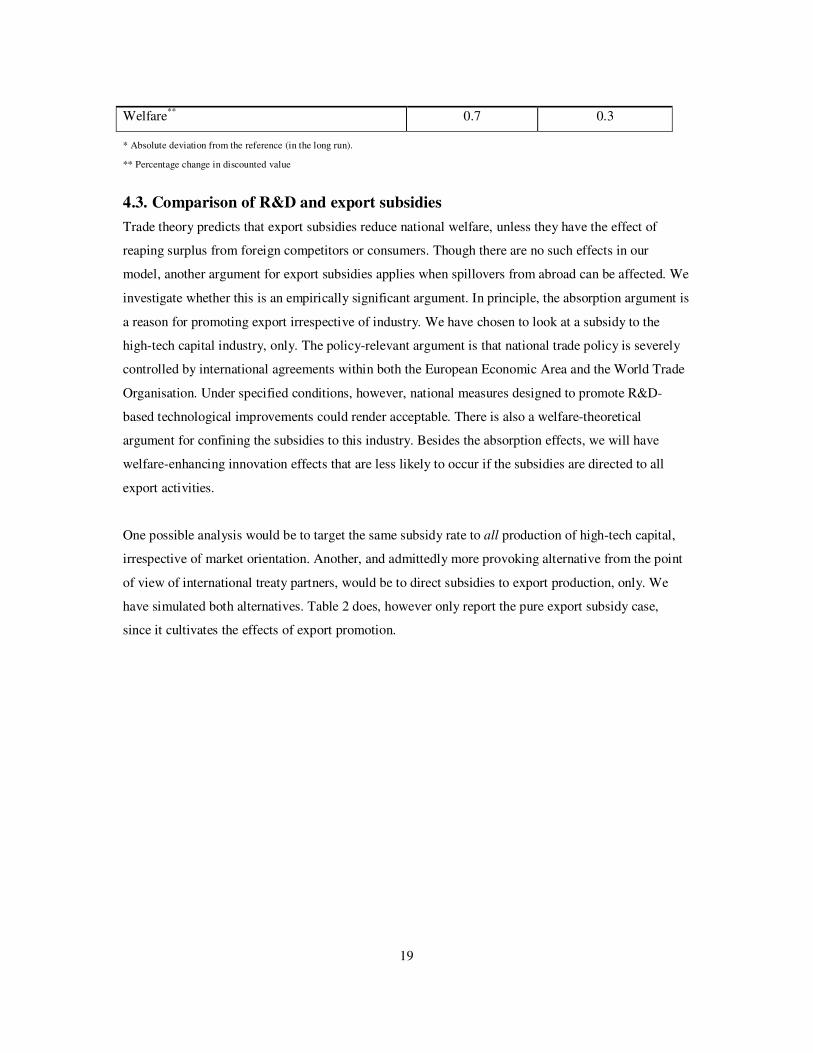
Welfare** 0.7 0.3
* Absolute deviation from the reference (in the long run).
** Percentage change in discounted value
4.3. Comparison of R&D and export subsidies
Trade theory predicts that export subsidies reduce national welfare, unless they have the effect of
reaping surplus from foreign competitors or consumers. Though there are no such effects in our
model, another argument for export subsidies applies when spillovers from abroad can be affected. We
investigate whether this is an empirically significant argument. In principle, the absorption argument is
a reason for promoting export irrespective of industry. We have chosen to look at a subsidy to the
high-tech capital industry, only. The policy-relevant argument is that national trade policy is severely
controlled by international agreements within both the European Economic Area and the World Trade
Organisation. Under specified conditions, however, national measures designed to promote R&D-
based technological improvements could render acceptable. There is also a welfare-theoretical
argument for confining the subsidies to this industry. Besides the absorption effects, we will have
welfare-enhancing innovation effects that are less likely to occur if the subsidies are directed to all
export activities.
One possible analysis would be to target the same subsidy rate to all production of high-tech capital,
irrespective of market orientation. Another, and admittedly more provoking alternative from the point
of view of international treaty partners, would be to direct subsidies to export production, only. We
have simulated both alternatives. Table 2 does, however only report the pure export subsidy case,
since it cultivates the effects of export promotion.
20
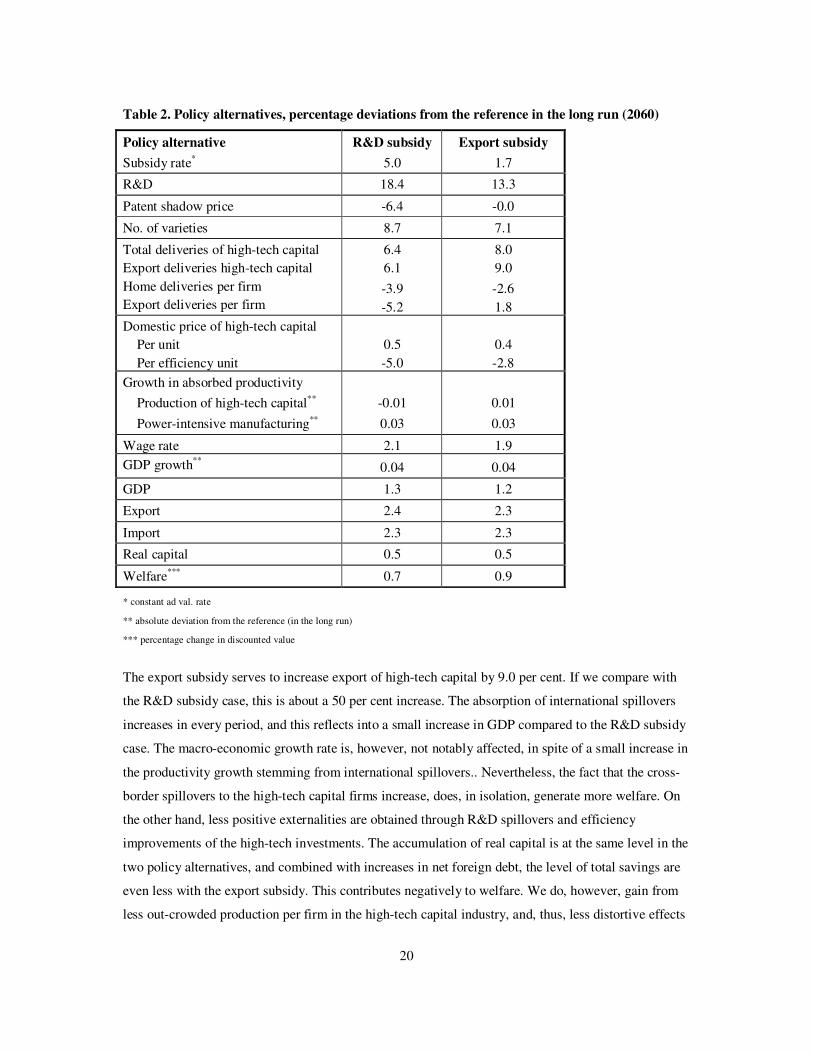
Table 2. Policy alternatives, percentage deviations from the reference in the long run (2060)
Policy alternative
Subsidy rate*
R&D subsidy
5.0
Export subsidy
1.7
R&D 18.4 13.3
Patent shadow price -6.4 -0.0
No. of varieties 8.7 7.1
Total deliveries of high-tech capital
Export deliveries high-tech capital
Home deliveries per firm
Export deliveries per firm
6.4
6.1
-3.9
-5.2
8.0
9.0
-2.6
1.8
Domestic price of high-tech capital
Per unit
Per efficiency unit
0.5
-5.0
0.4
-2.8
Growth in absorbed productivity
Production of high-tech capital**
Power-intensive manufacturing**
-0.01
0.03
0.01
0.03
Wage rate 2.1 1.9
GDP growth** 0.04 0.04
GDP 1.3 1.2
Export 2.4 2.3
Import 2.3 2.3
Real capital 0.5 0.5
Welfare*** 0.7 0.9
* constant ad val. rate
** absolute deviation from the reference (in the long run)
*** percentage change in discounted value
The export subsidy serves to increase export of high-tech capital by 9.0 per cent. If we compare with
the R&D subsidy case, this is about a 50 per cent increase. The absorption of international spillovers
increases in every period, and this reflects into a small increase in GDP compared to the R&D subsidy
case. The macro-economic growth rate is, however, not notably affected, in spite of a small increase in
the productivity growth stemming from international spillovers.. Nevertheless, the fact that the cross-
border spillovers to the high-tech capital firms increase, does, in isolation, generate more welfare. On
the other hand, less positive externalities are obtained through R&D spillovers and efficiency
improvements of the high-tech investments. The accumulation of real capital is at the same level in the
two policy alternatives, and combined with increases in net foreign debt, the level of total savings are
even less with the export subsidy. This contributes negatively to welfare. We do, however, gain from
less out-crowded production per firm in the high-tech capital industry, and, thus, less distortive effects
21
of the mark-up pricing domestically. In net, the larger absorption effects and smaller output reduction
of each high-tech variety relative to the R&D subsidy case, outperform the smaller generation of
positive externalities and the lower level of total savings, and result in a slightly higher welfare gain.
In the more realistic policy alternative where the same discounted subsidy amount is allocated to high-
tech capital production irrespective of market orientation, both domestic innovation and absorption
effects are smaller than in the pure export subsidy case. The rise in long-run growth becomes 0.01
percentage points lower than with only export subsidy, and the welfare gain drops to 0.7 per cent,
which is in line with the R&D subsidy case.
5. Conclusions
Recent empirical studies find that a country’s level of R&D affects productivity and competitiveness
of national firms, not only through developing new and better products and processes, but also through
increasing the firms’ capacity to learn from abroad. For small countries, the international channel is of
high importance, as they necessarily rely heavily on technological change induced abroad. This fact
brings up the question on how national efforts can enhance the exploitation of this common good.
Evidence from the last decade indicates that the more exposed the industry, the more crucial it will be
to invest in knowledge. This study combines the modelling of innovation processes with the modelling
of absorption. We have founded the model on empirical estimates and data, in order to grasp
quantitatively the interplay between domestic innovation and spillovers of productivity growth from
abroad. Along with the direct linkages described, we account for indirect interdependencies via
resource restraints and behavioural responses by modelling the processes in a CGE setting. The
disaggregate approach also allows us to study industrial disparities and variations in growth prospects
under different assumptions.
We ask how and why productivity growth should be stimulated in a small and open economy. Most
previous studies conclude that current levels of R&D are inefficiently low from a macroeconomic
perspective and that policy intervention is welfare enhancing. We find that accounting for absorptive
capacity effects of R&D significantly strengthens these conclusions. This is so, even though
stimulation of absorption in final goods industries comes at the cost of fewer resources devoted to
domestic innovation activities. It is important to have in mind that it is the externalities, not
productivity or innovation promotion per se, that call for public intervention. A main precondition for
the welfare gains from absorption is that firms do not fully take into account the effects their
22
behaviour has on spillovers from abroad. We consider positive external spillovers of their international
activities and their R&D on other firms.
We find that subsidising R&D directly is the best policy for promoting domestic innovation. It is also
effective in generating spillovers of productivity from abroad, though subsidising export proves
slightly more effective in that respect. By directing the subsidies to export of high-tech capital, we
would obtain a fair increase in domestic innovation, as well. This policy turns out to outperform the
direct R&D support in terms of welfare gains, and our study shows that knowledge spillovers from
abroad constitute an empirically significant case for strategic export promotion. Direct export
subsidies are, however, likely to run counter with international competition rules. In practice,
innovation policies that succeed in promoting export of high-tech investments goods as an indirect
effect are good substitutes for direct export subsidies.
23
References
Abramovitz, M. (1986): Catching Up, Forging Ahead and Falling Behind, Journal of Economic
History 46 (2), 385-406. Aghion, P. and P. Howitt (1992): A model of growth through creative destruction, Econometrica
60(2), 323-351. Alvarez, R. and R. Lopez (2006): Is Exporting a Source of Productivity Spillovers, Working paper 2006/012, Center for Applied Economics and Policy Research, Indiana. Alvarez-Pelaez, J. M. and C. Groth (2005): Too little or too much R&D?, European Economic Review 49, 437-456. Andreassen L. and G. H. Bjertnæs (2006): Tallfesting av faktoretterspørsel i MSG6 (Quantifying factor input demand in the MSG6 model), Documents 2006/7, Statistics Norway. d’Aspremont, C. and A. Jacquemin (1988): Cooperative and Noncooperative R&D in Duopoly with Spillovers, American Economic Review 78 (5), 1133-37. Balsvik (2006): Is mobility of labour a channel for spillovers from multinationals to local domestic firms?, Discussion paper no. 25/2006, Department of Economics, NHH, Bergen. Basu, S. (1996): Procyclical Productivity: Increasing Returns to Cyclical Utilization? Quarterly
Journal of Economics 111, 709-751. Bernard, A. B. and J. B. Jensen. (1999): “Exceptional Exporter Performance: Cause, Effect, or Both?” Journal of International. Economics 47 (1), 1–25. Bernard, A. B. and J. B. Jensen (2004): Why some firms export, The Review of Economics and
Statistics, 86/2, 561-569. Braconier, H., K. Ekholm and K. H. M. Knarvik (2001): Does FDI work as a channel for R&D spillovers? Weltwirtschaftliches Archiv 137 (4), 644-665. Bye, B., T.R. Heggedal, T. Fæhn and B. Strøm (2006): A CGE model of induced technological change: A detailed model description, Documents 2006/11, Statistics Norway. http://www.ssb.no/emner/10/03/doc_200611/doc_200611.pdf Bye, B., T. Fæhn, and T.R. Heggedal, (2007): Welfare and growth impacts of innovation policies in a small, open economy: an applied general equilibrium study, Discussion paper 510, Statistics Norway. Clerides, S. K. S. Lach and J. R. Tybout (1998): Is learning by exporting important? Micro-dynamic evidence from Colombia, Mexico and Marocco, The Quarterly Journal of Economics, 113/3, 903-947. Coe, D.T. and E. Helpman (1995): International R&D spillovers, European Economic Review 39, 859-887. Cohen, W. M. and D. A. Levinthal (1989): Innovation and learning: The two faces of R&D, Economic
Journal 99 (September), 569-596.
24
Crespo, J., C. Martin, and F.J. Velázquez (2002): International technology diffusion through imports and its impact on economic growth, European Economy Group, Working Paper 112/2002, Universidad Compultense de Madrid Damijan, J.P., S. Polanec and J. Prasnikar (2004): Self-selection, export market heterogeneity and productivity improvements: Firm-level evidence form Slovenia, LICOS Discussion Papers 148/2004, Katholieke Universiteit Leuven, Belgium. Diao, X., T. Roe and E. Yeldan (1999): Strategic policies and growth: An applied model of R&D-driven endogenous growth, Journal of Development Economics 60, 343-380. Gerschenkron, A. (1962): Economic Backwardness in Historical Perspective, Belknap Press, Cambridge, MA. Griffith R., S. Redding and J.Van Reenen (2004), Mapping the two faces of R&D: productivity growth in a panel of OECD industries, The Review of Economics and Statistics 86, 883-895. Grünfeld, L.A. (2002): International R&D spillovers and the effect of absorptive capacity, an empirical study, paper no 630, Norwegian Institute of Foreign Affairs, Oslo, Norway. Holmøy, E. and T. Hægeland (1997): Aggregate Productivity Effects of Technology Shocks in a Model of Heterogeneous Firms; the Importance of Equilibrium Adjustments; Discussion Papers 198, Statistics Norway. Jones, C. I. (1995): R&D based models of economic growth, Journal of Political Economy 193, 759-84. Jones, C. I. (1999): Growth: With or Without Scale Effects, The American Economic Review 89, 139-144. Jones, C. I. and J.C. Williams (2000): Too Much of a Good Thing? The Economics of Investment in R&D, Journal of Economic Growth 5, 65-85. Keller, W. (2002): Geographic Localization of International Technology Diffusion, American
Economic Review 92, 120–42. Keller, W. (2004): International Technology Diffusion, Journal of Economic Literature XLII, 752-782. Karpaty P., and L. Lundberg (2004): Foreign Direct Investment and Productivity spillovers in Swedish Manufacturing., WP 2/2004, Örebro University, Department of Economics. Klette, T.J. (1999): Market Power, scale economies and productivity: Estimates from a panel of establishment data. Journal of Industrial Economics 47, 451-476. Leahy, D. and J.P. Neary (1999): R&D spillovers and the case for industrial policy in an open economy, Oxford Economic Papers 51, 40-59. Lin, H. C. and B. Russo (2002): Growth Effects of Capital Income Taxes: How much does Endogenous Innovation Matter? Journal of Public Economic Theory 4, 613-640.
25
Lucas, R. (1988): On the Mechanisms of Development Planning, Journal of Monetary Economics 22
(1), 3-42. Norrbin, S. C. (1993): The Relationship Between Price and Marginal Cost in U.S. industry: A Contradiction, Journal of Political Economy 101, 1149-1164 Norwegian Ministry of Finance (2004): Perspektivmeldingen 2004 – utfordringer og valgmuligheter for norsk økonomi (Perspectives 2004 - challenges and options for the Norwegian economy), St.meld. no. 8. Pottelsberghe, B. van and F. Lichtenberg (2001): Does Foreign Direct Investment Transfer Technology Across Borders?," The Review of Economics and Statistics, 83(3), 490-497. Romer, P. M. (1986): Increasing Returns and Long-Run Growth, Journal of Political Economy 94 (5), 1002-37. Romer, P. (1990): Endogenous Technological Change, Journal of Political Economy 94, 1002-1037. Russo, B. (2004): A cost-benefit analysis of R&D tax incentives, Canadian Journal of Economics 37, 313-335. Sen, P. and S.J. Turnovsky (1989): Deterioration of the terms of trade and capital accumulation: a re-examination of the Laursen-Metzler effect, Journal of International Economics 26, 251-270.
Steger, T. M. (2005): Welfare implications of non-scale R&D-based growth models, Scandinavian Journal of Economics 107(4), 737-757.
26
Appendix A. Production activities
Other Products and Services
Manufacture of Metals
Polluting Transport Services
Non Polluting Transport Services
Research and development (R&D)
Transport Oils
Heating Fuels
High-tech Capital
Other Ordinary Machinery
Building of Ships, Oil Drilling Rigs, Oil Production Platforms etc.
Construction, excl. of Oil Well Drilling
Ocean Transport - Foreign, Services in Oil and Gas Exploration
Crude Oil
Natural Gas
Pipeline Transport of Oil and Gas
Production of Electricity
Wholesale and Retail Trade
Government Input Activities
27
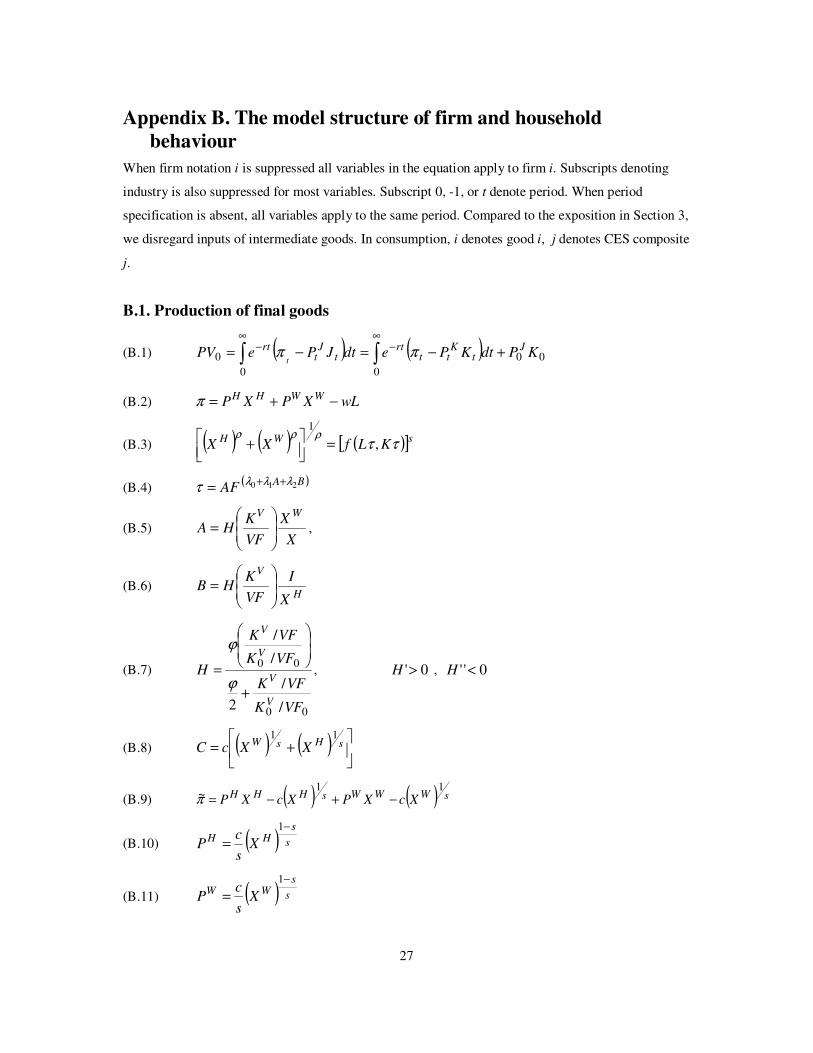
Appendix B. The model structure of firm and household
behaviour
When firm notation i is suppressed all variables in the equation apply to firm i. Subscripts denoting
industry is also suppressed for most variables. Subscript 0, -1, or t denote period. When period
specification is absent, all variables apply to the same period. Compared to the exposition in Section 3,
we disregard inputs of intermediate goods. In consumption, i denotes good i, j denotes CES composite
j.
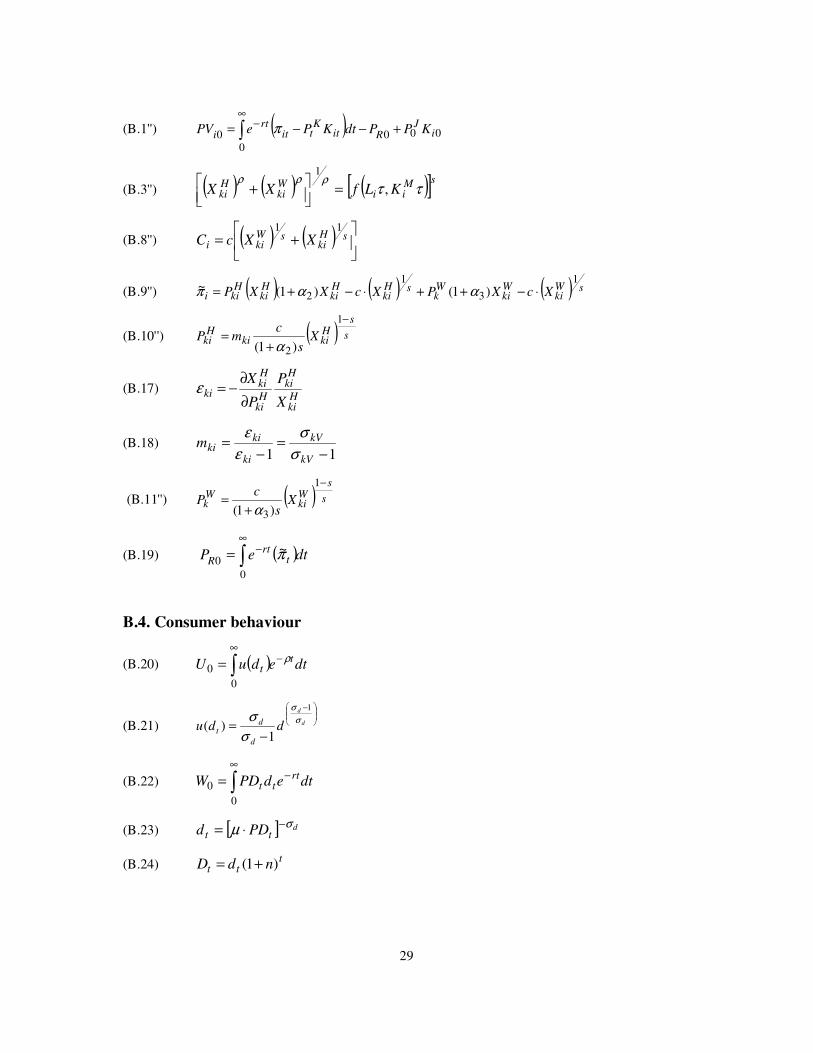
B.1. Production of final goods
(B.1) ( ) ( ) 00
00
0 KPdtKPedtJPePVJ
tK
ttrt
tJ
trt
t+−=−= ∫∫
∞−
∞− ππ
(B.2) wLXPXPWWHH −+=π
(B.3) ( ) ( ) ( )[ ]sWHKLfXX ττ
ρρρ,
1
=
+
(B.4) ( )BAAF 210 λλλτ ++=
(B.5) X
X
VF
KHA
WV
= ,
(B.6) H
V
X
I
VF
KHB
=
(B.7)
00
00
/
/
2
/
/
VFK
VFK
VFK
VFK
H
V
V
V
V
+
=ϕ
ϕ
, 0'>H , 0'' <H
(B.8) ( ) ( )
+= sHsW
XXcC11
(B.9) ( ) ( ) sWWWsHHH XcXPXcXP11
~ −+−=π
(B.10) ( ) s
sHH
Xs
cP
−
=1
(B.11) ( ) s
sWW
Xs
cP
−
=1
28
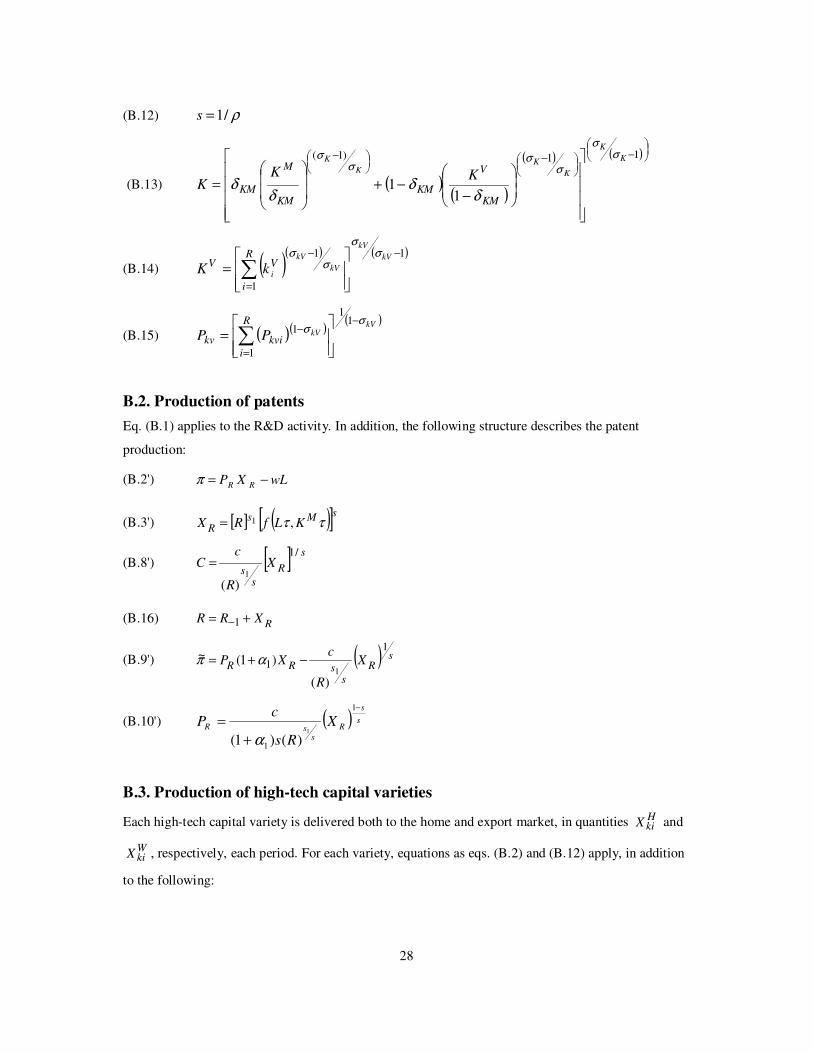
(B.12) ρ/1=s
(B.13) ( )( )
( ) ( )
−
−
−
−−+
=
11)1(
11
K
K
K
KK
K
KM
V
KMKM
M
KM
KKK
σσ
σσ
σσ
δδ
δδ
(B.14) ( )( ) ( )1
1
1 −
=
−
= ∑
kV
kV
kV
kV
i
R
i
VVkK
σσ
σσ
(B.15) ( )( )( )kV
kV
R
i
kvikv PPσ
σ−
=
−
= ∑
11
1
1
B.2. Production of patents
Eq. (B.1) applies to the R&D activity. In addition, the following structure describes the patent
production:
(B.2') wLXP RR −=π
(B.3') [ ] ( )[ ]sMsR KLfRX ττ ,1=
(B.8') [ ] s
R
ss
X
R
cC
/1
1
)(
=
(B.16) RXRR += −1
(B.9') ( ) sR
ssRR X
R
cXP
1
11
)(
)1(~ −+= απ
(B.10') ( ) s
s
R
ssR X
Rs
cP
−
+
=1
1
1
)()1( α
B.3. Production of high-tech capital varieties
Each high-tech capital variety is delivered both to the home and export market, in quantities HkiX and
WkiX , respectively, each period. For each variety, equations as eqs. (B.2) and (B.12) apply, in addition
to the following:
29
(B.1'') ( ) 0000
0 iJ
RitK
titrt
iKPPdtKPePV +−−= ∫
∞− π
(B.3'') ( ) ( ) ( )[ ]sMii
Wki
Hki KLfXX ττ
ρρρ,
1
=
+
(B.8'') ( ) ( )
+= sH
kisW
kii XXcC11
(B.9'') ( ) ( ) ( ) sWki
Wki
Wk
sHki
Hki
Hki
Hkii XcXPXcXXP
1
3
1
2 )1()1(~ ⋅−++⋅−+= ααπ
(B.10'') ( ) s
sHkiki
Hki X
s
cmP
−
+=
1
2 )1( α
(B.17) Hki
Hki
Hki
Hki
kiX
P
P
X
∂
∂−=ε
(B.18) 11 −
=−
=kV
kV
ki
kikim
σ
σ
ε
ε
(B.11'') ( ) s
sWki
Wk X
s
cP
−
+=
1
3 )1( α
(B.19) ( )dteP trt
R ∫∞
−=
00
~π
B.4. Consumer behaviour
(B.20) ( ) dteduUt
tρ−
∞
∫=
0
0
(B.21)
−
−= d
d
ddud
dt
σ
σ
σ
σ1
1)(
(B.22) dtedPDW rttt
−∞
∫=
0
0
(B.23) [ ] dtt PDd
σµ −⋅=
(B.24) ttt ndD )1( +=
30
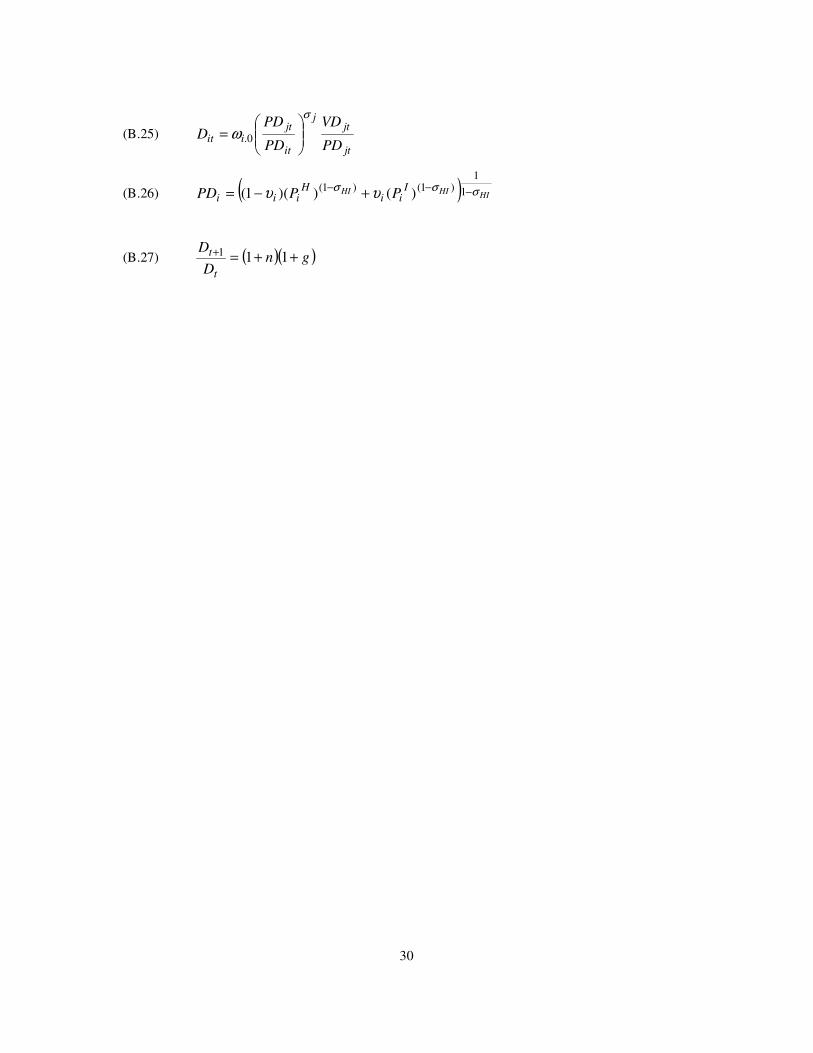
(B.25) jt
jtj
it
jtiit
PD
VD
PD
PDD
σ
ω
= 0.
(B.26) ( ) HIHIHI I
iiH
iii PPPD σσσ υυ −−− +−= 1
1)1()1( )())(1(
(B.27) ( )( )gnD
D
t
t ++=+ 111
31
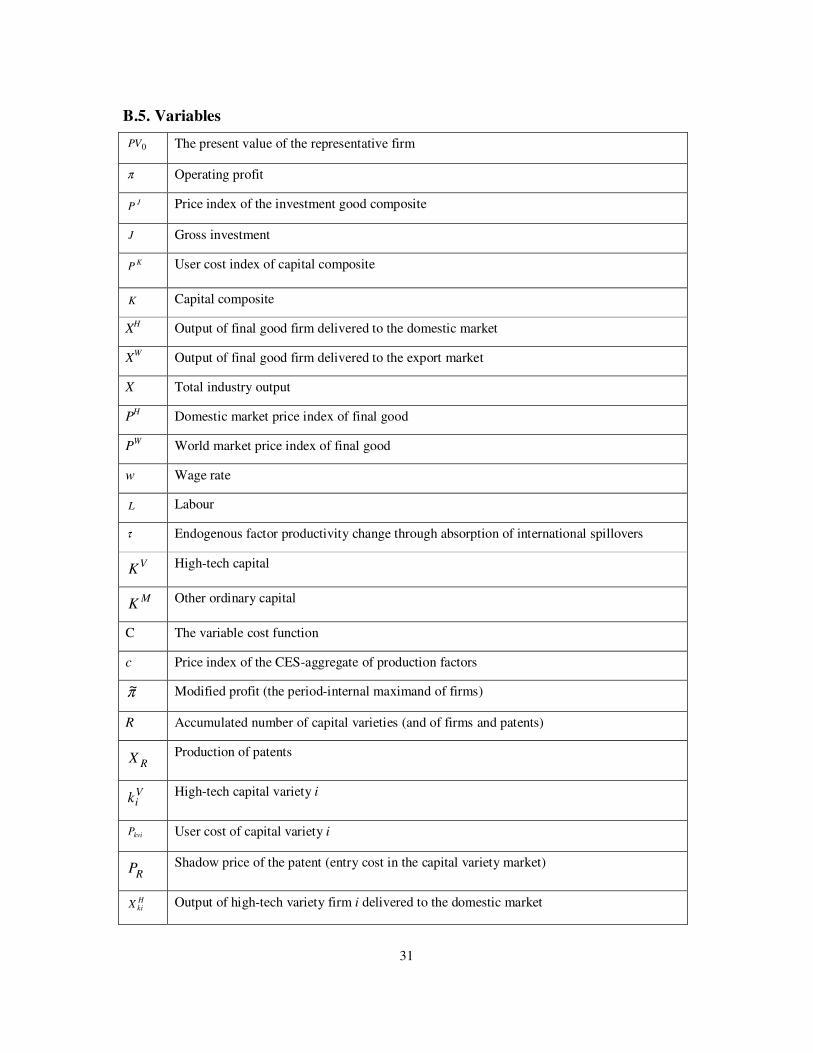
B.5. Variables
0PV The present value of the representative firm
π Operating profit
JP Price index of the investment good composite
J Gross investment
KP User cost index of capital composite
K Capital composite
XH Output of final good firm delivered to the domestic market
XW Output of final good firm delivered to the export market
X Total industry output
PH Domestic market price index of final good
PW World market price index of final good
w Wage rate
L Labour
τ Endogenous factor productivity change through absorption of international spillovers
VK High-tech capital
MK Other ordinary capital
C The variable cost function
c Price index of the CES-aggregate of production factors
π~ Modified profit (the period-internal maximand of firms)
R Accumulated number of capital varieties (and of firms and patents)
RX Production of patents
Vik High-tech capital variety i
kviP User cost of capital variety i
RP Shadow price of the patent (entry cost in the capital variety market)
HkiX Output of high-tech variety firm i delivered to the domestic market
32
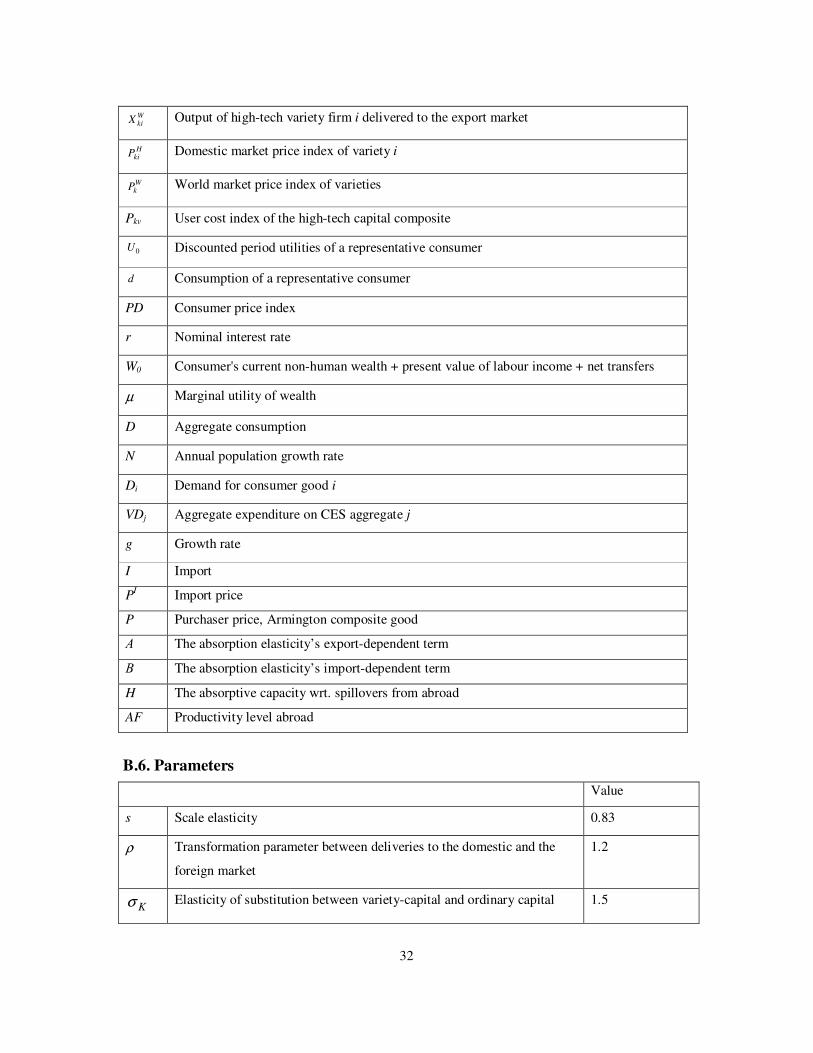
WkiX Output of high-tech variety firm i delivered to the export market
HkiP Domestic market price index of variety i
WkP World market price index of varieties
Pkv User cost index of the high-tech capital composite
0U Discounted period utilities of a representative consumer
d Consumption of a representative consumer
PD Consumer price index
r Nominal interest rate
W0 Consumer's current non-human wealth + present value of labour income + net transfers
µ Marginal utility of wealth
D Aggregate consumption
N Annual population growth rate
Di Demand for consumer good i
VDj Aggregate expenditure on CES aggregate j
g Growth rate
I Import
PI Import price
P Purchaser price, Armington composite good
Α The absorption elasticity’s export-dependent term
Β The absorption elasticity’s import-dependent term
H The absorptive capacity wrt. spillovers from abroad
AF Productivity level abroad
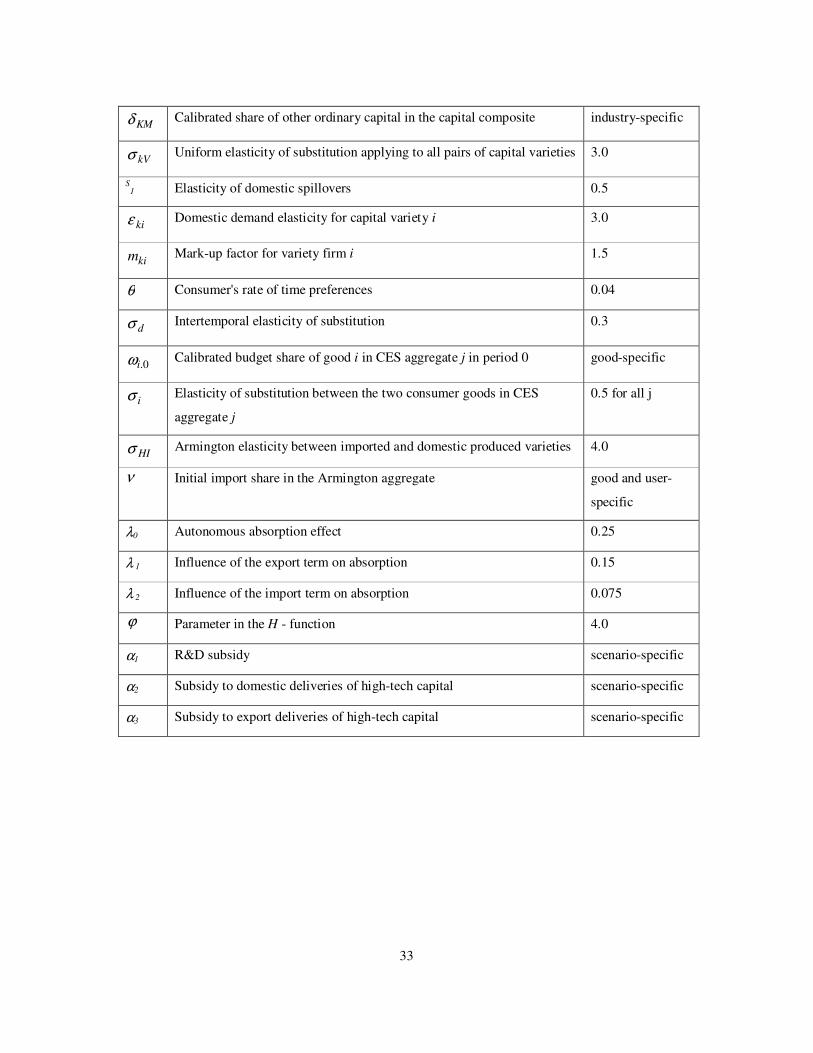
B.6. Parameters
Value
s Scale elasticity 0.83
ρ Transformation parameter between deliveries to the domestic and the
foreign market
1.2
Kσ Elasticity of substitution between variety-capital and ordinary capital 1.5
33
KMδ Calibrated share of other ordinary capital in the capital composite industry-specific
kVσ Uniform elasticity of substitution applying to all pairs of capital varieties 3.0
S1 Elasticity of domestic spillovers 0.5
kiε Domestic demand elasticity for capital variety i 3.0
kim Mark-up factor for variety firm i 1.5
θ Consumer's rate of time preferences 0.04
dσ Intertemporal elasticity of substitution 0.3
0.iω Calibrated budget share of good i in CES aggregate j in period 0 good-specific
iσ Elasticity of substitution between the two consumer goods in CES
aggregate j
0.5 for all j
HIσ Armington elasticity between imported and domestic produced varieties 4.0
ν Initial import share in the Armington aggregate good and user-
specific
λ0 Autonomous absorption effect 0.25
λ 1 Influence of the export term on absorption 0.15
λ 2 Influence of the import term on absorption 0.075
ϕ Parameter in the H - function 4.0
α1 R&D subsidy scenario-specific
α2 Subsidy to domestic deliveries of high-tech capital scenario-specific
α3 Subsidy to export deliveries of high-tech capital scenario-specific
34
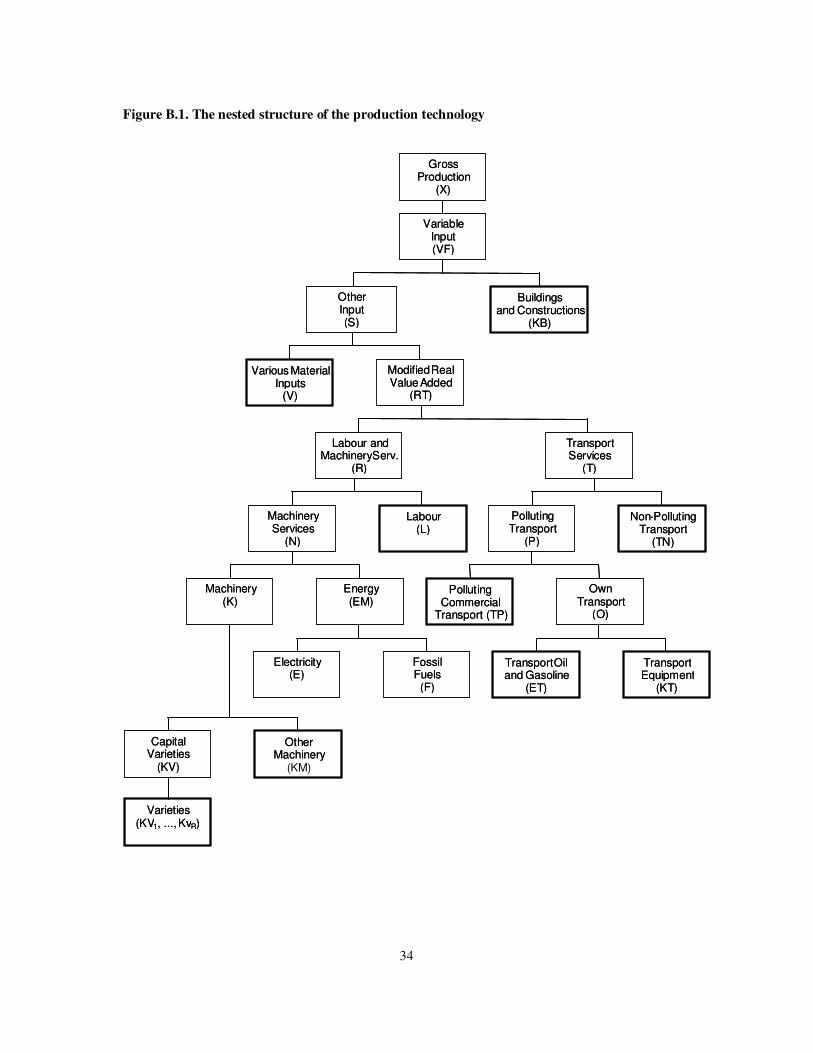
Figure B.1. The nested structure of the production technology
GrossProduction
(X)
VariableInput(VF)
OtherInput(S)
Buildingsand Constructions
(KB)
Various MaterialInputs
(V)
ModifiedReal Value Added
(RT)
Labour and MachineryServ.
(R)
Transport Services
(T)
PollutingTransport
(P)
Non-PollutingTransport
(TN)
MachineryServices
(N)
Labour(L)
PollutingCommercial
Transport (TP)
OwnTransport
(O)
Machinery(K)
Energy(EM)
Electricity(E)
FossilFuels
(F)
Transport Oiland Gasoline
(ET)
TransportEquipment
(KT)
CapitalVarieties
(KV)
OtherMachinery
(KM)
Varieties(KV1, ..., KvR)
GrossProduction
(X)
VariableInput(VF)
OtherInput(S)
Buildingsand Constructions
(KB)
Various MaterialInputs
(V)
ModifiedReal Value Added
(RT)
Labour and MachineryServ.
(R)
Transport Services
(T)
PollutingTransport
(P)
Non-PollutingTransport
(TN)
MachineryServices
(N)
Labour(L)
PollutingCommercial
Transport (TP)
OwnTransport
(O)
Machinery(K)
Energy(EM)
Electricity(E)
FossilFuels
(F)
Transport Oiland Gasoline
(ET)
TransportEquipment
(KT)
CapitalVarieties
(KV)
OtherMachinery
Varieties(KV1, ..., KvR)
35
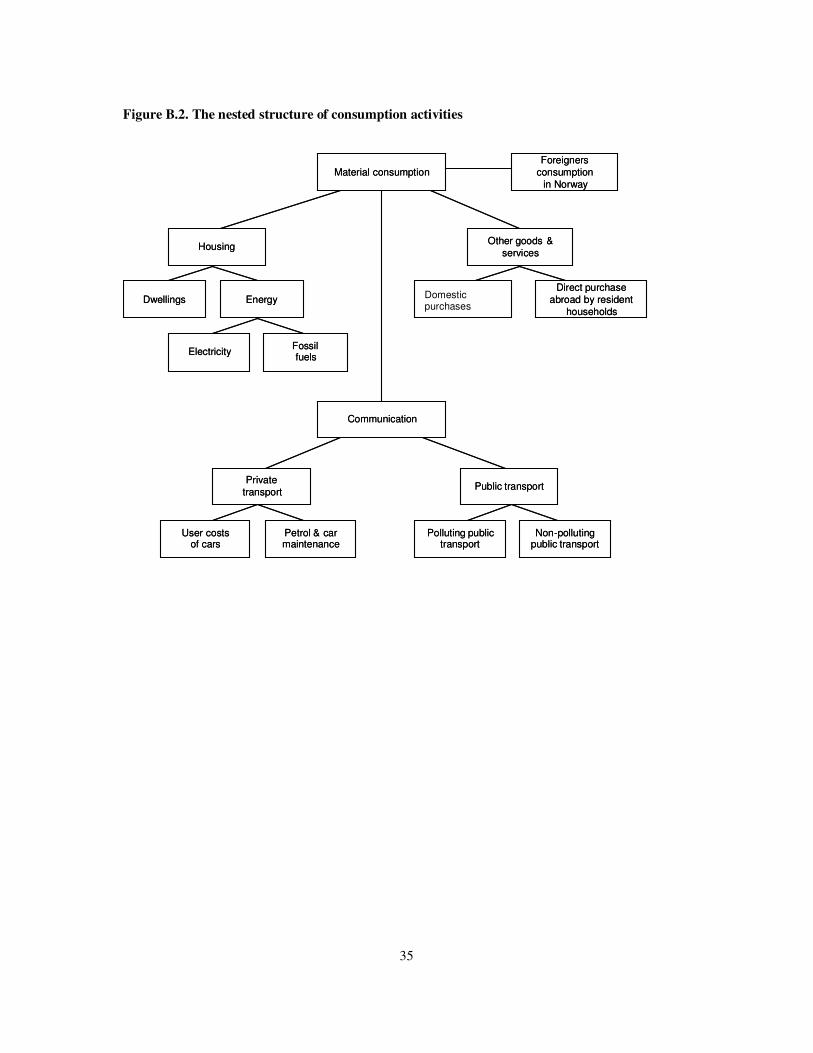
Figure B.2. The nested structure of consumption activities
Material consumption
Communication
Housing
Dwellings Energy
Electricity Fossil fuels
Other goods & services
Direct purchase abroad by resident
households
Private transport
User costs of cars
Petrol & car maintenance
Public transport
Polluting public transport
Non - polluting public transport
Foreigners consumption
in Norway Material consumption
Communication
Housing
Dwellings Energy
Electricity Fossil fuels
Other goods & services
Domestic purchases
Direct purchase abroad by resident
households
Private transport
User costs of cars
Petrol & car maintenance
Public transport
Polluting public transport
Non - polluting public transport
Foreigners consumption
in Norway
36
Appendix C. Calibration and parameters
The model is calibrated to the 2002 Norwegian National Accounts. The elasticities of substitution in
the production technology range from 0.15 at the upper part of the nested tree to 0.5 further down in
the nested tree structure, see appendix B, figure B.1, and are in the range of empirical findings
(Andreassen and Bjertnæs, 2006). We have less empirical foundation for the substitution possibilities
within the composite of high-tech capital and ordinary machinery capital. We assume a relatively high
substitution elasticity of 1.5, while the elasticity between the different capital varieties is expected to
be even higher and set to 3.0, giving a mark-up factor of 1.5 for the domestic price of capital varieties.9
The elasticities of scale are equal to 0.83 in all industries and fit econometric findings of moderate
decreasing returns to scale in Norwegian firms (Klette, 1999). The scale elasticity is at the lower end
of the estimates by Klette (1999), but is chosen in order to avoid unrealistic industrial specialisation
patterns.10 This implies that the elasticities of transformation between domestic and foreign deliveries
are equal to 4.9. The elasticities of substitution between domestic products and imported goods are
assumed equal to 4. The elasticity of scale related to previous knowledge is equal to 0.5, in order to
ensure decreasing spillover effects of the knowledge base, supported by both theoretical and empirical
findings (see Jones, 1995; 1999; Leahy and Neary, 1999).
In the scenarios, the exogenous growth factors are assumed to grow at constant rates. In most cases,
rates are set in accordance with the average annual growth estimates in the baseline scenario of
Norwegian Ministry of Finance (2004) that reports the governmental economic perspectives until
2050. The population growth is set to 0.4 per cent annually, in accordance with the expectations in
Norwegian Ministry of Finance (2004). Exogenous activities, like public consumption and output, are
also set in accordance with the governmental perspectives. The exogenous levels of offshore
investments and oil and gas exports result from a smoothing of their expected present values in the
governmental perspectives. The smoothing is made to account for the economic significance of the
Norwegian oil and gas resources without introducing another source of dynamics into the growth path.
9 This is in line with the Jones and Williams (2000) computations that exclude creative destruction (similarly to our model). Numerical specifications of Romer's Cobb Douglas production functions, as in Diao et al. (1999), Lin and Russo (2002), and Steger (2005), result in far larger mark-ups. Mark-ups of 1.5 are nevertheless in the upper bound of econometric estimates (Norrbin, 1993; Basu, 1996). Our main motivation for staying in the upper bound area is that we model industrial R&D as outsourced to a separate high-tech industry. Thus, R&D costs are ascribed to this industry, whereas the marginal costs of final goods industries exclude this part of the costs. This deviates from typical regressions of mark-ups, where marginal costs include all observed costs, including industrial R&D costs. 10 Because ρ=1/s, a larger elasticity of scale will imply a larger elasticity of transformation between domestic and foreign deliveries, 1/(1-ρ). If the elasticity of scale is close to 1 (constant returns to scale), the elasticity of transformation will be very high, implying practically no dispersion between domestic and foreign deliveries.
37
World market prices are assumed to increase 1.4 per cent annually. This is in the lower range of
exogenous price growth estimates in the governmental perspectives, and is chosen so that exogenous
inflationary impulses are more in line with internal impulses, which are dampened by the
consumption-smoothing features of the model. This provides us with endogenous developments of the
delivery ratios between the export and domestic markets that are more in line with those of the
governmental perspectives. The international nominal interest rate is 4 per cent. All policy variables
are constant in real terms at their 2002 levels.
In the governmental perspectives, total factor productivity growth is entirely exogenous and valued at,
on average, 1 per cent annually. Our model distinguishes between exogenous and endogenous
components. In line with empirical findings; see e.g. Coe and Helpman (1995) and Keller (2004), we
calibrate 5 per cent of the long-run domestic growth to stem from domestic innovation.11 The long run
in this context is 50-70 years from now, where the reference path obtains a stable growth period. The
assumed 5 per cent growth resulting from domestic innovation in this period forms a basis for
calibrating the 2002 level of accumulated knowledge, R0, which together with the remaining
parameters of the model determines the productivity growth from domestic knowledge accumulation.
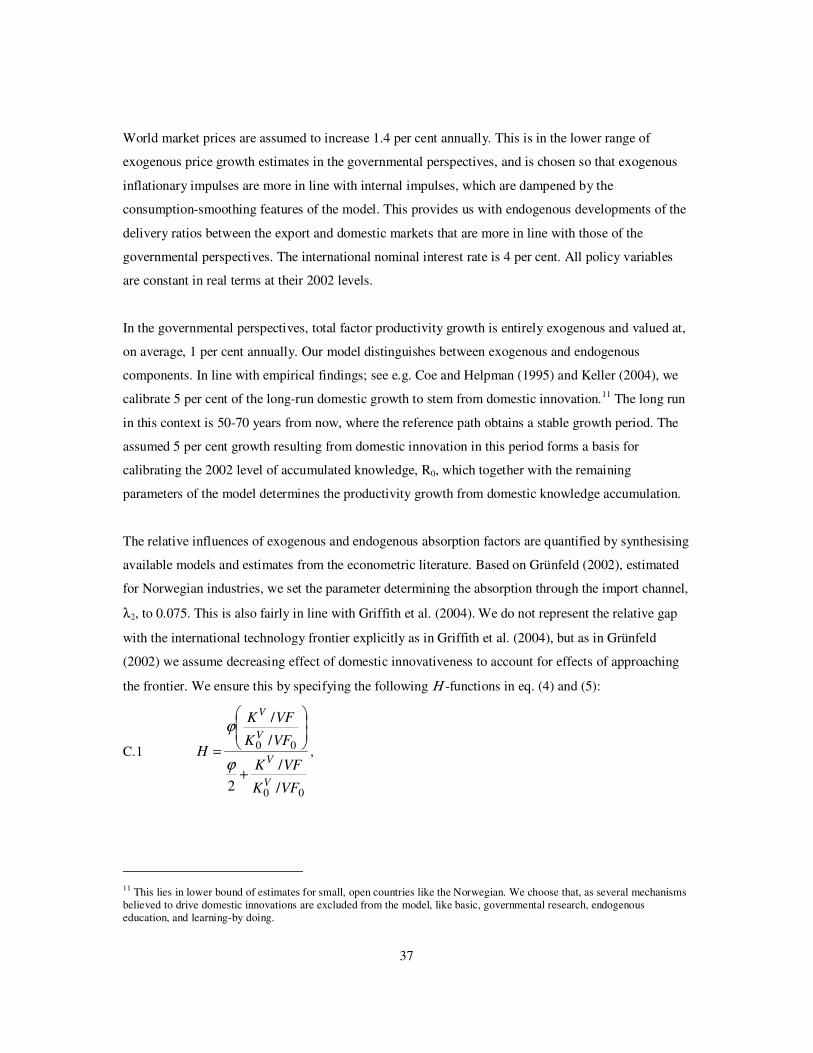
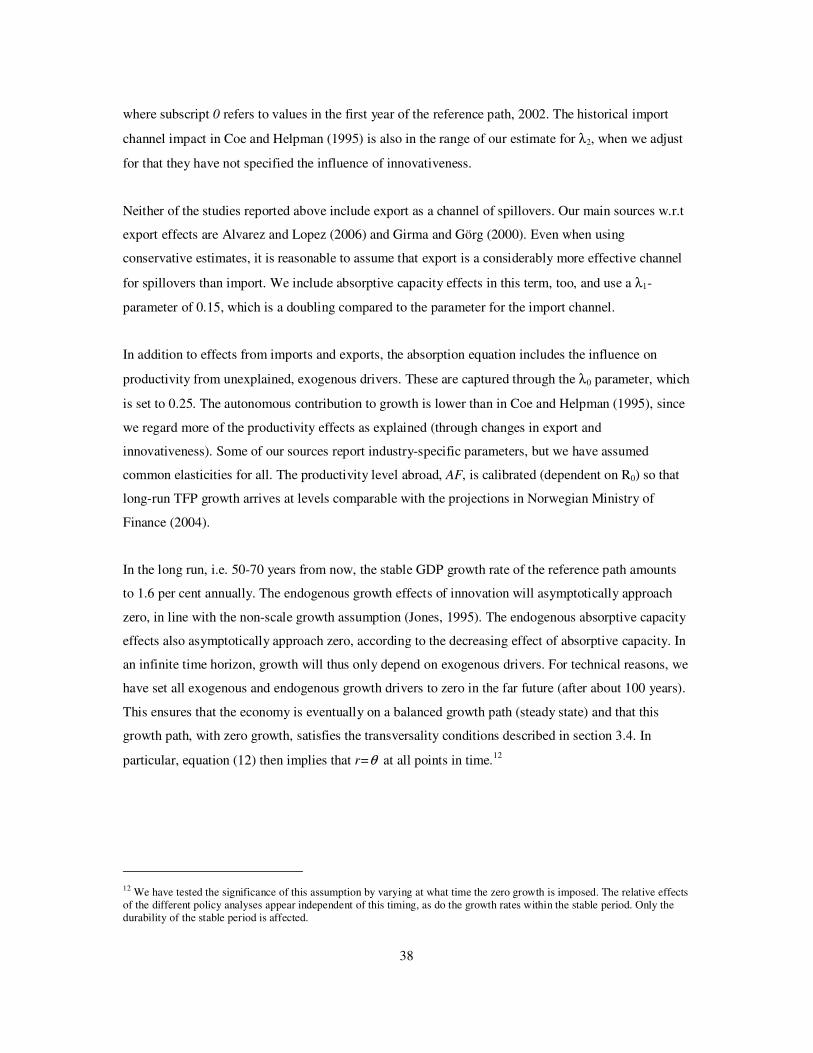
The relative influences of exogenous and endogenous absorption factors are quantified by synthesising
available models and estimates from the econometric literature. Based on Grünfeld (2002), estimated
for Norwegian industries, we set the parameter determining the absorption through the import channel,
λ2, to 0.075. This is also fairly in line with Griffith et al. (2004). We do not represent the relative gap
with the international technology frontier explicitly as in Griffith et al. (2004), but as in Grünfeld
(2002) we assume decreasing effect of domestic innovativeness to account for effects of approaching
the frontier. We ensure this by specifying the following Η -functions in eq. (4) and (5):
C.1
00
00
/
/
2
/
/
VFK
VFK
VFK
VFK
H
V
V
V
V
+
=ϕ
ϕ
,
11 This lies in lower bound of estimates for small, open countries like the Norwegian. We choose that, as several mechanisms believed to drive domestic innovations are excluded from the model, like basic, governmental research, endogenous education, and learning-by doing.
38
where subscript 0 refers to values in the first year of the reference path, 2002. The historical import
channel impact in Coe and Helpman (1995) is also in the range of our estimate for λ2, when we adjust
for that they have not specified the influence of innovativeness.
Neither of the studies reported above include export as a channel of spillovers. Our main sources w.r.t
export effects are Alvarez and Lopez (2006) and Girma and Görg (2000). Even when using
conservative estimates, it is reasonable to assume that export is a considerably more effective channel
for spillovers than import. We include absorptive capacity effects in this term, too, and use a λ1-
parameter of 0.15, which is a doubling compared to the parameter for the import channel.
In addition to effects from imports and exports, the absorption equation includes the influence on
productivity from unexplained, exogenous drivers. These are captured through the λ0 parameter, which
is set to 0.25. The autonomous contribution to growth is lower than in Coe and Helpman (1995), since
we regard more of the productivity effects as explained (through changes in export and
innovativeness). Some of our sources report industry-specific parameters, but we have assumed
common elasticities for all. The productivity level abroad, AF, is calibrated (dependent on R0) so that
long-run TFP growth arrives at levels comparable with the projections in Norwegian Ministry of
Finance (2004).
In the long run, i.e. 50-70 years from now, the stable GDP growth rate of the reference path amounts
to 1.6 per cent annually. The endogenous growth effects of innovation will asymptotically approach
zero, in line with the non-scale growth assumption (Jones, 1995). The endogenous absorptive capacity
effects also asymptotically approach zero, according to the decreasing effect of absorptive capacity. In
an infinite time horizon, growth will thus only depend on exogenous drivers. For technical reasons, we
have set all exogenous and endogenous growth drivers to zero in the far future (after about 100 years).
This ensures that the economy is eventually on a balanced growth path (steady state) and that this
growth path, with zero growth, satisfies the transversality conditions described in section 3.4. In
particular, equation (12) then implies that r=θ at all points in time.12
12 We have tested the significance of this assumption by varying at what time the zero growth is imposed. The relative effects of the different policy analyses appear independent of this timing, as do the growth rates within the stable period. Only the durability of the stable period is affected.