the stpi scheme and competitiveness of india’s it …fgks.in/images/pdf/papers/99.pdf · the stpi...
TRANSCRIPT
1
The STPI scheme and Competitiveness of India’s IT industry: Historical Analysis and a Future Outlook
Aradhna Aggarwal
Abstract
This study examines the contribution of the STPI scheme to export oriented growth of the IT industry from a historical perspective; evaluates the changing role of the factors driving export competitiveness of India vis-a-vis its competitors from an international perspective; and discusses the need to strengthen the STP scheme for facing the challenges in global IT markets. While analyzing the competitiveness of the industry, it uses the scores assigned to various factors driving competitiveness of IT industry in A.T.Kearney Reports of 2005 and 2009. Our findings suggest that the rest of the world is inching closer to India. India is greatly benefited by the availability of large pools of experienced and skilled labour It has however been losing in terms of most other factors, including the much hyped English language proficiency. The study describes how most players in the IT service industry have been formulating national strategies with the objective of promoting the export of IT services. Efforts are being made to reinforce both demand and supply forces through focused strategies, targeting, promotion of skills, and above all, liberal fiscal incentives. The study argues that the government needs to revisits its vision on the STPI scheme. Differentiated support policies are needed to strengthen the STPs. There is a strong need for further reinforcement of STPI’s competencies.
I. Introduction
Information technology software and services (IT/ITES) industry has emerged as one of the most
dynamic sectors in India’s economic boom, with an annual average growth rate of over 26 per
cent during the past 8 years, from 2000 to 2008. The industry has grown from a mere US $ 150
million in 1991-92 to a staggering 64 billion by 2007-08. It accounted for about 5.5 per cent of
India’s GDP during 2007-08 up from 1 percent in 1999 and is expected to have provided
employment to over 2 million IT professionals by March, 2008 (NASSCOM website). The
growth of industry is export driven. In 2007-08, the total software and hardware exports
increased to $40.3 bn, which was over 63% of the total revenue generated in the sector. IT-ITES
exports made up 44.7 % of India's total service export revenue in 2007-08, up from 4.9 % in
1997.
2
It is remarkable that a knowledge intensive industry of an emerging economy achieves such
phenomenal success in export markets. This miracle growth triggered a stream of studies
identifying the factors that have contributed to the success of the industry. Most studies attribute
it to the easy availability of skilled and English speaking workforce at a much lower rate, and top
quality software product (Schware, 1992; Sen,1995; Heeks 1996; Arora et.al, 2002;Joseph 2006;
Kumar and Joseph, 2005; Mathur 2006, Balakrishnan, 2006). A few studies (Heek 1996, Kumar
and Joseph 2005, Mathur 2006) recognize that the emergence of a strong Indian IT industry has
been facilitated by concerted efforts on the part of the Government, particularly since the 1980s.
Surprisingly, the setting up of special development zones, in particular, Software Parks (STPs)
which has been one of the most important components of the government policy has received
scant attention in the literature. This scheme introduced in 1991 has played an important and
dominant role in the emergence and development of Indian software industry. Today STPs have
over 9700 units registered with them which account for 97 percent of the total exports in this
sector. However, very little is known about the role of the scheme in IT export promotion in the
country.
The present study focuses on the contribution of the STPI scheme to export oriented growth of
the IT industry; evaluates the changing role of the factors driving export competitiveness of India
vis-a-vis its competitors; and discusses the need to strengthen the STP scheme for facing the
challenges in global IT markets.
2. The STPI scheme
The “Software Technology Park (STP)” is an export oriented scheme for the development and
export of computer software. Software Technology Park is a duty free customs bonded area in
which a unit imports free of duty all types of goods, including capital goods required by it and
executes a bond with the Assistant Commissioner of Customs binding itself to fulfill export
obligations. The Government of India established and registered STPI as an Autonomous Society
under the Department of Electronics (Now Ministry of Information Technology) on 5th June
1991 with an objective to implement the STP Scheme. It was assigned the responsibility of
3
• setting up and managing infrastructural facilities and providing other services, including
professional training for STPI units;
• providing them single window clearance mechanism; and
• offering tax incentives.
It has set up 19 STP centres across the country, which are located in: Bangalore, Bhubaneswar,
Chennai, Coimbatore, Gandhinagar, Guwahati, Hyderabad, Indore, Jaipur, Kolkata, Manipal,
Mohali, Navi Mumbai, Mysore, Noida, Pune, Srinagar, Thiruvananthapuram and Vizag. STPs
can be set up (just as SEZs), by the Central Government, State Government, Public or Private
Sector Undertakings or any combination thereof. An STP may be an individual unit by itself or it
may be an area designated as STP Complex by the Ministry of Information Technology.
2.1 A theoretical model of state intervention in export promotion
The role of STPs can be placed within an underlying theoretical model of growth of the ‘high
tech’ industry in a developing country. In general, the performance of an industry can be related
to demand and supply factors. On the demand side, market size is an important driver of growth.
Since the domestic market of high tech products is small in a developing country, growth
stimulus may come from exploiting export opportunities. Export markets are fiercely competitive
and therefore the country needs to build a significant competitive advantage over its rivals on the
supply side. Even while the basic conditions for exporting are present within the country,
institutional constraints such as the lack of commercial infrastructure, unfavourable business
environment, and rigidities in financial markets can create supply side bottlenecks impeding
growth of the industry. The active engagement of the state is therefore indispensable in initiating
and promoting industrial development in these countries. Figure 1 depicts a model of the
government’s role in promoting export.
4
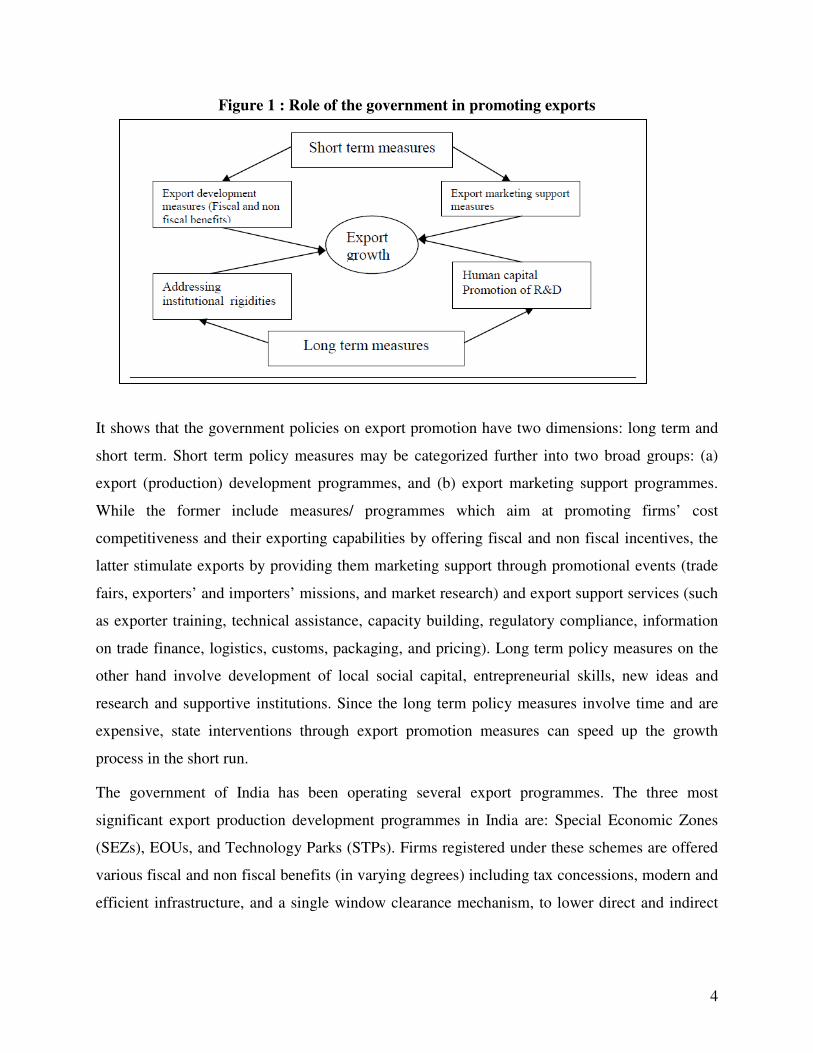
Figure 1 : Role of the government in promoting exports
It shows that the government policies on export promotion have two dimensions: long term and
short term. Short term policy measures may be categorized further into two broad groups: (a)
export (production) development programmes, and (b) export marketing support programmes.
While the former include measures/ programmes which aim at promoting firms’ cost
competitiveness and their exporting capabilities by offering fiscal and non fiscal incentives, the
latter stimulate exports by providing them marketing support through promotional events (trade
fairs, exporters’ and importers’ missions, and market research) and export support services (such
as exporter training, technical assistance, capacity building, regulatory compliance, information
on trade finance, logistics, customs, packaging, and pricing). Long term policy measures on the
other hand involve development of local social capital, entrepreneurial skills, new ideas and
research and supportive institutions. Since the long term policy measures involve time and are
expensive, state interventions through export promotion measures can speed up the growth
process in the short run.
The government of India has been operating several export programmes. The three most
significant export production development programmes in India are: Special Economic Zones
(SEZs), EOUs, and Technology Parks (STPs). Firms registered under these schemes are offered
various fiscal and non fiscal benefits (in varying degrees) including tax concessions, modern and
efficient infrastructure, and a single window clearance mechanism, to lower direct and indirect
5
costs of production. While SEZs and EOU schemes cater to a wide range of sectors, STP focuses
only on the IT sector.
In addition, STPI is also entrusted with the responsibility of providing market support to the
industry. As such, it acts as an Export Promotion Council (EPC) for the computer software and
hardware sectors. In this regard, it complements the functions of the ‘Electronics and Software
Export Promotion Council’.
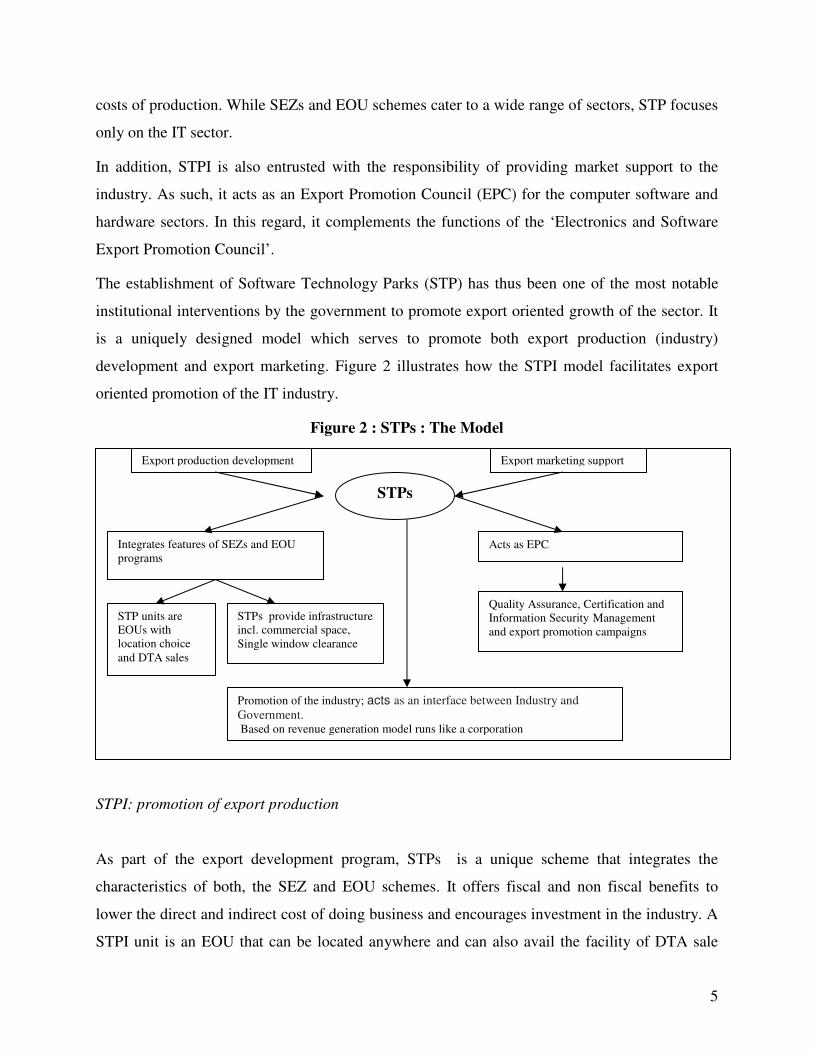
The establishment of Software Technology Parks (STP) has thus been one of the most notable
institutional interventions by the government to promote export oriented growth of the sector. It
is a uniquely designed model which serves to promote both export production (industry)
development and export marketing. Figure 2 illustrates how the STPI model facilitates export
oriented promotion of the IT industry.
Figure 2 : STPs : The Model
STPI: promotion of export production
As part of the export development program, STPs is a unique scheme that integrates the
characteristics of both, the SEZ and EOU schemes. It offers fiscal and non fiscal benefits to
lower the direct and indirect cost of doing business and encourages investment in the industry. A
STPI unit is an EOU that can be located anywhere and can also avail the facility of DTA sale
Export production development Export marketing support
Acts as EPC Integrates features of SEZs and EOU programs
STPs
STP units are EOUs with location choice and DTA sales
STPs provide infrastructure incl. commercial space, Single window clearance
Quality Assurance, Certification and Information Security Management and export promotion campaigns
Promotion of the industry; acts as an interface between Industry and Government. Based on revenue generation model runs like a corporation
6
upto 50% of the exports, just as EOUs. The Scheme provides benefits & exemptions which are
also applicable to software development units under the general EOU scheme. These include
o 100% foreign equity permission;
o duty free imports, including import of second hand capital goods;
o exemption of local taxes for domestic purchases;
o sale in domestic market upto 50% of export; and
o exemptions from payment of duties on donation of imported computers and computer
peripherals after two years of their import.
STP units are allowed to import telematic infrastructure equipments for creating a central facility
for the export of software without duty payment. The central facility so developed by STP units
for transmission of data / software for export are allowed to be utilised by other STP units and
units in DTA for export of software. Under STP scheme, units are allowed to render consultancy
services for development of software "on site" abroad. Consultancy fee received by such units in
convertible foreign currencies is deemed to be exports for the purposes of fulfillment of export
obligation under the Scheme.
The scheme also incorporates features which are consistent with the SEZ scheme. For instance,
the STP, just as a SEZ, is governed by a nodal agency, ‘Software Technology Parks of India
(STPI)’ which offers single -point contact services to all member units. Powers of approvals and
post approval revisions (such as additional import of Capital Goods, attestation of list of
imported CG, change of location, extension of validity of Letter of Permission, disposal of
obsolete capital goods) in the projects have been delegated to the Directors of STPs. The projects
costing less than or equal to Rs.100 million , not involving any foreign equity participation are
approved by the Jurisdictional Director of STP. He also issues Green cards. The Green Card
enables units to get priority services from all Government Departments/its agencies. It helps
units get priority allotment of telephones, electricity connections etc.
The STPI, just as the SEZ authority, also offers infrastructure facilities including ready to use
built up space, centralized computing facility and high speed data communication facilities.
SoftNet is the data communication network developed and owned by the STPI. To increase the
7
SoftNET's reliability, land lines are avoided. Instead, satellite earth stations and point to
multipoint radio equipments are used. Under softnet, several services are available. For instance,
the SoftPOINT connects software exporters in India to their clients abroad. The service is
available 24 hours a day, and the charges are fixed irrespective of the time and volume of data
transferred by the user. The SoftLINK provides a 24 hour access to the Global Commercial
Internet protocol Networks. STPI has developed relationships with 26 International carrier
companies worldwide. A very attractive feature of the policy is the provision of incubation
infrastructure. Under the incubation scheme, new units are given ready-to-use built-up space
with plug-and-play facilities along with internet connectivity and power backup, enabling them
to commence their operations with minimum gestation period and least upfront costs. The space
is ideally suited for a team size of 15-20 employees at a highly subsidized rent. Generally, it is
located within the premise of STPIs and is cost effective. Several IT majors including WIPRO
were benefited by this scheme in the initial years of their development.
STPs : Export marketing support for the IT industry
The STPI also functions as an export promotion council. To promote software exports, it takes
such initiatives as quality assurance, certification and information security management,
development support for software (R&D) and export promotion campaign. It organizes and
participates in fairs, exhibitions, seminars, and conferences; encourages industry consortia to
enable companies to come together, provides advisory and consultancy services; promotes
entrepreneurship by regularly organizing Entrepreneur Development Programmes; organizes
specialized training in the field of software technology for skill development; and works jointly
with venture capitalists to facilitate financial assistance to IT industries. A number of overseas
marketing and promotional offices have been opened by the STPI. In June 2000, a STP was set
up in Silicon Valley, composed of a Business Support Centre and an India Infotech Centre, with
a view to facilitate software export by small and medium firms to the US.
The STPI, just as export promotion councils, have a Self financing Business Model. A unit is
required to pay 3-years’ advance service charges at the time of signing of the legal agreement on
the basis of the projections made by it in the application, subject to a minimum of Rs. 50,000/- .
8
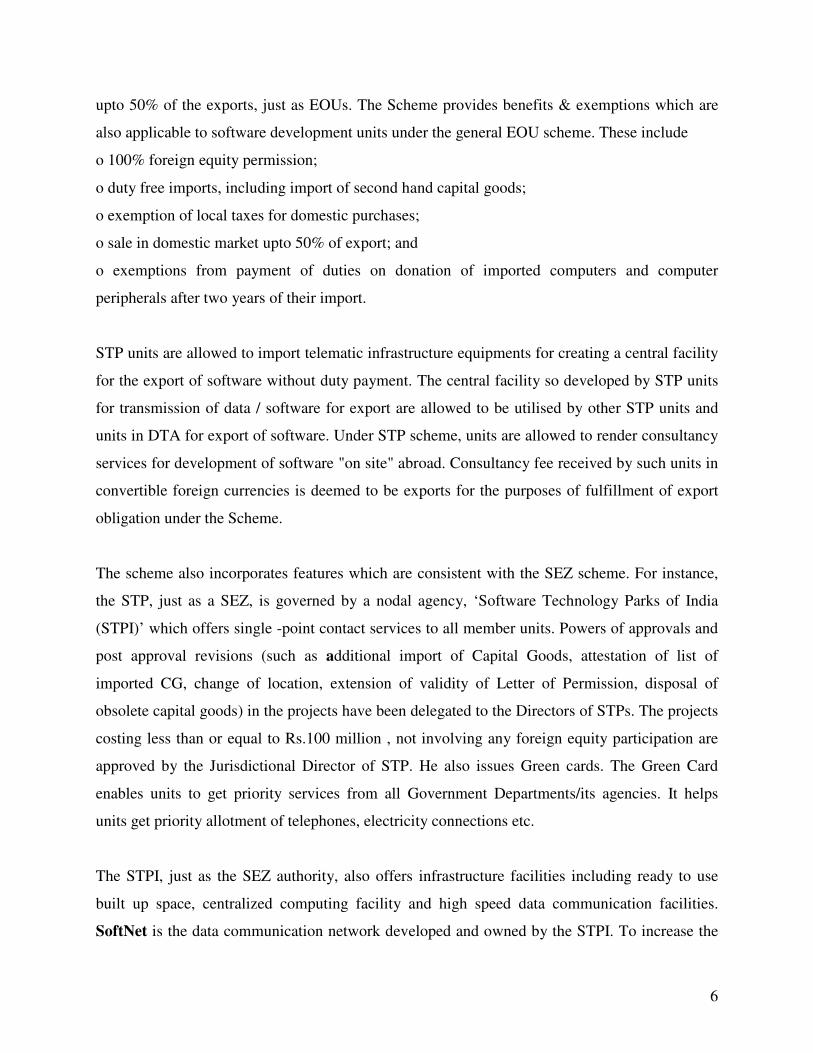
Subsequent charges are payable on annual basis. This model generates income, which is then
used not only for the marketing support as in the case of “EPCs” but also for providing
infrastructure and business development services. The role of STPI is thus more of an
entrepreneurial role of working directly with software companies. Figure 3 presents the income-
expenditure statement of the STPI for the past ten years. It shows that this is a self sustainable
model of administration and works like an enterprise that sets it apart from the general
government administration model ( as in SEZs) or the export promotion council model ( which
focuses only on marketing support).
Figure 3: STPI Financial performance: Rs. Crore
STPI: An industry association
Finally, it also acts as act as an interface between Industry and Government and works to create
and sustain a policy environment conducive to the growth of industry, in particular, of SMEs in
India. It catalyses change by working closely with government on policy issues. Thus, STPs is
an innovative ‘one stop’ model focused towards promoting the industry by providing the
companies with the technical, marketing and administrative support and enabling them to
complete in the world markets.
9
2.2 The STPI scheme: A historical perspective
The software exporting industry emerged in India in 1974 under the highly protected
environment to exploit new global market opportunities that emerged due to technological
developments in the industry in the late 1960s, more specifically in 1969 when IBM decided to
unbundled its mainframe operating system, applications software and hardware by creating open
standards (Dossani 2005). Initially, firms developed their own software. As the 1970s
progressed, hardware and software became more complex making in-house software
development and management more difficult. This led to the outsourcing of system integration
and then to the sourcing of system levels and application products by the US firms. In the early
1970s, American firms looked offshore for cheaper ways to develop software products. This
created the independent software vendor (ISV) industry. The implantation of a technically
sophisticated industry like software into a less developed host country would require entry of
transnational corporations. Countries such as Israel and Ireland realizing the potential of the
industry and the role of TNCs in its development offered lucrative incentives for global software
firms , inducing entry (Giuri et al, 2002).
Indian policy in this period was protectionist and regulatory.” imports of computers were highly
regulated and foreign direct investment regime was being tightened. This had inhibited growth in
the software industry. In 1972, the government of India introduced a “Software export scheme”.
Hardware imports were permitted for the purpose of software development on the condition that
the exporters recovered an export commitment equal to the price of computers imported. Tata
Consultancy Services (TCS), Bombay, was the first company to export software under these
guidelines. TCS, which was set up in 1968, got its first export assignment in 1973-74 after a few
local orders. In 1973, FERA closed the door to product software development in India by TNCs.
Beginning in the 1970, there was a growing shortage of engineers for the fast expanding
computer industry in the US and Europe. Since software development could not come to India,
Indian programmers were sent to developed countries. This provided Indian companies an
opportunity for body shopping. According to an estimate (Mathur 2006), around 75% of export
earnings came from body shopping in the late 1980s.
10
In that scenario, it was the establishment of SEEPZ that gave a head start to the software export
industry. In 1977 the Tatas went into partnership with Burroughs an American hardware
company, to establish a unit –Tata Burrough, in SEEPZ to export software and peripherals due to
relaxed rules in the SEZ. The Company got involved in manufacturing, marketing and exporting
computer systems & peripherals; marketing, installation, maintenance and support of the
equipment in India and rendering of computer consultancy and development services for the
Indian & overseas market. This helped the growth of the industry in Bombay. Of the top 8
exporters 7 were headquartered in Bombay with a 90% market share.
The period witnessed proactive role of the state in facilitating the development and exports of
software products and services in India. A series of initiatives and export promotion policy
measures that contributed to the growth of the sector are well documented in literature ( Dossani
2005, Kumar and Joseph 2005).
These developments notwithstanding, the industry was facing some major problems, especially
in exporting the product. One of the most serious challenges was the evaluation of the software
to be exported. Computer software was prepared on magnetic tape or any other physical media
and was submitted to the custom for valuation. However, it was found difficult to evaluate the
software in the absence of specific technical skills. Furthermore, international communication
facilities were extremely poor and non accessible due to a tightly protected telecommunication
regime. The next and more significant difficulty firms faced was the high cost of the data
communication links needed for software development. The telecommunications infrastructure
India had at the time was inadequate. Foreign corporations were looking to expand their global
production networks to India because the country offered a skilled, English-speaking workforce,
but the corporations could not be accommodated at a reasonable cost. India was factored -2 as
against +8 factored to Ireland.
To address these issues, in 1990, STPs were established by the Department of Communication &
Information Technology through three separate autonomous societies at Pune, Bangalore and
Bhubaneswar, which were merged in June 1991 into a single corporate entity and in quick
succession STPIs at Noida, Gandhi Nagar, Hyderabad and Thiruvananthapuram were

11
established. STPs were equipped with dedicated earth station equipment for providing Data
Communication links to STP units. They thus improved the International Data Communication
facilities exclusively for the Software Export Industry to accelerate the process of growth.
The role of STPI was not limited to providing communication links, it was also to offer a nodal
point for single window services to STP units for approvals, export-import evaluation, and
certification. Following its recommendations, the government tax exempted profits on IT exports
and offered a tax concession on the import of computers under the Export Promotion Capital
Goods scheme.
Commissioning of the STPs thus played an important role in the emergence and development of
the IT industry in the initial phase. It facilitated a structural shift in the industry away from onsite
to offshore facilities and accelerated the growth in software exports.
The STP scheme was highly benefited by a 10-year tax holiday for the units announced by the
government in April 2000 under a policy aimed at encouraging export oriented growth of the
economy. The tax holiday was extended to all export oriented units (EOUs) and units in SEZs, at
the same time under Section 10A and 10B of the IT Act. These benefits are set to expire in
March 2011 for all the units set up under the STPI ( and EOU) schemes. It is generally believed
that the role of STPI has become redundant with deregulation and liberalization of the telecom
sector. It has also been argued that the only benefit the scheme is offering is tax benefits which
should be withdrawn now as the industry has come to maturity. It is therefore important to
analyse the competitiveness of the industry from an international perspective.
3. Factors driving export competitiveness: An international perspective
Currently, India is the most preferred destination in the global IT-outsourcing markets. It
occupies the top ranking in attractiveness indices of various agencies including A.T. Kearney,
Gartner, and Horasis and Going Global Ventures Inc. It is home to six of the world's top eight
outsourcing hubs: Bangalore, Chennai, Pune, Mumbai, Delhi-NCR and Hyderabad.
12
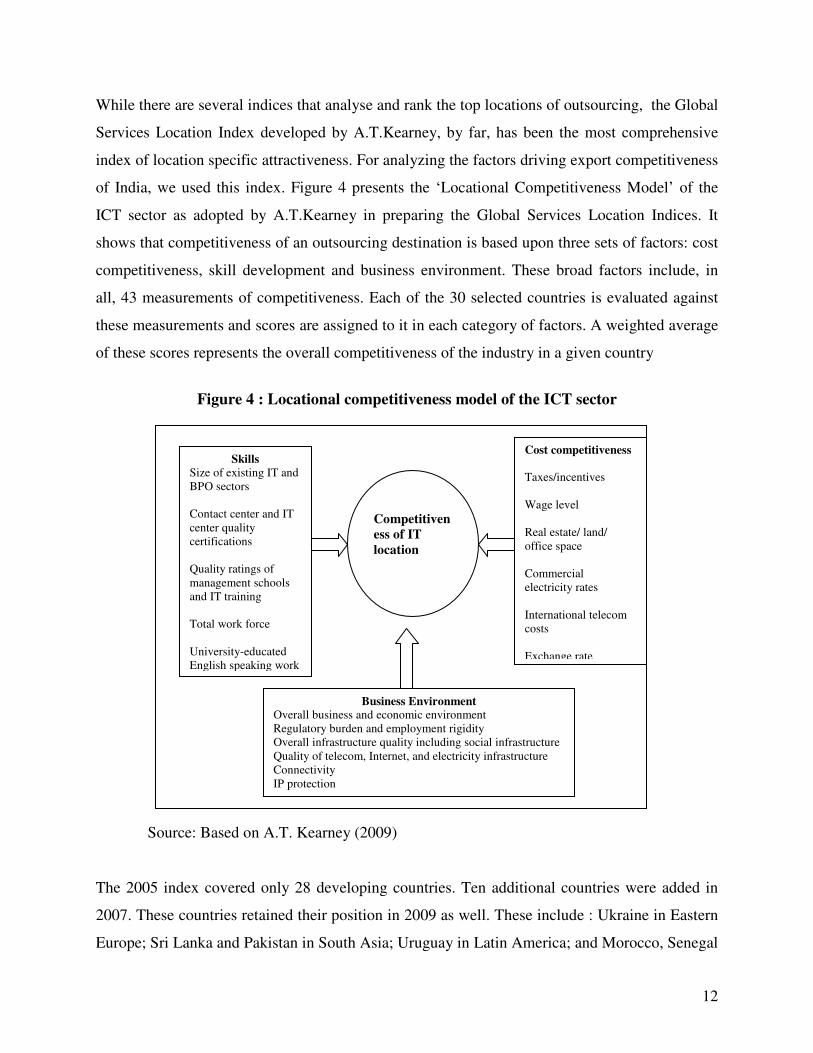
While there are several indices that analyse and rank the top locations of outsourcing, the Global
Services Location Index developed by A.T.Kearney, by far, has been the most comprehensive
index of location specific attractiveness. For analyzing the factors driving export competitiveness
of India, we used this index. Figure 4 presents the ‘Locational Competitiveness Model’ of the
ICT sector as adopted by A.T.Kearney in preparing the Global Services Location Indices. It
shows that competitiveness of an outsourcing destination is based upon three sets of factors: cost
competitiveness, skill development and business environment. These broad factors include, in
all, 43 measurements of competitiveness. Each of the 30 selected countries is evaluated against
these measurements and scores are assigned to it in each category of factors. A weighted average
of these scores represents the overall competitiveness of the industry in a given country
Figure 4 : Locational competitiveness model of the ICT sector
Source: Based on A.T. Kearney (2009)
The 2005 index covered only 28 developing countries. Ten additional countries were added in
2007. These countries retained their position in 2009 as well. These include : Ukraine in Eastern
Europe; Sri Lanka and Pakistan in South Asia; Uruguay in Latin America; and Morocco, Senegal
Skills Size of existing IT and BPO sectors Contact center and IT center quality certifications Quality ratings of management schools and IT training Total work force University-educated English speaking work
Cost competitiveness Taxes/incentives Wage level Real estate/ land/ office space Commercial electricity rates International telecom costs Exchange rate
Competitiven
ess of IT
location
Business Environment Overall business and economic environment Regulatory burden and employment rigidity Overall infrastructure quality including social infrastructure Quality of telecom, Internet, and electricity infrastructure Connectivity IP protection
13
and Mauritius in Africa. Thus a growing number of countries are competing to become viable
outsourcing locations.
We used the index scores to gauge India’s distinctive competencies or strengths relative to its
competitors. For the analysis we created two indices to examine:
• revealed comparative advantage (RCA) of rival countries vis-à-vis India, and
• incremental comparative advantage (ICA) of rival countries vis-à-vis India.
Revealed comparative advantages of India vis-à-vis the rest of the world (RCA): RCA
indices for the selected rival countries in three categories of factors, namely, cost
competitiveness, skill development and business environment essentially measure normalized
scores where normalization is done with respect to India’s scores in the same category of factors
(Figure 5). Thus:
RCA = (Siind / Sij) / (Sind / Sj)
Where Sij is the score of the jth country in the ith category and Siind is the score of India in the
same category. Sj and Sind are the overall attractiveness scores of the jth country and India,
respectively. Thus, three sets of RCA indices are developed for 2009:
• Revealed financial cost advantage (RFCA): These indices reveal comparative advantage
of competing countries in relation to India, in terms of cost competitiveness.
• Revealed labour advantage (RLA): They reveal comparative advantage of competing
countries vis-à-vis India in terms of the availability of skilled labour.
• Revealed business environment advantage (RBEA): They represent competing countries’
advantages in business environment.
14
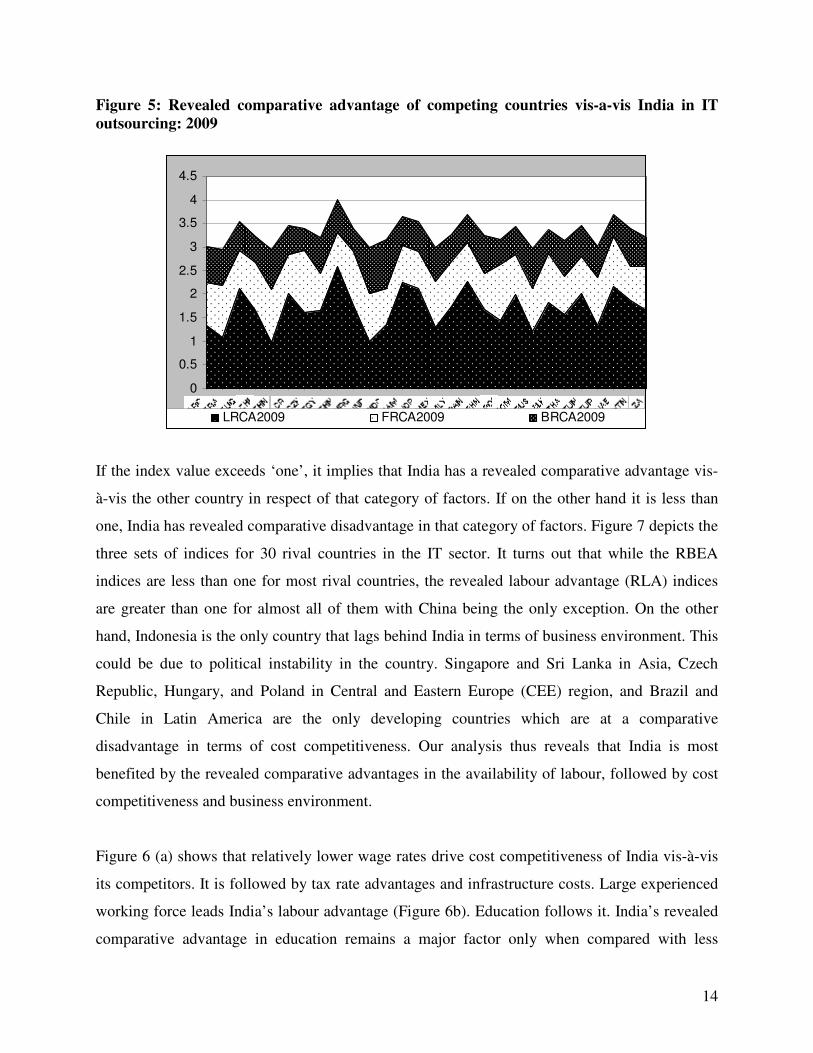
Figure 5: Revealed comparative advantage of competing countries vis-a-vis India in IT
outsourcing: 2009
0
0.5
1
1.5
2
2.5
3
3.5
4
4.5
LRCA2009 FRCA2009 BRCA2009
If the index value exceeds ‘one’, it implies that India has a revealed comparative advantage vis-
à-vis the other country in respect of that category of factors. If on the other hand it is less than
one, India has revealed comparative disadvantage in that category of factors. Figure 7 depicts the
three sets of indices for 30 rival countries in the IT sector. It turns out that while the RBEA
indices are less than one for most rival countries, the revealed labour advantage (RLA) indices
are greater than one for almost all of them with China being the only exception. On the other
hand, Indonesia is the only country that lags behind India in terms of business environment. This
could be due to political instability in the country. Singapore and Sri Lanka in Asia, Czech
Republic, Hungary, and Poland in Central and Eastern Europe (CEE) region, and Brazil and
Chile in Latin America are the only developing countries which are at a comparative
disadvantage in terms of cost competitiveness. Our analysis thus reveals that India is most
benefited by the revealed comparative advantages in the availability of labour, followed by cost
competitiveness and business environment.
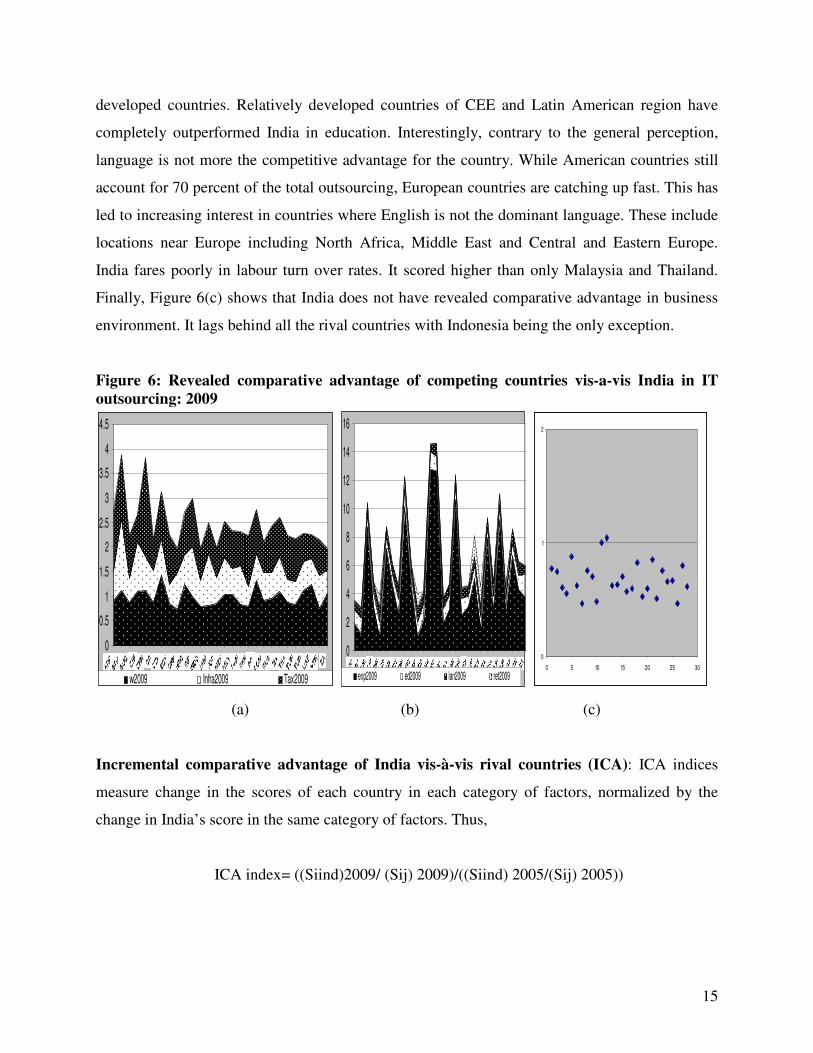
Figure 6 (a) shows that relatively lower wage rates drive cost competitiveness of India vis-à-vis
its competitors. It is followed by tax rate advantages and infrastructure costs. Large experienced
working force leads India’s labour advantage (Figure 6b). Education follows it. India’s revealed
comparative advantage in education remains a major factor only when compared with less
15
developed countries. Relatively developed countries of CEE and Latin American region have
completely outperformed India in education. Interestingly, contrary to the general perception,
language is not more the competitive advantage for the country. While American countries still
account for 70 percent of the total outsourcing, European countries are catching up fast. This has
led to increasing interest in countries where English is not the dominant language. These include
locations near Europe including North Africa, Middle East and Central and Eastern Europe.
India fares poorly in labour turn over rates. It scored higher than only Malaysia and Thailand.
Finally, Figure 6(c) shows that India does not have revealed comparative advantage in business
environment. It lags behind all the rival countries with Indonesia being the only exception.
Figure 6: Revealed comparative advantage of competing countries vis-a-vis India in IT
outsourcing: 2009
0
0.5
1
1.5
2
2.5
3
3.5
4
4.5
w2009 Infra2009 Tax2009
0
2
4
6
8
10
12
14
16
exp2009 ed2009 lan2009 ret2009
0
1
2
0 5 10 15 20 25 30
(a) (b) (c)
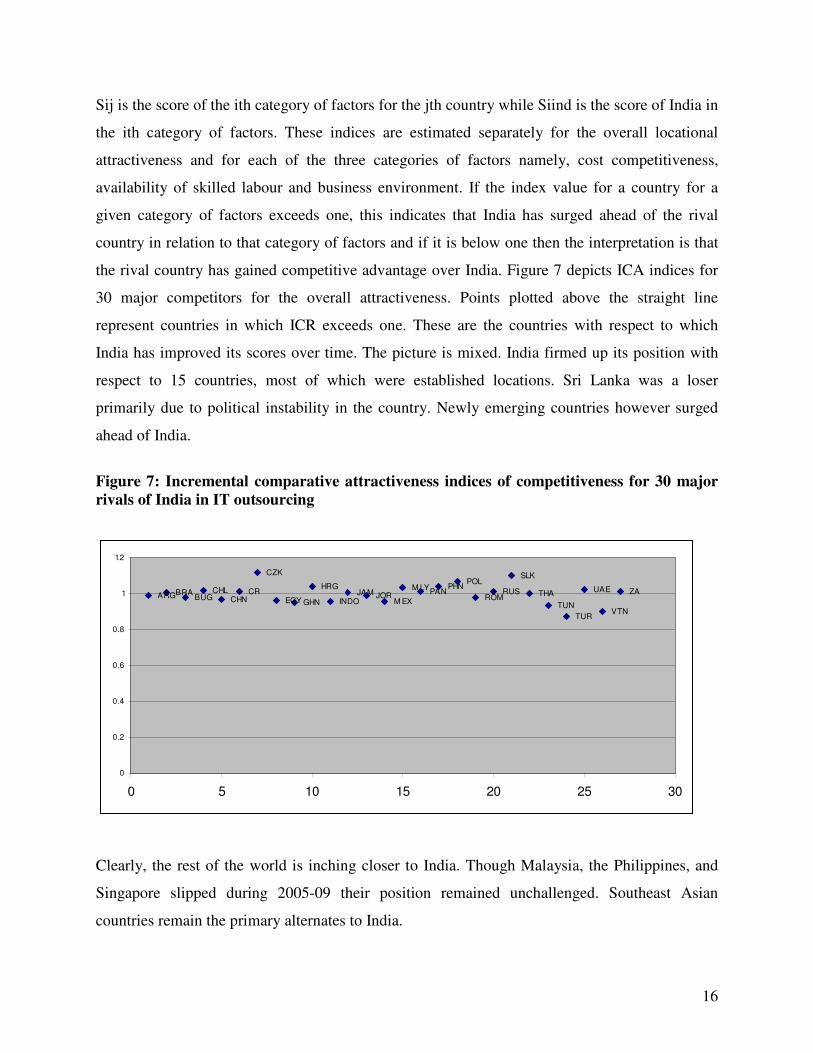
Incremental comparative advantage of India vis-à-vis rival countries (ICA): ICA indices
measure change in the scores of each country in each category of factors, normalized by the
change in India’s score in the same category of factors. Thus,
ICA index= ((Siind)2009/ (Sij) 2009)/((Siind) 2005/(Sij) 2005))
16
Sij is the score of the ith category of factors for the jth country while Siind is the score of India in
the ith category of factors. These indices are estimated separately for the overall locational
attractiveness and for each of the three categories of factors namely, cost competitiveness,
availability of skilled labour and business environment. If the index value for a country for a
given category of factors exceeds one, this indicates that India has surged ahead of the rival
country in relation to that category of factors and if it is below one then the interpretation is that
the rival country has gained competitive advantage over India. Figure 7 depicts ICA indices for
30 major competitors for the overall attractiveness. Points plotted above the straight line
represent countries in which ICR exceeds one. These are the countries with respect to which
India has improved its scores over time. The picture is mixed. India firmed up its position with
respect to 15 countries, most of which were established locations. Sri Lanka was a loser
primarily due to political instability in the country. Newly emerging countries however surged
ahead of India.
Figure 7: Incremental comparative attractiveness indices of competitiveness for 30 major
rivals of India in IT outsourcing
ARGBRABUG
CHLCHN
CR
CZK
EGY GHN
HRG
INDOJAM JOR
M EX
M LYPAN
PHNPOL
ROMRUS
SLK
THA
TUN
TUR
UAE
VTN
ZA
0
0.2
0.4
0.6
0.8
1
1.2
0 5 10 15 20 25 30
Clearly, the rest of the world is inching closer to India. Though Malaysia, the Philippines, and
Singapore slipped during 2005-09 their position remained unchallenged. Southeast Asian
countries remain the primary alternates to India.
17
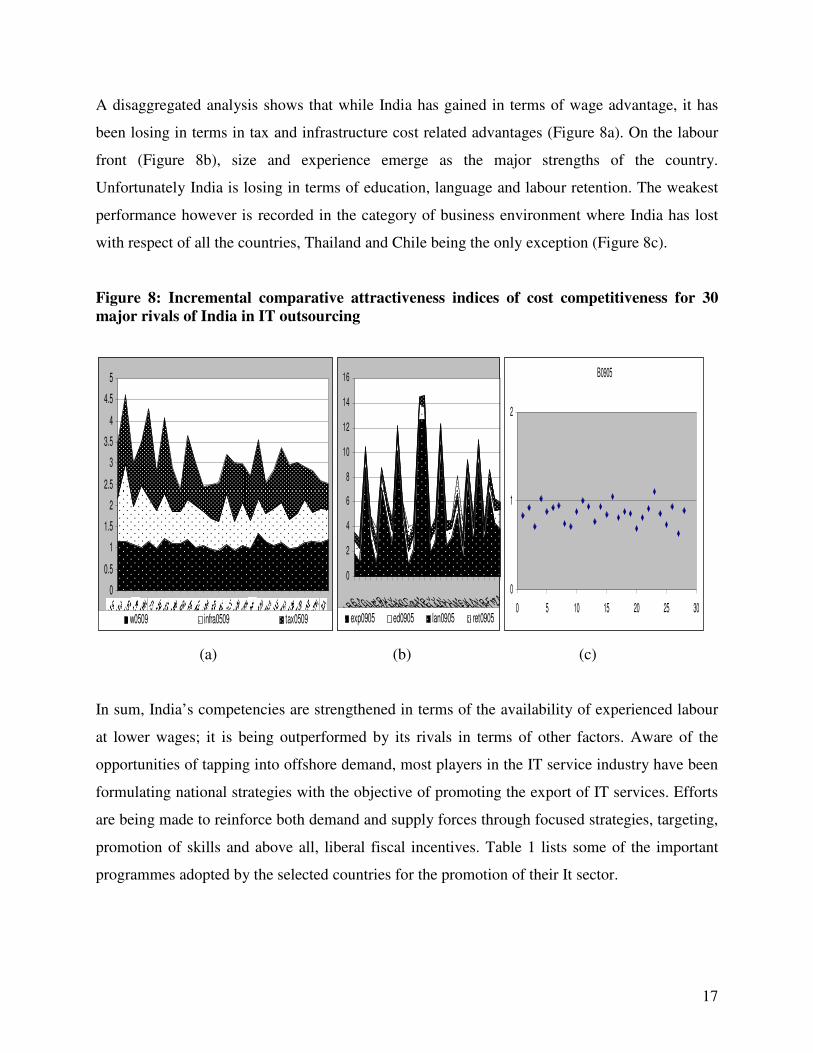
A disaggregated analysis shows that while India has gained in terms of wage advantage, it has
been losing in terms in tax and infrastructure cost related advantages (Figure 8a). On the labour
front (Figure 8b), size and experience emerge as the major strengths of the country.
Unfortunately India is losing in terms of education, language and labour retention. The weakest
performance however is recorded in the category of business environment where India has lost
with respect of all the countries, Thailand and Chile being the only exception (Figure 8c).
Figure 8: Incremental comparative attractiveness indices of cost competitiveness for 30
major rivals of India in IT outsourcing
0
0.5
1
1.5
2
2.5
3
3.5
4
4.5
5
w0509 infra0509 tax0509
0
2
4
6
8
10
12
14
16
AR GB R A
BU GC HL
C HNC RC ZK
EGYGH N
H RGIN DIN D OJAM
JORM EX
M LYP AN
PH NPOLR OM
R USSLKTH A
TU NTU R
U AEVTNZA
exp0905 ed0905 lan0905 ret0905
B0905
0
1
2
0 5 10 15 20 25 30
(a) (b) (c)
In sum, India’s competencies are strengthened in terms of the availability of experienced labour
at lower wages; it is being outperformed by its rivals in terms of other factors. Aware of the
opportunities of tapping into offshore demand, most players in the IT service industry have been
formulating national strategies with the objective of promoting the export of IT services. Efforts
are being made to reinforce both demand and supply forces through focused strategies, targeting,
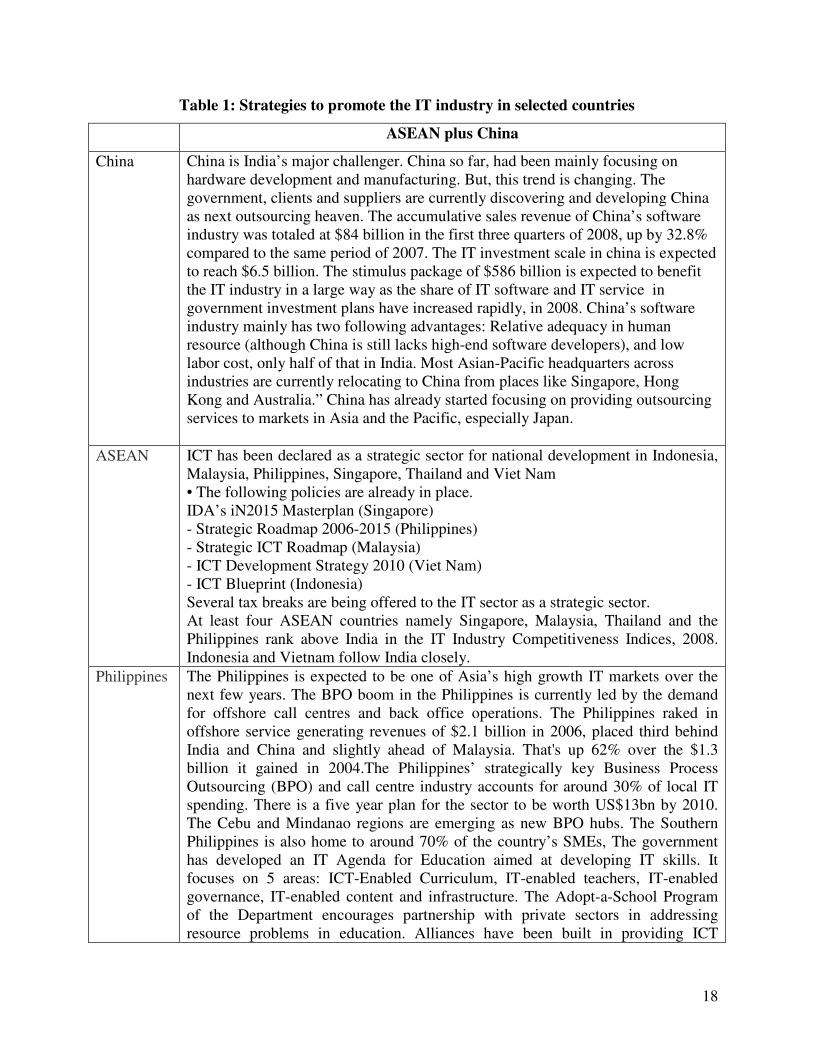
promotion of skills and above all, liberal fiscal incentives. Table 1 lists some of the important
programmes adopted by the selected countries for the promotion of their It sector.
18
Table 1: Strategies to promote the IT industry in selected countries
ASEAN plus China
China China is India’s major challenger. China so far, had been mainly focusing on hardware development and manufacturing. But, this trend is changing. The government, clients and suppliers are currently discovering and developing China as next outsourcing heaven. The accumulative sales revenue of China’s software industry was totaled at $84 billion in the first three quarters of 2008, up by 32.8% compared to the same period of 2007. The IT investment scale in china is expected to reach $6.5 billion. The stimulus package of $586 billion is expected to benefit the IT industry in a large way as the share of IT software and IT service in government investment plans have increased rapidly, in 2008. China’s software industry mainly has two following advantages: Relative adequacy in human resource (although China is still lacks high-end software developers), and low labor cost, only half of that in India. Most Asian-Pacific headquarters across industries are currently relocating to China from places like Singapore, Hong Kong and Australia.” China has already started focusing on providing outsourcing services to markets in Asia and the Pacific, especially Japan.
ASEAN ICT has been declared as a strategic sector for national development in Indonesia, Malaysia, Philippines, Singapore, Thailand and Viet Nam • The following policies are already in place. IDA’s iN2015 Masterplan (Singapore) - Strategic Roadmap 2006-2015 (Philippines) - Strategic ICT Roadmap (Malaysia) - ICT Development Strategy 2010 (Viet Nam) - ICT Blueprint (Indonesia) Several tax breaks are being offered to the IT sector as a strategic sector. At least four ASEAN countries namely Singapore, Malaysia, Thailand and the Philippines rank above India in the IT Industry Competitiveness Indices, 2008. Indonesia and Vietnam follow India closely.
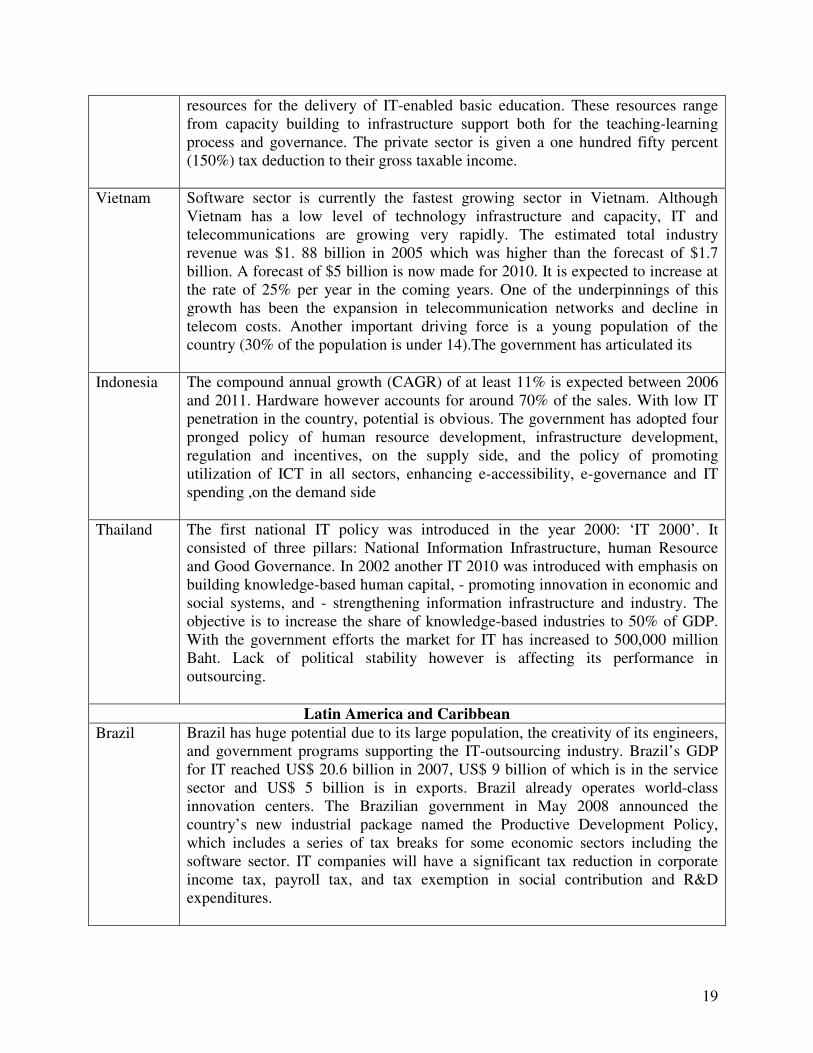
Philippines The Philippines is expected to be one of Asia’s high growth IT markets over the next few years. The BPO boom in the Philippines is currently led by the demand for offshore call centres and back office operations. The Philippines raked in offshore service generating revenues of $2.1 billion in 2006, placed third behind India and China and slightly ahead of Malaysia. That's up 62% over the $1.3 billion it gained in 2004.The Philippines’ strategically key Business Process Outsourcing (BPO) and call centre industry accounts for around 30% of local IT spending. There is a five year plan for the sector to be worth US$13bn by 2010. The Cebu and Mindanao regions are emerging as new BPO hubs. The Southern Philippines is also home to around 70% of the country’s SMEs, The government has developed an IT Agenda for Education aimed at developing IT skills. It focuses on 5 areas: ICT-Enabled Curriculum, IT-enabled teachers, IT-enabled governance, IT-enabled content and infrastructure. The Adopt-a-School Program of the Department encourages partnership with private sectors in addressing resource problems in education. Alliances have been built in providing ICT
19
resources for the delivery of IT-enabled basic education. These resources range from capacity building to infrastructure support both for the teaching-learning process and governance. The private sector is given a one hundred fifty percent (150%) tax deduction to their gross taxable income.
Vietnam Software sector is currently the fastest growing sector in Vietnam. Although Vietnam has a low level of technology infrastructure and capacity, IT and telecommunications are growing very rapidly. The estimated total industry revenue was $1. 88 billion in 2005 which was higher than the forecast of $1.7 billion. A forecast of $5 billion is now made for 2010. It is expected to increase at the rate of 25% per year in the coming years. One of the underpinnings of this growth has been the expansion in telecommunication networks and decline in telecom costs. Another important driving force is a young population of the country (30% of the population is under 14).The government has articulated its
Indonesia The compound annual growth (CAGR) of at least 11% is expected between 2006 and 2011. Hardware however accounts for around 70% of the sales. With low IT penetration in the country, potential is obvious. The government has adopted four pronged policy of human resource development, infrastructure development, regulation and incentives, on the supply side, and the policy of promoting utilization of ICT in all sectors, enhancing e-accessibility, e-governance and IT spending ,on the demand side
Thailand The first national IT policy was introduced in the year 2000: ‘IT 2000’. It consisted of three pillars: National Information Infrastructure, human Resource and Good Governance. In 2002 another IT 2010 was introduced with emphasis on building knowledge-based human capital, - promoting innovation in economic and social systems, and - strengthening information infrastructure and industry. The objective is to increase the share of knowledge-based industries to 50% of GDP. With the government efforts the market for IT has increased to 500,000 million Baht. Lack of political stability however is affecting its performance in outsourcing.
Latin America and Caribbean
Brazil Brazil has huge potential due to its large population, the creativity of its engineers, and government programs supporting the IT-outsourcing industry. Brazil’s GDP for IT reached US$ 20.6 billion in 2007, US$ 9 billion of which is in the service sector and US$ 5 billion is in exports. Brazil already operates world-class innovation centers. The Brazilian government in May 2008 announced the country’s new industrial package named the Productive Development Policy, which includes a series of tax breaks for some economic sectors including the software sector. IT companies will have a significant tax reduction in corporate income tax, payroll tax, and tax exemption in social contribution and R&D expenditures.
20
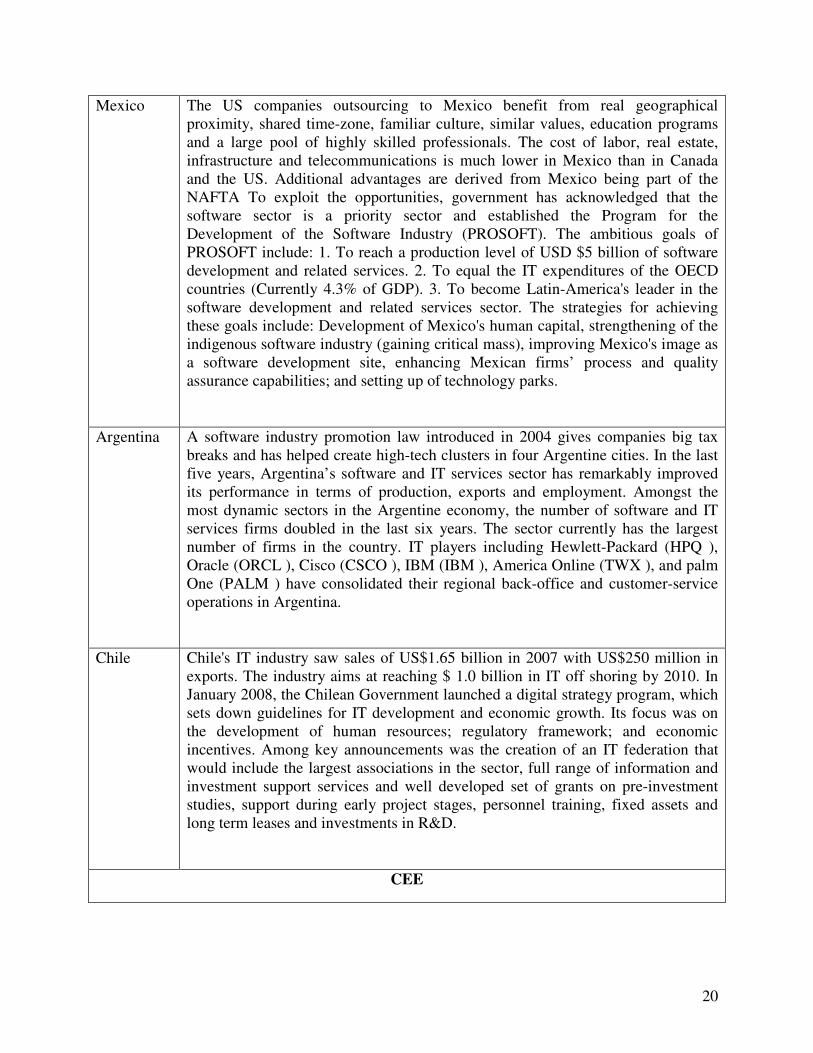
Mexico The US companies outsourcing to Mexico benefit from real geographical proximity, shared time-zone, familiar culture, similar values, education programs and a large pool of highly skilled professionals. The cost of labor, real estate, infrastructure and telecommunications is much lower in Mexico than in Canada and the US. Additional advantages are derived from Mexico being part of the NAFTA To exploit the opportunities, government has acknowledged that the software sector is a priority sector and established the Program for the Development of the Software Industry (PROSOFT). The ambitious goals of PROSOFT include: 1. To reach a production level of USD $5 billion of software development and related services. 2. To equal the IT expenditures of the OECD countries (Currently 4.3% of GDP). 3. To become Latin-America's leader in the software development and related services sector. The strategies for achieving these goals include: Development of Mexico's human capital, strengthening of the indigenous software industry (gaining critical mass), improving Mexico's image as a software development site, enhancing Mexican firms’ process and quality assurance capabilities; and setting up of technology parks.
Argentina A software industry promotion law introduced in 2004 gives companies big tax breaks and has helped create high-tech clusters in four Argentine cities. In the last five years, Argentina’s software and IT services sector has remarkably improved its performance in terms of production, exports and employment. Amongst the most dynamic sectors in the Argentine economy, the number of software and IT services firms doubled in the last six years. The sector currently has the largest number of firms in the country. IT players including Hewlett-Packard (HPQ ), Oracle (ORCL ), Cisco (CSCO ), IBM (IBM ), America Online (TWX ), and palm One (PALM ) have consolidated their regional back-office and customer-service operations in Argentina.
Chile Chile's IT industry saw sales of US$1.65 billion in 2007 with US$250 million in exports. The industry aims at reaching $ 1.0 billion in IT off shoring by 2010. In January 2008, the Chilean Government launched a digital strategy program, which sets down guidelines for IT development and economic growth. Its focus was on the development of human resources; regulatory framework; and economic incentives. Among key announcements was the creation of an IT federation that would include the largest associations in the sector, full range of information and investment support services and well developed set of grants on pre-investment studies, support during early project stages, personnel training, fixed assets and long term leases and investments in R&D.
CEE
21
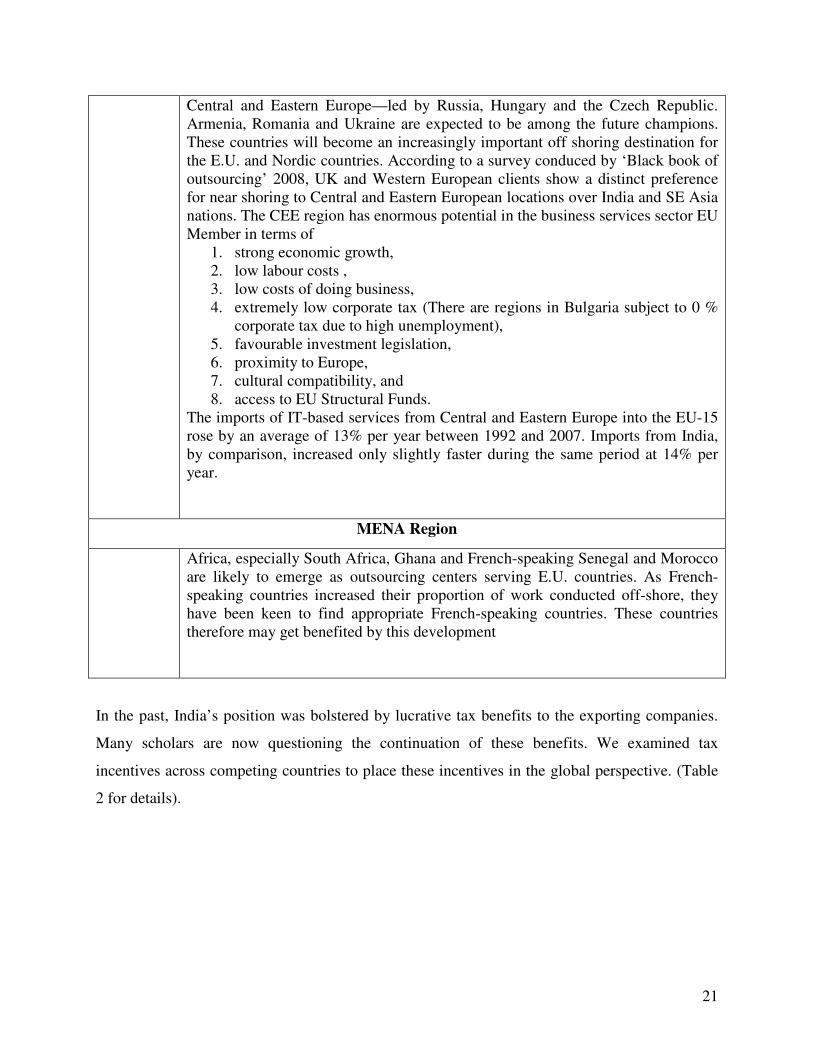
Central and Eastern Europe—led by Russia, Hungary and the Czech Republic. Armenia, Romania and Ukraine are expected to be among the future champions. These countries will become an increasingly important off shoring destination for the E.U. and Nordic countries. According to a survey conduced by ‘Black book of outsourcing’ 2008, UK and Western European clients show a distinct preference for near shoring to Central and Eastern European locations over India and SE Asia nations. The CEE region has enormous potential in the business services sector EU Member in terms of
1. strong economic growth, 2. low labour costs , 3. low costs of doing business, 4. extremely low corporate tax (There are regions in Bulgaria subject to 0 %
corporate tax due to high unemployment), 5. favourable investment legislation, 6. proximity to Europe, 7. cultural compatibility, and 8. access to EU Structural Funds.
The imports of IT-based services from Central and Eastern Europe into the EU-15 rose by an average of 13% per year between 1992 and 2007. Imports from India, by comparison, increased only slightly faster during the same period at 14% per year.
MENA Region
Africa, especially South Africa, Ghana and French-speaking Senegal and Morocco are likely to emerge as outsourcing centers serving E.U. countries. As French-speaking countries increased their proportion of work conducted off-shore, they have been keen to find appropriate French-speaking countries. These countries therefore may get benefited by this development
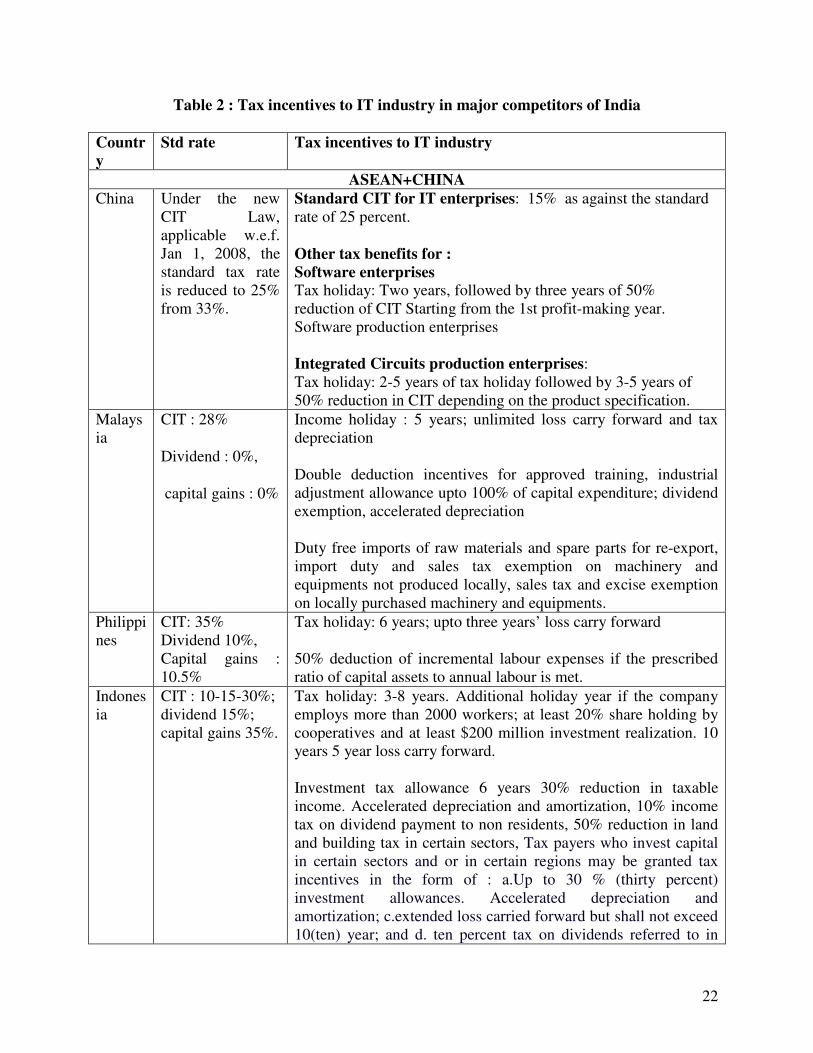
In the past, India’s position was bolstered by lucrative tax benefits to the exporting companies.
Many scholars are now questioning the continuation of these benefits. We examined tax
incentives across competing countries to place these incentives in the global perspective. (Table
2 for details).
22
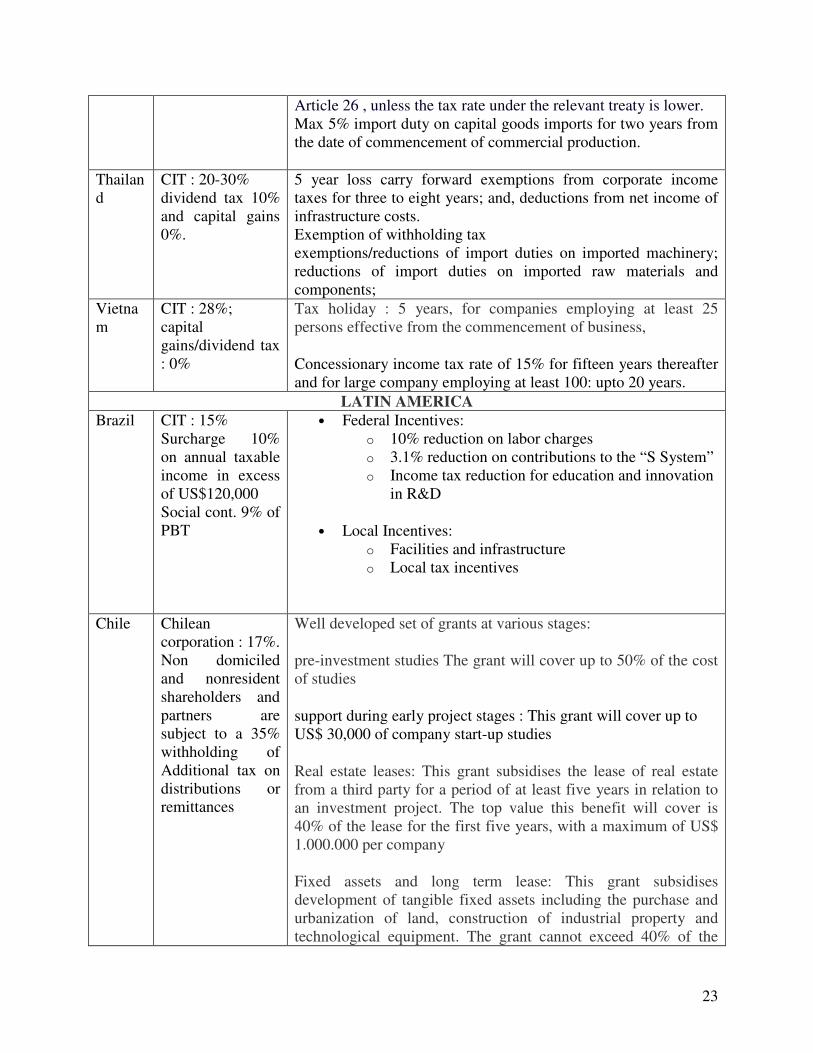
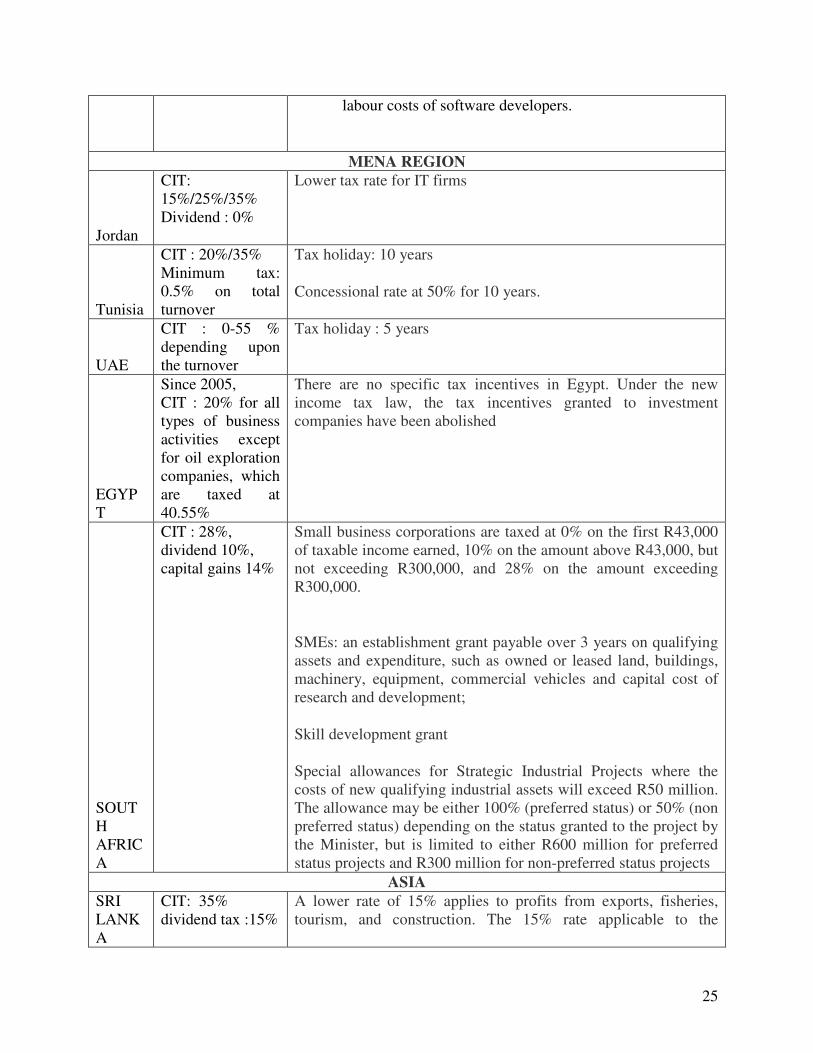
Table 2 : Tax incentives to IT industry in major competitors of India
Countr
y
Std rate Tax incentives to IT industry
ASEAN+CHINA
China Under the new CIT Law, applicable w.e.f. Jan 1, 2008, the standard tax rate is reduced to 25% from 33%.
Standard CIT for IT enterprises: 15% as against the standard rate of 25 percent.
Other tax benefits for :
Software enterprises Tax holiday: Two years, followed by three years of 50% reduction of CIT Starting from the 1st profit-making year. Software production enterprises Integrated Circuits production enterprises: Tax holiday: 2-5 years of tax holiday followed by 3-5 years of 50% reduction in CIT depending on the product specification.
Malaysia
CIT : 28%
Dividend : 0%,
capital gains : 0%
Income holiday : 5 years; unlimited loss carry forward and tax depreciation Double deduction incentives for approved training, industrial adjustment allowance upto 100% of capital expenditure; dividend exemption, accelerated depreciation Duty free imports of raw materials and spare parts for re-export, import duty and sales tax exemption on machinery and equipments not produced locally, sales tax and excise exemption on locally purchased machinery and equipments.
Philippines
CIT: 35% Dividend 10%, Capital gains : 10.5%
Tax holiday: 6 years; upto three years’ loss carry forward 50% deduction of incremental labour expenses if the prescribed ratio of capital assets to annual labour is met.
Indonesia
CIT : 10-15-30%; dividend 15%; capital gains 35%.
Tax holiday: 3-8 years. Additional holiday year if the company employs more than 2000 workers; at least 20% share holding by cooperatives and at least $200 million investment realization. 10 years 5 year loss carry forward. Investment tax allowance 6 years 30% reduction in taxable income. Accelerated depreciation and amortization, 10% income tax on dividend payment to non residents, 50% reduction in land and building tax in certain sectors, Tax payers who invest capital in certain sectors and or in certain regions may be granted tax incentives in the form of : a.Up to 30 % (thirty percent) investment allowances. Accelerated depreciation and amortization; c.extended loss carried forward but shall not exceed 10(ten) year; and d. ten percent tax on dividends referred to in
23
Article 26 , unless the tax rate under the relevant treaty is lower. Max 5% import duty on capital goods imports for two years from the date of commencement of commercial production.
Thailand
CIT : 20-30% dividend tax 10% and capital gains 0%.
5 year loss carry forward exemptions from corporate income taxes for three to eight years; and, deductions from net income of infrastructure costs. Exemption of withholding tax exemptions/reductions of import duties on imported machinery; reductions of import duties on imported raw materials and components;
Vietnam
CIT : 28%; capital gains/dividend tax : 0%
Tax holiday : 5 years, for companies employing at least 25 persons effective from the commencement of business,
Concessionary income tax rate of 15% for fifteen years thereafter and for large company employing at least 100: upto 20 years.
LATIN AMERICA
Brazil CIT : 15% Surcharge 10% on annual taxable income in excess of US$120,000 Social cont. 9% of PBT
• Federal Incentives: o 10% reduction on labor charges o 3.1% reduction on contributions to the “S System” o Income tax reduction for education and innovation
in R&D
• Local Incentives: o Facilities and infrastructure o Local tax incentives
Chile Chilean corporation : 17%. Non domiciled and nonresident shareholders and partners are subject to a 35% withholding of Additional tax on distributions or remittances
Well developed set of grants at various stages:
pre-investment studies The grant will cover up to 50% of the cost of studies
support during early project stages : This grant will cover up to US$ 30,000 of company start-up studies
Real estate leases: This grant subsidises the lease of real estate from a third party for a period of at least five years in relation to an investment project. The top value this benefit will cover is 40% of the lease for the first five years, with a maximum of US$ 1.000.000 per company
Fixed assets and long term lease: This grant subsidises development of tangible fixed assets including the purchase and urbanization of land, construction of industrial property and technological equipment. The grant cannot exceed 40% of the

24
investment or USD 70,000.
Mexico CIT : 28% Dividend: 0; if corporate tax paid.
A Single / Flat Rate Business Tax
IT firms established in Mexico can receive cash grants of up to 50% of the total cost of their project and tax credit of up to 30% of the total R&D expense.
Argentina
CIT: 35%. Tax on minimum notional income : The rate is 1% on the value of fixed and current assets
The Software Promotion Law (Law N° 25.922) set up FONSOFT, a public program intended to finance research, training and exports. At the same time, awards intended for professionals and institutions that make contributions to the country’s IT industry were established.
Recently, the SMEs authority (SEPyME) started a program that is intended to support the sector with subsidies and credit advantages. In a short period of time ProsperAr plans to financially support investment in this strategic sector through a venture.
CEE
Czech Rep.
Since 1 January 2008. - reduction of corporate income tax rate (from 24% in 2007 to: 2008 - 21%; 2009 - 20%; from 2010 - 19%)
Subsidy programme : upto 60% of 2 years’ wages; upto 45% of training costs 3-5 years depending on jobs created. For minimum support the project should invest Eur 357000 and 20-100 jobs
Bulgaria
corporate income is subject to tax at a flat rate of 10%
There are regions in Bulgaria subject to 0 % corporate tax due to high unemployment.
Slovakia
Amended on 1 January 2004 rate of corporate income tax in Slovakia is 19%.
• The State aid intensity in Slovakia can achieve up to 50% of the eligible investment costs.
• Five forms of investment incentives (tax relief, financial grant, job creation grant, training grant, discounted price for land)
Poland
Since 1 January 2007 : The CIT rate : of 19% Other taxes : 0%
No additional benefit.
HUNGARY
CIT : 16%; solidarity tax: 4% Local tax: upto 2%
• The Government’s Information Society Strategy was approved in 2003;
• The National Development Plan II 2007-2013 earmarks 3% (approx. EUR 790 million) of EU funds for the development of the info-communication sector;
• A 10% ( 15% for SMEs) tax allowance is offered on the
25
labour costs of software developers.
MENA REGION
Jordan
CIT: 15%/25%/35% Dividend : 0%
Lower tax rate for IT firms
Tunisia
CIT : 20%/35% Minimum tax: 0.5% on total turnover
Tax holiday: 10 years
Concessional rate at 50% for 10 years.
UAE
CIT : 0-55 % depending upon the turnover
Tax holiday : 5 years
EGYPT
Since 2005, CIT : 20% for all types of business activities except for oil exploration companies, which are taxed at 40.55%
There are no specific tax incentives in Egypt. Under the new income tax law, the tax incentives granted to investment companies have been abolished
SOUTH AFRICA
CIT : 28%, dividend 10%, capital gains 14%
Small business corporations are taxed at 0% on the first R43,000 of taxable income earned, 10% on the amount above R43,000, but not exceeding R300,000, and 28% on the amount exceeding R300,000.
SMEs: an establishment grant payable over 3 years on qualifying assets and expenditure, such as owned or leased land, buildings, machinery, equipment, commercial vehicles and capital cost of research and development;
Skill development grant
Special allowances for Strategic Industrial Projects where the costs of new qualifying industrial assets will exceed R50 million. The allowance may be either 100% (preferred status) or 50% (non preferred status) depending on the status granted to the project by the Minister, but is limited to either R600 million for preferred status projects and R300 million for non-preferred status projects
ASIA
SRI LANKA
CIT: 35% dividend tax :15%
A lower rate of 15% applies to profits from exports, fisheries, tourism, and construction. The 15% rate applicable to the

26
construction industry is restricted to resident companies
rate applicable to venture capital companies is 20%.
New or existing companies that export nontraditional goods are entitled to be taxed on the profits from these exports or services at a concessionary rate of 15% for a period of 20 years ending on March 31, 2014 and 2015, respectively. Dividends paid by such companies out of profits earned from the exports of nontraditional goods, which are taxed at 15%, are in turn liable to tax of 10%
Sources: Selected countries’ official documents
Our findings are as under.
• Almost all the countries have introduced reforms in their tax regimes in recent years and
corporate taxes are lowered significantly.
• ASEAN countries and China have been offering huge tax incentives to IT firms under
their priority/high tech sector programmes.
• Latin American countries have been offering Cash incentives.
• CEE countries have simplified their tax structure and reduced the rates drastically. They
are therefore not adhering to tax incentives. However some of these countries have been
offering such benefits on location basis or cash basis.
• MENA countries have lowered the rates recently and have fixed lower rates for IT firms
and special packages are doled out to exporting firms.
• Sri Lanka has two tax regimes : one for the companies in traditional sector and the other
for high sectors. Tax rates for high tech industries are substantially lower than that of
traditional sectors. In addition, generous tax incentives are offered to exporting firms.
In India on the other hand, the effective tax rate for them to be 33.99 percent. In addition a new
Chapter XII-B consisting of section 115J was inserted in the Income Tax Act by the Finance Act,
1987 (Act) to impose minimum tax in cases of companies. In 2005, FBT was introduced.
According to the MOF the marginal corporate rate turns out to be 45 percent. The latest version
of the “doing Business Report”, released in 2008 shows that India is one of the most heavily
taxed countries in terms of corporate taxation. Among 121 countries, its rank is 110 with the
overall rate of tax being over 70 percent. Figure 9 shows India’s position via-s-vis all those
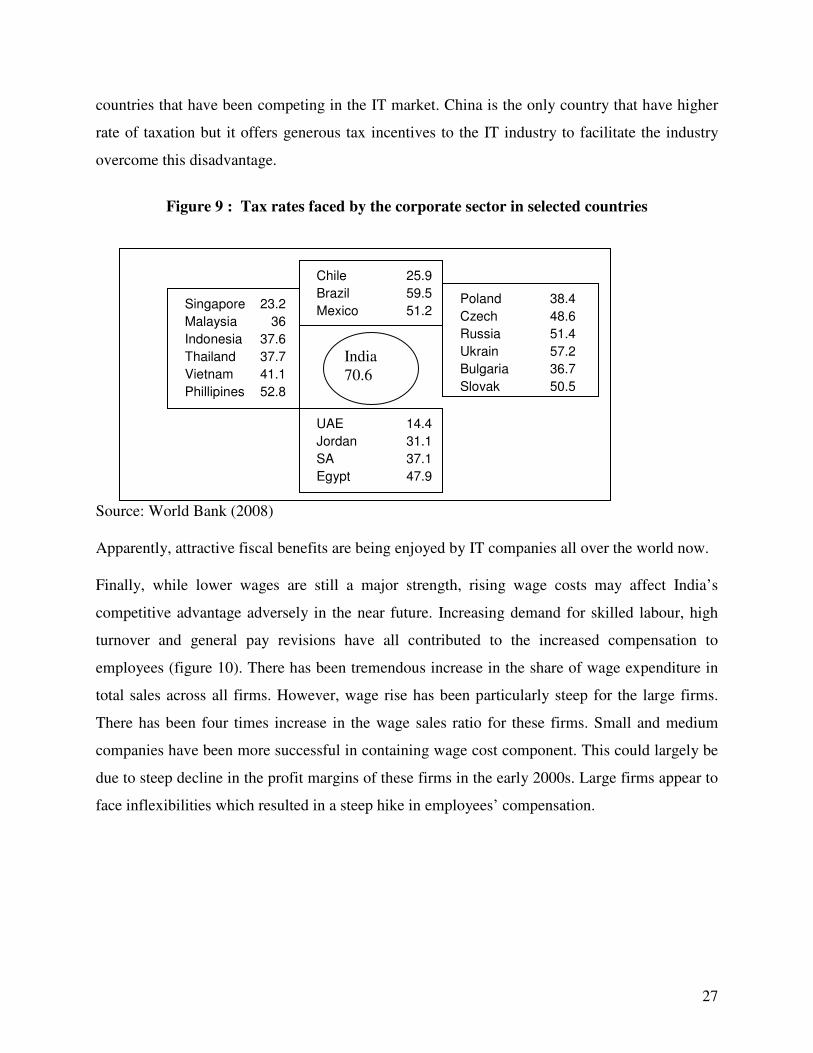
27
countries that have been competing in the IT market. China is the only country that have higher
rate of taxation but it offers generous tax incentives to the IT industry to facilitate the industry
overcome this disadvantage.
Figure 9 : Tax rates faced by the corporate sector in selected countries
Source: World Bank (2008)
Apparently, attractive fiscal benefits are being enjoyed by IT companies all over the world now.
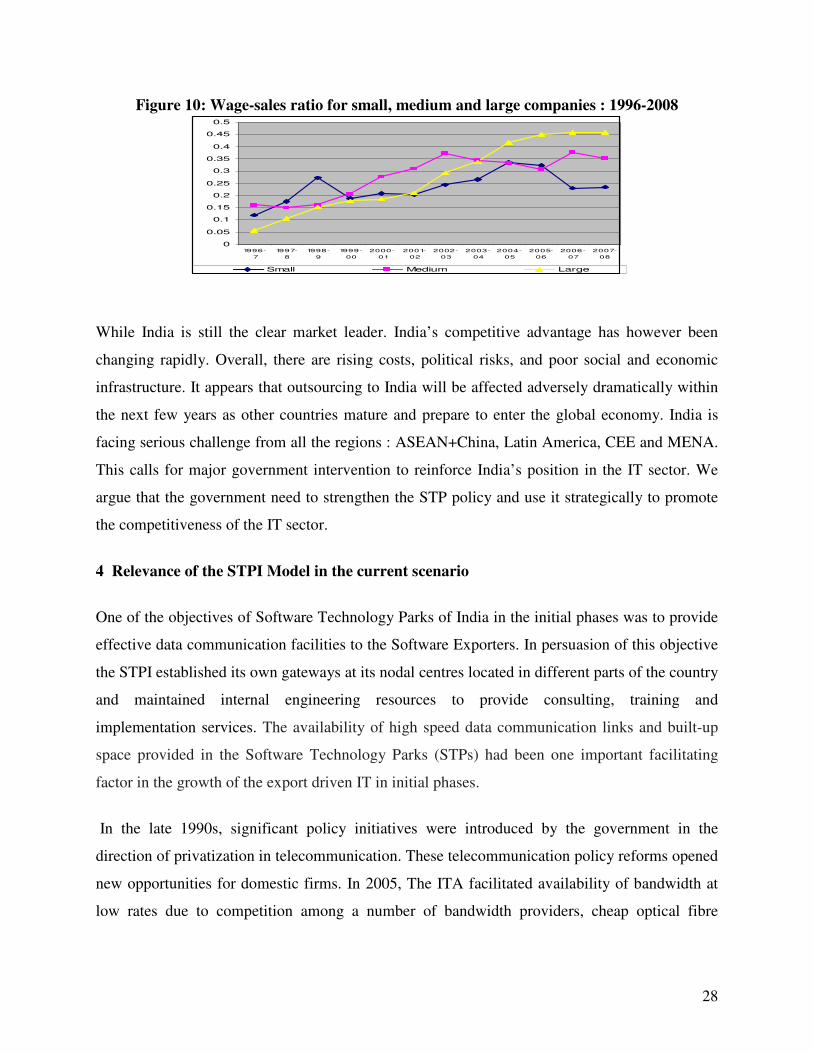
Finally, while lower wages are still a major strength, rising wage costs may affect India’s
competitive advantage adversely in the near future. Increasing demand for skilled labour, high
turnover and general pay revisions have all contributed to the increased compensation to
employees (figure 10). There has been tremendous increase in the share of wage expenditure in
total sales across all firms. However, wage rise has been particularly steep for the large firms.
There has been four times increase in the wage sales ratio for these firms. Small and medium
companies have been more successful in containing wage cost component. This could largely be
due to steep decline in the profit margins of these firms in the early 2000s. Large firms appear to
face inflexibilities which resulted in a steep hike in employees’ compensation.
Singapore 23.2
Malaysia 36
Indonesia 37.6
Thailand 37.7
Vietnam 41.1
Phillipines 52.8
Chile 25.9
Brazil 59.5
Mexico 51.2
Poland 38.4
Czech 48.6
Russia 51.4
Ukrain 57.2
Bulgaria 36.7
Slovak 50.5
India 70.6
UAE 14.4
Jordan 31.1
SA 37.1
Egypt 47.9
28
Figure 10: Wage-sales ratio for small, medium and large companies : 1996-2008
0
0.05
0.1
0.15
0.2
0.25
0.3
0.35
0.4
0.45
0.5
1996-
7
1997-
8
1998-
9
1999-
00
2000-
01
2001-
02
2002-
03
2003-
04
2004-
05
2005-
06
2006-
07
2007-
08
Small Medium Large
While India is still the clear market leader. India’s competitive advantage has however been
changing rapidly. Overall, there are rising costs, political risks, and poor social and economic
infrastructure. It appears that outsourcing to India will be affected adversely dramatically within
the next few years as other countries mature and prepare to enter the global economy. India is
facing serious challenge from all the regions : ASEAN+China, Latin America, CEE and MENA.
This calls for major government intervention to reinforce India’s position in the IT sector. We
argue that the government need to strengthen the STP policy and use it strategically to promote
the competitiveness of the IT sector.
4 Relevance of the STPI Model in the current scenario
One of the objectives of Software Technology Parks of India in the initial phases was to provide
effective data communication facilities to the Software Exporters. In persuasion of this objective
the STPI established its own gateways at its nodal centres located in different parts of the country
and maintained internal engineering resources to provide consulting, training and
implementation services. The availability of high speed data communication links and built-up
space provided in the Software Technology Parks (STPs) had been one important facilitating
factor in the growth of the export driven IT in initial phases.
In the late 1990s, significant policy initiatives were introduced by the government in the
direction of privatization in telecommunication. These telecommunication policy reforms opened
new opportunities for domestic firms. In 2005, The ITA facilitated availability of bandwidth at
low rates due to competition among a number of bandwidth providers, cheap optical fibre
29
connectivity against the satellite connectivity and duty-free imports. In this scenario, the role of
STPI in providing these services has become relatively less important.
Many believe that the STPs have lost their relevance. Their role is merely to offer tax incentives.
But this perception is based on a limited understanding of the programme. Units in STPs are
benefited by the single window approval mechanism, availability of commercial infrastructure at
competitive rates, incubation facilities and other infrastructure. The STPs also offer a transparent
policy environment and a package of concessions. They thus help not only in enhancing cost
competitiveness by lowering costs of production but also ensure conducive business
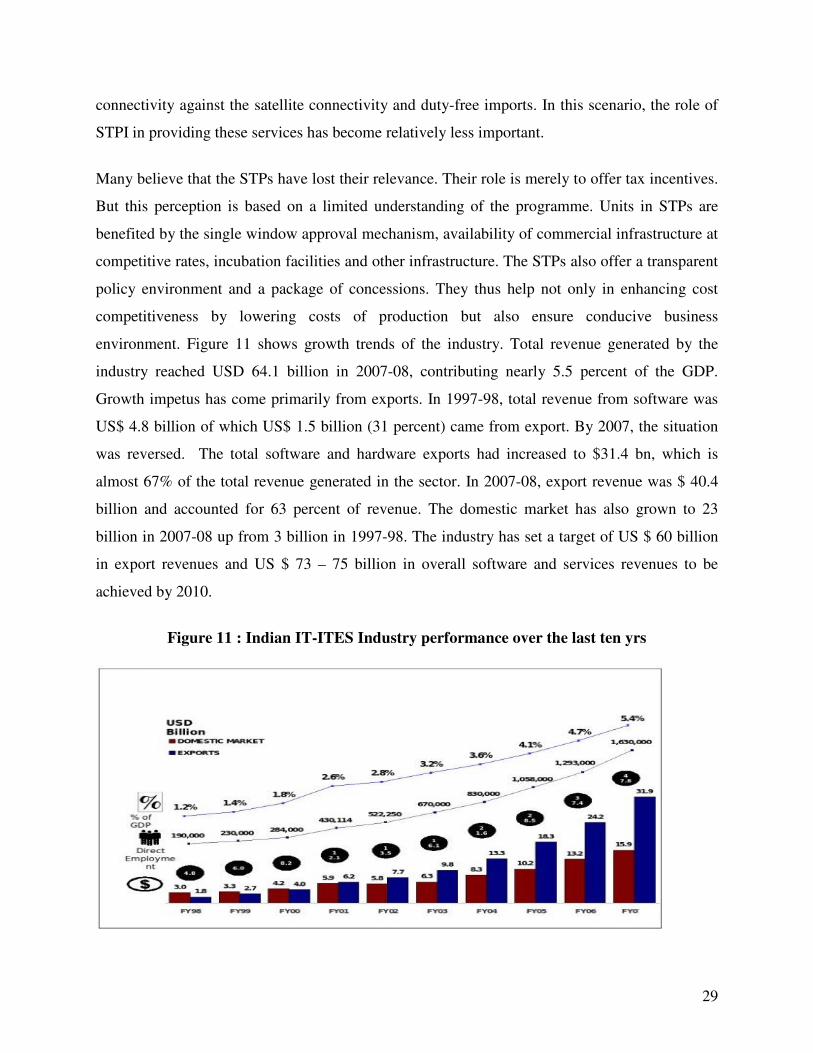
environment. Figure 11 shows growth trends of the industry. Total revenue generated by the
industry reached USD 64.1 billion in 2007-08, contributing nearly 5.5 percent of the GDP.
Growth impetus has come primarily from exports. In 1997-98, total revenue from software was
US$ 4.8 billion of which US$ 1.5 billion (31 percent) came from export. By 2007, the situation
was reversed. The total software and hardware exports had increased to $31.4 bn, which is
almost 67% of the total revenue generated in the sector. In 2007-08, export revenue was $ 40.4
billion and accounted for 63 percent of revenue. The domestic market has also grown to 23
billion in 2007-08 up from 3 billion in 1997-98. The industry has set a target of US $ 60 billion
in export revenues and US $ 73 – 75 billion in overall software and services revenues to be
achieved by 2010.
Figure 11 : Indian IT-ITES Industry performance over the last ten yrs
30
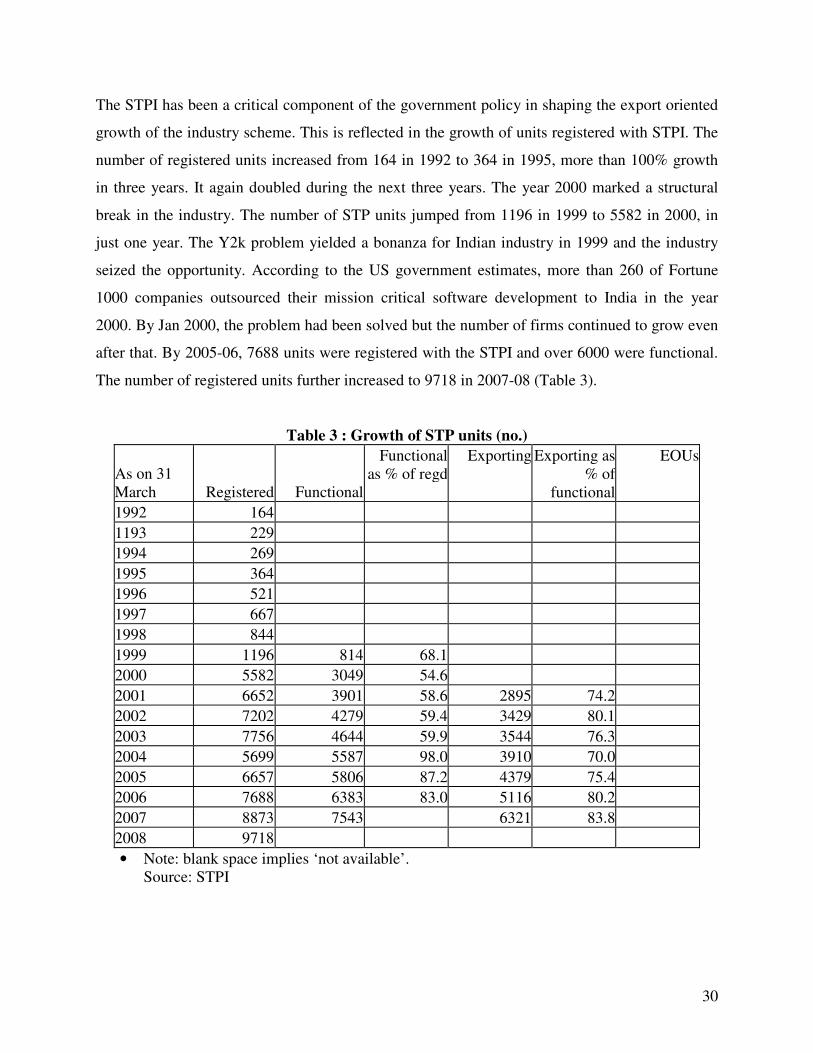
The STPI has been a critical component of the government policy in shaping the export oriented
growth of the industry scheme. This is reflected in the growth of units registered with STPI. The
number of registered units increased from 164 in 1992 to 364 in 1995, more than 100% growth
in three years. It again doubled during the next three years. The year 2000 marked a structural
break in the industry. The number of STP units jumped from 1196 in 1999 to 5582 in 2000, in
just one year. The Y2k problem yielded a bonanza for Indian industry in 1999 and the industry
seized the opportunity. According to the US government estimates, more than 260 of Fortune
1000 companies outsourced their mission critical software development to India in the year
2000. By Jan 2000, the problem had been solved but the number of firms continued to grow even
after that. By 2005-06, 7688 units were registered with the STPI and over 6000 were functional.
The number of registered units further increased to 9718 in 2007-08 (Table 3).
Table 3 : Growth of STP units (no.)
As on 31 March Registered Functional
Functional as % of regd
Exporting Exporting as % of
functional
EOUs
1992 164
1193 229
1994 269
1995 364
1996 521
1997 667
1998 844
1999 1196 814 68.1
2000 5582 3049 54.6
2001 6652 3901 58.6 2895 74.2
2002 7202 4279 59.4 3429 80.1
2003 7756 4644 59.9 3544 76.3
2004 5699 5587 98.0 3910 70.0
2005 6657 5806 87.2 4379 75.4
2006 7688 6383 83.0 5116 80.2
2007 8873 7543 6321 83.8
2008 9718
• Note: blank space implies ‘not available’. Source: STPI

31
In contrast, only 125 IT units (both hardware and software) were functional under the EOU
scheme in the year 2000. The number increased slowly to 258 by 2007. Despite the fact that the
fiscal and non fiscal benefits offered across the two schemes are similar and that STPs are
essentially treated as EOUs, IT companies have preferred the STPI scheme. This is because STPI
offers in addition to EOU benefits, several other benefits which makes it a ‘one-stop’ window for
the industry.
STPI exports accounted for a growing share of India’s total software exports. Against a share of
8% per cent in 1992-93, exports of STPI units reached 70% per cent of India’s total software
exports in 2000-01. By 2005-06, more than 90% of the national IT export was being routed
through the STPI. Figure 12 shows that national exports are explained largely by the STP
exports. In 2007-08 total exports of STPs are reported to be over Rs. 180 billion up from mere 20
billion in 2000-01. This amounts to 9 fold increase in 7 years.
Figure 12: Export performance : STPs vs National
0
20000
40000
60000
80000
100000
120000
140000
160000
1998-
99
1999-
00
2000-
01
2001-
02
2002-
03
2003-
04
2004-
05
2005-
06
2006-
07
STPI Nat ional
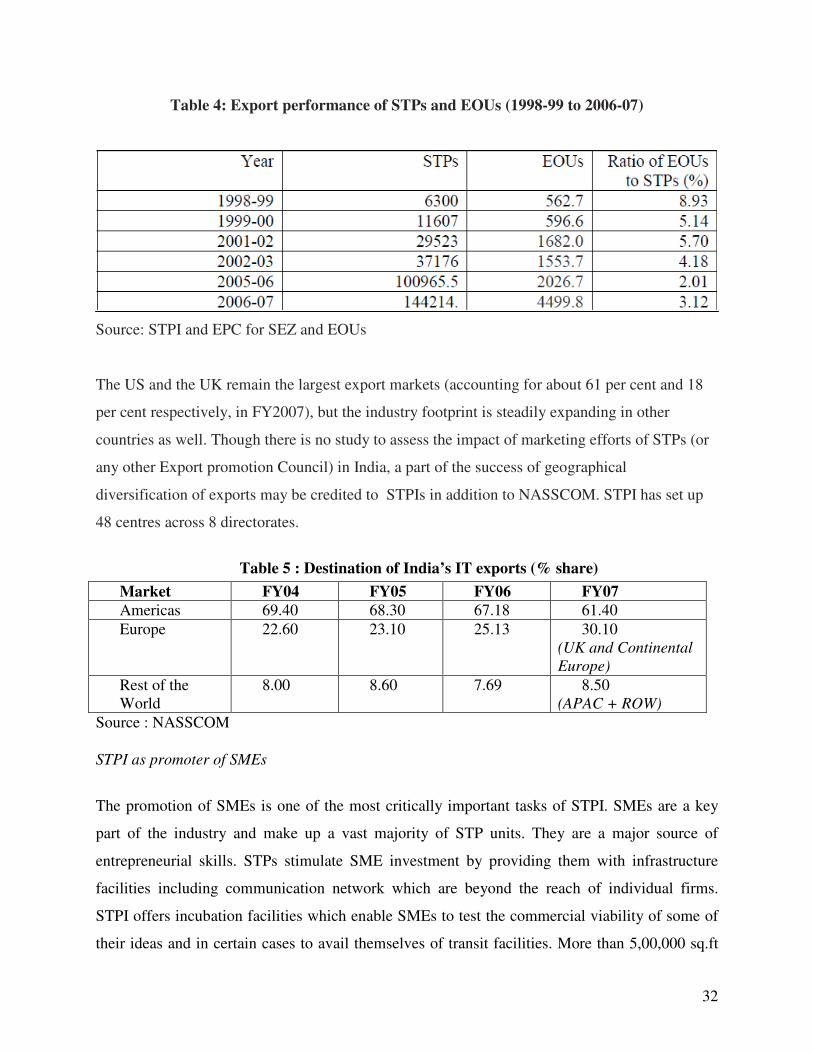
The following table (Table 4) provides data on software exports from STPs and EOUs. It shows
that IT firms distinctly prefer STPs over EOUs notwithstanding the fact that both the schemes
share common features. This is because STPs offer the benefits of SEZs, EPCs and industry
association as well along with EOUs.
32
Table 4: Export performance of STPs and EOUs (1998-99 to 2006-07)
Source: STPI and EPC for SEZ and EOUs
The US and the UK remain the largest export markets (accounting for about 61 per cent and 18
per cent respectively, in FY2007), but the industry footprint is steadily expanding in other
countries as well. Though there is no study to assess the impact of marketing efforts of STPs (or
any other Export promotion Council) in India, a part of the success of geographical
diversification of exports may be credited to STPIs in addition to NASSCOM. STPI has set up
48 centres across 8 directorates.
Table 5 : Destination of India’s IT exports (% share)
Source : NASSCOM
STPI as promoter of SMEs
The promotion of SMEs is one of the most critically important tasks of STPI. SMEs are a key
part of the industry and make up a vast majority of STP units. They are a major source of
entrepreneurial skills. STPs stimulate SME investment by providing them with infrastructure
facilities including communication network which are beyond the reach of individual firms.
STPI offers incubation facilities which enable SMEs to test the commercial viability of some of
their ideas and in certain cases to avail themselves of transit facilities. More than 5,00,000 sq.ft
Market FY04 FY05 FY06 FY07
Americas 69.40 68.30 67.18 61.40
Europe 22.60 23.10 25.13 30.10 (UK and Continental
Europe)
Rest of the World
8.00 8.60 7.69 8.50 (APAC + ROW)
33
of space is available with STPs across the country for the incubation facility. Recently, a SME
Enablement Center’ has been set up at NOIDA in partnership with SCO group. The center will
enable and encourage the SMEs to develop applications on SCO Linux/Unix platforms, which
are the fastest growing operating systems in the world. Realising the increasing need for Indian
companies to develop Intellectual Property, the STPI plans to provide an IPR cell within the
technology parks to encourage small-medium sized companies (SMEs). This would cover 50 per
cent of the costs incurred by SMEs in filing patents. It would provide provisions for getting ideas
patented in a year's time. It is also contemplating to provide workshops that would be conducted
to spread awareness on IPR related issues. STPI has also facilitated the promotion of long tail
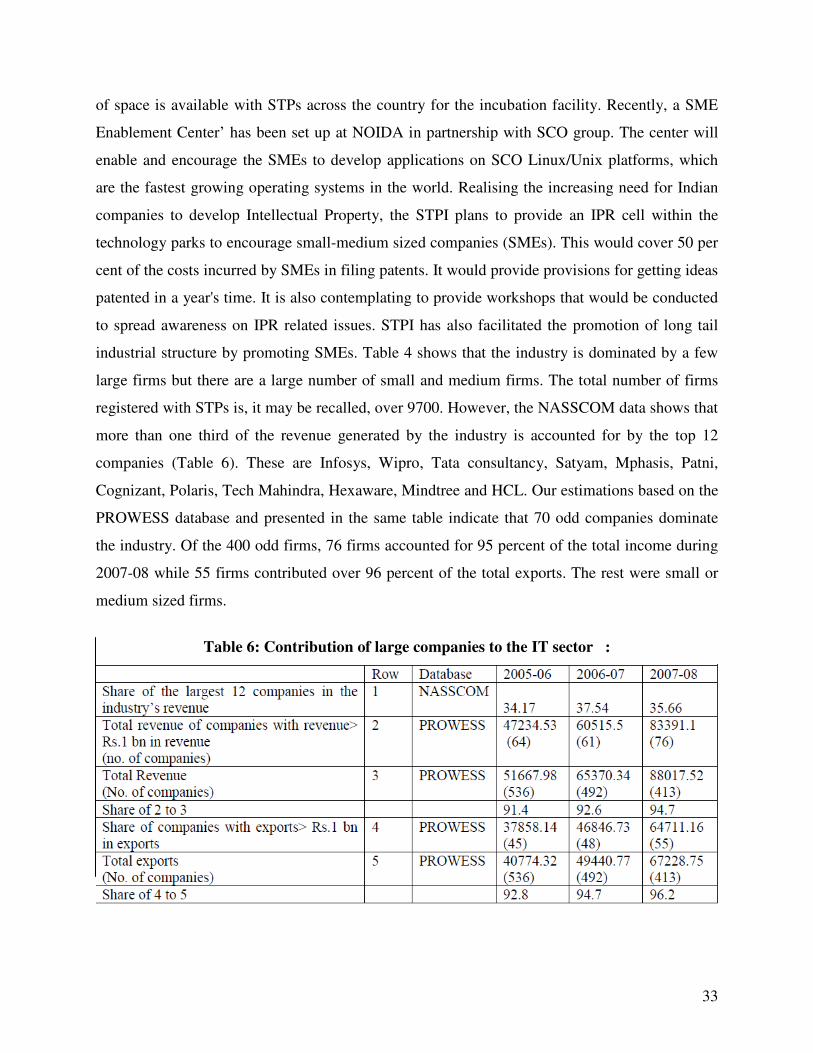
industrial structure by promoting SMEs. Table 4 shows that the industry is dominated by a few
large firms but there are a large number of small and medium firms. The total number of firms
registered with STPs is, it may be recalled, over 9700. However, the NASSCOM data shows that
more than one third of the revenue generated by the industry is accounted for by the top 12
companies (Table 6). These are Infosys, Wipro, Tata consultancy, Satyam, Mphasis, Patni,
Cognizant, Polaris, Tech Mahindra, Hexaware, Mindtree and HCL. Our estimations based on the
PROWESS database and presented in the same table indicate that 70 odd companies dominate
the industry. Of the 400 odd firms, 76 firms accounted for 95 percent of the total income during
2007-08 while 55 firms contributed over 96 percent of the total exports. The rest were small or
medium sized firms.
Table 6: Contribution of large companies to the IT sector :
34
The SMEs however serve as the seedbeds of entrepreneurial talent, create competitive business
environment, and impart dynamism to the industry’s growth. Technology, outsourcing and
access to third-party services are making it easier and cheaper to create niche for highly
customized services. This means the producers of niche products can cost effectively create
viable niche businesses. But promoting these businesses requires supportive investment climate.
STPs provide these SMEs access to comprehensive and focused support for enhancing the
managerial and technological capabilities, tapping business opportunities, and becoming
competitive in the local and international markets. These firms gradually grow organically to
become large firms imparting market dynamism. It may be observed in Table 4 that the number
of large firms has been growing every year.
The STPI and geographical diversification of the industry
Finally, the focus of the STPI is on the development of Tier-2 / Tier-3 cities as potential centres
of excellence. With rising costs in Tier I cities, moving to Tier II and Tier III cities has become
essential to maintain competitiveness of the industry. While commenting on India’s
competitiveness in outsourcing, the Location Global Service Report (A.T. Kearney 2007) states:
‘India’s continued competitiveness could in part be attributed to expansion of business away
from expensive and overburdened Tier I cities to Tier II and III cities, with their higher quality of
life and lower costs’.
Tier II and Tier III cities are non-metro cities endowed with sufficient human resources required
to grow and sustain ICT development in India. They enjoy cost advantage in terms of lower costs
of real estate, wages and transport. However, they lack conducive business environment and
necessary infrastructure which may increase the indirect cost of doing business and offset the
cost related advantages. STPs enhance the attractiveness of these locations in terms of financial
costs by offering tax benefits and reducing the cost of commercial space. On the non financial
side, STPs play an important role in enhancing the attractiveness of these cities by creating there
high speed data connectivity and by promoting linkages with educational institutions to ensure
the availability of skilled labour supply. STPI has already set up 52 STPI Centres across the
35
country to promote the IT sector in cities which have the potential but do not have the necessary
infrastructure.
Furthermore, while large firms dominate in well developed centres, SMEs play an important role
in relatively less developed regions. Table 5 presents the status and contribution by SMEs to STP
exports in four centres: Bangalore, Gandhinagar, Chennai and Trivendrum. We have information
on the status of 1244 firms across these STP centres. Of them, 535 (43%) have the status of
SMEs. However there has been substantial variability in the proportion of SMEs across these
centres. While the proportion of SMEs in Bangalore STP centre is 39 percent, in Gandhinagar it
is 83 percent. In Chennai and Trivendrum it is 60 and 66 percent, respectively. In terms of
contribution to exports, SMEs in Gandhinagar accounted for 38 percent of total exports in 2007-
08 while in Bangalore it was mere 4.7 percent. Bangalore is the world renowned oldest hub of IT
activity in India and is home of several large MNEs and domestic firms. Other centres are
relatively younger and therefore SMEs play a more important role in generating export incomes
in these centres.
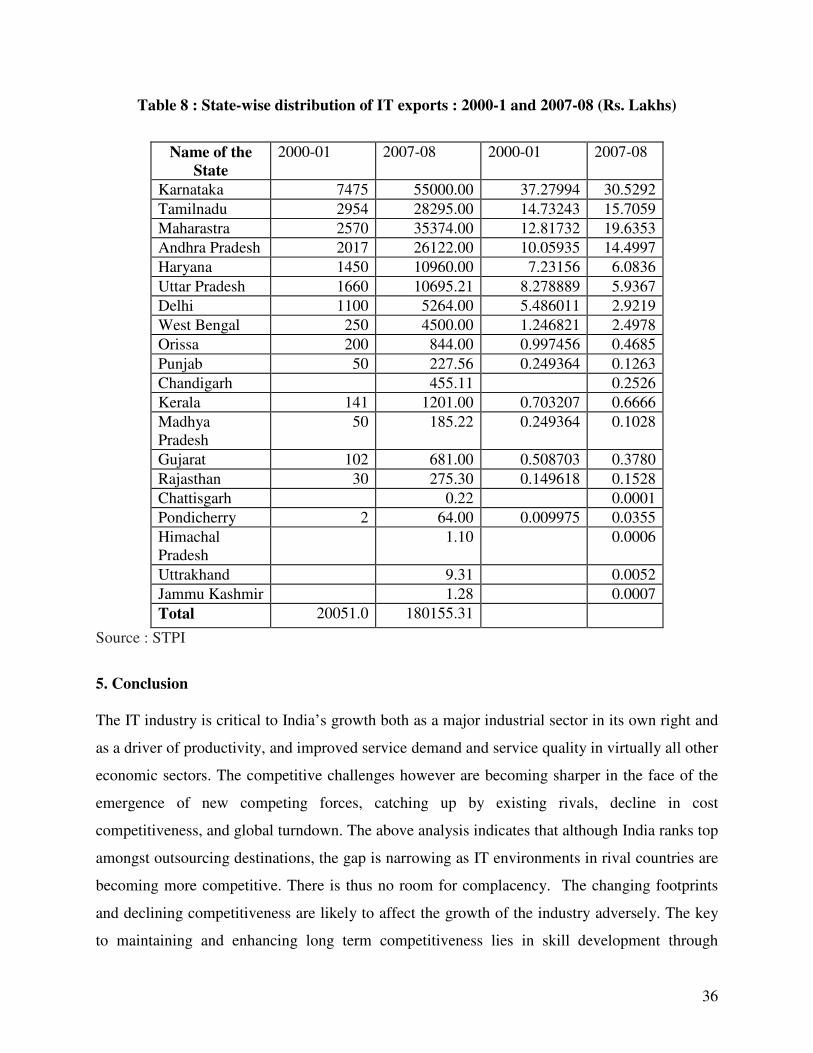
STPI has been also playing a proactive role in facilitating the geographic expansion of the
industry within the country. Table 8 shows that despite the continuing concentration of IT
activity in Karnataka, (in particular in Bangalore), there is tendency to disperse away to other
states also. For instance, Andhra Pradesh, Tamilnadu and Maharashtra together contributed 37
percent of total exports in 2000-01; their share increased to over 50 percent by 2007-08. In
addition, several new locations of IT exports emerged including in Chandigarh, Chattisgarh,
Uttanchal, Himachal Pradesh, and Jammu and Kashmir during this period. One may also note
that there has been a manifold increase in exports ( in absolute terms) from Haryana, Delhi, West
Bengal, Orissa, Kerala, Gujrat and Rajasthan, over the period since 2000.
36
Table 8 : State-wise distribution of IT exports : 2000-1 and 2007-08 (Rs. Lakhs)
Name of the
State
2000-01 2007-08 2000-01 2007-08
Karnataka 7475 55000.00 37.27994 30.5292
Tamilnadu 2954 28295.00 14.73243 15.7059
Maharastra 2570 35374.00 12.81732 19.6353
Andhra Pradesh 2017 26122.00 10.05935 14.4997
Haryana 1450 10960.00 7.23156 6.0836
Uttar Pradesh 1660 10695.21 8.278889 5.9367
Delhi 1100 5264.00 5.486011 2.9219
West Bengal 250 4500.00 1.246821 2.4978
Orissa 200 844.00 0.997456 0.4685
Punjab 50 227.56 0.249364 0.1263
Chandigarh 455.11 0.2526
Kerala 141 1201.00 0.703207 0.6666
Madhya Pradesh
50 185.22 0.249364 0.1028
Gujarat 102 681.00 0.508703 0.3780
Rajasthan 30 275.30 0.149618 0.1528
Chattisgarh 0.22 0.0001
Pondicherry 2 64.00 0.009975 0.0355
Himachal Pradesh
1.10 0.0006
Uttrakhand 9.31 0.0052
Jammu Kashmir 1.28 0.0007
Total 20051.0 180155.31
Source : STPI
5. Conclusion The IT industry is critical to India’s growth both as a major industrial sector in its own right and
as a driver of productivity, and improved service demand and service quality in virtually all other
economic sectors. The competitive challenges however are becoming sharper in the face of the
emergence of new competing forces, catching up by existing rivals, decline in cost
competitiveness, and global turndown. The above analysis indicates that although India ranks top
amongst outsourcing destinations, the gap is narrowing as IT environments in rival countries are
becoming more competitive. There is thus no room for complacency. The changing footprints
and declining competitiveness are likely to affect the growth of the industry adversely. The key
to maintaining and enhancing long term competitiveness lies in skill development through
37
promotion of education, infrastructure development and improving regulatory environment.
Some of these issues can be addressed by strengthening the STPI scheme. The government needs
to act now to ensure that it provides the STPI provides right environment for this sector to
flourish and to play its full role in driving diversification and upgradation of the industry.
Differentiated support policies are needed to strengthen the STPs. The role of STPI may now be
broad based It may take up the responsibility of promoting the supply of seed and venture
capital, initiate small innovation support programmes for business, improve the quality of
support, and strive to establish coordination between policy agencies, notably the Department of
Technology. There is thus strong need for further reinforcement of STPI’s competencies rather
than kill it.
The STPI scheme has played an important role in facilitating regional dispersion of IT activity. It
identified the potential of less developed regions, and set up centres to promote them as IT
locations by cultivating IT culture. However, the success of STPI has been quite uneven across
regions. While the performance of leading centres such as, Bangalore, Kolkata, Chennai,
Hyderabad, Noida, Pune and Mumbai has been good, other STPI centres lagged behind. That
means that the STPIs need to evaluate . One of the major benefits of the STPI is tax breaks
offered under Section 10A and 10B of the IT Act. With the sunset clause applicable on STP units
in 2011, it is feared that STPI might lose its attractiveness further. It is believed that the end of
tax exemptions may deal a crippling blow to this scheme which has made a significant
contribution to the growth of IT industry thus far and which needs to be strengthened at this
crucial juncture when the IT industry is facing serious global challenge.
Most firms do not find incubation facilities or marketing efforts by STPs as important inputs in
their businesses. It is now important to convert them into major R&D centres. That means that
the STPI needs to redraw its strategies and gear itself up for meeting challenges of the liberalized
world. Efforts should be made to strengthen these aspects of the STPI. This is the time to take
them to the next level and transform them into “high tech parks” along the lines of such parks in
Taiwan and Korea. These parks will make a significant contribution to moving up the value
chains, and improving business environment.
38
References
A.T.Kearney (2009) The Shifting Geography of Offshoring – The 2009
A.T.Kearney (2007) Offshoring for Long Term Advantage , Global Services Locational Index, 2007 A.T.Kearney (2005) Building Optimal Global Footprints, Global Services Locational Index, 2005 Arora, A., Arunachalam V.S., Asundi J. and Ronald F., (2002), The Indian Software Services Industry” Research Policy, Vol 30 (3), 1267-87. Dossani R, (2005) “Origins and Growth of the software industry in India”. Shorenstein Asia- Pacific Research Center, Working Paper
Heeks, R., (1996) India’s Software Industry: State Policy, Liberalization and Industrial Development, Sage Publications, New Delhi, Thousand Oaks, London Joseph, K.J (2006) Information Technology, Innovation System and Trade Regime in Developing Countries, Palgrave Macmillan ,New York Kumar, Nagesh and Joseph,K.J(2005),”Export of Software and Business Process Outsourcing from Developing Countries: Lessons from the Indian Experience, Asia Pacific Trade and Investment Review, Volume 1,No.1,April 2005 Mathur ,S.K.(2006),”Indian Information Technology Industry: Past ,Present and Future and a Tool for National Development”, Journal of Theoretical and Applied Information Technology, August 2006,Volume 2,No 2 Nasscom website (www.nasscom.in) for NASSCOM Strategic Review for various years
Balakrishnan ,Pulapre( 2006),” Benign Neglect or Strategic Intent? Contested Lineage of Indian Software Industry ,EPW, Vol 41 No 36 September 9, 2006 Schware R (1992) “Software Entry Strategies for Developing Countries”, World Development, Vol. 20, No. 2 pp 143-64.
Sen, P. (1995) “Indian Software Exports: An Assessment”, Economic and Political Weekly, Vol. 30, Nos. 7 & 8 pp 2053-58
Giuri P., G. Rocchetti & S. Torrisi (2002). "Open Source Software: From Open Science to New Marketing Models," LEM Papers Series 2002/23,
World Bank (2008) Doing Business, 2008