changing pattern of india’s high technology …srcc.edu/sites/default/files/article 8. changing...
TRANSCRIPT
Business Analyst, ISSN 0973-211X, 37(1) 117-146, © SRCC
CHANGING PATTERN OF INDIA’S HIGH TECHNOLOGY EXPORTS: A STUDYOF COMPETITIVENESS OF PHARMACEUTICAL PRODUCTS
Manisha∗ and Sandeep Kaur∗∗ ABSTRACT
Export earnings of India have increased substantially over the years. For active participation in the global trading system export diversification is essential. Export diversification plays a main part in the economic growth of the developing countries. These countries try to improve place at the global level by increase its exports by exporting high technology products. India is no exception to this. The present study makes trying to look at the strength of pharmaceutical exports in India’s high technology exports with the US and Russian Federation with the help of different indices like Revealed Comparative Advantage (RCA), Revealed Symmetric Comparative Advantage (RSCA) and Intra-Industry Trade (IIT) during 1991-2012. The empirical result of the study revealed that India has the maximum comparative advantage in pharmaceutical products with the US and Russian Federation. Further, the result of the study also highlights the positive impact of TRIPS on India’s pharmaceutical exports. The study also finds that domestic companies are more R and D oriented than foreign companies. For India to become a top player in the international business of pharmaceutical sector, the government of India needs to sustain foreign investments in pharmaceuticals sector so that it would help to meet the practical knowledge and to generate employment.
KEYWORDS: High Technology, TRIPS, Patent, WTO and R&D INTRODUCTION
Since the 1960s export promotion becomes the part of economic growth in many countries. For the growth of agriculture, industrial sector and easing the balance of payment situation diversification of exports is required. The pattern of economic development is related to structural changes in exports and expansion of export diversification worldwide. Developing countries realized that dependency on exports of primary products would hinder their development process. As a result, these countries shifted from low technology exports to medium and high technology exports (Samen, 2010). In spite of whether countries produce primary products or manufactured goods, it is the compatibility with world demand that
∗ Research Scholar, Centre for Economic Studies, Central University of Punjab, Bathinda. ∗∗ Assistant Professor, Centre for Economic Studies, Central University of Punjab, Bathinda. E-mail: [email protected]

118 BUSINESS ANALYST April 2016- September 2016
will determine the growth of country (Ismail, 2013). The picture of global maps of exports has changed much with the influx of high technology product from the developing countries. The remarkable change in the export pattern has led economists to question whether the achievement of high technology exports from developing countries is real or just a ‘statistical illusion’ (Srholec, 2010). It is an active signal that the emerging economies are actively involved in the global value chain and compete with the developed countries (Fu et. al., 2010). The trade of high technology goods provides information about the overall competitiveness and place of an economy within the global technology market (Tebaldi, 2011). For instance, Falk (2009) most of the developed countries are not participating in the export of high technology products due to the technological gap. At the one end of the spectrum are Korea and Singapore, which have the ability to design, manufacture and export high technology items. Malaysia is somewhere in the middle while Thailand and Philippines seem to be at the other end with the low capability (Mani and Romijin, 2004). Like other countries, India’s export growth is also associated with economic growth. To put its economy on a path of rapid and sustained growth, India embarked on a process of economic reform and continuous integration with the global economy in 1991 (Batra and Khan, 2005). The main purpose to launch the goal of economic reforms is that it would help to reach the new technology (Pohit and Basu, 2012). Although, India is progressing on the path of development, yet its export shares in the global market are still small, with a modest increase in export of medium and high- technology products (Nayak et. al., 2013). According to World Development- Indicators 2011, compiled by the World Bank, India’s high technology exports were 6.87 per cent of its manufactured exports compared to 9.72 percent in the case of Brazil, 25.81 percent in the case of China, 31.4 percent in the case of Israel & Japan and 43.39 and 45.16 percent in the case of Malaysia and Singapore (WDI, 2011). Some of the areas where India is making an impact are computer software, automobiles, and pharmaceuticals.
According to Euro Statistics (2011), the high-tech product list, based on the calculations of R&D intensity by groups of product (R&D expenditure/total sales) involves highly skilled workers, advanced technology, and high cost. The products are divided into nine categories, namely Aerospace, Computers/Office Machine, Electronic-telecommunications, Pharmacy, Scientific Instruments, Electrical Machinery, Chemistry, Nonelectrical Machinery, and Armament. Organization for Economic Cooperation and Development (OECD, 2005) has developed a four-way classification-high technology, medium technology, low-medium technology and low technology. The classification is based on the expenditure on research and development on the gross output and value added of different types of industries that produce goods for exports India’s pharmaceutical industry is one of the fastest growing segments of the Indian economy with an average annual growth rate of 14 percent during 2002-2005 (Green, 2007). The Pharmaceutical industry grew from mere US$ 0.3 billion turnovers in 1980 to about US$ 21.73 billion in 2009-10. The country ranks 3rd regarding the volume of production and 14th largest by value (Greece, 2007).
Vol. 37 No. 1 CHANGING PATTERN OF INDIA’S HIGH TECHNOLOGY 119
Objectives of the Study
1. To study the trends and growth of India’s high technology exports with the rest of the world since liberalization.
2. To study the composition and direction of high technology exports of pharmacy products of India with her two among the top export partners over the period of 1991 to 2012.
3. To analyze the Indian competitiveness and intra-industry trade of pharmaceutical products with her top two partners.
4. To study the issues of TRIPS with respect to India’s pharmaceuticals exports.
DATA AND METHODOLOGY
This section deals with different sources of data and methodology used in the study for analyzing the India’s high technology exports of Pharmaceutical products with USA and Russian Federation. Data Base
The study mainly covers the period of 12 years, i.e. 1991 to 2012. Keeping in mind the nature of study, secondary data have been taken from the following different sources:
1. Data for India high technology export performance have been collected from WITS for 1991-2013.
2. Data for different indices like Revealed Comparative Advantage, Revealed Symmetric Comparative Advantage and Grubel-Lloyd (G-L) index have been collected from WITS database.
3. Data related to R&D expenditure and export for different Indian companies has been selected from Prowess database published by Centre for Monitoring Indian Economy.
Methodology
Various trade indices have been calculated to assess the India’s performance of pharmaceutical exports with her top two exporting partners. Export Competitiveness
The degree of export specialization of India with the USA and Russian federation is calculated with the help of two indices, i.e. Balassa’s Revealed Comparative Advantage (RCA) and Revealed Symmetric Comparative Advantage (RSCA) for the average of five years i.e. 1991-1995, 1996-2000, 2001-2005, 2006-2010 and 2006-2012 for pharmaceutical products.

120 BUSINESS ANALYST April 2016- September 2016
Revealed Comparative Advantage Index
Balassa’s index (1965) of revealed comparative advantage (RCA) has been used to assess a country’s export potential. A variation of his formula was further interpreted by Donges and Riedel (1977); Browen (1983) and Vollrath (1991). The RCA indicates whether a country is in the process of extending the products in which it has export potential, as opposed to the situation in which the number of products that can have trade prospects with new partners. Countries with similar RCA profiles are unlikely to have high respective trade intensities unless intra-industry trade is involved. RCA measures, if estimated at high levels of product disaggregation, can focus attention on the other non-traditional products that might be successfully exported. The RCA index of the country i for the product j is often measured by the product’s share in the country’s exports in relation to its share in the world exports:
RCAij= (Xij/Xit) / (Xwj/Xwt)
Where Xij and Xwj are the values of country’s exports of product j and world exports of product j and where Xit and Xwt refer to the country’s total exports and total world exports. A value of less than unity implies that the country has a revealed comparative disadvantage in the product. Similarly, if the index exceeds unity, the country is said to have a revealed comparative advantage in the product. If the value is equal to one, the country’s specialization in a commodity is identical with the world specializing in that commodity (Balassa and Bauman, 1985). In the present study, RCA has been calculated for Indian pharmaceutical exports to USA and Russia Federation.
RCAij= (Xijb/Xitb) / (Xwjk/Xwt) Where,
RCAijb - India’s RCA in USA/Russia Xijb – India’s exports of commodity j to USA/Russia Xitb – Total exports of India to USA/Russia Xwjk – World’s exports of commodity j to USA/Russia Xwtk – Total exports of world to USA/Russia RCA suffers from the problem of asymmetry as the ‘pure’ RCA is basically not comparable on both sides of unity. A country is said to be under-specialized in a given sector if the values of index ranges from zero to one; while the value of the index ranges from one to infinity, if the country is specialized in that particular sector (Burange and Chanda, 2008). Dalum et al. (1998) recommended a methodology to make the index symmetric, and the new index is called ‘revealed symmetric comparative advantage’ (RSCA). Mathematically, it is: RSCA= (RCA-1) / (RCA+1)
The range of value lies between -1 and +1. Commodity is said to have a comparative advantage in its exports if the RSCA value is positive and vice versa.

Vol. 37 No. 1 CHANGING PATTERN OF INDIA’S HIGH TECHNOLOGY 121
Intra – Industry Trade (IIT)
Intra-industry trade arises if a country, in the same period, imports and exports similar types of goods or services. Similarity means goods or services taken from the same sector/industry. IIT allows a country to take advantage of larger markets. Most commonly used index to measure the IIT is Grubel- Lloyd (G-L) index. G-L Index computes the ratio of net exports in a commodity category to its total trade, i.e.
IITj=1- {Xij-Mij / (Xij+Mij)}
Where, Xij and Mij are country j’s exports and imports of industry i respectively. IITj=1 if trade in all industries is intra-industry (i.e. Xij=Mij for all i) and IITj=0 if trade in all industries is inter-industry (i.e. either Xj=0 or Mj=0 for all i). As Grubel and Lloyd (1975) point out, this measurement of IIT will be affected by the size of the overall trade imbalance of the country. The greater the imbalance, the more significant will be the share of net trade and smaller share of IIT (Bruhart, 1995; Stone and Lee, 1995). IIT is driven by economies of scale and commodity gains. By being engaged in IIT, a country can reduce the number of similar products it produces and benefit from scale economies and specialization. A higher IIT value suggests that these sources of gains are being exploited. It also indicates that the adjustment cost would be lower when compared to inter-industry trade in the process of trade expansion. It is based on the Grubel-Lloyd (G-L) formula; G-L index for bilateral trade is used to find out the inter- industry trade between India and USA and Russian Federation. It is a modified form used by Sahoo et. al., (2009). The formula is:
GLi=1-{|Xij-Mji|} / (Xij+Mji)
Where, GLi- G-L Index for India-USA and India Russian Federation Bilateral Trade; Xij-Exports of India’s pharmaceutical product to USA and Russian Federation; Mji- Imports of India’s pharmaceutical product from USA and Russian Federation; Compound Growth Rate: To calculate the compound growth rate for different indicators used in the study, the following formula has been used is Y= ABt. Where A and B are parameters, Y is the dependent variable, and t is time variable. The compound growth rate is equal to the estimated value of B, the
compound growth rate is equal to ∧∧
− BB 100. x )1( is estimated value of B. Selection of Indian Companies: Indian companies have been selected to compare the R and D expenditure and their exports from Prowess database. There are nearly 5000 manufacturing firms in Bombay Stock Exchange (BSE) which are filtered on the basis of two steps, first we excluded those companies which have zero or less than zero sales during any year of study period, secondly, there is the exclusion of all those firms which have nil foreign equity in any year of study period.
GROWTH AND PERFORMANCE OF INDIA’S HIGH TECHNOLOGY EXPORTS
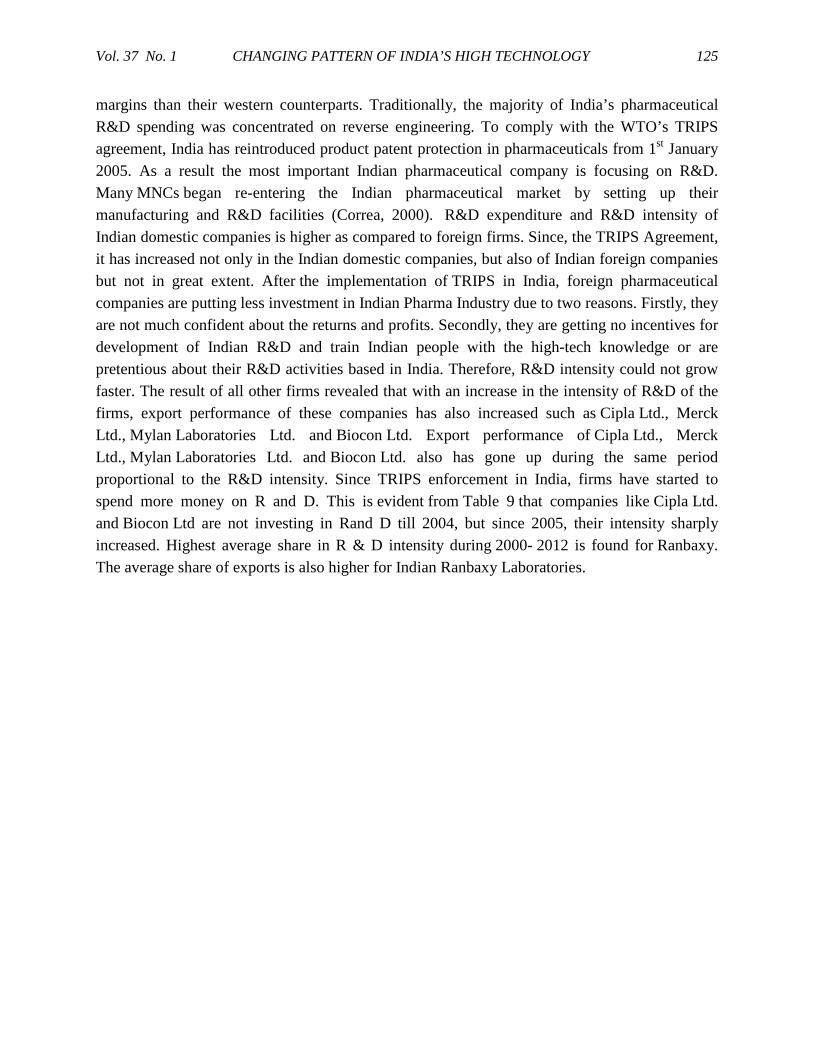
Table 1 depicts the growth and share of different components of India’s high technology exports to the World for the period of 1991 to 2012. The average percentage share of pharmacy i.e. 34.92
122 BUSINESS ANALYST April 2016- September 2016
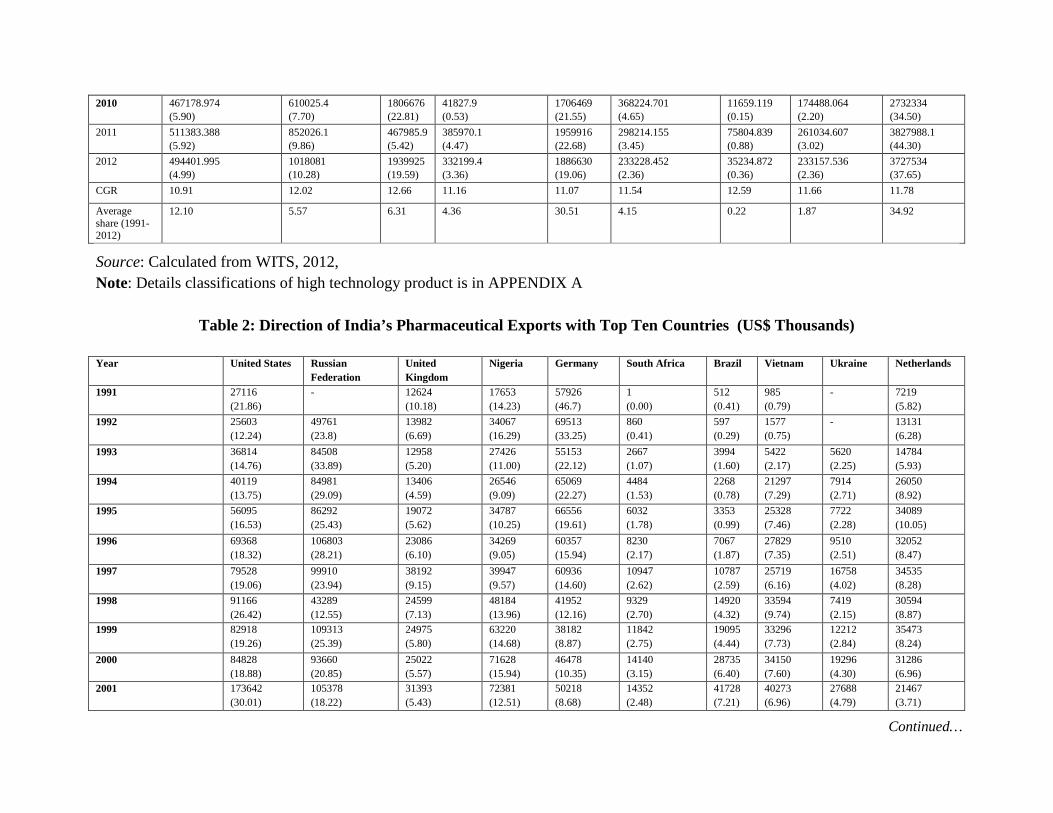
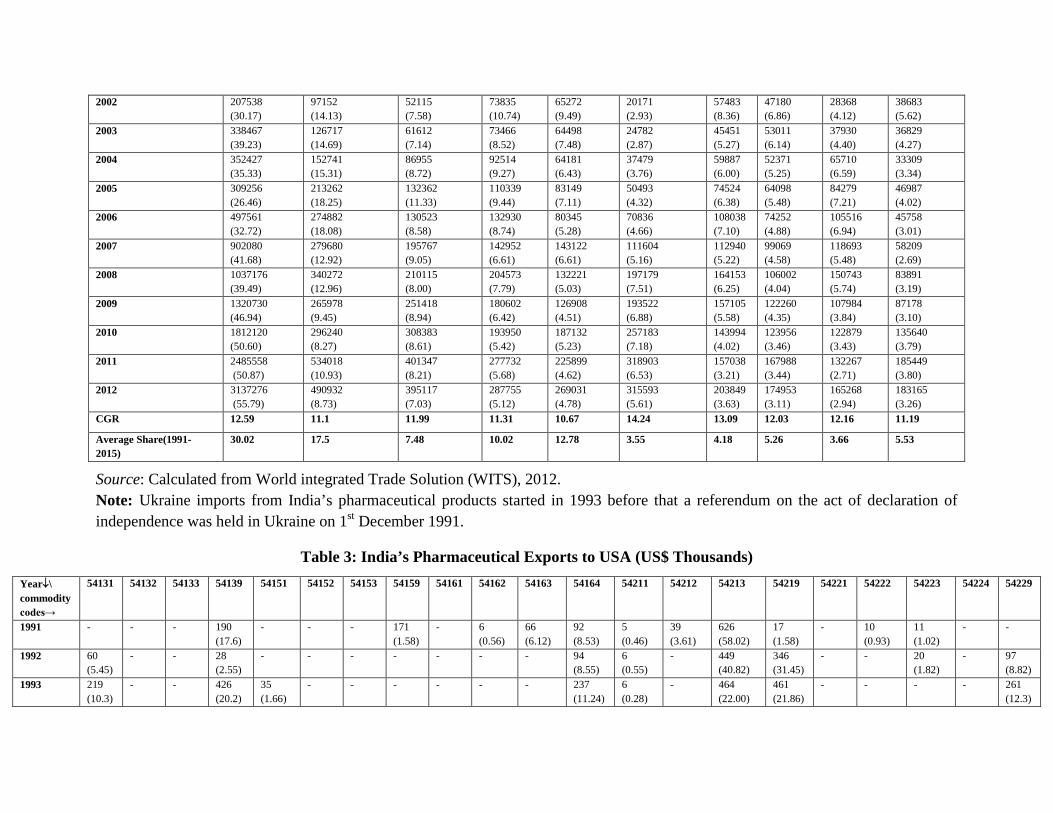
percent seem to be the highest, followed by chemistry (30.51 percent), computer office machines (12.10 percent), aerospace (6.31 percent), scientific instruments (5.57 percent), electronics tele-com’s (4.36 percent), non- electrical machinery (4.15 percent), electrical machinery (1.87 percent) and armaments (0.22 percent) during the whole study period. The compound growth rate in aerospace is found to be highest with 12.66 percent followed by armaments (12.59 percent), scientific instruments (12.02 percent), pharmacy (11.78 percent), electrical machinery (11.66 percent), non electrical machinery (11.54 percent), electronics tele-com’s (11.16 percent), chemistry (11.07 percent) and computer office machines (10.91 percent) during the study period. From the above description of the Table 1, pharmaceutical products seem to be most important in terms of value as well as size. Table 2 depicts the direction and volume of India’s pharmaceutical exports with its top ten exporting countries. United Kingdom seems to have the lowest variations in imports of India’s pharma products. On the other hand, the increasing share of USA in India’s pharma products reflects the better trade relations of USA with India. Thus, it is evident that USA is the top most exporting destinations of India’s pharmaceutical exports followed by Russian Federation with an average share of 30.30 percent and 17.5 percent respectively, in total exports since 1991 till 2012. Table 3 shows the India’s exports of pharmaceutical products to the USA for the period of 1991 to 2012. The compound growth rate is the highest of product ‘Insulin retail pack’ followed by ‘Cortisone derivatives’, ‘Streptomycin’s and their derivatives’, ‘Other hormones non retail’, ‘Insulin formulated and bulk’, ‘Antibiotics n.e.s retail’, ‘Penicillin/Strept retail’ and ‘Antibiotics n.e.s non retail’. Their compound growth rates found to be 19.06 percent, 18.42 percent, 16.60 percent, 15.93 percent, 15.49 percent, 14.82 percent, 14.60 percent and 13.61 percent respectively. The average share is the highest of product ‘Antibiotics n.e.s retail’ (33.40 percent) followed by ‘Penicillin/strept retail’ (19.00 percent), ‘Other antibiotics, bulk’ (8.76 percent) ‘Other hormones non retail’ (7.35 percent), ‘Antibiotics n.e.s non retail’ (6.61). These are important commodities in India’s exports to USA throughout the period. Table 4 portrays the India’s import values of pharmaceutical products from USA for the period of 1991 to 2012. The overall compound growth rate is found to be greater for ‘Pencillines/Strept retail’ with 14.26 percent, followed by ‘Hormone n.e.s retail pack’ (14.13 percent), ‘Antibiotics n.e.s non retail’ (12.94 percent annual growth) and ‘Glycosides and derivatives’ (12.90), ‘Insulin and salts’ (12.29), ‘Insulin retail pack’ (11.91), ‘Blood/Toxin/Cultures’ (11.54) and ‘Hormone n.e.s retail pack’ (11.30) during 1991 to 2012. This shows the changing important pattern of India pharmaceutical products from USA. Table 5 shows the India’s exports of pharmaceutical products to the Russian Federation (US$ thousand) from 1992 to 2012. The highest compound growth rate of exports is found for
Vol. 37 No. 1 CHANGING PATTERN OF INDIA’S HIGH TECHNOLOGY 123
‘Antisera/blood fracture/vaccine’ (13.38) followed by ‘Blood/Toxin/Cultures’ i.e. (13.15), ‘Glands etc. and extracts’ (12.26), ‘Streptomycin’s and derivatives’ (12.04), ‘Glycosides and derivatives’ (11.91), ‘Hormones ach retail pack’ (11.87) and ‘Penicillin/strept retail’ (11.73). The average share of exports is the highest of ‘Antibiotics n.e.s retail’ (26.00 percent) followed by ‘Antisera/blood fracture/vaccine’ (19.18 percent), ‘Hormone n.e.s retail pack’ (14.48 percent), ‘Insulin retail pack’ (13.28 percent), ‘Hormones ach retail pack’ (8.52 percent), ‘Penicillin/strept retail’ (5.13 percent) and ‘Blood/Toxin/Cultures’ (4.46 percent). Hence it is concluded from the table that India’s exports of pharma products are increasing, however the highest exports are of ‘Antisera/Blood fracture/Vaccine’. Table 6 depicts India’s imports of pharmaceutical products from Russia Federation during 1992 to 2012. The Compound Growth rate of Indian pharmaceutical imports from Russian Federation has been found the highest for ‘Glands etc. and extracts’ (26.93) followed by ‘blood/toxin/cultures’ (11.98) and ‘Other antibiotics, (bulk)’ (10.77). The average share of imports is the highest of ‘Other antibiotics, (bulk)’ (49.69 percent) followed by ‘Pencillines and derivatives’ (29.27 percent) and ‘Glands etc. and extracts’ (20.04 percent). And others have a very less average share in imports. ‘Blood/Toxin/Cultures’, ‘Antibiotics n.e.s retail’, ‘Insulin formulated, bulk’, ‘Other hormones non retail’, ‘Insulin retail pack’ and ‘Hormone n.e.s retail pack’ have specialization and their imports are less as compared to ‘Pencillines and derivatives’, ‘Other antibiotics (bulk)’ and ‘Glands etc. and derivatives’ respectively. It is clear from the above analysis that greater RSCA value with Russian Federation has been in the ‘Pencillines and derivatives’, ‘Penicillin non retail’, ‘Antibiotics n.e.s non retail’, ‘Antibiotic n.e.s retail’ and ‘Other hormones non retail’ throughout the study period.
TRADE COMPETITIVENESS OF INDIA WITH THE USA AND RUSSIAN FEDERATION
Table 7 showed India’s Revealed Comparative Advantage and revealed the symmetric comparative advantage in Pharmaceutical products with the United States of America and Russian Federation for the average of five years i.e. 1991-1995, 1996-2000, 2001-2005, 2006-2010 and 2006-2012 for pharmaceutical products. During 1991-1995, among 21 pharmaceutical products, India has the greatest RCA and RSCA with the USA in ‘Insulin and Its Salts’ (12.73 percent). During 1996-2000, the highest RCA of India with USA is found for Insulin formulated bulk (46.15 percent). Similarly, during the 2001-2005 ‘Other hormones nonretail’ have the highest revealed comparative advantage. During 2006-10, India has registered significant extent of competitive advantage for ‘Insulin formulated bulk’ i.e. 50.10 which is increased by 1.01 percent in 2006-12. It is clear that India has a greater power for ‘Insulin formulated bulk’ followed by ‘Penicillin nonretail’ and ‘other hormones nonretail’ throughout 2000-2012. The Table also shows India’s Revealed Comparative Advantage and

124 BUSINESS ANALYST April 2016- September 2016
RSCA in Pharmacy Sector with Russian Federation. In 1992-1995, India had greater RCA with Russian Federation in ‘Insulin formulated. Highest comparative advantage has accounted in ‘Other hormones nonretail’ (189.58) in the 2006-2010. While in 2006-2012, India again registered significant extent of competitive advantage for ‘Other hormones nonretail’. From the above description of Table 7, highest comparative advantage of India with Russian Federation is in the ‘Insulin formulated bulk’ during 1992-2005.
Intra-Industry Trade Index (IIT)
Table 8 highlight values of intra-industry trade measured by the GL index between India and USA, India and Russian Federation for the average of 1991-1995, 1996 -2000, 2001-2005 and 2006- 2012. During 1991-1995, the level of intra-industry trade shows that it is the highest for ‘Hormones n.e.s retail pack’. ‘In 2006-2012, it is found to be highest for ‘other antibiotics (bulk).' During 1992-1995, intra-industry trade between India and Russia Federation is found zero for other hormones/devices, etc., glands, etc. and extracts, Antibiotic n.e.s retail, retail insulin pack, other hormones nonretail and hormone n.e.s retail pack as for these commodities India does not depend on Russia. It is found to be the highest for ‘Pencil lines and derivatives.' During 2006-2012 largest intra-industry trade between India and Russian Federation is found in ‘Other Antibiotic bulk.'
TRIPS ISSUES AND INDIAN PHARMACEUTICAL EXPORTS
India has a competitive strength in the export of pharmaceutical products which is one of the categories of the high technology sector. Due to many factors, such as an increase in their production, their low prices at the international market, an increase in their R&D expenditure, etc. India has a unique position in the pharmaceutical industry in the world as especially in the production of generic medicines, which offer drugs at lower prices. For all this, credit goes to the India Patents Act that of 1970 (Deolalikar & Evenson, 1989). The pharmaceutical industry is one of the world’s most research-intensive industries, which is making enormous contributions to health care. To offer incentives to innovators to undertake research, many countries, especially the developed ones a tradition of strong patent protection. The patent system has become more prevalent after the establishment of Trade-Related Intellectual Property Rights (TRIPS). The Agreement of the World Trade Organization (WTO), made it compulsory for WTO members to include drugs/medicines in their regime for product and process patents (Nair, 2008). India signed the TRIPS Agreement in April 1994. In March 2005, India fulfilled the amendment of the Patent Act of 1970 to meet the terms of the TRIPS Agreement. It introduced product patents for drugs, foods, and chemical product. An immediate consequence of the TRIPS agreement was to be a sharp increase in the prices of invented drugs (Ramani & Maria, 2005). After 2005, India’s leading pharmaceutical companies recognized that if they want to survive as global players they require R&D capabilities. On the other side pharmaceutical companies also work at lower profit
Vol. 37 No. 1 CHANGING PATTERN OF INDIA’S HIGH TECHNOLOGY 125
margins than their western counterparts. Traditionally, the majority of India’s pharmaceutical R&D spending was concentrated on reverse engineering. To comply with the WTO’s TRIPS agreement, India has reintroduced product patent protection in pharmaceuticals from 1st January 2005. As a result the most important Indian pharmaceutical company is focusing on R&D. Many MNCs began re-entering the Indian pharmaceutical market by setting up their manufacturing and R&D facilities (Correa, 2000). R&D expenditure and R&D intensity of Indian domestic companies is higher as compared to foreign firms. Since, the TRIPS Agreement, it has increased not only in the Indian domestic companies, but also of Indian foreign companies but not in great extent. After the implementation of TRIPS in India, foreign pharmaceutical companies are putting less investment in Indian Pharma Industry due to two reasons. Firstly, they are not much confident about the returns and profits. Secondly, they are getting no incentives for development of Indian R&D and train Indian people with the high-tech knowledge or are pretentious about their R&D activities based in India. Therefore, R&D intensity could not grow faster. The result of all other firms revealed that with an increase in the intensity of R&D of the firms, export performance of these companies has also increased such as Cipla Ltd., Merck Ltd., Mylan Laboratories Ltd. and Biocon Ltd. Export performance of Cipla Ltd., Merck Ltd., Mylan Laboratories Ltd. and Biocon Ltd. also has gone up during the same period proportional to the R&D intensity. Since TRIPS enforcement in India, firms have started to spend more money on R and D. This is evident from Table 9 that companies like Cipla Ltd. and Biocon Ltd are not investing in Rand D till 2004, but since 2005, their intensity sharply increased. Highest average share in R & D intensity during 2000- 2012 is found for Ranbaxy. The average share of exports is also higher for Indian Ranbaxy Laboratories.
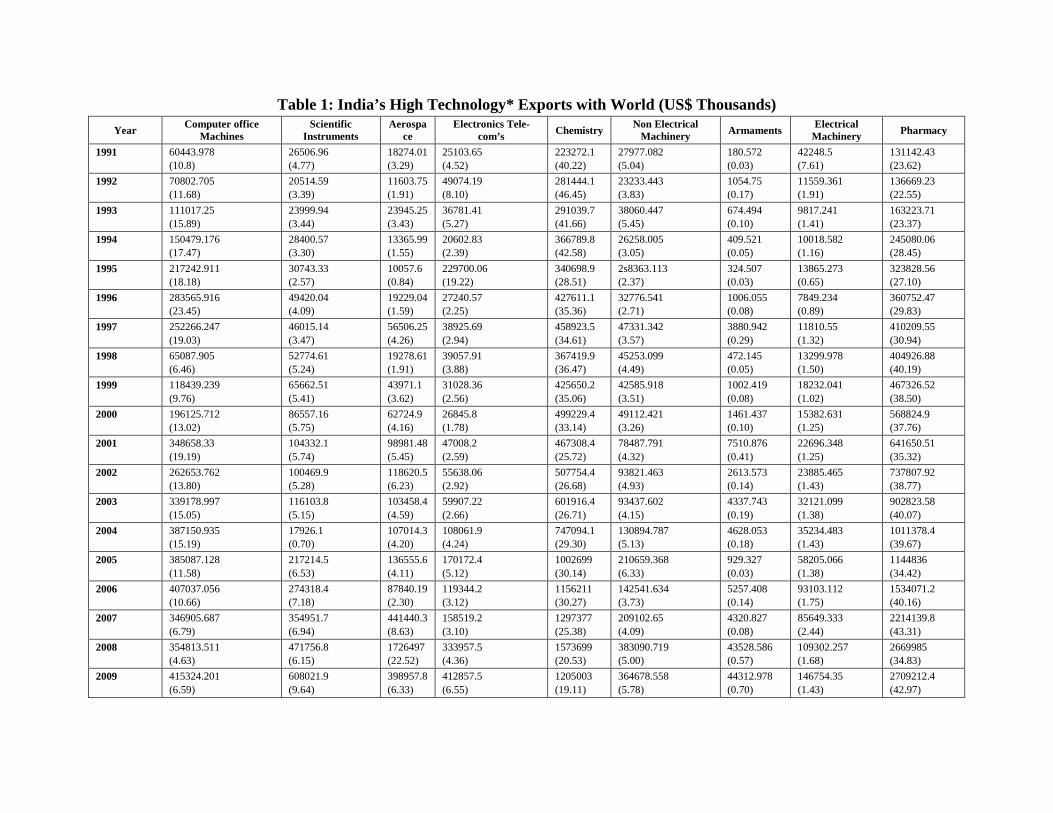
Table 1: India’s High Technology* Exports with World (US$ Thousands) Year Computer office
Machines Scientific
Instruments Aerospa
ce Electronics Tele-
com’s Chemistry Non Electrical Machinery Armaments Electrical
Machinery Pharmacy
1991 60443.978 (10.8)
26506.96 (4.77)
18274.01 (3.29)
25103.65 (4.52)
223272.1 (40.22)
27977.082 (5.04)
180.572 (0.03)
42248.5 (7.61)
131142.43 (23.62)
1992 70802.705 (11.68)
20514.59 (3.39)
11603.75 (1.91)
49074.19 (8.10)
281444.1 (46.45)
23233.443 (3.83)
1054.75 (0.17)
11559.361 (1.91)
136669.23 (22.55)
1993 111017.25 (15.89)
23999.94 (3.44)
23945.25 (3.43)
36781.41 (5.27)
291039.7 (41.66)
38060.447 (5.45)
674.494 (0.10)
9817.241 (1.41)
163223.71 (23.37)
1994 150479.176 (17.47)
28400.57 (3.30)
13365.99 (1.55)
20602.83 (2.39)
366789.8 (42.58)
26258.005 (3.05)
409.521 (0.05)
10018.582 (1.16)
245080.06 (28.45)
1995 217242.911 (18.18)
30743.33 (2.57)
10057.6 (0.84)
229700.06 (19.22)
340698.9 (28.51)
2s8363.113 (2.37)
324.507 (0.03)
13865.273 (0.65)
323828.56 (27.10)
1996 283565.916 (23.45)
49420.04 (4.09)
19229.04 (1.59)
27240.57 (2.25)
427611.1 (35.36)
32776.541 (2.71)
1006.055 (0.08)
7849.234 (0.89)
360752.47 (29.83)
1997 252266.247 (19.03)
46015.14 (3.47)
56506.25 (4.26)
38925.69 (2.94)
458923.5 (34.61)
47331.342 (3.57)
3880.942 (0.29)
11810.55 (1.32)
410209.55 (30.94)
1998 65087.905 (6.46)
52774.61 (5.24)
19278.61 (1.91)
39057.91 (3.88)
367419.9 (36.47)
45253.099 (4.49)
472.145 (0.05)
13299.978 (1.50)
404926.88 (40.19)
1999 118439.239 (9.76)
65662.51 (5.41)
43971.1 (3.62)
31028.36 (2.56)
425650.2 (35.06)
42585.918 (3.51)
1002.419 (0.08)
18232.041 (1.02)
467326.52 (38.50)
2000 196125.712 (13.02)
86557.16 (5.75)
62724.9 (4.16)
26845.8 (1.78)
499229.4 (33.14)
49112.421 (3.26)
1461.437 (0.10)
15382.631 (1.25)
568824.9 (37.76)
2001 348658.33 (19.19)
104332.1 (5.74)
98981.48 (5.45)
47008.2 (2.59)
467308.4 (25.72)
78487.791 (4.32)
7510.876 (0.41)
22696.348 (1.25)
641650.51 (35.32)
2002 262653.762 (13.80)
100469.9 (5.28)
118620.5 (6.23)
55638.06 (2.92)
507754.4 (26.68)
93821.463 (4.93)
2613.573 (0.14)
23885.465 (1.43)
737807.92 (38.77)
2003 339178.997 (15.05)
116103.8 (5.15)
103458.4 (4.59)
59907.22 (2.66)
601916.4 (26.71)
93437.602 (4.15)
4337.743 (0.19)
32121.099 (1.38)
902823.58 (40.07)
2004 387150.935 (15.19)
17926.1 (0.70)
107014.3 (4.20)
108061.9 (4.24)
747094.1 (29.30)
130894.787 (5.13)
4628.053 (0.18)
35234.483 (1.43)
1011378.4 (39.67)
2005 385087.128 (11.58)
217214.5 (6.53)
136555.6 (4.11)
170172.4 (5.12)
1002699 (30.14)
210659.368 (6.33)
929.327 (0.03)
58205.066 (1.38)
1144836 (34.42)
2006 407037.056 (10.66)
274318.4 (7.18)
87840.19 (2.30)
119344.2 (3.12)
1156211 (30.27)
142541.634 (3.73)
5257.408 (0.14)
93103.112 (1.75)
1534071.2 (40.16)
2007 346905.687 (6.79)
354951.7 (6.94)
441440.3 (8.63)
158519.2 (3.10)
1297377 (25.38)
209102.65 (4.09)
4320.827 (0.08)
85649.333 (2.44)
2214139.8 (43.31)
2008 354813.511 (4.63)
471756.8 (6.15)
1726497 (22.52)
333957.5 (4.36)
1573699 (20.53)
383090.719 (5.00)
43528.586 (0.57)
109302.257 (1.68)
2669985 (34.83)
2009 415324.201 (6.59)
608021.9 (9.64)
398957.8 (6.33)
412857.5 (6.55)
1205003 (19.11)
364678.558 (5.78)
44312.978 (0.70)
146754.35 (1.43)
2709212.4 (42.97)
2010 467178.974 (5.90)
610025.4 (7.70)
1806676 (22.81)
41827.9 (0.53)
1706469 (21.55)
368224.701 (4.65)
11659.119 (0.15)
174488.064 (2.20)
2732334 (34.50)
2011 511383.388 (5.92)
852026.1 (9.86)
467985.9 (5.42)
385970.1 (4.47)
1959916 (22.68)
298214.155 (3.45)
75804.839 (0.88)
261034.607 (3.02)
3827988.1 (44.30)
2012 494401.995 (4.99)
1018081 (10.28)
1939925 (19.59)
332199.4 (3.36)
1886630 (19.06)
233228.452 (2.36)
35234.872 (0.36)
233157.536 (2.36)
3727534 (37.65)
CGR 10.91 12.02 12.66 11.16 11.07 11.54 12.59 11.66 11.78
Average share (1991-2012)
12.10 5.57 6.31 4.36 30.51 4.15 0.22 1.87 34.92
Source: Calculated from WITS, 2012, Note: Details classifications of high technology product is in APPENDIX A
Table 2: Direction of India’s Pharmaceutical Exports with Top Ten Countries (US$ Thousands)
Year United States Russian Federation
United Kingdom
Nigeria Germany South Africa Brazil Vietnam Ukraine Netherlands
1991 27116 (21.86)
- 12624 (10.18)
17653 (14.23)
57926 (46.7)
1 (0.00)
512 (0.41)
985 (0.79)
- 7219 (5.82)
1992 25603 (12.24)
49761 (23.8)
13982 (6.69)
34067 (16.29)
69513 (33.25)
860 (0.41)
597 (0.29)
1577 (0.75)
- 13131 (6.28)
1993 36814 (14.76)
84508 (33.89)
12958 (5.20)
27426 (11.00)
55153 (22.12)
2667 (1.07)
3994 (1.60)
5422 (2.17)
5620 (2.25)
14784 (5.93)
1994 40119 (13.75)
84981 (29.09)
13406 (4.59)
26546 (9.09)
65069 (22.27)
4484 (1.53)
2268 (0.78)
21297 (7.29)
7914 (2.71)
26050 (8.92)
1995 56095 (16.53)
86292 (25.43)
19072 (5.62)
34787 (10.25)
66556 (19.61)
6032 (1.78)
3353 (0.99)
25328 (7.46)
7722 (2.28)
34089 (10.05)
1996 69368 (18.32)
106803 (28.21)
23086 (6.10)
34269 (9.05)
60357 (15.94)
8230 (2.17)
7067 (1.87)
27829 (7.35)
9510 (2.51)
32052 (8.47)
1997 79528 (19.06)
99910 (23.94)
38192 (9.15)
39947 (9.57)
60936 (14.60)
10947 (2.62)
10787 (2.59)
25719 (6.16)
16758 (4.02)
34535 (8.28)
1998 91166 (26.42)
43289 (12.55)
24599 (7.13)
48184 (13.96)
41952 (12.16)
9329 (2.70)
14920 (4.32)
33594 (9.74)
7419 (2.15)
30594 (8.87)
1999 82918 (19.26)
109313 (25.39)
24975 (5.80)
63220 (14.68)
38182 (8.87)
11842 (2.75)
19095 (4.44)
33296 (7.73)
12212 (2.84)
35473 (8.24)
2000 84828 (18.88)
93660 (20.85)
25022 (5.57)
71628 (15.94)
46478 (10.35)
14140 (3.15)
28735 (6.40)
34150 (7.60)
19296 (4.30)
31286 (6.96)
2001 173642 (30.01)
105378 (18.22)
31393 (5.43)
72381 (12.51)
50218 (8.68)
14352 (2.48)
41728 (7.21)
40273 (6.96)
27688 (4.79)
21467 (3.71)
Continued…
Note: Ukraine imports from India’s pharmaceutical products started in 1993 before that a referendum on the act of declaration of independence was held in Ukraine on 1st December 1991.
Table 3: India’s Pharmaceutical Exports to USA (US$ Thousands)
Year↓\ commodity codes→
54131 54132 54133 54139 54151 54152 54153 54159 54161 54162 54163 54164 54211 54212 54213 54219 54221 54222 54223 54224 54229
1991 - - - 190 (17.6)
- - - 171 (1.58)
- 6 (0.56)
66 (6.12)
92 (8.53)
5 (0.46)
39 (3.61)
626 (58.02)
17 (1.58)
- 10 (0.93)
11 (1.02)
- -
1992 60 (5.45)
- - 28 (2.55)
- - - - - - - 94 (8.55)
6 (0.55)
- 449 (40.82)
346 (31.45)
- - 20 (1.82)
- 97 (8.82)
1993 219 (10.3)
- - 426 (20.2)
35 (1.66)
- - - - - - 237 (11.24)
6 (0.28)
- 464 (22.00)
461 (21.86)
- - - - 261 (12.3)
2002 207538 (30.17)
97152 (14.13)
52115 (7.58)
73835 (10.74)
65272 (9.49)
20171 (2.93)
57483 (8.36)
47180 (6.86)
28368 (4.12)
38683 (5.62)
2003 338467 (39.23)
126717 (14.69)
61612 (7.14)
73466 (8.52)
64498 (7.48)
24782 (2.87)
45451 (5.27)
53011 (6.14)
37930 (4.40)
36829 (4.27)
2004 352427 (35.33)
152741 (15.31)
86955 (8.72)
92514 (9.27)
64181 (6.43)
37479 (3.76)
59887 (6.00)
52371 (5.25)
65710 (6.59)
33309 (3.34)
2005 309256 (26.46)
213262 (18.25)
132362 (11.33)
110339 (9.44)
83149 (7.11)
50493 (4.32)
74524 (6.38)
64098 (5.48)
84279 (7.21)
46987 (4.02)
2006 497561 (32.72)
274882 (18.08)
130523 (8.58)
132930 (8.74)
80345 (5.28)
70836 (4.66)
108038 (7.10)
74252 (4.88)
105516 (6.94)
45758 (3.01)
2007 902080 (41.68)
279680 (12.92)
195767 (9.05)
142952 (6.61)
143122 (6.61)
111604 (5.16)
112940 (5.22)
99069 (4.58)
118693 (5.48)
58209 (2.69)
2008 1037176 (39.49)
340272 (12.96)
210115 (8.00)
204573 (7.79)
132221 (5.03)
197179 (7.51)
164153 (6.25)
106002 (4.04)
150743 (5.74)
83891 (3.19)
2009 1320730 (46.94)
265978 (9.45)
251418 (8.94)
180602 (6.42)
126908 (4.51)
193522 (6.88)
157105 (5.58)
122260 (4.35)
107984 (3.84)
87178 (3.10)
2010 1812120 (50.60)
296240 (8.27)
308383 (8.61)
193950 (5.42)
187132 (5.23)
257183 (7.18)
143994 (4.02)
123956 (3.46)
122879 (3.43)
135640 (3.79)
2011 2485558 (50.87)
534018 (10.93)
401347 (8.21)
277732 (5.68)
225899 (4.62)
318903 (6.53)
157038 (3.21)
167988 (3.44)
132267 (2.71)
185449 (3.80)
2012 3137276 (55.79)
490932 (8.73)
395117 (7.03)
287755 (5.12)
269031 (4.78)
315593 (5.61)
203849 (3.63)
174953 (3.11)
165268 (2.94)
183165 (3.26)
CGR 12.59 11.1 11.99 11.31 10.67 14.24 13.09 12.03 12.16 11.19
Average Share(1991-2015)
30.02 17.5 7.48 10.02 12.78 3.55 4.18 5.26 3.66 5.53
Source: Calculated from World integrated Trade Solution (WITS), 2012.

1994 109 (2.34)
- - 426 (9.14)
18 (0.39)
- - - - 24 (0.51)
205 (4.40)
261 (5.60)
24 (0.51)
718 (15.40)
1485 (31.86)
1019 (21.86)
- 104 (2.23)
- - 268 (5.75)
1995 653 (9.22)
- - 813 (11.4)
- - - 28 (0.40)
- 209 (2.95)
566 (7.99)
289 (4.08)
27 (0.28)
378 (5.33)
2504 (35.34)
1489 (21.01)
- 81 (1.14)
49 (0.69)
- -
1996 1175 (12.0)
- - 1474 (15.0)
- - 21 (0.21)
70 (0.71)
- 110 (1.12)
789 (8.06)
248 (2.53)
45 (0.46)
749 (7.65)
2870 (29.30)
1827 (18.65)
20 (0.20)
28 (0.29)
- - 369 (3.77)
1997 239 (3.37)
- 66 (0.93)
701 (9.87)
- - - 450 (6.34)
- 717 (10.1)
1033 (14.55)
408 (5.75)
692 (9.75)
12 (0.17)
1187 (16.72)
1433 (20.18)
- 11 (0.15)
- - 152 (2.14)
1998 673 (6.48)
- 11 (0.11)
1466 (14.1)
- 253 (2.44)
- 92 (0.89)
- 936 (9.01)
716 (6.89)
252 (2.43)
142 (1.37)
- 2213 (21.30)
3158 (30.40)
- 71 (0.68)
1 (0.01)
- 404 (3.89)
1999 1066 (9.96)
- 176 (1.64)
1726 (16.1)
- - 8 (0.07)
202 (1.89)
125 (1.17)
117 (3.31)
951 (8.89)
5 (0.05)
- - 1555 (14.53)
4664 (43.59)
20 (0.19)
20 (0.19)
- - 65 (0.61)
2000 752 (3.39)
3 (0.00)
66 (0.30)
389 (1.75)
- - - 512 (2.31)
1154 (5.20)
735 (5.20)
1399 (6.30)
13 (0.06)
60 (0.27)
3 (0.01)
2891 (13.03)
7966 (35.90)
- 296 (1.33)
5950 (26.8)
- -
2001 1456 (2.21)
10 (0.01)
30 (0.05)
2424 (3.69)
- - 5 (0.01)
1443 (2.20)
3672 (5.59)
183 (5.59)
1099 (1.67)
21 (0.03)
485 (0.74)
0 6732 (10.24)
8014 (12.19)
- 38069 (57.9)
2 (0.00)
- 2095 (3.19)
2002 213 (3.41)
41 (0.02)
126 (0.20)
5697 (9.12)
- 5 (0.01)
16 (0.03)
3158 (5.05)
583 (0.93)
158 (0.93)
2275 (3.64)
179 (0.29)
1727 (2.76)
14158 (22.66)
9026 (14.44)
20389 (32.63)
19 (0.03)
225 (0.36)
0 - 2581 (4.13)
2003 1026 (1.16)
1 (0.07)
95 (0.11)
7886 (8.90)
36 (0.04)
- 73 (0.08)
409 (0.46)
572 (0.65)
916 (0.65)
999 (1.13)
75 (0.08)
322 (0.36)
20098 (22.69)
10279 (11.61)
38756 (43.76)
8 (0.01)
386 (4.37)
1540 (1.74)
- 1610 (1.82)
2004 1333 (1.10)
0 (0.00)
15 (0.01)
4084 (3.37)
1130 (0.93)
- 34 (0.03)
706 (0.58)
238 (0.20)
812 (0.20)
3115 (2.57)
13 (0.01)
2481 (2.05)
42954 (35.46)
15426 (12.73)
23877 (19.71)
0 (0.00)
16291 (13.45)
7910 (6.53)
- 730 (0.60)
2005 2101(1.24)
- - 10542(6.23)
485(0.29)
4(0.0) 170(0.10)
2208(0.23)
388(1.04)
1754(.80)
1362(.0.01)
16(2.63)
4443(2.63)
21404(12.65)
20870(12.33)
41105(24.29)
82(0.05)
3808(2.25)
58456(34.5)
- -
2006 2031 (1.12)
3 (0.00)
- 9687 (5.35)
98 (0.05)
6 (0.00)
853 (1.21)
2190 (0.07)
135 (0.17)
313 (0.42)
758 (0.07)
134 (0.14)
250 (0.14)
9960 (5.50)
39780 (21.98)
94504 (52.21)
12 (0.01)
13965 (7.72)
4508 (2.49)
- 1813 (1.00)
2007 10292 (2.62)
- - 16362 (4.16)
- 37 (0.01)
37 (0.01)
1480 (0.34)
1353 (0.17)
666 (0.71)
2782 (0.07)
292 (0.53)
2081 (0.53)
14431 (3.67)
46976 (11.94)
235654 (59.89)
161 (0.04)
51110 (13)
4146 (1.05)
- 5629 (1.43)
2008 8440 (2.23)
424 (0.11)
27 (0.01)
11296 (2.99)
604 (0.16)
76 (0.02)
486 (0.13)
3717 (0.16)
592 (0.32)
1219 (0.23)
853 (0.06)
241 (1.23)
4650 (1.23)
20375 (5.39)
37975 (10.05)
182112 (48.20)
1784 (0.47)
81889 (21.7)
12346 (3.27)
- 8720 (2.31)
2009 64069 (14.8)
37 (0.01)
176 (0.04)
18022 (4.16)
450 (0.10)
- 2897 (0.67)
1242 (0.04)
165 (0.58)
2531 (0.21)
889 (1.57)
6804 (0.91)
3944 (0.91)
5434 (1.26)
14322 (3.31)
195693 (45.23)
4458 (1.03)
82538 (19.0)
18008 (4.16)
- 11026 (2.55)
2010 33405 (8.33)
219 (0.05)
11 (0.00)
47685 (11.9)
10 (0.0)
4 (0.00)
8668 (2.16)
799 (0.12)
466 (0.57)
2302 (0.07)
286 (2.14)
8585 (1.78)
7153 (1.78)
10938 (2.73)
28641 (7.14)
173119 (43.17)
897 (0.22)
40189 (10.0)
31436 (7.84)
- 6205 (1.55)
2011 21363 (3.97)
131 (0.02)
606 (0.11)
47125 (8.75)
7 (0.0)
- 9426 (1.75)
7233 (0.10)
558 (1.15)
6177 (0.42)
2264 (0.46)
2494 (1.69)
9091 (1.69)
5302 (0.98)
50368 (9.36)
296387 (55.06)
242 (0.04)
21722 (4.03)
51876 (9.64)
28 (0.0)
5940 (1.10)
2012 8789 (1.65)
299 (0.06)
376 (0.07)
32647 (6.14)
4036 (0.76)
0 (0.00)
14787 (0.67)
3560 (0.77)
4113 (4.82)
25599 (0.18)
962 (0.40)
2137 (0.99)
5276 (0.99)
1167 (0.22)
52805 (9.94)
276202 (51.99)
374 (0.07)
4363 (0.82)
58456 (11.0)
2 (0.0)
35357 (6.65)
CGR 13.08 16.60 11.16 13.34 11.41 8.43 18.42 12.96 10.32 13.01 10.73 11.33 14.60 13.61 12.65 14.82 15.49 15.93 19.06 0.71 13.53 Share 4.84 0.02 0.16 8.76 0.20 0.11 0.39 1.31 0.71 1.81 3.42 2.46 1.36 6.61 19.00 33.40 0.11 7.35 5.12 0.00 2.89
Source: Calculated from World integrated Trade Solution (WITS), 2012.

Table 4: India’s Pharmaceutical Imports from USA (US$ Thousands)
Year↓\ commodity codes→
54131 54132 54133 54139 54151 54152 54153 54159 54161 54162 54163 54164 54211 54212 54213 54219 54221 54222 54223 54224 54229
1991 3056 (18.25)
- 55 (0.33)
7174 (42.85)
92 (0.55)
1 (0.01)
359 (2.14)
1326 (7.92)
2 (0.01)
115 (0.69)
378 (2.26)
289 (1.73)
2 (0.01)
169 (1.01)
8 (0.05)
201 (1.20)
364 (2.17)
3031 (18.10)
0 (0.00)
119 (0.71)
2 (0.01)
1992 676 (3.31)
58 (0.28)
146 (0.71)
10894 (53.34)
- 44 (0.22)
2587 (12.67)
2204 (10.79)
3 (0.01)
121 (0.59)
2822 (13.82)
394 (1.93)
49 (0.24)
46 (0.23)
- 40 (0.20)
7 (0.03)
38 (0.19)
3 (0.01)
193 (0.94)
100 (0.49)
1993 3185 (17.23)
- - 7661 (41.45)
279 (1.51)
- 2485 (13.44)
3251 (17.59)
16 (0.09)
13 (0.07)
928 (5.02)
322 (1.74)
17 (0.09)
113 (0.61)
22 (0.12)
2 (0.01)
- 87 (0.47)
- 95 (0.51)
7 (0.04)
1994 2518 (11.44)
- 3 (0.01)
13258 (60.23)
204 (0.93)
- 1307 (5.94)
2689 (12.22)
33 (0.15)
36 (0.16)
891 (4.05)
242 (1.10)
115 (0.52)
93 (0.42)
432 (1.96)
16 (0.07)
- 25 (0.11)
- 42 (0.19)
107 (0.49)
1995 3238 (8.45)
126 (0.33)
46 (0.12)
11607 (30.30)
340 (0.89)
- 1554 (4.06)
2155 (5.62)
100 (0.26)
25 (0.07)
1675 (4.37)
16563 (43.23)
- 35 (0.09)
146 (0.38)
541 (1.41)
- 60 (0.16)
61 (0.16)
- 41 (0.11)
1996 3460 (19.37)
204 (1.14)
7 (0.04)
8475 (47.46)
1253 (7.02)
- 360 (2.02)
1669 (9.35)
5 (0.03)
6 (0.03)
1392 (7.79)
539 (3.02)
- 1 (0.01)
63 (0.35)
417 (2.33)
1 (0.01)
- - - 7 (0.04)
1997 3693 (11.11)
5 (0.02)
29 (0.09)
15279 (45.96)
1479 (4.45)
- 780 (2.35)
4607 (13.86)
55 (0.17)
36 (0.11)
3902 (11.74)
1983 (5.92)
11 (0.03)
15 (0.05)
34 (0.10)
1042 (3.13)
- 12 (0.04)
127 (0.38)
- 157 (0.47)
1998 2223 (7.48)
- - 20076 (67.58)
- - 262 (0.88)
2817 (9.48)
38 (0.13)
43 (0.14)
2835 (9.54)
616 (2.07)
- - 15 (0.05)
215 (0.72)
- 450 (1.51)
59 (0.20)
- 60 (0.20)
1999 1079 (5.01)
15 (0.07)
43 (0.20)
13585 (63.06)
433 (2.01)
1 (0.00)
625 (2.90)
2965 (13.76)
198 (0.92)
77 (0.36)
1145 (5.31)
971 (4.51)
5 (0.02)
- 353 (1.64)
26 (0.12)
2 (0.01)
10 (0.05)
- - 10 (0.05)
2000 1065 (5.76)
0 34 (0.18)
10425 (56.38)
102 (0.55)
0 93 (0.50)
2152 (11.46)
65 (0.35)
41 (0.22)
1575 (8.52)
1342 (7.26)
- - 653 (3.53)
873 (4.72)
1 (0.01)
9 (0.05)
2 (0.01)
- 58 (0.31)
2001 240 (1.30)
4 (0.02)
0 9965 (53.87)
1266 (6.84)
- 135 (0.73)
1980 (10.70)
33 (0.18)
71 (0.38)
1860 (10.06)
1856 (10.23)
12 (0.06)
- 477 (2.58)
230 (1.24)
- 4 (0.02)
- - 365 (1.97)
2002 1631 (5.35)
- 18 (0.06)
14072 (46.16)
123 (0.40)
- - 3730 (12.24)
81 (0.27)
183 (0.60)
6947 (22.79)
1753 (5.75)
5 (0.02)
- 1677 (5.50)
103 (0.34)
- 34 (0.11)
9 (0.03)
- 117 (0.38)
2003 1127 (2.79)
0 0 22611 (56.00)
3715 (9.20)
- 904 (2.24)
3602 (8.92)
157 (0.39)
1 (0.00)
3977 (9.85)
867 (2.15)
2 (0.00)
- 1504 (3.72)
74 (0.18)
3 (0.01)
254 (0.63)
- 215 (0.53)
1367 (3.39)
2004 261 (0.60)
3 (0.01)
0 23781 (55.01)
4811 (11.13)
1 (0.00)
1119 (2.59)
1747 (4.04)
586 (1.36)
81 (0.19)
5444 (12.59)
2591 (5.99)
11 (0.03)
1 (0.14)
1779 (4.12)
347 (0.80)
4 (0.01)
266 (0.62)
0 - 394 (0.91)
2005 795 (1.51)
1 (0.00)
0 25750 (48.90)
3387 (6.43)
3 (0.01)
1477 (2.80)
1530 (2.91)
1040 (1.98)
30 (0.06)
8531 (16.20)
4935 (9.37)
9 (0.02)
75 (0.22)
1995 (3.79)
904 (1.72)
- 566 (1.07)
- 106 (0.20)
1523 (2.89)
2006 13 (0.02)
3 (0.00)
0 17912 (28.60)
5691 (9.09)
5 (0.01)
570 (0.91)
994 (1.59)
386 (0.62)
6 (0.01)
25836 (41.25)
3798 (6.06)
27 (0.04)
136 (0.01)
4307 (6.88)
1591 (2.54)
- 203 (0.32)
69 (0.11)
304 (0.49)
787 (1.26)
2007 8 (0.01)
2 (0.00)
1 (0.00)
41393 (43.60)
9969 (10.50)
- 476 (0.50)
1000 (1.05)
277 (0.29)
272 (0.29)
29585 (31.16)
2788 (2.94)
169 (0.18)
5 (4.25)
5123 (5.40)
1995 (2.10)
- 299 (0.31)
70 (0.07)
85 (0.09)
1430 (1.51)
2008 472 (0.38)
9 (0.01)
64 (0.05)
48671 (39.36)
4352 (3.51)
2 (0.00)
1166 (0.94)
708 (0.57)
376 (0.30)
666 (0.54)
40196 (32.51)
5081 (4.11)
537 (0.43)
5250 (0.01)
6074 (4.91)
4418 (3.57)
- 958 (0.77)
554 (0.45)
- 4104 (3.32)

2009 208 (0.14)
9 (0.01)
6 (0.00)
47276 (31.29)
8708 (5.76)
- 1596 (1.06)
570 (0.38)
506 (0.33)
547 (0.36)
68095 (45.07)
5010 (3.32)
- 13 (0.00)
7074 (4.68)
4568 (3.02)
- 631 (0.42)
3 (0.00)
0 (0.00)
6272 (4.15)
2010 532 (0.31)
7 (0.00)
66 (0.04)
59053 (34.30)
6049 (3.51)
- 1126 (0.65)
1316 (0.76)
679 (0.39)
631 (0.54)
74747 (43.07)
5811 (3.38)
- - 5279 (3.07)
6888 (4.00)
- 1094 (0.64)
2 (0.00)
1 (0.00)
8878 (5.16)
2011 4789 (2.13)
847 (0.38)
237 (0.11)
55569 (24.74)
10398 (4.63)
- 1804 (0.80)
3573 (1.59)
635 (0.28)
1206 (0.10)
87823 (39.10)
6644 (2.96)
- 50 (0.02)
29963 (13.34)
- - 167 (0.07)
6130 (2.73)
20 (0.01)
7843 (3.49)
2012 3116 (1.66)
197 (0.11)
246 (0.13)
31467 (16.78)
3722 (1.98)
- 841 (0.45)
3511 (1.87)
1154 (0.62)
185 (0.27)
117831 (62.83)
12134 (6.47)
- - - 12.94 - 476 (0.25)
7641 (4.07)
0 (0.00)
5014 (2.67)
CGR 9.01 9.71 10.30 10.95 12.29 9.49 10.12 9.73 12.90 11.30 12.80 11.54 10.80 10.08 14.26 1.66 7.88 11.12 11.91 9.12 14.13 Share 5.62 0.11 0.09 44.87 4.13 0.01 2.75 7.22 0.41 0.27 19.97 6.14 0.08 0.32 3.01 33.40 0.10 1.18 0.23 0.17 1.51
Source: Calculated from World integrated Trade Solution (WITS), 2012.
Table 5: India’s Pharmaceutical Exports to Russian Federation (US$ Thousands)
Year↓\ commodity codes→
54131 54132 54133 54139 54151 54152 54153 54159 54161 54162 54163 54164 54211 54212 54213 54219 54221 54222 54223 54224 54229
1992 3945 (2.54)
1 (0.0)
- 13270 (8.56)
13 (0.01)
- - 879 (0.57)
219 (0.14)
561 (0.36)
2004 (1.29)
1547 (1.00)
438 (0.28)
1184 (0.76)
15048 (9.70)
43508 (28.05)
4 (0.0)
1843 (1.19)
41315 (26.64)
9774 (6.30)
19549 (12.60)
1993 1402 (1.11)
- - 3160 (2.51)
- 5 (0.02)
212 (0.17)
123 (0.10)
1162 (0.92)
760 (0.60)
1781 (1.42)
1835 (1.46)
1171 (0.93)
2983 (2.37)
5320 (4.23)
49530 (39.87)
339 (0.27)
703 (0.56)
17386 (13.81)
16902 (13.43)
21112 (16.77)
1994 7096 (3.71)
10 (0.01)
38 (0.02)
9033 (4.73)
1629 (0.85)
50 (0.16)
764 (0.40)
376 (0.20)
74 (0.04)
88 (0.05)
6489 (3.40)
2410 (1.26)
2100 (1.10)
1546 (0.81)
12884 (6.74)
66616 (34.87)
92 (0.05)
8896 (4.66)
21068 (11.03)
17740 (9.29)
32050 (16.78)
1995 6436 (3.78)
17 (0.01)
71 (0.04)
2670 (1.57)
6787 (3.99)
9 (0.05)
542 (0.32)
424 (0.25)
348 (0.20)
1168 (0.69)
8805 (5.18)
1798 (1.06)
2120 (1.25)
1997 (1.17)
13292 (7.81)
58209 (34.22)
- 5160 (3.03)
25689 (15.10)
15619 (9.18)
18940 (11.13)
1996 13442 (5.92)
58 (0.03)
517 (0.23)
4522 (1.99)
4295 (1.89)
77 (0.21)
260 (0.11)
389 (0.17)
304 (0.13)
1290 (0.57)
17978 (7.92)
5152 (2.27)
784 (0.35)
485 (0.21)
12377 (5.45)
63169 (27.82)
28 (0.01)
1723 (0.76)
48877 (21.53)
14905 (6.57)
36395 (16.03)
1997 11922 (4.40)
213 (0.08)
496 (0.18)
6146 (2.27)
410 (0.15)
624 (1.10)
507 (0.19)
530 (0.20)
568 (0.21)
3410 (1.26)
19773 (7.31)
11860 (4.38)
983 (0.36)
866 (0.32)
10454 (3.86)
73125 (32.36)
117 (0.04)
3366 (1.24)
44562 (16.47)
23757 (8.78)
56952 (21.04)
1998 7925 (3.61)
887 (0.40)
369 (0.17)
7587 (3.46)
970 (0.44)
93 (0.22)
80 (0.04)
441 (0.20)
510 (0.23)
1222 (0.56)
23511 (10.72)
5704 (2.60)
355 (0.16)
3155 (1.44)
8886 (4.05)
70964 (28.97)
2 (0.00)
1703 (0.78)
32441 (14.79)
10924 (4.98)
41598 (18.97)
1999 6578 (3.32)
0 (0.0)
507 (0.26)
11178 (5.64)
30 (0.02)
35 (0.11)
834 (0.42)
400 (0.20)
583 (0.29)
1851 (0.93)
18004 (9.08)
6091 (3.07)
136 (0.07)
1994 (1.01)
7779 (3.92)
57463 (28.19)
6466 (3.26)
1532 (0.77)
30876 (15.57)
15174 (7.65)
30844 (15.55)
2000 8037 (2.72)
109 (0.02)
475 (0.16)
11328 (3.84)
515 (0.17)
0 (0.0)
1228 (0.42)
698 (0.24)
2093 (0.71)
2307 (0.78)
31543 (10.69)
8118 (2.75)
839 (0.28)
704 (0.24)
9433 (3.20)
83155 (21.31)
31 (0.01)
2906 (0.99)
55911 (18.95)
24203 (8.20)
51398 (17.42)
2001 8558 (1.95)
100 (0.01)
541 (0.12)
10400 (2.37)
747 (0.17)
- 425 (0.10)
250 (0.06)
621 (0.14)
2577 (0.59)
62221 (14.15)
10669 (2.43)
753 (0.17)
1156 (0.26)
18124 (4.12)
93698 (28.19)
- 6290 (1.43)
114536 (26.05)
38028 (8.65)
69960 (15.91)
2002 5320 (1.52)
23 (0.02)
333 (0.10)
10910 (3.12)
18 (0.01)
65 (0.12)
553 (0.16)
443 (0.13)
1094 (0.31)
872 (0.25)
63772 (18.21)
18971 (5.42)
1077 (0.31)
912 (0.26)
15416 (4.40)
88969 (22.82)
- 8058 (2.30)
42361 (12.10)
34578 (9.88)
56379 (16.10)
Continued…

2003 7181 (1.61)
111 (0.07)
282 (0.06)
11426 (2.56)
9 (0.00)
- 571 (0.13)
198 (0.04)
1321 (0.30)
750 (0.17)
87550 (19.65)
18788 (4.22)
810 (0.18)
1064 (0.21)
23671 (5.31)
101670 (24.07)
- 24272 (5.45)
52293 (11.74)
41245 (9.26)
72387 (16.24)
2004 6365 (1.11)
414 (0.01)
456 (0.08)
10417 (1.82)
3 (0.00)
15 (0.02)
527 (0.09)
230 (0.04)
1603 (0.28)
1774 (0.31)
106565 (18.66)
35030 (6.13)
644 (0.11)
574 (0.10)
29376 (5.14)
137429 (24.92)
- 14675 (2.57)
73652 (12.90)
55380 (9.70)
95874 (16.79)
2005 4813 (0.59)
93 (0.01)
410 (0.05)
14862 (1.81)
8 (0.00)
- 606 (0.07)
232 (0.03)
1390 (0.17)
3336 (0.41)
194791 (23.71)
43624 (5.13)
3374 (0.41)
445 (0.05)
38365 (4.67)
204732 (22.1)
67 (0.01)
2056 (0.25)
104050 (12.6)
82850 (10.0)
121296 (14.77)
2006 5938 (0.45)
130 (0.01)
313 (0.02)
17362 (1.33)
417 (0.03)
- 663 (0.05)
83 (0.01)
3293 (0.25)
989 (0.08)
437687 (33.43)
71071 (5.43)
5874 (0.45)
10695 (0.82)
64792 (4.95)
289383 (22.0)
- 8605 (0.66)
89601 (6.84)
101750 (7.77)
200599 (15.32)
2007 4764 (0.33)
143 (0.01)
798 (0.06)
27044 (1.88)
2264 (0.16)
- 1170 (0.08)
598 (0.04)
3847 (0.27)
1930 (0.13)
501050 (34.85)
104607 (7.27)
685 (0.05)
6371 (0.44)
66842 (4.65)
316756 (19.97)
6 (0.0)
19200 (1.34)
124427 (8.65)
104544 (7.27)
150891 (10.49)
2008 2739 (0.13)
18 (0.00)
121 (0.01)
27363 (1.33)
1670 (0.08)
- 1064 (0.05)
1868 (0.09)
2365 (0.11)
26161 (1.27)
768343 (37.30)
162388 (7.88)
3863 (0.19)
12572 (0.61)
124351 (6.04)
411371 (19.97)
1 (0.0)
13925 (0.68)
131410 (6.38)
159701 (7.75)
208858 (10.14)
2009 3706 (0.19)
201 (0.01)
391 (0.02)
41202 (2.16)
2849 (0.15)
- 614 (0.03)
871 (0.05)
2631 (0.14)
19700 (1.03)
708273 (37.12)
115157 (6.04)
129 (0.01)
9348 (0.49)
88021 (4.61)
362323 (18.99)
- 3241 (0.17)
120433 (6.31)
176177 (9.23)
252783 (13.25)
2010 9931 (0.41)
321 (0.01)
153 (0.01)
48208 (1.99)
4707 (0.19)
2 (0.0)
12090 (0.50)
1418 (0.06)
4791 (0.20)
30359 (1.25)
868054 (35.75)
156596 (6.45)
72 (0.0)
3961 (0.16)
81843 (3.37)
541450 (22.30)
4 (0.0)
6523 (0.27)
197671 (8.14)
200786 (8.27)
259488 (10.69)
2011 6874 (0.22)
1106 (0.03)
1443 (0.05)
66184 (2.08)
5449 (0.17)
-
2593 (0.08)
1165 (0.04)
7609 (0.24)
35183 (1.11)
1157377 (36.42)
259244 (8.16)
140 (0.0)
11564 (0.36)
212386 (6.68)
620402 (19.52)
251 (0.01)
6562 (0.21)
218735 (6.88)
262462 (8.26)
301409 (9.48)
2012 5235 (0.16)
576 (0.02)
1924 (0.06)
54992 (1.70)
9381 (0.29)
3 (0.0)
1742 (0.05)
1470 (0.05)
9551 (0.30)
36546 (1.13)
1183404 (36.64)
296487 (9.18)
381 (0.01)
14360 (0.44)
155896 (4.48)
699453 (21.65)
8 (0.00)
2446 (0.08)
204467 (6.33)
275397 (8.53)
276285 (8.55)
CGR 9.99 12.04 10.81 11.33 11.09 8.10 11.16 10.54 11.91 12.26 13.88 13.15 9.51 11.17 11.73 11.52 8.88 10.68 11.18 11.87 11.57
Share 1.90 0.04 0.08 2.80 0.42 0.02 0.16 0.13 0.27 0.64 19.18 4.46 0.32 0.60 5.13 26.00 0.17 1.40 13.28 8.52 14.48
Source: Calculated from World integrated Trade Solution (WITS), 2012
Table 6: India’s Pharmaceutical Imports from Russian Federation (US$ Thousands)
Year↓\ commodity codes→
54131 54139 54152 54153 54159 54162 54164 54219 54221 54222 54223 54229
1992 370 (87.14)
34 (8.02)
- - - 21 (4.84)
- - - - - -
1993 1023 (58.14)
720 (40.95)
- - - - - - 16 (0.91)
- - -
1994 1133 (95.29)
36 (3.06)
- - - - 20 (1.65)
- - - - -
1995 1729 (77.63)
498 (22.37)
- - - - - - - - - -
1996 4070 (78.46)
980 (18.89)
- 83 (1.61)
46 (0.89)
8 (0.15)
- - - - - -
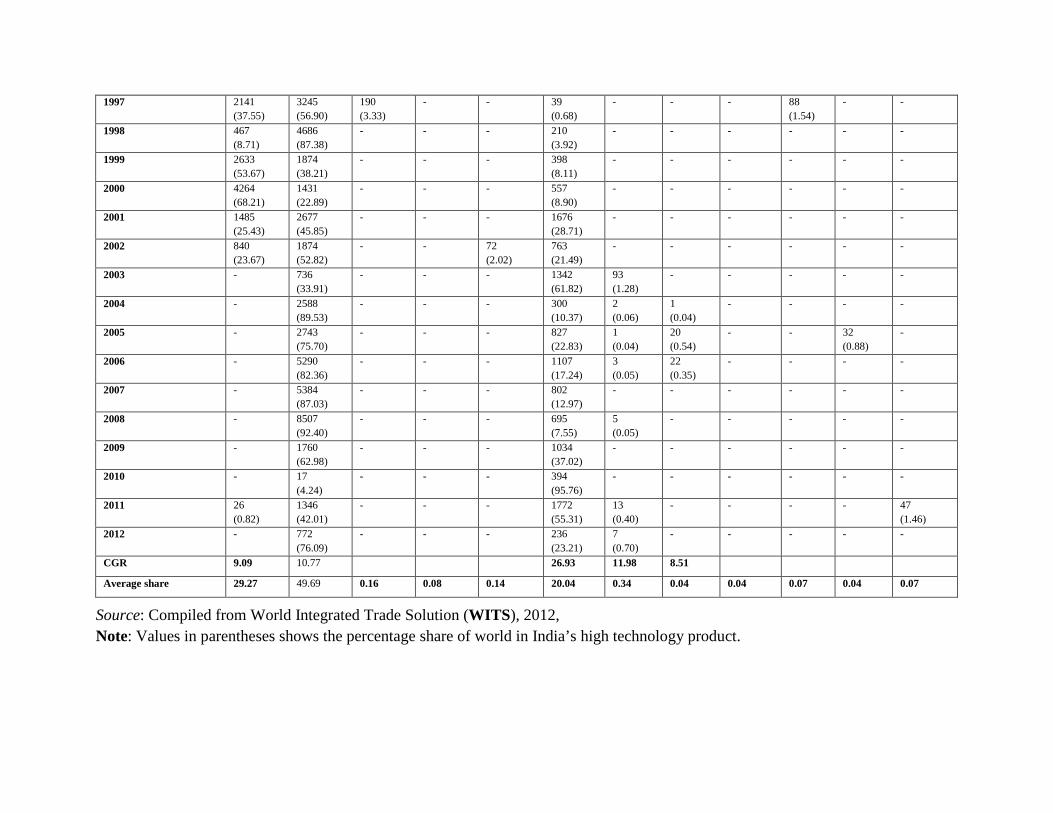
Source: Compiled from World Integrated Trade Solution (WITS), 2012, Note: Values in parentheses shows the percentage share of world in India’s high technology product.
1997 2141 (37.55)
3245 (56.90)
190 (3.33)
- - 39 (0.68)
- - - 88 (1.54)
- -
1998 467 (8.71)
4686 (87.38)
- - - 210 (3.92)
- - - - - -
1999 2633 (53.67)
1874 (38.21)
- - - 398 (8.11)
- - - - - -
2000 4264 (68.21)
1431 (22.89)
- - - 557 (8.90)
- - - - - -
2001 1485 (25.43)
2677 (45.85)
- - - 1676 (28.71)
- - - - - -
2002 840 (23.67)
1874 (52.82)
- - 72 (2.02)
763 (21.49)
- - - - - -
2003 - 736 (33.91)
- - - 1342 (61.82)
93 (1.28)
- - - - -
2004 - 2588 (89.53)
- - - 300 (10.37)
2 (0.06)
1 (0.04)
- - - -
2005 - 2743 (75.70)
- - - 827 (22.83)
1 (0.04)
20 (0.54)
- - 32 (0.88)
-
2006 - 5290 (82.36)
- - - 1107 (17.24)
3 (0.05)
22 (0.35)
- - - -
2007 - 5384 (87.03)
- - - 802 (12.97)
- - - - - -
2008 - 8507 (92.40)
- - - 695 (7.55)
5 (0.05)
- - - - -
2009 - 1760 (62.98)
- - - 1034 (37.02)
- - - - - -
2010 - 17 (4.24)
- - - 394 (95.76)
- - - - - -
2011 26 (0.82)
1346 (42.01)
- - - 1772 (55.31)
13 (0.40)
- - - - 47 (1.46)
2012 - 772 (76.09)
- - - 236 (23.21)
7 (0.70)
- - - - -
CGR 9.09 10.77 26.93 11.98 8.51
Average share 29.27 49.69 0.16 0.08 0.14 20.04 0.34 0.04 0.04 0.07 0.04 0.07

Table 7: Revealed Comparative Advantage and Revealed Symmetric Comparative Advantage of Pharmaceutical Products of
India with USA
Year Name of the Product* RCA RSCA Year Product Name** RCA RSCA
1991-1995 Insulin and its salt 12.73 0.85 1991-1995 Insulin formulated, bulk 28.01 0.93
1996-2000 Insulin formulated, bulk 46.15 0.96 1996-2000 Insulin formulated ,bulk 2821.06 1.00
2001-2005 Other hormone non retail 57.71 0.97 2001-2005 Insulin formulated, bulk 178.93 0.99
2006-2010 Insulin formulated, bulk 50.19 0.96 2006-2010 Other hormones non retail 189.58 0.99
2006-2012 Insulin formulated, bulk 51.42 0.96 2006-2012 Other hormones non retail 170.31 0.99
Source: Calculated from World Integrated Trade Solution (WITS), 2012. *USA, **Russian Federation
Table 8: India-USA* and Russian Federation** Bilateral Grubel-Lloyd Index
Year Product Name* GL Year Product name** GL
1991-1995 Hormones n.e.s retail pack 0.88 1991-1995 Pituitary/hormones etc. 1.00
1996-2000 Antisera/blood fracture/vaccine 0.68 1996-2000 Pencillines and derivatives 0.71
2001-2005 Other hormones/devices etc. 0.67 2001-2005 Glands etc. and extracts 0.59
2006-2010 Hormone n.e.s retail pack 0.64 2006-2010 Other antibiotics, bulk 0.49
2006-2012 Other hormones/devices etc. 0.68 2006-2012 Other antibiotics, bulk 0.37
Source: Calculated from World Integrated Trade Solution (WITS), 2012. *USA, **Russian Federation

Table 9: Growth of R &D Expenditure in Indian Pharmaceutical Companies
Year R & D Expenditure
R & D expenditure as % of sales
Domestic Company ( Rs.Crores)
Growth %
Foreign Company (Rs.Crores)
Growth %
Domestic Company
%
Growth %
Foreign Company
%
Growth %
2005 1527.24 40.86 510.50 47.25 4.98 30.71 1.63 48.18
2006 1850.97 21.20 816.02 59.85 5.35 7.43 2.39 46.63
2007 2371.79 28.14 695.62 -14.75 5.01 -6.36 2.67 11.72
2008 2772.63 16.90 700.18 0.66 4.78 -4.59 2.86 7.12
2009 2316.14 19.60 846.05 20.83 4.89 2.30 3.84 34.27
2010 3342.32 0.79 934.40 10.44 4.50 -7.98 4.01 4.43
Source: Ministry of Chemicals and Fertilizers, Department of Pharmaceuticals Annual Report 2011-12.
Table 10: Research and Development Intensity of Indian Pharmaceutical Companies
Name of the companies Mar 2001
Mar 2002
Mar 2003
Mar 2004
Mar 2005
Mar 2006
Mar 2007
Mar 2008
Mar 2009
Mar 2010
Mar 2011
Mar 2012
Average Share
Hester Biosciences Ltd. 0 0 0 0 0 0 0 0 0 0 0.15 0.22 0.03
Gujarat Themis Biosyn Ltd.
0 0 0 0 0 0 0 0.01 0 0 0 0 0.00
Ranbaxy Laboratories Ltd. 0 0 35.03 52.21 75.35 106.55 86.56 104.95 85.43 101.26 105.86 86 69.93
Cipla Ltd. 0 0 0 0 0 27.09 33.46 50.69 45.97 55.1 57.74 60.89 27.58
Pfizer Ltd. 0 0 0 0 0 0 0 6.16 5.73 6.27 2.31 1.22 1.81
Sanofi India Ltd. 0 0 0 0 0.91 0 0 1.15 0.96 1.1 0.81 0.76 0.47 GlaxoSmithKline Pharmaceuticals Ltd.
0 0 0 0 0 0 0 1.12 0.95 1 0.98 0.73 0.40
Continued…

Merck Ltd. 0.13 0.08 0.06 0.03 0.06 0.13 0.23 0.31 0.31 0.39 0.54 0.59 0.24
Wyeth Ltd. 0 0 0 0 0 0 0 0.2 0.19 0.17 0.45 0.3 0.11
AstraZeneca Pharma India Ltd.
0 0 0 0 0 0 0.5 0.6 0.49 0.45 0.72 0.29 0.25
Abbott India Ltd. 0 0 0 0 0 0 0 0.79 0.91 0.24 0.37 0.23 0.21
Zenotech Laboratories Ltd. 0 0 0 0 0 0 0 0.85 1.07 0.52 0.27 0.17 0.24
Resonance Specialties Ltd. 0.03 0.03 0.02 0.05 0.05 0.05 0.07 0.09 0.09 0.25 0.19 0.11 0.09
Novartis India Ltd. 0 0 0 0 0 0 0 0.19 0.06 0.03 0.04 0.05 0.03
Vista Pharmaceuticals Ltd. 0 0 0 0 0 0 0 0 0 0 0 0.01 0.00
Kerala Ayurveda Ltd. 0.02 0.01 0.02 0.02 0.01 0.02 0.02 0.03 0.01 0.05 0.32 0.8 0.11
Wanbury Ltd. 0 0 0 0 0 0 0 1.19 0.37 1.27 1.28 0.95 0.42
Fermenta Biotech Ltd. 0 0 0 0 0 0 0.24 0.2 0.36 0.52 0.38 0.68 0.20
Themis Medicare Ltd. 0 0 0 0 0 0 0 0.42 0.38 0.27 0.63 0.4 0.18
Capsugel Healthcare Ltd. 0.01 0 0.01 0.01 0.01 0 0 0 0 0 0 0 0.00
Source: Centre for Monitoring Indian Economy (CMIE), Prowess R & D Intensity: Expenditure on R&D as a proportion of firm’s sales
Table 11: Export performance of Indian Pharmaceutical Companies (US $ Million)
Name of the companies Mar 2001
Mar 2002
Mar 2003
Mar 2004
Mar 2005
Mar 2006
Mar 2007
Mar 2008
Mar 2009
Mar 2010
Mar 2011
Mar 2012 CGR Average Share
Hester Biosciences Ltd. 0 0 0.05 0.02 0.04 0.07 0.05 0.17 0.13 0.17 0.73 0.58 14.17 0.01
Gujarat Themis Biosyn Ltd. 2.48 0.57 0.43 0.12 0.11 0.34 0.37 0 0 0 0 0 7.49 0.10
Ranbaxy Laboratories Ltd. 161.05 218.1 395.08 536.87 546.8 493.99 587.61 641.53 555.07 600.36 761.6 1039.12 11.32 45.69
Cipla Ltd. 57.11 101.92 120.26 192.54 250.57 349.63 421.78 558.8 577.8 671.31 759.34 739.54 12.61 28.17
Sanofi India Ltd. 9.63 21.46 26.58 32.73 45.7 48.68 49.47 42.28 42.25 48.92 46.11 42.63 11.05 3.36
GlaxoSmithKline 15.46 15.8 13.87 8.58 8.5 9.77 12.45 20.06 19.46 25.39 23.51 14.83 10.51 1.72

Pharmaceuticals Ltd.
Merck Ltd. 3.72 2.7 2.71 4.09 3.27 3.54 3.93 5.02 6.17 11.22 10.41 10.26 11.37 0.49
AstraZeneca Pharma Ltd. 0.04 0 0.3 0.48 0.82 0.82 1.4 2.24 4.7 6.15 10.52 9.75 16.32 0.16
Pfizer Ltd. 3.05 4.1 4.63 5.95 5.33 5.9 6.36 5.6 4.69 5.5 8.47 4.39 10.38 0.54
Resonance Specialties Ltd. 0.84 0.36 0.35 0.16 0.03 0.01 0.36 0.08 0.06 0.07 1.37 2.81 10.56 0.06
Novartis India Ltd. 2.95 1.14 1.14 1.74 2.13 0.85 0.86 1.04 1.32 1.22 1.17 1.18 9.56 0.20
Abbott India Ltd. 0.7 0.35 0.33 0.45 0.61 0.73 0.72 0.88 0.89 0.94 1.65 1.12 11.14 0.07
Vista Pharmaceuticals Ltd. 0.33 0.22 0.29 0.25 0.23 0.23 0.25 0.25 0.36 0.18 1.26 0.72 10.84 0.04
Wyeth Ltd. 6.03 7.43 5.26 5.25 0.02 0.05 0.29 1.75 0.16 0.13 0.62 0.15 7.27 0.47
Zenotech Laboratories Ltd. 0 0 0 0.1 0 0.27 0.22 0.04 0.08 0.02 0.02 0 6.74 0.01
Kerala Ayurveda Ltd. 0.22 0.26 0 0.18 0.29 0.24 0.19 0.8 0.19 0.15 0.2 0.13 9.65 0.03
Mylan Laboratories Ltd. 0.98 1.97 59.11 66.11 77.04 87.74 113.44 151.75 238.96 337.87 520.65 679.04 16.49 10.82
Biocon Ltd. 5.87 9.73 22.74 66.74 86.11 80.66 108.16 129.46 92.09 109.12 153.41 134.47 12.92 5.81
Wanbury Ltd. 0.15 1.77 3.24 5.18 6.25 13.23 17.42 40.91 17.08 30.64 26.69 30.34 14.71 1.01
Fermenta Biotech Ltd. 1.25 1.51 0.89 0.67 1.62 3.9 4.26 5.38 4.39 7.5 9.86 15.54 12.89 0.32
Themis Medicare Ltd. 2.16 2.11 1.99 5.3 9.44 8.29 16.85 21.85 14.39 16.09 17.96 13.2 12.42 0.79
Capsugel Healthcare Ltd. 0.71 1.18 1.59 1.91 2.66 2.24 1.96 1.18 1.51 0.88 0.35 1.24 9.57 0.16
Source: Centre for Monitoring Indian Economy (CMIE), Prowess.
138 BUSINESS ANALYST April 2016- September 2016
CONCLUSION
Analysis of the study indicates that among the exports of high technology products, the country has the highest share in pharmaceutical sector from 1991 to 2012. USA is the top most destinations of India’s pharmaceutical exports followed by the Russian Federation. Commodity wise analysis of India’s pharmaceutical exports to the USA indicates that India has the highest share in the exports of product ‘Antibiotic n.e.s retail’ followed by ‘Penicillin/strept retail’ ‘Similarly, in case of Russia, India has the highest average share in the export of ‘Antibiotic n.e.s retail’ followed by ‘Antisera/blood fracture/vaccine’. The study revealed that India has competitive gain with the USA and Russian Federation is found for the ‘Insulin formulated bulk’. Results show that value of intra-industry trade between India and USA is the highest for ‘Hormones n.e.s retail’ throughout the study period. It has maintained its position throughout the study period as its intra-industry trade index has been found maximum in many years. After 2005, Indian leading pharmaceutical companies recognized that they could not survive as global players without the contribution of R&D capabilities. India started to increase expenditure in R&D as a result an increase in the production and exports of pharmaceutical products. The pharmaceuticals sector, where India has emerged as the most reliable supplier of quality generic drugs to Russia, has potential for further cooperation. Under Pharma 2020 program of the Russian Government, which aims at developing the domestic production base, leading Indian Pharma companies have started engaging with Russian partners to consider possibilities of joint investments. Thus, it is clear that the introduction of the TRIPS Agreement, which mainly concerns product patents, has increased the length of the patent to twenty years and affected India’s pharmaceutical sectors. Under Indian Patent Act of 1970, a product patent was not allowed for pharmaceutical products, agricultural products, food products and any chemical products. It seems from the preceding sections that grant of intellectual property rights for an invention is necessary for the domain of the pharmaceutical sector. Though it creates a short term monopoly and loss in social welfare, the long-term benefits are enormous. Secondly, the idea of making India compliant with TRIPS policy thereby is attracting more foreign direct investment or multi-national corporations in this sector need to be looked into carefully.
REFERENCES Balassa, B. (1965). Trade liberalization and “revealed” comparative advantage, The Manchester School 33(2): 99-123. Balassa, B. and Bauwens, L. (1985). Inter-Industry and Intra-Industry Specialization in Manufactured goods, Weltwirtschaftliches Archiv 124 (1), 1- 13. Batra, A. & Khan, Z. (2005). Revealed comparative advantage: an analysis for India and China, Working Research Paper-168, Indian Council for Research on International Economic Relations, New Delhi. 1-91 Burange, L. G. & Chadha, S. J. (2008). India’s revealed comparative advantage in merchandise trade, Artha Vijnana 50(4), 332-363. Correa, C. M. (2000). Intellectual property rights, the WTO and developing countries: The TRIPS agreement and policy options. Zed books. Dalum, B., Laursen, K. & Villumsen, G. (1998). Structural change in OECD export specialization patterns: de-specialization and ‘stickiness’, International Review of Applied Economics 12(3), 423-443. Das, M. (2013). Impact of TRIPS Agreement- on Competition in Pharmaceutical sector in India, Competition Commission of India, Government of India. 1-28.

Vol. 37 No. 1 CHANGING PATTERN OF INDIA’S HIGH TECHNOLOGY 139
Deolalikar, A. B. & Evenson, R. E (1989). Technology production and technology purchase in Indian industry: An econometric analysis, The Review of Economics and Statistics, 71(4), 689-92. Donges, J. B. & Riedel, J. (1977). The expansion of manufactured exports in developing countries: An empirical assessment of supply and demand issues, Weltwirtschaftliches Archive 113(1), 58-87. Dr. Mandar Madhukar Kodgule Associate Vice Preside- & Head, Global Intellectual Property & Strategic Planning, Lockhart Ltd., Pharma Times 44 (07), 1-44. Falk, M. (2009). High-tech exports and economic growth in industrialized countries, Applied Economics Letters 16(10), 1025-1028. Fu, D., Wu, Y. & Tang, Y. (2012). Does innovation matter for Chinese high-tech exports? A firm-level analysis, Frontiers of Economics in China, 7(2), 218-245. Green, W. (2007). The emergence of India's pharmaceutical industry and implications for the US generic drug market, US International Trade Commission, Office of Economics. Hatzichronoglou, T. (1997). Revision of the high-technology sector and product classification, OCED Science, technology and industry working papers, 1997/02. Mani, S. & Romijn, H. (Eds.). (2004). Innovation, learning, and technological dynamism of developing countries, United Nations University Press. Ministry of Chemicals and Fertilizers, Department- of Pharmaceuticals Annual Report 2011-12. Nair, G. G. (2008). Impact of TRIPS on Indian pharmaceutical industry, Journal of Intellectual Property Rights 13(5), 432-441. Nayak, S., Aggarwal, V. & Mann, P. (2013). India’s Manufacturing Exports Dynamics: An Analysis of Technology Intensity Transition. Growth of Indian Pharmaceutical Industry: Impact of Indian, US and European Pate- Laws and Regulatory Requirements. OECD (2001), Science Technology and Industry Scoreboard. Retrieved from <http://www.ebooksdownloads.xyz/search/oecd-science-technology-and-industry-scoreboard-2001-towards-a-knowledge-based-economy> on 24 November 2013. Pohit, S. & Basu, S. (2012). High Technology Merchandise Exports: Where does India Stand? South Asia Economic Journal, 13(2), 183-206. Ramani, S. V. & Maria, A. (2005). TRIPS: Its possible impact on biotech segment of the Indian pharmaceutical industry, Economic and Political Weekly 40(7), 675-683. Sahoo, P., Rai, D. K. & Kumar, R. (2009). India-Korea Trade and Investment- Relations, Indian Council for Research on International Economic Relations, Working Paper, No. 242 1-57. Samen, S. (2010). A Primer on Export Diversification: Key Concepts, Theoretical Underpinnings and Empirical Evidence, Growth and Crisis Unit World Bank Institute. Srholec, M. (2007). High-tech exports from developing countries: A symptom of technology spurts or statistical illusion?, Review of World Economics 143(2), 227-255. Stone, J. A. & Lee, H. H. (1995). Determinants of intra-industry trade: A longitudinal, cross-country analysis, Weltwirtschaftliches Archiv 131(1), 67-85. Tebaldi, E. (2011). The Determinants of High-Technology Exports: A Panel Data Analysis. Atlantic Economic Journal 39(4), 343-353. Vollrath, T. L. (1991). A theoretical evaluation of alternative trade intensity measures of revealed comparative advantage, Weltwirtschaftliches Archive 127(2), 265-280. Wana Ismail, N. (2013). Innovation and High-Tech Trade in Asian Countries, International conference on recent developments in Asian trade policy and integration, 1-19. WITS Comtrade Database (2013). Retrieved from <https://wits.worldbank.org/ > on 24 October 2013.

Appendix :A High Technology Products List – SITC Rev. 3 (Period 1988-95)
CODES SITC TITLE Aerospace 7921 Helicopters 7922+7923+7924+792 Aero planes Of which: 7922 Aero planes of unladen weight<2000 kg 7923 Aero planes of unladen weight<2000 kg and <15000kg 7924 Aero planes of unladen weight >15000kg 7925 Spacecraft (including satellites and launch vehicles) 79291 Propellers, rotors and parts thereof 79293 Under-carriages and parts thereof 714-71489 Aero planes motors 71441 Turbo-jets 71449 Other than turbo-jets 71491 Parts of turbo-jets or turbo-propellers 87411 Other navigational instruments Computers-office machine 75113 Word-processing machines 75131+75132+7513 Photo-copying apparatus 752-7529 Computers Of which: 7521 Analogue or hybrid data processing machines 7522 Digital automatic data processing with a central processing unit 7523 Digital automatic data processing with storage, input or output units 7526 Input or output units 7527 Storage units 75997 Parts and accessories of group 752-- Electronics-telecommunications 76381 Video apparatus 76383 Other sound reproducing apparatus 764-- Telecommunications equipment Of which : 7641- Electrical apparatus for telephone or telegraphed 76411 Telephone sets 76413 Teleprinters 76415 Communication apparatus 76417 Other apparatus for carries-current line systems

76419 Other telephonic apparatus, n.e.s 7642- Microphones, loudspeakers and amplifiers Of which: 76421 76422+76423
Microphones Loudspeakers
Of which: 76422 Loudspeakers, mounted in their ensolures 76423 Loudspeakers, not mounted in their ensolures 76424 Headphones, earphones and combined microphones/speaker sets 76425 Audio-frequency electric amplifiers 76426 Other sound amplifiers 7643 Transmission apparatus for radio, telephone and TV, including reception apparatus Of which: 76431 Transmission apparatus (without reception) 76432 Transmission apparatus incorporating reception apparatus 7648- Telecommunications equipments, n.e.s. Of which: 76481 Reception apparatus for radiotelephony 76482 Television cameras 76483 Radar apparatus 76491 Parts and accessories of 7641- 76492 Parts and accessories of 7642- 7722- Printed circuits 77261 Electrical boards and consoles<1000V 77318 OPTICAL FIBRE CABLES 77625 Microwave tubes 77627 Other valves and tubes 7763- Semi-conductor devices Of which: 77631 Non-photosensitive diodes 77632+77633 Transistors (excluding photosensitive transistors) 77635 Thyristors, diacs and triacs 77637 Photosensitive semi-conductor devices 77639 Other semi-conductor devices 7764- Electronic integrated circuits and micro assemblies Of which: 77641 Digital monolithic integrated units 77643 Non-digital monolithic units 77645 Hybrid integrated circuits 77649 Other electronic integrated circuits 7768- Piezo-electric crystals Of which: 77681 Piezo-electric crystals, mounted 77688 Parts of the devices of 7763- and of 77681

77689 Parts of the devices of 7764- 89879 Numeric recording stays PHARMACY 5413- Antibiotics 54131 Penicillin’s and their derivatives 54132 Streptomycin’s and their derivatives 54133 Tetracycline’s and their derivatives 54139 Other antibiotics of which: 54151 Insulin and its salts 54152 Pituitary (anterior) or similar hormones Of which: 5415- Hormones and their derivatives 54151 Insulin and its salts 54152 Pituitary/hormones etc. 54153 Cortisone derivatives 54159 Other hormones/devices etc. Of which: 5416- Glycosides, glands, antisera, vaccines 54161 Glycosides and derivatives 54162 Glands etc and extracts 54163 Antisera/Blood fracture/Vaccine 54164 Blood/Toxin/Cultures 5421- Medicaments containing antibiotics or derivatives thereof Of which: 54211 Penicillin non retail 54212 Antibiotic n.e.s non retail 54213 Penicillin/Strept retail 54219 Antibiotic n.e.s retail 5422- Medicaments containing hormones or other products of heading 5415- Of which: 54221 Insulin formulated, bulk 54222 Other hormones non retail 54223 Insulin retail pack 54224 Hormone ach retail pack 54229 Hormone n.e.s retail pack SCIENTIFIC INSTRUMENTS 774-- Electro-diagnostic apparatus for medicine or surgery and radiological apparatus of which: 7741- Electro-diagnostic apparatus (excepting radiological apparatus) of which: 77411 Electro-cardiographs 77412 Other electro-diagnostic apparatus 77413 Ultra-violet or infra-red ray apparatus

7742- Apparatus based on the use of x-rays or of alpha, beta or gamma radiations of which: 77421 Apparatus based on the use of x-rays (for medical uses ) 77422 Apparatus based on the use of alpha, beta or gamma radiations 77423 X-ray tubes 77429 Parts and accessories of 7742- 8711- Binoculars, astronomical instruments and optical telescopes 8713- Microscopes (other than optical microscopes) of which: 87131 Microscopes other than optical microscopes 87139 Parts and accessories 8714- Compound optical microscopes of which: 87141 Stereoscopic microscopes 87143 Other microscopes (including for microphotography) 87145 Microscopes, n.e.s. 87149 Parts and accessories 8714- Compound optical microscopes of which: 87141 Stereoscopic microscopes 87143 Other microscopes (including for microphotography) 87145 Microscopes, n.e.s. 87149 Parts and accessories 8719- Liquid crystal devices, lasers and other optical instruments of which: 87191 Telescopic sights for fitting to arms 87192 Lasers 87193 Other devices and instruments 87199 Parts and accessories of 8719- 87211 Dental drill engines 874 - 87411- 8742 Measuring instruments and apparatus of which: 8741 - 87411 Compasses, navigational instruments, geodesic instruments of which: 87412 Parts and accessories 87413 Geodesic instruments 87414 Parts and accessories 8743- Instruments for measuring or checking the flow, level, pressure or other variables of liquids or gases of which: 87431 Instruments for measuring the flow or level of liquids 87435 Instruments for checking pressure 87437 Other instruments and apparatus 87439 Parts and accessories of 8743- 8744- Instruments for physical or chemical analysis of which: 87441 Gas or smoke analysis apparatus
87442 Chromatographs 87443 Spectrometers, spectrographs using optical radiations 87444 Exposure meters 87445 Other apparatus using optical radiations 87446 Apparatus for physical or chemical analysis, n.e.s. 87449 Parts and accessories of 8744- 8745- Measuring, controlling and scientific instruments, n.e.s. of which: 87451 Sensitive balances 87452 Instruments designed for demonstrational purposes 87453 Appliances for testing the hardness 87454 Parts and accessories of 87453 87455 Density meters 87456 Parts and accessories of 87455 8746- Automatic regulating or controlling instruments of which: 87461 Thermostats 87463 Pressure regulators 87465 Other regulating or controlling apparatus 87469 Parts and accessories of 8746- 8747- Oscilloscopes, spectrum analyzers of which: 87471 Instruments for detecting ionizing radiations 87473 Cathode-ray oscilloscopes and cathode-ray oscillographes 87475 Other instruments for checking voltage, current and resistance 87477 Instruments designed for telecommunications 87478 Other instruments for measuring electrical quantities 87479 Parts and accessories of 8747- 8749- Parts and accessories, n.e.s. 88111 Photographic cameras 88121 Cinematographic cameras 88411 Contact lenses 88419 Optical fibers other than those of heading 7731- 89961 Hearing aids 89963 Orthopedic appliances 89966 Ocular prosthesis 89967 Pacemakers for stimulating heart muscles
ELECTRICAL MACHINERY 77862+77863+77864+77865 Electrical fixed capacitors of which: 77862 Tantalum fixed capacitors

77863 Aluminum electrolytic fixed capacitors 77864 Ceramic dielectric fixed capacitors, single layer 77865 Ceramic dielectric fixed capacitors, multilayer 7787- Electrical machines, having individual functions of which: 77871 Particle accelerators 77878 Other machines, having individual functions 77879 Parts and accessories of 7787- 77884 Electric sound or visual signaling apparatus
CHEMISTRY 52222+52223+52229+52269 Inorganic chemical elements of which: 52222 Selenium, tellurium, phosphorus, arsenic and boron 52223 Silicon 52229 Calcium, strontium and barium 52269 Other inorganic bases 525-- Radio-active materials of which: 5251- Radio-active isotopes of which: 52511 Natural uranium and its compounds 52513 Uranium enriched in U235, plutonium and its compounds 52515 Uranium depleted in U235 52517 Spent fuel elements of nuclear reactors 52519 Radio-active isotopes, n.e.s. 5259- Stable isotopes and their compounds of which: 52591 Isotopes other than those of heading 5251- 52595 Compounds, inorganic or organic, of rare-earth met 531-- Organic coloring matter and colour lakes of which: 5311- Organic coloring matter 5312- Synthetic organic products of a kind used as fluorescent brightening agents or luminophores 57433 Polyethylene terephthalate of which: 5911- Insecticides 5912- Fungicides 5913- Herbicides, anti-sprouting products 5914- Disinfectants
NON-ELECTRICAL MACHINERY 71489 Other gas turbines 71499 Parts of gas turbines 71871 Nuclear reactors 71877 Fuel elements non-irradiated

71878 Parts of nuclear reactors 72847 Machinery and apparatus for isotopic separation 7311- Machine-tools working by laser or other light or photon beam, ultrasonic, electro-discharge or electro-chemical processes of which: 73111 Operated by laser or other light or photon beam processes 73112 Operated by ultra-sonic processes 73113 Operated by electro-discharge processes 73114 Operated by electro-chemical, electron beam, ionic-beam or plasma jet processes 73131+73135+73142+73144+ 73151+73153+73161+73163+ 73165+73312+73314+73316+ 7359+73733+73735
Machine-tools, numerically controlled
of which: 73131 Horizontal lathes, numerically controlled 73135 Other lathes, numerically controlled 73142 Other drilling machines, numerically controlled 73144 Other boring-milling machines, numerically controlled 73151 Milling machines, knee-type, numerically controlled 73153 Other milling machines, numerically controlled 73161 Plat-surface grinding machines, numerically controlled 73163 Other grinding machines, numerically controlled 73165 Sharpening machines, numerically controlled 73312 Bending, folding, straightening or flattening machines, numerically controlled 73314 Shearing machines, numerically controlled 73316 Punching machines, numerically controlled 7359- Parts and accessories of 731-- and 733-- of which: 73591 Parts and accessories of 731-- 73595 Parts and accessories of 733-- 73733 Machines and apparatus for resistance welding of metal, fully or partly automatic 73735 Machines and apparatus for arc, including plasma arc welding of metal, fully or partly automatic
891—ARMAMENT 8911- Armored fighting vehicles 8912- Bombs, torpedoes, mines, missiles, etc... 8913- Non-military arms 8919- Parts and accessories of 89112, 89114 and 8913-
Source: Hatzichronoglou, T. (1997).