the spab research report 1. u-value report€¦ · the spab u-value report - caroline rye &...
TRANSCRIPT
!!
THE SPAB RESEARCH REPORT 1.
U-VALUE REPORT REVISED NOVEMBER 2012. FIRST PUBLISHED 2010
Caroline Rye and Cameron Scott
! © Society for the Protection Ancient Buildings 2012. www.spab.org.uk ! !
"#!!"##$
The SPAB U-value Report - Caroline Rye & Cameron Scott - Revised Nov. 2012. !
!$!
TABLE OF CONTENTS 1. INTRODUCTION 2. 2. BACKGROUND 3. 3. METHODOLOGIES 5. 3.1 In situ U-value monitoring procedure 5. 3.2 In situ U-value data analysis 8.
3.3 Calculated U-value methodology (BR 443) 9.
4. RESULTS & DISCUSSION 12. 4.1 Results Tables 14.
4.2 Uncertainties 17.
4.3 In situ results - Homogeneous Walls 18.
4.4 In situ results - Heterogeneous Walls 24.
4.5 In situ Discussion 28.
4.6 In situ Average U-values 32.
4.7 BuildDesk/BR 443 Comparison Results 33.
5. CONCLUSIONS 38. 5.1 In situ U-values 38.
5.2 Measured & calculated U-value comparison 39.
6. REFERENCES 41. !! !
The SPAB U-value Report - Caroline Rye & Cameron Scott - Revised Nov. 2012. !
!%!
1.!Introduction The SPAB Research Report 1 U-value Report sets out the findings out of research work carried out into the subject of the heat loss (U-values) of traditionally-built walls. The report provides a brief background description of the origins of this project and sets out the scope of its enquiry, this is followed by a methodology chapter which gives an account of the methodologies involved in both the measurements and calculation of U-values. There is then a section on the results from the previous three year's worth of in situ U-value monitoring, where the walls under examination are broken down into various descriptive sub-headings and their thermal performance as measured in situ is scrutinised. This section is then followed by an examination of this in situ performance in relation to that predicted for the same walls by means of a standard U-value calculation procedure and compares and contrasts the two sets of U-values. The report concludes with a discussion of the consequences of the discrepancy between measured and calculated U-values with regard to the refurbishment of solid walls and the reduction of heat loss from traditional buildings. Research Report 1. was first published in October 2010, this is the second
revised edition published in November 2012.!! !
The SPAB U-value Report - Caroline Rye & Cameron Scott - Revised Nov. 2012. !
!&!
!2. Background! The 2009-2010 SPAB U-value research project originally evolved from a 'Science and Heritage' research proposal developed in collaboration with Dr Paul Baker of Glasgow Caledonian University to improve the energy efficiency of the SPAB offices in 37 Spital Square, London. In the light of limited research in this area the project was to act as a demonstration exemplar that would inform architecturally sensitive refurbishment work on historic buildings. Part of the project included the use of heat flux sensors to monitor heat transfer through the walls of 37 Spital Square in response to the lack of data concerning the thermal performance of old buildings. Unfortunately the 'Science and Heritage' project did not receive the necessary grant funding but the monitoring element of the research, albeit in a modified form, was enabled by the identification of an MSc Historic Building Conservation researcher interested in the energy profiles of historic buildings. In consultation with Dr Paul Baker, Caroline Rye, then a student at the University of Portsmouth, working with Jonathan Garlick, Technical Officer at the SPAB, embarked on a programme of research to look at the in situ U-values of traditionally built walls. A traditional building is defined by English Heritage as being a building of solid wall construction built with permeable fabric1 and this definition applies to the majority of walls examined in this research. The range of wall types included solid cob and stone walls, timber-framed structures with a variety of different infill materials and some walls with air gaps. The range of walls examined was intentionally diverse in order to contrast with similar work undertaken by Dr Paul Baker on behalf of Historic Scotland where the walls under review were predominantly stone, and likewise research proposed by English Heritage where the intention was to gather data for brick buildings. In addition to the accumulation of in situ U-value figures for various traditional construction types a further exercise was undertaken in collaboration with Cameron Scott, as part of the MSc element of
"#!!"##$
The SPAB U-value Report - Caroline Rye & Cameron Scott - Revised Nov. 2012. !
!'!
the research, which compared the in situ U-values with figures calculated using a U-value calculating programme widely used within the construction industry, BuildDesk v3.4. The discrepancy between the figures produced by the two different U-value estimating methods was significant and provides evidence for claims that standard calculating methods underestimate the thermal performance of traditionally built buildings. Following on from the success of this initial research and the interest generated by the first edition of Research Report 1. the SPAB decided to continue its work on the U-values of traditional walls. During the winter seasons of 2010 -12, 46 more U-value measurements have been made of 34 different walls, including walls that are part of a broader Building Performance Survey. (The SPAB Building Performance Survey looks at seven properties that are undergoing refurbishment work and measures various aspects of their performance both before and after these 'improvements'. This is the subject of the second SPAB report, Research Report 2.) The walls examined between 2010-12 were mostly solid wall constructions of historic origin with the exception of a modern straw bale construction and measurements taken from a Hemp/Lime house at Haverhill in Suffolk. Eighteen 'refurbished' walls, that is walls that have recently had modern insulation materials added, have also been measured. Once again the in situ U-value measurements recorded on site were compared with U-values calculated for these same walls using the U-value calculator BuildDesk v.3.4.
The SPAB U-value Report - Caroline Rye & Cameron Scott - Revised Nov. 2012. !
!(!
3. Methodologies 3.1 In situ U-value monitoring procedure An in situ U-value is a non-destructive means of measuring thermal transmittance in site-specific, pre-existing building elements. It uses a heat flux monitor in combination with interior and exterior temperature measurements taken over time; in this way an in situ U-value is able to take into account thermal inertia (mass) and the effect of temperature change and other climatic conditions. The monitoring procedure described below has been developed by Dr Paul Baker during work undertaken for Historic Scotland and follows the principles set out in prEN 12494 Building components and elements - in situ
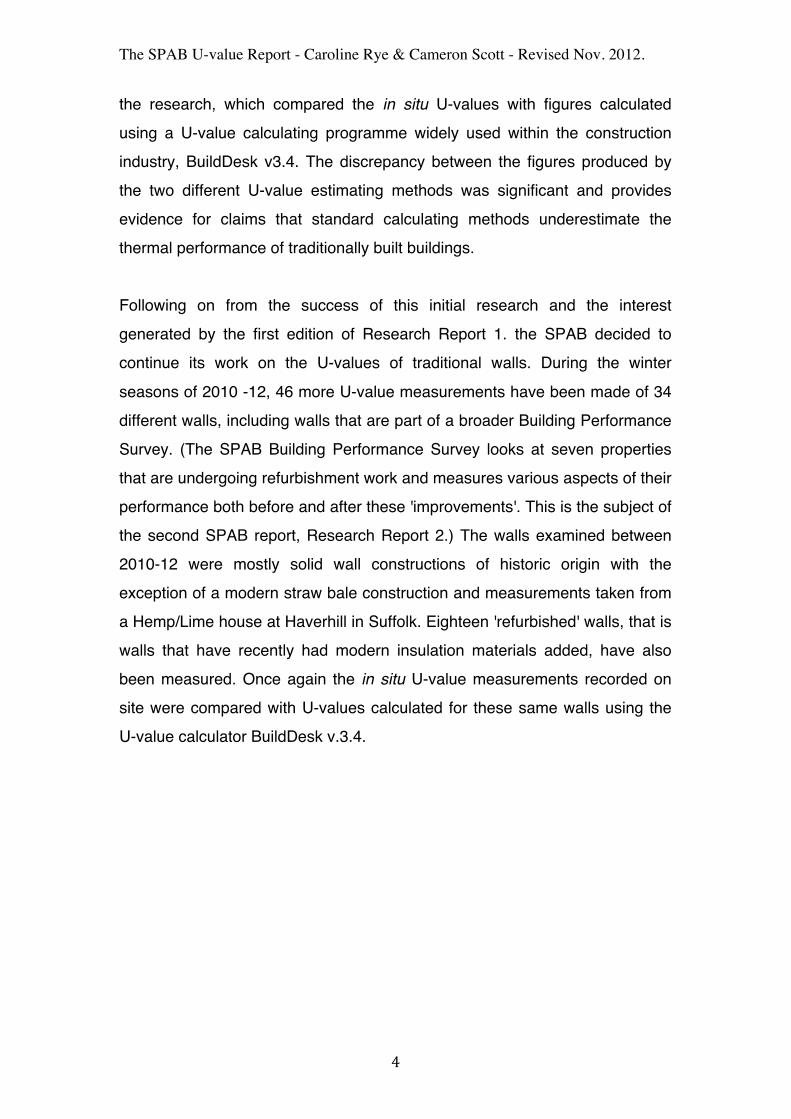
measurement of thermal resistance and thermal transmittance (a draft re-working of ISO 9869). A Hukseflux HFP01 heat flux sensor is attached to the interior surface of the wall under investigation (Fig. 1). The sensors are 80mm in diameter and 5mm thick. The sensors were mounted by firstly applying a layer of double-sided adhesive tape to the back of the sensor. Secondly, low tack masking tape was applied to the wall. Finally, the heat flux sensor was applied firmly to the masked area. This arrangement was generally satisfactory for two or more weeks monitoring on painted or plastered surfaces. Wallpapered surfaces were not generally used in case of damage. On occasion, if a wall surface was uneven, such as a bare stone or limewashed rubble wall, it was necessary to attach the sensors using a small quantity of silicon sealant.
The SPAB U-value Report - Caroline Rye & Cameron Scott - Revised Nov. 2012. !
!)!
!
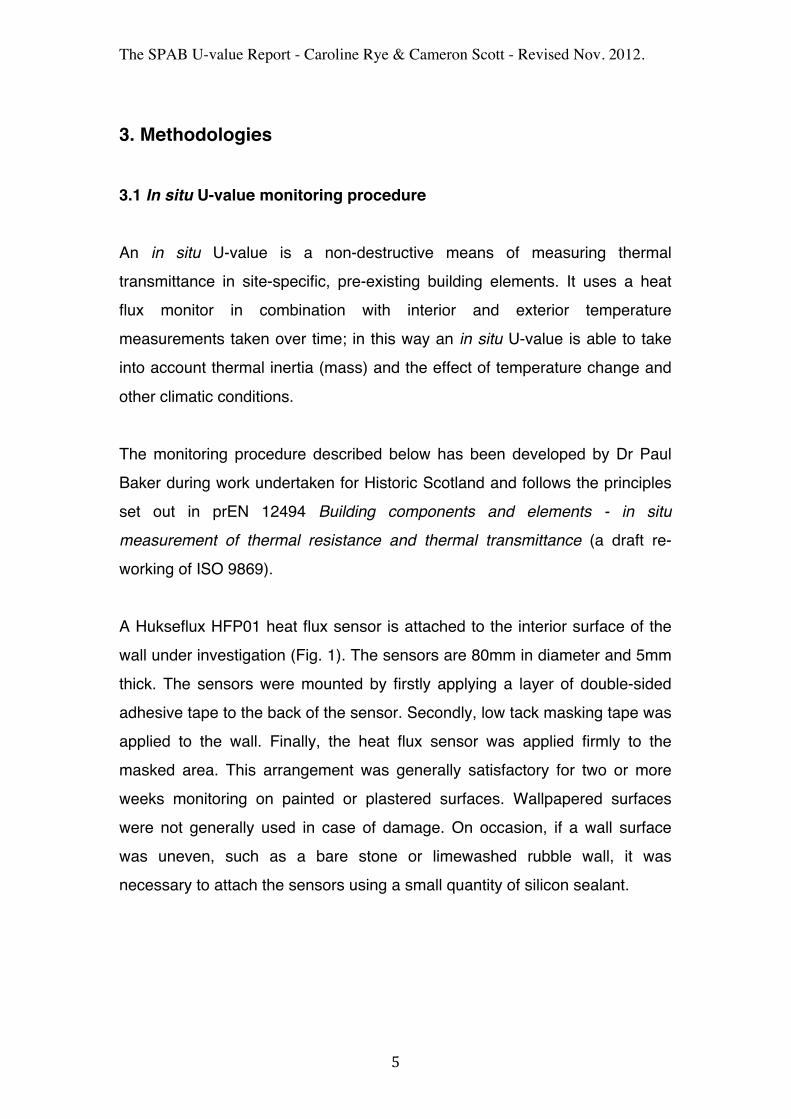
!!!!!!!!!!!!!!!!!!!!!!!!!!!!!!!!!!!Sensor locations were chosen to avoid probable thermal bridge locations near to windows, corners, etc., with the sensor ideally located about halfway between window and corner, and floor and ceiling. In addition, a thermographic camera was used to survey the internal face of the wall to ensure a general uniformity of surface temperature and thus establish a representative site for the placement of the sensor (Fig. 2). The heat flux data was logged on a Campbell Scientific CR1000 data logger. The Campbell data logger also recorded the surface temperature of the same wall using a type-T thermocouple taped onto the surface of the heat flux sensor (Fig. 1).
If necessary, in order to provide additional information concerning room conditions for data verification purposes, internal air temperature and relative humidity levels were monitored using dual channel Gemini TinyTag Plus 2 TGP-4520 loggers placed in proximity to the wall under investigation.
!Figure 1. Heat Flux Sensor and surface temperature thermocouple. !
Figure 2. Thermographic image showing temperature range across a wall. !
The SPAB U-value Report - Caroline Rye & Cameron Scott - Revised Nov. 2012. !
!*!
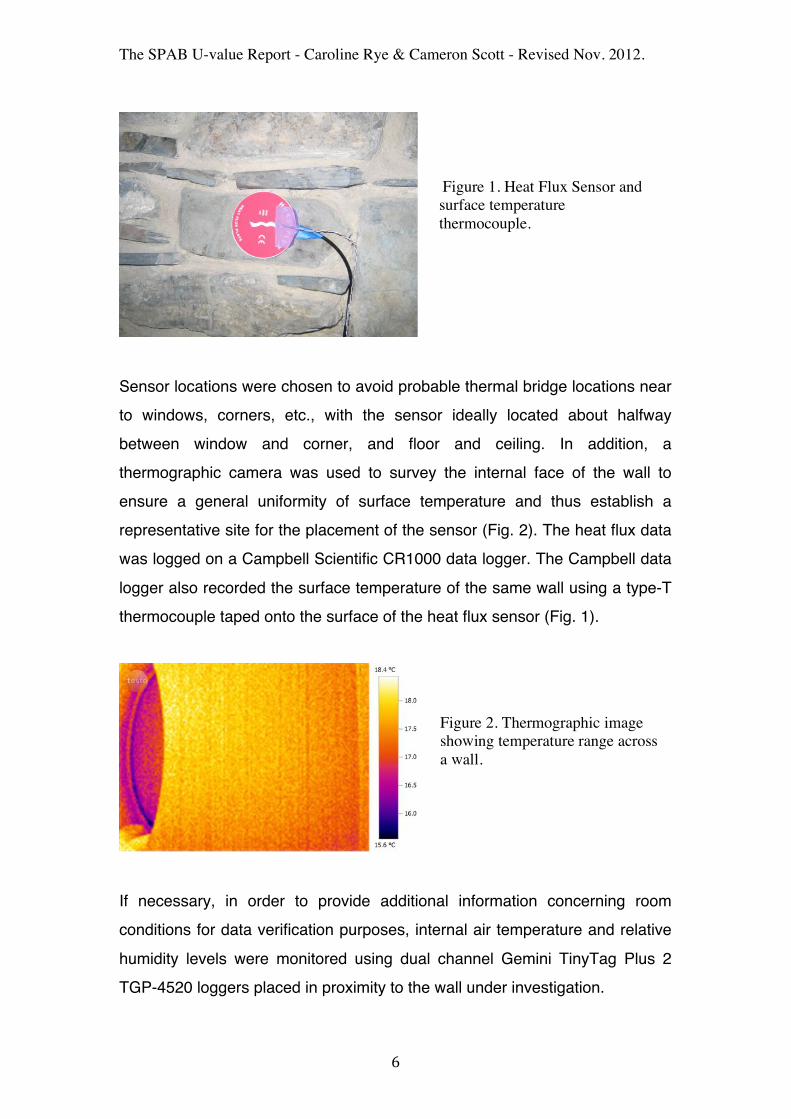
External temperatures were measured using a separate Gemini TinyTag Plus 2 TGP-4520 data logger which could be mounted outdoors. Thermistor probes were used to measure external air temperature and, generally, external wall surface temperature. Each external air temperature sensor was placed in a radiation shield which was secured, for example, onto a drainpipe (Fig. 3). Crimp-on terminals were used to fix surface temperature sensors to mortar joints, by drilling and plugging joints. Figure 3 shows the method of mounting external surface temperature sensors. In some cases external surface temperature sensors were not used either to avoid damaging the exterior surface of the building, for example, a rendered finish, or owing to difficult access.
!!! Sensors attached to Campbell Scientific loggers were logged at 5 second intervals and averaged over 10 minutes, whilst Tinytag loggers recorded 10 minute averages of data logged at 1 minute intervals.
+,-./01!&1!2,/!345!6./7380!90:;0/39./0!6046</61!!
The SPAB U-value Report - Caroline Rye & Cameron Scott - Revised Nov. 2012. !
!#!
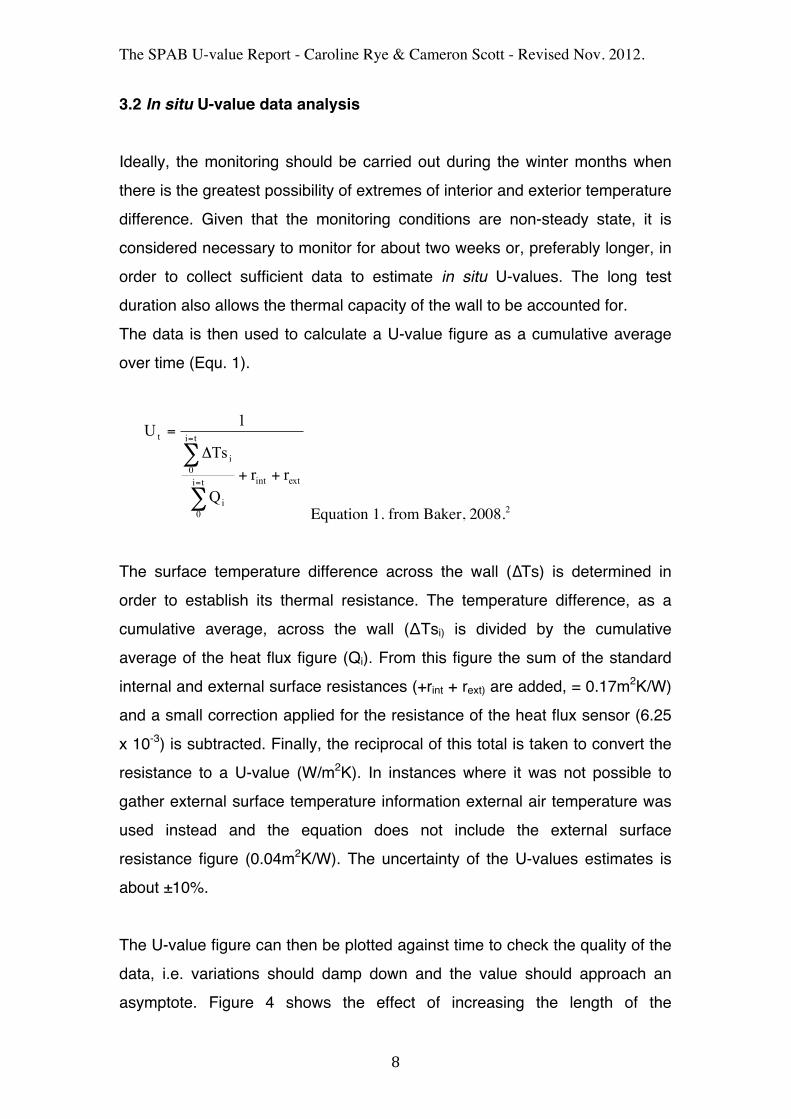
3.2 In situ U-value data analysis Ideally, the monitoring should be carried out during the winter months when there is the greatest possibility of extremes of interior and exterior temperature difference. Given that the monitoring conditions are non-steady state, it is considered necessary to monitor for about two weeks or, preferably longer, in order to collect sufficient data to estimate in situ U-values. The long test duration also allows the thermal capacity of the wall to be accounted for. The data is then used to calculate a U-value figure as a cumulative average over time (Equ. 1).
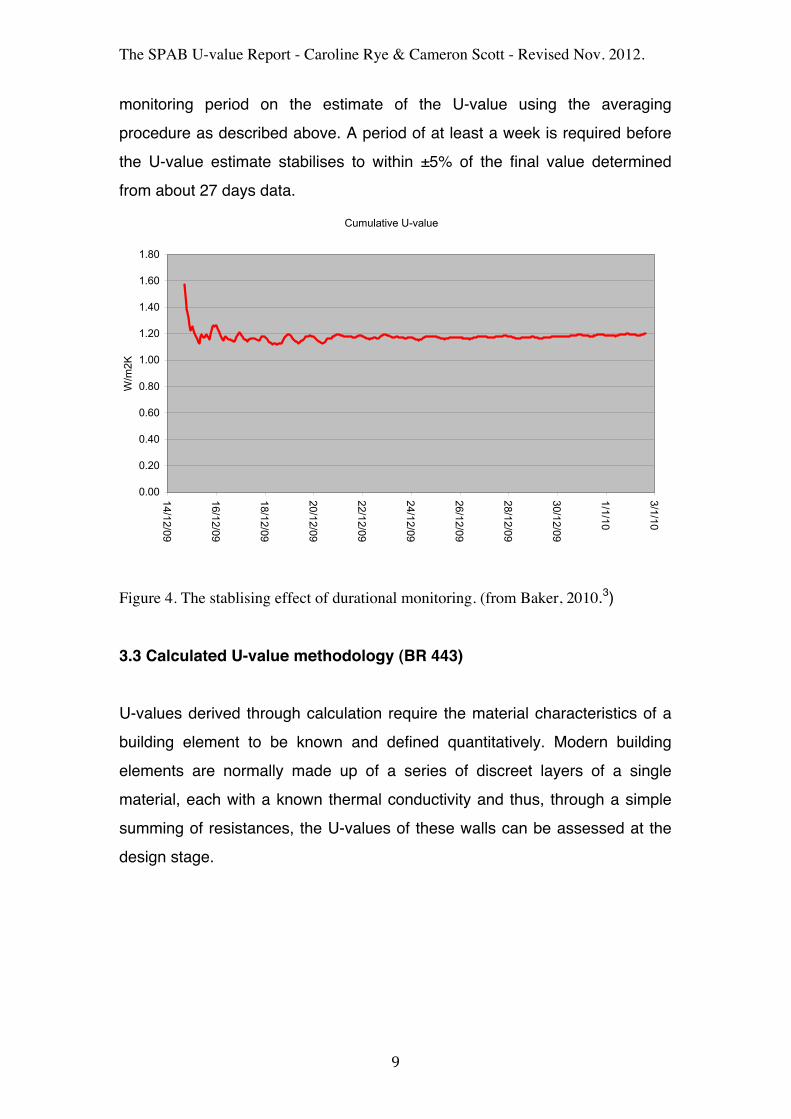
Equation 1. from Baker, 2008.2 The surface temperature difference across the wall (∆Ts) is determined in order to establish its thermal resistance. The temperature difference, as a cumulative average, across the wall (ΔTsi) is divided by the cumulative average of the heat flux figure (Qi). From this figure the sum of the standard internal and external surface resistances (+rint + rext) are added, = 0.17m2K/W) and a small correction applied for the resistance of the heat flux sensor (6.25 x 10⁻³) is subtracted. Finally, the reciprocal of this total is taken to convert the resistance to a U-value (W/m2K). In instances where it was not possible to gather external surface temperature information external air temperature was used instead and the equation does not include the external surface resistance figure (0.04m2K/W). The uncertainty of the U-values estimates is about ±10%. The U-value figure can then be plotted against time to check the quality of the data, i.e. variations should damp down and the value should approach an asymptote. Figure 4 shows the effect of increasing the length of the
extintti
0i
ti
0i
t
rrQ
Ts
1U
++!
=
"
"=
=
The SPAB U-value Report - Caroline Rye & Cameron Scott - Revised Nov. 2012. !
!=!
monitoring period on the estimate of the U-value using the averaging procedure as described above. A period of at least a week is required before the U-value estimate stabilises to within ±5% of the final value determined from about 27 days data.
Figure 4. The stablising effect of durational monitoring. (from Baker, 2010.3) 3.3 Calculated U-value methodology (BR 443) U-values derived through calculation require the material characteristics of a building element to be known and defined quantitatively. Modern building elements are normally made up of a series of discreet layers of a single material, each with a known thermal conductivity and thus, through a simple summing of resistances, the U-values of these walls can be assessed at the design stage.
20
Plot Cumulative U-value against time to check “quality” of data, i.e. variations should damp down and value should approach asymptote
Cumulative U-value
0.00
0.20
0.40
0.60
0.80
1.00
1.20
1.40
1.60
1.80
14/12/09
16/12/09
18/12/09
20/12/09
22/12/09
24/12/09
26/12/09
28/12/09
30/12/09
1/1/10
3/1/10W
/m2K
The SPAB U-value Report - Caroline Rye & Cameron Scott - Revised Nov. 2012. !
!$"!
Historic buildings with their traditional constructions present specific difficulties in this respect as, although it maybe possible to determine the overall width of a wall, its exact build-up can be difficult to define. For example, traditional walls can be conglomerate in nature with a number of different materials combined in varying proportions to form a heterogeneous whole, e.g. straw and clay to form a cob wall. Or, in other instances, a material and/or its quantity remains unknown, for example, the proportion of mortar, voids and stone involved in the core of a stone wall. In some cases it was possible to define a build-up for the walls involved in the in-situ monitoring as these walls had been the subject of recent survey or building work but in the absence of specific information, in order to compare the in-situ U-value results with calculated figures, it was occasionally necessary to approximate data. BuildDesk is a U-value calculating software package widely used throughout the UK building industry. BuildDesk calculations are based on the standards set out in the document BR 443 'Conventions for U-value calculations'4 which underpin building regulation energy conservation legislation and are also the basis of various energy assessment procedures. As a market leader with a robust methodology and good usability, BuildDesk was deemed an appropriate choice of software for the U-value comparison calculations. The element to be calculated was first defined, in this instance, an external wall with the default internal and external resistances (0.13 W/m2K and 0.04 W/m2K respectively). The various layers involved in the wall build-up were identified and added incrementally, the width of the particular material was entered and a resistance figure for each layer calculated from its thermal conductivity value. The information used in the calculation is sourced either from catalogues of materials that are pre-loaded within the BuildDesk software or alternatively can be entered directly by the user. Some materials used in traditional constructions are not to be found in the catalogues and here it was necessary to create new materials and enter thermal conductivity information for them from a variety of sources. However, there is in general a dearth of
The SPAB U-value Report - Caroline Rye & Cameron Scott - Revised Nov. 2012. !
!$$!
thermal conductivity data for traditional building materials and this contributes to additional uncertainty within calculation processes. As has been previously stated some traditional constructions can not readily be broken down into separate layers and on some occasions, within the software, it was deemed appropriate to treat these materials as 'inhomogeneous layers' with percentage proportions given for the combined materials. For example, a lath and plaster finish was treated as two layers; a 10mm inhomogeneous layer of 83.33% wood and 16.87% lime and sand plaster and a further layer of 15mm plaster making an overall depth of 25mm. During the early part (2009-10) of this research a further anomaly was encountered when trying to calculate stone walls. The software allowed a separate mortar fraction to be entered when calculating a brick or block wall but this was not possible when specifying stone within the build-up. In effect this meant that the wall was being calculated as if it was a solid slab of stone, without taking into account the thermal effect of the mortar. Partly as a result of this research work this anomaly within the calculating software has been corrected and it is now possible to define a block size and mortar fraction for a stone wall. The BuildDesk U-value calculations for the comparative part of the 2009 -10 research data set were carried out with the help of Cameron Scott of Timber Design Ltd. Further information about values and assumptions made in the calculating process are given in Tables 1 and 2.
The SPAB U-value Report - Caroline Rye & Cameron Scott - Revised Nov. 2012. !
!$%!
4. Results and Discussion The range of walls monitored was deliberately diverse and included historic walls walls which had been subject to recent repair and refurbishment and a few modern examples. Specific wall types consisted of mass masonry walls of granite, slate, limestone, gritstone, malmstone and flint (both as ashlar block and rubble constructions) and a section of concrete block repair work. Unfired earth-based materials were monitored either as mass wall constructions in the form of cob walls (earth and chalk) or as part of infilling material for a timber-frame as straw/clay and wattle and daub. Other timber-frame infill materials included brick and more modern infills such as hemcrete, mineral wool, sheep's wool, woodfibre board and reedboard, sometimes layered with the earlier brick material. Measurements were also taken on the timber studs of the frame itself. Almost all of the walls surveyed were solid walls of traditional (i.e. permeable) construction although a few of these walls contained cavities or air gaps formed by the addition of a lining to the interior wall face set off from the wall by battens. Five of these linings were historical consisting of either lime plaster on laths or timber paneling, others were of more recent origin when cavities had been created by fitting an additional layer to the existing wall often as part of an insulation strategy, such as the examples of stone and brick walls drylined with plasterboard, polystyrene sheets or sheep's wool. Most of the walls studied had an internal finish of lime and/or gypsum plaster and either no external finish or an external lime render. Four newly built walls, of hemp/lime, straw bale, straw/clay and a polyisocyanurate 'sandwich' were also examined, two within timber-frame structures. These timber-frame constructions also incorporated cavities in the form of a ventilated air gap behind a weatherboard external finish. In order to structure the findings and allow some basis for comparison, the sample group has been broken down into two basic wall 'types', homogeneous and heterogeneous. Homogeneous indicates that the wall is
The SPAB U-value Report - Caroline Rye & Cameron Scott - Revised Nov. 2012. !
!$&!
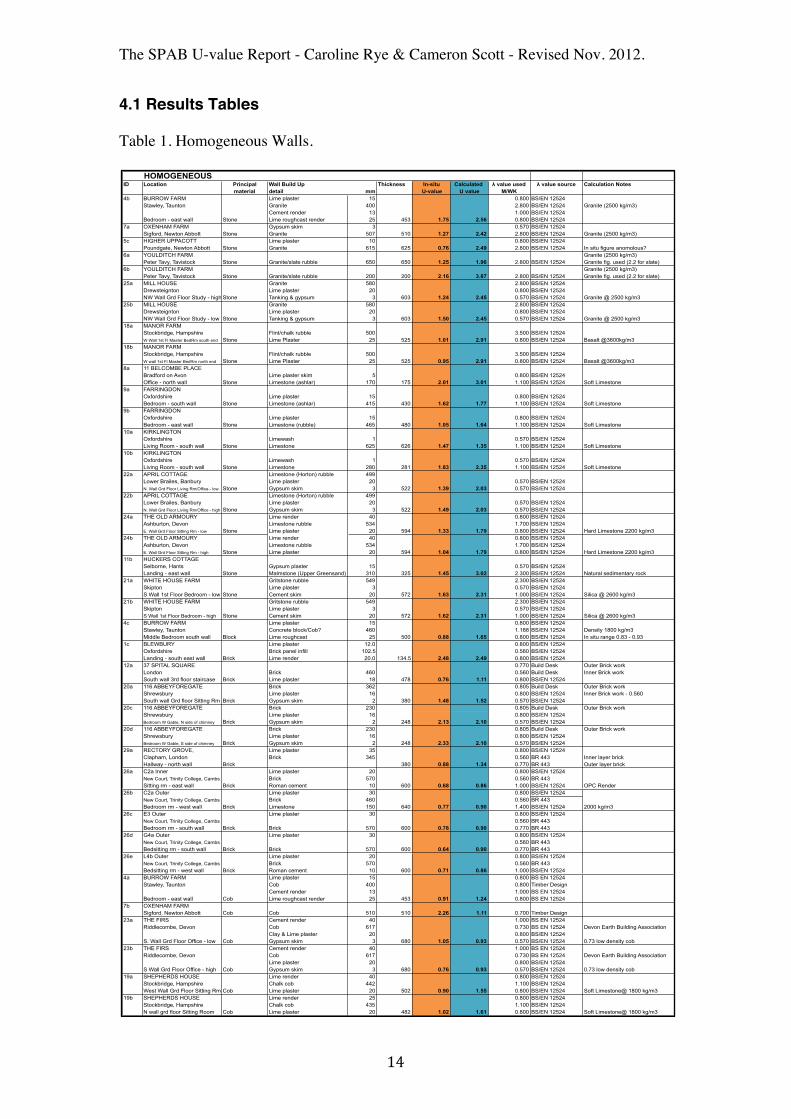
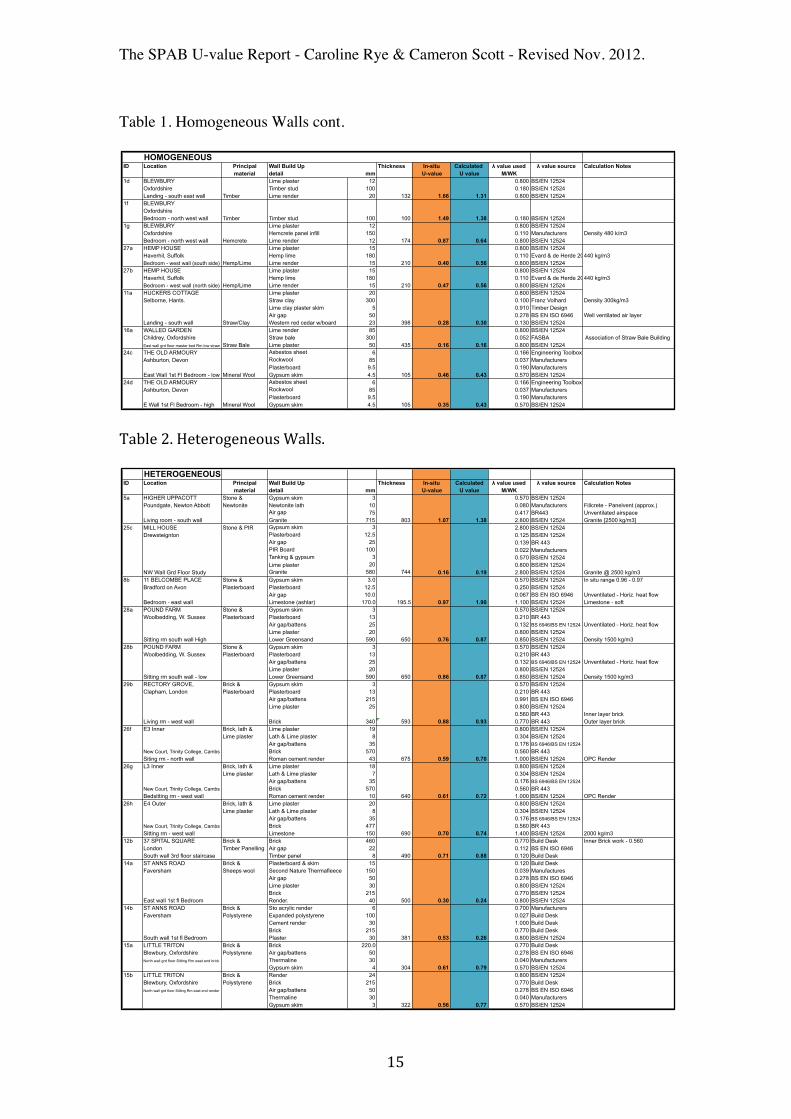
solid and (ignoring internal and external finishes) made predominantly from a single material e.g. limestone. Heterogeneous refers to a wall where the body of the wall consists of more than one material and/or incorporates some form of air gap within its build up. These two groupings can then, to a limited extent, be further ordered in terms of their relative densities, that is subdivided between heavy weight walls made of high density materials and light weight walls of lower densities. Tables 1 and 2 (p. 14.) detail each wall studied; its location, material build-up and the two U-value figures derived for it, one in situ, the other a BuildDesk calculated value. Also given in these tables are details concerning thermal conductivities and their sources, as well as other assumptions used in the U-value calculation. There is some uncertainty about a few elements of the build up and wall thickness data within the study. Burrow Farm near Taunton is a multi-period farmhouse built principally of rendered stone and cob which has been the subject of much alteration and repair over the years. A south-west facing bedroom wall (4c) was described as being a wall consisting of a concrete block repair but there was no absolute certainty about this and the in situ value recorded is similar to one achieved for a cob wall of the same width at the same location. On the opposing wall of the same room, a large cavity had been formed by a primitive dry-lining using deep studs placed against the interior face of a thin exterior cob wall to support a lath and lime plaster internal finish. Here it was not possible to say for certain the exact width of the cavity and this figure has been estimated from photographs of the exposed wall head taken during repair work. Abbeyforegate in Shrewsbury is an early nineteenth century three storey house, its was difficult to determine the exact dimensions of the gable end wall of the second floor bedroom, created from a previous partition wall when part of the terrace was demolished, therefore these dimensions have been extrapolated from other wall dimensions found within the house.
The SPAB U-value Report - Caroline Rye & Cameron Scott - Revised Nov. 2012. !
!$'!
4.1 Results Tables !Table 1. Homogeneous Walls.
!
HOMOGENEOUSID Location Principal Wall Build Up Thickness In-situ Calculated ! value used ! value source Calculation Notes
material detail mm U-value U value M/WK4b BURROW FARM Lime plaster 15 0.800 BS/EN 12524
Stawley, Taunton Granite 400 2.800 BS/EN 12524 Granite (2500 kg/m3)Cement render 13 1.000 BS/EN 12524
Bedroom - east wall Stone Lime roughcast render 25 453 1.75 2.56 0.800 BS/EN 12524 7a OXENHAM FARM Gypsum skim 3 0.570 BS/EN 12524
Sigford, Newton Abbott Stone Granite 507 510 1.27 2.42 2.800 BS/EN 12524 Granite (2500 kg/m3)5c HIGHER UPPACOTT Lime plaster 10 0.800 BS/EN 12524
Poundgate, Newton Abbott Stone Granite 615 625 0.76 2.49 2.800 BS/EN 12524 In situ figure anomolous?6a YOULDITCH FARM Granite (2500 kg/m3)
Peter Tavy, Tavistock Stone Granite/slate rubble 650 650 1.25 1.96 2.800 BS/EN 12524 Granite fig. used (2.2 for slate)6b YOULDITCH FARM Granite (2500 kg/m3)
Peter Tavy, Tavistock Stone Granite/slate rubble 200 200 2.16 3.87 2.800 BS/EN 12524 Granite fig. used (2.2 for slate)25a MILL HOUSE Granite 580 2.800 BS/EN 12524
Drewsteignton Lime plaster 20 0.800 BS/EN 12524 NW Wall Grd Floor Study - high Stone Tanking & gypsum 3 603 1.24 2.45 0.570 BS/EN 12524 Granite @ 2500 kg/m3
25b MILL HOUSE Granite 580 2.800 BS/EN 12524 Drewsteignton Lime plaster 20 0.800 BS/EN 12524 NW Wall Grd Floor Study - low Stone Tanking & gypsum 3 603 1.50 2.45 0.570 BS/EN 12524 Granite @ 2500 kg/m3
18a MANOR FARMStockbridge, Hampshire Flint/chalk rubble 500 3.500 BS/EN 12524 W Wall 1st Fl Master BedRm south end Stone Lime Plaster 25 525 1.01 2.91 0.800 BS/EN 12524 Basalt @3600kg/m3
18b MANOR FARMStockbridge, Hampshire Flint/chalk rubble 500 3.500 BS/EN 12524 W wall 1st Fl Master BedRm north end Stone Lime Plaster 25 525 0.95 2.91 0.800 BS/EN 12524 Basalt @3600kg/m3
8a 11 BELCOMBE PLACEBradford on Avon Lime plaster skim 5 0.800 BS/EN 12524 Office - north wall Stone Limestone (ashlar) 170 175 2.01 3.01 1.100 BS/EN 12524 Soft Limestone
9a FARRINGDONOxfordshire Lime plaster 15 0.800 BS/EN 12524 Bedroom - south wall Stone Limestone (ashlar) 415 430 1.62 1.77 1.100 BS/EN 12524 Soft Limestone
9b FARRINGDONOxfordshire Lime plaster 15 0.800 BS/EN 12524 Bedroom - east wall Stone Limestone (rubble) 465 480 1.05 1.64 1.100 BS/EN 12524 Soft Limestone
10a KIRKLINGTONOxfordshire Limewash 1 0.570 BS/EN 12524 Living Room - south wall Stone Limestone 625 626 1.47 1.35 1.100 BS/EN 12524 Soft Limestone
10b KIRKLINGTONOxfordshire Limewash 1 0.570 BS/EN 12524 Living Room - south wall Stone Limestone 280 281 1.83 2.35 1.100 BS/EN 12524 Soft Limestone
22a APRIL COTTAGE Limestone (Horton) rubble 499Lower Brailes, Banbury Lime plaster 20 0.570 BS/EN 12524 N. Wall Grd Floor Living Rm/Office - low Stone Gypsum skim 3 522 1.39 2.03 0.570 BS/EN 12524
22b APRIL COTTAGE Limestone (Horton) rubble 499Lower Brailes, Banbury Lime plaster 20 0.570 BS/EN 12524 N. Wall Grd Floor Living Rm/Office - high Stone Gypsum skim 3 522 1.49 2.03 0.570 BS/EN 12524
24a THE OLD ARMOURY Lime render 40 0.800 BS/EN 12524 Ashburton, Devon Limestone rubble 534 1.700 BS/EN 12524 E. Wall Grd Floor Sitting Rm - low Stone Lime plaster 20 594 1.33 1.79 0.800 BS/EN 12524 Hard Limestone 2200 kg/m3
24b THE OLD ARMOURY Lime render 40 0.800 BS/EN 12524 Ashburton, Devon Limestone rubble 534 1.700 BS/EN 12524 E. Wall Grd Floor Sitting Rm - high Stone Lime plaster 20 594 1.04 1.79 0.800 BS/EN 12524 Hard Limestone 2200 kg/m3
11b HUCKERS COTTAGESelborne, Hants Gypsum plaster 15 0.570 BS/EN 12524 Landing - east wall Stone Malmstone (Upper Greensand) 310 325 1.45 3.02 2.300 BS/EN 12524 Natural sedimentary rock
21a WHITE HOUSE FARM Gritstone rubble 549 2.300 BS/EN 12524 Skipton Lime plaster 3 0.570 BS/EN 12524 S Wall 1st Floor Bedroom - low Stone Cement skim 20 572 1.63 2.31 1.000 BS/EN 12524 Silica @ 2600 kg/m3
21b WHITE HOUSE FARM Gritstone rubble 549 2.300 BS/EN 12524 Skipton Lime plaster 3 0.570 BS/EN 12524 S Wall 1st Floor Bedroom - high Stone Cement skim 20 572 1.62 2.31 1.000 BS/EN 12524 Silica @ 2600 kg/m3
4c BURROW FARM Lime plaster 15 0.800 BS/EN 12524Stawley, Taunton Concrete block/Cob? 460 1.188 BS/EN 12524 Density 1800 kg/m3Middle Bedroom south wall Block Lime roughcast 25 500 0.88 1.65 0.800 BS/EN 12524 In situ range 0.83 - 0.93
1c BLEWBURY Lime plaster 12.0 0.800 BS/EN 12524 Oxfordshire Brick panel infill 102.5 0.560 BS/EN 12524 Landing - south east wall Brick Lime render 20.0 134.5 2.48 2.49 0.800 BS/EN 12524
12a 37 SPITAL SQUARE 0.770 Build Desk Outer Brick workLondon Brick 460 0.560 Build Desk Inner Brick workSouth wall 3rd floor staircase Brick Lime plaster 18 478 0.76 1.11 0.800 BS/EN 12524
20a 116 ABBEYFOREGATE Brick 362 0.805 Build Desk Outer Brick workShrewsbury Lime plaster 16 0.800 BS/EN 12524 Inner Brick work - 0.560South wall Grd floor Sitting Rm Brick Gypsum skim 2 380 1.48 1.52 0.570 BS/EN 12524
20c 116 ABBEYFOREGATE Brick 230 0.805 Build Desk Outer Brick workShrewsbury Lime plaster 16 0.800 BS/EN 12524Bedroom W Gable, N side of chimney Brick Gypsum skim 2 248 2.13 2.10 0.570 BS/EN 12524
20d 116 ABBEYFOREGATE Brick 230 0.805 Build Desk Outer Brick workShrewsbury Lime plaster 16 0.800 BS/EN 12524Bedroom W Gable, S side of chimney Brick Gypsum skim 2 248 2.33 2.10 0.570 BS/EN 12524
29a RECTORY GROVE, Lime plaster 35 0.800 BS/EN 12524 Clapham, London Brick 345 0.560 BR 443 Inner layer brickHallway - north wall Brick 380 0.88 1.34 0.770 BR 443 Outer layer brick
26a C2a Inner Lime plaster 20 0.800 BS/EN 12524 New Court, Trinity College, Cambs Brick 570 0.560 BR 443Sitting rm - east wall Brick Roman cement 10 600 0.68 0.86 1.000 BS/EN 12524 OPC Render
26b C2a Outer Lime plaster 30 0.800 BS/EN 12524 New Court, Trinity College, Cambs Brick 460 0.560 BR 443Bedroom rm - west wall Brick Limestone 150 640 0.77 0.90 1.400 BS/EN 12524 2000 kg/m3
26c E3 Outer Lime plaster 30 0.800 BS/EN 12524 New Court, Trinity College, Cambs 0.560 BR 443Bedroom rm - south wall Brick Brick 570 600 0.78 0.90 0.770 BR 443
26d G4a Outer Lime plaster 30 0.800 BS/EN 12524 New Court, Trinity College, Cambs 0.560 BR 443Bedsitting rm - south wall Brick Brick 570 600 0.64 0.90 0.770 BR 443
26e L4b Outer Lime plaster 20 0.800 BS/EN 12524 New Court, Trinity College, Cambs Brick 570 0.560 BR 443Bedsitting rm - west wall Brick Roman cement 10 600 0.71 0.86 1.000 BS/EN 12524
4a BURROW FARM Lime plaster 15 0.800 BS EN 12524Stawley, Taunton Cob 400 0.800 Timber Design
Cement render 13 1.000 BS EN 12524Bedroom - east wall Cob Lime roughcast render 25 453 0.91 1.24 0.800 BS EN 12524
7b OXENHAM FARMSigford, Newton Abbott Cob Cob 510 510 2.26 1.11 0.700 Timber Design
23a THE FIRS Cement render 40 1.000 BS EN 12524Riddlecombe, Devon Cob 617 0.730 BS EN 12524 Devon Earth Building Association
Clay & Lime plaster 20 0.800 BS/EN 12524 S. Wall Grd Floor Office - low Cob Gypsum skim 3 680 1.05 0.93 0.570 BS/EN 12524 0.73 low density cob
23b THE FIRS Cement render 40 1.000 BS EN 12524Riddlecombe, Devon Cob 617 0.730 BS EN 12524 Devon Earth Building Association
Lime plaster 20 0.800 BS/EN 12524 S Wall Grd Floor Office - high Cob Gypsum skim 3 680 0.76 0.93 0.570 BS/EN 12524 0.73 low density cob
19a SHEPHERDS HOUSE Lime render 40 0.800 BS/EN 12524Stockbridge, Hampshire Chalk cob 442 1.100 BS/EN 12524West Wall Grd Floor Sitting Rm Cob Lime plaster 20 502 0.90 1.55 0.800 BS/EN 12524 Soft Limestone@ 1800 kg/m3
19b SHEPHERDS HOUSE Lime render 25 0.800 BS/EN 12524Stockbridge, Hampshire Chalk cob 435 1.100 BS/EN 12524N wall grd floor Sitting Room Cob Lime plaster 20 482 1.02 1.61 0.800 BS/EN 12524 Soft Limestone@ 1800 kg/m3
The SPAB U-value Report - Caroline Rye & Cameron Scott - Revised Nov. 2012. !
!$(!
!Table 1. Homogeneous Walls cont. !
!!>3?@0!%1!A090/<-040<.6!B3@@61!!
!
HOMOGENEOUSID Location Principal Wall Build Up Thickness In-situ Calculated ! value used ! value source Calculation Notes
material detail mm U-value U value M/WK1d BLEWBURY Lime plaster 12 0.800 BS/EN 12524
Oxfordshire Timber stud 100 0.180 BS/EN 12524 Landing - south east wall Timber Lime render 20 132 1.66 1.31 0.800 BS/EN 12524
1f BLEWBURYOxfordshireBedroom - north west wall Timber Timber stud 100 100 1.49 1.38 0.180 BS/EN 12524
1g BLEWBURY Lime plaster 12 0.800 BS/EN 12524 Oxfordshire Hemcrete panel infill 150 0.110 Manufacturers Density 480 k/m3Bedroom - north west wall Hemcrete Lime render 12 174 0.87 0.64 0.800 BS/EN 12524
27a HEMP HOUSE Lime plaster 15 0.800 BS/EN 12524 Haverhil, Suffolk Hemp lime 180 0.110 Evard & de Herde 2010440 kg/m3Bedroom - west wall (south side) Hemp/Lime Lime render 15 210 0.40 0.56 0.800 BS/EN 12524
27b HEMP HOUSE Lime plaster 15 0.800 BS/EN 12524 Haverhil, Suffolk Hemp lime 180 0.110 Evard & de Herde 2010440 kg/m3Bedroom - west wall (north side) Hemp/Lime Lime render 15 210 0.47 0.56 0.800 BS/EN 12524
11a HUCKERS COTTAGE Lime plaster 20 0.800 BS/EN 12524 Selborne, Hants. Straw clay 300 0.100 Franz Volhard Density 300kg/m3
Lime clay plaster skim 5 0.910 Timber DesignAir gap 50 0.278 BS EN ISO 6946 Well ventilated air layer
Landing - south wall Straw/Clay Western red cedar w/board 23 398 0.28 0.30 0.130 BS/EN 12524 16a WALLED GARDEN Lime render 85 0.800 BS/EN 12524
Childrey, Oxfordshire Straw bale 300 0.052 FASBA Association of Straw Bale BuildingEast wall grd floor master bed Rm low straw Straw Bale Lime plaster 50 435 0.16 0.16 0.800 BS/EN 12524
24c THE OLD ARMOURY Asbestos sheet 6 0.166 Engineering ToolboxAshburton, Devon Rockwool 85 0.037 Manufacturers
Plasterboard 9.5 0.190 ManufacturersEast Wall 1st Fl Bedroom - low Mineral Wool Gypsum skim 4.5 105 0.46 0.43 0.570 BS/EN 12524
24d THE OLD ARMOURY Asbestos sheet 6 0.166 Engineering ToolboxAshburton, Devon Rockwool 85 0.037 Manufacturers
Plasterboard 9.5 0.190 ManufacturersE Wall 1st Fl Bedroom - high Mineral Wool Gypsum skim 4.5 105 0.35 0.43 0.570 BS/EN 12524
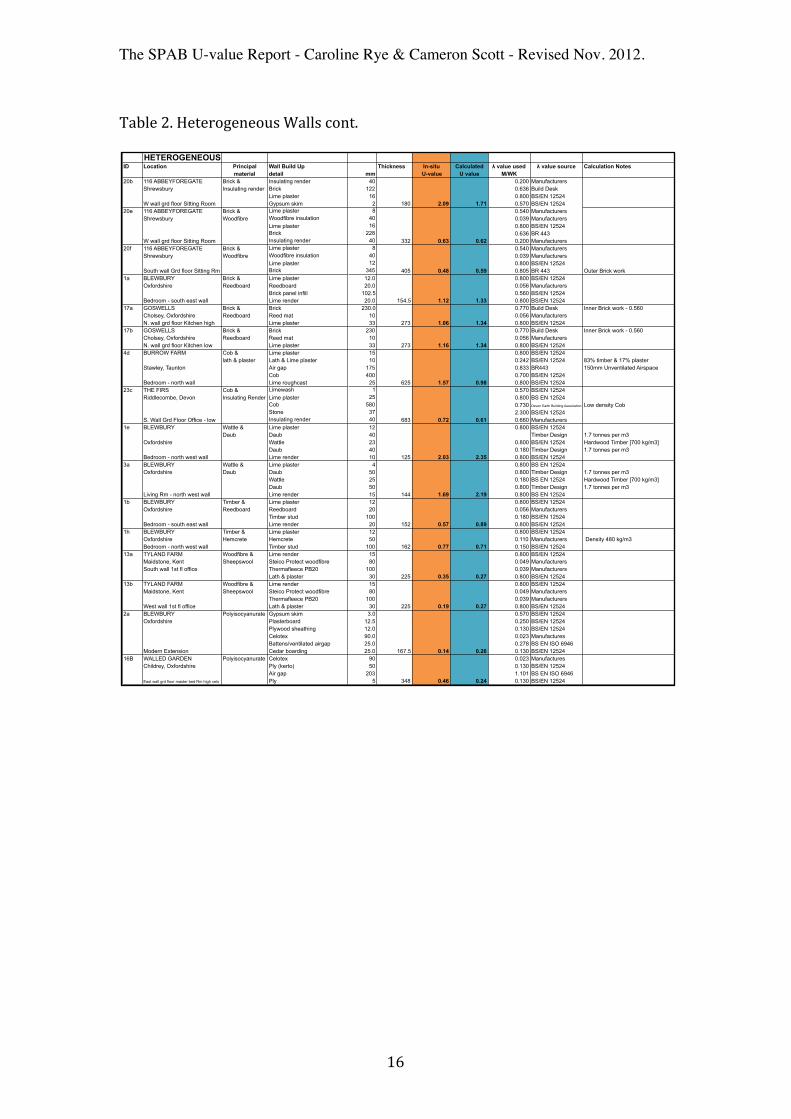
HETEROGENEOUSID Location Principal Wall Build Up Thickness In-situ Calculated ! value used ! value source Calculation Notes
material detail mm U-value U value M/WK5a HIGHER UPPACOTT Stone & Gypsum skim 3 0.570 BS/EN 12524
Poundgate, Newton Abbott Newtonite Newtonite lath 10 0.080 Manufacturers Fillcrete - Panelvent (approx.)Air gap 75 0.417 BR443 Unventilated airspace
Living room - south wall Granite 715 803 1.07 1.38 2.800 BS/EN 12524 Granite [2500 kg/m3]25c MILL HOUSE Stone & PIR Gypsum skim 3 2.800 BS/EN 12524
Drewsteignton Plasterboard 12.5 0.125 BS/EN 12524 Air gap 25 0.139 BR 443PIR Board 100 0.022 ManufacturersTanking & gypsum 3 0.570 BS/EN 12524 Lime plaster 20 0.800 BS/EN 12524
NW Wall Grd Floor Study Granite 580 744 0.16 0.19 2.800 BS/EN 12524 Granite @ 2500 kg/m38b 11 BELCOMBE PLACE Stone & Gypsum skim 3.0 0.570 BS/EN 12524 In situ range 0.96 - 0.97
Bradford on Avon Plasterboard Plasterboard 12.5 0.250 BS/EN 12524 Air gap 10.0 0.067 BS EN ISO 6946 Unventilated - Horiz. heat flow
Bedroom - east wall Limestone (ashlar) 170.0 195.5 0.97 1.90 1.100 BS/EN 12524 Limestone - soft28a POUND FARM Stone & Gypsum skim 3 0.570 BS/EN 12524
Woolbedding, W. Sussex Plasterboard Plasterboard 13 0.210 BR 443Air gap/battens 25 0.132 BS 6946/BS EN 12524 Unventilated - Horiz. heat flowLime plaster 20 0.800 BS/EN 12524
Sitting rm south wall High Lower Greensand 590 650 0.76 0.87 0.850 BS/EN 12524 Density 1500 kg/m328b POUND FARM Stone & Gypsum skim 3 0.570 BS/EN 12524
Woolbedding, W. Sussex Plasterboard Plasterboard 13 0.210 BR 443Air gap/battens 25 0.132 BS 6946/BS EN 12524 Unventilated - Horiz. heat flowLime plaster 20 0.800 BS/EN 12524
Sitting rm south wall - low Lower Greensand 590 650 0.86 0.87 0.850 BS/EN 12524 Density 1500 kg/m329b RECTORY GROVE, Brick & Gypsum skim 3 0.570 BS/EN 12524
Clapham, London Plasterboard Plasterboard 13 0.210 BR 443Air gap/battens 215 0.991 BS EN ISO 6946Lime plaster 25 0.800 BS/EN 12524
0.560 BR 443 Inner layer brickLiving rm - west wall Brick 340 593 0.88 0.93 0.770 BR 443 Outer layer brick
26f E3 Inner Brick, lath & Lime plaster 19 0.800 BS/EN 12524 Lime plaster Lath & Lime plaster 8 0.304 BS/EN 12524
Air gap/battens 35 0.176 BS 6946/BS EN 12524New Court, Trinity College, Cambs Brick 570 0.560 BR 443Siting rm - north wall Roman cement render 43 675 0.59 0.70 1.000 BS/EN 12524 OPC Render
26g L3 Inner Brick, lath & Lime plaster 18 0.800 BS/EN 12524 Lime plaster Lath & Lime plaster 7 0.304 BS/EN 12524
Air gap/battens 35 0.176 BS 6946/BS EN 12524New Court, Trinity College, Cambs Brick 570 0.560 BR 443Bedsitting rm - west wall Roman cement render 10 640 0.61 0.72 1.000 BS/EN 12524 OPC Render
26h E4 Outer Brick, lath & Lime plaster 20 0.800 BS/EN 12524 Lime plaster Lath & Lime plaster 8 0.304 BS/EN 12524
Air gap/battens 35 0.176 BS 6946/BS EN 12524New Court, Trinity College, Cambs Brick 477 0.560 BR 443Sitting rm - west wall Limestone 150 690 0.70 0.74 1.400 BS/EN 12524 2000 kg/m3
12b 37 SPITAL SQUARE Brick & Brick 460 0.770 Build Desk Inner Brick work - 0.560London Timber Panelling Air gap 22 0.112 BS EN ISO 6946South wall 3rd floor staircase Timber panel 8 490 0.71 0.88 0.120 Build Desk
14a ST ANNS ROAD Brick & Plasterboard & skim 15 0.120 Build DeskFaversham Sheeps wool Second Nature Thermafleece 150 0.039 Manufactures
Air gap 50 0.278 BS EN ISO 6946Lime plaster 30 0.800 BS/EN 12524Brick 215 0.770 BS/EN 12524
East wall 1st fl Bedroom Render. 40 500 0.30 0.24 0.800 BS/EN 1252414b ST ANNS ROAD Brick & Sto acrylic render 6 0.700 Manufacturers
Faversham Polystyrene Expanded polystyrene 100 0.027 Build DeskCement render 30 1.000 Build DeskBrick 215 0.770 Build Desk
South wall 1st fl Bedroom Plaster 30 381 0.53 0.26 0.800 BS/EN 1252415a LITTLE TRITON Brick & Brick 220.0 0.770 Build Desk
Blewbury, Oxfordshire Polystyrene Air gap/battens 50 0.278 BS EN ISO 6946North wall grd floor Sitting Rm west end brick Thermaline 30 0.040 Manufacturers
Gypsum skim 4 304 0.61 0.79 0.570 BS/EN 12524 15b LITTLE TRITON Brick & Render 24 0.800 BS/EN 12524
Blewbury, Oxfordshire Polystyrene Brick 215 0.770 Build DeskNorth wall grd floor Sitting Rm east end render Air gap/battens 50 0.278 BS EN ISO 6946
Thermaline 30 0.040 ManufacturersGypsum skim 3 322 0.56 0.77 0.570 BS/EN 12524
The SPAB U-value Report - Caroline Rye & Cameron Scott - Revised Nov. 2012. !
!$)!
!>3?@0!%1!A090/<-040<.6!B3@@6!8<491!!
!! !
HETEROGENEOUSID Location Principal Wall Build Up Thickness In-situ Calculated ! value used ! value source Calculation Notes
material detail mm U-value U value M/WK20b 116 ABBEYFOREGATE Brick & Insulating render 40 0.200 Manufacturers
Shrewsbury Insulating render Brick 122 0.636 Build DeskLime plaster 16 0.800 BS/EN 12524
W wall grd floor Sitting Room Gypsum skim 2 180 2.09 1.71 0.570 BS/EN 12524 20e 116 ABBEYFOREGATE Brick & Lime plaster 8 0.540 Manufacturers
Shrewsbury Woodfibre Woodfibre insulation 40 0.039 ManufacturersLime plaster 16 0.800 BS/EN 12524Brick 228 0.636 BR 443
W wall grd floor Sitting Room Insulating render 40 332 0.63 0.62 0.200 Manufacturers20f 116 ABBEYFOREGATE Brick & Lime plaster 8 0.540 Manufacturers
Shrewsbury Woodfibre Woodfibre insulation 40 0.039 ManufacturersLime plaster 12 0.800 BS/EN 12524
South wall Grd floor Sitting Rm Brick 345 405 0.48 0.59 0.805 BR 443 Outer Brick work1a BLEWBURY Brick & Lime plaster 12.0 0.800 BS/EN 12524
Oxfordshire Reedboard Reedboard 20.0 0.056 ManufacturersBrick panel infill 102.5 0.560 BS/EN 12524
Bedroom - south east wall Lime render 20.0 154.5 1.12 1.33 0.800 BS/EN 12524 17a GOSWELLS Brick & Brick 230.0 0.770 Build Desk Inner Brick work - 0.560
Cholsey, Oxfordshire Reedboard Reed mat 10 0.056 ManufacturersN. wall grd floor Kitchen high Lime plaster 33 273 1.06 1.34 0.800 BS/EN 12524
17b GOSWELLS Brick & Brick 230 0.770 Build Desk Inner Brick work - 0.560Cholsey, Oxfordshire Reedboard Reed mat 10 0.056 ManufacturersN. wall grd floor Kitchen low Lime plaster 33 273 1.16 1.34 0.800 BS/EN 12524
4d BURROW FARM Cob & Lime plaster 15 0.800 BS/EN 12524 lath & plaster Lath & Lime plaster 10 0.242 BS/EN 12524 83% timber & 17% plaster
Stawley, Taunton Air gap 175 0.833 BR443 150mm Unventilated Airspace Cob 400 0.700 BS/EN 12524
Bedroom - north wall Lime roughcast 25 625 1.57 0.98 0.800 BS/EN 12524 23c THE FIRS Cob & Limewash 1 0.570 BS/EN 12524
Riddlecombe, Devon Insulating Render Lime plaster 25 0.800 BS EN 12524Cob 580 0.730 Devon Earth Building Association Low density CobStone 37 2.300 BS/EN 12524
S. Wall Grd Floor Office - low Insulating render 40 683 0.72 0.61 0.660 Manufacturers1e BLEWBURY Wattle & Lime plaster 12 0.800 BS/EN 12524
Daub Daub 40 Timber Design 1.7 tonnes per m3Oxfordshire Wattle 23 0.800 BS/EN 12524 Hardwood Timber [700 kg/m3]
Daub 40 0.180 Timber Design 1.7 tonnes per m3Bedroom - north west wall Lime render 10 125 2.03 2.35 0.800 BS/EN 12524
3a BLEWBURY Wattle & Lime plaster 4 0.800 BS EN 12524Oxfordshire Daub Daub 50 0.800 Timber Design 1.7 tonnes per m3
Wattle 25 0.180 BS EN 12524 Hardwood Timber [700 kg/m3]Daub 50 0.800 Timber Design 1.7 tonnes per m3
Living Rm - north west wall Lime render 15 144 1.69 2.19 0.800 BS EN 125241b BLEWBURY Timber & Lime plaster 12 0.800 BS/EN 12524
Oxfordshire Reedboard Reedboard 20 0.056 ManufacturersTimber stud 100 0.180 BS/EN 12524
Bedroom - south east wall Lime render 20 152 0.57 0.89 0.800 BS/EN 12524 1h BLEWBURY Timber & Lime plaster 12 0.800 BS/EN 12524
Oxfordshire Hemcrete Hemcrete 50 0.110 Manufacturers Density 480 kg/m3 Bedroom - north west wall Timber stud 100 162 0.77 0.71 0.150 BS/EN 12524
13a TYLAND FARM Woodfibre & Lime render 15 0.800 BS/EN 12524 Maidstone, Kent Sheepswool Steico Protect woodfibre 80 0.049 ManufacturersSouth wall 1st fl office Thermafleece PB20 100 0.039 Manufacturers
Lath & plaster 30 225 0.35 0.27 0.800 BS/EN 12524 13b TYLAND FARM Woodfibre & Lime render 15 0.800 BS/EN 12524
Maidstone, Kent Sheepswool Steico Protect woodfibre 80 0.049 ManufacturersThermafleece PB20 100 0.039 Manufacturers
West wall 1st fl office Lath & plaster 30 225 0.19 0.27 0.800 BS/EN 12524 2a BLEWBURY Polyisocyanurate Gypsum skim 3.0 0.570 BS/EN 12524
Oxfordshire Plasterboard 12.5 0.250 BS/EN 12524 Plywood sheathing 12.0 0.130 BS/EN 12524 Celotex 90.0 0.023 ManufacturesBattens/ventilated airgap 25.0 0.278 BS EN ISO 6946
Modern Extension Cedar boarding 25.0 167.5 0.14 0.26 0.130 BS/EN 12524 16B WALLED GARDEN Polyisocyanurate Celotex 90 0.023 Manufactures
Childrey, Oxfordshire Ply (kerto) 50 0.130 BS/EN 12524 Air gap 203 1.101 BS EN ISO 6946
East wall grd floor master bed Rm high celo Ply 5 348 0.46 0.24 0.130 BS/EN 12524
The SPAB U-value Report - Caroline Rye & Cameron Scott - Revised Nov. 2012. !
!$*!
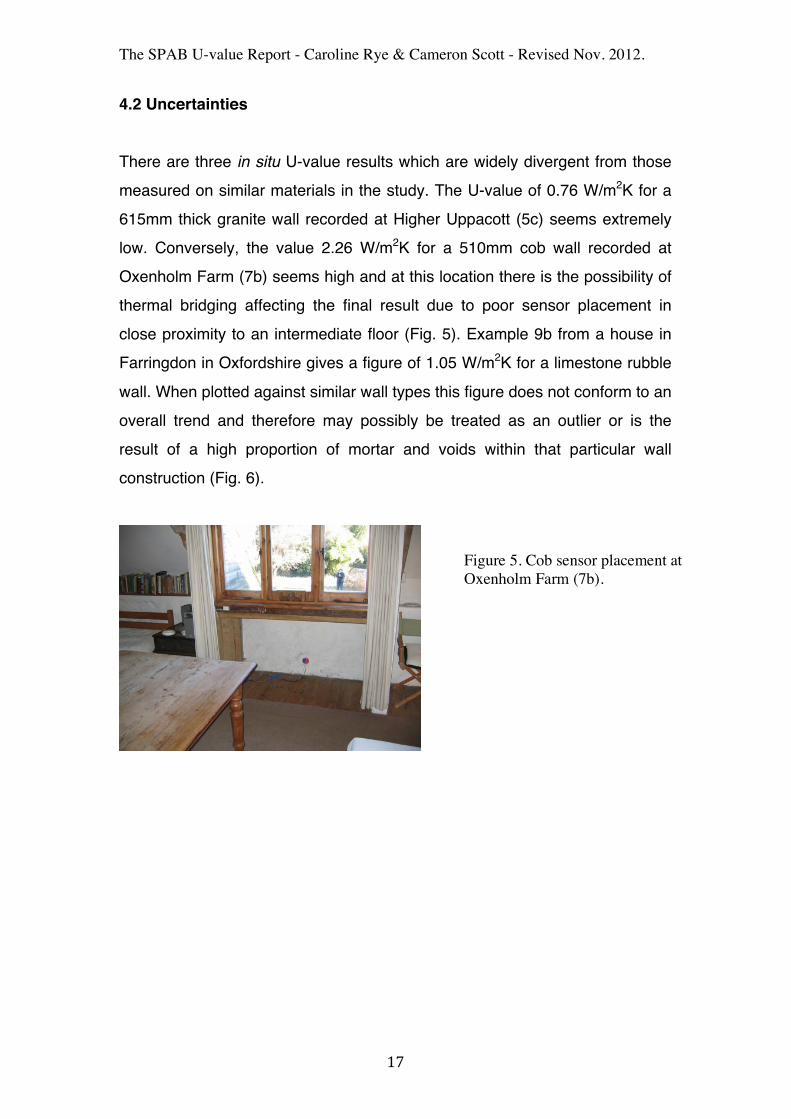
4.2 Uncertainties There are three in situ U-value results which are widely divergent from those measured on similar materials in the study. The U-value of 0.76 W/m2K for a 615mm thick granite wall recorded at Higher Uppacott (5c) seems extremely low. Conversely, the value 2.26 W/m2K for a 510mm cob wall recorded at Oxenholm Farm (7b) seems high and at this location there is the possibility of thermal bridging affecting the final result due to poor sensor placement in close proximity to an intermediate floor (Fig. 5). Example 9b from a house in Farringdon in Oxfordshire gives a figure of 1.05 W/m2K for a limestone rubble wall. When plotted against similar wall types this figure does not conform to an overall trend and therefore may possibly be treated as an outlier or is the result of a high proportion of mortar and voids within that particular wall construction (Fig. 6).
!!
Figure 5. Cob sensor placement at Oxenholm Farm (7b). !
The SPAB U-value Report - Caroline Rye & Cameron Scott - Revised Nov. 2012. !
!$#!
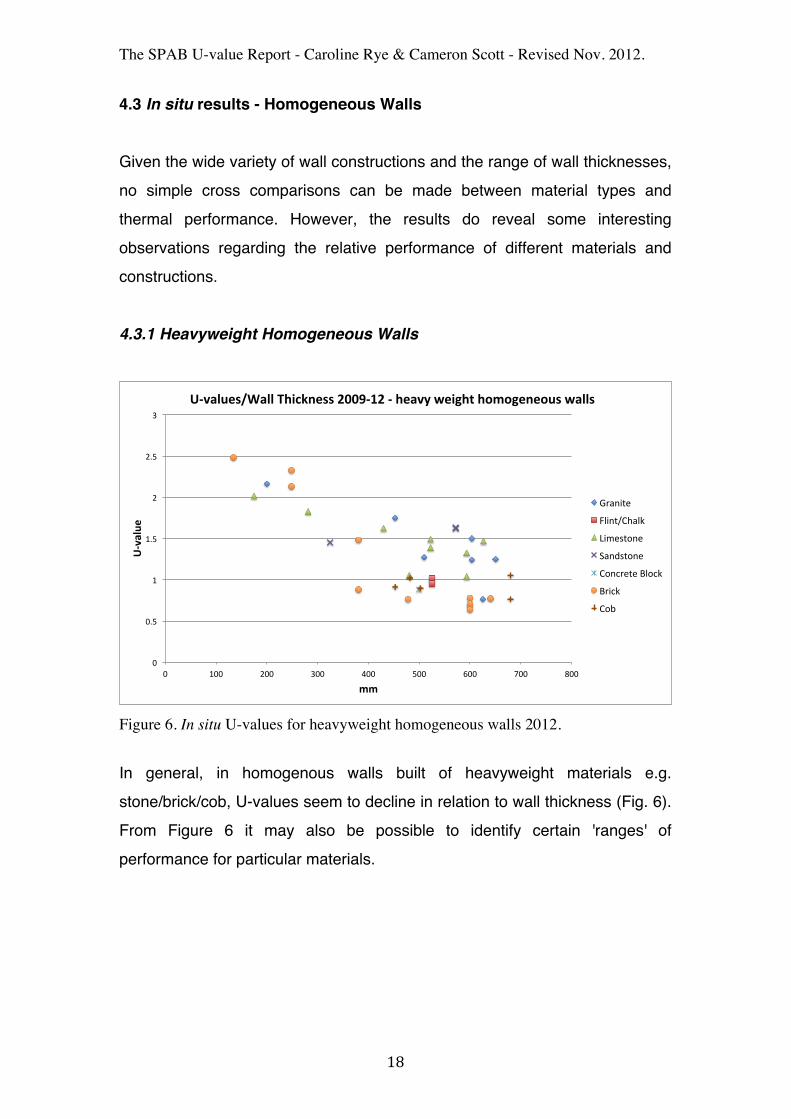
4.3 In situ results - Homogeneous Walls Given the wide variety of wall constructions and the range of wall thicknesses, no simple cross comparisons can be made between material types and thermal performance. However, the results do reveal some interesting observations regarding the relative performance of different materials and constructions. 4.3.1 Heavyweight Homogeneous Walls
Figure 6. In situ U-values for heavyweight homogeneous walls 2012. In general, in homogenous walls built of heavyweight materials e.g. stone/brick/cob, U-values seem to decline in relation to wall thickness (Fig. 6). From Figure 6 it may also be possible to identify certain 'ranges' of performance for particular materials.
!"
!#$"
%"
%#$"
&"
&#$"
'"
!" %!!" &!!" '!!" (!!" $!!" )!!" *!!" +!!"
!"#$%&'
(
))(
!"#$%&'*+,$%%(-./012'**(3445"63("(.'$#7(8'/9.:(.;);9'2';&*(8$%%*(
,-./012"
340/1567.48"
90:2;1</2"
=./>;1</2"
6</?-212"@4<?8"
@-0?8"
6<A"
The SPAB U-value Report - Caroline Rye & Cameron Scott - Revised Nov. 2012. !
!$=!
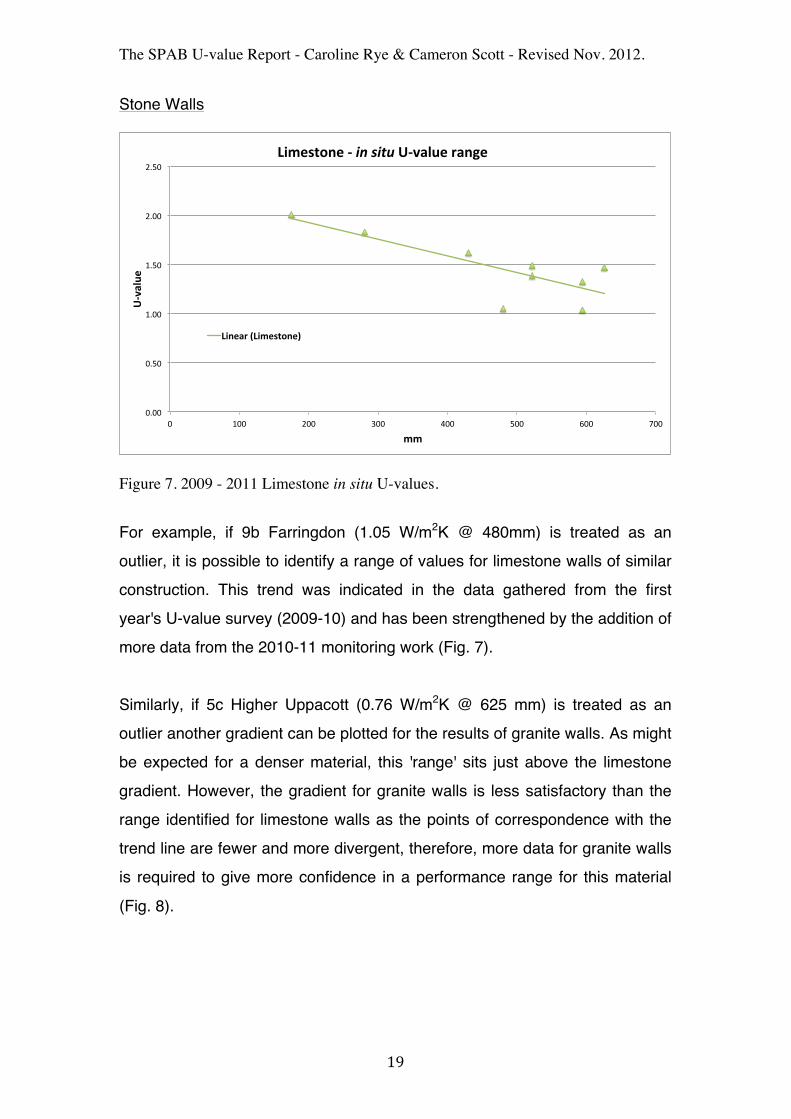
Stone Walls
!!Figure 7. 2009 - 2011 Limestone in situ U-values. For example, if 9b Farringdon (1.05 W/m2K @ 480mm) is treated as an outlier, it is possible to identify a range of values for limestone walls of similar construction. This trend was indicated in the data gathered from the first year's U-value survey (2009-10) and has been strengthened by the addition of more data from the 2010-11 monitoring work (Fig. 7). Similarly, if 5c Higher Uppacott (0.76 W/m2K @ 625 mm) is treated as an outlier another gradient can be plotted for the results of granite walls. As might be expected for a denser material, this 'range' sits just above the limestone gradient. However, the gradient for granite walls is less satisfactory than the range identified for limestone walls as the points of correspondence with the trend line are fewer and more divergent, therefore, more data for granite walls is required to give more confidence in a performance range for this material (Fig. 8).
!"!!#
!"$!#
%"!!#
%"$!#
&"!!#
&"$!#
!# %!!# &!!# '!!# (!!# $!!# )!!# *!!#
!"#$%&'
(
))(
*+)',-./'("(!"#$!%&#!"#$%&'(0$/1'(
*+/'$0(2*+)',-./'3(
The SPAB U-value Report - Caroline Rye & Cameron Scott - Revised Nov. 2012. !
!%"!
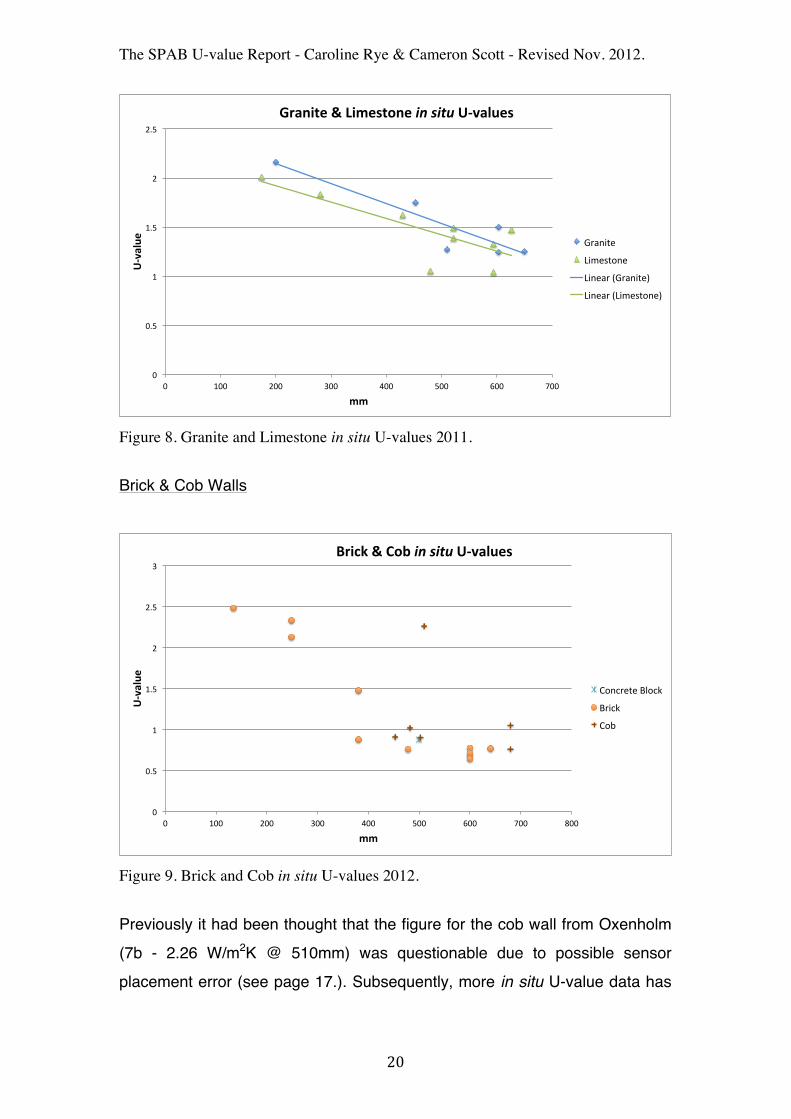
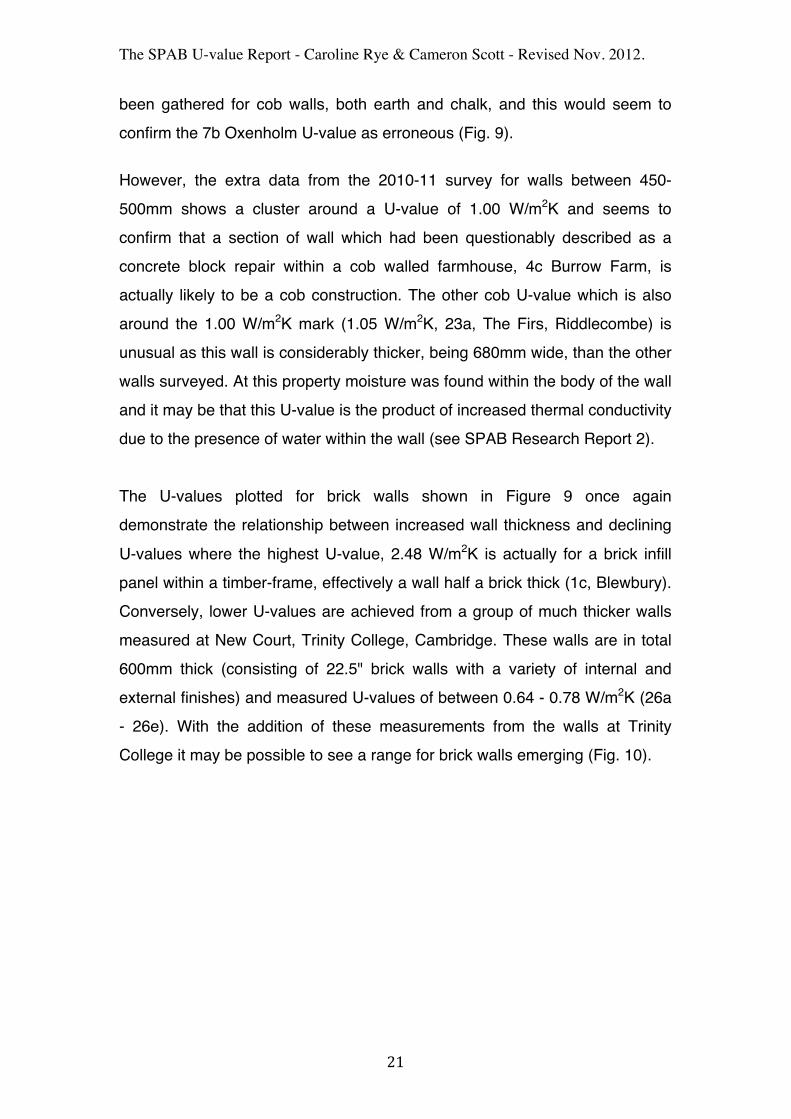
Figure 8. Granite and Limestone in situ U-values 2011. Brick & Cob Walls
Figure 9. Brick and Cob in situ U-values 2012. Previously it had been thought that the figure for the cob wall from Oxenholm (7b - 2.26 W/m2K @ 510mm) was questionable due to possible sensor placement error (see page 17.). Subsequently, more in situ U-value data has
!"
!#$"
%"
%#$"
&"
&#$"
!" %!!" &!!" '!!" (!!" $!!" )!!" *!!"
!"#$%&'
(
))(
*+$,-.'(/(0-)'1.2,'(!"#$!%&#!"#$%&'1(
+,-./01"
2/31405.1"
2/.1-,"6+,-./017"
2/.1-,"62/31405.17"
!"
!#$"
%"
%#$"
&"
&#$"
'"
!" %!!" &!!" '!!" (!!" $!!" )!!" *!!" +!!"
!"#$%&'
(
))(
*+,-.(/(012(!"#$!%&#!"#$%&'3(
,-./0121"34-/5"
306/5"
,-7"
The SPAB U-value Report - Caroline Rye & Cameron Scott - Revised Nov. 2012. !
!%$!
been gathered for cob walls, both earth and chalk, and this would seem to confirm the 7b Oxenholm U-value as erroneous (Fig. 9). However, the extra data from the 2010-11 survey for walls between 450-500mm shows a cluster around a U-value of 1.00 W/m2K and seems to confirm that a section of wall which had been questionably described as a concrete block repair within a cob walled farmhouse, 4c Burrow Farm, is actually likely to be a cob construction. The other cob U-value which is also around the 1.00 W/m2K mark (1.05 W/m2K, 23a, The Firs, Riddlecombe) is unusual as this wall is considerably thicker, being 680mm wide, than the other walls surveyed. At this property moisture was found within the body of the wall and it may be that this U-value is the product of increased thermal conductivity due to the presence of water within the wall (see SPAB Research Report 2). The U-values plotted for brick walls shown in Figure 9 once again demonstrate the relationship between increased wall thickness and declining U-values where the highest U-value, 2.48 W/m2K is actually for a brick infill panel within a timber-frame, effectively a wall half a brick thick (1c, Blewbury). Conversely, lower U-values are achieved from a group of much thicker walls measured at New Court, Trinity College, Cambridge. These walls are in total 600mm thick (consisting of 22.5" brick walls with a variety of internal and external finishes) and measured U-values of between 0.64 - 0.78 W/m2K (26a - 26e). With the addition of these measurements from the walls at Trinity College it may be possible to see a range for brick walls emerging (Fig. 10).
The SPAB U-value Report - Caroline Rye & Cameron Scott - Revised Nov. 2012. !
!%%!
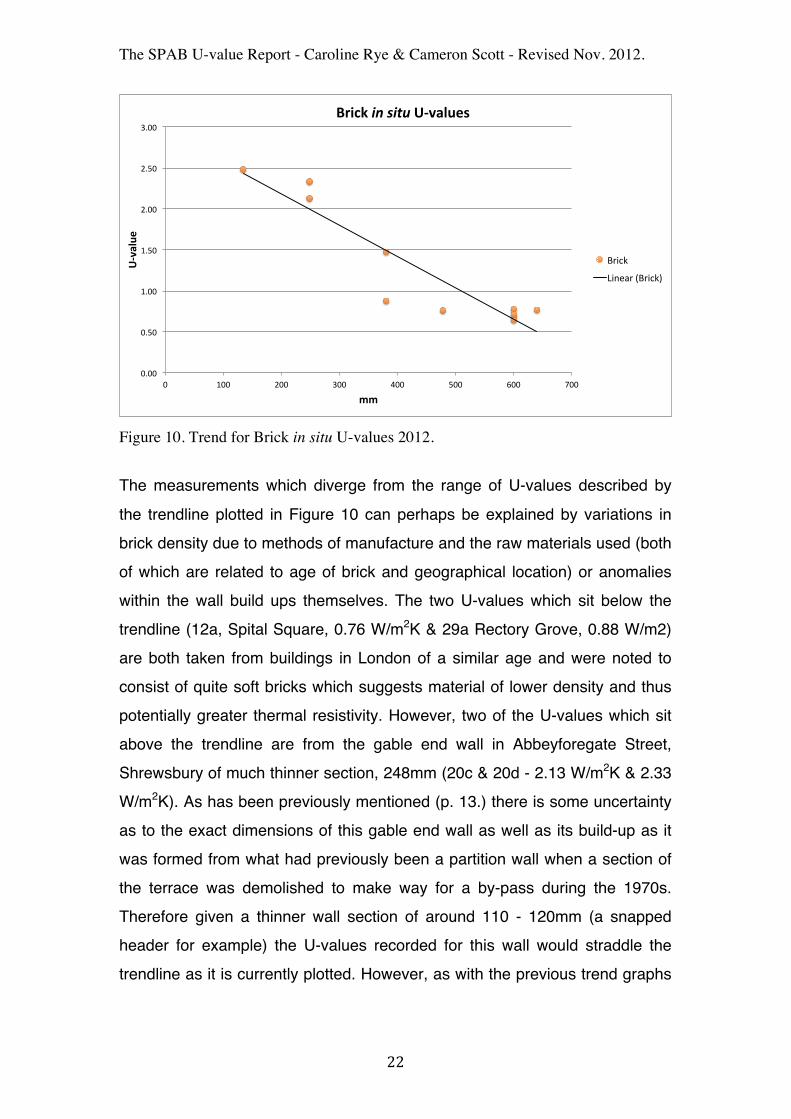
Figure 10. Trend for Brick in situ U-values 2012. The measurements which diverge from the range of U-values described by the trendline plotted in Figure 10 can perhaps be explained by variations in brick density due to methods of manufacture and the raw materials used (both of which are related to age of brick and geographical location) or anomalies within the wall build ups themselves. The two U-values which sit below the trendline (12a, Spital Square, 0.76 W/m2K & 29a Rectory Grove, 0.88 W/m2) are both taken from buildings in London of a similar age and were noted to consist of quite soft bricks which suggests material of lower density and thus potentially greater thermal resistivity. However, two of the U-values which sit above the trendline are from the gable end wall in Abbeyforegate Street, Shrewsbury of much thinner section, 248mm (20c & 20d - 2.13 W/m2K & 2.33 W/m2K). As has been previously mentioned (p. 13.) there is some uncertainty as to the exact dimensions of this gable end wall as well as its build-up as it was formed from what had previously been a partition wall when a section of the terrace was demolished to make way for a by-pass during the 1970s. Therefore given a thinner wall section of around 110 - 120mm (a snapped header for example) the U-values recorded for this wall would straddle the trendline as it is currently plotted. However, as with the previous trend graphs
!"!!#
!"$!#
%"!!#
%"$!#
&"!!#
&"$!#
'"!!#
!# %!!# &!!# '!!# (!!# $!!# )!!# *!!#
!"#$%&'
(
))(
*+,-.(!"#$!%&#!"#$%&'/(
+,-./#
0-123,#4+,-./5#
The SPAB U-value Report - Caroline Rye & Cameron Scott - Revised Nov. 2012. !
!%&!
for stone walls, more data is required to provide real confidence in the ranges described for the different wall materials under examination. There is as yet very limited in situ U-value data for flint and sandstone wall materials within this study. The three U-values for sandstones, 1.45 W/m2K for Malmstone (11b, Huckers Cottage), 1.63 & 1.62 W/m2K for Millstone Grit (21a & 21b, White House Farm) invert the normal trend as the lower value is for a thinner wall. This reflects the diversity of sandstone materials in general and their widely varying densities which makes establishing a range for this material type, even with increased sample numbers, problematic.
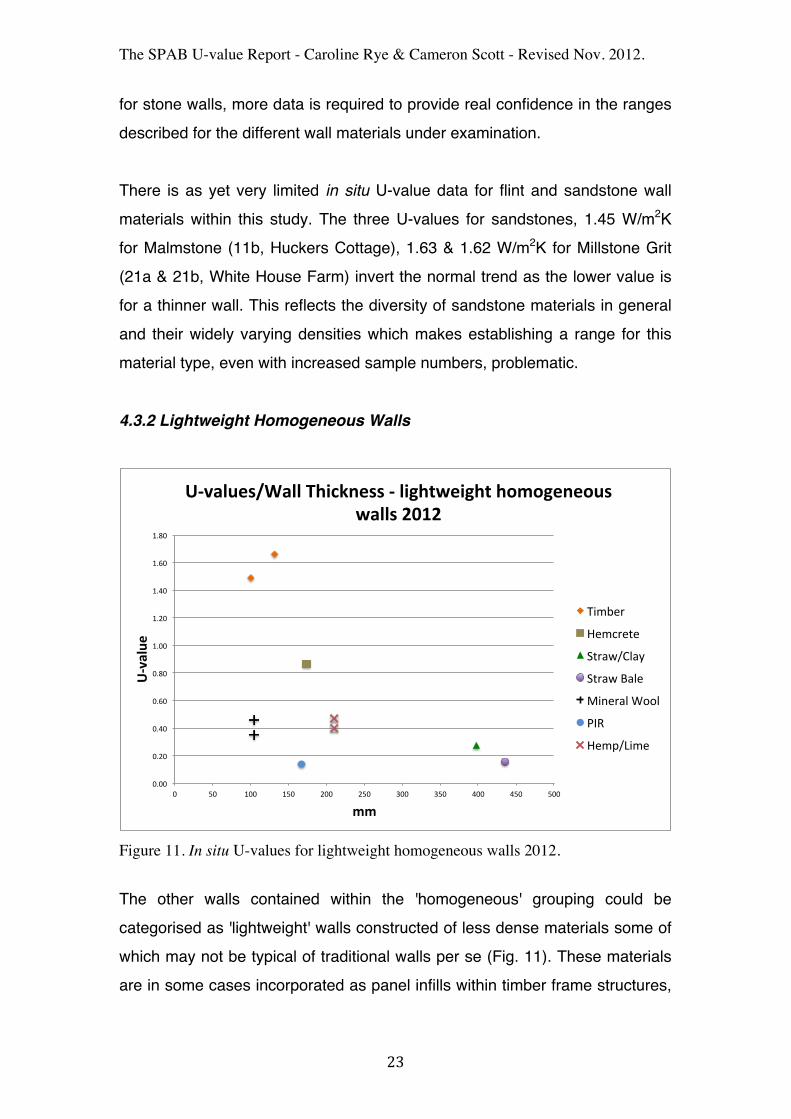
4.3.2 Lightweight Homogeneous Walls
Figure 11. In situ U-values for lightweight homogeneous walls 2012. The other walls contained within the 'homogeneous' grouping could be categorised as 'lightweight' walls constructed of less dense materials some of which may not be typical of traditional walls per se (Fig. 11). These materials are in some cases incorporated as panel infills within timber frame structures,
!"!!#
!"$!#
!"%!#
!"&!#
!"'!#
("!!#
("$!#
("%!#
("&!#
("'!#
!# )!# (!!# ()!# $!!# $)!# *!!# *)!# %!!# %)!# )!!#
!"#$%&'
(
))(
!"#$%&'*+,$%%(-./012'**("(%/3.45'/3.4(.6)63'2'6&*(5$%%*(7897(
+,-./0#
1/-20/3/#
430567895:#
43056#;59/#
<,=/059#>??9#
@AB#
1/-C7D,-/#
The SPAB U-value Report - Caroline Rye & Cameron Scott - Revised Nov. 2012. !
!%'!
such as the straw/clay example and some are of modern origin, such as the polyisocyanurate and mineral wool walls. There are also two U-values taken from the timber studs of the timber-frames themselves. In general less dense materials incorporate more trapped air and therefore have an insulative effect reducing heat loss. Because of this the relationship of increased wall thickness and decreased U-values found amongst heavyweight walls is not replicated within the lightweight walls in the study. The lowest U-values here come from straw/clay (11b, Huckers Cottage, 0.28 W/m2K @ 398mm), polyisocyanurate (2a, Blewbury, 0.14 W/m2K @ 168mm) infills and a Straw Bale wall (16a, The Walled Garden, 0.16 W/m2K @ 435mm) across a range of wall thickness. Other U-values measured between 0.50 - 1.00 W/m2K are for mineral wool (24c & 24d, Ashburton, 0.46 & 0.35 W/m2K) and hemcrete (1g, Blewbury, 0.87 W/m2K) both used as infills within timber-frames and also two U-values of 0.40 W/m2K and 0.47 W/m2K for a solid wall of hemp/lime measured at Haverhill. All these U-values are relatively low in relation to the heavier weight walls, as are the figures for timber studs at Blewbury, 1.66 & 1.49 W/m2K (1d & 1f) and are a function of the thinness of these walls in relation to the reduced density of their construction material. 4.4 In situ results - Heterogeneous Walls The identification of walls as 'heavyweight' or 'lightweight' becomes more problematic when discussing the heterogeneous walls sampled within this study. This is particularly the case when secondary lightweight additions have been made to existing heavyweight walls to reduce heat loss thus changing the nature of these walls. Perhaps unsurprisingly, given its preeminence as a building material within the UK, there are a substantial number of brick walls within the study, as well as a few stone walls, which feature an additional layer or layers of material, most of which also incorporate some sort of a cavity or air gap. Four of these heterogeneous brick walls with cavities are historic; the wainscot paneled wall at Spital Square and three of the walls measured at New Court, Trinity College which have a lath and plaster lining. A
The SPAB U-value Report - Caroline Rye & Cameron Scott - Revised Nov. 2012. !
!%(!
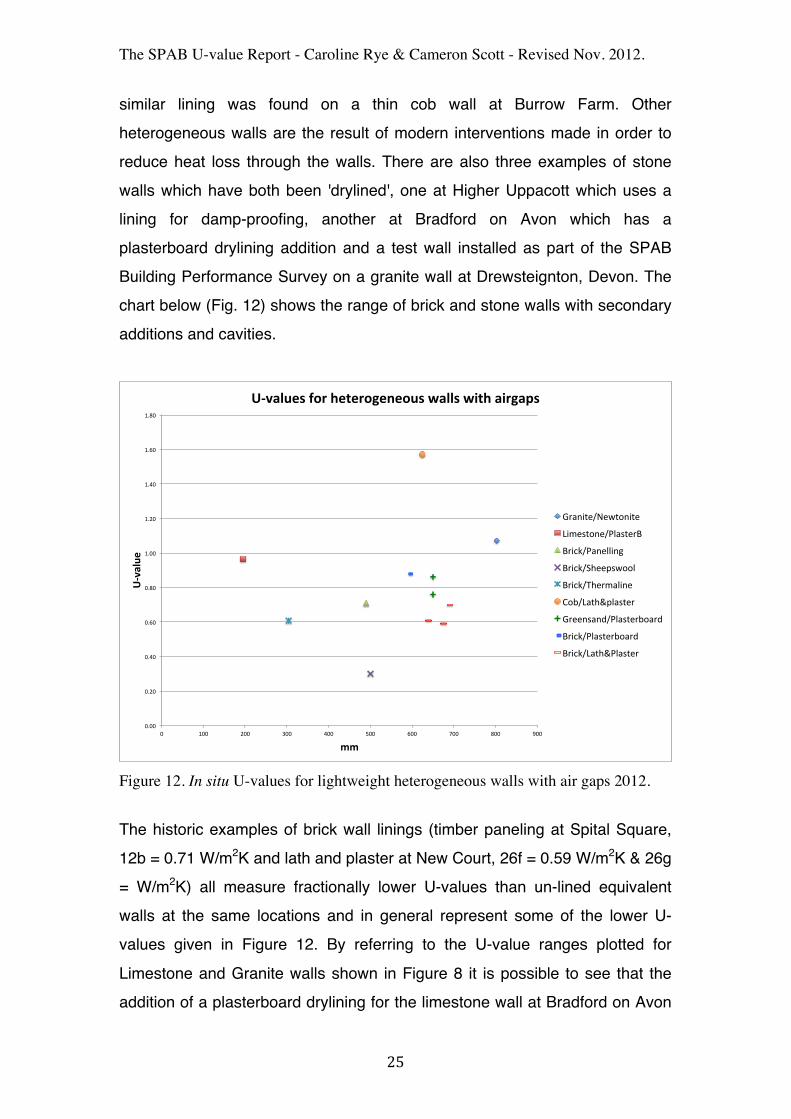
similar lining was found on a thin cob wall at Burrow Farm. Other heterogeneous walls are the result of modern interventions made in order to reduce heat loss through the walls. There are also three examples of stone walls which have both been 'drylined', one at Higher Uppacott which uses a lining for damp-proofing, another at Bradford on Avon which has a plasterboard drylining addition and a test wall installed as part of the SPAB Building Performance Survey on a granite wall at Drewsteignton, Devon. The chart below (Fig. 12) shows the range of brick and stone walls with secondary additions and cavities.
Figure 12. In situ U-values for lightweight heterogeneous walls with air gaps 2012. The historic examples of brick wall linings (timber paneling at Spital Square, 12b = 0.71 W/m2K and lath and plaster at New Court, 26f = 0.59 W/m2K & 26g = W/m2K) all measure fractionally lower U-values than un-lined equivalent walls at the same locations and in general represent some of the lower U-values given in Figure 12. By referring to the U-value ranges plotted for Limestone and Granite walls shown in Figure 8 it is possible to see that the addition of a plasterboard drylining for the limestone wall at Bradford on Avon
!"!!#
!"$!#
!"%!#
!"&!#
!"'!#
("!!#
("$!#
("%!#
("&!#
("'!#
!# (!!# $!!# )!!# %!!# *!!# &!!# +!!# '!!# ,!!#
!"#$%&'
(
))(
!"#$%&'*(+,-(.'/'-,0'1',&*(2$%%*(23/.($3-0$4*(
-./01234536270123#
8193:27034;</:23.=#
=.1>?4;/03<<10@#
=.1>?4AB33C:677<#
=.1>?4DB3.9/<103#
E7F48/2BGC</:23.#
-.330:/0H4;</:23.F7/.H#
=.1>?4;</:23.F7/.H#
=.1>?48/2BG;</:23.#
The SPAB U-value Report - Caroline Rye & Cameron Scott - Revised Nov. 2012. !
!%)!
(8b, 196mm = 0.97 W/m2K) provides a U-value well below the figure predicted for a wall of equivalent thickness without a drylining, approximately. 1.9 W/mK. However the same cannot be said for the Granite example from Higher Uppacott where the U-value of 1.07 W/m2K recorded for a 803mm wall seems quite high when matched against the trendline plotted for Granite walls in Figure 8. Overall, variations in the thicknesses of the air gaps found for these walls and crucially whether the air present within them can really be said to be 'still' or otherwise will have a significant influence on the thermal conductivity of the wall as a whole. As will the thickness of any material that is incorporated within the build up specifically for the purposes of insulating the wall. Therefore it is difficult to make meaningful comparisons for this particular sub-grouping of walls. There are some walls which have received an additional treatment without the incorporation of an air gap or cavity where brick walls have been subject to either external or internal insulation using expanded polystyrene, insulating lime render, reedboard, woodfibre board or hemcrete. Some of the walls that do not incorporate any form of air gap combine two materials as panel infills for timber-frames; one being the traditional treatment of wattle and daub and others more modern interventions such as the addition of reedboard or hemcrete to existing brick and timber stud work or another example where the original panel infill material has been replaced with sheep's wools combined with a woodfibre board (Fig. 12).
The SPAB U-value Report - Caroline Rye & Cameron Scott - Revised Nov. 2012. !
!%*!
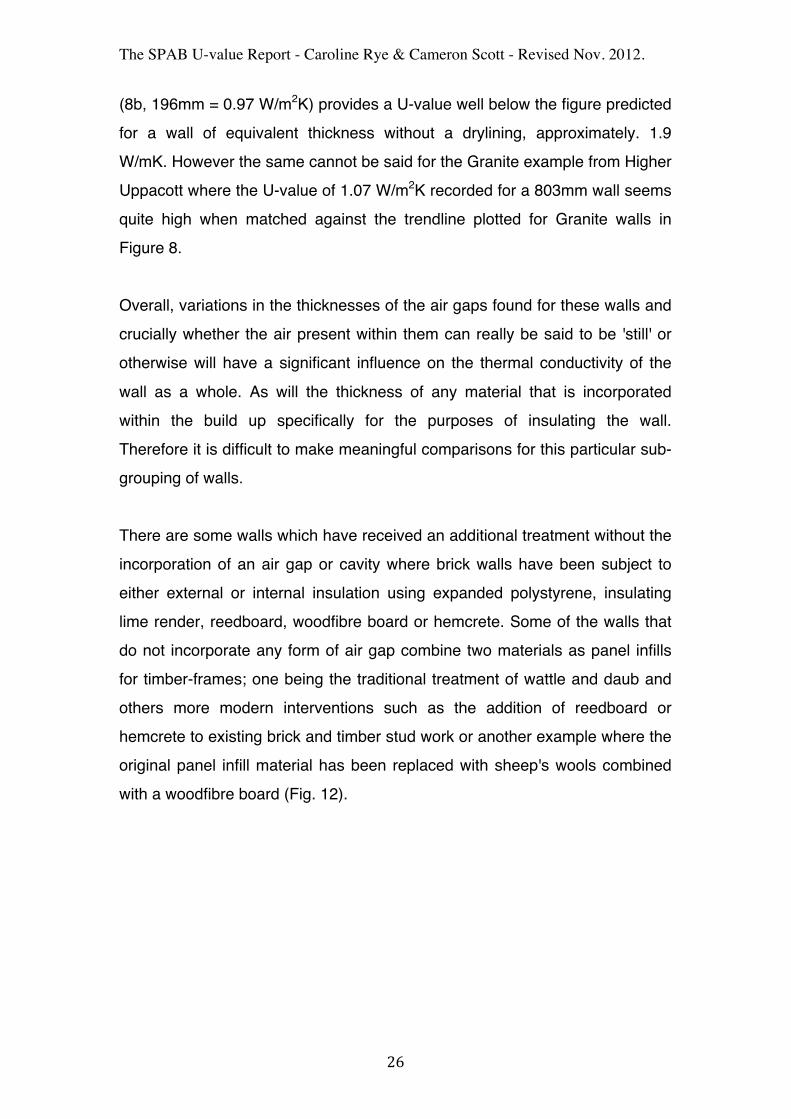
Figure 13. In situ U-values for lightweight heterogeneous walls without air gaps 2012. Although most of the walls shown in Figure 13 feature some form of refurbishment the exception to this are the two measurements for Wattle and Daub infill panels (1e & 3a) which inevitably record quite high U-values (2.03 and 1.69 W/m2K) being of thin wall section and consisting principally of a heavyweight material (clay/daub). The two walls with the lowest U-values either comprise of entirely lightweight and therefore highly insulating materials (13a & 13b, 0.35 and 0.19 W/m2K) or are a combination of a thick granite wall 580mm and a substantial addition of a lightweight insulating material 100mm PIR (25c = 0.16 W/m2K). Once again, however, due to the range of materials involved in the build-ups of these walls and the relative proportions of heavy and lightweight elements comparison between individual walls becomes largely irrelevant. Perhaps of more significance is the consideration of refurbished walls in general and a discussion of these walls is included in the next section of this report.
!"!!#
!"$!#
%"!!#
%"$!#
&"!!#
&"$!#
!# %!!# &!!# '!!# (!!# $!!# )!!# *!!# +!!#
!"#$%&'
()
**)
!"#$%&'()+,-).'/'-,0'1',&()(,%23)4$%%()
,-./01234#56786-9:;<#
,-./01=9>?;:@9A#-69B6-#
,-./01C66BDE:-B#
F:G;6#H#I:?D#
J.KD6-1C66BDE:-B#
J.KD6-1L6K/-686#
FEEBMD-614N66O>PEE;#
Q-:9.8613=C#
,-./01FEEBMD-6#
RED1=9>?;:@9A#C69B6-#
The SPAB U-value Report - Caroline Rye & Cameron Scott - Revised Nov. 2012. !
!%#!
4.5 In situ Discussion
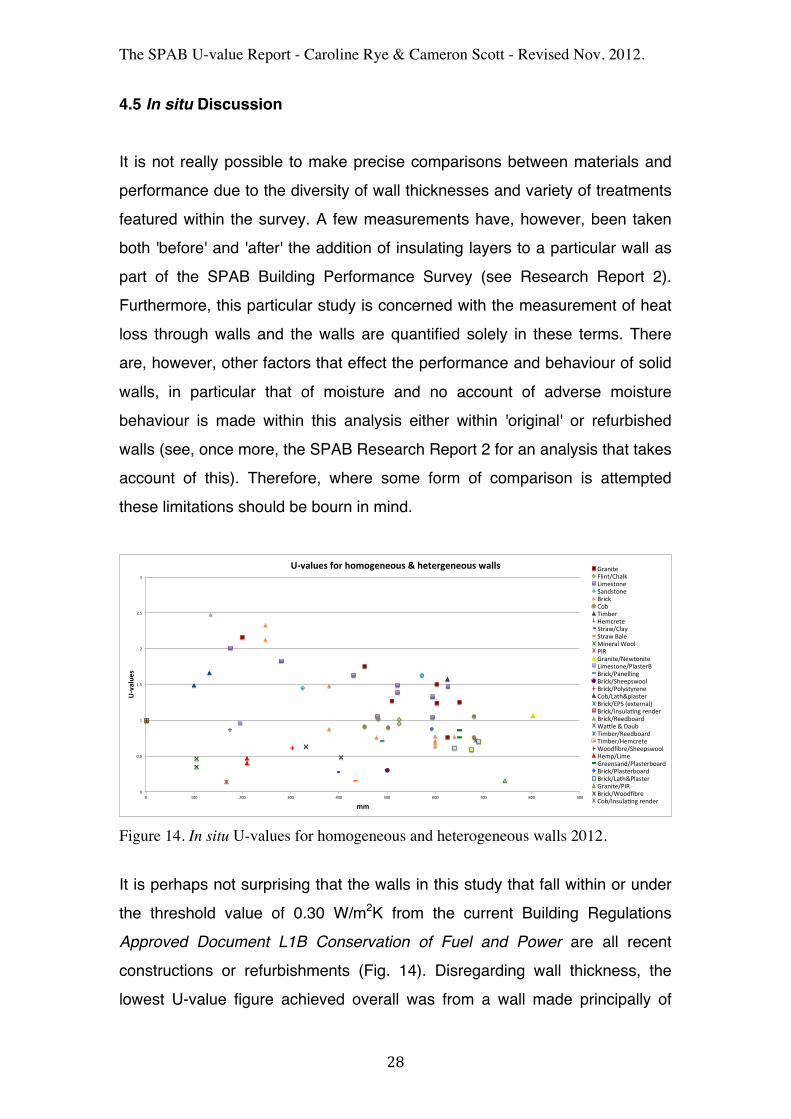
It is not really possible to make precise comparisons between materials and performance due to the diversity of wall thicknesses and variety of treatments featured within the survey. A few measurements have, however, been taken both 'before' and 'after' the addition of insulating layers to a particular wall as part of the SPAB Building Performance Survey (see Research Report 2). Furthermore, this particular study is concerned with the measurement of heat loss through walls and the walls are quantified solely in these terms. There are, however, other factors that effect the performance and behaviour of solid walls, in particular that of moisture and no account of adverse moisture behaviour is made within this analysis either within 'original' or refurbished walls (see, once more, the SPAB Research Report 2 for an analysis that takes account of this). Therefore, where some form of comparison is attempted these limitations should be bourn in mind.
Figure 14. In situ U-values for homogeneous and heterogeneous walls 2012. It is perhaps not surprising that the walls in this study that fall within or under the threshold value of 0.30 W/m2K from the current Building Regulations Approved Document L1B Conservation of Fuel and Power are all recent constructions or refurbishments (Fig. 14). Disregarding wall thickness, the lowest U-value figure achieved overall was from a wall made principally of
!"
!#$"
%"
%#$"
&"
&#$"
'"
!" %!!" &!!" '!!" (!!" $!!" )!!" *!!" +!!" ,!!"
!"#$%&'
()
**)
!"#$%&'()+,-).,*,/'0',&()1).'2'-/'0',&()3$%%() -./0123"45102678/59":1;3<2=03">/0?<2=03"@.1A9"7=B"C1;B3."D3;A.323">2./E675/F">2./E"@/53"G103./5"H==5"IJK"-./01236L3E2=0123":1;3<2=036I5/<23.@"@.1A96I/035510M"@.1A96>833N<E==5"@.1A96I=5F<2F.303"7=B6:/28ON5/<23."@.1A96PI>"Q3R23.0/5S"@.1A96J0<T5/U0M".30?3."@.1A96K33?B=/.?"H/V53"O"W/TB"C1;B3.6K33?B=/.?"C1;B3.6D3;A.323"H==?XB.36>833N<E==5"D3;N6:1;3"-.330</0?6I5/<23.B=/.?"@.1A96I5/<23.B=/.?"@.1A96:/28OI5/<23."-./01236IJK"@.1A96H==?XB.3"7=B6J0<T5/U0M".30?3."
The SPAB U-value Report - Caroline Rye & Cameron Scott - Revised Nov. 2012. !
!%=!
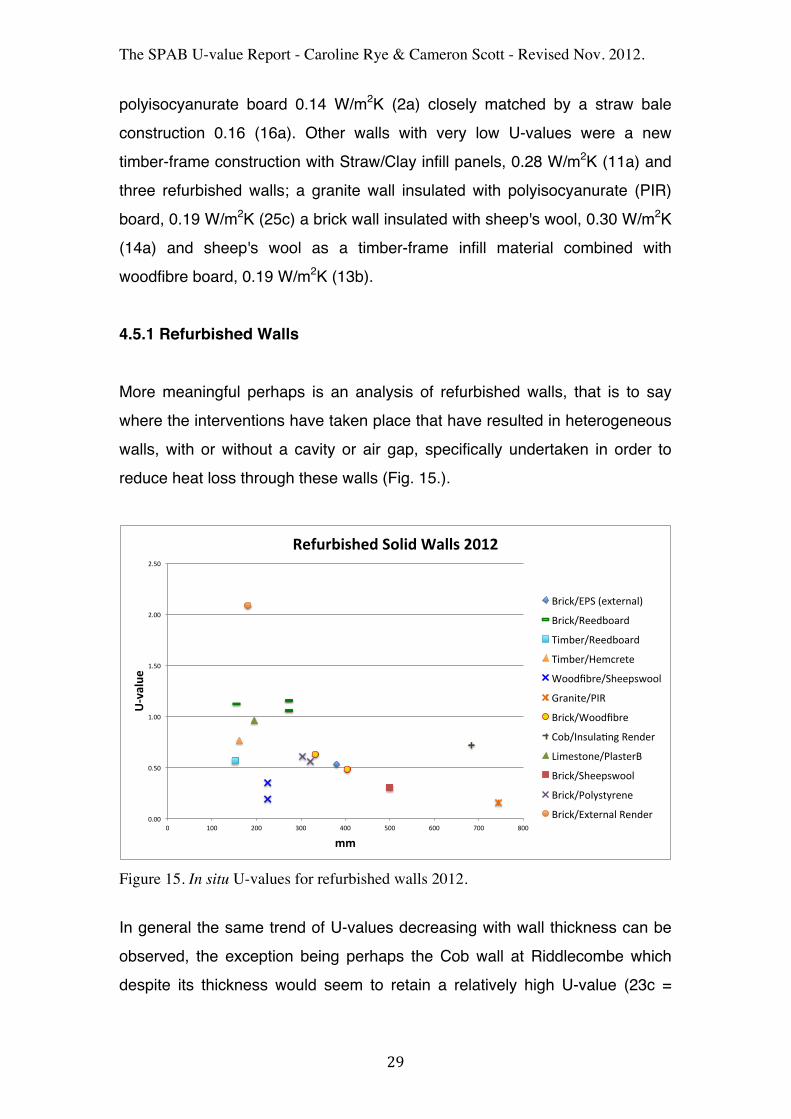
polyisocyanurate board 0.14 W/m2K (2a) closely matched by a straw bale construction 0.16 (16a). Other walls with very low U-values were a new timber-frame construction with Straw/Clay infill panels, 0.28 W/m2K (11a) and three refurbished walls; a granite wall insulated with polyisocyanurate (PIR) board, 0.19 W/m2K (25c) a brick wall insulated with sheep's wool, 0.30 W/m2K (14a) and sheep's wool as a timber-frame infill material combined with woodfibre board, 0.19 W/m2K (13b). 4.5.1 Refurbished Walls More meaningful perhaps is an analysis of refurbished walls, that is to say where the interventions have taken place that have resulted in heterogeneous walls, with or without a cavity or air gap, specifically undertaken in order to reduce heat loss through these walls (Fig. 15.).
Figure 15. In situ U-values for refurbished walls 2012. In general the same trend of U-values decreasing with wall thickness can be observed, the exception being perhaps the Cob wall at Riddlecombe which despite its thickness would seem to retain a relatively high U-value (23c =
!"!!#
!"$!#
%"!!#
%"$!#
&"!!#
&"$!#
!# %!!# &!!# '!!# (!!# $!!# )!!# *!!# +!!#
!"#$%&'
(
))(
*'+&,-./0'1(23%.1(4$%%/(5675(
,-./01234#56786-9:;<#
,-./01=66>?@:->#
A.B?6-1=66>?@:->#
A.B?6-1C6B/-686#
D@@>E?-614F66GHI@@;#
J-:9.8613K=#
,-./01D@@>E?-6#
L@?1K9HM;:N9O#=69>6-#
P.B6H8@9613;:H86-,#
,-./014F66GHI@@;#
,-./013@;QH8Q-696#
,-./012786-9:;#=69>6-#
The SPAB U-value Report - Caroline Rye & Cameron Scott - Revised Nov. 2012. !
!&"!
0.72 W/m2K). This is the wall that has been observed to be wet and indeed the pre and post-refurbishment U-values for this wall show little change in measured heat loss. It is possible that the damp condition of the wall is increasing it's thermal conductivity or that the insulation provided by the external render, which is only 40mm thick, is not having a significant effect on the thermal behaviour of the wall, this is discussed in more detail in SPAB Research Report 2. Similarly, albeit for a much thinner wall, the brick wall in Shrewsbury, 20b also treated with an external render would seem to record a U-value (2.09 W/m2K) that sits above the general trend for refurbished walls. The chart shown in Figure 15 contains walls that incorporate both lightweight and heavyweight materials in different proportions therefore there can be a considerable range of U-values seen for walls of similar thicknesses. For example, the 225mm wall from Tyland Farm, which has U-values of 0.19 and 0.35 W/m2K (13a & 13b) consists entirely of lightweight insulating materials used as new infill panels within an historic timber-frame. The 273mm wall recorded at Cholsey consists largely of brick (230mm) and is therefore predominantly a heavyweight wall with the thin addition of lightweight reedboard for insulation, it subsequently provided U-values of 1.06 and 1.16 W/m2K. Therefore no simple equivalences should be drawn between wall thickness and potential refurbished wall U-values as each circumstance will determine the possibilities of what materials can be deployed to best effect taking into account numerous factors including historic fabric, loss of interior room space and general buildablility. 4.5.2 Timber-frames. It is perhaps also useful to look at performance and treatments for particular types of building. Measurements taken within the timber-framed houses in Blewbury, Oxfordshire show poor thermal performance from traditional infill materials: 2.48 W/m2K for 102.5mm brick (1c); and a marginally improved 2.03 W/m2K for 103mm wattle and daub (1e). As is to be expected, the timber stud element of the frame achieves a better performance with a figure of 1.49
The SPAB U-value Report - Caroline Rye & Cameron Scott - Revised Nov. 2012. !
!&$!
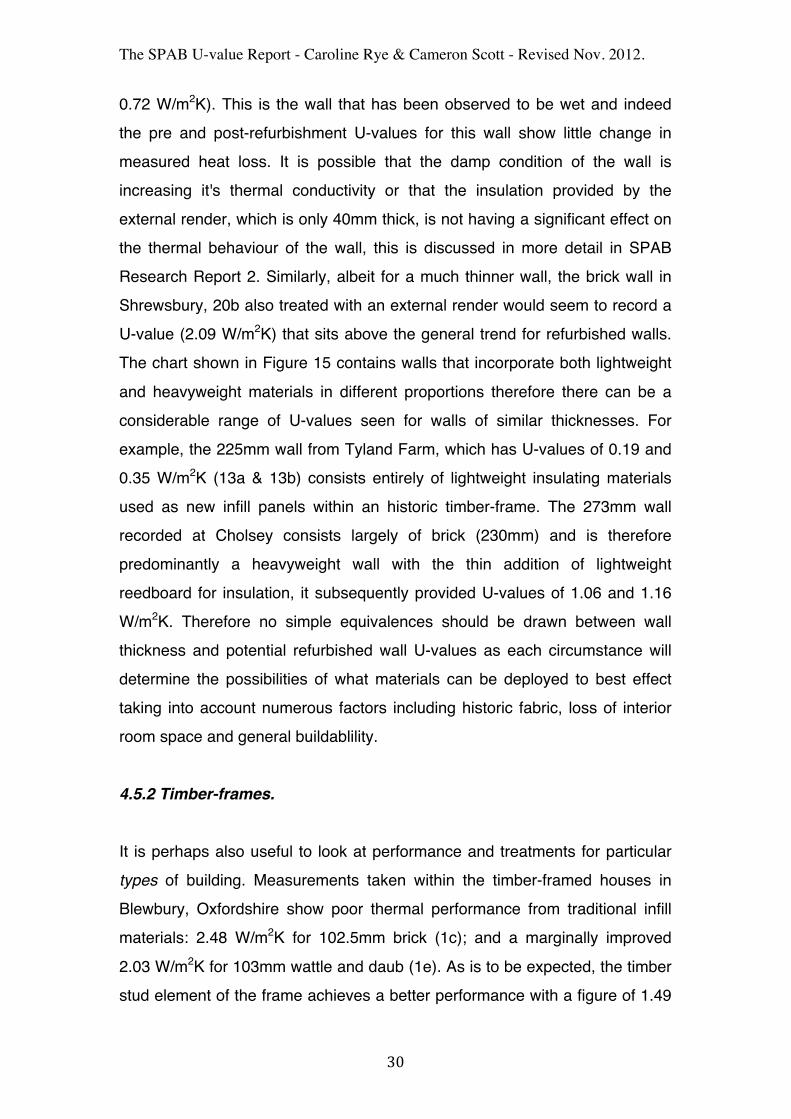
W/m2K for a 100mm stud (1f). These U-values are primarily a function of the thinness of the walls (U-values tend to decrease with increased wall thickness) and the relative densities of the materials involved. Mass infill materials, hemcrete and straw/clay, which can be used as infill in timber frame buildings, perform better than the traditional materials; hemcrete with a value of 0.87 W/m2K at 150mm (1g) and Straw/Clay at 0.28 W/m2K @ 300mm (11a). However these materials are used in greater proportions to form thicker walls and are more lightweight (less dense) than traditional infill materials. Other materials that exhibit low U-values within panel infills are modern insulation materials and are extremely lightweight; sheep's wool and woodfibre board, 0.19 & 0.35 W/m2K (13a & 13b), polyisocyanurate (PIR) board, 0.14 W/m2K (2a) and mineral wool, 0.46 and 0.35 W/m2K (24c & 24d) (Fig. 16).
Figure 16. In situ U-values for timber-frame infill panels 2011. 4.5.3 Refurbished Timber Frame Walls.
A number of walls within the study group had been subject to some form of 'refurbishment' motivated by concerns of improving the wall's thermal
!"
!#$"
%"
%#$"
&"
&#$"
!" $!" %!!" %$!" &!!" &$!" '!!" '$!" (!!" ($!"
!"#$%&'
(
))(
!"#$%&'*(+,-(.)/'-"+-$)'(012%%(3$1'%*(
)*+,-*.*"
/.-0123405"
678*-04"9::4"
/;**<=1::4"
>?@"
90A4*"B"C0DE"
The SPAB U-value Report - Caroline Rye & Cameron Scott - Revised Nov. 2012. !
!&%!
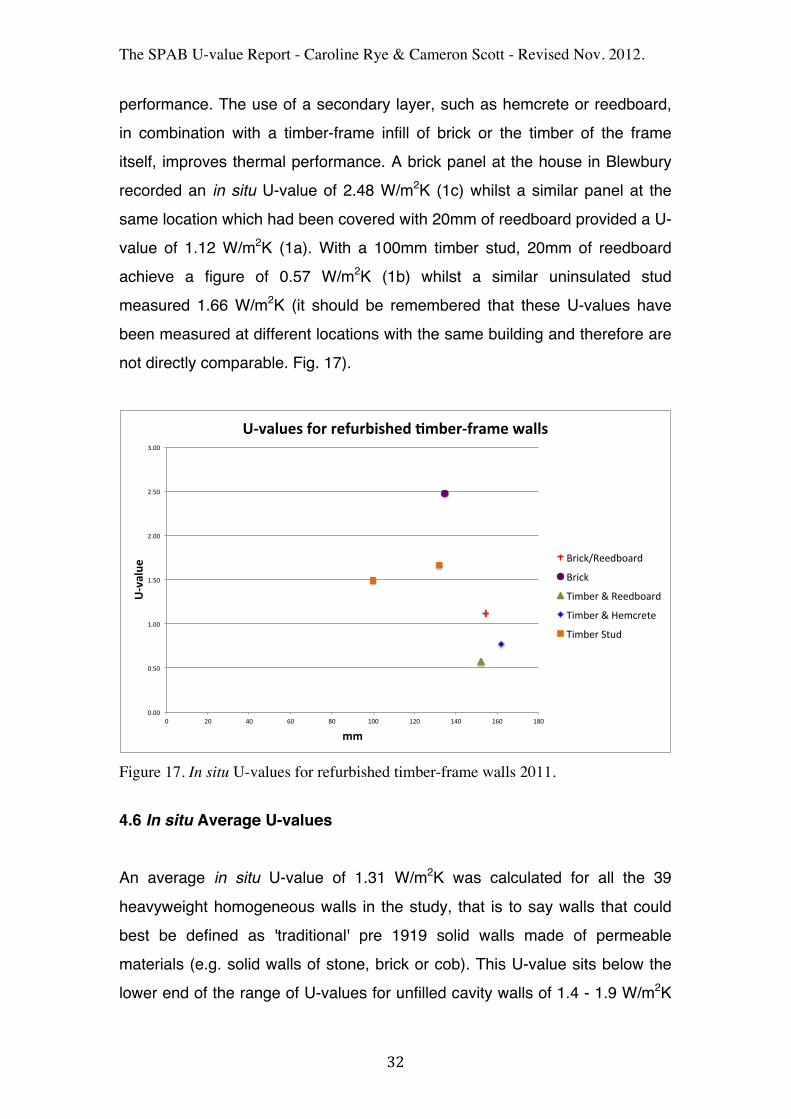
performance. The use of a secondary layer, such as hemcrete or reedboard, in combination with a timber-frame infill of brick or the timber of the frame itself, improves thermal performance. A brick panel at the house in Blewbury recorded an in situ U-value of 2.48 W/m2K (1c) whilst a similar panel at the same location which had been covered with 20mm of reedboard provided a U-value of 1.12 W/m2K (1a). With a 100mm timber stud, 20mm of reedboard achieve a figure of 0.57 W/m2K (1b) whilst a similar uninsulated stud measured 1.66 W/m2K (it should be remembered that these U-values have been measured at different locations with the same building and therefore are not directly comparable. Fig. 17).
Figure 17. In situ U-values for refurbished timber-frame walls 2011. 4.6 In situ Average U-values An average in situ U-value of 1.31 W/m2K was calculated for all the 39 heavyweight homogeneous walls in the study, that is to say walls that could best be defined as 'traditional' pre 1919 solid walls made of permeable materials (e.g. solid walls of stone, brick or cob). This U-value sits below the lower end of the range of U-values for unfilled cavity walls of 1.4 - 1.9 W/m2K
!"!!#
!"$!#
%"!!#
%"$!#
&"!!#
&"$!#
'"!!#
!# &!# (!# )!# *!# %!!# %&!# %(!# %)!# %*!#
!"#$%&'
(
))(
!"#$%&'*(+,-(-'+&-./*0'1(2).'-"+-$)'(3$%%*(
+,-./01223456,3#
+,-./#
7-842,#9#1223456,3#
7-842,#9#:28.,2;2#
7-842,#<;=3#
The SPAB U-value Report - Caroline Rye & Cameron Scott - Revised Nov. 2012. !
!&&!
identified by Hens et al5 in a study of brick cavity walls. A further average in
situ U-value of 1.36 W/m2K was calculated solely for the 32 solid stone or brick walls in the study or 1.42 W/m2K for the 21 stone walls and 1.24 W/m2K for the 11 solid brick walls. These figures are lower than the U-values given for stone (2.4 & 2.1 W/m2K) and brick walls (2.1 W/m2K) in Table S6: Wall U-
values for England and Wales in Appendix S of the Standard Assessment Procedure (SAP) 2009 document used in the calculation of SAP ratings for existing buildings (RdSAP)6. 4.7 BuildDesk/BR 443 Comparison Results
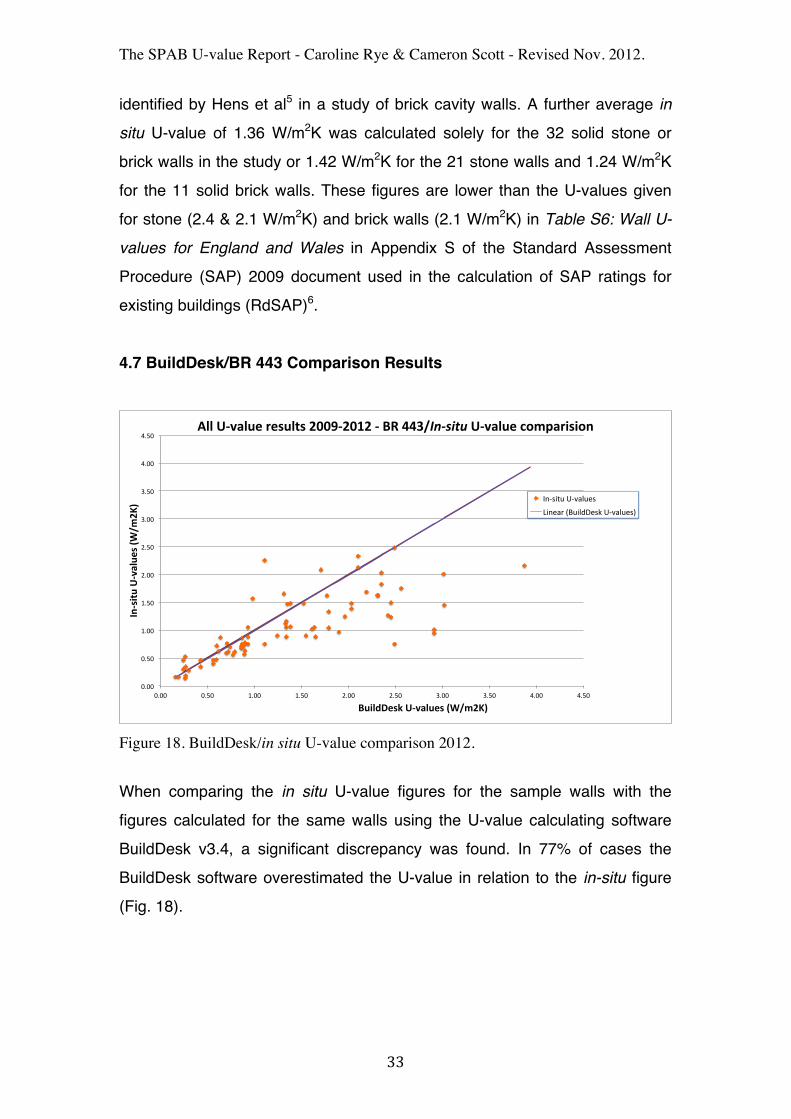
Figure 18. BuildDesk/in situ U-value comparison 2012. When comparing the in situ U-value figures for the sample walls with the figures calculated for the same walls using the U-value calculating software BuildDesk v3.4, a significant discrepancy was found. In 77% of cases the BuildDesk software overestimated the U-value in relation to the in-situ figure (Fig. 18).
!"!!#
!"$!#
%"!!#
%"$!#
&"!!#
&"$!#
'"!!#
'"$!#
("!!#
("$!#
!"!!# !"$!# %"!!# %"$!# &"!!# &"$!# '"!!# '"$!# ("!!# ("$!#
!"#$%&'
()#*+,'-
$(./01
234(
5'%,67-$8()#*+,'-$(./01234((
9,,()#*+,'-(:-$',&$(2;;<#2;=2(#(5>(??@0!"#$%&'()#*+,'-(AB1C+:%$%B"(
)*+,-./#0+123/4,#
5-*426#78/-39:4,;#0+123/4,<#
The SPAB U-value Report - Caroline Rye & Cameron Scott - Revised Nov. 2012. !
!&'!
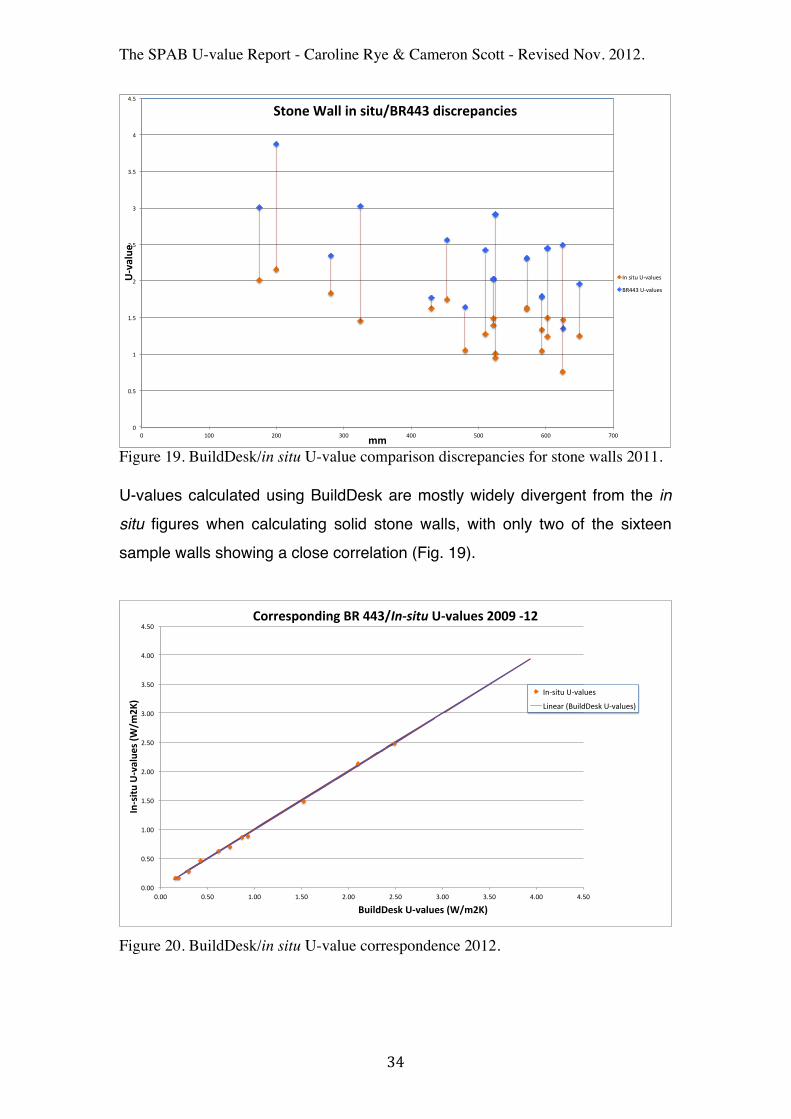
!Figure 19. BuildDesk/in situ U-value comparison discrepancies for stone walls 2011. !U-values calculated using BuildDesk are mostly widely divergent from the in
situ figures when calculating solid stone walls, with only two of the sixteen sample walls showing a close correlation (Fig. 19).
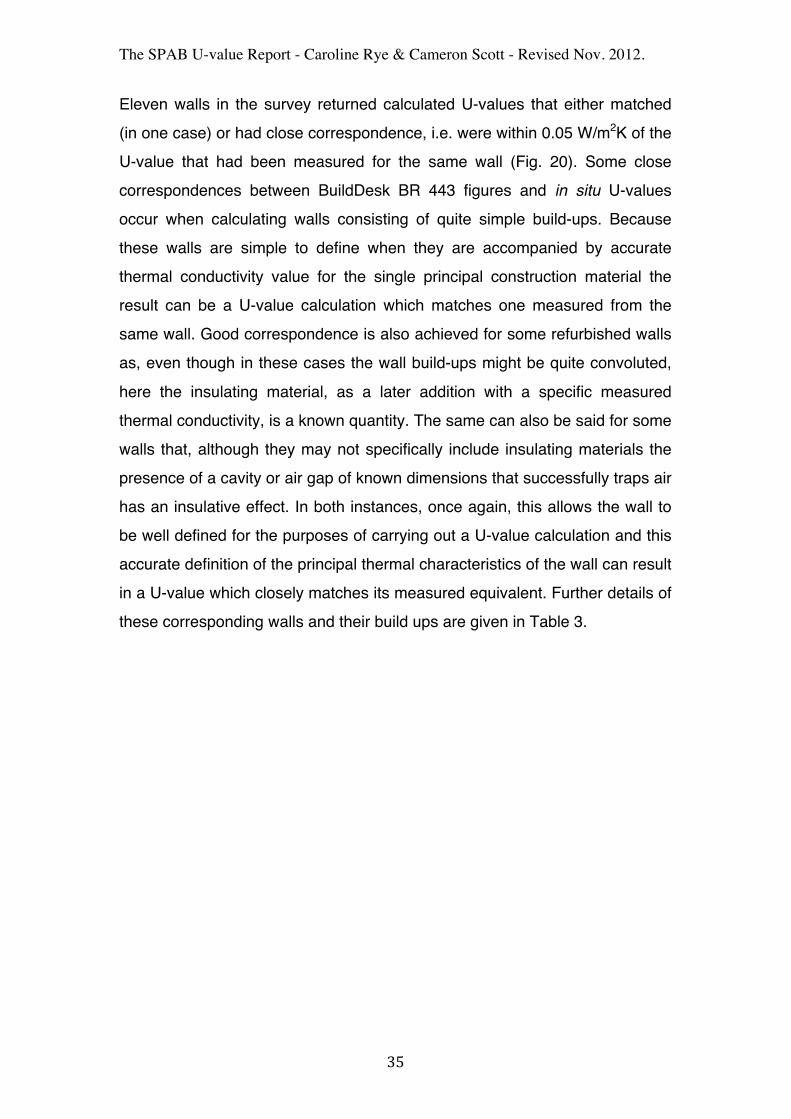
Figure 20. BuildDesk/in situ U-value correspondence 2012.
!"
!#$"
%"
%#$"
&"
&#$"
'"
'#$"
("
(#$"
!" %!!" &!!" '!!" (!!" $!!" )!!" *!!"
!"#$%&'
(
))(
*+,-'(.$%%(/-(0/+&123445(6/078'9$-7/'0(
+,"-./0"1234506-"
78(('"1234506-"
!"!!#
!"$!#
%"!!#
%"$!#
&"!!#
&"$!#
'"!!#
'"$!#
("!!#
("$!#
!"!!# !"$!# %"!!# %"$!# &"!!# &"$!# '"!!# '"$!# ("!!# ("$!#
!"#$%&'
()#*+,'-
$(./01
234(
5'%,67-$8()#*+,'-$(./01234((
9:;;-$<:"6%"=(5>(??@0!"#$%&'()#*+,'-$(2AAB(#C2(
)*+,-./#0+123/4,#
5-*426#78/-39:4,;#0+123/4,<#
The SPAB U-value Report - Caroline Rye & Cameron Scott - Revised Nov. 2012. !
!&(!
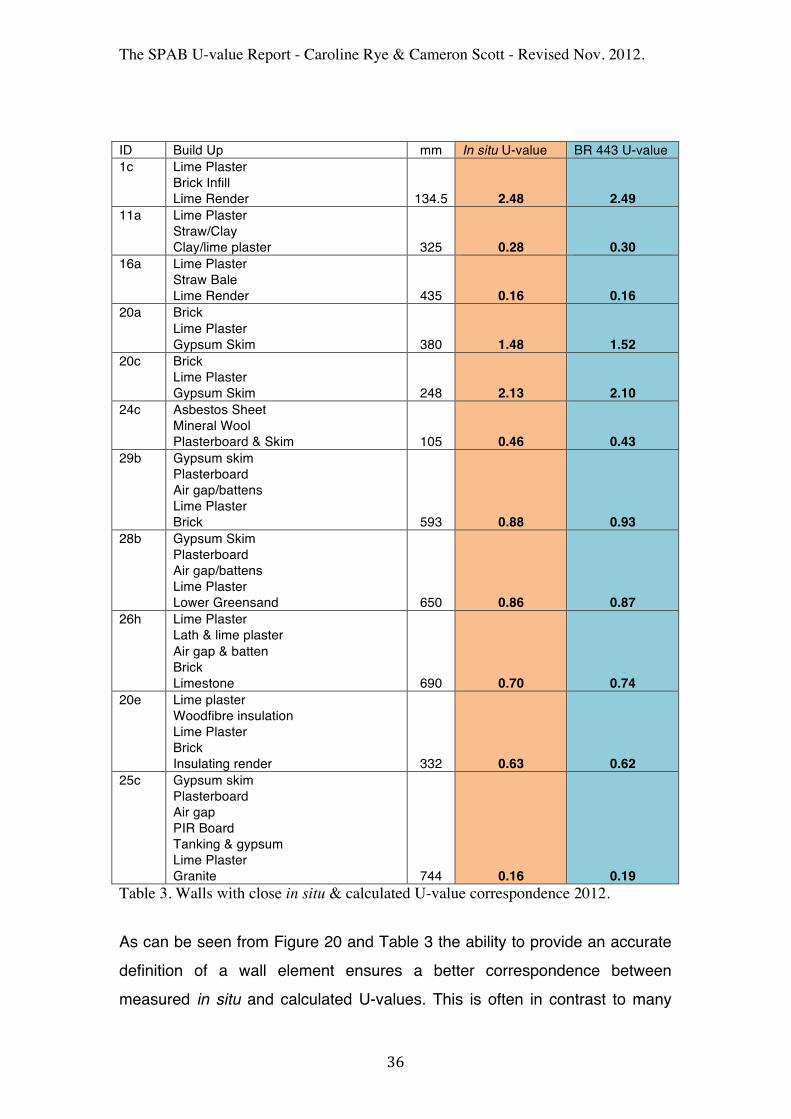
Eleven walls in the survey returned calculated U-values that either matched (in one case) or had close correspondence, i.e. were within 0.05 W/m2K of the U-value that had been measured for the same wall (Fig. 20). Some close correspondences between BuildDesk BR 443 figures and in situ U-values occur when calculating walls consisting of quite simple build-ups. Because these walls are simple to define when they are accompanied by accurate thermal conductivity value for the single principal construction material the result can be a U-value calculation which matches one measured from the same wall. Good correspondence is also achieved for some refurbished walls as, even though in these cases the wall build-ups might be quite convoluted, here the insulating material, as a later addition with a specific measured thermal conductivity, is a known quantity. The same can also be said for some walls that, although they may not specifically include insulating materials the presence of a cavity or air gap of known dimensions that successfully traps air has an insulative effect. In both instances, once again, this allows the wall to be well defined for the purposes of carrying out a U-value calculation and this accurate definition of the principal thermal characteristics of the wall can result in a U-value which closely matches its measured equivalent. Further details of these corresponding walls and their build ups are given in Table 3.
The SPAB U-value Report - Caroline Rye & Cameron Scott - Revised Nov. 2012. !
!&)!
ID Build Up mm In situ U-value BR 443 U-value 1c Lime Plaster
Brick Infill Lime Render
134.5
2.48
2.49 11a Lime Plaster
Straw/Clay Clay/lime plaster
325
0.28
0.30 16a Lime Plaster
Straw Bale Lime Render
435
0.16
0.16 20a Brick
Lime Plaster Gypsum Skim
380
1.48
1.52 20c Brick
Lime Plaster Gypsum Skim
248
2.13
2.10 24c Asbestos Sheet
Mineral Wool Plasterboard & Skim
105
0.46
0.43 29b Gypsum skim
Plasterboard Air gap/battens Lime Plaster Brick 593 0.88 0.93
28b Gypsum Skim Plasterboard Air gap/battens Lime Plaster Lower Greensand 650 0.86 0.87
26h Lime Plaster Lath & lime plaster Air gap & batten Brick Limestone 690 0.70 0.74
20e Lime plaster Woodfibre insulation Lime Plaster Brick Insulating render 332 0.63 0.62
25c Gypsum skim Plasterboard Air gap PIR Board Tanking & gypsum Lime Plaster Granite 744 0.16 0.19
Table 3. Walls with close in situ & calculated U-value correspondence 2012. As can be seen from Figure 20 and Table 3 the ability to provide an accurate definition of a wall element ensures a better correspondence between measured in situ and calculated U-values. This is often in contrast to many
The SPAB U-value Report - Caroline Rye & Cameron Scott - Revised Nov. 2012. !
!&*!
existing stone walls where, although the overall thickness of the element may be known, the different proportions of materials involved in its construction, including mortar, voids and other non visible characteristics, as well as the random nature of their amalgamation often defy accurate description. The calculation of U-values for traditional walls is further problematised by the lack of basecase thermal conductivity data for most UK vernacular building materials. Furthermore, due to the diverse geology of these Islands such data as does exist may potentially be very location specific. When considered en masse these factors can mean that in some instances there can be significant uncertainty with regard to a calculated U-value for a traditional wall.
The SPAB U-value Report - Caroline Rye & Cameron Scott - Revised Nov. 2012. !
!&#!
5. Conclusions To date (Nov 2012) this study has looked at the in situ U-values of 77 walls built mainly of traditional materials and construction. It has then compared these figures with U-values calculated using the U-value calculating software, BuildDesk v3.4. based on the standard BR 443 Conventions for U-value Calculations 5.1 In situ U-values The study suggests that it maybe possible to begin to build-up a general trend of U-values for walls of traditional construction. A range of U-values for Limestone and Brick walls is developing, however, more data is needed to reinforce the figures already established and provide greater certainty. Likewise, more data is needed in order to reinforce and provide greater certainty for other material types featured within the study, such as granite and cob. Some materials, often found in thinner wall sections, record high U-values indicating greater heat loss. A secondary layer within a wall which either traps a layer of still air or includes a lightweight (and thus less thermally conductive) insulating material, or both, can reduce the U-values measured for a refurbished wall (see Drewsteignton 25a, 25b, 25c & Shrewsbury 20a, 20b, 20e & 20f). Or result in U-values that sit below a particular expected range for equivalent walls with no additions, such as the examples of the timber paneled brick wall at Spital Square (12b) or the dry-lined ashlar stone wall in Bradford on Avon (8b). However, this study has only looked at the phenomena of heat loss through these walls quantified as a U-value. There are other factors concerning the overall performance of a wall which should be taken into account during the application of a secondary insulating layer to a traditionally-built wall, principally that of moisture transfer. More research work is required in order to better understand this area and this is, in part, the
The SPAB U-value Report - Caroline Rye & Cameron Scott - Revised Nov. 2012. !
!&=!
purpose of the SPAB Building Performance Survey (see The SPAB Research Report 2.). 5.2 Measured & calculated U-value comparison Significant differences between the and the calculated U-value figures were found with the calculating software overestimating the U-value in 77% of cases. In overestimating the U-value BuildDesk/BR 443 underestimates the thermal performance of the walls in the sample group, as indicated by their in
situ figures. Furthermore, averages of the in situ U-value data used in this study produced figures that were lower (indicating reduced heat loss) than those shown on U-value Tables used in the assessment of the energy performance of existing dwellings (RdSAP). This is significant as, in part, U-value calculations are the basis for much building energy assessment and building energy legislation and policy. Therefore, this study suggests that conventional industry practices are unable to represent accurately the thermal performance of traditionally built walls. Ultimately, this could have negative consequences for traditional buildings as the poorer calculated U-values may result in misguided priorities with regard to energy saving alterations or suggest the need for interventions which, depending on their manner of execution, maybe deleterious to the fabric and longevity of the building, as well as to human health. The calculation of U-values for traditionally built stone walls are particularly problematic using the BR 443 calculating method. The reason for this is that features of traditionally built stone walls, including their construction methods and potential ambiguity, are not considered within the BR 443 guidance nor are such things easily incorporated into calculating software programmes such as BuildDesk v3.4. In addition, within the software, there is a paucity of thermal conductivity data for individual stone types. Traditionally built historic buildings tend to be built of the local vernacular material and are therefore of greater geologically diversity than the material types provided for within
The SPAB U-value Report - Caroline Rye & Cameron Scott - Revised Nov. 2012. !
!'"!
standard thermal conductivity tables. There is a need to increase the range of available thermal conductivity data to reflect this diversity. In general, the reason for the discrepancy between measured in situ and calculated U-values is likely to be the fundamental difficultly of providing an accurate definition for the purposes of making a calculation for a wall made up of inadequately identified materials, of dubious quantities, with doubtful root thermal conductivity values. Inversely, the calculated figure for a U-value tends to correspond more closely with the in situ figure when more information is known about the build-up of that particular wall and a specific thermal conductivity can be given. A correlation between the calculated and in situ figure is also more likely when the wall can be described in discrete, known, layers as this construction method corresponds more closely with modern building methods. Therefore, due to the inherent difficulties of defining the precise material properties of traditionally constructed walls an in situ figure will in many instances be more representative of actual thermal performance than a calculated one.
The SPAB U-value Report - Caroline Rye & Cameron Scott - Revised Nov. 2012. !
!'$!
6. References 1 English Heritage (2007). Energy Performance Certificates for Historic and
Traditional Homes. Retrieved April 22, 2010, from English Heritage, Conservation & Research website: www.climatechangeandyourhome.org.uk/live/home_information_packs.aspx 2 Baker, P. 2008. In situ U-value measurements in traditional buildings -
preliminary results. (Historic Scotland, Technical Conservation Group Technical Paper). Edinburgh: Historic Scotland. 3 Baker, P. (2010, January 26). How to analyse in situ data. Unpublished document. Glasgow Caledonian University. 4 Anderson, B. (2006). Conventions for U-value calculations (BR 443). Watford: Building Research Establishment. 5 Hens, H,. Janssens, A,. Depraetere, W,. Carmeliet, J,. & Lecompte, J. (2007). Brick Cavity Walls: A Performance Analysis Based on Measurements and Simulations [Electronic version]. Journal of Building Physics 31(2) 95-124. 6 Building Research Establishment. (2010). The governmentʼs standard
assessment procedure for energy rating of dwellings (2009 edition). Retrieved from the Building Research Establishment website: www.bre.co.uk/sap2009/page.jsp?id=1642
!!!!!!!!!!!!!!!!!!!!!!!!!!!!!!!!!!!!!!!!!!!!!!!!!!!!!!!!! !!