ars.els-cdn.com€¦ · web viewdna and amino acid sequence information is included in table s1....
TRANSCRIPT

Self-Assembled Protein Nanocarrier for Intracellular Delivery of Antibody
Sung In Lim and Julie A. Champion*
School of Chemical & Biomolecular Engineering, Georgia Institute of Technology, Atlanta,
Georgia 30332, United States
*Correspondence:
Julie A. Champion
Associate Professor950 Atlantic Drive NWDepartment of Chemical & Biomolecular EngineeringGeorgia Institute of TechnologyAtlanta, Georgia 30332Phone: +1 404-894-2874Fax: +1 404-385-2713E-mail: [email protected]
Supporting Information

Figure S1. Schematics of fusion peptides used to generate the Hex nanocarrier. H6-SPAB-Hex has the
same amino acid sequences as Hex-SPAB-H6, but has the inverted configuration. Both peptides are
hexameric in a native state, but dissociate into monomers when denatured by SDS. The Hex nanocarrier
was produced by reassembly of an equimolar mix of monomeric H6-SPAB-Hex and monomeric Hex-
SPAB-H6. DNA and amino acid sequence information is included in Table S1. SPAB was used as a
control in the binding kinetics assay.

Figure S2. Characterization of fusion peptides and the Hex nanocarrier. (a) Size measurement by
dynamic light scattering of H6-SPAB-Hex (green), Hex-SPAB-H6 (red), and the Hex nanocarrier (blue)
at 2 µM in a native state in PBS. (b) SDS-PAGE analysis of H6-SPAB-Hex (lane 1), Hex-SPAB-H6 (lane
2), and the Hex nanocarrier (lane 3). The expected molecular weight of monomeric peptides is 11.8 kDa.

Figure S3. Estimation of the monomeric Hex nanocarrier by size-molecular weight correlation under
denaturing conditions. Sizes of three reference proteins including lysozyme, bovine serum albumin
(BSA), and mouse serum IgG, were measured by DLS (n = 3) in the presence of 0.2% (w/v) SDS, and
plotted as a function of molecular weight to draw a standard curve with R2 = 0.977 to which the measured
size of the denatured Hex nanocarrier was fit. Error bars are not shown because they are smaller than
symbols.
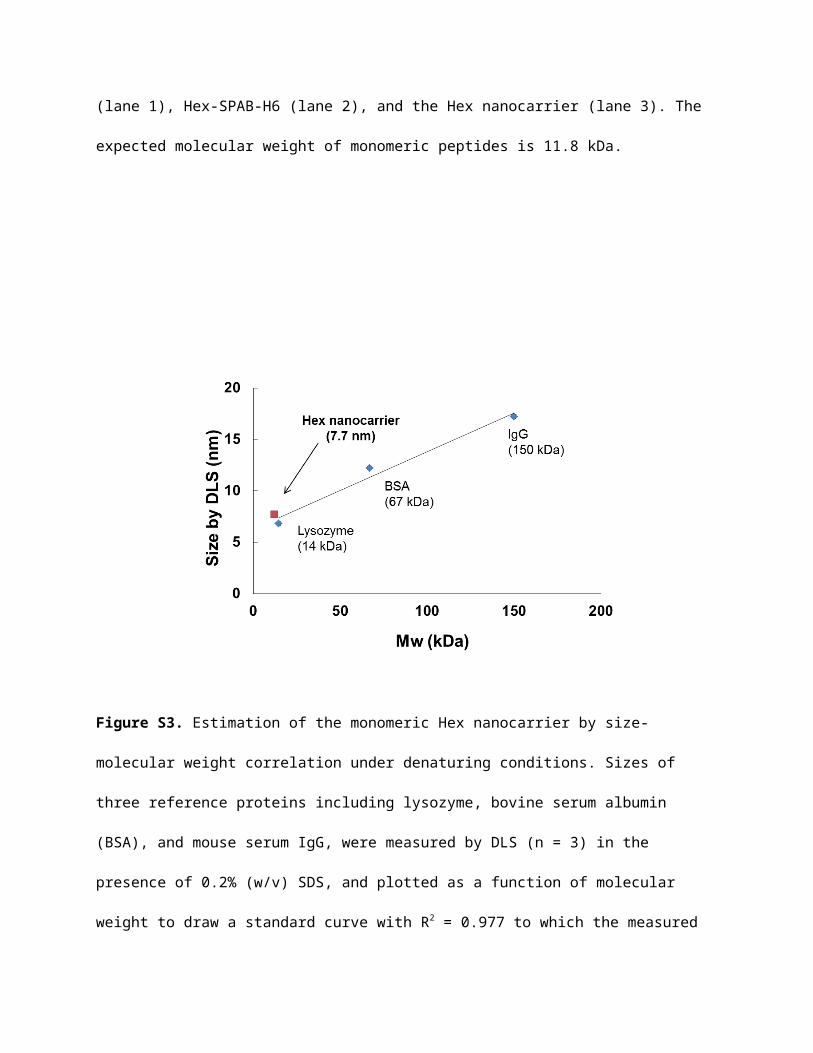
Figure S4. Cellular uptake of the Hex nanocarrier and dose dependency. (a) Fluorescence microscopy
image of HeLa cells incubated for 24 h with 0.2 µM of TAMRA-labeled BSA (BSA-TAM) and TAMRA-
labeled Hex nanocarrier (Hex-TAM), respectively. (b) Fluorescence microscopy images of HeLa cells
incubated with various concentrations of the TAMRA-labeled Hex nanocarrier. The scale bar corresponds
to 50 µm.

Figure S5. Cellular uptake of TAMRA-labeled IgGM by the Hex nanocarrier. At a fixed molar ratio of 3:1
IgGM-TAM:Hex with the concentration of IgGM-TAM being varied from 0.2 to 1.5 µM, IgGM-TAM-Hex
was incubated with HeLa cells for 24 h at 37oC. Cellular fluorescence was imaged by fluorescence
microscopy. The scale bar corresponds to 100 µm.

Figure S6. Cellular uptake of IgG by the Hex nanocarrier at various mixing ratios. (a) TAMRA-labeled
IgGM or IgGR at 0.6 µM was mixed with the Hex nanocarrier at various mixing molar ratios of 1:0, 1:1,
3:1, and 6:1 IgG-TAM:Hex, and then incubated with HeLa cells for 24 h. Cellular fluorescence was

imaged by fluorescence microscopy. (b) Cellular fluorescence was quantitatively measured by flow
cytometry. Error bars indicate mean ± s.d. (n = 3).
Figure S7. Specificity of the Hex nanocarrier for antibody delivery. TAMRA-labeled reference proteins
(BSA, recoverin) as well as IgGs were incubated with HeLa cells at the concentration of 0.40 µM in the
absence or presence of the Hex nanocarrier (0.13 µM). Fluorescence microscopy was used to observe
cellular fluorescence.

Figure S8. Immuno-staining of beta tubulin in a reducing environment. HeLa cells were fixed,
permeabilized, and stained by fluorescently labeled anti-beta tubulin-Cy3 antibody (red) in the presence
of 0, 10, and 20 mM DTT. The nucleus was stained with Hoechst 33342 (blue).

Figure S9. Cytosolic delivery of anti-NPC antibody by the Hex nanocarrier. (Upper left) CLSM images
of HeLa cells immunostained with mouse anti-NPC antibody followed by goat anti-mouse IgG Alexa
Fluor 647 conjugate (red). Cells were fixed and permeabilized before immunostaining. (Upper right)
HeLa cells incubated for 24 h with 0.6 µM anti-NPC. (Lower left) HeLa cells incubated for 24 h with 0.6
µM anti-NPC mixed with 0.2 µM Hex nanocarrier. (Lower right) HeLa cells incubated for 24 h with 0.6
µM IgGM mixed with 0.2 µM Hex nanocarrier. Cells were fixed, permeabilized, and stained by goat anti-

mouse IgG Alexa Fluor 647 conjugate (red) to visualize the distribution of delivered antibodies. The scale
bar represents 10 µm.
Figure S10. Generation and characterization of the Au-Hex nanocarrier. (a) Fusion of the Aurein motif to
H6-SPAB-Hex and Au-Hex-SPAB-H6. (b) Schematic illustration of the fusion peptides containing the
Aurein motif (yellow sphere) and their assembly to produce the Au-Hex nanocarrier. (c) Size
measurement by DLS of the Au-Hex nanocarrier in comparison to the Hex nanocarrier. Changes in their
size upon binding IgGM at different mixing ratios were plotted together. Error bars indicate mean ± s.d. (n
= 3).

Figure S11. Cytotoxicity of the Au-Hex nanocarrier. HeLa cells were incubated with various
concentrations of the Au-Hex nanocarrier as well as the Hex nanocarrier for 24 h, and then subjected to
MTT assay to measure cell viability which was normalized to untreated control cells. Error bars indicate
mean ± s.d. (n = 3).


Figure S12. Time-course of cellular uptake of TAMRA-labeled IgGM by the Au-Hex nanocarrier in
comparison to the Hex nanocarrier. At a fixed molar ratio of 3:1 IgGM-TAM:Hex or Au-Hex, 0.4µM
IgGM-TAM was mixed with the Hex or Au-Hex nanocarrier, and then incubated with HeLa cells at 37oC.
Cellular fluorescence was imaged at various time points by fluorescence microscopy.

SI Figure 13. Fluorescence microscopy images of HeLa cells incubated with 0.6 µM of mouse anti-beta-
tubulin antibody with 0.2 µM of the Au-Hex nanocarrier and the Hex nanocarrier. After 24 h, cells were
washed, fixed, permeabilized, and stained with goat anti-mouse IgG Alexa Fluor 647 conjugate (red) to
visualize intracellular distribution of antibodies. Nuclei were stained with Hoechst 33342 (blue). The
scale bar represents 20 µm.

Figure S14. Cytotoxicity of anti-beta tubulin antibody delivered by the Au-Hex and the Hex nanocarrier.
Cell viability of HeLa cells incubated for 48 h with 0.4 µM of anti-beta tubulin antibody mixed with the
Au-Hex nanocarrier (Anti-β-tubulin-AuHex) or the Hex nanocarrier (Anti-β-tubulin-Hex) at a fixed molar
ratio of 3:1 antibody:AuHex or Hex was normalized to that of untreated HeLa cells (Control).
Nocodazole and paclitaxel are cytotoxic agents that interfere with microtubule polymerization and
depolymerization, respectively. Error bars indicate mean ± s.d. (n = 3); *p < 0.001 (t-test: two-sample
assuming unequal variances).

Figure S15. Fluorescence microscopy images of HeLa cells incubated with 0.6 µM of mouse anti-NPC
antibody with 0.2 µM of the Au-Hex nanocarrier and the Hex nanocarrier. After 24 h, cells were washed,
fixed, permeabilized, and stained with goat anti-mouse IgG Alexa Fluor 647 conjugate (red) to visualize
intracellular distribution of antibodies. Nuclei were stained with Hoechst 33342 (blue). The scale bar
represents 20 µm.

a b
Figure S16. Fluorescence intensity at the nucleus boundary calculated from the CLSM images in Figure
5b, c. (a). Fluorescence intensity of the nuclear membrane resulting from anti-NPC antibody delivered by
the Hex or the AuHex nanocarrier. Six random points at the boundary from three cells in Figure 5b and c,
respectively, were subjected to the ‘profile’ function in the Zen Blue software to give a mean
fluorescence. (b) Background-subtracted fluorescence intensity of the nuclear membrane. Mean
background fluorescence intensity was obtained from a rectangular region of the same size drawn by the
‘profile’ function in the cell but excluding the nucleus boundary. The mean background fluorescence
intensity was then subtracted from the boundary fluorescence obtained in Figure S16a. Error bars
represents mean ± s.d. (n = 6).

Table S1. DNA sequences encoding fusion peptides used in this study
Peptide DNA sequence
H6-SPAB-Hex
AT
GCATCATCATCATCACCACGCTGACAACAAATTCAACAAAGAACAACAGAACGCTTTTTACGAAATC
CTGCACCTGCCGAACCTGAACGAAGAACAGCGTAACGGCTTTATTCAATCTCTGAAAGATGACCCGA
GCCAGTCTGCAAACCTGCTGGCGGAAGCCAAAAAACTGAATGATGCACAAGCTCCGAAAGGCGGTG
GCAGTGGTGGCGGTTCCGGCGGTGGCTCAGGTGGCGGTTCGGGTGAACTGAAAGCGATCGCCCAGGAA
CTGAAAGCCATCGCTAAAGAACTGAAAGCAATCGCGTGGGAACTGAAAGCAATCGCGCAGGGCGCT
GGC
Hex-SPAB-H6
AT
GGGTGAACTGAAAGCCATCGCACAAGAACTGAAAGCCATCGCTAAAGAACTGAAAGCTATTGCCTG
GGAACTGAAAGCCATCGCTCAAGGTGCAGGCGGTGGCGGTAGTGGCGGTGGCTCCGGTGGCGGTTCAG
GCGGTGGCTCGGCCGATAACAAATTCAACAAAGAACAGCAAAACGCCTTCTATGAAATTCTGCATCT
GCCGAACCTGAATGAAGAACAGCGTAACGGCTTTATCCAATCTCTGAAAGATGACCCGAGCCAGTCT
GCGAATCTGCTGGCAGAAGCTAAAAAACTGAATGACGCGCAGGCTCCGAAACACCACCACCACCAC
CAC
H6-SPAB-Hex-Au
AT
GCATCATCATCATCACCACGCTGACAACAAATTCAACAAAGAACAACAGAACGCTTTTTACGAAATC
CTGCACCTGCCGAACCTGAACGAAGAACAGCGTAACGGCTTTATTCAATCTCTGAAAGATGACCCGA
GCCAGTCTGCAAACCTGCTGGCGGAAGCCAAAAAACTGAATGATGCACAAGCTCCGAAAGGCGGTG
GCAGTGGTGGCGGTTCCGGCGGTGGCTCAGGTGGCGGTTCGGGTGAACTGAAAGCGATCGCCCAGGAA
CTGAAAGCCATCGCTAAAGAACTGAAAGCAATCGCGTGGGAACTGAAAGCAATCGCGCAGGGCGCT
GGCGGTCTGTTTGATATTATTAAAAAAATTGCAGAAAGCTTT
Au-Hex-SPAB-H6
AT
GGGTCTGTTTGATATTATTAAAAAAATTGCAGAAAGCTTTGGTGAACTGAAAGCCATCGCACAAG
AACTGAAAGCCATCGCTAAAGAACTGAAAGCTATTGCCTGGGAACTGAAAGCCATCGCTCAAGGTGC
AGGCGGTGGCGGTAGTGGCGGTGGCTCCGGTGGCGGTTCAGGCGGTGGCTCGGCCGATAACAAATTCA
ACAAAGAACAGCAAAACGCCTTCTATGAAATTCTGCATCTGCCGAACCTGAATGAAGAACAGCGTAA
CGGCTTTATCCAATCTCTGAAAGATGACCCGAGCCAGTCTGCGAATCTGCTGGCAGAAGCTAAAAAA
CTGAATGACGCGCAGGCTCCGAAACACCACCACCACCACCAC
H6-SPAB-HEX-
TAT-HA2
AT
GCATCATCATCATCACCACGCTGACAACAAATTCAACAAAGAACAACAGAACGCTTTTTACGAAATC
CTGCACCTGCCGAACCTGAACGAAGAACAGCGTAACGGCTTTATTCAATCTCTGAAAGATGACCCGA
GCCAGTCTGCAAACCTGCTGGCGGAAGCCAAAAAACTGAATGATGCACAAGCTCCGAAAGGCGGTG
GCAGTGGTGGCGGTTCCGGCGGTGGCTCAGGTGGCGGTTCGGGTGAACTGAAAGCGATCGCCCAGGAA
CTGAAAGCCATCGCTAAAGAACTGAAAGCAATCGCGTGGGAACTGAAAGC
AATCGCGCAGGGCGCTGG
CCGCCGCCGCCAGCGCCGCAAAAAACGCGGCGGCGATATTATGGGCGAATGGGGCAACGAAATTTTT
GGCGCGATTGCGGGCTTTCTGGGC

H6-SPAB
AT
GCATCATCATCATCACCACGCTGACAACAAATTCAACAAAGAACAACAGAACGCTTTTTACGAAATC
CTGCACCTGCCGAACCTGAACGAAGAACAGCGTAACGGCTTTATTCAATCTCTGAAAGATGACCCGA
GCCAGTCTGCAAACCTGCTGGCGGAAGCCAAAAAACTGAATGATGCACAAGCTCCGAAA
- Yellow-boxed sequence encodes the hexahistidine, HHHHHH.
- Underlined sequence encodes SPAB,
ADNKFNKEQQNAFYEILHLPNLNEEQRNGFIQSLKDDPSQSANLLAEAKKLNDAQAPK.
- Italicized sequence encodes the GGGS linker, GGGSGGGSGGGSGGGS.
- Green-boxed sequence encodes the self-assembling Hex domain,
GELKAIAQELKAIAKELKAIAWELKAIAQGAG.
- Bold sequence encodes the Aurein 2.1, GLFDIIKKIAESF.