the role of facebook marketing brand equity & purchase ...e)_vol_18... · 1. the role of...
TRANSCRIPT

The�Role�of�Facebook�Marketing Brand�Equity�&�Purchase�Intention
Challenges�of�Supply�Chain�Integration
VOLUME�18����������ISSUE�7����������VERSION�1.0
Online�ISSN�:�2249-4588Print�ISSN�:��0975-5853DOI�:�10.17406/GJMBR
The�Mediator�Effect�of�Satisfaction

Global Journal of Management and Business Research: E
Marketing
Global Journal of Management and Business Research: E Marketing
Volume 18 Issue 7 (Ver. 1.0)
Open Association of Research Society
All rights reserved.
This is a special issue published in version 1.0 of “Global Journal of Science Frontier
Research.” By Global Journals Inc.
All articles are open access articles distributedunder “Global Journal of Science Frontier
Research”
Reading License, which permits restricted use. Entire contents are copyright by of “Global
Journal of Science Frontier Research” unless otherwise noted on specific articles.
No part of this publication may be reproduced or transmitted in any form or by any means,
electronic or mechanical, including photocopy, recording, or any information
storage and retrieval system, without written permission.
The opinions and statements made in this book are those of the authors concerned. Ultraculture has not verified and neither
confirms nor denies any of the foregoing andno warranty or fitness is implied.
Engage with the contents herein at your own risk.
The use of this journal, and the terms and conditions for our providing information, is
governed by our Disclaimer, Terms and Conditions and Privacy Policy given on our
By referring / using / reading / any type of association / referencing this journal, this
signifies and you acknowledge that you have read them and that you accept and will be
bound by the terms thereof.
All information, journals, this journal, activities undertaken, materials, services and our website, terms and conditions, privacy policy, and this journal is subject to change
anytime without any prior notice.
Incorporation No.: 0423089License No.: 42125/022010/1186
Registration No.: 430374Import-Export Code: 1109007027
Employer Identification Number (EIN): USA Tax ID: 98-0673427
website http://globaljournals.us/terms-and-condition/menu-id-1463/
© Global Journal of Management and Business
Research. 2018.
Global Journals Inc. (A Delaware USA Incorporation with “Good Standing”; Reg. Number: 0423089)Sponsors: Open Scientific Standards
Publisher’s Headquarters office
Offset Typesetting
Packaging & Continental Dispatching
Find a correspondence nodal officer near you
To find nodal officer of your country, pleaseemail us at [email protected]
eContacts
Press Inquiries: [email protected] Inquiries: [email protected] Support: [email protected] & Releases: [email protected]
Pricing (E xcluding Air Parcel Charges):
Open Association of Research Society
Global Journals Incorporated2nd, Lansdowne, Lansdowne Rd., Croydon-Surrey, Pin: CR9 2ER, United Kingdom
Global Journals Pvt LtdE-3130 Sudama Nagar, Near Gopur Square, Indore, M.P., Pin:452009, India
USA Toll Free: +001-888-839-7392 USA Toll Free Fax: +001-888-839-7392
945th Concord Streets,
United States of AmericaFramingham Massachusetts Pin: 01701,
Global Journals Headquarters®
Yearly Subscription (Personal & Institutional) 250 USD (B/W) & 350 USD (Color)

Editorial Board Global Journal of Management and Business Research
Dr. John D. Theodore Prof. Moji Moatamedi
American Military University
JDT Management Consultants, President.
D.B.A., Business Economy
University of South Africa
Ph.D. Aristotelian University
Business Administration
Ph.D. Administration, University of Kansas
USA
Honorary Vice Chair
Ph.D., at The University of Sheffield,
MBA, Manchester Business School
University of Manchester
UK
Dr. R. Allen Shoaf Professor Maura Sheehan
B.A., M.A., Ph.D. Cornell University
Cornell University, Teaching Assistant in the English
Department,
University of Florida, US
Professor, International Management
Director, International Centre
for Management & Governance Research (ICMGR)
Ph.D. in Economics
UK
Dr. Mehdi Taghian Dr. Carl Freedman
Senior Lecturer
Faculty of Business and Law
BL Deakin Business School
Melbourne Burwood Campus
Australia
B.A., M.A., Ph.D. in English, Yale University
Professor of English, Louisiana State University, US
Dr. Agni Aliu Dr. Tsutomu Harada
Ph.D. in Public Administration,
South East European University, Tetovo, RM
Asociater profesor South East European University,
Tetovo, Macedonia
Professor of Industrial Economics
Ph.D., Stanford University, Doctor of Business
Administration, Kobe University
Dr. Wing-Keung Won Dr. Xiaohong He
Ph.D., University of Wisconsin-Madison,
Department of Finance and
Big Data Research Center
Asia University,
Taiwan
Professor of International Business
University of Quinnipiac
BS, Jilin Institute of Technology; MA, MS, Ph.D.,.
(University of Texas-Dallas)
Dr. Carlos García Pont Dr. Söhnke M. Bartram
Associate Professor of Marketing
IESE Business School, University of Navarra
Doctor of Philosophy (Management),
Massachussetts Institute of Technology (MIT)
Master in Business Administration, IESE, University of
Navarra
Degree in Industrial Engineering,
Universitat Politècnica de Catalunya
Web: iese.edu/aplicaciones/faculty/facultyDetail.asp
Department of Accounting and Finance
Lancaster University Management School
Ph.D. (WHU Koblenz)
MBA/BBA (University of Saarbrücken)
Web: lancs.ac.uk/staff/bartras1/
Dr. Bassey Benjamin Esu Dr. Dodi Irawanto
B.Sc. Marketing; MBA Marketing; Ph.D Marketing
Lecturer, Department of Marketing, University of Calabar
Tourism Consultant, Cross River State Tourism
Development Department
Co-ordinator, Sustainable Tourism Initiative, Calabar,
Nigeria
Ph.D., M.Com, B.Econ Hons.
Department of Management
Faculty of Economics and Business
Brawijaya University
Malang, Indonesia
Dr. Ivona Vrdoljak Raguz Dr. Yongbing Jiao
University of Dubrovnik,
Head, Department of Economics and Business
Economics,
Croatia
Ph.D. of Marketing
School of Economics & Management
Ningbo University of Technology
Zhejiang Province, P. R. China
Dr. Charles A. Rarick Yue-Jun Zhang
Ph.D.
Professor of International Business
College of Business
Purdue University Northwest
Hammond, Indiana US
Business School,
Center for Resource and
Environmental Management
Hunan University, China
Dr. Albrecht Classen Dr. Brandon S. Shaw
M.A. (Staatsexamen), Ph.D. University of Virginia,
German
Director, Summer Abroad Program, Medieval Europe
Travel Course
B.A., M.S., Ph.D., Biokinetics, University of Johannesburg,
South Africa
Professor Department of Sport and Movement Studies
University of Johannesburg, South Africa

Contents of the Issue
i. Copyright Notice ii. Editorial Board Members iii. Chief Author and Dean iv. Contents of the Issue
1. The Role of Facebook Marketing on Customer-based Brand Equity and
Purchase Intention in Fashion-Wear Retail Industry, Sri Lanka. 1-10 2. Perception-Awareness Model with Respect to Green Marketing Practices- A
Study in Kolkata and its Suburbs. 11-17 3. L’Effet Médiateur De La Satisfaction Sur Les Liens Relationnels Et La Fidélité
L’application De La Méthode De Barron Kenny 1986. 19-27 4. Challenges of Supply Chain Integration: The Case of Soap and Detergent
Manufacturing Companies in Ethiopia. 29-35 5. Halal Food Awareness of Young Adult Muslims Consumers: Comparative
Studies between Bangladesh and Phillipine. 37-45
6. Effects of Brand Experience on Consumer Brand Loyalty in Fashion Retail Industry: Moderating the Role of Gender. 47-56
v. Fellows vi. Auxiliary Membershipsvii. Preferred Author Guidelinesviii. Index
© 2018. Nisha Anupama Jayasuriya, Dr. S. M. Ferdous Azam, Dr. Ali Khatibi Dr. Halinah Atan & Dr. Isuri Roche Dharmaratne. This is a research/review paper, distributed under the terms of the Creative Commons Attribution-Noncommercial 3.0 Unported License http://creativecommons.org/licenses/by-nc/3.0/), permitting all non-commercial use, distribution, and reproduction in any medium, provided the original work is properly cited.
The Role of Facebook Marketing on Customer-based Brand Equity and Purchase Intention in Fashion-Wear Retail Industry, Sri Lanka
By Nisha Anupama Jayasuriya, Dr. S. M. Ferdous Azam, Dr. Ali Khatibi, Dr. Halinah Atan & Dr. Isuri Roche Dharmaratne
Sri Lanka Institute of Information Technology Abstract- In the contemporary environment, people experience things in a completely different way than the previous generation. The consumables, lifestyles and decision making has been affected and controlled by social media. With this new shift in consumer behavior, reaching the target customer groups via traditional channels may not be effective for business firms. Due to this reason, identifying the potentials of new channels become vital for business firms. This paper study the activities on marketing on such giant social network named Facebook and components of customer-based brand equity and purchase intention on the same platform. Customers of the fashion-wear retail industry were targeted for this study and survey method has been used for data collection. The relevant questionnaire was pilot tested among 40 Facebook fans of the reputed fashion-wear retailers in Sri Lanka. Based on the theories and expert opinions the measures of Facebook marketing, customer-based brand equity and purchase intention were identified. Reliability and validity of these constructs were tested and the remaining items were selected as the measures for these variables.
Keywords: facebook marketing, customer-based brand equity, purchase intention, fashion-wear industry.
GJMBR-E Classification: JEL Code: M31, M37
TheRoleofFacebookMarketingonCustomerbasedBrandEquityandPurchaseIntentioninFashionWearRetailIndustrySriLanka Strictly as per the compliance and regulations of:
Global Journal of Management and Business Research: E Marketing Volume 18 Issue 7 Version 1.0 Year 2018 Type: Double Blind Peer Reviewed International Research JournalPublisher: Global JournalsOnline ISSN: 2249-4588 & Print ISSN: 0975-5853

The Role of Facebook Marketing on Customer-based Brand Equity and Purchase Intention in
Fashion-Wear Retail Industry, Sri Lanka Nisha Anupama Jayasuriya α, Dr. S. M. Ferdous Azam σ, Dr. Ali Khatibi ρ, Dr. Halinah Atan Ѡ
& Dr. Isuri Roche Dharmaratne¥
Abstract-
In
the contemporary environment, people experience things in a completely different way than the previous generation. The consumables, lifestyles
and decision making has been affected and controlled by social
media. With this new shift in consumer behavior, reaching the target customer groups via traditional channels may not be effective for business firms. Due to this reason, identifying the potentials of new channels become vital for business firms. This paper study the activities on
marketing on such giant
social network named Facebook
and components of customer-based brand equity and purchase intention on the same platform. Customers of the fashion-wear retail industry were targeted for this study and survey method has been used for data collection. The relevant questionnaire was pilot tested among 40 Facebook fans of the reputed fashion-wear retailers in Sri Lanka. Based on the theories and expert opinions the measures of Facebook marketing, customer-based brand equity and purchase intention were identified. Reliability and validity of these constructs were tested and the remaining items were selected as the measures for these variables. This study provides a good starting point to identify measures of the three variables and lead to a more comprehensive research.
Keywords:
facebook marketing, customer-based brand equity, purchase intention, fashion-wear industry.
I.
Introduction
ashion-wear industry in Sri Lanka, one of lucrative as well as ideal industry for social media, is still at its infant stage of using it as a marketing tool.
Currently, new small and medium players entering into the platform seeking the potentiality of this new medium. In Sri Lankan context, Facebook is considered as the most popular medium among public and business firms. It is used with the purpose
of reaching
the largecustomerbase. This new platform allows firms to be more interactive with their target customer group at low cost. The filtering techniques available on Facebook provides an opportunity
to do exact filtering of the right
audience which enhances the efficiency of marketing messages further. All these techniques lead business firms to use this media effectively to gain some sales. However, the use of social media to uplift brands into the next level has largely forgotten due to poor
awareness among business firms(Kamburugamuwa, 2015). Even in the interview of leading businessmen in the field, this point was proven. According to him, the main aim of utilizing social media was directed to the creation of demand/sales. No attention was given on the development of brand equity.
(Nawarathna, D. 2017, November, 18. Personal Interview). It indicates that industry is still at its infant stage in the use of social media and the strategic purpose of social media has not been discussed adequately. Thus, the purpose of this study directed to identify the impact of Facebook marketing on the brand equity creation as well as purchase intention of fashion-wear retailers in Sri Lanka.
Considering the fast phase that the retail industry is moving in the online platform, it will be risky for fashion-ware retailers to operate “Brick and Motor” (Ahlam, 2013). Businesses should ready for addressing the requirements of millennials who will be their main target market soon. Those millennials who live in a digitalized world, mostly prefer to do their shopping in online platform rather than in physical stores. It provides them with great convenience, vast choice and good deals (Godey et al., 2016). Therefore, the social media in the Sri Lankan contexthas enormous opportunities yet to be explored for businesses. Despite this emerging opportunity only 10–15 percent apparel retails are online in Sri Lanka (Kambrugamuwa, 2015). As the reasons behind this poor presence, the poor understanding of social media potentials and the requirement of ‘touch and feel’ element in the fashion-ware sector lies (Bhatnagar, Misra, & Rao, 2000).
F
© 2018 Global Journals
1
Year
2018
Globa
l Jo
urna
l of M
anag
emen
t an
d Bu
siness Resea
rch
Volum
e XVIII
Issue
VII
Ver
sion
I(
)E
Author α: Graduate School of Management, Management and Science University, Malaysia, Sri Lanka Institute of Information Technology. e-mail: [email protected]
II. Review of the Concept
a) Keller brand value chain model
© 2018 Global Journals1
2
Year
2018
Globa
l Jo
urna
l of M
anag
emen
t an
d Bu
siness Resea
rch
Volum
e XVIII
Issue
VII
Ver
sion
I(
)E
The Role of Facebook Marketing on Customer-based Brand Equity and Purchase Intention in Fashion-Wear Retail Industry, Sri Lanka
Source: (K.L.Keller, 2007)
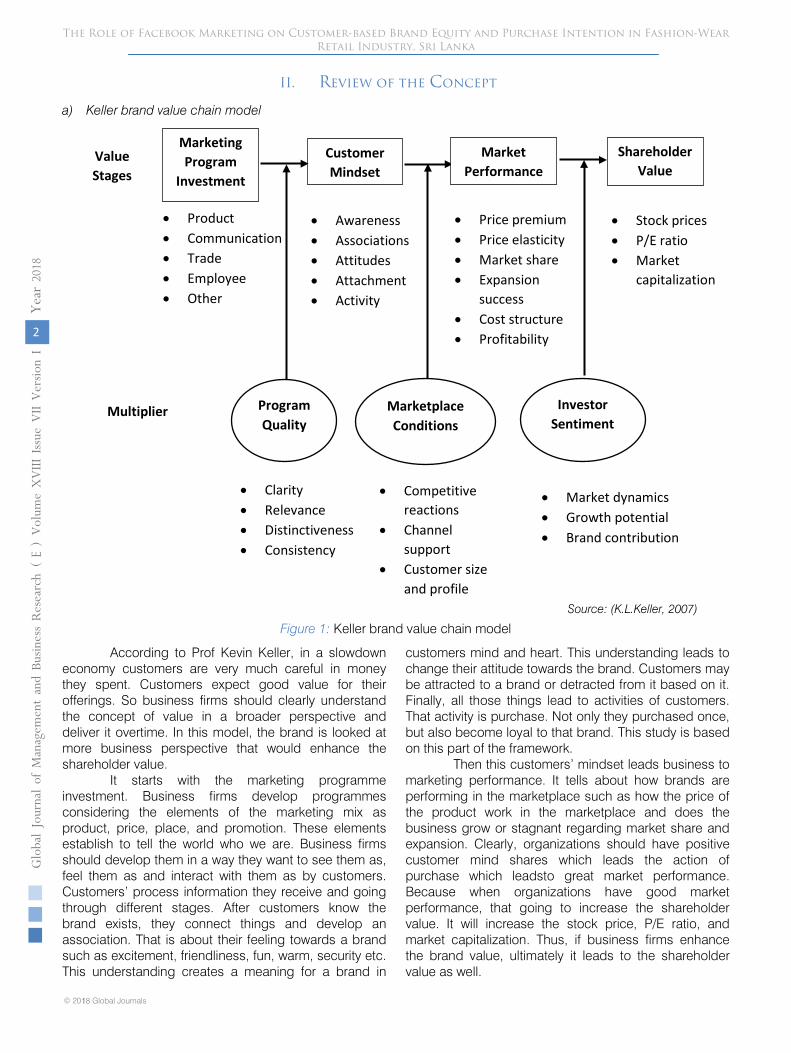
Figure 1: Keller brand value chain model
According to Prof Kevin Keller, in a slowdown economy customers are very much careful in money they spent. Customers expect good value for their offerings. So business firms should clearly understand the concept of value in a broader perspective and deliver it overtime. In this model, the brand is looked at more business perspective that would enhance the shareholder value.
It starts with the marketing programme investment. Business firms develop programmes considering the elements of the marketing mix as product, price, place, and promotion. These elements establish to tell the world who we are. Business firms should develop them in a way they want to see them as, feel them as and interact with them as by customers. Customers’ process information they receive and going through different stages. After customers know the brand exists, they connect things and develop an association. That is about their feeling towards a brand such as excitement, friendliness, fun, warm, security etc. This understanding creates a meaning for a brand in
customers mind and heart. This understanding leads to change their attitude towards the brand. Customers may be attracted to a brand or detracted from it based on it. Finally, all those things lead to activities of customers. That activity is purchase. Not only they purchased once, but also become loyal to that brand. This study is based on this part of the framework.
Then this customers’ mindset leads business to marketing performance. It tells about how brands are performing in the marketplace such as how the price of the product work in the marketplace and does the business grow or stagnant regarding market share and expansion. Clearly, organizations should have positive customer mind shares which leads the action of purchase which leadsto great market performance. Because when organizations have good market performance, that going to increase the shareholder value. It will increase the stock price, P/E ratio, and market capitalization. Thus, if business firms enhance the brand value, ultimately it leads to the shareholder value as well.
Shareholder Value
Marketing Program
Investment
Customer Mindset
Market Performance
Program Quality
Marketplace Conditions
Investor Sentiment
Value Stages
Multiplier
• Product• Communication• Trade• Employee• Other
• Awareness• Associations• Attitudes• Attachment• Activity
• Price premium• Price elasticity• Market share• Expansion
success• Cost structure• Profitability
• Stock prices• P/E ratio• Market
capitalization
• Clarity• Relevance• Distinctiveness• Consistency
• Competitive reactions
• Channel support
• Customer size and profile
• Market dynamics• Growth potential• Brand contribution

The Role of Facebook Marketing on Customer-based Brand Equity and Purchase Intention in Fashion-Wear Retail Industry, Sri Lanka
© 2018 Global Journals
3
Year
2018
Globa
l Jo
urna
l of M
anag
emen
t an
d Bu
siness Resea
rch
Volum
e XVIII
Issue
VII
Ver
sion
I(
)E
However, this process is not that easy. There are some multipliers as well. Having a qualityprogramme would be a factor to have a quality customer base. If it is a low-quality one the firm will end up with poor customer mindshare. However, a clear, relevant and outstanding one can generate a positive customer mindset.
Even though, a company offers a quality marketing programme the things going on the marketplace may interrupt or downplay that quality. As the examples, the actions and reactions of competitors and the support getting from intermediaries can be considered. No matter the campaign is high quality if the intermediaries do not provide adequate support for it. Then the size of the customer group. When you are targeting a niche market, the high-quality programme that developed for mass market will not be successful.
The other issue that impact on shareholder value is the investor sentiment. If investors see growth potential for the business, they may have a very positive attitude towards the brand. Otherwise, they may have a very negative attitude. The reason is they perceive a lot of risk with that brand. So these multipliers determine how effectively a brand is moving through the brand value chain.
b) Social MediaSocial media can be defined as “a group of
Internet-based applications that build on ideological and technological foundations of web 2.0 and allow the creation and exchange of user-generated content” (Kaplan & Haenlein, 2010).There are four types of social media like blogs, social networks micro-blogs, photo, and video sharing sites. The main advantage of these platforms is that there are no restrictions regarding time, place, media and low in cost (Kim & Ko, 2012). The growing interest in the use of social media is visible through the behavior of consumers. Most of the customers search online before making their purchase decision. They are highly sensitive to the reviews of other customers in the online platform (Godey et al., 2016). Even though they visit a place physically, they tend to use their mobile to find a better deal elsewhere (Ahlam, 2013). In fashion retailing sector this is prominent, and people do engage very much when making their purchase decision. Therefore, it will be a fertile ground to practice innovative social marketing tactics.
Social Media Marketing can be identified as the process that empowers the promotion of websites, products, and services via online social channels. It involves marketing related activities such as blogging, sharing photos and posts online(Yazdanparast, Joseph, & Muniz, 2016).About the fashion industry, there are millions of fashion blogs that update the latest fashions and fashion apps that provide more engagement opportunity for customers. In addition to that, customers
are encouraged to share favorite fashion items and outfits among their networks(Mohr & John, 2013). As more shoppers use social media and rely on them in decision making in the apparel sector, the promotions on this platforms become vital.
c) Facebook Marketing in Fashion-wear IndustryAll over the world, Facebook is considered as
the popular social media network. It has the highest daily active users compared to other social networks. Therefore, Facebook can be identified as a great social platform for organic and paid opportunities which has highest potential reach(Chaffey, 2018). When considering the Sri Lankan market 36% internet penetration is there, and social media usage is at its fast-growing stage (22% growth). Currently, it accounts for approximately 6 million users, and it has only 29% penetration in the population. Therefore, Facebook has not reached its peak yet in the Sri Lankan context and has a high potential to grow.
When considering the usage of social media in the Sri Lankan context, Facebook is showing a remarkable upscale among the other platforms (figure 1).

(Social Media Stats Sri Lanka, 2018)
Figure 2: Social Media Stats of Sri Lanka from August 2018
Facebook is already considered as a business take-off tool (Kim & Ko, 2012)and a tool that widely impacts on customer preferences (Godey et al., 2016) and buying decisions of publics(Yazdanparast et al., 2016). This platform provides a decent opportunity for fashion-ware retailers to “showrooming” their products to potential customers online. Majority of customers tend to search online before coming to a shop as well as while shopping to know whether there is a good deal elsewhere(Ahlam, 2013).
All the above evidence prove the role played by Facebook in society. As a tool with a very high amount of users and high growth potentiality, Facebook provides a clear opportunity for Sri Lankan business firms. In that situation, fashion-wear industry in Sri Lanka increasingly uses Facebook for business purpose.
d) Brand Equity
A brand can be identified as a name, term, sign, symbol or design or combination of these, intended to identify goods or service of one seller or group of sellers and to differentiate them from those of competitors (Kotler, Baker, Gummesson, & Buttle, 1993). Brand Equity is identified in two forms as financial-based brand equity and customer-based brand equity. The customer-based brand equity is a psychological concept. Keller, define CBBE as “the differential effect that brand knowledge has on consumer response to the marketing of that brand.”
Considering the brand equity as the knowledge that customers have related to the brand, Keller identified the brand image and brand awareness as measures for brand equity. Aaker has presented slightly different idea addressing the measure of brand
awareness, brand association, perceived quality and brand loyalty for brand equity. Among these elements, brand loyalty was identified as the most important item to determine brand equity. Brand loyalty is differentiated from repurchasing and work as an entry barrier, price premium and competing tool. Brand awareness is the customers’ ability to recall the brand name relevant to certain product category and brand association is linking a brand to something in customers’ memory. Perceived quality has been identified as the overall impression of product or services come under a brand(Aaker, 1991).
e) Purchase Intention Purchase intention can be defined in different
terms. It can be identified as “consumers’ willingness to consider buying’, “buying intention in future” and “decision repurchase.” In addition to that, it can be defined as the degree of conviction that consumers have to purchase a product or service. Ultimately it is a subjective judgment of customers after evaluating a product or service to buy(Balakrishnan, Dahnil, & Yi, 2014).
f) Facebook Marketing and Brand Equity Social media has a direct link to the brand
equity rather than traditional media which focus on improving brand awareness. This relationship has been proven in the study of (Godey, Manthioua, Pederzoli, Rokka, & Aiello, 2016). In that study, Keller’s brand equity dimensions which are brand awareness and brand image has been tested. This research invites future researchers to incorporate other dimensions of brand equity as well for the study. The social media components such as entertainment, interaction and
83.80%
6.50% 6.18%1.78% 0.73% 0.25%
0.00%
10.00%
20.00%
30.00%
40.00%
50.00%
60.00%
70.00%
80.00%
90.00%
Facebook Pinterest Youtube Twitter Instagram Linkedin
The Role of Facebook Marketing on Customer-based Brand Equity and Purchase Intention in Fashion-Wear Retail Industry, Sri Lanka
© 2018 Global Journals1
4
Year
2018
Globa
l Jo
urna
l of M
anag
emen
t an
d Bu
siness Resea
rch
Volum
e XVIII
Issue
VII
Ver
sion
I(
)E

trendiness have been identified as the main factors that have an impact on brand equity (Godey, et al, 2016).
g) Facebook Marketing and Purchase Intention Some elements of Facebook marketing have
been identified as the factors which impact on purchase intention. Those elements are entertainment, interaction and word of mouth (Kim & Ko, 2010). However, the study of (Bruhn, Schoenmueller, & Schäfer, 2012)presents a different result proving a weak relationship between SMM and PI. Further, the study of Dehghani & Tumer, (2015) found that Facebook leads to enhance the brand value and then the purchase intention. They conclude that FBM should not intend the sales but the brand value.
h) Brand Equity and Purchase Intention Brand equity has been identified for its positive
impact on purchase intention. The study of Vihn & Huy, (2016), provide empirical evidence that even in service or product category, high brand equity generates high purchase intention. Customers tend to defend their purchase intention based on the brand name (Pütter, 2017). Further, the studies of that Moradi & Zarei, (2011), Chang & Liu, (2009), Chen & Chang, (2008) also prove the strong relationship between brand equity and purchase intention.
III. Research Design
The study focus on identifying the impact of Facebook Marketing on customer-based brand equity and purchase intention. As the study focus on Facebook marketing, components have been selected based on the Honeycomb model. Two other components as entertainment and eWoM have been added based on the findings of past literature.
The questionnaire comprising profile questions and items for each construct in the conceptual model. Accordingly, it was organized by the five areas as Facebook marketing, customer-based brand equity, purchase intention, an open question, and personal data. Items have been developed referring the past literature and reviewed by industry experts for clarity and accuracy. A 5-point Likert scale is used, where a value of 1 indicates disagreement, while a value of 5 indicates agreement to the statement. In total, the questionnaire was contained 55 Likert scale questions and one open-ended question.
Since this study focuses on identifying the impact of Facebook marketing, sample unit of the study was the Facebook fans of Fashion-wear retailers in Sri Lanka. Hence the pilot study was conducted among 60 Facebook fans of leading Fashion-wear retailers who have been active in the Facebook. The questionnaires were sent as a link via the messenger, and altogether 40 participants joined the survey voluntarily and filled the questionnaire. By giving priority to the respondents’ privacy, contact details and emails have been eliminated. Further, assurance has been given that information is exclusively used for academic purpose.
The collected data was analyzed using SPSS 21 version. The Cronbach’s alpha method was used to check the internal consistency of the data set. To consider the internal consistency of the data set the Cronbach Alpha needs to be greater than 0.70. Further, the correlation was tested to check the construct validity. The correlation value needs to be between 0.3, and 0.9 and the minimum correlation value need to be greater than 0.30 (Sekaran & Bougie, 2016).
IV. Results
The profile of the selected sample for the pilot survey is presented in Table 1.
Table 1: Demographic Profile of the Respondents
Measure Item Frequency Percentage
Gender Female 28 70
Male 12 30
Age
Under 23 7 17.5 24 – 29 17 42.5 30 – 34 10 25.0 35 – 39 5 12.5 45 – 50 1 2.5 50 above 0 0
Occupation
Senior manager 6 15.8 Manager 6 15.8 Executive 8 21.1 Entry level employee 3 7.9 Non-administrative employee 2 5.3 Self-employed 1 2.6 Student 11 28.9
The Role of Facebook Marketing on Customer-based Brand Equity and Purchase Intention in Fashion-Wear Retail Industry, Sri Lanka
© 2018 Global Journals
5
Year
2018
Globa
l Jo
urna
l of M
anag
emen
t an
d Bu
siness Resea
rch
Volum
e XVIII
Issue
VII
Ver
sion
I(
)E

Unemployed 1 2.6
Education
High School 3 7.5 Diploma 5 12.5 Degree 15 37.5 Professional qualification 2 5.0 Master degree 15 37.5 Doctorate degree 0 0
Source: Pilot Survey As expected, the majority of participates are
female (70%) and age 24 – 29 (42.5%). The remainder respondents are at age between 30 -34 (25.0%), 35 – 39 (12.5%) and under 23 17.5%.Regardingoccupation-wise, the majority of respondents were executed grade (21.1%), senior manager level (15.8%), manager (15.8%), entry-level employees (7.9%) and non-administrative employee (5.3%) (Table 1).
a)
Facebook Marketing
There were 34 items under the six components
of Facebook Marketing. When considering them separately, the reliability results are as follows.
In brand identity (BI), according to descriptive
statistics and intercorrelation
values for the test of reliability, the highest correlation for each item with at least one other item in the construct is between 0.3, and 0.9. Hence, all the items correlate adequately in this construct. The Cronbach’s alpha value is 0.725. Hence, disclosing the brand identity information such as corporate name, logo, slogan, and colour can be identified as elements in developing a brand identity (Hamzah, Alwi, & Othman, 2014). In addition to that, contents that they shared on
the Facebook page and
brands that they represent also contribute to generating
a brand identity (Tresna & Wijaya, 2015). In conversation (CV), according to descriptive
statistics and intercorrelation
values for the test of reliability, the highest correlation for each item with at least one other item in the construct is between 0.3, and 0.9.Hence, all the items correlate adequately in this construct. The Cronbach’s alpha value is 0.828, which is more than 0.7. The minimum corrected item total is 0.566. Conversation reflects the communication between a brand and customers as well as between consumers themselves (Kaplan & Haenlein, 2010).This finding validates the study of (Schmitt, 1999), which tells generating an affective brand experience will be an effective motivator for customers.
In reputation (RP), according to descriptive statistics and intercorrelation
values for the test of
reliability, the highest correlation for each item with at least one other item in the construct is between 0.3, and 0.9.Hence, all the items correlate adequately in this construct. The Cronbach’s alpha value is 0.831, which is more than 0.7. The minimum corrected item total is 0.531. This finding agrees with the study of (Veloutsou,Cleopatra; Moutinho, 2009)stating that
reputation is significant to be a successful and profitable brand.
In Relationship (RL), according to descriptive statistics and intercorrelation values for the test of reliability, is not within the range of 0.3 to 0.9. The Cronbach’s alpha value is 0.529, which is less than 0.7. Furthermore, the minimum corrected item-total correlation is 0.115. Hence, these five items have been removed. The relationship in the honeycomb model can be identified as the relationship between individuals (Babac, 2011). It includes the relationship retailer has with other retailers and with customers. However, it seems customers do not much worry about the retailer’s relationship with other relevant organizations as well as with other customers. Sharing pictures of customers is not considered as a sign of a good relationship in this context.
In Entertainment (En), according to descriptive statistics and intercorrelation values for the test of reliability, the highest correlation for each item with at least one other item in the construct is between 0.3, and 0.9.Hence, all the items correlate adequately in this construct. The Cronbach’s alpha value is 0.844, which is more than 0.7. The minimum corrected item total is 0.624. Entertainment is not a honeycomb component. However, it indicates a high level of importance as a Facebook marketing component. Entertainment is the result of the fun, excitement, cool and plays in social media. When considering Facebook, it is an entertainment medium. Therefore, customers visit Facebook with the purpose of exposing to entertaining contents(Godey et al., 2016).
In e-Word of Mouth (WOM), according to descriptive statistics and intercorrelation values for the test of reliability, the highest correlation for each item with at least one other item in the construct is between 0.3, and 0.9.Hence, all the items correlate adequately in this construct. The Cronbach’s alpha value is 0.846, which is more than 0.7. The minimum corrected item total is 0.622. e-WOM represent any positive or negative comment made by the existing, potential or past customer about a brand(Park & Lee, 2009). Sometimes it may happen between totally unknown people. Still, e-WOM has been identified as a high credible and believable medium among customers(Kapoor, Jayasimha, & Sadh, 2013).
In Sales Promotion (SP), according to descriptive statistics and intercorrelation values for the test of reliability, is not within the range of 0.3 to 0.9.
The Role of Facebook Marketing on Customer-based Brand Equity and Purchase Intention in Fashion-Wear Retail Industry, Sri Lanka
© 2018 Global Journals1
6
Year
2018
Globa
l Jo
urna
l of M
anag
emen
t an
d Bu
siness Resea
rch
Volum
e XVIII
Issue
VII
Ver
sion
I(
)E

Hence, these items are not correlated adequately in this construct. The Cronbach’s alpha value is 0.830, which is more than 0.7. If SP1,SP2 are dropped, intercorrelation values for the test of reliability, the highest correlation for each item with at least one other item in the construct is between 0.3, and 0.9.Hence, all the items correlate adequately in this construct. The Cronbach’s alpha value is 0.826, which is more than 0.7. The minimum corrected item total is 0.466.
b) Customer-based Brand Equity There were 16 items under the four components
of customer-based brand equity. When considering them separately, the reliability results are as follows.
In Brand Awareness (BA), according to descriptive statistics and intercorrelation values for the test of reliability, is not within the range of 0.3 to 0.9. Hence, these items are not correlated adequately in this construct. If BA3 is dropped, intercorrelation values for the test of reliability, the highest correlation for each item with at least one other item in the construct is between 0.3, and 0.9.Hence, all the items correlate adequately in this construct. The Cronbach’s alpha value is 0.818, which is more than 0.7. The minimum corrected item total is 0.723.In Brand Association (BS), according to descriptive statistics and intercorrelation values for the test of reliability, the highest correlation for each item with at least one other item in the construct is between 0.3, and 0.9. Hence, all the items correlate adequately in this construct. The Cronbach’s alpha value is 0.786, which is more than 0.7. If BS3 is dropped, the minimum corrected item total is 0.725, and the Cronbach’s alpha value will be 0.837. In Perceived Quality (PQ), according to descriptive statistics and intercorrelation values for the test of reliability, is not within the range of 0.3 to 0.9. Hence, these items are not correlated adequately in this construct. If PQ1 is dropped, intercorrelation values for the test of reliability, the highest correlation for each item with at least one other item in the construct is between 0.3, and 0.9.Hence, all the items correlate adequately in this construct. The Cronbach’s alpha value is 0.884, which is more than 0.7. The minimum corrected item total is 0.732.In Brand Loyalty (BL), according to descriptive statistics and intercorrelation values for the test of reliability, is not within the range of 0.3 to 0.9. Hence, these items are not correlated adequately in this
construct. If BL5 and BL6 are dropped, intercorrelation values for the test of reliability, the highest correlation for each item with at least one other item in the construct is between 0.3 and 0.9.Hence, all the items correlate adequately in this construct. The Cronbach’s alpha value is 0.853, which is more than 0.7. The minimum
adequately represent the customer-based brand equity. This finding is in line with the theory developed by (Aaker, 1991). He has identified the components of customer-based brand equity as brand awareness, brand association, perceived quality, and brand loyalty. The same components have been considered here and the pilot study found out items tested under these components are reliable.
c) Purchase Intention In Purchase Intention (PI), according to
descriptive statistics and intercorrelation values for the test of reliability, is not within the range of 0.3 to 0.9. Hence, these items are not correlated adequately in this construct. If PI8 is dropped, intercorrelation values for the test of reliability, the highest correlation for each item with at least one other item in the construct is between 0.3 and 0.9.Hence, all the items correlate adequately in this construct. The Cronbach’s alpha value is 0.880, which is more than 0.7. The minimum corrected item total is 0.598.
Purchase intention can be identified as the possibility to purchase in the future (Kim & Ko, 2010). It can be considered as customers’ action according to the brand value chain. As it predicts the future willingness of customers to relate to a brand, most of the studies consider purchase intention as an indicator or market success. As the forecasting customer value become one of an important factor in the business field, purchase intention can be identified as a critical element to study punctually (Park, Ko, & Kim, 2010).
The overall model contains three constructs. According to descriptive statistics and intercorrelation values for the test of reliability, is within the range of 0.3 to 0.9. Hence, these items are correlated adequately in this construct. The Cronbach’s alpha value is 0.855, which is more than 0.7. The minimum corrected item total is .710. Table 2 summarises the results of the pilot test.
Table 2: Summary of the Results
Constructs
No. of Items
Initial Final Cronbach’s Alpha Facebook Marketing 31 21 0.894 Customer-based Brand Equity 16 11 0.925 Purchase Intention 8 7 0.780 Entire Framework 55 39 0.949
The Role of Facebook Marketing on Customer-based Brand Equity and Purchase Intention in Fashion-Wear Retail Industry, Sri Lanka
© 2018 Global Journals
7
Year
2018
Globa
l Jo
urna
l of M
anag
emen
t an
d Bu
siness Resea
rch
Volum
e XVIII
Issue
VII
Ver
sion
I(
)E
corrected item total is 0.639. All these components
V. Conclusion and Future Research
Three constructs were identified based on literature and expert opinion. Cronbach Alpha was used to test the reliability of these constructs. All three constructs have a reliability value of 0.7 and greater. Hence the internal consistency of these constructs has been achieved.
The inter-item correlation value of each construct was studied to test the discriminant validity. Accordingly, the components such as conversation (Kaplan & Haenlein, 2010), brand identity ((Tresna & Wijaya, 2015)), entertainment(Godey et al., 2016), reputation (Veloutsou & Moutinho, 2009) brand identity(Tresna & Wijaya, 2015) and e-WOM (Park & Lee, 2009)and sales promotions have been identified as the components of Facebook Marketing. In the construct measuring FBM, the five items of the component relationship have to be removed as there is no correlation among these items. It means customers are not aware or interested to know about the relationships that their fashion-wear retailer has with other relevant businesses. In the component of sales promotion, SP1 and SP2 havethe highest correlation <0.30. Hence these items were dropped from that component and tested for reliability and validity. It indicates that customers do not experience frequent price discounts of their fashion-wear retailer and they do not believe that the price deals of their retailers are reasonable. It validates the findings of Chandon, Wansink, & Laurent, (2000).
In the construct of customer-based brand equity, under the construct of brand awareness, BA3 has the highest correlation <0.30. Hence this item was dropped from that component. It indicates that identifying brand separately from competitors brand do not contribute for the brand awareness. In the perceived quality, the item PQ1 was dropped as the highest correlation <0.30. It indicates that customer service of the retailers does not have an impact on the perceived quality. However, in online context service quality is very much important. Still, retailers provide low-quality service to the customers (Parasuraman, Zeithaml, & Malhotra, 2005).
In the component of brand loyalty, BL5 and BL6 were dropped as the highest correlation <0.30. It means that selection of that particular retailer while other retailers available and being the first choice in the future do not reflect the brand loyalty of that retailer.
In the construct of purchase intention, PI8 has the highest correlation <0.30. Hence this item was dropped from that component. This means that intention to replace the service provider with other brands does not have an impact on the purchase intention of the customers.
All three constructs comprise of valid items to measure these variables. The removed items are
marked with (R) in the appendix. To summarize, all three constructs fulfill the requirement of reliability. Out of 55, 16 items have been removed.
This pilot study attempts to identify the Facebook marketing activities and develop appropriate measures for Facebook marketing, customer-based brand equity and purchase intention. At the end of the reliability of a construct validity test, the items representing three constructs have been identified. Then these items can be used to test these constructs with a larger sample.
References Références Referencias
1. Aaker, D. A. (1991). Managing brand equity : capitalizing on the value of a brand name. Simon and Schuster. Retrieved from https://books. google.lk/books?id=r_TSY5sxnO8C&dq=Aaker,+D.+(1991).+Managing+Brand+Equity.+New+York:+The+Free+Press&lr=&source=gbs_navlinks_s
2. Ahlam, S. A. (2013). Trends and shifts in apparel retail, marketing and sourcing. DailyFT. Retrieved from http://www.ft.lk/article/203706/Trends-and-shifts-in-apparel-retail--marketing-and-sourcing
3. Babac, R. (2011). Impact of Social Media Use on Brand Equity of Magazine. MSc International Marketing.
4. Balakrishnan, B. K. P. D., Dahnil, M. I., & Yi, W. J. (2014). The Impact of Social Media Marketing Medium Toward Purchase Intention and Brand Loyalty Among Generation Y. Procedia - Social and Behavioral Sciences, 148, 177–185. https://doi.org/
10.1016/j. sbspro.2014.07.032
5. Bhatnagar, A., Misra, S., & Rao, H. R. (2000). On risk, convenience, and Internet shopping behavior. Communications of the ACM, 43(11), 98–105. https://doi.org/10.1145/353360.353371
6. Bruhn, M., Schoenmueller, V., & Schäfer, D. B. (2012). Are social media replacing traditional media in terms of brand equity creation? Management Research Review, 35(9), 770–790. https://doi.org/
10.1108/01409171211255948
7.
Chaffey, D. (2018). Global social media research summary 2018 | Smart Insights. Retrieved September 21, 2018, from https://www.smart insights.com/social-media-marketing/social-media-strategy/new-global-social-media-research/
9.
Chang, H. H., & Liu, Y. M. (2009). The impact of brand equity on brand preference and purchase intentions in the service industries. Service Industries Journal, 29(12), 1687–1706. https://doi. org/10.1080/02642060902793557
The Role of Facebook Marketing on Customer-based Brand Equity and Purchase Intention in Fashion-Wear Retail Industry, Sri Lanka
© 2018 Global Journals1
8
Year
2018
Globa
l Jo
urna
l of M
anag
emen
t an
d Bu
siness Resea
rch
Volum
e XVIII
Issue
VII
Ver
sion
I(
)E
8. Chandon, P., Wansink, B., & Laurent, G. (2000). R & D A Benefit Congruency Framework Of Sales Promotion Effectiveness. Retrieved from https://flora.insead.edu/fichiersti_wp/inseadwp2000/2000-22.pdf

10. Chen, C.-F., & Chang, Y.-Y. (2008). Airline brand equity, brand preference, and purchase intentions-The moderating effects of switching costs. Journal of Air Transport Management, 14, 40–42. https://doi. org/10.1016/j.jairtraman.2007.11.003
11. Dehghani, M., & Tumer, M. (2015). A research on effectiveness of Facebook advertising on enhancing purchase intention of consumers. Computers in Human Behavior, 49, 597–600. https://doi.org/ 10.1016/j.chb.2015.03.051
12. Godey, B., Manthiou, A., Pederzoli, D., Rokka, J., Aiello, G., Donvito, R., & Singh, R. (2016a). Social media marketing efforts of luxury brands: Influence on brand equity and consumer behavior. Journal of Business Research, 69(12), 5833–5841. https://doi. org/10.1016/j.jbusres.2016.04.181
13. Godey, B., Manthiou, A., Pederzoli, D., Rokka, J., Aiello, G., Donvito, R., & Singh, R. (2016b). Social media marketing efforts of luxury brands: Influence on brand equity and consumer behavior. Journal of Business Research, 69(12), 5833–5841. https://doi. org/10.1016/j.jbusres.2016.04.181
14. Hamzah, Z. L., Alwi, S. F. S., & Othman, M. N. (2014). Fulltext. Journal of Business Research, (11)(67), 2299–2310.
15. K.L.Keller. (2007). Strategic Brand Management (3rd Edition) (text only) 3 edition by K.L.Keller: K.L.Keller: Amazon.com: Books (3 edition). Prentice Hall. Retrieved from https://www.amazon.com/ Strategic-Brand-Management-text-K-LKeller/dp/ B003TOYAN2
16. Kambrugamuwa, A. (2015). Shopping Fashion Online: An enormous opportunity for entrepreneurs but are we ready yet? – Lanka Business Online. Retrieved October 24, 2017, from http://www. lankabusinessonline.com/shopping-fashion-online-an-enormous-opportunity-for-entrepreneurs-but-are-we-ready-yet/
17. Kamburugamuwa, A. (2015). Shopping Fashion Online: An enormous opportunity for entrepreneurs but are we ready yet? – Lanka Business Online. Retrieved October 26, 2017, from http://www.lanka businessonline.com/shopping-fashion-online-an-enormous-opportunity-for-entrepreneurs-but-are-we-ready-yet/
18. Kaplan, A. M., & Haenlein, M. (2010). Users of the world, unite! The challenges and opportunities of Social Media. Business Horizons, 53(1), 59–68. https://doi.org/10.1016/j.bushor.2009.09.003
19. Kapoor, P. S., Jayasimha, K. R., & Sadh, A. (2013). Brand-related, Consumer to Consumer, Communication via Social Media. IIM Kozhikode Society & Management Review, 2(1), 43–59. https://doi.org/10.1177/2277975213496514
20. Kim, A. J., & Ko, E. (2010). Impacts of Luxury Fashion Brand’s Social Media Marketing on Customer Relationship and Purchase Intention.
Journal of Global Fashion Marketing, 1(3), 164–171. https://doi.org/10.1080/20932685.2010.10593068
21. Kim, A. J., & Ko, E. (2012). Do social media marketing activities enhance customer equity? An empirical study of luxury fashion brand. Journal of Business Research, 65(10), 1480–1486. https://doi.org/10.1016/j.jbusres.2011.10.014
22. Kim, A. J., & Ko, E. (2012). Do social media marketing activities enhance customer equity? An empirical study of luxury fashion brand. Journal of Business Research, 65(10), 1480–1486. https://doi.org/10.1016/j.jbusres.2011.10.014
23. Kotler, P., Baker, M. J., Gummesson, E., & Buttle, F. A. (1993). EDITORIAL. Journal of Hospitality & Leisure Marketing, 1(2), 1–6. https://doi.org/10.
1300/j150v01n02_01
24. Mohr, I., & John, S. (2013). The Impact of Social Media on the Fashion Industry. Retrieved from http://digitalcommons.www.na-businesspress.com/ JABE/MohrI_Web15_2_.pdf
25. Moradi, H., & Zarei, A. (2011). The Impact of Brand Equity on Purchase Intention and Brand Preference-the Moderating Effects of Country of Origin Image. Australian Journal of Basic and Applied Sciences, 5(3), 539–545. Retrieved from file:///C:/Users/Arjuna/ Desktop/New folder/Purchase Intention/2011 Hadi Moradi.pdf
26. Parasuraman, A., Zeithaml, V. A., & Malhotra, A. (2005). E-S-QUAL a multiple-item scale for assessing electronic service quality. Journal of Service Research, 7(3), 213–233. https://doi.org/ 10.1177/1094670504271156
27. Park, C., & Lee, T. M. (2009). Information direction, website reputation and eWOM effect: A moderating role of product type. Journal of Business Research, 62(1), 61–67. https://doi.org/10.1016/j.jbusres. 2007.11.017
28. Park, J., Ko, E., & Kim, S. (2010). Consumer Behavior in Green Marketing for Luxury Brand: A Cross-Cultural Study of US, Japan and Korea. Journal of Global Academy of Marketing Science, 20(4), 319–333. https://doi.org/10.1080/ 12297119. 2010.9707436
29. Pütter, M. (2017). The Impact of Social Media on Consumer Buying Intention. Journal of International Business Research and Marketing, 3(1), 7–13. https://doi.org/10.18775/jibrm.1849-8558.2015.31. 3001
30. Schmitt, B. (1999). Experiential Marketing. Journal of Marketing Management,
15(1–3), 53–67. https://doi.
org/10.1362/026725799784870496
31. Sekaran, U., & Bougie, R. (2016). Research methods for business : a skill-building approach. Retrieved from https://books.google.lk/books? id=Ko6bCgAAQBAJ&printsec=frontcover&dq=uma+sekaran&hl=en&sa=X&ved=0ahUKEwjVkNykke
The Role of Facebook Marketing on Customer-based Brand Equity and Purchase Intention in Fashion-Wear Retail Industry, Sri Lanka
© 2018 Global Journals
9
Year
2018
Globa
l Jo
urna
l of M
anag
emen
t an
d Bu
siness Resea
rch
Volum
e XVIII
Issue
VII
Ver
sion
I(
)E

32.
Social Media Stats Sri Lanka. (2018). Retrieved September 19, 2018, from http://gs.statcounter. com/social-media-stats/all/sri-lanka
33.
Tresna, L., & Wijaya, J. C. (2015). The
Impact of Social Media Towards Brand Equity: An Empirical Study of Mall X. IBuss Management, 3(2), 37–48.
34.
Veloutsou,Cleopatra; Moutinho, L. (2009). Brand relationships through brand reputation and brand tribalism. Journal of Business Research, 62(3), 314–322. https://doi.org/10.1016/J.JBUSRES.2008.05. 010
35.
Vihn, T. T., & Huy, L. Van. (2016). The Relationships among Brand Equity, Brand Preference, and Purchase Intention: Empirical Evidence from the Motorbike Market in Vietnam. International Journal of Economics and Finance, 8(3). https://doi.org/ 10.5539/ijef.v8n3p75
36.
Yazdanparast, A., Joseph, M., & Muniz, F. (2016). Consumer based brand equity in the 21st century: an examination of the role of social media marketing. Young Consumers, 17(3), 243–255. https://doi.org/10.1108/YC-03-2016-00590
The Role of Facebook Marketing on Customer-based Brand Equity and Purchase Intention in Fashion-Wear Retail Industry, Sri Lanka
© 2018 Global Journals1
10
Year
2018
Globa
l Jo
urna
l of M
anag
emen
t an
d Bu
siness Resea
rch
Volum
e XVIII
Issue
VII
Ver
sion
I(
)E
vYAhWMOo8KHQwpB3MQ6AEIJzAA#v=onepage&q=uma sekaran&f=false

© 2018. Dr. Dipa Mitra, Mr. Jayjit Chakraborty & Mr. Shantanu. P. Chakraborty. This is a research/review paper, distributed under the terms of the Creative Commons Attribution-Noncommercial 3.0 Unported License http://creativecommons.org/licenses/by-nc/3.0/), permitting all non-commercial use, distribution, and reproduction in any medium, provided the original work is properly cited.
Perception-Awareness Model with Respect to Green Marketing Practices-A Study in Kolkata and its Suburbs
By Dr. Dipa Mitra, Mr. Jayjit Chakraborty & Mr. Shantanu. P. Chakraborty University of Calcutta
Abstract- Green Marketing is considered as one of the major trends in modern businesses. Today, green marketing is a one of the main focal points in business endeavours to gain competitive advantage. Consumers are becoming more sensitive in their environmental attitudes, preferences and purchases. In this regard an extensive study has been undertaken to investigate the awareness and perception level of the consumers of Kolkata and suburbs. The main purpose of the present study is to investigate the Awareness & Perception of the consumers towards green marketing practices. A descriptive research has been conducted with the help of primary data collected from 197 respondents with the help of personal interview and questionnaire survey. CHI-SQUARE ANALYSIS is used to check the influence of consumers’ demographics on Awareness & Perception towards Green Marketing Practices. RELIABILITY TEST has been done to check the internal consistency of data, PRINCIPAL COMPONENT ANALYSIS, MULTIPLE REGRESSION ANALYSIS and CONFIRMATORY FACTOR ANALYSIS are performed to identify major factors contributing towards Awareness & Perception of the consumers; to investigate their influence level and to frame an equation on the basis of the same; and to ensure whether hypothesised model is a perfect fit with the original model. Finally a STRUCTURAL EQUATION MODELING has been framed.
Keywords: green marketing, awareness, perception, consumers, model.
GJMBR-E Classification: JEL Code: M39
PerceptionAwarenessModelwithRespecttoGreenMarketingPracticesAStudyinKolkataanditsSuburbs Strictly as per the compliance and regulations of:
Global Journal of Management and Business Research: E Marketing Volume 18 Issue 7 Version 1.0 Year 2018 Type: Double Blind Peer Reviewed International Research JournalPublisher: Global JournalsOnline ISSN: 2249-4588 & Print ISSN: 0975-5853

Perception-Awareness Model with Respect to Green Marketing Practices- A Study in Kolkata
and its Suburbs Dr. Dipa Mitra α, Mr. Jayjit Chakraborty σ & Mr. Shantanu. P. Chakraborty ρ
Abstract-
Green Marketing
is considered as one of the major trends in modern businesses. Today, green marketing is a one of the main focal points in business endeavours to gain competitive advantage. Consumers are becoming more sensitive in their environmental attitudes, preferences and purchases. In this regard an extensive study has been undertaken to investigate the awareness and perception level of the consumers of Kolkata and suburbs. The main purpose of the present study is to investigate the Awareness & Perception of the consumers towards green marketing practices. A descriptive research has been conducted with the help of primary data collected from 197 respondents with the help of personal interview and questionnaire survey. CHI-SQUARE ANALYSIS is used to check the influence of consumers’ demographics on Awareness & Perception towards Green Marketing Practices. RELIABILITY TEST has been done to check the internal consistency of data, PRINCIPAL COMPONENT ANALYSIS, MULTIPLE REGRESSION ANALYSIS and CONFIRMATORY FACTOR ANALYSIS are performed to identify major factors contributing towards Awareness & Perception of the consumers; to investigate their influence level and to frame an equation on the basis of the same; and to ensure whether hypothesised model is a perfect fit with the
original model. Finally a STRUCTURAL EQUATION MODELING has been framed. This model may help the policy makers of the Indian green marketers to strengthen their marketing strategy and to improve their eco friendly performance, if required, to promote a green lifestyle.
Keywords:
green marketing, awareness, perception, consumers, model.
I.
Introduction
reen marketing is an emerging concept, which deals with practicing safe practices such that people are aware about their surroundings and
the problem, while purchasing a product and disposing it off after use. It has environmental impact, as it is about increasing the awareness to consumer and making them sensitive, such that they switch to green product and services.
Green marketing is gaining popularity and
success because of its environmental friendly approach. Green products are easy to use and dispose off as they
can be recycled and reused. This concept is becoming a trendsetter as it is allowing most of the consumer about environmental issues and helping them to become selective in using green products. Consumers nowadays are becoming more and more sensitive and selective in their approach for green products.
Customer satisfaction plays a very important role as far as green marketing is concerned. There is lot of pressure to the manufacturers politically, socially and ethically, in manufacturing of green product, that is economical and suits consumer needs. Companies are becoming more and more competitive in manufacturing of green products, as most of the manufacturers are profit driven, and are motivated to embrace changes. Purchasing behaviour of the customer is changing from traditional product to green products as they are nowadays much more aware of the environment and its surrounding. The packaging, advertising, and marketing of green products have gone through sea change in recent years, but the problem these firms are facing is the cost in the production and manufacturing of green products and making it available for the masses.
In this respect an empirical study has been undertaken to understand the Awareness & Perception of the consumers of Kolkata and its suburbs towards green marketing practices; to investigate the major factors and their influencing level on Awareness and Perception towards green marketing practices; and finally to frame a model on the same to facilitate the policy decision of the green marketers.
II. Literature Review
Follows, S.B and Jobber, D. (2000) have worked in creating values and specific attitudes. They tried to analyze consumer behaviour in purchase intention and the consequences that leads to ease of disposal of green products. Authors have tried to identify the results of using green products and had provided a background in analyzing the attitude of the consumers using green products.
Laroche et al. (2001) have suggested in their study that, consumers are ready to pay high cost while purchasing a green product, as they find that, there lies an opportunity for big company and businesses in investing in eco friendly products. Manufacturers are
G
© 2018 Global Journals
11
Year
2018
Globa
l Jo
urna
l of M
anag
emen
t an
d Bu
siness Resea
rch
Volum
e XVIII
Issue
VII
Ver
sion
I(
)E
Author α: Associate Professor & Coordinator, M. Phil. & Ph.D. Programme, Indian Institute of Social Welfare and Business Management. Author σ ρ: Full Time Lecturer, The Bhawanipur Education Society College. e-mail: [email protected]
making green products, as they find it profitable for the companies and businesses to invest in green products.
Hartmann et al. (2005) have worked on and have come up with a strategy that is attracting lot of attention from manufacturers and consumers, both in marketing and branding green products. It assumes emotional and economic benefits in marketing green products, both for businesses and consumers as a whole. The study focuses on branding and marketing green products.
D’Souza et al. (2006) have found that, there is a lot of expectation of the consumers regarding high quality green products, which are environmentally user friendly and can be recycled, as well as cost effective. To market green product quality, cost and awareness among the consumer play a very important and vital role.
Clem (2008) has emphasized that, consumers nowadays are becoming more concerned about the environment and there is an urge among consumers to use green products and adopt green practices. The continuous effort by government and other political sources have positive impact in increasing consumer awareness. The socio, economic and political scenario had been responsible for the change in attitude and purchase of green products.
Singh, S.P (2008) has highlighted the problems associated with green products. Green marketing can be applied to consumer goods, services, industrial goods, eco tourism and other related areas. Companies manufacturing and green products, keeping in mind the consequences of producing green products, are able to venture into new markets and are able to generate profits as compared to the companies, that lack vision in manufacturing green products.
Andrews, C. and Devault, D. (2009) have been able to explain the correlation between government policy, business strategy, that is responsible to develop a market for green product. Businesses have encouraged innovation and adopted new technology, that is promoting the production of green products. Consumer behaviour has undergone a paradigm shift and is acting as a key driver in promoting green products.
Mishra, P. and Sharma, P. (2010) in their work, have tried to understand the impact of green marketing in Indian Context and suggested the ways that can be adopted to promote green marketing in future. As per the authors, green marketing is sure and certain to grow in future. However, there are challenges in implementing green strategies in Indian context, such as lack of awareness, standardization and authenticity.
Drozdenko et al. (2011) have highlighted some of the very important and critical areas, that are related to pricing, distribution and marketing strategy for green products. It was found that there are gender differences for the product categories, but there were no
differences, that were observed with respect to education and family income. It was found that, consumers are ready to pay higher prices for purchase of green products.
Dey, P. (2015) has discussed the characteristics of Indian consumers such as demographic factors such as age, qualification and income, that play a vital role for the companies and the manufacturers in formulating green marketing strategies, that are impacting consumer behaviour in use and purchase of green products. Indian consumers in general, lack awareness and interest in purchase of green products.
Rahman et al. (2017) have been able to focus on the advertising and promotional strategy, that is increasing the awareness about green products among consumers. A strong correlation was found between the consumer perception and green marketing strategies opted by the manufacturers. The study emphasizes the use of marketing, and selling green products that are environment friendly.
III. Research Objectives
The main purpose of the present study is to investigate the Awareness & Perception of the people of Kolkata and its suburbs towards green marketing practices, to point out the most significant factors influencing respondents Awareness & Perception towards Green Marketing Practices, and to identify the impact of those factors on Consumer Awareness & Perception and finally to established a model to facilitate the policy decision of the green marketers regarding this issue checking the model fit.
IV. Research Methodology
A descriptive research has been conducted with the help of primary data collected from the respondents by personal interview and close ended questionnaire. After collecting data from 197 respondents through questionnaire survey from Kolkata and its suburbs, CHI-SQUARE ANALYSIS is used to check the influence of consumer demographics on Awareness & Perception towards Green Marketing Practices. RELIABILITY TEST has been done to check the internal consistency of the data. PRINCIPAL COMPONENT ANALYSIS is performed to identify major factors. MULTIPLE REGRESSION ANALYSIS is used on the major factors identified to investigate their influence level and to frame an equation on the basis of the same. Confirmatory Factor Analysis is applied to ensure whether hypothesised model is a perfect fit with the original model or not. Finally a STRUCTURAL EQUATION MODELING has been framed to confirm all the paths of the model are associated with statistically significant coefficients and the model is a perfect fit.
Perception-Awareness Model with Respect to Green Marketing Practices-A Study in Kolkata and its Suburbs
© 2018 Global Journals1
12
Year
2018
Globa
l Jo
urna
l of M
anag
emen
t an
d Bu
siness Resea
rch
Volum
e XVIII
Issue
VII
Ver
sion
I(
)E
V. Analysis and Discussion
a) Chi-Square Analysis
Perception-Awareness Model with Respect to Green Marketing Practices-A Study in Kolkata and its Suburbs
© 2018 Global Journals
13
Year
2018
Globa
l Jo
urna
l of M
anag
emen
t an
d Bu
siness Resea
rch
Volum
e XVIII
Issue
VII
Ver
sion
I(
)E
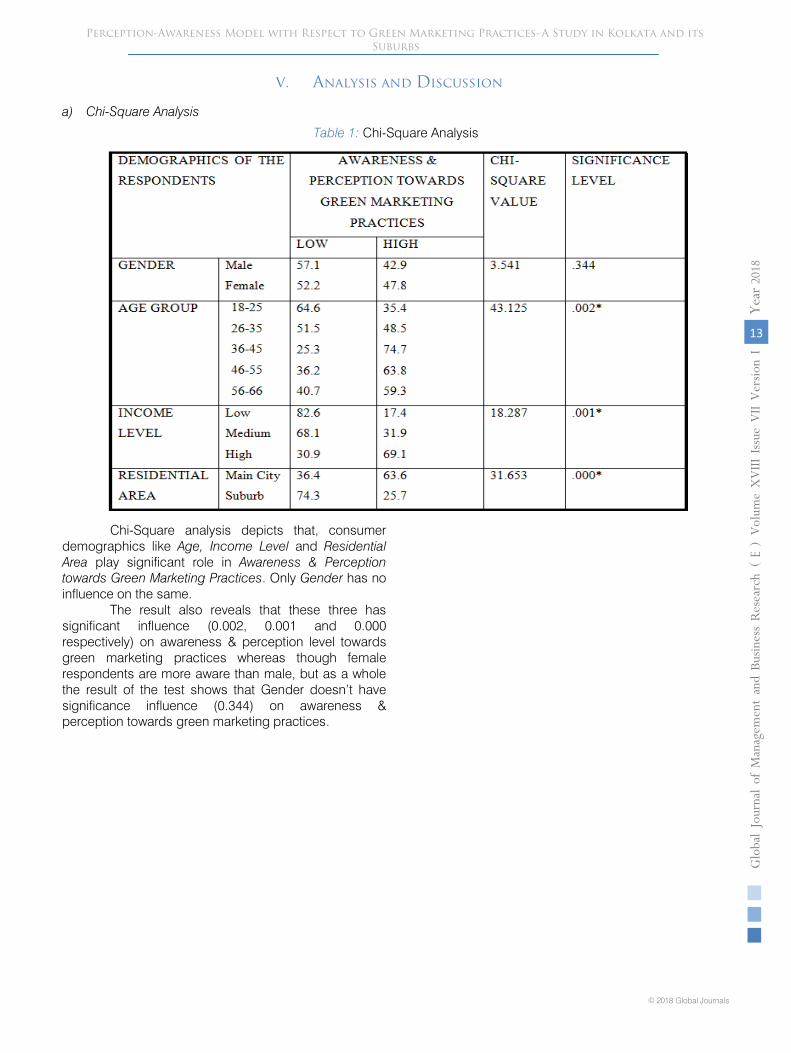
Table 1: Chi-Square Analysis
Chi-Square analysis depicts that, consumer demographics like Age, Income Level and Residential Area play significant role in Awareness & Perception towards Green Marketing Practices. Only Gender has no influence on the same.
The result also reveals that these three has significant influence (0.002, 0.001 and 0.000 respectively) on awareness & perception level towards green marketing practices whereas though female respondents are more aware than male, but as a whole the result of the test shows that Gender doesn’t have significance influence (0.344) on awareness & perception towards green marketing practices.

Perception-Awareness Model with Respect to Green Marketing Practices-A Study in Kolkata and its Suburbs
© 2018 Global Journals1
14
Year
2018
Globa
l Jo
urna
l of M
anag
emen
t an
d Bu
siness Resea
rch
Volum
e XVIII
Issue
VII
Ver
sion
I(
)E
b) Principle Component Analysis
Table 2: Summary Table of Principle Component Analysis
Reliability Statistics shows Cronbach's Alpha value for all 18 items is .834. The KMO value is .855 and Bartlett’s test of sphericity being statistically significant (.002) shows the adequacy of data to perform factor analysis. The value of more than .8 is meritorious. In the above table six major factors (eigen values more than 1) are extracted whose values are between .7 and .8. All the extracted components explain 72.34 % variance.
Perception-Awareness Model with Respect to Green Marketing Practices-A Study in Kolkata and its Suburbs
© 2018 Global Journals
15
Year
2018
Globa
l Jo
urna
l of M
anag
emen
t an
d Bu
siness Resea
rch
Volum
e XVIII
Issue
VII
Ver
sion
I(
)E
c) Confirmatory Factor Analysis
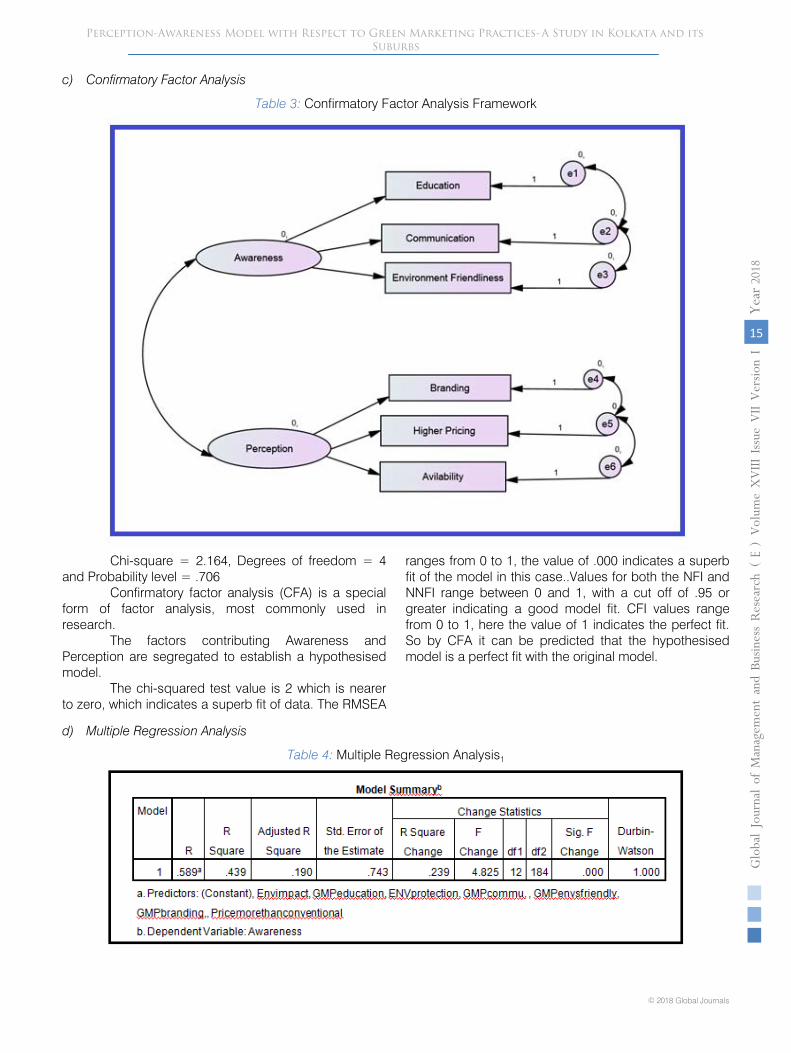
Table 3: Confirmatory Factor Analysis Framework
Chi-square = 2.164, Degrees of freedom = 4 and Probability level = .706
Confirmatory factor analysis (CFA) is a special form of factor analysis, most commonly used in research.
The factors contributing Awareness and Perception are segregated to establish a hypothesised model.
The chi-squared test value is 2 which is nearer to zero, which indicates a superb fit of data. The RMSEA
ranges from 0 to 1, the value of .000 indicates a superb fit of the model in this case..Values for both the NFI and NNFI range between 0 and 1, with a cut off of .95 or greater indicating a good model fit. CFI values range from 0 to 1, here the value of 1 indicates the perfect fit. So by CFA it can be predicted that the hypothesised model is a perfect fit with the original model.
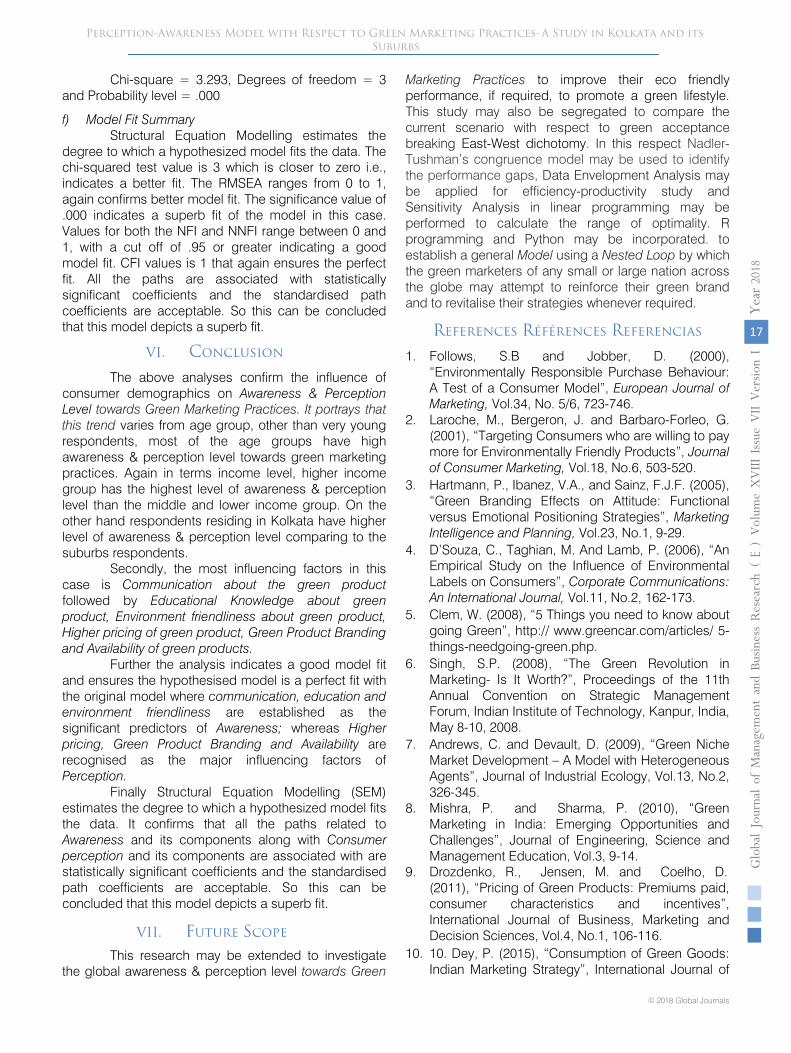
d) Multiple Regression Analysis
Table 4: Multiple Regression Analysis1

Perception-Awareness Model with Respect to Green Marketing Practices-A Study in Kolkata and its Suburbs
© 2018 Global Journals1
16
Year
2018
Globa
l Jo
urna
l of M
anag
emen
t an
d Bu
siness Resea
rch
Volum
e XVIII
Issue
VII
Ver
sion
I(
)E
The R value represents the simple correlation and it is 0.589.The R2 value indicates the total variation in the dependent variable. In this case, 44% variance can be explained. ANOVA indicates the statistical significance of the regression model. In ANOVA, the
significance value is .000, which indicates that; the regression model is statistically significant and it predicts the awareness about the green product. This represents an overall good fit for the data. Hence the regression equation can be
AWARENESS = 2.750+ (.286 * Communication) + (.105* Education) + (.172 * Environment friendliness)
Table 5: Multiple Regression Analysis2
The R value represents the simple correlation and is 0.646. The R2 value indicates the total variation in the dependent variable. In this case, 51% variance can be explained. .ANOVA indicates the statistical significance of the regression model. In ANOVA, the
significance value is .003, which indicates that; the regression model is statistically significant and it predicts the Perception about the green product. This represents an overall good fit for the data.
The regression equation is
PERCEPTION= 3.248+ (.302 * Branding) + (.221* Higher Pricing) + (.175 * Availability)
e) Structural Equation Modelling
Table 6: Structural Equation Modelling (Sem)
Perception-Awareness Model with Respect to Green Marketing Practices-A Study in Kolkata and its Suburbs
© 2018 Global Journals
17
Year
2018
Globa
l Jo
urna
l of M
anag
emen
t an
d Bu
siness Resea
rch
Volum
e XVIII
Issue
VII
Ver
sion
I(
)E
Chi-square = 3.293, Degrees of freedom = 3 and Probability level = .000
f) Model Fit Summary Structural Equation Modelling estimates the
degree to which a hypothesized model fits the data. The chi-squared test value is 3 which is closer to zero i.e., indicates a better fit. The RMSEA ranges from 0 to 1, again confirms better model fit. The significance value of .000 indicates a superb fit of the model in this case. Values for both the NFI and NNFI range between 0 and 1, with a cut off of .95 or greater indicating a good model fit. CFI values is 1 that again ensures the perfect fit. All the paths are associated with statistically significant coefficients and the standardised path coefficients are acceptable. So this can be concluded that this model depicts a superb fit.
VI. Conclusion
The above analyses confirm the influence of consumer demographics on Awareness & Perception Level towards Green Marketing Practices. It portrays that this trend varies from age group, other than very young respondents, most of the age groups have high awareness & perception level towards green marketing practices. Again in terms income level, higher income group has the highest level of awareness & perception level than the middle and lower income group. On the other hand respondents residing in Kolkata have higher level of awareness & perception level comparing to the suburbs respondents.
Secondly, the most influencing factors in this case is Communication about the green product followed by Educational Knowledge about green product, Environment friendliness about green product, Higher pricing of green product, Green Product Branding and Availability of green products.
Further the analysis indicates a good model fit and ensures the hypothesised model is a perfect fit with the original model where communication, education and environment friendliness are established as the significant predictors of Awareness; whereas Higher pricing, Green Product Branding and Availability are recognised as the major influencing factors of Perception.
Finally Structural Equation Modelling (SEM) estimates the degree to which a hypothesized model fits the data. It confirms that all the paths related to Awareness and its components along with Consumer perception and its components are associated with are statistically significant coefficients and the standardised path coefficients are acceptable. So this can be concluded that this model depicts a superb fit.
VII. Future Scope
This research may be extended to investigate the global awareness & perception level towards Green
Marketing Practices to improve their eco friendly performance, if required, to promote a green lifestyle. This study may also be segregated to compare the current scenario with respect to green acceptance breaking East-West dichotomy. In this respect Nadler-Tushman’s congruence model may be used to identify the performance gaps, Data Envelopment Analysis may be applied for efficiency-productivity study and Sensitivity Analysis in linear programming may be performed to calculate the range of optimality. R programming and Python may be incorporated. to establish a general Model using a Nested Loop by which the green marketers of any small or large nation across the globe may attempt to reinforce their green brand and to revitalise their strategies whenever required.
References Références Referencias
1. Follows, S.B and Jobber, D. (2000), “Environmentally Responsible Purchase Behaviour: A Test of a Consumer Model”, European Journal of Marketing, Vol.34, No. 5/6, 723-746.
2. Laroche, M., Bergeron, J. and Barbaro-Forleo, G. (2001), “Targeting Consumers who are willing to pay more for Environmentally Friendly Products”, Journal of Consumer Marketing, Vol.18, No.6, 503-520.
3. Hartmann, P., Ibanez, V.A., and Sainz, F.J.F. (2005), “Green Branding Effects on Attitude: Functional versus Emotional Positioning Strategies”, Marketing Intelligence and Planning, Vol.23, No.1, 9-29.
4. D’Souza, C., Taghian, M. And Lamb, P. (2006), “An Empirical Study on the Influence of Environmental Labels on Consumers”, Corporate Communications: An International Journal, Vol.11, No.2, 162-173.
5. Clem, W. (2008), “5 Things you need to know about going Green”, http:// www.greencar.com/articles/ 5-things-needgoing-green.php.
6. Singh, S.P. (2008), “The Green Revolution in Marketing- Is It Worth?”, Proceedings of the 11th Annual Convention on Strategic Management Forum, Indian Institute of Technology, Kanpur, India, May 8-10, 2008.
7. Andrews, C. and Devault, D. (2009), “Green Niche Market Development – A Model with Heterogeneous Agents”, Journal of Industrial Ecology, Vol.13, No.2, 326-345.
8. Mishra, P. and Sharma, P. (2010), “Green Marketing in India: Emerging Opportunities and Challenges”, Journal of Engineering, Science and Management Education, Vol.3, 9-14.
9. Drozdenko, R., Jensen, M. and Coelho, D. (2011), “Pricing of Green Products: Premiums paid, consumer characteristics and incentives”, International Journal of Business, Marketing and Decision Sciences, Vol.4, No.1, 106-116.
10. 10. Dey, P. (2015), “Consumption of Green Goods: Indian Marketing Strategy”, International Journal of

Perception-Awareness Model with Respect to Green Marketing Practices-A Study in Kolkata and its Suburbs
Management Research and Business Strategy, Vol.4, No.1, 212-224.
11. 11. Rahman,S., Barua,A., Hoque,R. And Zahir,R. (2017), “Influence of Green Marketing on Consumer Behaviour: A Realistic Study on Bangladesh”, Global Journal of Management and Business Research: E Marketing, Vol.17, No.1.
© 2018 Global Journals1
18
Year
2018
Globa
l Jo
urna
l of M
anag
emen
t an
d Bu
siness Resea
rch
Volum
e XVIII
Issue
VII
Ver
sion
I(
)E

© 2018. Jamila Jouali & Ibtissam Abarar. This is a research/review paper, distributed under the terms of the Creative Commons Attribution-Noncommercial 3.0 Unported License http://creativecommons.org/licenses/by-nc/3.0/), permitting all non-commercial use, distribution, and reproduction in any medium, provided the original work is properly cited.
L’Effet Médiateur De La Satisfaction Sur Les Liens Relationnels Et La Fidélité L’application De La Méthode De Barron Kenny 1986
By Jamila Jouali & Ibtissam Abarar
Abstract- Les relations dans le contexte professionnel représentent un domaine d'intérêt au milieu des universitaires et des praticiens du monde entier. Les entreprises développent de plus en plus des liens avec d'autres organisations afin de créer un avantage concurrentiel. Notre recherche propose d'étudier l'effet médiateur de la satisfaction sur la relation entre les liens relationnels et la fidélité. La recherche est à situer dans le contexte de service aux entreprises au Maroc. Les données collectées sont à la base des clients des prestataires de service situés dans la zone de Casablanca. Les résultats montrent en effet que la satisfaction joue un rôle médiateur dans la relation entre les liens relationnels et la fidélité à l’égard de son prestataire. Elle y participe néanmoins, via son rôle de conception de la qualité relationnelle.
GJMBR-E Classification: JEL Code: M31
LEffetMdiateurDeLaSatisfactionSurLesLiensRelationnelsEtLaFidlitLapplicationDeLaMthodeDeBarronKenny1986
Strictly as per the compliance and regulations of:
Global Journal of Management and Business Research: E Marketing Volume 18 Issue 7 Version 1.0 Year 2018 Type: Double Blind Peer Reviewed International Research JournalPublisher: Global JournalsOnline ISSN: 2249-4588 & Print ISSN: 0975-5853
Université Hasssan 2, Ecole Supérieure de Technologie

L’Effet Médiateur De La Satisfaction Sur Les Liens Relationnels Et La Fidélité L’application De La
Méthode De Barron Kenny 1986 Jamila Jouali α & Ibtissam Abarar σ
,
Abstract-
Les relations dans le contexte professionnel représentent un domaine d'intérêt au milieu des universitaires et des praticiens du monde entier. Les entreprises développent de plus en plus des liens avec d'autres organisations afin de créer un avantage concurrentiel. Notre recherche propose d'étudier l'effet médiateur de la satisfaction sur la relation entre les liens relationnels et la fidélité. La recherche est à situer dans le contexte de service aux entreprises au Maroc. Les données collectées sont à la base des clients des prestataires de service situés dans la zone de Casablanca. Les résultats montrent en effet que la satisfaction joue un rôle médiateur dans la relation entre les liens relationnels et la fidélité à l’égard de son prestataire. Elle y participe néanmoins, via son rôle de conception de la qualité relationnelle.
ntroduction
'intérêt croissant porté au contexte du marketing industriel a conduit les chercheurs à approfondir leurs recherches sur la satisfaction du client
particulièrement dans les services aux entreprises Homburg et Rudolf, (2001). Les récents travaux de Caceres et Paparoidamis, (2007),
dans le contexte inter-organisationnel, montre la complexité des produits et le risque perçu d'achat. Cela démontre que les relations efficaces et durables sont essentielles pour créer une valeur mutuelle et donc améliorer la performance des entreprises. La littérature porte plus sur les pratiques relationnelles adoptées par les fournisseurs et les avantages potentiels tirés de l’approche relationnelle. Gronroos (1994)
soutient que ce type de marketing "sert à 'établir, maintenir et améliorer les relations avec les clients et d'autres partenaires, afin que les objectifs des parties concernées soient réussis. Ceci est réalisé par un échange mutuel et la réalisation des promesses ". Les principes sur lesquels se base le marketing relationnel incluent la confiance, l'engagement et la satisfaction du client Gil-Saura et al, (2009).
D’autres facteurs clés sont liés au succès de la collaboration de la relation dans le contexte B2B. Selon Ruokonen et al, (2008), une stratégie relationnelle efficace permet au fournisseur en termes de coopération accrue, une meilleure compréhension des besoins des clients menant à l'élaboration de produits et de services plus
personnalisés. Les avantages financiers comprennent les coûts dus à la rétention plus élevé des clients, et les bénéfices accrus en raison de la fidélité des clients et la réduction des prix de la sensibilité Gronroos, 1994; Reichheld et Sasser, (1990). Les aspects des défenseurs de la théorie relationnelle et le développement à long terme des relations commercialement viables avec les clients passent par l’écoute de leur exigences et la satisfaction de leur besoins afin de les fidéliser à une forte valeur ajoutée Reichheld et Sasser, (1990).A ce jour, une grande partie de l'activité de recherche en marketing relationnel confirme que la présence de la confiance et de l'engagement a un impact positif sur les relations Barry et al, (2008). Selon Morgan et Hunt (1994), la confiance existe lorsque les parties envisage le partenaire de l’échange à travers ses indicateurs" fiabilité, crédibilité et intégrité ". L'engagement de la relation est défini «comme un désir durable à maintenir une relation privilégiée" Moorman et al, (1992). La confiance et l'engagement sont fondés sur la communication régulière dans une relation. Nous cherchons dans ce travail de monter l’importance de la satisfaction comme une variable médiatrice entre les liens relationnels et la fidélité.
II. Définition Du Marketing Relationnel
L’examen de la littérature sur le marketing relationnel montre une diversité des définitions de la relation. Les définitions exposées dans la littérature dépendent de la nature et du contexte de l’étude. Nous présentons dans ce qui suit une synthèse des principaux résultats théoriques. Voir le tableau ci-dessous.
L
© 2018 Global Journals
19
Year
2018
Globa
l Jo
urna
l of M
anag
emen
t an
d Bu
siness Resea
rch
Volum
e XVIII
Issue
VII
Ver
sion
I(
)E
Author α: Université Hasssan 2, Ecole Supérieure de TechnologieRoute d'Eljadida, KM 7, CASABLANCA, Marocco. e-mail: [email protected] σ: Laboratoire de Recherche en Management des Organisations (LAREMO).
I. I

Table 1
Auteurs Definitions
Van de Ven (1976)
"Une relation inter-organisationnelle exhibe les propriétés de base de toute forme organisée de comportement collectif : les comportements sont orientés vers des objectifs. Une interdépendance existe entre les membres et elle peut agir comme une unité ayant une identité distincte de celle de ses membres".
Anderson et Narus (1990)
Un partenariat reflète "le degré avec lequel il y a une reconnaissance et une compréhension que le succès de chacune des firmes dépend en partie l’une de l’autre. Chacune effectuant des actions afin de fournir un effort coordonné orienté vers la satisfaction conjointe des besoins du marché".
Seabright, Levinthal et Fichman (1992)
"Une relation d'échange consiste en un ensemble d'arrangements formels ou informels entre organisations indépendantes impliquant le transfert de ressources ou de services".
Han, Wilson et Dant (1993)
Une relation client/fournisseur de long terme permet d'obtenir certains bénéfices qui ne seraient pas réalisables au travers du modèle concurrentiel traditionnel".
Mohr et Spekman
(1994)
‘’Les partenariats sont définis comme des relations stratégiques délibérées entre des firmes indépendantes qui ont en commun des buts compatibles, essayent d'obtenir des bénéfices mutuels, et partagent un niveau élevé d'interdépendance mutuel’’.
Håkansson et Snehota (1995)
"Une relation est un espace où des interactions prennent place, et où quelque chose est produit ; où des liens d'activités, de ressources et d'acteurs sont établis".
Barnes (1997) "Pour qu'une relation existe, […] il faut un contact continu avec l'entreprise et les interactions doivent impliquer davantage que de simples transactions".
Bendapudi et Berry (1997)
"Une relation existe dès lors qu'un échange individuel est évalué, non pas de manière isolée, mais dans la continuité des échanges passés et censés perdurer dans le futur".
Holmlund et Törnroos (1997)
‘’Une relation est définie comme un processus interdépendant d'interactions et d'échanges continus entre au moins deux acteurs, dans un contexte de réseau commercial".
Holmlund et Törnroos (1997)
"Les relations commerciales constituent l'aspect central qui connecte des acteurs, des ressources et des activités dans un réseau commercial"
Marion (2001) "La relation est considérée comme un processus d'interaction étendue et durable".
Tähtinen (2001a) "Une relation […] est composée de processus d'interaction produisant des liens en termes d'activité, de ressource et d'acteur entre les entreprises".
Johnson et Selnes
(2004)
"Nous définissons une relation d'échange comme un mécanisme permettant la création de valeur au travers de la coordination de la production, de la consommation et des activités économiques reliées entre un client et un fournisseur".
Grégoire et Fisher (2006)
Une relation correspond à "une connexion psychologique entre un consommateur et une firme, une marque ou un employé du fournisseur".
Source : David Vidal 2009 Le tableau.1 présente, les différentes tentatives
de catégorisation des fondements théoriques du marketing relationnel. Ainsi, nous remarquons la diversité des théories et des cadres d’analyse mobilisés et qui renvoient chacun à une réflexion bien spécifique. Malgré l'apparente diversité des définitions présentées dans le tableau 1, un certain consentement sur la définition du marketing relationnel peut être observé autour des dimensions clés: une relation étroite, des liens entre acteurs, des bénéfices mutuels….
III. Liens Relationnels Dans Le Contexte Inter-Organisationnel
En raison de l'importance accrue des relations inter-organisationnelles, les liens relationnels sont un atout intéressant dans le cadre de la collaboration entre les organisations. Cela est dû au fait que les liens sont la base des constructions des relations stables. Ces travaux conduisent toutefois unanimement à démontrer que si les relations entre les entreprises sont fortes, ils peuvent agir comme un signe que les entreprises vont
coopérer durant une longue période et affecter positivement la force concurrentielle et financière des entreprises Storbacka, Strandvik et Grönroos (1994). Bliemel & Eggert (1997) soutiennent que les membres d'un réseau doivent développer des liens relationnels pour s’assurer, entre autres, contre les comportements opportunistes. La relation entre les fournisseurs et les clients dans le contexte inter-organisationnel doit changer parce que la stabilité de la relation entre clients/fournisseurs est une condition préalable à un bon climat des affaires. Les demandes des baisses du prix, les augmentations des bénéfices, les cycles de production plus courts et la concurrence mondiale sont une partie des forces qui affectent les fournisseurs et les clients dans le marché de B to B. Ces paramètres les incitent à développer des relations plus fortes Holmlund et Kock (1995). De fait, les entreprises ont réduit leurs nombre de fournisseurs et ont commencé à plus coopérer avec les fournisseurs restants. La force des liens impacte la force de la relation. Ce qui affecte la cessation de la relation, même si les partenaires ne sont
L’Effet Médiateur De La Satisfaction Sur Les Liens Relationnels Et La Fidélité L’application De LaMéthode De Barron Kenny 1986
© 2018 Global Journals1
20
Year
2018
Globa
l Jo
urna
l of M
anag
emen
t an
d Bu
siness Resea
rch
Volum
e XVIII
Issue
VII
Ver
sion
I(
)E
pas satisfaits de la coopération. Cela peut être vu

comme une perception négative des liens. D'autre part, les liens affectent à la fois la poursuite de la relation et également la force de la relation d'une manière positive et conduisent au renforcement de la relation, qui va générer une rentabilité accrue
Wendelin (2007).
a)
Liens temporels issus du marketing relationnel
Les liens temporels, ils expriment en termes dynamiques les interactions, les investissements, l'engagement, l'échange, la coordination, les processus d'adaptation, l'attraction et la confiance. En d'autres termes, les concepts sont dynamiques dans leur nature et sont définis en termes temporels de passé, présent et futur. Toutes ces caractéristiques de relations varient au fil du temps. La construction de la relation est généralement caractérisée par l'incertitude. La confiance semble être essentiellement un moyen pour gérer les interactions entre les entreprises et faire face à l'incertitude quant à
l'avenir de la relation. Ruohomaa et
Kutvonen, (2005). Suh et al (2006) soulignent que les attentes sont toujours associées à des résultats comportementaux positifs. Cowles (1996) affirme que la confiance se produit lorsque l'une des parties, cherche à mettre quelque chose de précieux pour lui / elle, suppose qu'il peut être compté sur les connaissances, les compétences et les motifs, de l'autre partie ce qui encourage la collaboration. Cette dernière est basée sur la perception de l'échange d'informations et des caractéristiques majeures de l'interaction de partenaire. Ainsi, dés le début de la relation, la confiance et la transparence revêtent une grande signification dans la finalité de surmonter l'incertitude.
Les liens temporels sont appelés également «
de planification, électronique, de logistique, administratif, informationnel ou bien organisationnel ». Entre ces différents liens identifiés, il ya une faible différence. Par exemple Roeckl (1996) affirme que les liens électroniques permettent aux prestataires de services de voir les informations concernant les commandes des clients utilisant l'EDI ‘’échange de données informatisées’‘. Les liens logistiques sont représentés par l’ajustement et l’adaptation de la fonction logistique lors des transferts physiques des produits Easton (1992). Les liens administratifs sont représentés par des systèmes administratifs où les entreprises peuvent créer des interfaces similaires ou bien adapter les interfaces l’une à l’autre ; de telle manière que l'information puisse circuler et les tâches être effectuées entre les entreprises.
b) Liens sociaux issus du marketing relationnel
La relation qui se développe entre client fournisseur représente un intérêt particulier dans le domaine de marketing des services. La vente d’un produit immatériel comme le service se manifeste généralement comme un phénomène tangible Kotler et Armstrong, (1994). Par conséquent, en matière de
marketing de services, l'interaction personnelle devient elle-même un critère important que les clients utilisent pour déterminer leur degré de satisfaction par rapport à l'offre, et savoir s’ils vont continuer à faire des affaires avec ce prestataire Solomon et al, (1985). Les liens sociaux sont des liens personnels qui mettent l'accent sur les dimensions de service pour développer des relations clients fournisseurs au moyen des interactions interpersonnelles Berry, (1995); Wilson, (1995), de l'identification Smith, (1998); Turner, (1970), de l’empathie, de l’affiliation, de l’attachement à l’organisation, de l’expérience partagée au travers des conseils fournis Sharp et Sharp, (1997). Ils font référence à l’attachement psychosocial unissant l’entreprise à son client Han, (1991). Ils sont représentés par la familiarité, la confiance qui se construisent à travers l'échange interpersonnel qui renforce la relation personnelle et peut amener à un lien personnel de proximité. Les liens sociaux se maintiennent avec des clients et fournisseurs en étroite collaboration Han, (1993), et représentent le degré mutuel d'amitié et le goût du partage dans la relation client et fournisseur Wilson, (1995).
c) Liens structurels issus du marketing relationnel Les liens structurels sont la multiplicité des
facteurs économiques, stratégiques et techniques qui se développent au cours d’une relation impliquant des avantages économiques explicites grâce à la technologie et aux marchés. Ces liens sont les investissements irréversibles, qui représentent les barrières contractuelles pour maintenir la relation. Elle est liée essentiellement à l’échange économique et définie par les transactions négociées Emerson (1981). Les liens structurels contiennent des liens économiques et fonctionnels de l’échange. Les liens personnels englobent des ressources de nature émotionnelle ou affective Emerson 1972; Turner (1970). Le contenu de ces liens est de deux types : structurel et social. Williams et al. (1993) ont souligné que, lorsque les partenaires n’ont pas de confiance, les uns envers les autres, il n’y a pas de mobilisation de ressource dans cette relation. Pour construire une relation basée sur la confiance, les liens cognitifs et émotionnels doivent être soutenus et développés Lewis et Wiegert (1985).
Satisfaction
La satisfaction du client a été longuement débattue comme un concept central du marketing au cours de ces dernières années Anderson Narus al (1998). Dans une étude menée par Garbarino E, Johnson 1999 sur la tendance de conceptualisation des mesures de la satisfaction, les chercheurs adoptent une vision cumulative de satisfaction. A ce titre, ils se basant sur le niveau général de satisfaction, ainsi que sur toutes les expériences passées avec l’entreprise. Oliver (1999) propose trois dimensions de satisfaction:
L’Effet Médiateur De La Satisfaction Sur Les Liens Relationnels Et La Fidélité L’application De LaMéthode De Barron Kenny 1986
© 2018 Global Journals
21
Year
2018
Globa
l Jo
urna
l of M
anag
emen
t an
d Bu
siness Resea
rch
Volum
e XVIII
Issue
VII
Ver
sion
I(
)E
IV.

cognitive, affective et conative. Il conclue que la fidélité est une action répétitive de l’utilisation de même produit ou service. Plusieurs recherches empiriques témoignent du lien entre la satisfaction et la fidélité des clients. Les premiers travaux de Dwyer (1980) ont souligné que la satisfaction est essentielle dans la compréhension des chaines de relations et à leur viabilité. La satisfaction est le résultat d'évaluation des interactions de la relation. De ce fait, il est susceptible d'être un indicateur de renouvellement de la relation Sheth et Parvatiyar, (1995). La satisfaction, selon Parsons (2002), se réfère au degré de performance de la réponse aux attentes des clients. Des études antérieures sur la fidélisation des clients ont exploré la satisfaction en tant que facteur déterminant dans les décisions des clients de conserver ou de déposer un produit ou un service dans une relation donnée Lemon et al, (2002). En marketing, la satisfaction contribue à travers l’intention comportementale et de rachat à la fidélité des clients Bitner, (1992); Oliver, (1999); Selnes, (1993); Dick and Basu (1994) suggèrent que la satisfaction est un antécédent affectif de la fidélité. Par ailleurs, les chercheurs considèrent souvent la satisfaction comme un élément affectant la probabilité de rachat ou la réutilisation du service par un même prestataire
V. La Fidélité
La fidélité est perçue comme un construit a deux dimensions comportementale et attitudinale Lam et Burton, (2006); Est et al, (2000); Dick et Basu, (1994). Le degré de fidélité est souvent mesuré par le comportement tel que la fréquence d’achat ou le bouche à oreille Lam et Burton, (2006). Dekimpe, et al, (1997). L’objet principal de la relation client est « d'obtenir et garder les clients Grönroos, (1995). Peng et Wang (2006) définisse le marketing relationnel comme toutes activités marketing orientées vers la fidélité des clients créant une valeur pour toutes les parties impliquées dans l’échange relationnel ". Des études antérieures confirment que les entreprises de service reçoivent plus d’avantages auprès des clients fidèles Bagherzad, Chavosh et Hosseinikhah, (2011). Le porte feuille clients fidèles, dans le contexte de B to B n’est pas uniquement le fait de maintenir un nombre de client au fil du temps, mais surtout d’entretenir des relations à long terme avec les clients pour encourager leur futur achat. Les fournisseurs ont compris l’importance de la fidélité et que le maintien de bonnes relations contribue à une rentabilité supérieure. Plusieurs recherches dans ce cadre ont montré l’importance de la fidélité dans la performance de l’entreprise. Les travaux de Rust et al., (2000); Lam et al., (2004;) supposent que les clients fidèles offrent un flux régulier de revenu pour une entreprise, en restant avec la même marque et en rejetant l’ouverture aux autre concurrent.
a) Cadre méthodologique Au niveau de ce travail de recherche, nous
avons eu recours aux différentes échelles présentées dans des travaux antérieurs. Ces échelles possèdent de bonnes qualités psychométriques et sa fiabilité a été justifiée. Se sont des échelles unidimensionnelle qui se compose de 16 items représentés come suit 4 items pour les liens temporels, En nous basant sur les travaux de Kumar et al (1995) Gundlach et al. (1995). 4 items pour les Liens sociaux ; 4 items pour les liens structurels ; 3 pour la satisfaction en enfin deux items pour la fidélité Toutes les variables de notre modèle sont des variables métriques. Pour les mesurer, nous utilisons dans notre questionnaire des échelles ordinales de Likert à 5 point. Nous avons cherché à minimiser le nombre d'échelons pour éviter de nous rapprocher des propriétés des échelles d'intervalles. En effet, plus le nombre d'échelons augmente, plus la variance des réponses est importante et par conséquent, l'échelle peut se rapprocher des échelles d'intervalles. Le choix de cinq points est motivé aussi par la recherche d'un équilibre entre le besoin en information pertinente et approfondie et le risque de lassitude du répondant. Nous détaillons à présent le contenu de notre questionnaire. Ce contenu est le résultat de la revue de littérature et des travaux empiriques antérieurs ainsi que les résultats de l’étude qualitative exploratoire effectuée. Tous les items générés durant cette phase seront testés sur notre échantillon pour s'assurer de la fiabilité et de la validité des instruments de mesure. La génération des items (indicateurs de mesure des concepts) est la deuxième étape du paradigme de Churchill. Cette étape contribue à l'élaboration de l'échelle de mesure. Le principe sert à générer les différentes dimensions du concept et les différents indicateurs permettant sa mesure.
i. Test des effets médiateurs Baron et Kenny (1986) et Kenny et al., (1998)
présente une série de quatre tests successifs et nécessaires pour tester l’effet médiateur d’une variable XM dans le processus d’impact de la variable indépendante XP sur la variable dépendante Y (Figure):
b) L’effet médiateur XM
Figure 1: Effet mediateur de Baron et Kenny 1986
Étape 1: Montrer que le lien entre la variable indépendante XP sur la variable dépendante Y est significatif afin de s’assurer de l’existence d’un impact à
L’Effet Médiateur De La Satisfaction Sur Les Liens Relationnels Et La Fidélité L’application De LaMéthode De Barron Kenny 1986
© 2018 Global Journals1
22
Year
2018
Globa
l Jo
urna
l of M
anag
emen
t an
d Bu
siness Resea
rch
Volum
e XVIII
Issue
VII
Ver
sion
I(
)E

médiatiser. Dans la régression de Y sur XP, le coefficient (c) doit être donc significatif (Test de Student ³ 1,96 ; p = 0,05).*. En contrôlant XP, le coefficient (b) entre XM et Y doit rester significatif.
Étape 4: Pour établir l’existence d’une médiation complète par XM, le coefficient (c’) liant XP et Y devenir nul, en contrôlant XM. Il s’agit de vérifier que c’=0 en
L’application des quatre étapes du modèle de Baron et Kenny (1986), une série de régressions est réalisée sous PLS.
i.
Effet médiateur de la satisfaction entre la relation Lien temporel- - fidélité
Étape 1: Tester la relation entre d’une part de la variable
indépendante lien temporel et d’autre part la variable
Figure
2: Test d'hypothèse entre lien temporel et fidélité
Les résultats de cette première analyse montrent que les liens temporels influencent positivement la fidélité (Coefficient non standardisé Lamda 0,554 ; T de Student= 7,549). Cette relation est significative. La valeur de R2 associé à la variable endogène affiche un niveau suffisant R2 =30,7.
Étape 2:
Tester la relation entre d’une part la variable lien temporel, et la variable médiatrice la satisfaction. Les résultats de cette deuxième analyse montrent que la satisfaction est positivement et significativement influencée par les liens temporels. (lamda =0,448 ; T de
précédentes peuvent être mobilisés pour répondre aux exigences de cette étape.
Étape 3:
Tester la relation entre le lien temporel et la fidélité, en ajoutant la variable médiatrice la satisfaction. Egalement durant cette étape nous pouvons mobiliser les résultats des analyses précédentes du modèle structurel. Les résultats du modèle structurel montrent que la variable indépendante lien temporel influence positivement la variable médiatrice la satisfaction (lamda =0,448 ; T de Student=5,284). La satisfaction influence positivement à son tour la fidélité (lamda=0,234 ; T de
Figure 3: Effet global du lien temporel sur la fidélité
La figure montre que le lien entre lien temporel et la fidélité n’est plus significatif après l’introduction de la variable médiatrice alors qu’il l’était lors de la première étape de la démarche de Kenny et Baron (lamda= 0,554 ; T de Student= 7,549).). La médiation par la satisfaction est donc parfaite entre Le lien temporel et la fidélité avec c’=0).
ii. Lien social- Satisfaction – fidélité
Etape 1: Tester la relation entre le lien social et la fidélité. Les résultats de l’analyse montrent que les liens
sociaux influencent positivement la fidélité (lamda= 0,587; T de Student= 7,816). Cette relation est significative. La valeur de R2 associé à la variable endogène affiche un niveau suffisant R2 =34.5
L’Effet Médiateur De La Satisfaction Sur Les Liens Relationnels Et La Fidélité L’application De LaMéthode De Barron Kenny 1986
© 2018 Global Journals
23
Year
2018
Globa
l Jo
urna
l of M
anag
emen
t an
d Bu
siness Resea
rch
Volum
e XVIII
Issue
VII
Ver
sion
I(
)E
Étape 4: La dernière étape de la démarche de Baron et Kenny
Student= 5,284) Les résultats des analyses Studen= 5,611).
présence de XM, sinon la médiation est partielle. dépendante la fidélité.

Etape 2: Tester la relation entre la variable lien social, et la variable médiatrice satisfaction. Les résultats de cette deuxième analyse montrent que la satisfaction est positivement et significativement influencée par les liens sociaux. (Lamda est de 0,109 ; T de Student= 1.986).
Etape 3: Tester la relation entre le lien social et la fidélité, en ajoutant la variable médiatrice la satisfaction. Les résultats de cette troisième analyse sont significatifs en se basant sur les résultats du modèle structurel. Les résultats montrent que la variable indépendante lien
social influence positivement la variable médiatrice la satisfaction (Lamda est de 0,109 ; T de Student= 1.986). La satisfaction influence positivement à son tour la fidélité (lamda=0,234 ; T de Student=5,611). Etape 4) nous vérifions dans cette étape la nature de la médiation en examinant la significativité des liens directs Entre le lien social et la fidélité. Il faut aussi s’assurer de la significativité de l’effet médiateur en utilisant le test de Sobel.
Figure 5:
Effet global du lien social sur la fidélité
La figure montre que le lien entre lien
social et la fidélité est diminué après l’introduction de la variable médiatrice .La médiation par la satisfaction est donc partielle entre Le lien social et la fidélité car c’≠ 0.
C= 0,587
C’=0,362 C – C’ = a * b > 0 Médiation partielle: c’≠ 0 et c > c’ (Si la médiation est partielle (MacKinnon et al. 1995), l’effet (c’)
doit être inférieur à l’effet initial (c) obtenu en l’absence de la variable médiatrice:
iii.
Lien structurel- Satisfaction- Fidélité 1)
Tester la relation entre d’une part de la variable indépendante lien temporel et d’autre part la variable dépendante la fidélité.
Figure 6:
Test d’hypothèse entre lien structurel et fidélité
Les résultats de cette première analyse montrent que les liens structurels influencent positivement la fidélité (lamda= 0,582 T de Student= 7,801). Cette relation est significative. La valeur de R2 associé à la variable endogène affiche un niveau suffisant R2 =33,9.
2)
Tester la relation entre lien structurel, et satisfaction. Les résultats de cette deuxième analyse montrent
que la satisfaction est positivement et significativement influencée par les liens structurels. (lamda= 0,106 ; T de Student= 2,283) nous avons mobilisé les résultats du modèle structurel.
3)
Tester la relation entre le lien structurel et la fidélité, en ajoutant la variable médiatrice la satisfaction. Les résultats de cette troisième analyse sont à la base des résultats du modèle structurel.
L’Effet Médiateur De La Satisfaction Sur Les Liens Relationnels Et La Fidélité L’application De La
© 2018 Global Journals1
24
Year
2018
Globa
l Jo
urna
l of M
anag
emen
t an
d Bu
siness Resea
rch
Volum
e XVIII
Issue
VII
Ver
sion
I(
)E
Figure 4: Test d’hypothèse entre lien social et fidélité
Méthode De Barron Kenny 1986

Figure 7: Effet global du lien structurel sur la fidélité
Les résultats montrent que la variable lien structurel influence positivement la satisfaction (lamda =0,106; T de Student=2,283) Et la satisfaction influence positivement à son tour la fidélité (lamda=0,234 ; T de Student= 5,611). 4) La dernière étape de la démarche de Baron et
Kenny permet de vérifier la nature partielle ou complète de la médiation
en examinant la significativité des liens directs entre la variable indépendante lien structurel et celle dépendante la fidélité. Il faut aussi s’assurer de la significativité de l’effet médiateur en utilisant le test de Sobel.
La figure montre que le lien entre lien structurel et la fidélité est diminué après l’introduction de la variable médiatrice. La médiation par la satisfaction est donc partielle entre le lien structurel et la fidélité.
C= 0,582 C’= 0,384
C – C’ = a * b =0,194.> 0 Médiation partielle: c’≠ 0 et c > c’ (Si la médiation est partielle (MacKinnon et al. 1995), l’effet (c’) doit être inférieur à l’effet initial (c) obtenu en l’absence de la variable médiatrice:
Le test de Sobel a été calculé pour tester la significativité de l’effet médiateur de la satisfaction. En utilisant les coefficients de régression et les termes d’erreurs, les résultats du test indiquent que l’effet médiateur de la satisfaction est statistiquement significatif pour la relation entre les lien structurels et la fidélité (Z= 3.895> 1,96 ; p= 0.000).
VI. Conclusion
Notre modèle propose d’étudier l’impact de ces trois liens, sur la construction de la satisfaction des clients. Notre premier apport de ce travail est l’intégration des liens relationnels dans le modèle traditionnel du marketing. Les résultats de test des hypothèses liées aux relations entre les liens relationnels (temporels, sociaux et structurels) et la satisfaction du client. En effet le lien relationnel peut être décris comme un processus itératif, qui peut être subir un changement continuellement et successivement à chaque expérience. En outre, à travers chaque interaction successive, le client dispose des atouts pour évaluer le service. Et par conséquent, Le résultat peut subir une
altération dans le niveau de satisfaction. En outre, ces liens peuvent avoir un effet positif ou négatif, en fonction de la situation (Liljander, 2000). Dans le contexte de notre recherche nous avons présumé l’effet positif des liens relationnels, l’objectif étant d’encourager les clients à poursuivre leurs relations d’échanges. Même dans la présence de possibilité de changement de prestataire. Les trois hypothèses ont considéré les liens « temporels, sociaux, structurels » comme la base de compréhension de la satisfaction des clients Garbarino et Johnson, (1999) ; Wang et al, (2006). Les résultats empiriques, montrent l’impact positif des liens relationnels sur la satisfaction, fournissant un soutien pour les trois hypothèses H1, H2 et H3. Tout d'abord, il semble que les clients ont tendance à compter sur les liens temporels, telles que le partage des informations confidentielle, en fonction de leurs besoins concernant des informations relatives au marché, à l'état de la concurrence, ainsi que par avoir alloué plus de moyens dans l’avenir. Tous ces éléments augmentent positivement le niveau de satisfaction du client. De cette étude, il est clair que les entreprises marocaines à tisser des liens structurels via des interactions avec leurs clients. Ces interactions engendrent des liens psychologiques, juridiques et physiques qui attachent le client à son fournisseur dans une relation (Lin et al., 2003). Les entreprises marocaines considèrent les liens sociaux comme un facteur important pour établir des relations avec leurs prestataires de services; ces liens renforcent également leur niveau de satisfaction.
Bibliographie
1. Anderson, E., Weitz, B., 1992. The use of pledges to build and sus-tain commitment in distribution channels. J. Marketing Res. 29(February), 18-34.
2. Bagherzad, A.,Chavosh, A and Hosseinikhah, S. (2011), “The influence of relationship marketing tactics on customer’s loyalty in B2C relationship–the role of communication and personalization”, European Journal of Economics, Finance and Administrative Sciences, Vol. 5(31), pp. 49-56.
3. Baron, Reuben M. and David A. Kenny (1986), “Moderator-Mediator Variables Distinction in Social Psychological Research: Conceptual, Strategic, and
L’Effet Médiateur De La Satisfaction Sur Les Liens Relationnels Et La Fidélité L’application De LaMéthode De Barron Kenny 1986
© 2018 Global Journals
25
Year
2018
Globa
l Jo
urna
l of M
anag
emen
t an
d Bu
siness Resea
rch
Volum
e XVIII
Issue
VII
Ver
sion
I(
)E

Statistical Considerations,” Journal of Personality and Social Psychology, 51 (6), 1173-82.
4. Berry L. (1995),” Relationship marketing of services -Growing interest, emerging perspectives”, The Journal of the Academy of Marketing Science, 23, 4, 236-245.
5. Bitner MJ. (1992); Service scapes: the impact of physical surroundings on customers and employees. J Mark (April) 56:57– 71.
6. Bliemel, F., Eggert, A. (1997):“Structural Bonding In Customer-Supplier Relattionship:- The Case of Prosumer Versus Consumer, In Mazet, F., Salle, R., Valla, J-P. (eds.) Interaction, relationships and networks. Conference proceedings from the 13th IMP Annual Conference, Lyon, September 1997. 49-68.
7. Caceres, R, C., Paparoidamis, N, G. (2007) Service quality, relationship satisfaction, trust, commitment and business-to-business loyalty, European Journal of Marketing, Vol. 41, No. 7/8, Pp. 836-867
8. David Vidal (2009) Contribution to the analysis of the determinants of customer reactions in the context the deterioration of exchanges Relationship PhD Thesis in Management Sciences.
9. Dekimpe, and al (1997), Decline and Variability in Brand Loyalty, International Journal of Research in Marketing, 14 (No. 5), 405-20.
10. Dick and Basu (1994) Customer loyalty: towards an integrated framework. Journal of the Academy of Marketing Science 22 (2), 99-113.
11. Dick AS, Basu K. Customer 1994 loyalty: toward an integrated conceptual framework. J Acad Mark Sci; 22(2):99–113.
12. East, R., Sinclair, J. and Gendall, P., 2000. Loyalty: testing the Dick and Basu model. Proceedings of ANZMAC Conference, Griffith University, Gold Coast, November, CD-ROM.
13. Easton, G. (1992): Industrial Networks: A Review in Axelsson, B., and Easton, G. (eds.), Industrial Networks A New View of Reality, London and New York, Routledge.
14. Eggert, A; Helm, S. (2003). Exploring the Impact of Relationship Transparency on Business. Relationships: A Cross-Sectional Study Among Purchasing Managers in Germany. Industrial Marketing Management, Vol. 32, No. 2, pp. 101-108.
15. Emerson, R. M.. 1972. "Exchange Theory, Part II: Exchange Relations and Networks." Pp. 58-87 in Sociological Theories in Progress, edited by J. Berger, M. Zelditch, and B. Anderson. Vol. 2. Boston: Houghton Mifflin.
16. Emerson, Richard M. 1981. Social exchange theory. In Social psychology: Sociological perspectives. Edited by Morris Rosenberg and Ralph H. Turner, 30–65. New York: Basic Books.
17. Garbarino, Ellen; Johnson, Mark S. (1999), “The Different Roles of Satisfaction, Trust, and
Commitment in Customer Relationships”, Journal of Marketing, 63 (2), 70-87.
18. Gil-Saura, I., Berenguer-Contrí, G.and al (2009) Relational benefits and loyalty in retailing: an inter-sector comparison, International Journal of Retail & Distribution Management, Vol. 37, No. 6, Pp. 493-509.
19. Grönroos, Christian (1994) “From Marketing Mix to Relationship Marketing: Towards a Paradigm Shift in Marketing”, Management Decision, Vol. 32, No. 2, 4-20.
20. Gundlach, G.T., Achrol, R.A. and Mentzer, J.T. (1995), “The structure of commitment in exchange”, Journal of Marketing, Vol. 59 No. 1, pp. 78- 92.
21. Han, S-L., Wilson, D. T., Dant, S. P. (1993): Buyer-Supplier Relationships Today, Industrial Marketing Management, 22, 331-338.
22. Holmlund, M., and
Kock, S. (1995), 'Buyer Perceived
Service Quality in Industrial Networks', Industrial Marketing Management, 24, pp 109-121.
23. Homburg, C. and Rudolph, B. (2001), ``Customer satisfaction in industrial markets: dimensional and multiple role issues’’, Journal of Business Research, Vol. 52, pp. 15-33.
24. Kotler,P.,1973. A., Zeithaml V. A. et Berry L. L., (1988) , « SERVQUAL : A multiple-item scale for measuring customer perceptions
of service quality
», Journal of Retailing, printemps 12-40.
25. Kumar, N., L.K. Scheer and J.B. Steenkamp (1995), The effects of supplier fairness on vulnerable resellers, Journal of Marketing Research, 32 (February), 54-65.
26.
Lam, Shun Yin, Venkatesh Shankar, M
Krishna Erramilli, and Bvsan Murthy (2004), "Customer Value, Satisfaction, Loyalty, and Switching Costs: An Illustration From a Business-to-Business Service Context," Journal of Academy of Marketing Science., 32 (3), 293.
27.
Lemon, and al. (2002) “Dynamic Customer Relationship Management: Incorporating Future Considerations Into the Service Retention Decision.
in
Journal of Marketing 66 · January 2002.
28.
Lemon,
and al 2002 “ Customer Equity Management Charting New Directions for the Future of Marketing “ Journal of Service Research”.
29.
Lewis et Wiegert (1985) Trust as a Social Reality. Social Forces, 63, 967-985 Scientific Research Publishing.
30.
Liljander, V. (2000): The Importance of Internal Relationship Marketing for External Relationship Success, in this book.
31.
Lin, N.P., J.C.M. Weng, and Y.C. Hsieh,
2003
"Relational Bonds and Customer's Trust and Commitment – A Study on the Moderating Effects of Web Site Usage," Service Industries Journal,.
L’Effet Médiateur De La Satisfaction Sur Les Liens Relationnels Et La Fidélité L’application De LaMéthode De Barron Kenny 1986
© 2018 Global Journals1
26
Year
2018
Globa
l Jo
urna
l of M
anag
emen
t an
d Bu
siness Resea
rch
Volum
e XVIII
Issue
VII
Ver
sion
I(
)E

32. Moorman, and al (1993). Factors Affecting Trust in Market Research Relationships. Journal of Marketing, 57 (January), 81–101.
33. Moorman, C., Zaltman, G., & Deshpande, R. (1992). Relationship between Providers and Users of Market Research: The Dynamics of Trust within and between Organizations. Journal of Marketing Research, 29 (August), 314–328.
34. Morgan et Hunt (1994), “The commitment-trust theory of relationship marketing”. Journal of Marketing. 58 (July), 1994.
35. Oliver, (1999): whence consumer loyalty? Journal of Marketing; 1999; 63.
36. Parvatiyar 1995 “Relationship marketing in consumer markets: Antecedents and consequen- ces” Journal of the Academy of Marketing Science, Volume 23, Issue 4, pp 255–271
37. Peng, L.Y. and Q. Wang, 2006. Impact of relationship marketing tactics (RMTs) on switchers and Stayers in a competitive service industry. J. Marketing Manag., 22: 25-59.
38. R. Solomon, and al “A Role Theory Perspective on Dyadic Interactions: The Service Encounter“ Journal of Marketing Vol. 49, No. 1 (Winter, 1985), pp. 99-111.
39. Regan Lam, Suzan Burton, (2006) "SME banking loyalty (and disloyalty): a qualitative study in Hong Kong", International Journal of Bank Marketing, Vol. 24 Issue: 1, pp. 37-52.
40. Reichheld F (1996)., « L’effet loyauté : réussir en fidélisant ses clients, ses salariés et ses actionnaires », Dunod, Paris.
41. Roeckl, C. (1996): Electronic bonding to play role in local competition, Communications Week, Manhasset, December 9th, 9-10.
42. Ruohomaa and Kutvonen 2005. “Trust management survey. In Proceedings of the iTrust 3rd International” Conference on Trust Management, 23-26, May, 2005, Rocquencourt, France, pages 77-92. Springer-Verlag, LNCS 3477/2005.
43. Selnes, (1993) "An Examination of the Effect of Product Performance on Brand Reputation, Satisfaction and Loyalty", European Journal of Marketing, Vol. 27 Issue: 9, pp.19-35.
44. Sharp, B. and A. Sharp, 1997. Loyalty Programs and Their Impact on Repeat-Purchase Loyalty Patterns. International Journal of Research in Marketing 14 (No. 5), 473-486.
45. Smith, B. (1998): Buyer-Seller Relationships: Bonds, Relationships Management, and Sex-Type, Revue Canadienne des Sciences de L’Administration, March, Montreal.
46. Sobel, M. E. (1982). Asymptotic confidence intervals for indirect effects in structural equation models. In S. Leinhardt (Ed.), Sociological Methodology 1982 (pp.290-312). Washington DC: American Sociological Association.
47. Storbacka, Strandvik, Grönroos, (1994) "Managing Customer Relationships for Profit: The Dynamics of Relationship Quality", International Journal of Service Industry Management , Vol. 5 Issue: 5, pp. 21-38.
48. Turner, R. H. (1970), “Family interaction”, New York, NY: John Wiley.
49. Wang, W.-H., C.-J. Liang, and Y.-D. Wu 2006, "Relationship Bonding Tactics, Relationship Quality and Customer Behavioral Loyalty – Behavioral Sequence in Taiwan's Information Services Industry," Journal of Services Research, Vol. 6, No.1.
50. Wendelin, R. (2007): A Framework for Understanding the Nature and Change of Bonds in Business Relationships – Cases from The Truck Producing Industry in Andrea L. Dixon & Karen A. Machleit (eds.), Proceedings of the AMA (American Marketing Association) Winter Educators’ Conference-Marketing Theory and Applications Volume 18, CD-ROM, ISBN 0-87757-324-7.
51. Wilson, David T. (1995), “An Integrated Model of Buyer-Seller Relationships,” Journal of the Academy of Marketing Science, 23(4), 335-345.
L’Effet Médiateur De La Satisfaction Sur Les Liens Relationnels Et La Fidélité L’application De LaMéthode De Barron Kenny 1986
© 2018 Global Journals
27
Year
2018
Globa
l Jo
urna
l of M
anag
emen
t an
d Bu
siness Resea
rch
Volum
e XVIII
Issue
VII
Ver
sion
I(
)E

This page is intentionally left blank
L’Effet Médiateur De La Satisfaction Sur Les Liens Relationnels Et La Fidélité L’application De LaMéthode De Barron Kenny 1986
© 2018 Global Journals1
28
Year
2018
Globa
l Jo
urna
l of M
anag
emen
t an
d Bu
siness Resea
rch
Volum
e XVIII
Issue
VII
Ver
sion
I(
)E

© 2018. Mr. Daniel Atnafu. This is a research/review paper, distributed under the terms of the Creative Commons Attribution-Noncommercial 3.0 Unported License http://creativecommons.org/licenses/by-nc/3.0/), permitting all non-commercial use, distribution, and reproduction in any medium, provided the original work is properly cited.
Challenges of Supply Chain Integration: The Case of Soap and Detergent Manufacturing Companies in Ethiopia
By Mr. Daniel Atnafu Arsi University
Abstract- The main objective of this study was to investigate the challenges of supply chain integration in Ethiopia soap and detergent manufacturing companies. To address the research objective, the quantitative survey approach was followed, and target unit of analysis of the study was 25 soap and detergent manufacturing companies. The questionnaire was administered to 75 target respondents to collect the primary data (each company represented by three informants). To analyze the data obtained from respondents’ simple descriptive statistics were applied. Finally, the study found that inflexible organization system, lack of channel trust and commitment, resistance to change and lack of top management commitment were found as supply chain integration challenges in soap and detergent manufacturing firms. In general, the conclusion obtained from this study may not be used to generalize to overall supply chain network performance since its focus is only from the manufacturer’s points of view.
Keywords: supply chain integration, internal and external integration, challenges.
GJMBR-E Classification: JEL Code: L61
ChallengesofSupplyChainIntegrationTheCaseofSoapandDetergentManufacturingCompaniesinEthiopia
Strictly as per the compliance and regulations of:
Global Journal of Management and Business Research: E Marketing Volume 18 Issue 7 Version 1.0 Year 2018 Type: Double Blind Peer Reviewed International Research JournalPublisher: Global JournalsOnline ISSN: 2249-4588 & Print ISSN: 0975-5853

Challenges of Supply Chain Integration: The Case of Soap and Detergent Manufacturing
Companies in Ethiopia Mr. Daniel Atnafu
Abstract-
The main objective of this study was to investigate the challenges of supply chain integration in Ethiopia soap and detergent manufacturing companies. To address the research objective, the quantitative survey approach was followed, and target unit of analysis of the study was 25 soap and detergent manufacturing companies. The questionnaire was administered to 75 target respondents to collect the primary data (each company represented by three informants). To analyze the data obtained from respondents’ simple descriptive statistics were applied. Finally, the study found that inflexible organization system, lack of channel trust and commitment, resistance to change and lack of top management commitment were found as supply chain integration challenges in soap and detergent manufacturing firms. In general, the conclusion obtained from this study may not be used to generalize to overall supply chain network performance since its focus is only from the manufacturer’s points of view.
Keywords:
supply chain integration, internal and external integration, challenges.
I.
Introduction
he current business environment is often described as intensely competitive, increasingly dynamic and globalized in. To remain competitive
in such a challenging environment, organizations should not only continue to leverage their internal sources of competitive advantage but also should strive to tap into the synergies across the multiple supply chains that they are part of(Natour, et al, 2011). Many authors agree that integrative practices and a high level of integration have a positive impact on corporate and supply chain performance. Recent empirical work (Frohlich and Westbrook, 2001; Vickery et al., 2003; Childer house and Towill, 2003) shows convincing empirical evidence for the relationship between integration and performance.
On the other hand; Van Donk
& Van der Vaart (2005) disagrees with the assumption that more integration is always better. Based on both theoretical perspective and empirical evidence they show that it is significant to understand the influence of business conditions on the level of integration and integrative activities implemented. The main factor is the influence of demand characteristics or uncertainty on the type of practices employed: an issue also addressed by Fisher
(1997), Mason-Jones and Towill (1998) and Childer house and Towill (2002). This argument indicates the need for more research to empirically test how supply chain integration affects business performance in a different business scenario. For that reason, the researcher of this study interested to examine the effect from the context of developing countries which is surrounded by different market challenges specifically on Soap and detergent manufacturing firms found in Ethiopian.
As to the knowledge of the researcher in Ethiopia, there are few papers that are conducted on supply chain management which only assess the practice in different sub-sectors. For instance, a study made by Berhane (2007) to model supply chain management system in Ethiopian manufacturing industry indicate different problems such as Poor strategic alliance, longer lead times (procurement, conversion, distribution) which results in unnecessary inventory and more value is not given to increase customer service level and product expectation, which result in loss of customers that have large economic impact on the organization. The same author concludes that one of the problems which contributed a lot towards the above limitations and backwardness of the sector could be the lack of conceptual framework and basic knowledge of supply chain management amongst the business practitioners. A study conducted by Asfaw (2012)also concludes that modern supply chain management theories and practices are not well understood and practiced as a means of improving organizational performance. Therefore, the study aimed to investigate challenges of supply chain integration in soap and detergent manufacturing firms’ in Ethiopia. Based on the gap identified and discussions made on empirical and theoretical evidence, the following basic research questions were formulated.
• To what extent Ethiopian Soap and detergent manufacturing firms integrate with their supply chain partners (supplier & customer).
• What are the challenges that affect the supply chain integration of Ethiopian Soap and Detergent Manufacturing firms.
T
© 2018 Global Journals
29
Year
2018
Globa
l Jo
urna
l of M
anag
emen
t an
d Bu
siness Resea
rch
Volum
e XVIII
Issue
VII
Ver
sion
I(
)E
Author: Department of Logistics and Supply Chain Management, Arsi University, Ethiopia. e-mail: [email protected]

II. Literature Review
a) The Concept of Supply Chain Integration In a supply chain context, integration is defined
as a process of interaction and collaboration in which companies in a particular supply chain work together to arrive at mutually acceptable outcomes (Pagell, 2004). Most supply chain literature considers supply chain integration as the collaborative effort in linking functions and supply chain networks in terms of process, information and physical flow (Sabath, 1995; Lambert et al. 1998; Frohlich and Westbrook, 2001; Mentzer et al. 2001; Fawcett and Magnan, 2002; Romano, 2003; Pagell, 2004; Zailani and Rajagopal, 2005). Mentzer et al. (2008) concluded that coordination and collaboration with suppliers and customers is the key element of supply chain integration. Therefore, coordination, collaboration, interaction, information flow linkage and business process linkage become the key components of supply chain integration for this research. The supply chain literature seems to have arrived at an agreement that supply chain integration is required internally within and across functions, as well as externally across suppliers and customers (Steven, 1989; Morash and Clinton, 1998; Frohlich and Westbrook, 2001).
i. Internal integration
Internal integration is defined as a process of inter-departmental interaction and collaboration that brings departments together into a cohesive organization (Kahn and Mentzer, 1996). Moreover, to achieve greater customer satisfaction, II is characterized by full system visibility within an organization from the point of purchasing through to distribution. In practice, special attention must be given to the interactions between functional areas such as procurement, production, logistics, marketing, sales and distribution (Steven, 1989; Morash and Clinton, 1998; Birou et al., 1998). An organization is considered to have a high level of integration when the information systems used by different functions are linked together with all functions able to access accurate and real-time information from other functions, and there are also effective means of communication across functions (Sabath, 1995; Frohlich and Westbrook, S. Boon-itt 2001). Furthermore, there should be seamless links between functions regarding business processes as well as strong relationships which support interaction and collaboration across the functions (Steven, 1989; Morash and Clinton, 1998).
ii.
Supplier integration
Supplier integration refers to the process of interaction and collaboration between an organization and its suppliers to ensure an effective flow of supplies. It is also called ‘backward’ integration (Froehlich and Westbrook, 2001). An organization is considered to have a high level of SI when its information systems are linked with those of the suppliers, both parties can access
accurate and real-time information, and there are effective means of communication between the two parties (Liker et al., 1996; Ragatz et al., 2002; Koufteros et al., 2005). Furthermore, there should be seamless links between them regarding business processes as well as the strong supplier-customer relationships which support interaction and collaboration (Handfield, 1993; Gilbert and Ballou, 1999). Integration with suppliers represents a change from an adversarial to a cooperative attitude, commencing with product development, the supply of high-quality products, the processing and incorporation of changes in specifications, technology exchange and design support.
iii. Customer integration Customer integration refers to the process of
interaction and collaboration between an organization and its customers to ensure an effective flow of supplies. To achieve a high level of CI, a company needs to penetrate deep into the customer organization to understand its products, culture, market and organization, so that it can respond rapidly to the customer’s needs and requirements. Another important goal of CI is the improvement of demand planning and visibility in supply chains (Fisher et al., 1994); without information sharing from one end of the supply chain to the other, tremendous inefficiencies in customer service may occur (Lee et al., 1997).
b) Challenges and Obstacles of Supply Chain Integration
To achieve efficient supply chain integration for the processes or activities; organizations should recognize and understand all the integration challenges of supply chain. Awad & Nassar (2010b) explained that neither it was easy to integrate the supply chain strategies among organizations and nor it was easy to integrate the supply chain strategy of an organization with its corporate strategy. The following are major challenges that associate with supply chain integration explained by different authors;
Change and Culture: Karkkainen & Ala-risku (2003) argued that every organization had an organizational culture that defined its values, mission, structure, and strategy. Organizational culture was unique for every organization. The most difficult challenge that confronts the corporations is the culture and change because culture defines the relationships within an organization such as relationships among suppliers, customers, employees and other stakeholders. Therefore, an organization might need a cultural change to integrate its supply chain strategy with another organization. Cultural change is not an easy task at it changes everything such as values, mission, structure, strategy and relationships and it the biggest challenge faced by organizations while integrating their supply chains (Cited in Awad & Nassar, 2010b).
Challenges of Supply Chain Integration: The Case of Soap and Detergent Manufacturing Companies in Ethiopia
© 2018 Global Journals1
30
Year
2018
Globa
l Jo
urna
l of M
anag
emen
t an
d Bu
siness Resea
rch
Volum
e XVIII
Issue
VII
Ver
sion
I(
)E

Globalization: Awad & Nassar (2010b) argued that world markets were moving towards globalization and commoditization. Therefore, different challenges were raised by these factors as it became difficult for organizations to cut costs and integrate their business processes internationally. They further stated that companies look for new markets and production processes during the industrial age but now they looked for economies of scale. It was difficult for organizations to rely solely on supply chain integration to cut costs and it was not easy to integrate different supply chains systems globally or internationally. Thus, globalization is another challenge for supply chain integration.
Business process integration: Awad & Nassar (2010b) argued that there was a need to coordinate business processes in such a way that they should improve performance and service. They further exclaimed that the modern e-commerce practices had enabled the organizations to link their internal processes with those of external stakeholders. But, there were certain compatibility challenges among organizations such as technical, operational, strategic and political/legal challenges that could become an obstacle in business process integration among different organizations. Transaction costs: Awad & Nassar (2010b) described that integration of supply chain sometimes required outsourcing of certain activities that would involve uncertainty and risk (such as revelation of trade secrets and performance breakdowns). There is a transaction cost involved in outsourcing certain activities. These transaction costs could become a challenge for supply chain integration.
Strategy and Planning: McDermott & Chan (1996) argued that strategy and planning itself became a challenge for supply chain integration among different organizations. It was because different organizations had different organizational or corporate objectives for which they strategize and plan. Supply chain strategy of an organization is integrated with its corporate strategy to reach its corporate goals and objectives.
Thus, supply chain integration means integration of corporate strategies among different organizations which is a challenge because corporate goals and objectives of different organizations are different and unique. It is not easy or possible to integrate corporate strategies of two different organizations. (Cited in Awad & Nassar, 2010b)
Customer order management: Boxall (1992) explained that customers were becoming more demanding and their needs and wants had changed in the modern world. Needs and wants of customers had become dynamic as well as diverse. The basic purpose of supply chain strategy was to identify and satisfy the needs and wants of customers effectively and efficiently. But, when needs and wants are changing, it was not possible to integrate supply chains for a longer period of time as
market dynamics used to change rapidly. Therefore, it seems that supply chain integration was a short term orientation. (Cited in Awad & Nassar, 2010b)
Operations Management: Awad & Nassar (2010b) different operations’ strategies were employed by different organizations to satisfy the needs and wants of target customers. Supply chain was a part of operations strategy. Another challenge for supply chain integration arises in operations as it is important for different organizations to integrate their supply chain management only if their operations are flexible enough to allow this integration.
Business standards: Finally, business or trade standards for operating in different industries are different. Sometime, the value chain for a specific product or service is scattered across different industries. Therefore, in such case, it becomes difficult to integrate supply chains because of the difference in industry or business standards. (Awad & Nassar, 2010b).According to R. Shukla& D. Garg & A. Agarwal (2012), there are barriers which affect not only coordination in the supply chain, but also influence one another. It is, therefore, important to understand their mutual relationship so that those barriers that are at the root (called driving barriers) and those which are most influenced by others (called driven barriers) are identified, so that management can take appropriate action.
III. Methodology
This study fall under quantitative survey research design that focus on examine challenges of supply chain integration in Soup and Detergent Manufacturing firms in Ethiopia. A total of 25 companies have been selected as a target unit of analysis for this study. To obtain list of manufacturing companies, the researcher used ECSA 2010 report and data on lists of manufacturing firm which obtained from ministry industry. After selecting the target companies questionnaire was distributed to the 75 respondents (three from each company) who typically have a title such as SC (supply chain) manager, CEO/president, vice president or director, and knowledgeable about the company’s SC processes. For this study as a primary data questionnaire has been designed and distributed to collect information from selected sample respondents. A set of questions on each aspect of the supply chain integration have been derived from extensive literature review and almost majority of instruments that measure Supply chain integration were adopted from Baofeng Huo, (2012). All questions have been organized of using Likert scale ranging from 1 to 5. The perceived operational performance also addressed through questionnaire. Moreover, items related to supply chain integration challenges have been objectively organized based key measures obtained from SCM literatures (e.g R. Shukla& D. Garg & A.
Challenges of Supply Chain Integration: The Case of Soap and Detergent Manufacturing Companies in Ethiopia
© 2018 Global Journals
31
Year
2018
Globa
l Jo
urna
l of M
anag
emen
t an
d Bu
siness Resea
rch
Volum
e XVIII
Issue
VII
Ver
sion
I(
)E

Table 2: Internal Integration
Table 2 indicate the summary frequency distribution that the internal integration of firms based on the intensity of respondents toward their respective judgement about their company. Therefore, the majority of respondents responses reflect that (43.6% agree and 27% strong agree) on the reliable items that measure Internal Integration that takes place in their organizations. This shows there is somewhat good internal integration of major functional units within the
organization such as procurement, production, marketing, inventory management and distribution. Others around 22% remain neutral and small percentage of respondents responses (7.2%) indicate that they disagree on the measurement items provided. These indicate non-existence a perfect internal integration and timely exchange of information between functional units or departments within the organizations.
Table 3: Customer Integration
Like that of internal integration, Table 3 show the summary frequency distribution of respondents’ response toward firms’ intensity in working with major customers in an integrated manner. As it is exhibited in the above table 37% agree plus 22.1% strongly agree on the measurement that evaluates the existence of external relationships with major customers. These shows that soap and detergent manufacturing companies have to some extent good communication with their customers on research activities and new product development, they have transparent information exchange with their customers about their inventory status, they exchange production plan information with
their customers, they collaborate with their customers‟ development program, they are aware of their customers medium and long-term policies and strategies, they share technical information with their customers, they have long term relationship with their customers. However, around 13.8% of respondents’ responses shows disagree and strongly disagree on the issue of customer integration. This shows the availability of some gaps in achieving better customer integration with downstream partners. Finally, the remaining 26.3% found to be neutral concerning to the measurement items.
Challenges of Supply Chain Integration: The Case of Soap and Detergent Manufacturing Companies in Ethiopia
© 2018 Global Journals1
32
Year
2018
Globa
l Jo
urna
l of M
anag
emen
t an
d Bu
siness Resea
rch
Volum
e XVIII
Issue
VII
Ver
sion
I(
)E
ResponsesN Percentage
Internal Integration
Strongly Disagree 6 1.1%Disagree 32 6.1%Neutral 112 21.4%Agree 228 43.6%
Strongly Agree 145 27.7%Total 523 100.0%
N=75
ResponsesN Percentage
Customer Integration
Strongly disagree 20 9.2%
Disagree 10 4.6%
Neutral 57 26.3%Agree 82 37.8%
Strongly agree 48 22.1%
Total 217 100.0%
Agarwal (2012)). After collecting the relevant data for the study, Statistical Package for Social Science (SPSS-20) software was used for input/output analysis of descriptive statistics.
IV. Result and Discussion
a) Intensity towards Supply Chain Integration This section focus on the intensity of Ethiopian
soap and detergent manufacturing firm’s towards
supply chain integration and associated challenges. Therefore, data related to each of the of supply chain integration dimensions: Internal integration, customer integration, and supplier integration are summarized and the results are presented below.
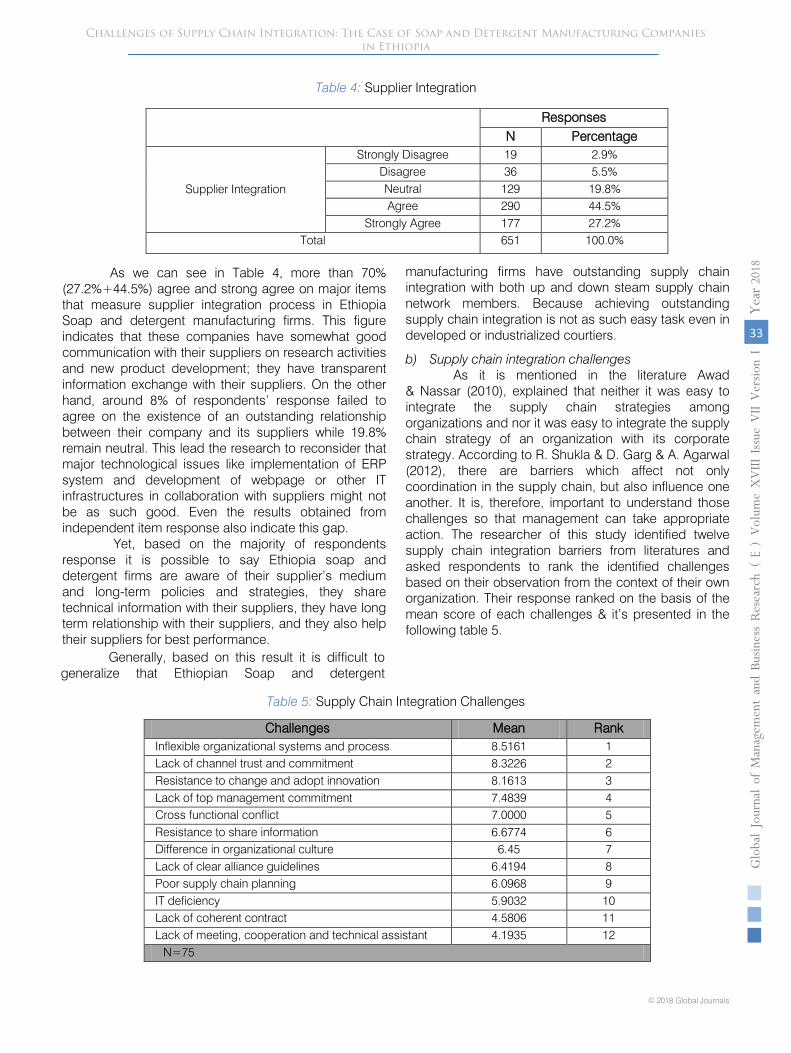
Table 4: Supplier Integration
As we can see in Table 4, more than 70%
(27.2%+44.5%) agree and strong agree on major items that measure supplier integration process in Ethiopia Soap and detergent manufacturing firms. This figure indicates that these companies have somewhat good communication with their suppliers on research activities and new product development; they have transparent information exchange with their suppliers. On the other hand, around 8% of respondents’ response failed to agree on the existence of an outstanding relationship between their company and its suppliers while 19.8% remain neutral. This lead the research to reconsider that major technological issues like implementation of ERP system and development of webpage or other IT infrastructures in collaboration with suppliers might not be as such good. Even the results obtained from independent item response also indicate this gap.
Yet, based on the majority of respondents
response it is possible to say Ethiopia soap and detergent firms are aware of their supplier’s medium and long-term policies and strategies, they share technical information with their suppliers, they have long term relationship with their suppliers, and they also help their suppliers for best performance.
Generally, based on this result it is difficult to generalize that Ethiopian Soap and detergent
manufacturing firms have outstanding supply chain integration with both up and down steam supply chain network members. Because achieving outstanding supply chain integration is not as such easy task even in developed or industrialized courtiers.
b)
Supply chain integration challenges
As it is mentioned in the literature Awad
& Nassar (2010), explained that neither it was easy to integrate the supply chain strategies among organizations and nor it was easy to integrate the supply chain strategy of an organization with its corporate strategy. According to R. Shukla
& D. Garg
& A. Agarwal (2012), there are barriers which affect not only coordination in the supply chain, but also influence one another. It is, therefore, important to understand those challenges so that management can take appropriate action. The researcher of this study identified twelve supply chain integration barriers from literatures and asked respondents to rank the identified challenges based on their observation from the context of their own organization. Their response ranked on the basis of the mean score of each challenges & it’s presented in the following table 5.
Table 5: Supply Chain Integration Challenges
Challenges of Supply Chain Integration: The Case of Soap and Detergent Manufacturing Companies in Ethiopia
© 2018 Global Journals
33
Year
2018
Globa
l Jo
urna
l of M
anag
emen
t an
d Bu
siness Resea
rch
Volum
e XVIII
Issue
VII
Ver
sion
I(
)E
ResponsesN Percentage
Supplier Integration
Strongly Disagree 19 2.9%Disagree 36 5.5%Neutral 129 19.8%Agree 290 44.5%
Strongly Agree 177 27.2%Total 651 100.0%
Challenges Mean RankInflexible organizational systems and process 8.5161 1Lack of channel trust and commitment 8.3226 2Resistance to change and adopt innovation 8.1613 3Lack of top management commitment 7.4839 4Cross functional conflict 7.0000 5Resistance to share information 6.6774 6Difference in organizational culture 6.45 7Lack of clear alliance guidelines 6.4194 8Poor supply chain planning 6.0968 9IT deficiency 5.9032 10Lack of coherent contract 4.5806 11Lack of meeting, cooperation and technical assistant 4.1935 12 N=75

As we can see from table 5, the major top challenges that hinder the supply chain integration process ranked by respondents based on their degree of severity. Rank 1 indicates very critical challenge and rank 12 represent very less critical challenge. As shown in the table the barriers were identified on the basis of their mean score. Basically, respondent who represent Ethiopian Soap and detergent manufacturing firms identified inflexible organization system and process, lack of channel trust and commitment, resistance to change and adopt innovation, lack of top level management commitment and cross functional conflicts were identified as the top five critical challenges for adopting and implementing supply chain integration process. On the other hand respondents ranked information technology deficiency, lack of coherent contract and lack of meeting, cooperation and technical assistant as the least critical challenges for integration. In a USA based study, the continual existence of functional silos, resistance to change, and poor communication are identified as barriers to adopting collaborative relationships between supply chain partners (Mentzer et al., 2001). Here there is one thing that surprise the researcher of this study IT deficiency is taken as the least challenging which is far from truth on the context of Ethiopia because IT infrastructure is poor and it is nationwide problem.
V. Conclusion
This empirical study was conducted in Ethiopia Soap and detergent manufacturing firms to investigate the challenges of supply chain integration. The challenges with internal and external integration, the researcher adopt twelve critical challenges from literature and asked respondents to rank in accordance with their degree of effect. To begin with extent of firms’ intensity towards supply chain integration, the study found that Ethiopian Soap and detergent manufacturing firms are somewhat in a good position. However, their internal integration or collaboration of each departmental unit within the organization is better than external integration with customers and suppliers. Yet, in terms of information technology usage it was found weak in the firms under the study. Finally, the study find that inflexible organization system and process, lack of channel trust and commitment, resistance to change and adopt innovation, lack of top level management commitment and cross functional conflicts were identified as the top five critical challenges for adopting and implementing supply chain integration process in the manufacturing firms under the study. To this end, reducing the extent of such challenges and implementing supply chain integration expected from managers of each company to enhance their competitiveness. In this study data were collected from manufactures, not include supplier and customer. The
study validly generalizability only from manufacturers point of view. Hence, it is highly desirable in the future research to have more than one respondent and consider it to incorporate customers and suppliers.
References Références Referencias
1. Awad, H. A., &Nassar, M. O. (2010a).Supply Chain Integration: Definition and Challenges. International Association of Engineers:
2. Awad, H. A., & Nassar, M. O. (2010b). A Broader view of the Supply Chain Integration. Challenges. International Journal of Innovation, Management and Technology, 1 (1), 51-56.
3. Central statistical agency (Ethiopia). 2010. Report on large and medium scale manufacturing and electricity industry survey.
4. Childerhouse, P. & Towill, D. R. (2003), "Simplified material flow holds the key to supply chain integration", Omega, vol. 31, pp. 17-27.
5. Childerhouse, P. & Towill, D.R. (2002), "Analysis of the factors affecting the real-world value stream performance", International Journal of Production Research, vol. 40, no. 15, pp. 3499-3518.
6. DerejeAsfaw (2012). The impact of supply chain management practices on the organizational performance of basic metal and engineering industries in Ethiopia.
7. Fawcett, S.E. and Magnan, G.M. (2002), “The rhetoric and reality of supply chain integration”, International Journal of Physical Distribution & Logistics Manage- ment, Vol. 32 No. 5, pp. 339-61.
8. Fisher, M. (1997), “What is the right supply chain for your product?”, Harvard Business Review, March-April, pp. 105-16.
9. Frohlich, M.T. and Westbrook, R. (2001), “Arcs of integration: an international study of supply chain strategies”, Journal of Operations Management, Vol. 19 No. 2, pp. 185- 200.
10. Handfield, R.B. and Bechtel, C. (2002), “The role of trust and relationship structure in improving supply chain responsiveness”, Industrial Marketing Management, Vol. 31 No. 4, pp. 367-82.
11. Kahn, K.B. and Mentzer, J.T. (1996), “Logistics and interdepartmental integration”, International Journal of Physical Distribution & Logistics Management, Vol. 26 No. 8, pp. 6-14.
12. Lambert, D. M., Cooper, M. C., and Pagh, J. D. (1998), "Supply Chain Management: Implementation Issues and Research Opportunities," International Journal of Logistics Management, 9(2), pp. 1-20.
13. Lambert, Douglas M., James R. Stock, and Lisa M. Ellram (1998), Fundamentals of Logistics Management, Boston, MA: Irwin/McGraw-Hill, Chapter 14.
14. Mentzer, J.T. (2001), Supply Chain Management, Sage, Thousand Oaks, CA.
Challenges of Supply Chain Integration: The Case of Soap and Detergent Manufacturing Companies in Ethiopia
© 2018 Global Journals1
34
Year
2018
Globa
l Jo
urna
l of M
anag
emen
t an
d Bu
siness Resea
rch
Volum
e XVIII
Issue
VII
Ver
sion
I(
)E

15. Morash, E.A. and Clinton, S.R. (1998), “Supply chain integration: customer value through collaborative closeness versus operational excellence”, Journal of Marketing Theory and Practice, Vol. 6 No. 4, pp. 104-20.
16. Narasimhan, R. and Kim, S.W. (2002), “Effect of supply chain integration on the relationship between diversification and performance: evidence from Japanese and Korean firms”, Journal of Operations Management, Vol. 20 No. 3, pp. 303-23.
17. Stevens, G.C. (1989), “Integrating the supply chain”, International Journal of Physical Distribution & Logistics Management, Vol. 19 No. 8, pp. 3-8.
18. Van der Vaart, T. and Van Donk, D. (2008), “A critical review of survey-based research in supply chain integration”, International Journal of Production Economics, Vol. 111 No. 42, pp. 42-55.
19. Vickery, S.K., Jayaram, J., Doge, C. and Calantine, R. (2003), “The effects of an integrative supply chain strategy on customer service and financial performance: an analysis of direct versus indirect relationships”, Journal of Operations Management, Vol. 21 No. 5, pp. 523-39.
20. Williamson, Oliver E. 1985. The Economic Institutions of Capitalism. New York:
21. Zailani, S. and Rajagopal, P. (2005), “Supply chain integration and performance: US versus East Asian companies”, Supply Chain Management: An International Journal, Vol. 10 No. 5, pp. 379-93.
Challenges of Supply Chain Integration: The Case of Soap and Detergent Manufacturing Companies in Ethiopia
© 2018 Global Journals
35
Year
2018
Globa
l Jo
urna
l of M
anag
emen
t an
d Bu
siness Resea
rch
Volum
e XVIII
Issue
VII
Ver
sion
I(
)E

This page is intentionally left blank
© 2018 Global Journals1
36
Year
2018
Globa
l Jo
urna
l of M
anag
emen
t an
d Bu
siness Resea
rch
Volum
e XVIII
Issue
VII
Ver
sion
I(
)E
Challenges of Supply Chain Integration: The Case of Soap and Detergent Manufacturing Companies in Ethiopia

© 2018. Khandaker Ashikur Rahman. This is a research/review paper, distributed under the terms of the Creative Commons Attribution-Noncommercial 3.0 Unported License http://creativecommons.org/licenses/by-nc/3.0/), permitting all non-commercial use, distribution, and reproduction in any medium, provided the original work is properly cited.
Halal Food Awareness of Young Adult Muslims Consumers: Comparative Studies between Bangladesh and Phillipine
By Khandaker Ashikur Rahman
Introduction- Every major religi on represents a symbolic meaning to food and drinks by having rules to regulate their consumption, and sometimes include religious rituals. This is the reason why certain religions forbid and restrict the consumption of certain food completely, or at certain specific time (Aliman and Othman, 2007). In Islam, there are two terms that denote Islamic prohibitions and restrictions on food, which are 'Haram' which means unlawful or prohibited and 'Halal' which means lawful or permitted. The word 'Halal' is derived from the word 'Halla' which the meaning is lawful, legal, legitimate and permitted for Muslims .In reality, Halal is one of the crucial aspect of spiritual needs for the Muslim consumers which plays a vital role in their life by guiding them to purchase and consume the Halal product (Alserhan, 2010).
Islam is the larges t religion of Bangladesh as it is known as a Muslim country. Muslims comprise 90.4% of the population, followed by Hindus, who constitute 8.2%, and Buddhists, Christians, those who practice others religions and those who do not are the remainders.
Usually Bangladesh peoples are used
to take Halal foods because they know the rules of Islam and grown up with the Islamic teachings.
GJMBR-E Classification: JEL Code: D11
HalalFoodAwarenessofYoungAdultMuslimsConsumersComparativeStudiesbetweenBangladeshandPhillipine
Strictly as per the compliance and regulations of:
Global Journal of Management and Business Research: E Marketing Volume 18 Issue 7 Version 1.0 Year 2018 Type: Double Blind Peer Reviewed International Research JournalPublisher: Global JournalsOnline ISSN: 2249-4588 & Print ISSN: 0975-5853

Halal Food Awareness of Young Adult Muslims Consumers: Comparative Studies between
Bangladesh and Phillipine Khandaker Ashikur Rahman
I.
Introduction
a)
Brief Introduction very major religion represents a symbolic meaning
to food and drinks by having rules to regulate their consumption, and sometimes include religious
rituals. This is the reason why certain religions forbid and restrict the consumption of certain food completely, or at certain specific time (Aliman and Othman, 2007). In Islam, there are two terms that denote Islamic prohibitions and restrictions on food, which are 'Haram' which means unlawful or prohibited and 'Halal' which means lawful or permitted. The word 'Halal' is derived from the word 'Halla' which the meaning is lawful, legal, legitimate and permitted for Muslims .In reality, Halal is one of the crucial aspect of spiritual needs for the Muslim consumers which plays a vital role in their life by guiding them to purchase and consume the Halal product (Alserhan, 2010).
Islam is the largest religion of Bangladesh as it is known as a Muslim country. Muslims comprise 90.4% of the population, followed by Hindus, who constitute 8.2%, and Buddhists, Christians, those who practice others religions and those who do not are the remainders.11
On the other hand, the total population in Philippines was last recorded at 97.4 million people in 2013. However, Philippine Muslims people only comprise of 14% from the population, which those are practicing Islam. Because Philipphines is a non Muslim country, most of the people of Philippines are Christians and it is almost 86.5%.
. Usually Bangladesh peoples are used to take Halal foods because they know the rules of Islam and grown up with the Islamic teachings. They are more aware about the benefits of halal foods compare to the non-Muslim countries. Besides, the Bangladesh people including young people are conscious about the Halal foods.
2
1
Data.worldbank.org/country/Bangladesh
2 www.tradingeconomics.com/philippines/population
. So the muslims population in Philipphines constitutes as the minority. Despite of cultural barrier, Muslims in Philippines have the potential to maximize their contribution if only the uniqueness that
they have could be seriously utilized. Numerous approaches had been done and programs had been designed. In the Philippines, the Halal Standard had been designed for the advantage of all. However, along the way there were hurdles have had encountered that caused the realization of Halal declined.
b) Back Ground of the Study The purpose of the study is to investigate the
awareness and perception of young Muslims consumer in Bangladesh and Philippine in relation to the Halal foods. Consumer perception and behavior towards halal food consumption in this both country is vital because it takes a serious role in monitoring and checking the halal food and products. Nowadays, Muslim consumers as well as other non-Muslim consumers demand healthy and good quality food. For Muslims, it must conform to the Shariah requirements. Therefore, it is worthwhile for companies and industries to take a closer look at consumer intention to offer good quality halal products and that can be used to predict and satisfy customers and company objectives. In addition with the diiference culture, where Bangladesh is major Muslims country and Philippines is minority Muslims country, perhaps the marketer need to take consideration in offering of their products.
c) Problem Statement It is statistically proven that demand for Halal
products and services are increasing and the development of Halal food marketing is rapidly expanding in the global market. World Halal food industry had increase from US$635 billion in 2009 to US$765 billion in 2013. In 2014, Muslim population in the world is estimated to be 2.04 billion people. It has been estimated that 70 percent of Muslim engaged in Halal Food consumption (Halal Journal, 2012).
However, a fundamental challenge to spread the Halal foods benefit through the young people in the world although all of them are not Muslim. As for the Muslims country would not be that much hurdles and difficulties, however the one from the minority Muslims country need more attention. Therefore in such situations, this study sought to examine the awareness of two country which is from the major Muslims country and minority Muslims country namely, Bangladesh and Philippines. This will probably be helpful in providing
E
© 2018 Global Journals
37
Year
2018
Globa
l Jo
urna
l of M
anag
emen
t an
d Bu
siness Resea
rch
Volum
e XVIII
Issue
VII
Ver
sion
I(
)E
Author: e-mail: [email protected]

improved facts and information particularly in the Islamic Marketing research area. d) Objective of the Study
The objective of this study is to know the level of awareness of using halal foods to the young peoples. The study also extends to measure the various impacts of issues, which is directly involved for using halal foods. The specific objections of this mini research are as follows; • To investigate the factors that influenced the level of
halal foods awareness of the young Muslims consumer.
• To study the awareness level of Muslim consumers in Bangladesh and Philippine.
• To investigate the differences of halal awareness level between Bangladesh and Philippines young Muslims consumer.
e) Significance of the Study The primary drive for choosing this research
topic is to fill the gap in the research field relating to Halal foods awareness to the young Muslims
consumers of Bangladesh and Philippine. In addition, this study focused on Bangladesh and Philippine youths who are from 18 to 30. Past research, which had been done, focused on the Malaysian consumers in general or those targeted on specific geographic regions. This can be seen from a study conducted by Shaari and Shahira (2010), which focus on respondents from geographical area of Kota Samarahan. In the study, it shows that religiosity, halal awareness and halal certification have an impact on the Muslim consumer purchase intention. On the other hand, study made by Salman and Siddiqui (2011) also shows that self-identity is one of the dimensions, which affect the Halal food consumption.
Moreover, the previous research theme measures the perceptions, behaviors and importance of halal logo and so on. Not many research focus on young people about awareness of Halal foods in Bangladesh and Philippine and how the youngsters are aware of the Halal products. These are the major significance of the study.
II. Literature Review
Figure 1:
Proposed framework for the research studies
The proposed model is designed with the awareness on halal food as the dependent variable with four dimensions of independent variables, which are: religious belief, religious commitment, attitude, and halal logo certification. Religious belief and religious commitment play roles as it was found to provide an improved explanation of unprocessed food choices and shopping styles (Mizerski & Muhammad,
2010).
Whereas is attitude is an independent variable which is also characterized by religious’ based evaluation on the awareness on consuming and choosing halal food for Muslims. In addition, equally important is the fourth
independent variable, halal logo certification that also contributes to the awareness on halal food among the young teenagers. The following discussion provides an overview of variables.
Halal Food Awareness of Young Adult Muslims Consumers: Comparative Studies between Bangladesh and Phillipine
© 2018 Global Journals1
38
Year
2018
Globa
l Jo
urna
l of M
anag
emen
t an
d Bu
siness Resea
rch
Volum
e XVIII
Issue
VII
Ver
sion
I(
)E
Religious Belief
Religious
Commitment
Attitude
Halal
Certification
Logo
Halal Food
Awareness
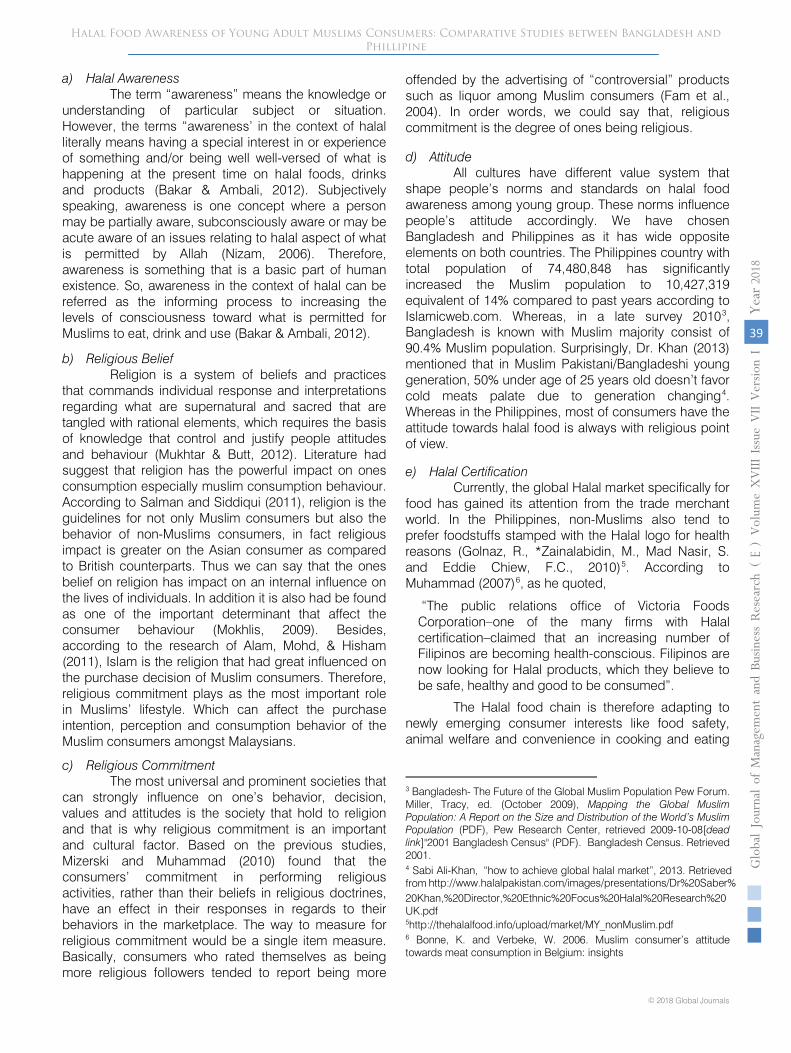
a) Halal Awareness The term “awareness” means the knowledge or
understanding of particular subject or situation. However, the terms “awareness’ in the context of halal literally means having a special interest in or experience of something and/or being well well-versed of what is happening at the present time on halal foods, drinks and products (Bakar & Ambali, 2012). Subjectively speaking, awareness is one concept where a person may be partially aware, subconsciously aware or may be acute aware of an issues relating to halal aspect of what is permitted by Allah (Nizam, 2006). Therefore, awareness is something that is a basic part of human existence. So, awareness in the context of halal can be referred as the informing process to increasing the levels of consciousness toward what is permitted for Muslims to eat, drink and use (Bakar & Ambali, 2012).
b) Religious Belief Religion is a system of beliefs and practices
that commands individual response and interpretations regarding what are supernatural and sacred that are tangled with rational elements, which requires the basis of knowledge that control and justify people attitudes and behaviour (Mukhtar & Butt, 2012). Literature had suggest that religion has the powerful impact on ones consumption especially muslim consumption behaviour. According to Salman and Siddiqui (2011), religion is the guidelines for not only Muslim consumers but also the behavior of non-Muslims consumers, in fact religious impact is greater on the Asian consumer as compared to British counterparts. Thus we can say that the ones belief on religion has impact on an internal influence on the lives of individuals. In addition it is also had be found as one of the important determinant that affect the consumer behaviour (Mokhlis, 2009). Besides, according to the research of Alam, Mohd, & Hisham (2011), Islam is the religion that had great influenced on the purchase decision of Muslim consumers. Therefore, religious commitment plays as the most important role in Muslims’ lifestyle. Which can affect the purchase intention, perception and consumption behavior of the Muslim consumers amongst Malaysians.
c) Religious Commitment The most universal and prominent societies that
can strongly influence on one’s behavior, decision, values and attitudes is the society that hold to religion and that is why religious commitment is an important and cultural factor. Based on the previous studies, Mizerski and Muhammad (2010) found that the consumers’ commitment in performing religious activities, rather than their beliefs in religious doctrines, have an effect in their responses in regards to their behaviors in the marketplace. The way to measure for religious commitment would be a single item measure. Basically, consumers who rated themselves as being more religious followers tended to report being more
offended by the advertising of “controversial” products such as liquor among Muslim consumers (Fam et al., 2004). In order words, we could say that, religious commitment is the degree of ones being religious.
d) Attitude All cultures have different value system that
shape people’s norms and standards on halal food awareness among young group. These norms influence people’s attitude accordingly. We have chosen Bangladesh and Philippines as it has wide opposite elements on both countries. The Philippines country with total population of 74,480,848 has significantly increased the Muslim population to 10,427,319 equivalent of 14% compared to past years according to Islamicweb.com. Whereas, in a late survey 20103, Bangladesh is known with Muslim majority consist of 90.4% Muslim population. Surprisingly, Dr. Khan (2013) mentioned that in Muslim Pakistani/Bangladeshi young generation, 50% under age of 25 years old doesn’t favor cold meats palate due to generation changing4
e)
Halal Certification
. Whereas in the Philippines, most of consumers have the attitude towards halal food is always with religious point of view.
Currently, the global Halal market specifically for food has gained its attention from the trade merchant world. In the Philippines, non-Muslims also tend to prefer foodstuffs stamped with the
Halal logo for health
reasons (Golnaz, R., *Zainalabidin, M., Mad Nasir, S. and Eddie Chiew, F.C., 2010)5. According to Muhammad (2007)6
The Halal food chain is therefore adapting to newly emerging consumer interests like food safety, animal welfare and convenience in cooking and eating
, as he quoted, “The public relations office of Victoria Foods Corporation–one of the many
firms with Halal
certification–claimed that an increasing number of Filipinos are becoming health-conscious. Filipinos are now looking for Halal products, which they believe to be safe, healthy and good to be consumed”.
Halal Food Awareness of Young Adult Muslims Consumers: Comparative Studies between Bangladesh and Phillipine
© 2018 Global Journals
39
Year
2018
Globa
l Jo
urna
l of M
anag
emen
t an
d Bu
siness Resea
rch
Volum
e XVIII
Issue
VII
Ver
sion
I(
)E
3 Bangladesh- The Future of the Global Muslim Population Pew Forum. Miller, Tracy, ed. (October 2009), Mapping the Global Muslim Population: A Report on the Size and Distribution of the World’s Muslim Population (PDF), Pew Research Center, retrieved 2009-10-08[dead link]"2001 Bangladesh Census" (PDF). Bangladesh Census. Retrieved 2001. 4 Sabi Ali-Khan, “how to achieve global halal market”, 2013. Retrieved from http://www.halalpakistan.com/images/presentations/Dr%20Saber%20Khan,%20Director,%20Ethnic%20Focus%20Halal%20Research%20UK.pdf5http://thehalalfood.info/upload/market/MY_nonMuslim.pdf 6 Bonne, K. and Verbeke, W. 2006. Muslim consumer’s attitude towards meat consumption in Belgium: insights
(Bonne and Verbeke, 2006).7 Also, the Halal Rearach Council (2014), mentioned that the Trade Commissioner of Malaysia External Trade Development Corp., Mr. Ahmad quoted, “he believed that the Philippines have a competitive advantage in cosmetics, food supplements, and food seasoning ingredients. There are a lot of potentials (for these products). Just by having a small halal seal will bring big difference to your products being exported abroad,” he said.8
III. Research Methodology
Conversely, as the most populous religion in Bangladesh is Islam, both non-Muslims and Muslims are aware of halal logo or certification.
a) Research Design The general purpose of the study is to identify
the halal Awareness of the young teenagers in two country namely Bangladesh and Philippines toward halal food. The design of this research is survey research that uses four variables. This study is a quantitative study and Cooper and Emory (1995) stated that the explanative study used to test the hypothesis and also explain the relationship and the underlying influence of these variables.
b) Data Collection Method and Instruments This research used questionnaires as the
methods for data collection. Basically, questionnaire is being use to measure the variables of interest. Several questions have been adapted and modified by previous study to search the answer for respondents’ background and understanding of halal concepts in Malaysia. The questionnaire contains six main sections: 1) demographic 2) religious belief 3) Religious Commitment 4) Awareness 5) Halal certification 6) Attitude. A total 71 respondents were randomly selected from the Bangladesh and Philippines young teenager. Survey questionnaires were distributed online to the respondents and the questionnaires are filled up by online through Google document form (www.docs.google.com).
c) Sample Determination This research is meant for a mini research and
thus, the range of sample size should be from 60 – 150 so that it will not be too small size nor too big and also the best sample size which can give the recommendable findings and can help to get the clear analysis. The sample size of this research is chosen to be 71 respondents. Those respondents are chosen from
from a means-end chain approach. Anthropology of Food 5: 1-24. 7
Bonne, K. and Verbeke, W. 2006. Muslim consumer’s attitude
towards meat consumption in Belgium: insights from a means-end chain approach. Anthropology of Food 5: 1-24.
8January 28, 2014, retrieved from: http://halalrc.blogspot.com/
2014_01_01_archive.html
young adult o from Bangladesh and Philippines. The age ranges of the respondents are from 18 and above, which includes both male and female.
d) Data Measurement Scale (Nominal, Ordinal or Likert Scale)
The questionnaire used the five-point Likert scale of 1 to 5 (1 representing strongly agree and 5 strongly not agree) to measure the consumers awareness of halal food. . Based on the understandings from previous studies, questionnaire was adapted for the religiousity and halal certification (zainal et al; 2008). Besides, the halal awareness and attitude the questionnaire was also adapted from previous studies to collect information. In addition, consumers’ demographic and social-economic backgrounds were also collected.
e) Analyzing Procedure SPSS analysis was used to run the raw data in
order to proceed with data analysis. Both descriptive and factor analysis was used to analyzed the information collected from the questionnaire. Descriptive analysis was used to analyzed respondents’ demographic and social-economic, however the factor analysis is being used as a statistical technique which the objective to indicate the underlying factors that might have impact on consumer awareness on halal food. In addition, reliability analysis and Annova (degree of relationship) analysis also was done for this research in order to proceed with data analysis. As for the analysis of the comparison study, the T-test had been done.
f) Hypothesis Development Different hypothesis has been developed after
going through past studies and the data collection stage. The different hypotheses are religious belief, religious commitment, halal certification, and attitude. Based on the review of the literature, research objectives and the model, the following hypotheses were developed:
H1: There is a positive relationship between religious belief and halal awareness of young Muslim consumers in consuming halal food.
H2: There is a positive relationship between religious commitment and halal awareness of young Muslim consumers in consuming halal food.
H3: There is a positive relationship between, halal certification and halal awareness of young Muslim consumers in consuming halal food.
H4: There is a positive relationship between attitude and halal awareness of young Muslim consumers in consuming halal food.
H5: There is differences between young Muslims consumer in Bangladesh and Philippines on the Halal food awareness.
Halal Food Awareness of Young Adult Muslims Consumers: Comparative Studies between Bangladesh and Phillipine
© 2018 Global Journals1
40
Year
2018
Globa
l Jo
urna
l of M
anag
emen
t an
d Bu
siness Resea
rch
Volum
e XVIII
Issue
VII
Ver
sion
I(
)E

IV. Analysis and Results a) Descriptive Analysis
The result of this study showed that out of 71 respondents there were 44 male respondents and 27 females. Among the respondents up to from 24-26 years old were 40.8% followed by 27 and above years
old were 29.6%. The respondents are commonly single with 59.2% and only 38% is married. Among the respondents are from Philippines and Bangladesh. For Philippines there were 32 respondents and 39 respondents from Bangladesh.
Table 1: Table Demographic
b) Reliability Analysis By applying IBM SPSS 20.0 version, this kind of
analysis can help the researchers to the internal consistency of the data for analysis. The most common type of statistics is the reliability analysis which is called Cronbach’s coefficient alpha. From the table 2 below showed the Cronbach’s Alpha according to our independent variables, we have done one by one in order to get the accurate figure of the Cronbach’s Alpha.
The Reliability Statistics as shown below table 2 are on standardized items from.719 to .718 accordingly, which simply means that our measuring on each independent variable is very reliable.
Table 2:
Reliability Statistics
Halal Food Awareness of Young Adult Muslims Consumers: Comparative Studies between Bangladesh and Phillipine
© 2018 Global Journals
41
Year
2018
Globa
l Jo
urna
l of M
anag
emen
t an
d Bu
siness Resea
rch
Volum
e XVIII
Issue
VII
Ver
sion
I(
)E
GENDER:
Male
Female
44
27
62%
38%
MARITAL SATTUS:
Single
Married
Others
42
27
2
59.2%
38%
2.8%
COUNTRY:
Philippines
Bangladesh
32
39
45.1%
54.9%
Items Frequency Percentage
AGE:
18-20(years)
21-23(years)
24-26(years)
27 and above
12
9
29
21
16.9%
12.7%
40.8%
29.6%
Cronbach's
Alpha
Cronbach's
Alpha Based
on
Standardized
Items
No. of Items
.719 .860 19
.786 .786 4
.729 .725 3
.718 .734 3

c) Factor Analysis To assess the dimensionality of the “Halal Food
Consciousness Among Young Adult: Comparative Study among Bangladesh and Philippines’. Factor analysis were performed using the principal factor/ component(PF) method, followed by the varimax rotation. Table 3 shows the results of the factor analysis testfor the variables. The Kaiser–Meyer-Olkin (KMO) value which is a measure of sampling adequacy.
The results of the Bartletts Test of Sphericity were also significant, which indicates that the factor analysis processes were correct and suitable for testing multidimensionality.Fifteen items of these questionnaires were factor analyzed using principal componen textraction with an orthogonal (Varimax) rotation according to each variable. The number of factors were unconstrained. For the sake of convergent validity, 0.5 was used as a factor loading cut-off point. In our case
we rotated two times to get the significant variables under four factors and these are Religious Belief, Religious Commitment, Attitude which divided into Environment and Halal and lastly is Logo. We have done the factor analysis two times on each variables in order to get the accurate measurement for extraction method, principal component analysis
From the Table 3, it has revealed that Kaiser-Meyer-Olkin (KMO) Measures of sampling Adequacy in our study is according to each variable as mentioned-above are these: Religious Belief, the KMO & Bartlett’s Test is 0.479, as for Religious Commitment is 0.811, Attitude 0.563 and followed by Logo is 0.515. This is somehow could say a good result as it exceeds 0.5 Bartlett’s Test of Sphericity is 0.000suggesting that the factor analysis had proceeded correctly and that samples were adequate execpt for religious belief which is below 0.5.
Table 3: KMO and Bartlett's Test
*Sample for FACRELCOMITMENT (religious commitment)
d) Degree of Relationship The proposed model (Table 4) consists of one
exogenous variable (Awareness) and four endogenous variables (religious belief, religious commitment, attitude “environment and halal” and logo). In our research, the
overall value is .964. This R Square value is very important because it reveals how well the striaght-line model fits the scatter of points. Since our R Square is quite high, the better is the stright-line’s fit to the points.
Table 4: Model Summary
a.
Predictors 1, REGR factor score 1 for analysis 1, REG R factor score 1 for analysis 1, REGR factor score 1 for analysis 1, REGR factor score for analysis 1
Table 5: ANOVAb
a.
Predictors: (Constant), REGR factor score 1 for analysis, REGR factor score 1 for analysis 1, REGR fator score 1 for analysis 1,
REGR factor score for analysis 1
b.
Dependent Variable: REGR factor 1 for analysis 1
Halal Food Awareness of Young Adult Muslims Consumers: Comparative Studies between Bangladesh and Phillipine
© 2018 Global Journals1
42
Year
2018
Globa
l Jo
urna
l of M
anag
emen
t an
d Bu
siness Resea
rch
Volum
e XVIII
Issue
VII
Ver
sion
I(
)E
Kaiser-Meyer-Olkin Measure of Sampling Adequacy.
Bartlett's Test of Approx. Chi-
Square
Sphericity Df
Sig.
.811*
110.616
6
.000
Model R R SquareAdjusted R
Square
Std. Error of
the Estimate
1 .964a
.930 .925 .77482206
ModelSum of
Squares dfMean Square F Sig.
1 Regression 5 .000a
Residual 4.893 64
Total 69.991 69
170.30113.020
.076
65.098

To express as percentage, this means that 65.09% of model explains the halal awareness among young adult between Philippines and Bangladesh. However, to understand more about statistical significance of this result, it is very necessary to look at the ANOVA Table 5. Next, the SPSS provides an Analysis of Variance (ANOVA) section; with this information, it is necessary to understand that regression is related to analysis of variance. This tests the null hypothesis that multiple R in the population equals 0. The model in this mini thesis research reaches statistical significance (sig. = .000; this really means p<.0005, meaning that there is at least one significant difference.
In the SPSS coefficients table 6, look at the Sig. Level for the t value for the constant. Because the determination of the significance of the intercept and the slope are so vital to bivariate regression analysis, we simply computed the values because the two values
must be tested for statistical significance. From the result of the table 6 labeled as Coefficients, this is where the slope and intercept t test results are seen. Since our tests have significance levels of 0.000 which is Logo and the rest are above the 0.000, which are above our standard significance level cutoff of .05, so our computed (alpha) and (beta). The other value given is the VIF (Variance Inflation Factor), which is just the inverse of the tolerance value (1 divided by tolerance). VIF values above 10 would be a concern here, indicating multicollinearity. In our mini thesis research, the tolerance value of independent variables is from 2.363 to 1.359 which is not less than .10. Therefore, we can say that we didn’t violate the assumption of multicollinearity. Furthermore, it supported the VIF which are also less than 10. The next thing we want to know is which of the variables included in the model contributed to the prediction of the dependent variable.
Table 6:
Coefficientsa
a.
Dependent Variable: REGR factor score 1 for analysis 1
Subsequently, there is one negative sign which is halal under attitude -0.12 in the data analysis found, the largest beta coefficient in the table is .862, which is for logo.
This simply means that
this variable makes the significant or unique contribution to explaining the dependent variable, when the variance explained by all other variables in the model is controlled for. The other beta values for religious belief and religious commitment and attitude (halal)of Halal awareness are accordingly, 0.57, 0.127 and 0.57 these made less of a contribution.
From the coefficient matrix table we can generate the calculation of probability of
halal awareness among young adult(Y) = a + b1x1 (religiosity belief) + b2 x2(religiosity
commitment) + b3 x3 (halal) b4 x4 (logo).
e)
Test of Hypothesis
H1.
Religious belief is positively related to the halal awareness among young adult.
According to the
table 6, the factor H1 independent variable in standardized coefficient is .057, meaning not supported and it’s insignificant as it has the third highest .256. The H2 which is the religious commitment based on awareness towards Halal products will positively influence the Filipinos and Bangladeshi on halal products, it supported and has significant of awareness among young adult in halal product so as the H4, Halal logo s will positively aware
of Halal products and has the highest standardized coefficient beta of .862.
Furthermore, for the significance test of each variable, from the Table 6,
we have checked the value in the column marked sig. This tells whether the variable is making a statistically significant unique contribution to the equation or not. According to the research, P value of Religiousity belief is .256 means P>0.05. Thus, the
religiousity belief is merely precluded which means that
Halal Food Awareness of Young Adult Muslims Consumers: Comparative Studies between Bangladesh and Phillipine
© 2018 Global Journals
43
Year
2018
Globa
l Jo
urna
l of M
anag
emen
t an
d Bu
siness Resea
rch
Volum
e XVIII
Issue
VII
Ver
sion
I(
)E
Model
Unstandardized Coefficients
Standardized Coefficients t Sig.
B Std. Error Beta
1 (Constant) -0.01 0.33 .023 .982
FACREL
BELIEF
.057 .050 .057 1.147 .256
FACREL
COMMIT
MENT
.125 .051 .127 2.466 .016
FACENV
IRNOME
NT
FACHALAL
FCLOGO
.051
-.013
.862
.050
.044
.044
.057
-0.12
.862
1.021
-.283
19.692
.311
.778
.000
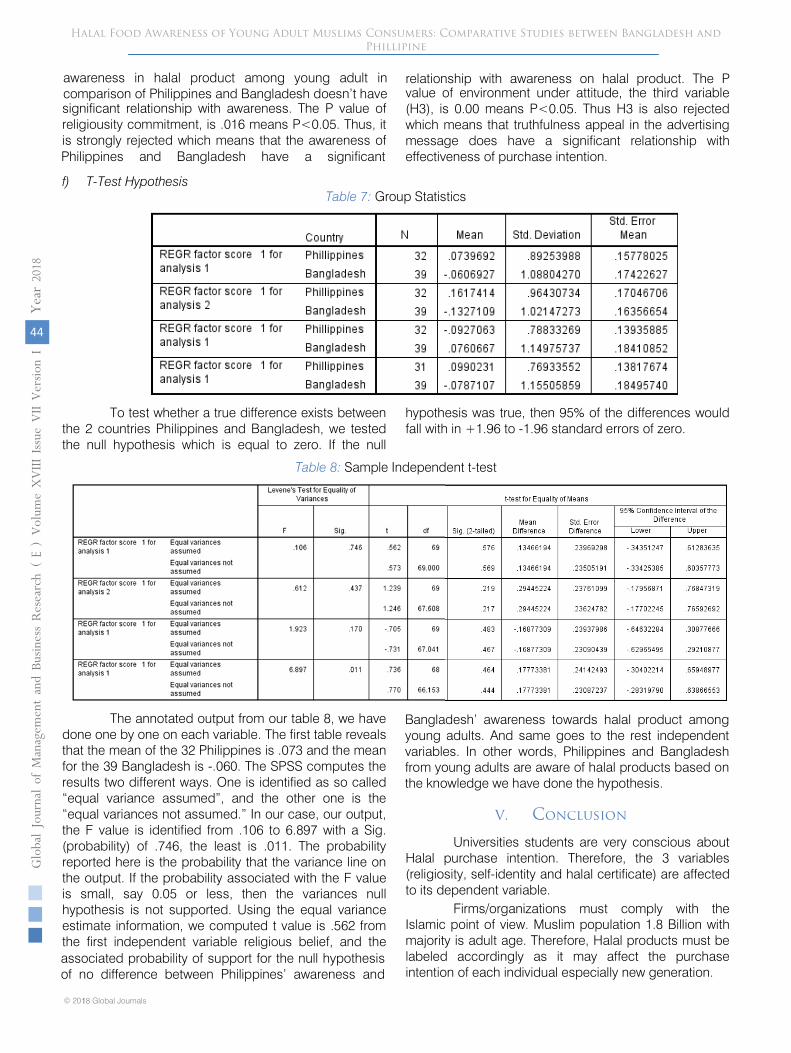
significant relationship with awareness. The P value of religiousity commitment, is .016 means P<0.05. Thus, it is strongly rejected which means that the awareness
of Philippines and Bangladesh
have a significant
relationship with awareness on halal product.
The P value of environment under attitude, the third variable (H3), is 0.00 means P<0.05. Thus
H3 is also rejected
which means that truthfulness appeal in the advertising message does have a
significant relationship with
effectiveness of purchase intention.
f)
T-Test Hypothesis
To test whether a true difference exists between the 2 countries Philippines and Bangladesh, we
tested the null hypothesis which is equal to zero. If the null
hypothesis was true, then 95% of the
differences would fall with in +1.96 to -1.96 standard errors of zero.
Table 8:
Sample Independent t-test
The annotated output from our table 8, we have done one by one on each variable.
The first table reveals that the mean of the 32 Philippines is .073 and the mean for the 39 Bangladesh is -.060. The SPSS computes the results two different ways. One is identified as so called “equal variance assumed”, and the other one is the “equal variances not assumed.” In our case, our output, the F value is identified from .106 to 6.897 with a Sig. (probability) of .746, the least is .011. The probability reported here is the probability that the variance line on the output. If the probability associated with the F value is small, say 0.05 or less, then the variances null hypothesis is not supported. Using the equal variance estimate information, we computed t value is .562 from the first independent variable religious belief, and the associated probability of support for the null hypothesis of no difference between Philippines’ awareness and
Bangladesh’ awareness towards halal product among young adults. And same goes to the rest independent variables. In other words, Philippines and Bangladesh from young adults are aware of halal products based on the knowledge we have done the hypothesis.
V.
Conclusion
Universities students are very conscious about Halal purchase intention. Therefore, the 3 variables (religiosity, self-identity and halal certificate) are affected to its dependent variable.
Firms/organizations must comply with the Islamic point of view. Muslim population 1.8 Billion with majority is adult age. Therefore, Halal products must be labeled accordingly as it may affect the purchase intention of each individual especially new generation.
Halal Food Awareness of Young Adult Muslims Consumers: Comparative Studies between Bangladesh and Phillipine
© 2018 Global Journals1
44
Year
2018
Globa
l Jo
urna
l of M
anag
emen
t an
d Bu
siness Resea
rch
Volum
e XVIII
Issue
VII
Ver
sion
I(
)E
Table 7: Group Statistics
22
awareness in halal product among young adult in comparison of Philippines and Bangladesh doesn’t have

corporate image describes the picture an organization presents to the public.
Nowadays, young generations can check further information about certain product whether it is genuine or not. Furthermore, the students are smart enough to differentiate the product and service via internet, the widely common users everywhere in the world.
VI.
Limitation & Further Research
Further research should be considered to
gather more information regarding the service quality and customers’ satisfaction dimensions in context of the local and international students in Malaysia. Also, the limitation of this study was the difficulty in approaching wide variety of universities across Malaysia. This is due to time limitation and cost. For further research, the researchers need to increase the number of respondents involved in the research study to get enough result and the analysis will be as accurate as possible.
References Références
Referencias
1.
Alam, S. S., Mohd, R., & Hisham, B. (2011). Is religiosity an important determinant on Muslim consumer behaviour in Malaysia? Journal of Islamic Marketing, 2(1), 83–96.
2.
Alserhan, B. A. (2010). On Islamic branding: brands as good deeds. Journal of Islamic Marketing, 1(2), 101–106.
3.
Ambali, A. R., & Bakar, A. N. (2014). People’s Awareness on Halal Foods and Products: Potential Issues for Policy-makers. Procedia - Social and Behavioral Sciences, 121(September 2012), 3–25.
4.
Bonne, K. and Verbeke, W. 2006. Muslim consumer’s attitude towards meat consumption in Belgium: insights from a means-end chain approach. Anthropology of Food 5: 1- 24.
5.
Fam, K.S., Waller, D.S. and Erdogan, B.Z. (2004), “The influence of religion on attitudes towards the advertising of controversial products”, European Journal of Marketing, Vol. 38 Nos 5/6, pp. 537-55.
6.
Miller, Tracy, ed. (2009), Mapping the Global Muslim Population: A Report on the Size and Distribution of
the World’s Muslim Population (PDF), Pew Research Center.
7.
Mokhlis, S., (2009). Relevancy and Measurement of Religiosity in Consumer Behavior Research.
International Business Research.
Vol. 2 Iss: 2, pp. 75-84.
8.
Muhamad, N., & Mizerski, D. (2010). The constructs mediating religions’ influence on buyers and consumers.Journal of Islamic Marketing, 1(2),
124–135.
9.
Mukhtar, A., & Butt, M. M. (2012). Intention to choose <IT>Halal</IT> products: the role of religiosity. Journal of Islamic Marketing, 3(2),
108–120.
10.
Salehudin, I., & Luthfi, B. A. (2011). Marketing Impact of Halal Labeling toward Indonesian Muslim Consumer’s Behavioral Intention Based on Ajzen’ s Planned Behavior Theory : Policy Capturing Studies on Five Different Product Categories. Asean Marketing Journal,
(1), 35–44.
11.
Salman, F., & Siddiqui, K. (2011). An exploratory study for measuring consumers awareness and perceptions towards Halal food in Pakistan. Interdisciplinary Journal of Contemporary Research in Business, 3(2), 639-652.
Web References:
12.
Bangladesh. “Countries and their cultures”. Retrieved from; http://www.everyculture.com/A-Bo/ Bangladesh.
html
13.
Halal News Research, January 28, 2014. Retrieved from: http://halalrc.blogspot.com/2014_01_01_
archive.html
14.
Halal
Pedia. Retrieved from http://www.daganghalal. com/HalalInfo/HalalInfo.aspx
15.
Historical Background. Retrieved from; http://countrystudies.us/philippines/46.htm
16.
Religion In Bangladesh- early History. Retrieved from http://atheism.about.com/library/FAQs/islam/
countries/bl_BangladeshAncient.htm 17.
Sabi Ali-Khan, “how to achieve global halal market”, 2013. Retrieved from http://www.halalpakistan.com/
images/presentations/Dr%20Saber%20Khan,%20Director,%20Ethnic%20Focus%20Halal%20Research%20UK.
18.
Student Awareness on Halal. Retrieved from https://www.scribd.com/doc/249250963/Students-Awareness-on-Halal
Halal Food Awareness of Young Adult Muslims Consumers: Comparative Studies between Bangladesh and Phillipine
© 2018 Global Journals
45
Year
2018
Globa
l Jo
urna
l of M
anag
emen
t an
d Bu
siness Resea
rch
Volum
e XVIII
Issue
VII
Ver
sion
I(
)E
For further information, future researchers may continue to evaluate this study whether the universities students in Malaysia are aware of Islamic products that are offered widely around the globe by penetrating marketing strategies in some part of the world like in Arab Golf or Europe or in West.
Thus, the marketing approach requires managers of any industry related to Halal to perform their work efficiently by being honest, well informed with customers about the product and being alert to how their services can meet customers’ needs. Importantly,
This page is intentionally left blank
Halal Food Awareness of Young Adult Muslims Consumers: Comparative Studies between Bangladesh and Phillipine
© 2018 Global Journals1
46
Year
2018
Globa
l Jo
urna
l of M
anag
emen
t an
d Bu
siness Resea
rch
Volum
e XVIII
Issue
VII
Ver
sion
I(
)E
© 2018. Fernando H.S.M, Kumara H.H.S.N., Mendis H.I.A., Wettawa W.M.B.S. & Samarasinghe H.M.U.S.R. This is a research/ review paper, distributed under the terms of the Creative Commons Attribution-Noncommercial 3.0 Unported License http:// creativecommons.org/licenses/by-nc/3.0/), permitting all non-commercial use, distribution, and reproduction in any medium, provided the original work is properly cited.
Effects of Brand Experience on Consumer Brand Loyalty in Fashion Retail Industry: Moderating the Role of Gender
By Fernando H.S.M, Kumara H.H.S.N., Mendis H.I.A., Wettawa W.M.B.S. & Samarasinghe H.M.U.S.R
Keywords: brand experience, brand loyalty, fashion retail industry, consumer gender.
GJMBR-E Classification: JEL Code: M37, M30
EffectsofBrandExperienceonConsumerBrandLoyaltyinFashionRetailIndustryModeratingtheRoleofGender
Strictly as per the compliance and regulations of:
Global Journal of Management and Business Research: E Marketing Volume 18 Issue 7 Version 1.0 Year 2018 Type: Double Blind Peer Reviewed International Research JournalPublisher: Global JournalsOnline ISSN: 2249-4588 & Print ISSN: 0975-5853
Abstract- The Intensity of the competition in the fashion retail industry is becoming notable where customers have left with the many purchasing alternatives than before. Fashion retail industry in a developing country such as Sri Lanka, encounter to threats from international level more frequently. Organizations are often adapting the brand strategies in order to remain their relationship between the customer and their brand. Since the fast fashion concept emerged it is no longer sufficient to provide a product solely to satisfy their customers, exceptionally in the fashion industry where local and international organizations have started to provide affordable luxury products. Eventually, brand loyalty has become more significance to maintain the image of the fashion retail industry which can be predicted that consumer expects intangible benefits to improve their lifestyles along with products.
The paper aims to understand the effect of brand experience on brand loyalty in the fashion retail industry of Sri Lanka moderating the role of consumer gender. It is a fact that basic segmentation in the fashion industry is based on the gender.

Effects of Brand Experience on Consumer Brand Loyalty in Fashion Retail Industry:
Moderating the Role of Gender Fernando H.S.M α, Kumara H.H.S.N. σ, Mendis H.I.A. ρ, Wettawa W.M.B.S. Ѡ & Samarasinghe H.M.U.S.R ¥
Abstract-
The
Intensity
of
the
competition
in
the
fashion
retail
industry
is
becoming
notable
where
customers
have
left
with
the
many
purchasing
alternatives
than
before.
Fashion
retail
industry
in
a
developing
country
such
as
Sri
Lanka,
encounter
to
threats
from
international
level
more
frequently.
Organizations
are
often
adapting
the
brand
strategies
in
order
to
remain
their
relationship
between
the
customer
and
their
brand.
Since
the
fast
fashion
concept
emerged
it
is
no
longer
sufficient
to
provide
a
product
solely
to
satisfy
their
customers,
exceptionally
in
the
fashion
industry
where
local
and
international
organizations
have
started
to
provide
affordable
luxury
products.
Eventually,
brand
loyalty
has
become
more
significance
to
maintain
the
image
of
the
fashion
retail
industry
which
can
be
predicted
that
consumer
expects
intangible
benefits
to
improve
their
lifestyles
along
with
products.
The
paper
aims
to
understand
the
effect
of
brand
experience
on
brand
loyalty
in
the
fashion
retail
industry
of
Sri
Lanka
moderating
the
role
of
consumer
gender.
It
is
a
fact
that
basic
segmentation
in
the
fashion
industry
is
based
on
the
gender.
Hence
this
study
attempts
to
understand
the
gender
moderation
in
aforementioned
relationship.
The
objectives
of
the
study focused
on
determining
the
relationship
between
brand
experience
and
loyalty
and
to
examine
the
gender
moderation
within
aforementioned
the
relationship.
A
structured
questionnaire
and
an
online
survey
utilized
to
gather
both
qualitative
and
quantitative
data
from
266
respondents
who
selected
through
convenient
sampling
method.
The
research
indicates
that
brand
experience
has
strong
positive
effect
on
brand
loyalty
where
sensory
dimension
has
higher
influence
in
brand
loyalty
than
other
dimensions
in
the four
factor
model
of
brand
experience.
Further
the
brand
loyalty
consumers
in
Sri
Lankan
market
are
found
to
be
moderate
based
on
their
gender
which
considering
significance
in
factor
of
high
quality.
Keywords: brand
experience,
brand
loyalty,
fashion
retail
industry,
consumer
gender.
I.
Introduction
ith
the
agile
business
practices,
fashions
have
simultaneously
changed
from
time
to
time
to
the
point
to
labels
clothes
with
the
name
of
centuries
such
as
90’s
trousers
and
blouses.
Fashion
retail
sector
today
too
has
shown
significant
market
growth. Local
retailers
are
expanding
their
scale
and
scope
whilst
global
retailers
continued
to
enter. In this
context, the purpose of this study was to investigate, to what extend Sri Lankan fashion retail sector has grasped tourism market opportunities fashion retail sector today too has shown significant market growth. Local retailers are expanding their scale and scope whilst global retailers continued to enter. In this context, the purpose of this study was to investigate, to what extend Sri Lankan fashion retail sector has grasped tourism market opportunities fashion retail sector today too has shown significant market growth. Local retailers are expanding their scale and scope whilst global retailers continued to enter. In this context, the purpose of this study was to investigate, to what extend Sri Lankan fashion retail sector has grasped tourism market opportunities fashion retail sector today too has shown significant market growth. Local retailers are expanding their scale and scope whilst global retailers continued to enter. In this context, the purpose of this study was to investigate, to what extend Sri Lankan fashion retail sector has grasped tourism market opportunities Fashion retail industry is a novel and emerging sector in Sri Lanka. It was almost non-existent about three years ago while today it is estimated that local retailers are earning over 10 million US dollars annually (Dias, 2011). Moreover, they have the potential to reach up to US$500 million in the next few years (Dias, 2011). “In witnessing the growth of the fashion industry, the retail market is likely to grow by 50% of the number of pieces made or displayed and sold” (Dias, 2011). Prior to the 1990s, Sri Lanka was a closed economy. The retail sector majorly consisted of small privately owned single stores that did not have corporate management and were known as traditional retailers (Linage and Jayewardene, 2013). However, over the past few years especially after war conflicts, Sri Lankan fashion retail sector have rapidly expanded and the number of retailers have increased. This positive macro environment background has not only benefited domestic retailers but also has attracted international retailers. As to 2013 Global retail development index, Sri Lanka titled as “Sri Lanka, thriving with fresh investment ranks fifteenth with a market attractiveness of 16.6%” (Kearney, 2013). In essence, fashion retail industry today is at a forefront of success due to the positive macro environment changes such as post -war economic developments, growing
W
Author α σ ρ Ѡ ¥: Faculty of Business, Sri Lanka institute of InformationTechnology, Malabe, Sri Lanka. e-mails: [email protected],[email protected], [email protected],[email protected], [email protected]
© 2018 Global Journals
47
Year
2018
Globa
l Jo
urna
l of M
anag
emen
t an
d Bu
siness Resea
rch
Volum
e XVIII
Issue
VII
Ver
sion
I(
)E

middle class, changing consumer demands mainly due to the western cultural influences, improvement of infrastructural facilities, technological advancements etc. Fashion retail industry is a renewed and imaging sector has performed significant market growth in Sri Lanka. It was almost non – existent about three years ago while today it is estimated that local retailers are receiving over 10 million us dollars annually. Though over the past few years, especially after war struggle, Sri Lankan fashion retail sector have promptly extended the number of retailers have improved. According to, 2003 global retail development index Sri Lanka titled as “Sri Lanka thriving with fresh investment” rank fifteenth with investment ranks fifteenth with market attractiveness of 16. 6%. In spirit fashion retail industry today is at a forefront of success due to the grabbed tourism market opportunities as well.
Since, the country classification of Clothing Exports, there is a high demand for Sri Lankan apparels to export in European countries including Netherlands, United Kingdom, Germany, Italy, Belgian, Australia, etc. and also similar demand in United Status America as well. Hong Kong, Canada, China, United Arab Emirates, Japan and are also the buyers of Sri Lankan apparels overseas who transport export pays to the country (Central Bank of Sri Lanka, 2017).
With the reputation of being a leading country that satisfy the world’s apparel needs, Sri Lankan garment industry proved that they satisfied the local market with their ability. When focus on the local markets there are some leading brands that concur the Sri Lankan fashion industry. Consider the local market there are some leading brands both international and local. Hence, in this study focus on the relationship between consumer brand experience and brand loyalty towards fashion retail industry according to the Sri Lankan concept.
Developing a strong brand identity and developing a memorable image is the key factors that maintain a company success. Effective branding builds a better reputation, quickly identifying over competitors and improve value of the organization (Workhouse, 2018). It is positively influence the customers purchasing decisions. So branding is the significant aspect in the marketing world but it may be happening many challenges. Even the most tailored brands face lot of troubles to change the market place and industry. In order to truly be a success, a brand wants to have its very own special niche or subcategory inside its industry. This does not definitely need to be another product or service, yet simply something that makes it emerge from different rivals in the commercial center. An organization could tailor their products and services and marketing strategies toward a specific niche.
Today brand experience has turned into a vital factor for the achievement of organizations. Business associations have started to consider customer
experience with their brands beyond customer satisfaction. In marketing literature, the notion of experience has been examined from contrasting frame of references such as situations where customer experience on consumption, product, aesthetic, service and shopping. One more research area was brand experience (Baser, Cintamur, Arslan, 2015).
For confirmatory factors of brand experiences, many researchers follow the four-factor model which is considered as the best model with correlated factors. Based on Brakus, Schmitt & Zarantonello research in 2009, they have examined six studies to prove the reliability, validity, and distinctiveness of the four-factor model. Therefore, sensory, effective intellectual and behavioral responses awaken by brands formulated the entire concept of brand experience. The four-factor model focuses the situation where consumers search, shop and consume the product due to the fact that experiences are tend to enter one’s mind while connecting with the brand itself. Further brand experience directly affects to consumer’s brand trust and loyalty to build the emotional bond between consumer and brand.
II. Literature Review
Business
and
marketing
practices
have
attracted
by
the
concept
of
brand
experience
remarkably
within
recent
period
of
time.
Marketing
practitioners have
come
to
perceive
that
awareness
that
seeing
how
customers
encounter
brands
are
in
the
balance for
expanding
marketing
procedures
for
good
and services.
(Brakus,
Schmitt
and
Zarantonello,
2009).
Moreover,
researches
have
shown
that
Brand
Experience as
very
pinnacle
of
fundamental
factor
in
maintaining the
brand
within
the
customer
mind.
In order
to
cater
to
the
changing
culture
of
the
market environments,
traditional
marketing
is
no
longer
a
solution.
Hence
the
businesses
achieve
the
opportunity to
act
on
a far
broader
context
with
the
shift
of
experiential
marketing.
Theoretically,
experiential
marketing
is
the
contradictory
side
of
traditional
marketing.
While
experiential
showcasing
considers
customers
as
a
judicious
and
passionate
being
who
take interest
in
accomplishing
pleasurable
experiences,
conventional
marketers
understands
buyers
as
balanced
leaders
who
concerned
practical
highlights
and advantages
(Schmitt
B.,
1999).
According to
the
Schmitt
B.
(1999)
contemplate
on experiential
marketing,
there
are
five
distinct
kinds
of
experience
modules
that
organization
can
create
including;
‘sensory
experience,
affective
experience,
creative
cognitive
experience,
physical
experience
(behavior and
lifestyle)
and
social-identity
experience’.
(p. 62).
As
for
the
brand
concerns,
with
greater
extension of
brands,
it has
no
longer
‘just'
a product
or
© 2018 Global Journals1
48
Year
2018
Globa
l Jo
urna
l of M
anag
emen
t an
d Bu
siness Resea
rch
Volum
e XVIII
Issue
VII
Ver
sion
I(
)E
Effects of Brand Experience on Consumer Brand Loyalty in Fashion Retail Industry: Moderating the Role of Gender

service but a mean of providing the customer experience.
As the principal scholastics to conceptualize and measure the experiential elements of brand, in Brakus, Schmitt and Zarantonello's examination, hey have characterized brand experience as the personalized internal reactions of customers evoked by stimuluses related to a brand. Further, they demonstrate that bran encounter comprised of four measurements; sensory experience, affective experience, intellectual experience, and behavioral experience. Therefore, within a holistic view of experiential marketing, it is evidential that marketers provide the majority of experience to their customer through their brands.
III. Dimension of Brand Experience
a) Sensory Experience It simply refers to the senses evoked by the
brand itself, whereas outlook, colors, texture, design can be considering as stimuli in the apparel industry. This aesthetics of the products and brand make customer interested and influence to their purchase decision. ‘Brand experience related sensory organs can be identify as sensation induced by brand associated stimuli that are part of a brand’s design and identity, packaging, communications, and surrounding’ (Hepola, et al., 2017: p.285). As a loyal customer involve and contact with the brand at every moment. It is the first time when the customer involves towards the brand that are created by the sensory organs.
‘Consumers can easier to store visual stimuli in their minds due to the catching images as information and data about related products. Experience related to human sense organize individuals’ beliefs, their feelings, and opinions about the brand which allows consumers to form mental formations and consumer’s perceptions of applicable brand communications and inputs’ (Huang, et al., 2015: p.132).
‘Most academic research has found that variance of sensory information and data affect customer behavior and perception, feelings towards goods and services. Sight is the most influential human sense for discovering changes and differences in the human surrounding and is the most powerful and major sense type in perceiving goods and services’ (Hulten, 2010: p.259).
b) Affective Experience
This dimension considers the customers’
emotion and the association with the brand.
Zarantonello and Schmitt (2010) mentioned that
affective dimension includes the feelings generated by
the brand and its emotional bond with the customer.
‘Mostly high end shopping of fashion products can gain
high consumer engagement towards themselves and it
tend to have a desire to demonstrate positive affective
consumer experience such as cheerfulness,
contentment or relaxation’(Huong, Hong and Khai, 2015). ‘Effective experience, which is deeply concentrated and embedded in consumers’ minds automatically, is able to cause consumers’ feelings and emotions’ (Huang, et al.,2015: p.132). It can be generated during product and services consumption stage. Through the encouraging of emotional and effective experiences, the consumer brand relationship can be strengthened. Because stronger emotions towards product or service are resistant to change towards the opposite end of the emotion continuum, such as changing from positive to negative or from negative to positive (Huang, et al., 2015: p.132). Effective experience replicate consumers brand estimation and result in strong consumer relationship towards the brands. ‘As highlighted of marketing has moved from deals to consumer relationships it is natural that effective commitment, being an emotional element, has received more consideration from researches than continues commitment has in recent years.
c) Intellectual Experience Generally, the intellectual dimension involves
the ‘ability of the brand to engage consumers’ convergent and divergent thinking’ (Baser, Cintamur, and Arslan, 2015: p. 106). Pham Thi Lan Huong et al. (2015) have mentioned that intellectual experience as a mean of learning orientation. Besides in the fashion retail industry, it is observed as that shopping background allowed buyers to shape the unmistakable impression of the brand.
In Schmitt B. (1999) experiential marketing perspective, marketers appeal to reason with the goal of making subjective, critical thinking knowledge that draws in client inventively through surprise, intriguer and provocation. Solely depending on the emotional factors will not prevail customer from the competition. The methods of reaching information are far more beyond imagination which has to create highly knowledgeable customers. Further intellectual thinking is known to common for new technology products, yet it has also used from the product design to retailing and communication in other industries.
d) Behavioral Experience As it names behavioral dimension concerns with
the customers' reaction and behaviors towards a particular brand including physical expressions, lifestyle, and interaction with the brand. (Baser, Cintamur, and Arslan, 2015). The experience can be either generated when a person shops or use a product or services. Based on the Plam Thi Lan Hong et al. (2015) study, in the context of foreign research, this dimension has gained less attention compared to others. On top of that relating to the fashion industry, the researchers noted that high-class outfits explore both worthy conduct of the wearer and his or her correspondence style inspect by others.
© 2018 Global Journals
49
Year
2018
Globa
l Jo
urna
l of M
anag
emen
t an
d Bu
siness Resea
rch
Volum
e XVIII
Issue
VII
Ver
sion
I(
)E
Effects of Brand Experience on Consumer Brand Loyalty in Fashion Retail Industry: Moderating the Role of Gender

In other perspective, marketers try to adhere to this experience by targeting customers’ lives through physical experience with the alternative lifestyle. Business use of the rational approach to change how the customer behaves is one of many paths. ‘Changes in lifestyle and behaviors are often more motivational, inspirational and emotional in nature and often motivated by role models’ (Schmitt, 1999: p.62).
e) Consumer Brand Loyalty Corporations use attractive marketing tactics,
such as loyalty or rewards programs, trials, incentives like free samples to build brand loyalty and brand ambassadors. Hänninen et al. paper on ‘’ the effect of marketing communication on business relationship loyalty” (Hänninen, Nora; Karjaluoto and Heikki, 2017) discusses how the communication channels effect the customer brand loyalty. The consequence was the communication channel efficiency had better importance as a mediator between loyalty and perceived value.
Brand loyalty refers to a strong internal attitude toward a mark which adds to buyers' mental connections toward the brand and the organization. The type of behavioral loyalty is a consumer’s response expressed over time with some decision-making process involved (Ran Huang Stacy H Lee HaeJung Kim Leslie Evans, 2015).
Most researchers concur that brand loyalty can make firm advantages, for example, diminished advertising costs (Chaudhuri and Holbrook, 2001) and when the company has a good brand name with loyal customers help to gain the competitive advantage in the market. Brand experience is considered as a measure of brand loyalty, like a superior brand experience of a customer will lead the customer to prefer this brand in the future (Brakus et al., 2009), where the brand would have deposited in the mind of the customer. The literature has also shown that brand experience can be seen as a two-way influence which is direct and indirect influence on loyalty, and the brand engagement has been described as an intermediary between experience and loyalty.
f) Consumers’ Gender Considering about the gender as a moderating
variable, this has a crucial part in the behavior of the consumers. As stated by Jin, Koh, and Lee(2015) study, male and female purchasers experience distinctive arrangement process when creating reliability towards attire brands. Gender is considered as a social identify construct and it is known to influence men and female with specific characteristics such as roles, values, attitudes, perception, preferences, and behaviors (Chung K., Yu J., Kim W., and Shin J., 2015). In other perspective, gender differences exist due to the biological, cognitive, behavioral and social cause; thus it becomes a notable influencing variable.
Generally, the cultural and growing background variances form the different characteristics associated with male and female. For example, Females age more than 60, stay at home looking for their grandchildren may be a similar scenario for Southern Asian countries. Contrary to the same demographic category in European country might be very outgoing and sociable. Therefore, the issue addressed by the Schmitt B. can be related to the gender differences in a nation in relation to the experience as well. As stated by Sivaraj and Sritharan (2014) Females involve greatly and vigorously in recall process of emotional events, real-world experiences and involved more in purchasing activities than males. Further stated that women tend to have more loyalty to service performances while men considered having more loyalty to product performance.
The connection is observed to be more grounded for guys when contrasted with females. As such, if guys get great e-tail brand understanding, they turned out to be more brand loyal than females. Consequently, analysts infer that as a vital discovering which features the significance of brand understanding and trust in internet retailing.
Based on a study conducted by Clef et al. (2013); The correlation between intellectual and behavioral dimension and consumer loyalty could not be verified. The empirical study was directed towards the Adidas sportswear brand, and they conclude that a positive relationship between experience and satisfaction is coming from sensory and affective dimensions while intellectual and behavioral elements represent lower significance.
It can be stated that eventually this result directly affects the brand experience and brand loyalty relationship since buyers’ satisfaction is manipulated between brand experience and consumer brand loyalty in the study.
On account of the results from previous studies, it is evidential that the four-factor model proposed by Brakus et al. (2009) may differ from industry to industry.
IV. Problem Statement and
Conceptualization
In the commercial center, brands are exceedingly critical because of the reason it speaks to the associations' responsibilities to their clients. As a result of in the most recent decade, advertisers have understood the significance of making a solid brand to have the capacity to separate in a forceful market. Be that as it may, having a solid brand is not anymore enough to make due over the long haul and gain an extensive customer base. Particularly in the fashion retail industry where numerous items satisfy a similar requirement of the customer, made it necessary for organizations to adjust to changes in the market and reach the attention of the market. The circumstance has
© 2018 Global Journals1
50
Year
2018
Globa
l Jo
urna
l of M
anag
emen
t an
d Bu
siness Resea
rch
Volum
e XVIII
Issue
VII
Ver
sion
I(
)E
Effects of Brand Experience on Consumer Brand Loyalty in Fashion Retail Industry: Moderating the Role of Gender

prompted a wide assortment of brands that can be found and expanded rivalry.
Practically the number of international brands within the country is increasing day by day while providing consumers with more brand choices. Eventually it has become far more difficult to gain customer loyalty towards one preferred brand specifically for a long time.
Consequently, the customer-brand relationship has become a key factor for building a continuing relationship in the commercial world. Nowadays the marketers often well-structured to provide customers with a superior experience, in the expectation of affecting the customers' choices and give them a rich client experience to reinforce the estimation of the brand.
Specifically moderating factor as gender is one of the most significant elements for fashion marketers due to its role in segmenting the whole market environment. With the intention of facing the intense competition, effective differentiation is essential in targeting consumers. Hence, to establish a long-term relationship with these factors that are important for marketers that are directing at understanding market preferences and gaining brand loyalty from their customers.
a) Research Objectives The following objectives are expected to
achieve within the research findings.
1. To determine the relationship between brand experience and customer loyalty in the fashion retail industry.
The supporting sub-objectives will be addressed under the first main objective.
• To determine the relationship of sensory experience towards the brand loyalty.
• To determine the relationship of affective experience towards the brand loyalty.
• To determine the relationship of intellectual
experience towards the brand loyalty.
• To determine the relationship of behavioral
experience towards the brand loyalty.
2.
To
examine
the
gender
moderation
within
the
relationship
between
brand
experience
and
consumer brand
loyalty
in
the
fashion
retail
industry.
b)
Conceptual Framework
The
frame
of
the
study
shows
in
Figure
1
illustrate
the
variables
and
relationship
between
the
variables and
outlined
by
the
hypothesis
developed
in
the preceding
research.
Figure
1
© 2018 Global Journals
51
Year
2018
Globa
l Jo
urna
l of M
anag
emen
t an
d Bu
siness Resea
rch
Volum
e XVIII
Issue
VII
Ver
sion
I(
)E
Effects of Brand Experience on Consumer Brand Loyalty in Fashion Retail Industry: Moderating the Role of Gender
H1: There is a relationship between Brand Experience and Consumer Brand Loyalty.
H2: Sensory brand experience has an influences Consumer Brand Loyalty.
H3: Affective brand experience has an influence on Consumer Brand Loyalty.
H4: Intellectual Experience has an influence on Consumer Brand Loyalty.
H5: Behavioral Experience has an influence on Consumer Brand Loyalty.
H6: Consumers' gender moderates the relationship between Brand Experience and Consumer Brand Loyalty.
V. Data and Methodology
a) Data and Sample The researchers gathered both first hand and
secondary source of information yet primary source will be the data that collected from Sri Lankan consumer at a micro level to increase the validity of the study. The focus of the research is in the urban area of the country where the fashion retail industry is more competitive. With the purpose of improving the reliability and the validity of the study towards the research setting, the research will be used both quantitative and qualitative data which will be analyzed respectively. Based on the theoretical definition of the population, researches plan to focus on the female and male consumers who engaged with fashion brands within Colombo district in Sri Lanka. Further, a sample is defined as a subset of the population which generalize and represent the characteristics of the population. To accomplish the target of the examination, researchers embraced both a subjective and quantitative methodology as the exploration system for the investigation. The information for the investigation will be gathered through a pilot survey and well-developed questionnaire. This study which is on Fashion Retail industry is bound to complete within several months hence it is short-term research. Hence the researchers chosen cross-sectional examination to directing the exploration.To proceed with the research, convenient sampling method will be selected, because considering the huge customers base of fashion retail industry, it is not that easy to get information from each customer. In order to gather adequate information from such a vast population within a short time period, research sample should be easily reachable. During the research, relevant details will be gathered from around 250 participants out of the focused population.
b) Method of Data Collection During the pre-study of the research, 20
participants were selected accordingly ten from each gender. The pre-study was used to identify the most
popular brand among the different age groups. In order to complete the pre-study, explanation on research study and concept was given by researchers to the participants. Odel, Levis, Gflock, Boss and Fashion Bug were selected from the list of 10 fashion brands since researchers cannot afford to cover all fashion brands available in Colombo district.
A survey is scheduled to conduct in two stages including a pilot questionnaire and revised questionnaire during the research. The first stage is completed by using 30 participants consisting of 15 males and 15 females. Further the results generated from pre-study was used as input to the pilot survey questionnaire. Popular brands among customers and the reliability of the questionnaire is confirmed during the pilot survey. The revised questionnaire will be used to examine the connection between brand experience and loyalty of consumers by directing variable of buyers' gender.
The questionnaire will contain with descriptive and relational questions to find customer engagement and responses towards the brands. By considering the demographic factor of gender difference, the questionnaire will be distributed among 250 participants with the intention of covering at least 50 customers from each brand. The face validity of questions included in the questionnaire was checked, and following questions are subjective covers the concepts proposed to measure.
VI. Result and Discussion
a) Descriptive analysis As highlighted by Khan I. and Rahman Z.
(2016), Nunnally (1978) stated that the construct of the study builds to cover the theories are reliable if The Cronbach's α estimations of each develop item extended from 0.78 to 0.84, which is well over the prescribed dimension of 0.70.
Since the relative results of the study by displaying the constructive items are over the .84 except for the brand loyalty construct which resulted as .83. Hence the study has resulted beyond the recommended level that confirms the reliability of the research.
Majority of customers resulting 53%, do not ready to spent more than 10 000 Sri Lankan Rupees on fashion brands. In different point, customers seek the premium quality as characteristics but for the affordable price ranges. In addition, the customers who claimed that willingness to pay more than 20 000 Sri Lankan Rupees resulted only 2.63%.
Besides considerably higher proportion of participants resulting 33%, were ready to spend within the price range of less than 5000 Sri Lankan Rupees where we can conclude that willingness to invest is at the lower level compared to the customer expectations.
Table 1 represent the details of construct and measurements items along with the descriptive of the
© 2018 Global Journals1
52
Year
2018
Globa
l Jo
urna
l of M
anag
emen
t an
d Bu
siness Resea
rch
Volum
e XVIII
Issue
VII
Ver
sion
I(
)E
Effects of Brand Experience on Consumer Brand Loyalty in Fashion Retail Industry: Moderating the Role of Gender
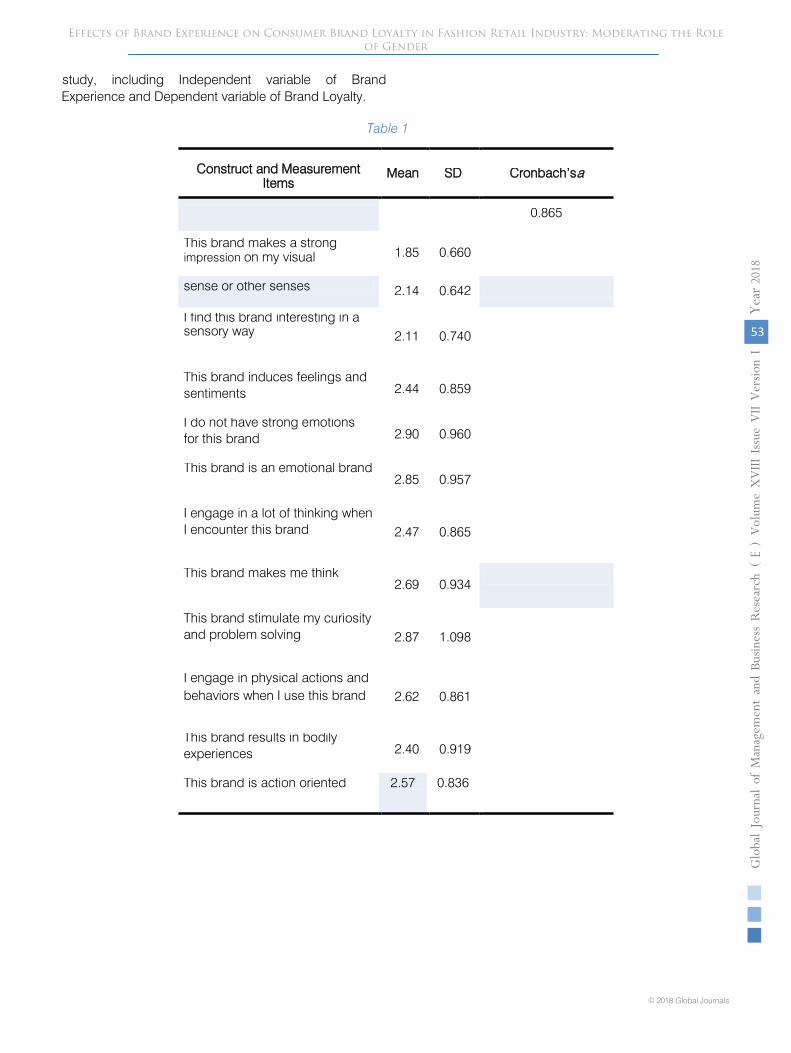
study, including Independent variable of Brand Experience and Dependent variable of Brand Loyalty.
Table 1
© 2018 Global Journals
53
Year
2018
Globa
l Jo
urna
l of M
anag
emen
t an
d Bu
siness Resea
rch
Volum
e XVIII
Issue
VII
Ver
sion
I(
)E
Effects of Brand Experience on Consumer Brand Loyalty in Fashion Retail Industry: Moderating the Role of Gender
Construct and MeasurementItems
Mean SD Cronbach’sa
0.865
This brand makes a strongimpression on my visual 1.85 0.660
sense or other senses 2.14 0.642
I find this brand interesting in asensory way 2.11 0.740
This brand induces feelings andsentiments 2.44 0.859
I do not have strong emotionsfor this brand 2.90 0.960
This brand is an emotional brand2.85 0.957
I engage in a lot of thinking whenI encounter this brand 2.47 0.865
This brand makes me think2.69 0.934
2.87 1.098
I engage in physical actions andbehaviors when I use this brand 2.62 0.861
This brand results in bodilyexperiences 2.40 0.919
This brand is action oriented 2.57 0.836
This brand stimulate my curiosityand problem solving
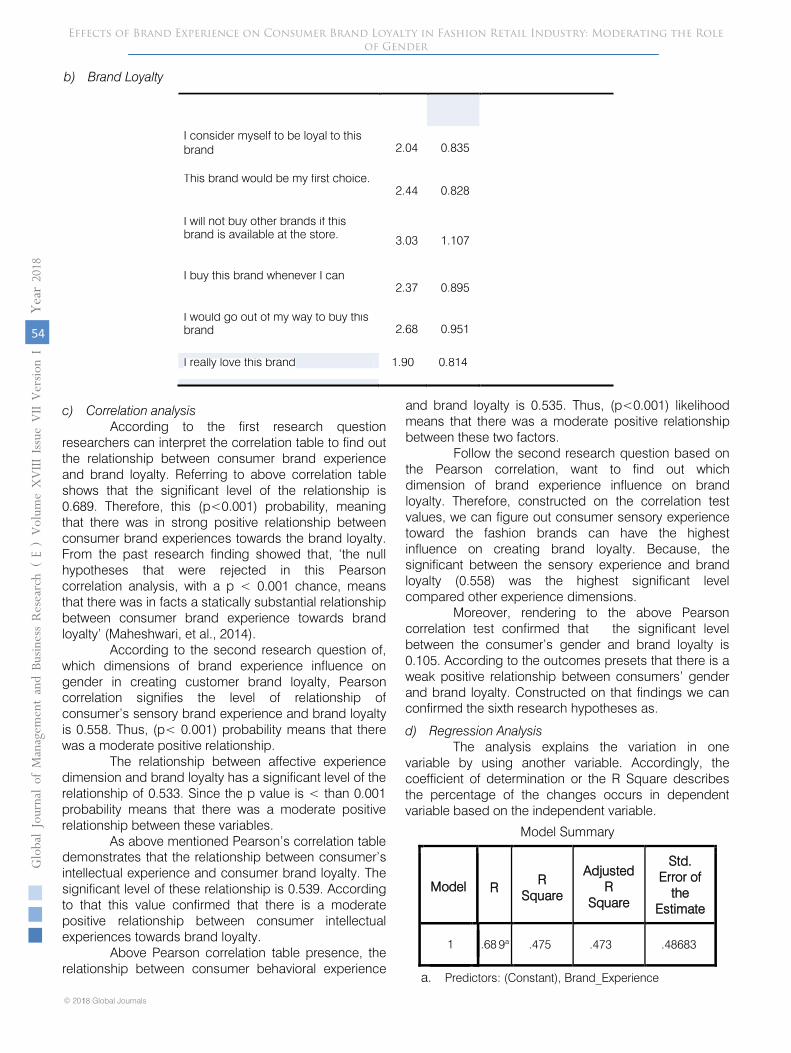
54
Year
2018
Globa
l Jo
urna
l of M
anag
emen
t an
d Bu
siness Resea
rch
Volum
e XVIII
Issue
VII
Ver
sion
I(
)E
Effects of Brand Experience on Consumer Brand Loyalty in Fashion Retail Industry: Moderating the Role of Gender
b) Brand Loyalty
I consider myself to be loyal to thisbrand 2.04 0.835
This brand would be my first choice.2.44 0.828
I will not buy other brands if thisbrand is available at the store. 3.03 1.107
I buy this brand whenever I can2.37 0.895
I would go out of my way to buy thisbrand 2.68 0.951
I really love this brand
c) Correlation analysisAccording to the first research question
researchers can interpret the correlation table to find outthe relationship between consumer brand experienceand brand loyalty. Referring to above correlation tableshows that the significant level of the relationship is0.689. Therefore, this (p<0.001) probability, meaningthat there was in strong positive relationship betweenconsumer brand experiences towards the brand loyalty.From the past research finding showed that, ‘the nullhypotheses that were rejected in this Pearsoncorrelation analysis, with a p < 0.001 chance, meansthat there was in facts a statically substantial relationshipbetween consumer brand experience towards brandloyalty’ (Maheshwari, et al., 2014).
According to the second research question of,which dimensions of brand experience influence ongender in creating customer brand loyalty, Pearsoncorrelation signifies the level of relationship ofconsumer’s sensory brand experience and brand loyaltyis 0.558. Thus, (p< 0.001) probability means that therewas a moderate positive relationship.
The relationship between affective experiencedimension and brand loyalty has a significant level of therelationship of 0.533. Since the p value is < than 0.001probability means that there was a moderate positiverelationship between these variables.
As above mentioned Pearson’s correlation tabledemonstrates that the relationship between consumer’sintellectual experience and consumer brand loyalty. Thesignificant level of these relationship is 0.539. Accordingto that this value confirmed that there is a moderatepositive relationship between consumer intellectualexperiences towards brand loyalty.
Above Pearson correlation table presence, therelationship between consumer behavioral experience
and brand loyalty is 0.535. Thus, (p<0.001) likelihoodmeans that there was a moderate positive relationshipbetween these two factors.
Follow the second research question based onthe Pearson correlation, want to find out whichdimension of brand experience influence on brandloyalty. Therefore, constructed on the correlation testvalues, we can figure out consumer sensory experiencetoward the fashion brands can have the highestinfluence on creating brand loyalty. Because, thesignificant between the sensory experience and brandloyalty (0.558) was the highest significant levelcompared other experience dimensions.
Moreover, rendering to the above Pearsoncorrelation test confirmed that the significant levelbetween the consumer’s gender and brand loyalty is0.105. According to the outcomes presets that there is aweak positive relationship between consumers’ genderand brand loyalty. Constructed on that findings we canconfirmed the sixth research hypotheses as.
d) Regression AnalysisThe analysis explains the variation in one
variable by using another variable. Accordingly, thecoefficient of determination or the R Square describesthe percentage of the changes occurs in dependentvariable based on the independent variable.
Model Summary
Model RR
Square
AdjustedR
Square
Std.Error of
theEstimate
1 .475 .473 .48683
© 2018 Global Journals1
1.90 0.814
.68 9a
a. Predictors: (Constant), Brand_Experience

© 2018 Global Journals
55
Year
2018
Globa
l Jo
urna
l of M
anag
emen
t an
d Bu
siness Resea
rch
Volum
e XVIII
Issue
VII
Ver
sion
I(
)E
Therefore 48% of variation occurs in BrandLoyalty which can explained by Brand experience ofconsumers. Due to the fact that the percentage is belowthe 50%, the relationship is moderately strengthen.
Y = b0 + b1 x1 + b0 + b1 x2…b0…b1 xn.
Brand Loyalty= f (Sensory, Affective, Intellectual,Behavioral).
Brand Loyalty (Y) = .241 + .304 (SE) + .251 (AE) + .123(IE) + .213 (BE) + e
Accordingly, the Sensory experience on brandsresults p= 0.000, Affective experience on brands gainedp= 0.000, Intellectual experience on Brands gained p=0.008 and Behavioral Experience on brands showed p= 0.000. Comparatively the mentioned four results aremore than 0.050 which indicate the collective influenceof brand loyalty.
e) ANOVA analysisTo monitor the whether Consumers’ gender
moderates the relationship between Brand Experienceand Consumer Brand Loyalty, research hypothesis wasformulated that there is a significant due to consumer’sgender on the brand experience and brand loyaltyparallel to which a null hypothesis was formulated thatstated the opposite of the hypotheses.
Consumers’ gender moderates the relationshipbetween Brand Experience and Consumer BrandLoyalty. The p value (denoted by “Sig.”) is .000 in bothAnova tables. Because of P value is lower thansignificant value of 0.05 there for, Consumers’ gendermoderates the relationship between Brand Experienceand Consumer Brand Loyalty.
There is a relationship between brandexperience and consumer brand loyalty
PositivelyAccepted
Sensory brand experience has an influence ona consumer brand loyalty
PositivelyAccepted
Affective brand experience has an influence onconsumer brand loyalty
PositivelyAccepted
Intellectual experience has an influence onconsumer brand loyalty
PositivelyAccepted
Behavioral experience has an influence onconsumer brand loyalty
PositivelyAccepted
Consumers gender moderates the relationshipbetween brand experience and consumerbrand loyalty
Accepted
Figure 2
f) Word CloudBased on the qualitative results the word cloud
depicts the participants’ opinions with relating to theselecting brands of their choice. The size of the wordsincluded in the Figure explain the frequency of theworlds utilized to shows the experiences of theconsumers. Besides the size, thickness and colors ofthe words represent the words according to the majority.Hence the ‘High Quality’ can be identify as a mainsignificance factor for customer to remain with the brandand creating long term relationships.
VII. Conclusion
This study provides empirical evidence on therelationship among consumer brand experience andbrand loyalty in Sri Lankan fashion retail industry. Thisstudy also attempt to determine the moderating role ofgender on the relationship that consumer brandexperience and brand loyalty. To achieve the abovementioned research objectives, the study proposed sixhypotheses and empirically examined them. Findings ofthe study suggest a significant impact of consumerbrand experience on brand loyalty. The study alsoconfirmed that gender acts as a moderator in therelationship that consumer brand experience and brandloyalty in fashion retail industry.
Nevertheless, the study has some limitationswhich give important directions for future research. First,the study considered that sample size of the studywhich comparatively small with the other relatedliterature studies. Further the sample only focus on theurban area of Colombo which is one of main city. Evensample of 266 participant was not sufficient to reachevery area of Colombo City. Furthermore the studyutilized the convenient sampling technique to gatherrelevant data pertaining only the most reachableparticipants. Researchers considered the mentionedmethod was appropriated for the study due to the timelimitation. However in order to develop moregeneralizable research study Random sampling wouldbe more applicable in collecting the data. The study
Effects of Brand Experience on Consumer Brand Loyalty in Fashion Retail Industry: Moderating the Role of Gender

Effects of Brand Experience on Consumer Brand Loyalty in Fashion Retail Industry: Moderating the Role of Gender
© 2018 Global Journals1
56
Year
2018
Globa
l Jo
urna
l of M
anag
emen
t an
d Bu
siness Resea
rch
Volum
e XVIII
Issue
VII
Ver
sion
I(
)E
contains only five fashion brands in the Sri Lankanmarket to understand the customer perception on theresearch problem. The brands were examined throughcross sectional study where the effect on brandexperience and brand loyalty was analyzed within shorttime period. It will be appropriate to consider morebrands to gain deeper understanding on customers’behavior towards brand.
References Références Referencias
1. Bapat, D., 2016. Impact of brand familiarity onbrand experience dimensions for financial servicebrands. p. 639-p.640.
2. Brakus, J.J., Schmitt, B.H. & Zarantonello, L. (2009)Brand Experience:What Is It? How Is It Measured?Does It Affect Loyalty? Journal of Marketing, 73, 52-68.
3. Brakus, J.J., Schmitt, B.H. & Zhang, S. (2008)Experiential Attributes and Consumer Judgement. In: Schmitt B.H., Rogers, D.L. (eds.) Handbook onBrand and Experience Management. Cheltenham,United Kingdom, Edward Elgar, pp.174-187.
4. Chung, K.H., Yu, J.E, Kim, W.J. & Shin, J.I. (2015)The Effect of Perceived Value on Customer Loyaltyin a Low-Priced Cosmetic Brand of South Korea:The Moderating Effect of Gender. AdvancedScience and Technology Letters, 114, 40-44.
5. Cleff, T., Dorr, S. Vicknair, A. & Walter, N. (2013)Brand Experience - How It Relates to BrandPersonality, Consumer Satisfaction and consumerLoyalty. An Empirical Analysis of the Adidas Brand.Interdisciplinary Management Research, 9, 731-754.
6. Hanninen, N. & Karjaluoto, H. (2017) The Effect ofMarketing Communication on Business Relationshiployalty. Marketing Intelligence & Planning, 35 (4), 1-35.
7. Hepola, J., Karjaluoto, H., &Hintikka, A. (2017) TheEffect of Sensory Brand Experience andInvolvement on Brand Equity Directly and Indirectlythrough Consumer Brand Engagement. Journal ofProduct and Brand Management, 26 (3), 282-293.
8. Huang, R., Lee, S., Kim, H.J. & Evans, L. (2015) TheImpact of Brand Experience on Brand Response inMulti-Channel Fashion Retailing. Journal ofResearch in Interactive Marketing, 9 (2), 129-147.
9. Huong, P.T., Hong, N.T. & Khai, T.T. (2015) Effectsof Brand Experience on Brand Loyalty in FashionRetail Business. Journal of EconomicDevelopment.73-88.
10. Hulten, B., 2010. Sensory marketing: the multisensory brand-experience concept, Journal ofMarketing Management, 75-86.
11. Khan, I. & Rahman, Z. (2016) E-tail BrandExperience’s Influence on E-brand Trust and E-brand Loyalty. International Journal of Retail &Distribution Management, 44 (6), 588-606.
12. Kruger, L.M. (2016) Brand Loyalty: Exploring SelfBrand Connection and Brand Experience. Journal ofProduct & Brand Management, 27 (2), 172-184.
13. Lindstrom, M., 2005. Broad sensory branding. p. 86.14. Lues, H.T. & Klerk, N. (2017) Gender Differences in
Brand Loyalty towards Fashion Brands amongGeneration Y Students. International Journal ofBusiness and Management Studies, 9 (2), 52-68.
15. Maheshwari, V., Lodorfos, G., & Jacobsen S. (2014)Determinants of Brand Loyalty: A Study of theExperience – Commitment - Loyalty Construct.International Journal of Business Administration, 5(6), 13-23.
16. Pollalis, Y. & Niros, M. (2016) Effects of BrandExperience on Brand Loyalty: The Moderating roleof Consumer Confidence. 4th InternationalConference on Contemporary Marketing Issues, 4,568-571.
17. Schmitt, B. (1999) Experiential Marketing. Journal ofMarketing Management, 15, 53-67.
18. Sekaran, U. (2003) Research Methods for Business -A Skill Building Approach. 4th Edition, NewYouk,United States of America, John Wiley & Sons, Inc.
19. Sekaran, U., & Bougie, R. (2010) Research Methodsfor Business: A Skill Building Approach. 5th Edition, Haddington, John Wiley & Sons, Inc.
20. Sivaraj, R. & Sritharan, V. (2014) Influence ofModerating Variables on Attachment, Brand Trustand Loyalty Relationship. International Journal ofEconomics, Commerce and Management, 2 (4),1-14.
21. Strategy Marketing & Technology Solutions (2017)Why Is Branding Important? Strategy New Media.[Online] Available from: https://strategynewmedia.com/why-is-branding-important/, (Accessed: 8 June2018).
22. Tansey, M. (2017) Fashion and Loyalty: An Analysisof Consumer Loyalty in the Clothing Industry, CardiffMetropolitan University.
23. Walter, N., Cleff, T. & Chu, G. (2013) BrandExperience’s Influence on Customer Satisfactionand Loyalty: A Mirage in Marketing Research.International Journal of Management Research andBusiness Strategy, 2 (1), 130-144.
24. Williams, J. (2018) The Basics of Branding.Entrepreneur Asia Pacific. [Online] Available from:https://www.entrepreneur.com/article/77408,(Accessed: 8 June 2018).
25. Wurkhouse, (2017) So What is Branding? And whyis it so Important for your Business? Wurkhouse.[Online] Available from: http://blog.wurkhouse.com/why-is-branding-important, (Accessed: 8 June2018).

Global Journals
Guidelines Handbook
2018
www.GlobalJournals.org

Fellows
Global Journals Incorporate (USA) is accredited by Open Association of Research Society (OARS), U.S.A and in turn, awards “FARSBA” title to individuals. The 'FARSBA' title is accorded to a selected professional after the approval of the Editor-in-
Chief/Editorial Board Members/Dean.
FARSBA accrediting is an honor. It authenticates your research activities. After recognition as FARSBA, you can add 'FARSBA' title with your name as you use this recognition as additional suffix to your status.
This will definitely enhance and add more value and repute to your name. You may use it on your professional Counseling Materials such as CV, Resume, and Visiting Card etc.
The following benefits can be availed by you only for next three years from the date of certification:
FARSBA designated members are entitled to avail a 40% discount while publishing their research papers (of a single author) with Global Journals Incorporation (USA), if the same is accepted by Editorial Board/Peer Reviewers. If you are a main author or co-author in case of multiple authors, you will be entitled to avail discount of 10%.
Once FARSBA title is accorded, the Fellow is authorized to organize a
symposium/seminar/conference on behalf of Global Journal Incorporation (USA).The Fellow can also participate in conference/seminar/symposium organized by another institution as representative of Global Journal. In both the cases, it is mandatory for him to discuss with us and obtain our consent.
You may join as member of the Editorial Board of Global Journals Incorporation (USA) after successful completion of three years as Fellow and as Peer Reviewer. In addition, it is also desirable that you should organize seminar/symposium/conference at least once.
We shall provide you intimation regarding launching of e-version of journal of your stream time to time.This may be utilized in your library for the enrichment of knowledge of your students as well as it can also be helpful for the concerned faculty members.
FELLOW OF ASSOCIATION OF RESEARCH SOCIETY IN BUSINESS (FARSB)
The “FARSB” is a dignified title which is accorded to a person’s name viz. Dr. John E. Hall, Ph.D., FARSBA or William Walldroff, M.S., FARSBA.
© Copyright by Global Journals | Guidelines Handbook
I

As FARSBA, you will be given a renowned, secure and free professional email address with 100 GB of space e.g. [email protected]. This will include Webmail, Spam Assassin, Email Forwarders,Auto-Responders, Email Delivery Route tracing, etc.
The FARSBA will be eligible for a free application of standardization of their researches. Standardization of research will be subject to acceptability within stipulated norms as the next step after publishing in a journal. We shall depute a team of specialized research professionals who will render their services for elevating your researches to next higher level, which is worldwide open standardization.
The FARSBA member can apply for grading and certification of standards of their educational and Institutional Degrees to Open Association of Research, Society U.S.A.Once you are designated as FARSBA, you may send us a scanned copy of all of your credentials. OARS will verify, grade and certify them. This will be based on your academic records, quality of research papers published by you, and some more criteria. After certification of all your credentials by OARS, they will be published on your Fellow Profile link on website https://associationofresearch.org which will be helpful to upgrade the dignity.
The FARSBA members can avail the benefits of free research podcasting in Global Research Radio with their research documents. After publishing the work, (including published elsewhere worldwide with proper authorization) you can upload your research paper with your recorded voice or you can utilize chargeable services of our professional RJs to record your paper in their voice on request.
The FARSBA member also entitled to get the benefits of free research podcasting of
their research documents through video clips. We can also streamline your conference videos and display your slides/ online slides and online research video clips at reasonable charges, on request.
The FARSBA can go through standards of OARS. You can also play vital role if you have
any suggestions so that proper amendment can take place to improve the same for the benefit of entire research community.
IIII
© Copyright by Global Journals | Guidelines Handbook

The ' MARSBA ' title is accorded to a selected professional after the approval of the
Editor-in-Chief / Editorial Board Members/Dean.
The “MARSBA” is a dignified ornament which is accorded to a person’s name viz. Dr.
John E. Hall, Ph.D., MARSBA or William Walldroff, M.S., MARSBA.
MARSB accrediting is an honor. It authenticates your research activities. After becoming MARSBA, you
can add 'MARSBA' title with your name as you use this recognition as additional suffix to your status.
This will definitely enhance and add more value and repute to your name. You may use it on your
professional Counseling Materials such as CV, Resume, Visiting Card and Name Plate etc.
The following benefitscan be availed by you only for next three years from the date of certification.
MARSBA designated members are entitled to avail a 25% discount while publishing
their research papers (of a single author) in Global Journals Inc., if the same is
accepted by our Editorial Board and Peer Reviewers. If you are a main author or co-
author of a group of authors, you will get discount of 10%.
As MARSBA, you will be given a renowned, secure and free professional email address
with 30 GB of space e.g. [email protected]. This will include Webmail, Spam
Assassin, Email Forwarders,Auto-Responders, Email Delivery Route tracing, etc.
MEMBER OF ASSOCIATION OF RESEARCH SOCIETY IN BUSINESS (MARSBA)
The FARSBA is eligible to earn from sales proceeds of his/her researches/reference/review Books or literature, while publishing with Global Journals. The FARSBA can decide whether he/she would like to publish his/her research in a closed manner. In this case, whenever readers purchase that individual research paper for reading, maximum 60% of its profit earned as royalty by Global Journals, will be credited to his/her bank account. The entire entitled amount will be credited to
his/her bank account exceeding limit of minimum fixed balance. There is no minimum time limit for collection. The FARSC member can decide its price and we can help in making the right decision.
The FARSBA member is eligible to join as a paid peer reviewer at Global Journals Incorporation (USA) and can get remuneration of 15% of author fees, taken from the author of a respective paper. After reviewing 5 or more papers you can request to transfer the amount to your bank account.
III
© Copyright by Global Journals | Guidelines Handbook

We shall provide you intimation regarding launching of e-version of journal of your
stream time to time.This may be utilized in your library for the enrichment of
knowledge of your students as well as it can also be helpful for the concerned faculty
members.
Once you are designated as MARSBA, you may send us a scanned copy of all of your
credentials. OARS will verify, grade and certify them. This will be based on your
academic records, quality of research papers published by you, and some more
criteria.
It is mandatory to read all terms and conditions carefully.
The MARSBA member can apply for approval, grading and certification of standards of
their educational and Institutional Degrees to Open Association of Research, Society
U.S.A.
© Copyright by Global Journals
IV
| Guidelines Handbook

Auxiliary Memberships
Institutional Fellow of Open Association of Research Society (USA)-OARS (USA)Global Journals Incorporation (USA) is accredited by Open Association of Research Society, U.S.A (OARS) and in turn, affiliates research institutions as “Institutional Fellow of Open Association of Research Society” (IFOARS).The “FARSC” is a dignified title which is accorded to a person’s name viz. Dr. John E. Hall, Ph.D., FARSC or William Walldroff, M.S., FARSC.The IFOARS institution is entitled to form a Board comprised of one Chairperson and three to five board members preferably from different streams. The Board will be recognized as “Institutional Board of Open Association of Research Society”-(IBOARS).
The Institute will be entitled to following benefits:
The IBOARS can initially review research papers of their institute and recommend them to publish with respective journal of Global Journals. It can also review the papers of other institutions after obtaining our consent. The second review will be done by peer reviewer of Global Journals Incorporation (USA) The Board is at liberty to appoint a peer reviewer with the approval of chairperson after consulting us. The author fees of such paper may be waived off up to 40%.
The Global Journals Incorporation (USA) at its discretion can also refer double blind peer reviewed paper at their end to the board for the verification and to get recommendation for final stage of acceptance of publication.
The IBOARS can organize symposium/seminar/conference in their country on behalf of Global Journals Incorporation (USA)-OARS (USA). The terms and conditions can be discussed separately.
The Board can also play vital role by exploring and giving valuable suggestions regarding the Standards of “Open Association of Research Society, U.S.A (OARS)” so that proper amendment can take place for the benefit of entire research community. We shall provide details of particular standard only on receipt of request from the Board.
The board members can also join us as Individual Fellow with 40% discount on total fees applicable to Individual Fellow. They will be entitled to avail all the benefits as declared. Please visit Individual Fellow-sub menu of GlobalJournals.org to have more relevant details.
V
© Copyright by Global Journals | Guidelines Handbook

We shall provide you intimation regarding launching of e-version of journal of your stream time to time. This may be utilized in your library for the enrichment of knowledge of your students as well as it can also be helpful for the concerned faculty members.
After nomination of your institution as “Institutional Fellow” and constantly functioning successfully for one year, we can consider giving recognition to your institute to function as Regional/Zonal office on our behalf.The board can also take up the additional allied activities for betterment after our consultation.
The following entitlements are applicable to individual Fellows:
Open Association of Research Society, U.S.A (OARS) By-laws states that an individual Fellow may use the designations as applicable, or the corresponding initials. The Credentials of individual Fellow and Associate designations signify that the individual has gained knowledge of the fundamental concepts. One is magnanimous and proficient in an expertise course covering the professional code of conduct, and follows recognized standards of practice.
Open Association of Research Society (US)/ Global Journals Incorporation (USA), as described in Corporate Statements, are educational, research publishing and professional membership organizations. Achieving our individual Fellow or Associate status is based mainly on meeting stated educational research requirements.
Disbursement of 40% Royalty earned through Global Journals : Researcher = 50%, Peer Reviewer = 37.50%, Institution = 12.50% E.g. Out of 40%, the 20% benefit should be passed on to researcher, 15 % benefit towards remuneration should be given to a reviewer and remaining 5% is to be retained by the institution.
We shall provide print version of 12 issues of any three journals [as per your requirement] out of our 38 journals worth $ 2376 USD.
© Copyright by Global Journals
Other:
The individual Fellow and Associate designations accredited by Open Association of Research Society (US) credentials signify guarantees following achievements:
The professional accredited with Fellow honor, is entitled to various benefits viz. name, fame, honor, regular flow of income, secured bright future, social status etc.
VI
| Guidelines Handbook

Note :
″
″
In addition to above, if one is single author, then entitled to 40% discount on publishing research paper and can get 10%discount if one is co-author or main author among group of authors.
The Fellow can organize symposium/seminar/conference on behalf of Global Journals Incorporation (USA) and he/she can also attend the same organized by other institutes on behalf of Global Journals.
The Fellow can become member of Editorial Board Member after completing 3yrs. The Fellow can earn 60% of sales proceeds from the sale of reference/review
books/literature/publishing of research paper. Fellow can also join as paid peer reviewer and earn 15% remuneration of author charges and
can also get an opportunity to join as member of the Editorial Board of Global Journals Incorporation (USA)
• This individual has learned the basic methods of applying those concepts and techniques to common challenging situations. This individual has further demonstrated an in–depth understanding of the application of suitable techniques to a particular area of research practice.
In future, if the board feels the necessity to change any board member, the same can be done with the consent of the chairperson along with anyone board member without our approval.
In case, the chairperson needs to be replaced then consent of 2/3rd board members are required and they are also required to jointly pass the resolution copy of which should be sent to us. In such case, it will be compulsory to obtain our approval before replacement.
In case of “Difference of Opinion [if any]” among the Board members, our decision will be final and binding to everyone.
VII
© Copyright by Global Journals | Guidelines Handbook

We accept the manuscript submissions in any standard (generic) format.
We typeset manuscripts using advanced typesetting tools like Adobe In Design, CorelDraw, TeXnicCenter, and TeXStudio. We usually recommend authors submit their research using any standard format they are comfortable with, and let Global Journals do the rest.
Authors should submit their complete paper/article, including text illustrations, graphics, conclusions, artwork, and tables. Authors who are not able to submit manuscript using the form above can email the manuscript department at [email protected] or get in touch with [email protected] if they wish to send the abstract before submission.
Before and during Submission
Authors must ensure the information provided during the submission of a paper is authentic. Please go through the following checklist before submitting:
1. Authors must go through the complete author guideline and understand and agree to Global Journals' ethics and code of conduct, along with author responsibilities.
2. Authors must accept the privacy policy, terms, and conditions of Global Journals. 3. Ensure corresponding author’s email address and postal address are accurate and reachable. 4. Manuscript to be submitted must include keywords, an abstract, a paper title, co-author(s') names and details (email
address, name, phone number, and institution), figures and illustrations in vector format including appropriate captions, tables, including titles and footnotes, a conclusion, results, acknowledgments and references.
5. Authors should submit paper in a ZIP archive if any supplementary files are required along with the paper. 6. Proper permissions must be acquired for the use of any copyrighted material. 7. Manuscript submitted must not have been submitted or published elsewhere and all authors must be aware of the
submission.
Declaration of Conflicts of Interest
It is required for authors to declare all financial, institutional, and personal relationships with other individuals and organizations that could influence (bias) their research.
Policy on Plagiarism
Plagiarism is not acceptable in Global Journals submissions at all.
Plagiarized content will not be considered for publication. We reserve the right to inform authors’ institutions about plagiarism detected either before or after publication. If plagiarism is identified, we will follow COPE guidelines:
Authors are solely responsible for all the plagiarism that is found. The author must not fabricate, falsify or plagiarize existing research data. The following, if copied, will be considered plagiarism:
• Words (language) • Ideas • Findings • Writings • Diagrams • Graphs • Illustrations • Lectures
© Copyright by Global Journals
Preferred Author Guidelines
VIII
| Guidelines Handbook
Alternatively, you can download our basic template from https://globaljournals.org/Template.zip

• Printed material • Graphic representations • Computer programs • Electronic material • Any other original work
Authorship Policies
Global Journals follows the definition of authorship set up by the Open Association of Research Society, USA. According to its guidelines, authorship criteria must be based on:
1. Substantial contributions to the conception and acquisition of data, analysis, and interpretation of findings. 2. Drafting the paper and revising it critically regarding important academic content. 3. Final approval of the version of the paper to be published.
Changes in Authorship
The corresponding author should mention the name and complete details of all co-authors during submission and in manuscript. We support addition, rearrangement, manipulation, and deletions in authors list till the early view publication of the journal. We expect that corresponding author will notify all co-authors of submission. We follow COPE guidelines for changes in authorship.
Copyright
During submission of the manuscript, the author is confirming an exclusive license agreement with Global Journals which gives Global Journals the authority to reproduce, reuse, and republish authors' research. We also believe in flexible copyright terms where copyright may remain with authors/employers/institutions as well. Contact your editor after acceptance to choose your copyright policy. You may follow this form for copyright transfers.
Appealing Decisions
Unless specified in the notification, the Editorial Board’s decision on publication of the paper is final and cannot be appealed before making the major change in the manuscript.
Acknowledgments
Contributors to the research other than authors credited should be mentioned in Acknowledgments. The source of funding for the research can be included. Suppliers of resources may be mentioned along with their addresses.
Declaration of funding sources
Global Journals is in partnership with various universities, laboratories, and other institutions worldwide in the research domain. Authors are requested to disclose their source of funding during every stage of their research, such as making analysis, performing laboratory operations, computing data, and using institutional resources, from writing an article to its submission. This will also help authors to get reimbursements by requesting an open access publication letter from Global Journals and submitting to the respective funding source.
Preparing your Manuscript
Authors can submit papers and articles in an acceptable file format: MS Word (doc, docx), LaTeX (.tex, .zip or .rar including all of your files), Adobe PDF (.pdf), rich text format (.rtf), simple text document (.txt), Open Document Text (.odt), and Apple Pages (.pages). Our professional layout editors will format the entire paper according to our official guidelines. This is one of the highlights of publishing with Global Journals—authors should not be concerned about the formatting of their paper. Global Journals accepts articles and manuscripts in every major language, be it Spanish, Chinese, Japanese, Portuguese, Russian, French, German, Dutch, Italian, Greek, or any other national language, but the title, subtitle, and abstract should be in English. This will facilitate indexing and the pre-peer review process.
The following is the official style and template developed for publication of a research paper. Authors are not required to follow this style during the submission of the paper. It is just for reference purposes.
© Copyright by Global Journals | Guidelines Handbook
IX

Manuscript Style Instruction (Optional)
• Microsoft Word Document Setting Instructions. • Font type of all text should be Swis721 Lt BT. • Page size: 8.27" x 11'”, left margin: 0.65, right margin: 0.65, bottom margin: 0.75. • Paper title should be in one column of font size 24. • Author name in font size of 11 in one column. • Abstract: font size 9 with the word “Abstract” in bold italics. • Main text: font size 10 with two justified columns. • Two columns with equal column width of 3.38 and spacing of 0.2. • First character must be three lines drop-capped. • The paragraph before spacing of 1 pt and after of 0 pt. • Line spacing of 1 pt. • Large images must be in one column. • The names of first main headings (Heading 1) must be in Roman font, capital letters, and font size of 10. • The names of second main headings (Heading 2) must not include numbers and must be in italics with a font size of 10.
Structure and Format of Manuscript
The recommended size of an original research paper is under 15,000 words and review papers under 7,000 words. Research articles should be less than 10,000 words. Research papers are usually longer than review papers. Review papers are reports of significant research (typically less than 7,000 words, including tables, figures, and references)
A research paper must include:
a) A title which should be relevant to the theme of the paper. b) A summary, known as an abstract (less than 150 words), containing the major results and conclusions. c) Up to 10 keywords that precisely identify the paper’s subject, purpose, and focus. d) An introduction, giving fundamental background objectives. e) Resources and techniques with sufficient complete experimental details (wherever possible by reference) to permit
repetition, sources of information must be given, and numerical methods must be specified by reference. f) Results which should be presented concisely by well-designed tables and figures. g) Suitable statistical data should also be given. h) All data must have been gathered with attention to numerical detail in the planning stage.
Design has been recognized to be essential to experiments for a considerable time, and the editor has decided that any paper that appears not to have adequate numerical treatments of the data will be returned unrefereed.
i) Discussion should cover implications and consequences and not just recapitulate the results; conclusions should also be summarized.
j) There should be brief acknowledgments. k) There ought to be references in the conventional format. Global Journals recommends APA format.
Authors should carefully consider the preparation of papers to ensure that they communicate effectively. Papers are much more likely to be accepted if they are carefully designed and laid out, contain few or no errors, are summarizing, and follow instructions. They will also be published with much fewer delays than those that require much technical and editorial correction.
The Editorial Board reserves the right to make literary corrections and suggestions to improve brevity.
© Copyright by Global Journals
X
| Guidelines Handbook

Format Structure
It is necessary that authors take care in submitting a manuscript that is written in simple language and adheres to published guidelines.
All manuscripts submitted to Global Journals should include:
Title
The title page must carry an informative title that reflects the content, a running title (less than 45 characters together with spaces), names of the authors and co-authors, and the place(s) where the work was carried out.
Author details
The full postal address of any related author(s) must be specified.
Abstract
The abstract is the foundation of the research paper. It should be clear and concise and must contain the objective of the paper and inferences drawn. It is advised to not include big mathematical equations or complicated jargon.
Many researchers searching for information online will use search engines such as Google, Yahoo or others. By optimizing your paper for search engines, you will amplify the chance of someone finding it. In turn, this will make it more likely to be viewed and cited in further works. Global Journals has compiled these guidelines to facilitate you to maximize the web-friendliness of the most public part of your paper.
Keywords
A major lynchpin of research work for the writing of research papers is the keyword search, which one will employ to find both library and internet resources. Up to eleven keywords or very brief phrases have to be given to help data retrieval, mining, and indexing.
One must be persistent and creative in using keywords. An effective keyword search requires a strategy: planning of a list of possible keywords and phrases to try.
Choice of the main keywords is the first tool of writing a research paper. Research paper writing is an art. Keyword search should be as strategic as possible.
One should start brainstorming lists of potential keywords before even beginning searching. Think about the most important concepts related to research work. Ask, “What words would a source have to include to be truly valuable in a research paper?” Then consider synonyms for the important words.
It may take the discovery of only one important paper to steer in the right keyword direction because, in most databases, the keywords under which a research paper is abstracted are listed with the paper.
Numerical Methods
Numerical methods used should be transparent and, where appropriate, supported by references.
Abbreviations
Authors must list all the abbreviations used in the paper at the end of the paper or in a separate table before using them.
Formulas and equations
Authors are advised to submit any mathematical equation using either MathJax, KaTeX, or LaTeX, or in a very high-quality image. Tables, Figures, and Figure Legends
Tables: Tables should be cautiously designed, uncrowned, and include only essential data. Each must have an Arabic number, e.g., Table 4, a self-explanatory caption, and be on a separate sheet. Authors must submit tables in an editable format and not as images. References to these tables (if any) must be mentioned accurately.
© Copyright by Global Journals | Guidelines Handbook
XI

Figures
Figures are supposed to be submitted as separate files. Always include a citation in the text for each figure using Arabic numbers, e.g., Fig. 4. Artwork must be submitted online in vector electronic form or by emailing it.
Preparation of Eletronic Figures for Publication
Although low-quality images are sufficient for review purposes, print publication requires high-quality images to prevent the final product being blurred or fuzzy. Submit (possibly by e-mail) EPS (line art) or TIFF (halftone/ photographs) files only. MS PowerPoint and Word Graphics are unsuitable for printed pictures. Avoid using pixel-oriented software. Scans (TIFF only) should have a resolution of at least 350 dpi (halftone) or 700 to 1100 dpi (line drawings). Please give the data for figures in black and white or submit a Color Work Agreement form. EPS files must be saved with fonts embedded (and with a TIFF preview, if possible).
For scanned images, the scanning resolution at final image size ought to be as follows to ensure good reproduction: line art: >650 dpi; halftones (including gel photographs): >350 dpi; figures containing both halftone and line images: >650 dpi.
Color charges: Authors are advised to pay the full cost for the reproduction of their color artwork. Hence, please note that if there is color artwork in your manuscript when it is accepted for publication, we would require you to complete and return a Color Work Agreement form before your paper can be published. Also, you can email your editor to remove the color fee after acceptance of the paper.
Tips for writing a good quality Management Research Paper
Techniques for writing a good quality management and business research paper:
1. Choosing the topic: In most cases, the topic is selected by the interests of the author, but it can also be suggested by the guides. You can have several topics, and then judge which you are most comfortable with. This may be done by asking several questions of yourself, like "Will I be able to carry out a search in this area? Will I find all necessary resources to accomplish the search? Will I be able to find all information in this field area?" If the answer to this type of question is "yes," then you ought to choose that topic. In most cases, you may have to conduct surveys and visit several places. Also, you might have to do a lot of work to find all the rises and falls of the various data on that subject. Sometimes, detailed information plays a vital role, instead of short information. Evaluators are human: The first thing to remember is that evaluators are also human beings. They are not only meant for rejecting a paper. They are here to evaluate your paper. So present your best aspect.
2. Think like evaluators: If you are in confusion or getting demotivated because your paper may not be accepted by the evaluators, then think, and try to evaluate your paper like an evaluator. Try to understand what an evaluator wants in your research paper, and you will automatically have your answer. Make blueprints of paper: The outline is the plan or framework that will help you to arrange your thoughts. It will make your paper logical. But remember that all points of your outline must be related to the topic you have chosen.
3. Ask your guides: If you are having any difficulty with your research, then do not hesitate to share your difficulty with your guide (if you have one). They will surely help you out and resolve your doubts. If you can't clarify what exactly you require for your work, then ask your supervisor to help you with an alternative. He or she might also provide you with a list of essential readings.
4. Use of computer is recommended: As you are doing research in the field of management and business then this point is quite obvious. Use right software: Always use good quality software packages. If you are not capable of judging good software, then you can lose the quality of your paper unknowingly. There are various programs available to help you which you can get through the internet.
5. Use the internet for help: An excellent start for your paper is using Google. It is a wondrous search engine, where you can have your doubts resolved. You may also read some answers for the frequent question of how to write your research paper or find a model research paper. You can download books from the internet. If you have all the required books, place importance on reading, selecting, and analyzing the specified information. Then sketch out your research paper. Use big pictures: You may use encyclopedias like Wikipedia to get pictures with the best resolution. At Global Journals, you should strictly follow here.
© Copyright by Global Journals
XII
| Guidelines Handbook

6. Bookmarks are useful: When you read any book or magazine, you generally use bookmarks, right? It is a good habit which helps to not lose your continuity. You should always use bookmarks while searching on the internet also, which will make your search easier.
7. Revise what you wrote: When you write anything, always read it, summarize it, and then finalize it.
8. Make every effort: Make every effort to mention what you are going to write in your paper. That means always have a good start. Try to mention everything in the introduction—what is the need for a particular research paper. Polish your work with good writing skills and always give an evaluator what he wants. Make backups: When you are going to do any important thing like making a research paper, you should always have backup copies of it either on your computer or on paper. This protects you from losing any portion of your important data.
9. Produce good diagrams of your own: Always try to include good charts or diagrams in your paper to improve quality. Using several unnecessary diagrams will degrade the quality of your paper by creating a hodgepodge. So always try to include diagrams which were made by you to improve the readability of your paper. Use of direct quotes: When you do research relevant to literature, history, or current affairs, then use of quotes becomes essential, but if the study is relevant to science, use of quotes is not preferable.
10. Use proper verb tense: Use proper verb tenses in your paper. Use past tense to present those events that have happened. Use present tense to indicate events that are going on. Use future tense to indicate events that will happen in the future. Use of wrong tenses will confuse the evaluator. Avoid sentences that are incomplete.
11. Pick a good study spot: Always try to pick a spot for your research which is quiet. Not every spot is good for studying.
12. Know what you know: Always try to know what you know by making objectives, otherwise you will be confused and unable to achieve your target.
13. Use good grammar: Always use good grammar and words that will have a positive impact on the evaluator; use of good vocabulary does not mean using tough words which the evaluator has to find in a dictionary. Do not fragment sentences. Eliminate one-word sentences. Do not ever use a big word when a smaller one would suffice. Verbs have to be in agreement with their subjects. In a research paper, do not start sentences with conjunctions or finish them with prepositions. When writing formally, it is advisable to never split an infinitive because someone will (wrongly) complain. Avoid clichés like a disease. Always shun irritating alliteration. Use language which is simple and straightforward. Put together a neat summary.
14. Arrangement of information: Each section of the main body should start with an opening sentence, and there should be a changeover at the end of the section. Give only valid and powerful arguments for your topic. You may also maintain your arguments with records.
15. Never start at the last minute: Always allow enough time for research work. Leaving everything to the last minute will degrade your paper and spoil your work.
16. Multitasking in research is not good: Doing several things at the same time is a bad habit in the case of research activity. Research is an area where everything has a particular time slot. Divide your research work into parts, and do a particular part in a particular time slot.
17. Never copy others' work: Never copy others' work and give it your name because if the evaluator has seen it anywhere, you will be in trouble. Take proper rest and food: No matter how many hours you spend on your research activity, if you are not taking care of your health, then all your efforts will have been in vain. For quality research, take proper rest and food.
18. Go to seminars: Attend seminars if the topic is relevant to your research area. Utilize all your resources.
19. Refresh your mind after intervals: Try to give your mind a rest by listening to soft music or sleeping in intervals. This will also improve your memory. Acquire colleagues: Always try to acquire colleagues. No matter how sharp you are, if you acquire colleagues, they can give you ideas which will be helpful to your research.
20. Think technically: Always think technically. If anything happens, search for its reasons, benefits, and demerits. Think and then print: When you go to print your paper, check that tables are not split, headings are not detached from their descriptions, and page sequence is maintained.
© Copyright by Global Journals | Guidelines Handbook
XIII

Irrelevant and inappropriate material is superfluous. Foreign terminology and phrases are not apropos. One should never take a broad view. Analogy is like feathers on a snake. Use words properly, regardless of how others use them. Remove quotations. Puns are for kids, not grunt readers. Never oversimplify: When adding material to your research paper, never go for oversimplification; this will definitely irritate the evaluator. Be specific. Never use rhythmic redundancies. Contractions shouldn't be used in a research paper. Comparisons are as terrible as clichés. Give up ampersands, abbreviations, and so on. Remove commas that are not necessary. Parenthetical words should be between brackets or commas. Understatement is always the best way to put forward earth-shaking thoughts. Give a detailed literary review.
22. Report concluded results: Use concluded results. From raw data, filter the results, and then conclude your studies based on measurements and observations taken. An appropriate number of decimal places should be used. Parenthetical remarks are prohibited here. Proofread carefully at the final stage. At the end, give an outline to your arguments. Spot perspectives of further study of the subject. Justify your conclusion at the bottom sufficiently, which will probably include examples.
23. Upon conclusion: Once you have concluded your research, the next most important step is to present your findings. Presentation is extremely important as it is the definite medium though which your research is going to be in print for the rest of the crowd. Care should be taken to categorize your thoughts well and present them in a logical and neat manner. A good quality research paper format is essential because it serves to highlight your research paper and bring to light all necessary aspects of your research.
Informal Guidelines of Research Paper Writing
Key points to remember:
• Submit all work in its final form. • Write your paper in the form which is presented in the guidelines using the template. • Please note the criteria peer reviewers will use for grading the final paper.
Final points:
One purpose of organizing a research paper is to let people interpret your efforts selectively. The journal requires the following sections, submitted in the order listed, with each section starting on a new page:
The introduction: This will be compiled from reference matter and reflect the design processes or outline of basis that directed you to make a study. As you carry out the process of study, the method and process section will be constructed like that. The results segment will show related statistics in nearly sequential order and direct reviewers to similar intellectual paths throughout the data that you gathered to carry out your study.
The discussion section:
This will provide understanding of the data and projections as to the implications of the results. The use of good quality references throughout the paper will give the effort trustworthiness by representing an alertness to prior workings.
Writing a research paper is not an easy job, no matter how trouble-free the actual research or concept. Practice, excellent preparation, and controlled record-keeping are the only means to make straightforward progression.
General style:
Specific editorial column necessities for compliance of a manuscript will always take over from directions in these general guidelines.
To make a paper clear: Adhere to recommended page limits. Mistakes to avoid: •
Insertion of a title at the foot of a page with subsequent text on the next page. •
Separating a table, chart, or figure—confine each to a single page.
•
Submitting a manuscript with pages out of sequence. •
In every section of your document, use standard writing style, including articles ("a" and "the").
•
Keep paying attention to the topic of the paper.
© Copyright by Global Journals
XIV
| Guidelines Handbook
21. Adding unnecessary information: Do not add unnecessary information like "I have used MS Excel to draw graphs."

• Use paragraphs to split each significant point (excluding the abstract). • Align the primary line of each section. • Present your points in sound order. • Use present tense to report well-accepted matters. • Use past tense to describe specific results. • Do not use familiar wording; don't address the reviewer directly. Don't use slang or superlatives. • Avoid use of extra pictures—include only those figures essential to presenting results.
Title page:
Choose a revealing title. It should be short and include the name(s) and address(es) of all authors. It should not have acronyms or abbreviations or exceed two printed lines.
Abstract: This summary should be two hundred words or less. It should clearly and briefly explain the key findings reported in the manuscript and must have precise statistics. It should not have acronyms or abbreviations. It should be logical in itself. Do not cite references at this point.
An abstract is a brief, distinct paragraph summary of finished work or work in development. In a minute or less, a reviewer can be taught the foundation behind the study, common approaches to the problem, relevant results, and significant conclusions or new questions.
Write your summary when your paper is completed because how can you write the summary of anything which is not yet written? Wealth of terminology is very essential in abstract. Use comprehensive sentences, and do not sacrifice readability for brevity; you can maintain it succinctly by phrasing sentences so that they provide more than a lone rationale. The author can at this moment go straight to shortening the outcome. Sum up the study with the subsequent elements in any summary. Try to limit the initial two items to no more than one line each.
Reason for writing the article—theory, overall issue, purpose.
• Fundamental goal. • To-the-point depiction of the research. • Consequences, including definite statistics—if the consequences are quantitative in nature, account for this; results of
any numerical analysis should be reported. Significant conclusions or questions that emerge from the research.
Approach:
o Single section and succinct. o An outline of the job done is always written in past tense. o Concentrate on shortening results—limit background information to a verdict or two. o Exact spelling, clarity of sentences and phrases, and appropriate reporting of quantities (proper units, important
statistics) are just as significant in an abstract as they are anywhere else.
Introduction:
The introduction should "introduce" the manuscript. The reviewer should be presented with sufficient background information to be capable of comprehending and calculating the purpose of your study without having to refer to other works. The basis for the study should be offered. Give the most important references, but avoid making a comprehensive appraisal of the topic. Describe the problem visibly. If the problem is not acknowledged in a logical, reasonable way, the reviewer will give no attention to your results. Speak in common terms about techniques used to explain the problem, if needed, but do not present any particulars about the protocols here.
The following approach can create a valuable beginning:
o Explain the value (significance) of the study. o Defend the model—why did you employ this particular system or method? What is its compensation? Remark upon
its appropriateness from an abstract point of view as well as pointing out sensible reasons for using it. o Present a justification. State your particular theory(-ies) or aim(s), and describe the logic that led you to choose
them. o Briefly explain the study's tentative purpose and how it meets the declared objectives.
© Copyright by Global Journals | Guidelines Handbook
XV

Approach:
Use past tense except for when referring to recognized facts. After all, the manuscript will be submitted after the entire job is done. Sort out your thoughts; manufacture one key point for every section. If you make the four points listed above, you will need at least four paragraphs. Present surrounding information only when it is necessary to support a situation. The reviewer does not desire to read everything you know about a topic. Shape the theory specifically—do not take a broad view.
As always, give awareness to spelling, simplicity, and correctness of sentences and phrases.
Procedures (methods and materials):
This part is supposed to be the easiest to carve if you have good skills. A soundly written procedures segment allows a capable scientist to replicate your results. Present precise information about your supplies. The suppliers and clarity of reagents can be helpful bits of information. Present methods in sequential order, but linked methodologies can be grouped as a segment. Be concise when relating the protocols. Attempt to give the least amount of information that would permit another capable scientist to replicate your outcome, but be cautious that vital information is integrated. The use of subheadings is suggested and ought to be synchronized with the results section.
When a technique is used that has been well-described in another section, mention the specific item describing the way, but draw the basic principle while stating the situation. The purpose is to show all particular resources and broad procedures so that another person may use some or all of the methods in one more study or referee the scientific value of your work. It is not to be a step-by-step report of the whole thing you did, nor is a methods section a
set of orders.
Materials:
Materials may be reported in part of a section or else they may be recognized along with your measures.
Methods:
o
Report the method and not the particulars of each process that engaged the same methodology.
o
Describe the method entirely. o
To be succinct, present methods under headings dedicated to specific dealings or groups of measures.
o
Simplify—detail how procedures were completed, not how they were performed on a particular day. o
If well-known procedures were used, account for the procedure by name, possibly with a reference, and that's all.
Approach:
It is embarrassing to use vigorous voice when documenting methods without using first person, which would focus the reviewer's interest on the researcher rather than the job. As a result, when writing up the methods, most authors use third person passive voice.
Use standard style in this and every other part of the paper—avoid familiar lists, and use full sentences.
What to keep away from:
o
Resources and methods are not a set of information.
o
Skip all descriptive information and surroundings—save it for the argument. o
Leave out information that is immaterial to a third party.
Results:
The principle of a results segment is to present and demonstrate your conclusion. Create this part as entirely objective details of the outcome, and save all understanding for the discussion.
The page length of this segment is set by the sum and types of data to be reported. Use statistics and tables, if suitable, to present consequences most efficiently.
You must clearly differentiate material which would usually be incorporated in a study editorial from any unprocessed data or additional appendix matter that would not be available. In fact, such matters should not be submitted at all except if requested by the instructor.
© Copyright by Global Journals
XVI
| Guidelines Handbook

Content:
o Sum up your conclusions in text and demonstrate them, if suitable, with figures and tables. o In the manuscript, explain each of your consequences, and point the reader to remarks that are most appropriate. o Present a background, such as by describing the question that was addressed by creation of an exacting study. o Explain results of control experiments and give remarks that are not accessible in a prescribed figure or table, if
appropriate. o Examine your data, then prepare the analyzed (transformed) data in the form of a figure (graph), table, or
manuscript.
What to stay away from:
o Do not discuss or infer your outcome, report surrounding information, or try to explain anything. o Do not include raw data or intermediate calculations in a research manuscript. o Do not present similar data more than once. o A manuscript should complement any figures or tables, not duplicate information. o Never confuse figures with tables—there is a difference.
Approach:
As always, use past tense when you submit your results, and put the whole thing in a reasonable order.
Put figures and tables, appropriately numbered, in order at the end of the report.
If you desire, you may place your figures and tables properly within the text of your results section.
Figures and tables:
If you put figures and tables at the end of some details, make certain that they are visibly distinguished from any attached appendix materials, such as raw facts. Whatever the position, each table must be titled, numbered one after the other, and include a heading. All figures and tables must be divided from the text.
Discussion:
The discussion is expected to be the trickiest segment to write. A lot of papers submitted to the journal are discarded based on problems with the discussion. There is no rule for how long an argument should be.
Position your understanding of the outcome visibly to lead the reviewer through your conclusions, and then finish the paper with a summing up of the implications of the study. The purpose here is to offer an understanding of your results and support all of your conclusions, using facts from your research and generally accepted information, if suitable. The implication of results should be fully described.
Infer your data in the conversation in suitable depth. This means that when you clarify an observable fact, you must explain mechanisms that may account for the observation. If your results vary from your prospect, make clear why that may have happened. If your results agree, then explain the theory that the proof supported. It is never suitable to just state that the data approved the prospect, and let it drop at that. Make a decision as to whether each premise is supported or discarded or if you cannot make a conclusion with assurance. Do not just dismiss a study or part of a study as "uncertain."
Research papers are not acknowledged if the work is imperfect. Draw what conclusions you can based upon the results that you have, and take care of the study as a finished work.
o You may propose future guidelines, such as how an experiment might be personalized to accomplish a new idea. o Give details of all of your remarks as much as possible, focusing on mechanisms. o Make a decision as to whether the tentative design sufficiently addressed the theory and whether or not it was
correctly restricted. Try to present substitute explanations if they are sensible alternatives. o One piece of research will not counter an overall question, so maintain the large picture in mind. Where do you go
next? The best studies unlock new avenues of study. What questions remain? o Recommendations for detailed papers will offer supplementary suggestions.
© Copyright by Global Journals | Guidelines Handbook
XVII

Approach:
When you refer to information, differentiate data generated by your own studies from other available information. Present work done by specific persons (including you) in past tense.
Describe generally acknowledged facts and main beliefs in present tense.
The Administration Rules
Administration Rules to Be Strictly Followed before Submitting Your Research Paper to Global Journals Inc.
Please read the following rules and regulations carefully before submitting your research paper to Global Journals Inc. to avoid rejection.
Segment draft and final research paper: You have to strictly follow the template of a research paper, failing which your
paper may get rejected. You are expected to write each part of the paper wholly on your own. The peer reviewers need to identify your own perspective of the concepts in your own terms. Please do not extract straight from any other source, and do not rephrase someone else's analysis. Do not allow anyone else to proofread your manuscript.
Written material: You may discuss this with your guides and key sources. Do not copy anyone
else's paper, even if this is
only imitation, otherwise it will be rejected on the grounds of plagiarism, which is illegal. Various methods to avoid plagiarism are strictly applied by us to every paper, and, if found guilty, you may be blacklisted, which could affect your career adversely. To guard yourself and others from possible illegal use, please do not permit anyone to use or even read your paper and file.
© Copyright by Global Journals
XVIII
| Guidelines Handbook
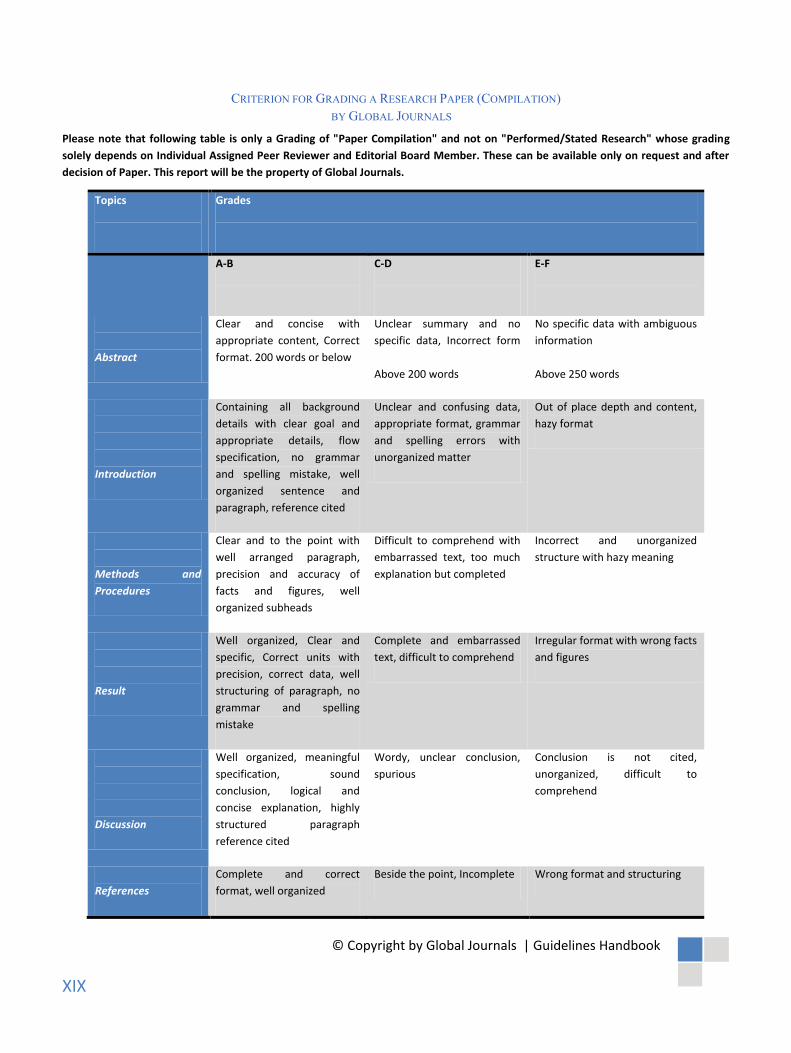
CRITERION FOR GRADING A RESEARCH PAPER (COMPILATION)BY GLOBAL JOURNALS
Please note that following table is only a Grading of "Paper Compilation" and not on "Performed/Stated Research" whose grading
solely depends on Individual Assigned Peer Reviewer and Editorial Board Member. These can be available only on request and after
decision of Paper. This report will be the property of Global Journals.
Topics Grades
A-B C-D E-F
Abstract
Clear and concise with
appropriate content, Correct
format. 200 words or below
Unclear summary and no
specific data, Incorrect form
Above 200 words
No specific data with ambiguous
information
Above 250 words
Introduction
Containing all background
details with clear goal and
appropriate details, flow
specification, no grammar
and spelling mistake, well
organized sentence and
paragraph, reference cited
Unclear and confusing data,
appropriate format, grammar
and spelling errors with
unorganized matter
Out of place depth and content,
hazy format
Methods and
Procedures
Clear and to the point with
well arranged paragraph,
precision and accuracy of
facts and figures, well
organized subheads
Difficult to comprehend with
embarrassed text, too much
explanation but completed
Incorrect and unorganized
structure with hazy meaning
Result
Well organized, Clear and
specific, Correct units with
precision, correct data, well
structuring of paragraph, no
grammar and spelling
mistake
Complete and embarrassed
text, difficult to comprehend
Irregular format with wrong facts
and figures
Discussion
Well organized, meaningful
specification, sound
conclusion, logical and
concise explanation, highly
structured paragraph
reference cited
Wordy, unclear conclusion,
spurious
Conclusion is not cited,
unorganized, difficult to
comprehend
References
Complete and correct
format, well organized
Beside the point, Incomplete Wrong format and structuring
XIX
© Copyright by Global Journals | Guidelines Handbook
Index
A
Adequately · 1, 6, 7
B
Bivariate · 43
C
Campaign · 3
E
Endogenous · 42
I
Interact · 2
L
Lucrative · 1
M
Médiatrice · 19, 24, 25, 26, 27Meritorious · 14
N
Nationwide · 35
O
Obstacle · 32
P
Penetrating · 45Procurement · 30, 31, 33Prominent · 3, 39

© Global Journals