the private equity play - lorelli lorelli the private equity play.pdf · the lbo model purchase •...
TRANSCRIPT
The Private Equity Play
Mike Lorelli

2
Your Pride Vs. Their Need
Your Pride:
“Action oriented executive with 21
years leadership experience with
Fortune 500 Allied Chemical.”

3
Your Pride Vs. Their Need
Your Pride:
“Action oriented executive with 21
years leadership experience with
Fortune 100 Allied Chemical. ”
Their Point-of-View:
“21 years! Ugh! We want to exit in
Year 4. . . Year 7 max. Please get
this Rip Van Winkle out of my
sight!”
“He probably takes 10 years to
figure out what Amazon or EF
people do in 3 years!”
4
Your Revised “Pride”
Your Pride:
“I’m a Fortune trained leader
that has made a step change
in the EBITDA CAGR,
in every assignment."

5
Your Revised “Pride”
Your Pride:
“I’m a Fortune trained leader
who has made a step change
in the EBITDA CAGR
in every assignment."
Their Read:
“Jesus!!!” Here comes my bonus!”
Trump, please don’t tax carried
interest!” This is our guy!

6
Agenda
➢ History
➢ Returns
➢ Where is the money coming from?
➢ Terminology
➢ The p.e. model
➢ p.e. compensation
➢ Results and Performance Measures
➢ ‘The Funnel’
➢ Management Compensation
➢ The p.e.’s Plan
➢ The right mindset when dealing with private equity
➢ Importance of a good LinkedIn profile. . . you want to hear about good searches
➢ Tips to drive ‘p.e. stickiness’ and your personal ‘hits’
➢ Don’t forget about Board roles

7
EBITDA
Earnings Before:
• Interest
• Taxes
• Depreciation
• Amortization

8
Stages
Idea Up & Running Mature
VC PE
• Trailing EBITDA
9
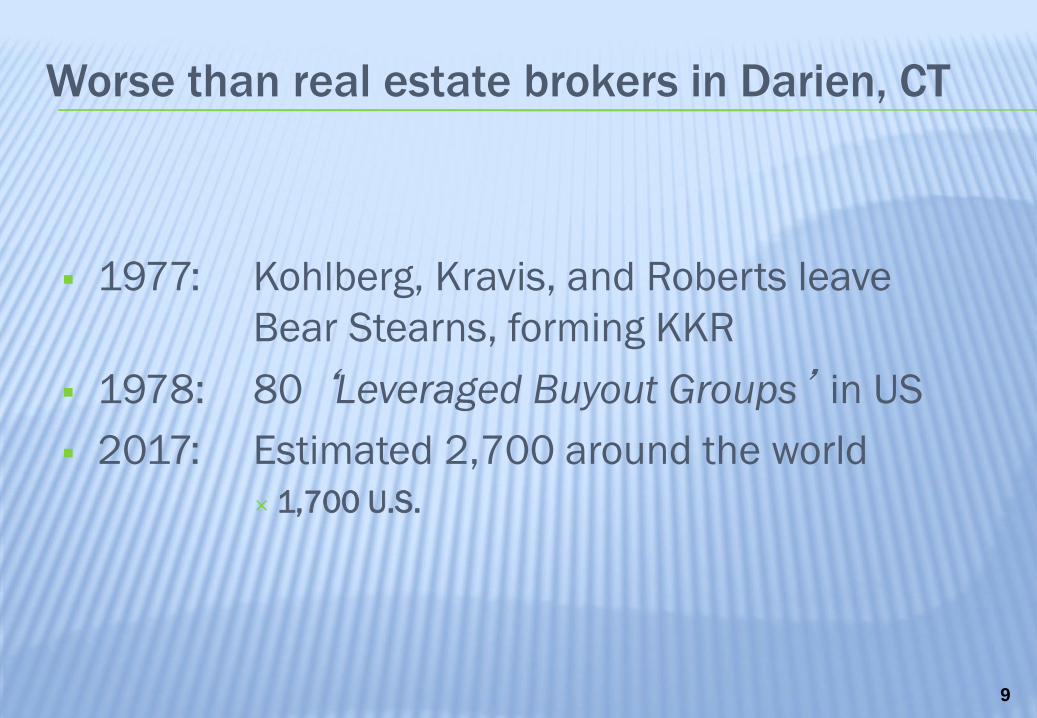
Worse than real estate brokers in Darien, CT
▪ 1977: Kohlberg, Kravis, and Roberts leave
Bear Stearns, forming KKR
▪ 1978: 80 ‘Leveraged Buyout Groups’ in US
▪ 2017: Estimated 2,700 around the world
1,700 U.S.

10
Value Creation
100% Value Creation
90%
80%
70%
60%
50%
40%
30%
20%
10%
0%
18%
31%
51%
22%
36%
46%
39%
32% 25%
Leverage era (1980s) Multiple Expansion
era (1990s)
Earnings growth
era (2000s)
Operational improvement
era (2010s)
Operational improvement Multiple arbitrage Leverage
Valu
e C
reati
on

11
WSJ: “Buyouts Leave Simmons Little Rest”

12
Terminology
▪ The providers of capital: Limited Partners, or LP’s- who are they?
▪ The fund manager: General Partner, or GP, or p.e.

13
Returns Well Out-Performed S&P

14
Percentage of Capital by LP typeLBO Funds

15
16
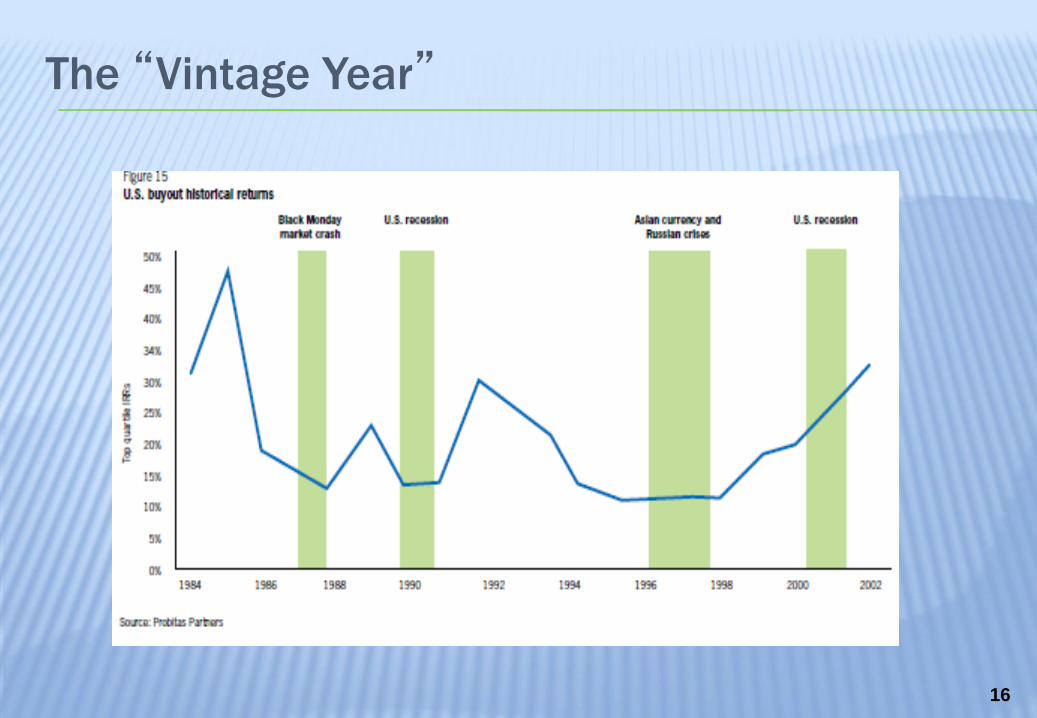
The “Vintage Year”

17
Many ways to categorize the 1,700
▪ By size• Large $1 billion+ revenues
• Mid-market > $150 million
• Small < $150 million
▪ By sector specialty• Health care
• Consumer
• QSR
• IT
• Financial services
• etc.
▪ Net-net, sector first; and mid-market; not lower or upper
18
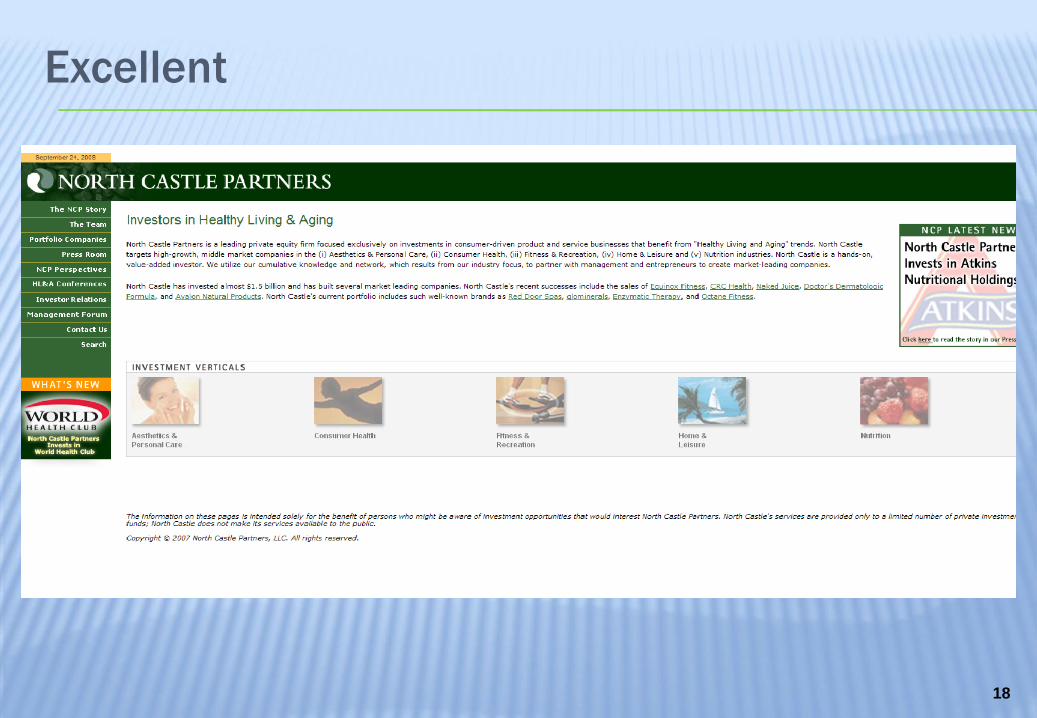
Excellent
19
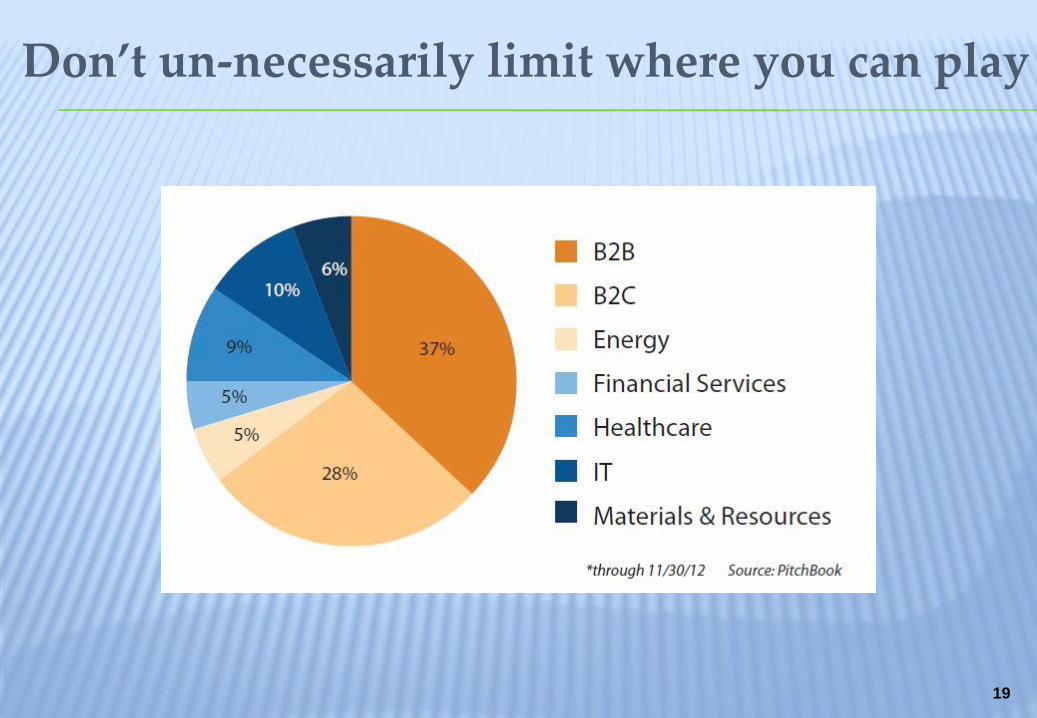
Don’t un-necessarily limit where you can play
20
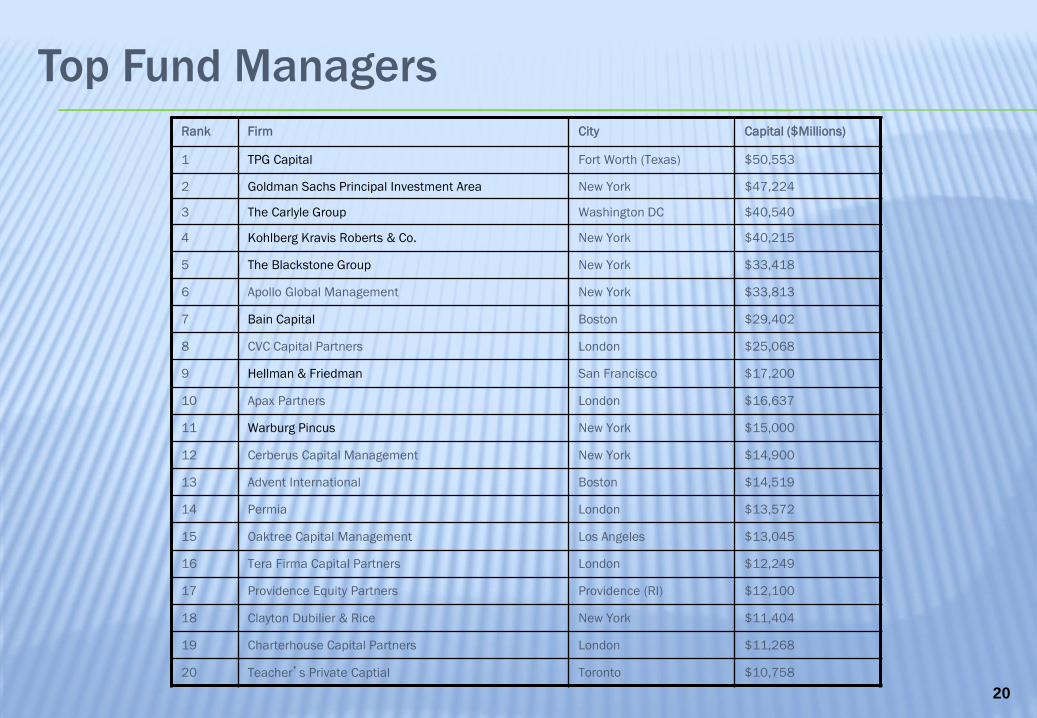
Top Fund Managers
Rank Firm City Capital ($Millions)
1 TPG Capital Fort Worth (Texas) $50,553
2 Goldman Sachs Principal Investment Area New York $47,224
3 The Carlyle Group Washington DC $40,540
4 Kohlberg Kravis Roberts & Co. New York $40,215
5 The Blackstone Group New York $33,418
6 Apollo Global Management New York $33,813
7 Bain Capital Boston $29,402
8 CVC Capital Partners London $25,068
9 Hellman & Friedman San Francisco $17,200
10 Apax Partners London $16,637
11 Warburg Pincus New York $15,000
12 Cerberus Capital Management New York $14,900
13 Advent International Boston $14,519
14 Permia London $13,572
15 Oaktree Capital Management Los Angeles $13,045
16 Tera Firma Capital Partners London $12,249
17 Providence Equity Partners Providence (RI) $12,100
18 Clayton Dubilier & Rice New York $11,404
19 Charterhouse Capital Partners London $11,268
20 Teacher’s Private Captial Toronto $10,758
21
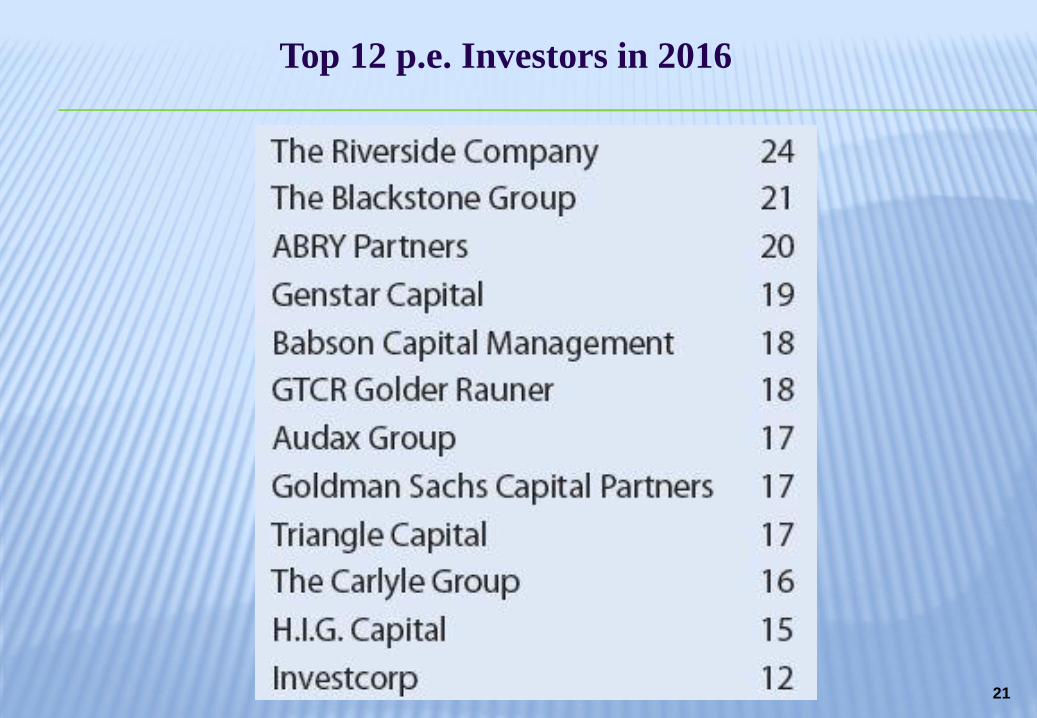
Top 12 p.e. Investors in 2016

22
The LBO model
▪ Purchase
• 7.0 X $90m = $630
• Cash 270
• Debt 360
▪ Sale• 8.0 X $141m = $1,130
• Debt 320
• Proceeds 810

23
The LBO model
▪ Purchase
• 7.0 X $90m = $630
• Cash 270
• Debt 360
▪ Sale• 8.0 X $14.1m = $1,130
• Debt 320
• Proceeds 810
= 3.0 X cash-on-cash

The p.e. / L.P Model Pelosi 2008 Fund
2008 2009 2010 2011 2012 2013 2014 2015 2016
A
B
C D
E
F
GH
IJ
F
E
DA
B
C
Sale
Purchase

25
The p.e. / L.P Model Pelosi 2008 Fund
2008 2009 2010 2011 2012 2013 2014 2015 2016 2017
A
B
CD
E
F
GH
I
J
F
E
DA
BC
Sale
Purchase
Invest Harvest

26
Multiples Continue to Rise

27
‘Add-Ons’ now 64% (!)

28
p.e. Compensation
▪ 2% of managed capital
• pays salaries, rent, and nominal bonuses
▪ Pay back LP’s 100c on the dollar, then . . .
▪ 20% carried interest from profits on distributions
▪ Then, balance to LP’s in proportion
29
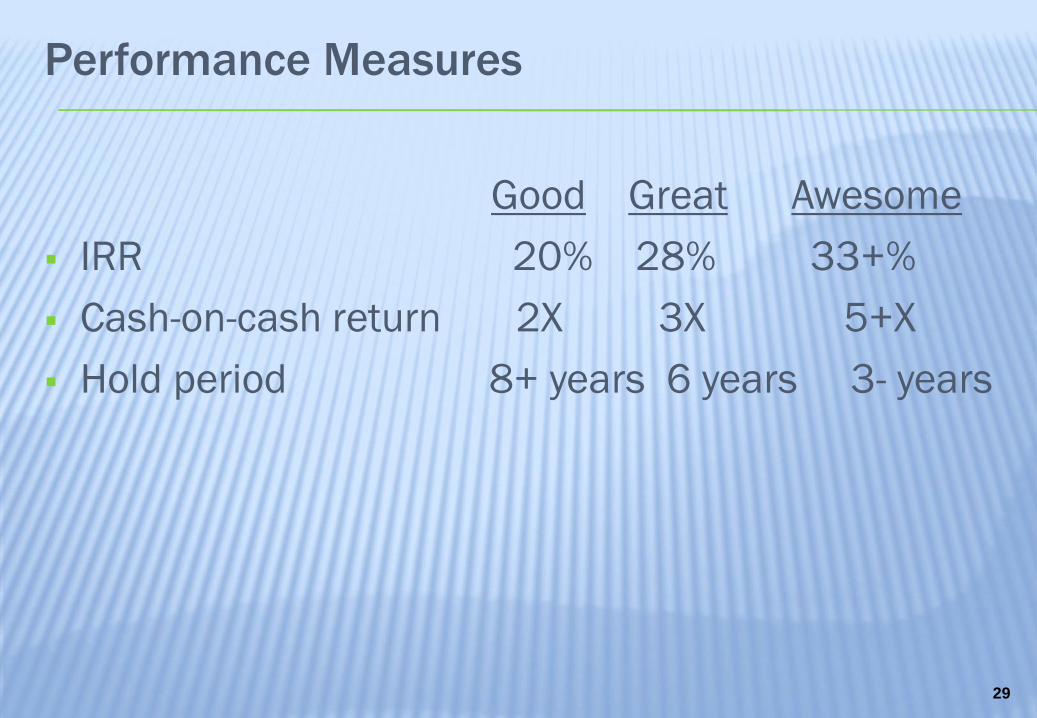
Performance Measures
Good Great Awesome
▪ IRR 20% 28% 33+%
▪ Cash-on-cash return 2X 3X 5+X
▪ Hold period 8+ years 6 years 3- years

30
Buyout Fund Sample
Partnership/Year
Capital
Committed (M)
Capital
Cont. (M)
Dist. As of
(M)
Net IRR
As of (%)
Oregon State Treasury 12/31/16 12/31/16
2000 Riverside Capital Appreciation Fund/2000 $50.0 $46.3 $73.1 22.1
2003 Riverside Capital Appreciation Fund/2003 $75.0 $77.4 $47.1 15.3
Apollo Investment Fund VI LP/2006 $200.0 $223.1 $57.5 3.1
Aurora Equity Partners III LP/2004 $50.0 $53.0 $20.8 17.7
BCI Growth V LP/1999 $75.0 $72.9 $27.2 -8.7
Castle Harlan Partners IV LP/2002 $100.0 $102.3 $109.8 17.3
CVC Capital Partners Asia Pacific II LP/2005 $100.0 $122.4 $38.3 -6.2
Diamond Castle Partners IV LP/2005 $100.0 $71.3 $16.1 -4.5
Endeavor Capital Fund III LP/2000 $25.0 $24.5 $43.7 28.9
Fenway Partners Capital Fund III LP/2006 $50.0 $53.9 $19.6 -4.9
Hicks Muse Tate & Furst Europe Fund LP/1999 $99.3 $116.8 $196.9 21.7
KKR European Fund LP/1999 $400.0 $532.3 $778.8 19.3
KKR Millennium Fund LP/2002 $1,000.0 $1,308.8 $1,064.2 17.9
Lion Capital Fund I LP/2004 $99.8 $108.8 $117.2 26.5
Oak Hill Capital Partners II LP/2004 $100.0 $105.8 $15.7 6.8
Parthenon Investors III LP/2005 $100.0 $67.8 $8.7 1.7
Rhone Partners III LP/2006 $100.0 $65.4 $11.5 5.8
TPG Partners III LP/2000 $300.0 $284.5 $571.9 24.5
HarbourVest Partners 2004 Direct Fund/2004 $75.0 $74.1 $21.1 11.1
31
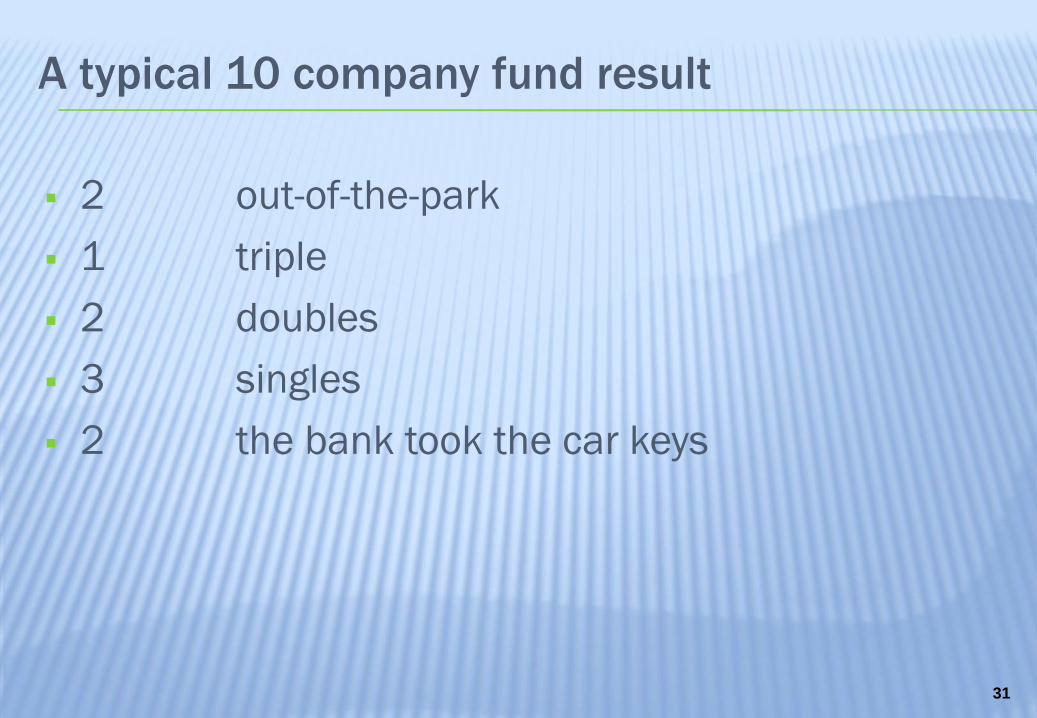
A typical 10 company fund result
▪ 2 out-of-the-park
▪ 1 triple
▪ 2 doubles
▪ 3 singles
▪ 2 the bank took the car keys
32
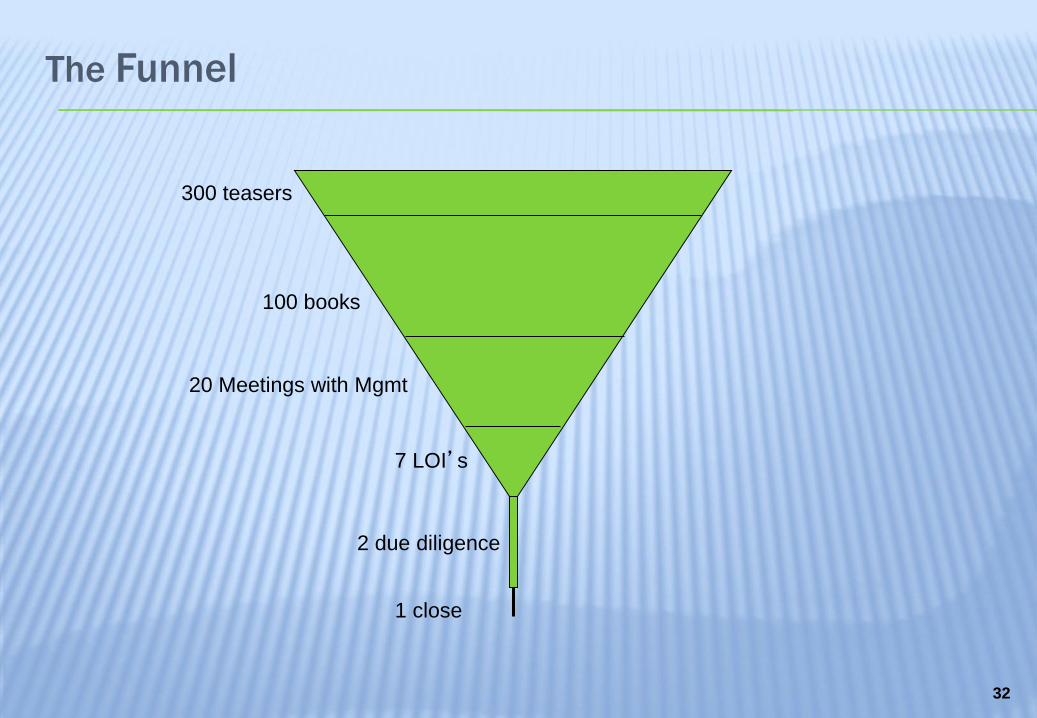
The Funnel
300 teasers
100 books
7 LOI’s
2 due diligence
1 close
20 Meetings with Mgmt

33
Who the p.e. wants to meet
Job Seekers
Deal Resource
Thesis-Driven
Deal Exec
Target-
Driven Deal
Exec
Source: Andy Thompson, Notch Partners

34
Management Compensation
Base Bonus Equity
▪ CEO $200K - $450K 50-75% 5.0% equity*
▪ CFO/COO 125K - $275K 40-50% 1.5% equity
▪ CMO 125K- $225K 25-33% 1.0% equity
▪ * and opportunity to co-invest

The Deal
Project NTL Sept 1st, 2007
Offer: $55 million for 75% of the company + $34 million debt, implies $107 million
Bank Adj. +$4.0 excesses 2006 EBITDA
2007 Adjusted EBITDA 12,744 16,744 Sources Debt Multiple
EBITDA Multiple 8.4x 6.41x Debt Financing 58,000 3.46x
Offer Price 107,333 107,333 new p.e. Equity 35,000 2007 2008 2009 2010
Company Debt 34,000 34,000 Total Sources: 93,000 EBITDA 12,744 17,840 23,700 29,300
Current Equity 73,333 73,333 Interest @ 12% (6,553) (5,645) (4,450)
Uses Taxes % 40% (4,515) (7,222) (9,940)
Payment to 5 owners 55,000 Capex (2,500) (2,500) (2,500)
Current Owner Proceeds 55,000 Refinancing of Debt 34,000 Debt Pay (6,788) (8,333) (11,591)
Estimated Fees and Expenses 4,000 Cash Flow 0.0 0.0 0.0
new p.e. $ 35,000 75% Total Uses: 93,000
Equity Rollover 11,667 25% Cash 0 0.0 0.0 0.0
Total Post-Deal Equity 46,667 100.0% ? equity Debt 58,000 51,212 42,877 31,286
196,039 Year 3 Ownership Net Debt 58,000 51,212 42,877 31,286
Management: of 15.0 pts 2.5%now 2011 new p.e. 63.8%
Mike Lorelli 0.0550 672 10,782 Current Owners 21.3% Exit EV 142,720 189,600 234,400
CFO 0.0300 367 5,881 Immediate skin in game 2.5% Exit Equity 91,508 146,723 203,114
EVP 0.0200 244 3,921 3 year option program 12.5% Equity to p.e. 58,336 93,536 129,485
V.P. and GC 0.0220 269 4,313 100.0% Equity to 5 owners 19,445 31,179 50,920
R&D 0.0060 73 1,176 Total cash to 5 owners 74,445 86,179 105,920
Sub. GM 0.0060 73 1,176 p.e. cash
CMO (new hire) 0.0060 73 1,176 IRR (5 years)
VP Supply Chain (new hire) 0.0050 61 980 Exit multiple 8
Total Management 0.1500 1,833 29,406

36
The Private Equity vs. Traditional C-level
▪ Greater emphasis on time (driven by Hold Period)
▪ Tenure can be compared to ‘the half-life of uranium’
▪ Better fits are executives who:
• Exhibit “Jack be nimble, Jack be quick” temperament
• Be a Jack-of-all-trades
• Work on scare resources
– you may be making the run to Staples for supplies today
– you write the Strategic Plan (no Corporate Staff)
• Love tight quarters
– You may be sharing a pillow some nights with the p.e’s Deal Team

37
Carried Interest . . .
38
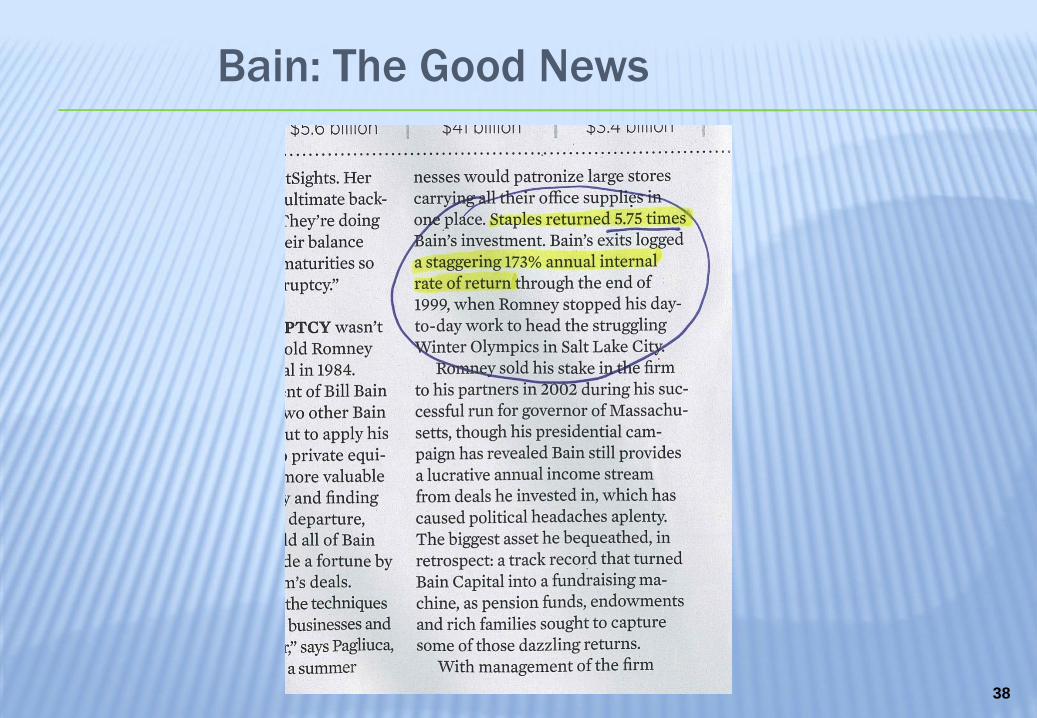
Bain: The Good News

39
Bain: The Black Eye

The Trades

41
The Importance of a Killer LinkedIn Profile
▪ 50% of candidates are
found via LinkedIn
▪ Or they will at least check you
out!
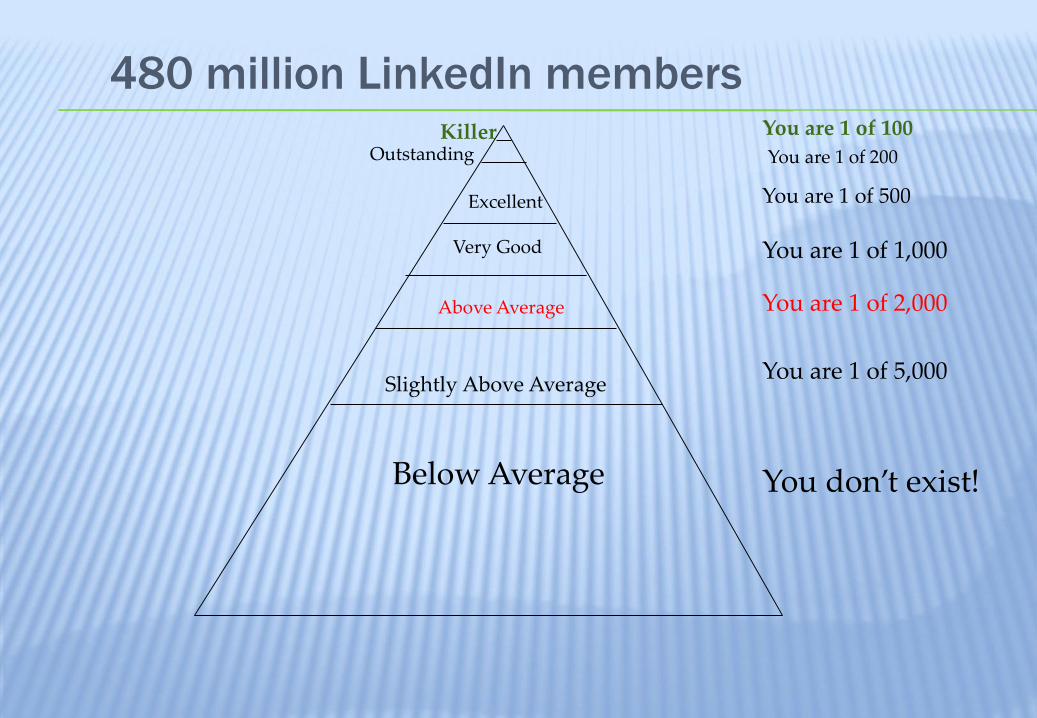
Below Average
Slightly Above Average
Above Average
Very Good
Excellent
OutstandingKiller
You don’t exist!
You are 1 of 5,000
You are 1 of 2,000
You are 1 of 1,000
You are 1 of 500
You are 1 of 100
480 million LinkedIn members
You are 1 of 200
43
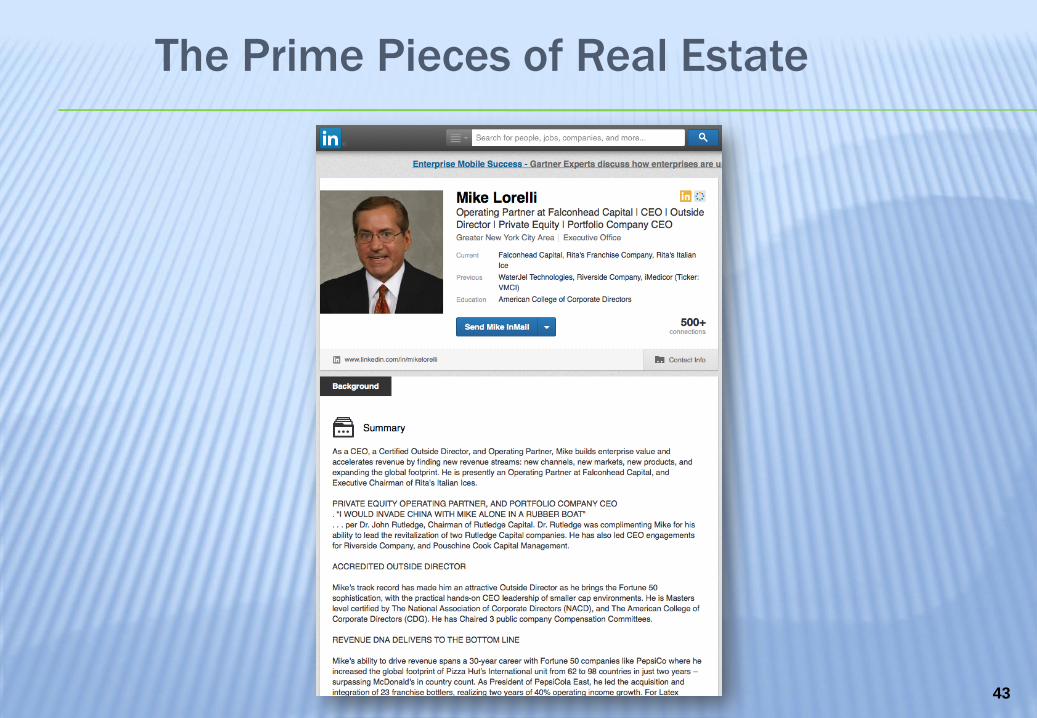
The Prime Pieces of Real Estate
44
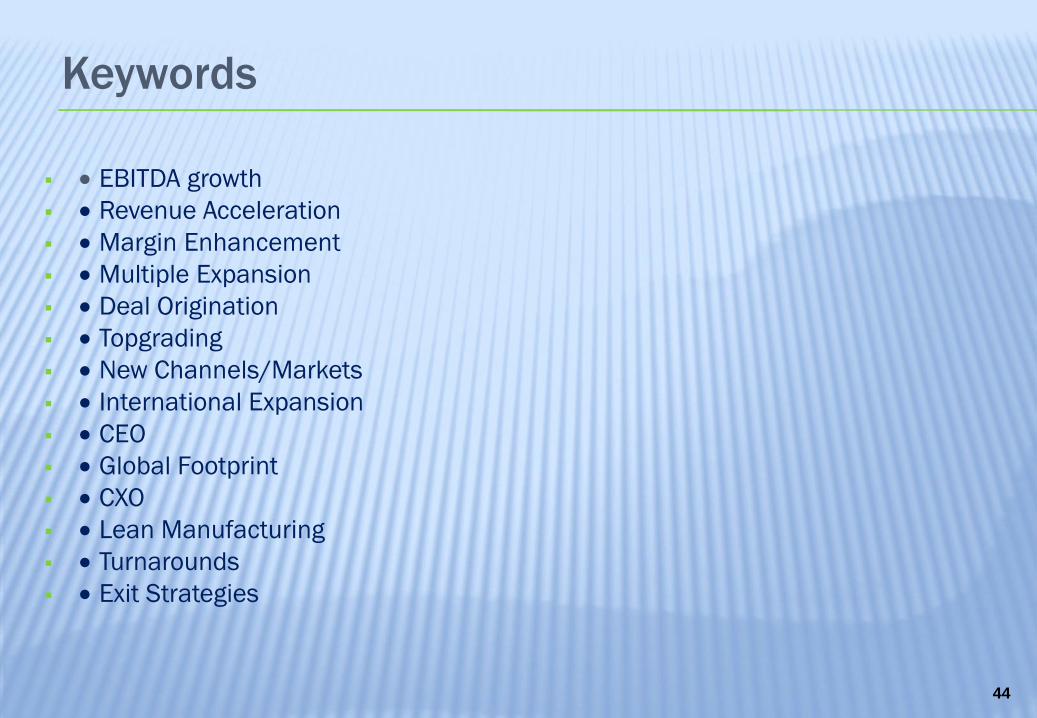
Keywords
▪ • EBITDA growth
▪ • Revenue Acceleration
▪ • Margin Enhancement
▪ • Multiple Expansion
▪ • Deal Origination
▪ • Topgrading
▪ • New Channels/Markets
▪ • International Expansion
▪ • CEO
▪ • Global Footprint
▪ • CXO
▪ • Lean Manufacturing
▪ • Turnarounds
▪ • Exit Strategies
45
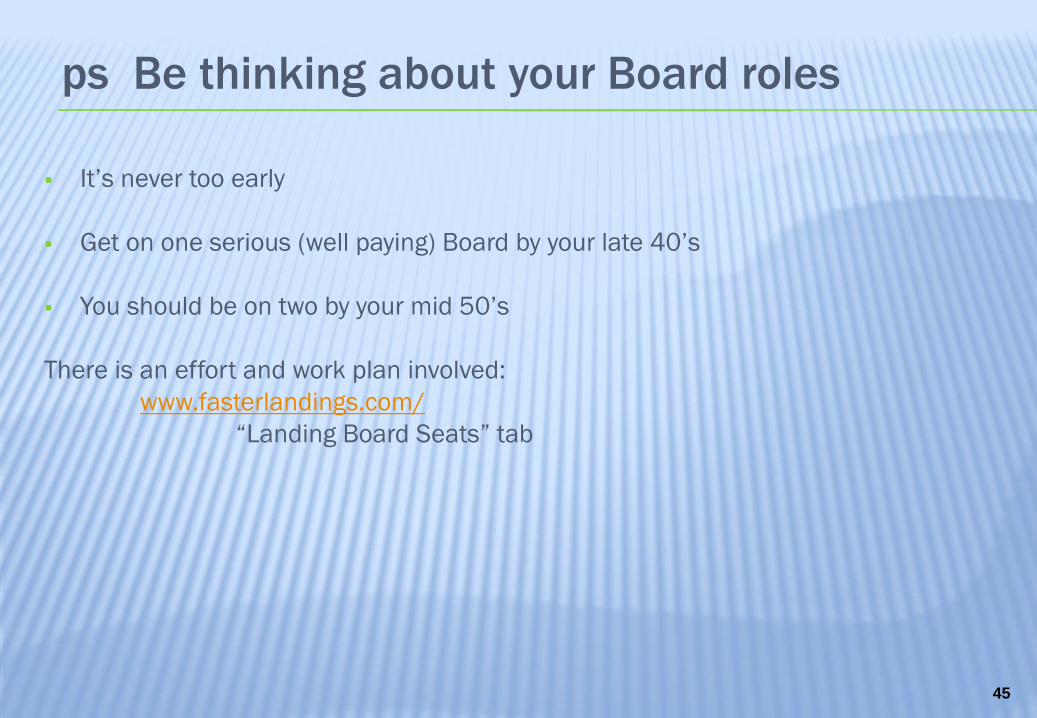
ps Be thinking about your Board roles
▪ It’s never too early
▪ Get on one serious (well paying) Board by your late 40’s
▪ You should be on two by your mid 50’s
There is an effort and work plan involved:
www.fasterlandings.com/
“Landing Board Seats” tab
46
Lots of Private Equity Board Opportunities
▪ In the US:
• 3,600 public companies X 7 = 25,200 outside directors
• 16,821 private equity companies X 2 = 33,000 outside directors

47


49
Visit www.linkedin.com/in/mikelorelli
Mike Lorelli
(203) 253-1238
Thank You! Questions?

50
Michael K. Lorelli15 Norman Lane
Darien, CT 06820
Office: 203 655-2444
FAX: 203 655-6916
Email: [email protected]
Website: www.Lorelli.net
www.LinkedIn.com/in/MikeLorelli
http://www.gplus.to/MikeLorelli
Mike Lorelli’s 30-year career spans a wide range of consumer products and services, and
B2B categories, with responsibilities for both domestic and international units. His years as a
line-operating manager have been with Fortune 100 companies: PepsiCo and Bristol Myers
Squibb. For the last 14 years, as CEO, he has led revitalizations and turnarounds for private
equity firms. For example, Dr. John Rutledge, Chairman of Rutledge Capital, will say:
“I would invade China with Mike alone in a rubber boat.” He is presently An Operating
Partner at Falconhead Capital, and Executive Chairman of the Board, Rita’s Franchise
company, the nations leading Italian Ice and frozen custard chain.
Mike has also led CEO engagements for Riverside Company, Rutledge Capital, and
Pouschine Cook Capital.
Mike’s assignments at PepsiCo included CMO for PepsiCo’s beverage sector, President of
Pepsi-Cola East, a $1.5 Billion operating company, and President for Pizza Hut’s
International division where he led a “global or bust” charge, resulting in expanding the
Company’s presence from 68 to 92 countries, surpassing McDonalds in country count.
During his PepsiCo tenure, he is given credit for authoring the soft drink company’s “Big
Event Marketing” strategy, which coupled the product with leading- edge events in
entertainment, sports, consumer electronics, movies and home video.
Mike holds a Bachelor of Engineering degree in Industrial Engineering from New York
University, and an MBA in Marketing from NYU’s Stern Graduate School of Business. He has
traveled to 58 countries, is an avid runner, claims to excel at no sport, is an active private
pilot, member The CEO Trust, former member of YPO, and author of the childrens’ best-
seller “Traveling Again, Dad?” with profits donated to childrens’ charities. Mike is also a
Director of CPKelco.. He holds a Masters Professional Director Certification from The
American College of Corporate Directors, and is also an NACD 2011 Masters Governance
Fellow. He is also a registered speaker with Vistage International.
Leading The World In Burn Care
Michael K. Lorelli