the many faces of poverty in the science city of muñoz · the many faces of poverty (volume 4) the...
TRANSCRIPT

2
The Many Faces of Poverty (Volume 4)
The Many Faces of Povertyin the Science City of Muñoz
INDICATOR
DEMOGRAPHYPopulationAverage household sizeChildren under 1 year oldChildren under 5 years oldChildren 0-5 years oldChildren 6-12 years oldMembers 13-16 years oldMembers 6-16 years oldMembers 10 years old and aboveMembers of the labor force
HEALTH AND NUTRIT IONChildren under 5 years old who diedWomen who died due to pregnancy related-causesMalnourished children 0-5 years old
HOUS INGHouseholds living in makeshift housingHouseholds who are informal settlers
WATER AND SANITATIONHouseholds without access to safe water supplyHouseholds without access to sanitary toilet facilities
BASIC EDUCATI ONChildren 6-12 years old not attending elementary schoolChildren 13-16 years old not attending high schoolChildren 6-16 years old not attending school
INCOME AND L IVELIHOODHouseholds with income below poverty thresholdHouseholds with income below food thresholdHouseholds who experienced food shor tageUnemployment rate (15 years old and above)
PEACE AND ORDERVictims of crime
Magnitude
142384
491299
3441130
79575988297
Propor tion
3.52.1
2.48.0
55.942.12.1
Households Population
CBMS Core Indicators, Science City of Muñoz, 2005
Propo r t io nMagni tu de
139468888379
102565282
1553848796
23889
62985
301
209321142544
20.440.016.4
102 0.2
315
0.4
3252 13.6
0.13.8
CBMS Composite Indicator, Science City of Muñoz, 2005
CBMS Composite IndicatorAvera g e
1.5

The Many Faces of Poverty (Volume 4)
3
Total Number of Households and Population, by Barangay, Science City of Muñoz,2005
Ba rang a y Tota l households Tota l population
Bagong SikatBalanteBantugBicalCabisuculanCalabalabaanCalisitanCatalanacanCurvaFranzaGabaldonLabneyLicaongLinglingayMagtanggolMaligayaMangandingayMapangpangMaragolMatingkisNaglabrahanPalusapisPandallaPoblacion EastPoblacion NorthPoblacion SouthPoblacion WestRang-ayanRizalSan AndresSan AntonioSan FelipeSapang CawayanVilla CuizonVilla IslaVilla NatiVilla Santos
3803131601440248195177528209459366167254494400719322116535204121516173385549398731430331322428406234219471239158
154813567265199910408578232455920202715907401056224918193476135550025078815112227722173624361848331818521356141517521666103294720071011686

4
The Many Faces of Poverty (Volume 4)
CBMS Poverty Maps: Science City of Muñoz
Map 1. Proportion of Children under 5 Years Old who Died, by Barangay, 2005
Mangandingay
Villa Isla
MapangpangSan Felipe
Rizal
Linglingay
Franza
San Andres
Licaong
CabisuculanMagtanggol
Villa CuizonBagong Sikat
Villa Santos
Calisitan Rang-ayan Bical
Pandalla
LabneyCalabalabaan
glabrahan
San Antonio
Curva
Maligaya
Palusapis
Matingkis
Gabaldon
Catalanacan
Pob South
Pob WestPob North
Pob EastVilla Nati
Sapang Cawayan
BantugBalante
Maragol
Bar angay M ag n i tude P r opor t i on
Bot tom 10 Barangays
MapangpangSan AndresLicaongMangandingayPoblacion Nor thRang-ayanMaragolMagtanggolVilla IslaVilla Nati
1322323221
2.01.91.71.51.21.11.01.00.90.7

The Many Faces of Poverty (Volume 4)
5
Map 2. Proportion of Women who Died Due to Pregnancy-Related Causes,by Barangay, 2005
Mangandingay
Villa Isla
MapangpangSan Felipe
Rizal
Linglingay
Franza
San Andres
Licaong
CabisuculanMagtanggol
Villa CuizonBagong Sikat
Villa Santos
Calisitan Rang-ayan Bical
Pandalla
LabneyCalabalabaan
Naglabrahan
San Antonio
Curva
Maligaya
Palusapis
Matingkis
Gabaldon
Catalanacan
Pob South
Pob WestPob North
Pob EastVilla Nati
Sapang Cawayan
BantugBalante
Maragol
CBMS Poverty Maps: Science City of Muñoz
Bar angay M ag n i tude P r opor t i on
Bot tom 1 Barangay
Villa Isla 1 2.1

6
The Many Faces of Poverty (Volume 4)
Map 3. Proportion of Children 0-5 Years Old who are Malnourished,by Barangay, 2005
CBMS Poverty Maps: Science City of Muñoz
Mangandingay
Villa Isla
MapangpangSan Felipe
Rizal
Linglingay
Franza
San Andres
Licaong
CabisuculanMagtanggol
Villa CuizonBagong Sikat
Villa Santos
Calisitan Rang-ayan Bical
Pandalla
LabneyCalabalabaan
Naglabrahan
San Antonio
Curva
Maligaya
Palusapis
Matingkis
Gabaldon
Catalanacan
Pob South
Pob WestPob North
Pob EastVilla Nati
Sapang Cawayan
BantugBalante
Maragol
Bar angay M ag n i tude P r opor t i on
Bot tom 10 Barangays
Poblacion EastVilla SantosVilla CuizonMangandingayNaglabrahanRizalVilla IslaMatingkisLinglingayCalabalabaan
431117199
13199
237
17.312.611.811.411.37.67.57.16.66.4

The Many Faces of Poverty (Volume 4)
7
Table 1. Health and Nutrition Indicators, by Barangay, Science City of Muñoz, 2005
Ba rang a y Number o fch i ld ren
(0-5 years o ld )
Malnou rishedch i ld ren
(0-5 years o ld )
Propor t ion
Chi l d ren under5 years old
who d ied
Number o fch i ld ren under
1 year o ld
Women deaths dueto p regnancy-re l a ted
causes
Magni tude Magni tude Pr opo r t i on Magni tude Propor tion
Number o fch i ld ren under
5 years old
Bagong SikatBalanteBantugBicalCabisuculanCalabalabaanCalisitanCatalanacanCurvaFranzaGabaldonLabneyLicaongLinglingayMagtanggolMaligayaMangandingayMapangpangMaragolMatingkisNaglabrahanPalusapisPandallaPoblacion EastPoblacion NorthPoblacion SouthPoblacion WestRang-ayanRizalSan AndresSan AntonioSan FelipeSapang CawayanVilla CuizonVilla IslaVilla NatiVilla Santos
152161768234999272270782511868811728220333813149298109622318321424521736118715015217416411712421014079
0050000100002022213000003012030000210
242917647172311451449412029533653181063191348166342428042444228301824462811
0000000000000000000000000000000000100
19020493728612211086343103304228108142350248415167573541278029310324928925443323417117621820214314425616588
84918372507655232419139940438126313513471719111
4.22.01.06.32.56.42.31.50
2.32.64.73.56.60.81.011.41.80.97.111.31.40
17.32.84.71.41.37.62.86.02.04.911.87.50.612.6
00
0.60000
0.40000
1.70
1.00.61.52.01.000000
1.20
0.31.10
1.90000
0.90.70
0000000000000000000000000000000000
2.100

8
The Many Faces of Poverty (Volume 4)
CBMS Poverty Maps: Science City of Muñoz
Map 4. Proportion of Households Living in Makeshift Housing, by Barangay, 2005
Mangandingay
Villa Isla
MapangpangSan Felipe
Rizal
Linglingay
Franza
San Andres
Licaong
CabisuculanMagtanggol
Villa CuizonBagong Sikat
Villa Santos
Calisitan Rang-ayan Bical
Pandalla
LabneyCalabalabaan
Naglabrahan
San Antonio
Curva
Maligaya
Palusapis
Matingkis
Gabaldon
Catalanacan
Pob South
Pob WestPob North
Pob EastVilla Nati
Sapang Cawayan
BantugBalante
Maragol
Bar angay M ag n i tude P r opor t i on
Bot tom 10 Barangays
MaragolMagtanggolSan FelipeSapang CawayanCurvaPoblacion Nor thPoblacion EastFranzaBantugPoblacion West
92533417112718216630
17.213.38.47.35.34.94.74.64.14.1

The Many Faces of Poverty (Volume 4)
9
CBMS Poverty Maps: Science City of Muñoz
Map 5. Proportion of Households who are Informal Settlers, by Barangay, 2005
Mangandingay
Villa Isla
MapangpangSan Felipe
Rizal
Linglingay
Franza
San Andres
Licaong
CabisuculanMagtanggol
Villa CuizonBagong Sikat
Villa Santos
Calisitan Rang-ayan Bical
Pandalla
LabneyCalabalabaan
Naglabrahan
San Antonio
Curva
Maligaya
Palusapis
Matingkis
Gabaldon
Catalanacan
Pob South
Pob WestPob North
Pob EastVilla Nati
Sapang Cawayan
BantugBalante
Maragol
Bar angay M ag n i tude P r opor t i on
Bot tom 10 Barangays
CatalanacanSapang CawayanLabneyPoblacion WestPoblacion Nor thCabisuculanMangandingayVilla CuizonPandallaLinglingay
952014421888538
18.18.68.45.83.33.22.52.31.71.6

10
The Many Faces of Poverty (Volume 4)
Map 6. Proportion of Households without Access to Safe Water Supply,by Barangay, 2005
CBMS Poverty Maps: Science City of Muñoz
Mangandingay
Villa Isla
MapangpangSan Felipe
Rizal
Linglingay
Franza
San Andres
Licaong
CabisuculanMagtanggol
Villa CuizonBagong Sikat
Villa Santos
Calisitan Rang-ayan Bical
Pandalla
LabneyCalabalabaan
Naglabrahan
San Antonio
Curva
Maligaya
Palusapis
Matingkis
Gabaldon
Catalanacan
Pob South
Pob WestPob North
Pob EastVilla Nati
Sapang Cawayan
BantugBalante
Maragol
Bar angay M ag n i tude P r opor t i on
Bot tom 10 Barangays
Rang-ayanLabneyCabisuculanMaragolBantugLicaongSan AntonioNaglabrahanPoblacion WestCalisitan
2241918272544151
52.111.47.35.11.61.60.90.80.70.6

The Many Faces of Poverty (Volume 4)
11
CBMS Poverty Maps: Science City of Muñoz
Map 7. Proportion of Households without Access to Sanitary Toilet Facilities, byBarangay, 2005
Mangandingay
Villa Isla
MapangpangSan Felipe
Rizal
Linglingay
Franza
San Andres
Licaong
CabisuculanMagtanggol
Villa CuizonBagong Sikat
Villa Santos
Calisitan Rang-ayan Bical
Pandalla
LabneyCalabalabaan
Naglabrahan
San Antonio
Curva
Maligaya
Palusapis
Matingkis
Gabaldon
Catalanacan
Pob South
Pob WestPob North
Pob EastVilla Nati
Sapang Cawayan
BantugBalante
Maragol
Bar angay M ag n i tude P r opor t i on
Bot tom 10 Barangays
San AndresMangandingaySapang CawayanVilla NatiBicalLabneyGabaldonRizalPalusapisCabisuculan
1611015452902962547730
50.331.423.122.120.517.416.916.315.012.1

12
The Many Faces of Poverty (Volume 4)
Table 2. Housing, Water and Sanitation Indicators, by Barangay, Science City of Muñoz, 2005
Households liv ing inmak eshif t hous ing
Households who arein f ormal sett l e rs
Households without accessto safe water supply
Households without accessto san itar y to i le t faci l it ies
Ba rang a y
P r opor t i onP r opor t i on P r opor t i on P r opor t i onMagni tude Magni tude Magni tude Magni tude
Bagong SikatBalanteBantugBicalCabisuculanCalabalabaanCalisitanCatalanacanCurvaFranzaGabaldonLabneyLicaongLinglingayMagtanggolMaligayaMangandingayMapangpangMaragolMatingkisNaglabrahanPalusapisPandallaPoblacion EastPoblacion NorthPoblacion SouthPoblacion WestRang-ayanRizalSan AndresSan AntonioSan FelipeSapang CawayanVilla CuizonVilla IslaVilla NatiVilla Santos
0166401131121143311532372920240182710309141534171210
2424380195003141863818002311814222152205222
2025018112120194200102711100205
224004010000
1255490301519332062291914392610102064779315215505416188541295212
0.38.03.420.512.17.710.90.61.44.416.917.47.52.89.83.631.4
03.72.93.315.05.20.82.70.52.111.716.350.31.92.023.10.56.222.17.6
00.34.10.90
0.50.60.65.34.63.81.81.22.213.33.22.21.717.2
01.70.80
4.74.92.54.12.10.31.23.58.47.30.50.40.40
0.51.31.50.73.20
0.618.1
00
0.88.40.41.61.50.42.50.91.500
0.41.70.33.30.35.80.50.60.31.20.58.62.30.40.81.3
0.50
1.60
7.30.50.60.40.50.40
11.41.60.400
0.30
5.10.50.80.200
0.40
0.752.1
00
0.90
0.40000

The Many Faces of Poverty (Volume 4)
13
CBMS Poverty Maps: Science City of Muñoz
Map 8. Proportion of Children 6-12 years old Not Attending ElementarySchool, by Barangay, 2005
Mangandingay
Villa Isla
MapangpangSan Felipe
Rizal
Linglingay
Franza
San Andres
Licaong
CabisuculanMagtanggol
Villa CuizonBagong Sikat
Villa Santos
Calisitan Rang-ayan Bical
Pandalla
LabneyCalabalabaan
Naglabrahan
San Antonio
Curva
Maligaya
Palusapis
Matingkis
Gabaldon
Catalanacan
Pob South
Pob WestPob North
Pob EastVilla Nati
Sapang Cawayan
BantugBalante
Maragol
Bar angay M ag n i tude P r opor t i on
Bot tom 10 Barangays
Poblacion EastVilla SantosRizalSan AndresSan FelipeLicaongPoblacion Nor thMatingkisVilla NatiSan Antonio
76284961614081283664
28.626.425.124.724.623.723.023.022.922.5

14
The Many Faces of Poverty (Volume 4)
Map 9. Proportion of Children 13-16 years old Not Attending High School, byBarangay, 2005
Mangandingay
Villa Isla
MapangpangSan Felipe
Rizal
Linglingay
Franza
San Andres
Licaong
CabisuculanMagtanggol
Villa CuizonBagong Sikat
Villa Santos
Calisitan Rang-ayan Bical
Pandalla
LabneyCalabalabaan
Naglabrahan
San Antonio
Curva
Maligaya
Palusapis
Matingkis
Gabaldon
Catalanacan
Pob South
Pob WestPob North
Pob EastVilla Nati
Sapang Cawayan
BantugBalante
Maragol
CBMS Poverty Maps: Science City of Muñoz
Bar angay M ag n i tude P r opor t i on
Bot tom 10 Barangays
Villa SantosCurvaVilla NatiVilla IslaPalusapisSan AndresSan FelipeLabneyRang-ayanPoblacion East
32474881846963337963
64.060.359.352.351.551.550.849.348.246.7

The Many Faces of Poverty (Volume 4)
15
Map 10. Proportion of Children 6-16 years old Not Attending School,by Barangay, 2005
CBMS Poverty Maps: Science City of Muñoz
Mangandingay
Villa Isla
MapangpangSan Felipe
Rizal
Linglingay
Franza
San Andres
Licaong
CabisuculanMagtanggol
Villa CuizonBagong Sikat
Villa Santos
Calisitan Rang-ayan Bical
Pandalla
LabneyCalabalabaan
Naglabrahan
San Antonio
Curva
Maligaya
Palusapis
Matingkis
Gabaldon
Catalanacan
Pob South
Pob WestPob North
Pob EastVilla Nati
Sapang Cawayan
BantugBalante
Maragol
Bar angay M ag n i tude P r opor t i on
Bot tom 10 Barangays
Villa SantosVilla NatiCurvaSan FelipePoblacion EastLicaongLinglingayBalanteSan AndresMangandingay
446261899152
122647567
28.225.924.323.922.721.320.319.919.719.1

16
The Many Faces of Poverty (Volume 4)
Table 3. Education Indicators, by Barangay, Science City of Muñoz, 2005
Number o fch i ld ren
( 6-12 years old)
Chi ld ren not attend inge lementar y school
(6-12 years old )
Number o fch i ld ren
( 13 -16 years old)
Chi ld ren not attend ingh igh school
(13-16 years old )
Number o fch i ld ren
( 6-16 years old)
Chi ld ren notattend ing school(6-16 years old )
Ba rang a y
M ag n i tude Magni tude Magni tudeP r opor t i on P r opor t i on P r opor t i on
Bagong SikatBalanteBantugBicalCabisuculanCalabalabaanCalisitanCatalanacanCurvaFranzaGabaldonLabneyLicaongLinglingayMagtanggolMaligayaMangandingayMapangpangMaragolMatingkisNaglabrahanPalusapisPandallaPoblacion EastPoblacion NorthPoblacion SouthPoblacion WestRang-ayanRizalSan AndresSan AntonioSan FelipeSapang CawayanVilla CuizonVilla IslaVilla NatiVilla Santos
24319511563301881531324221733152771191694063095722347239212287371122266353282549321195247285248183151354157106
3337236583931228536645319409161124501275289651876816010656496164613723693628
13.619.020.417.620.720.316.720.120.820.319.116.023.722.419.721.721.416.719.123.010.317.514.828.623.021.319.317.525.124.722.524.620.215.219.522.926.4
14912760917897698521078185117677519614131411743193874716360135163141277164124134144124103791558250
41591737745312482476446333384541155415742419841163485110379476962634732814832
27.546.528.443.346.444.928.239.160.334.639.349.344.042.938.336.646.234.938.327.640.451.518.346.729.536.237.248.237.951.543.150.845.640.552.359.364.0
3923221765508285222217632251500394186244602450886351115585209134534182401516423826485319381429372286230509239156
2664191854936311076170753452122791406713983118861691636311088567575895032956244
6.619.910.816.717.216.214.316.924.314.019.018.321.320.317.615.819.111.316.814.813.416.18.822.712.214.913.318.117.619.717.523.917.513.918.725.928.2

The Many Faces of Poverty (Volume 4)
17
CBMS Poverty Maps: Science City of Muñoz
Map 11. Proportion of Households with Income Below the Poverty Threshold, byBarangay, 2005
Mangandingay
Villa Isla
MapangpangSan Felipe
Rizal
Linglingay
Franza
San Andres
Licaong
CabisuculanMagtanggol
Villa CuizonBagong Sikat
Villa Santos
Calisitan Rang-ayan Bical
Pandalla
LabneyCalabalabaan
Naglabrahan
San Antonio
Curva
Maligaya
Palusapis
Matingkis
Gabaldon
Catalanacan
Pob South
Pob WestPob North
Pob EastVilla Nati
Sapang Cawayan
BantugBalante
Maragol
Bar angay M ag n i tude P r opor t i on
Bot tom 10 Barangays
San AndresMagtanggolCabisuculanLabneyMangandingayRizalPalusapisBicalLinglingayVilla Isla
279320198132247252382318347329
86.780.079.879.076.776.174.072.370.269.9
18
The Many Faces of Poverty (Volume 4)
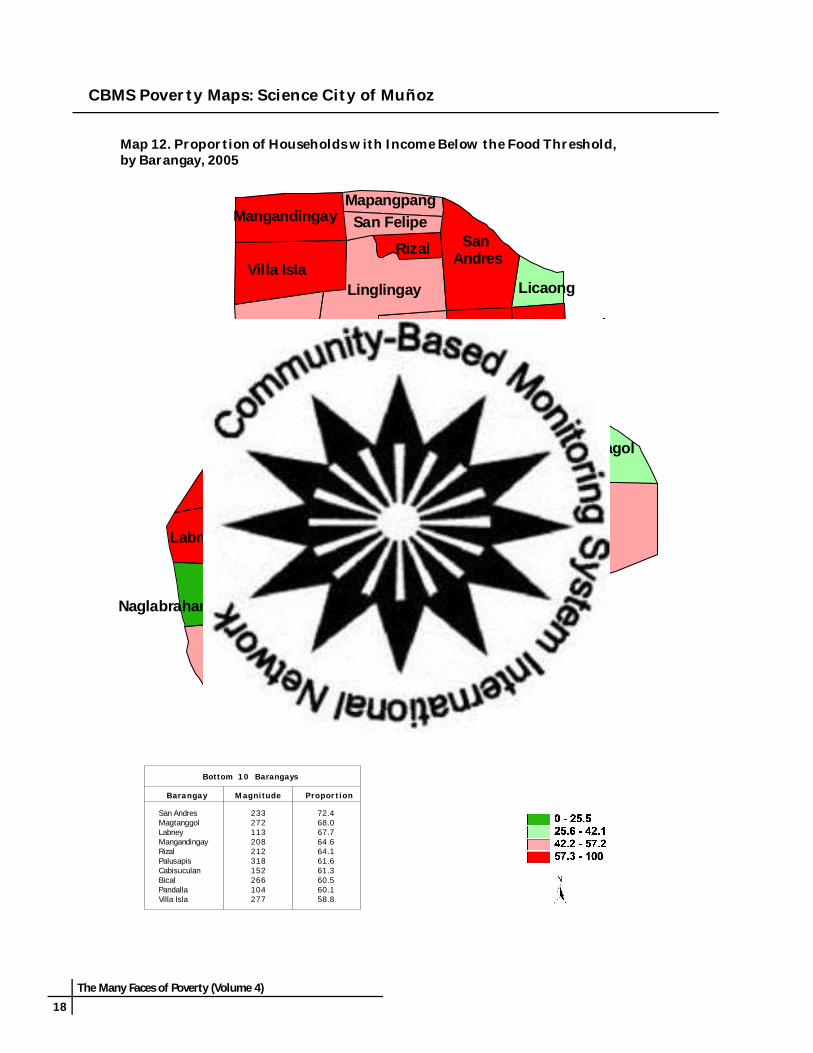
Map 12. Proportion of Households with Income Below the Food Threshold,by Barangay, 2005
Mangandingay
Villa Isla
MapangpangSan Felipe
Rizal
Linglingay
Franza
San Andres
Licaong
CabisuculanMagtanggol
Villa CuizonBagong Sikat
Villa Santos
Calisitan Rang-ayan Bical
Pandalla
LabneyCalabalabaan
Naglabrahan
San Antonio
Curva
Maligaya
Palusapis
Matingkis
Gabaldon
Catalanacan
Pob South
Pob WestPob North
Pob EastVilla Nati
Sapang Cawayan
BantugBalante
Maragol
CBMS Poverty Maps: Science City of Muñoz
Bar angay M ag n i tude P r opor t i on
Bot tom 10 Barangays
San AndresMagtanggolLabneyMangandingayRizalPalusapisCabisuculanBicalPandallaVilla Isla
233272113208212318152266104277
72.468.067.764.664.161.661.360.560.158.8

The Many Faces of Poverty (Volume 4)
19
Map 13. Proportion of Households who Experienced Food Shortage,by Barangay, 2005
CBMS Poverty Maps: Science City of Muñoz
Mangandingay
Villa Isla
MapangpangSan Felipe
Rizal
Linglingay
Franza
San Andres
Licaong
CabisuculanMagtanggol
Villa CuizonBagong Sikat
Villa Santos
Calisitan Rang-ayan Bical
Pandalla
LabneyCalabalabaan
Naglabrahan
San Antonio
Curva
Maligaya
Palusapis
Matingkis
Gabaldon
Catalanacan
Pob South
Pob WestPob North
Pob EastVilla Nati
Sapang Cawayan
BantugBalante
Maragol
Bar angay M ag n i tude P r opor t i on
Bot tom 10 Barangays
Sapang CawayanNaglabrahanLabneyCabisuculanGabaldonMagtanggolMapangpangPoblacion EastMangandingaySan Antonio
3913162021216
121012
17.010.79.68.15.85.35.23.13.12.8

20
The Many Faces of Poverty (Volume 4)
Households with incomebelow the pover ty th reshold
Households with incomebelow the food threshold
Households who experiencedfood shor tage
Table 4. Income Indicators, by Barangay, Science City of Muñoz, 2005
Ba rang a y
M ag n i tude M ag n i tude M ag n i tudeP r opor t i on P r opor t i on P r opor t i on
Bagong SikatBalanteBantugBicalCabisuculanCalabalabaanCalisitanCatalanacanCurvaFranzaGabaldonLabneyLicaongLinglingayMagtanggolMaligayaMangandingayMapangpangMaragolMatingkisNaglabrahanPalusapisPandallaPoblacion EastPoblacion NorthPoblacion SouthPoblacion WestRang-ayanRizalSan AndresSan AntonioSan FelipeSapang CawayanVilla CuizonVilla IslaVilla NatiVilla Santos
6619369831819812288305134302231132120347320363247682691264538212010715215527323025227928425312369329148109
17.461.743.672.379.862.649.757.864.165.863.179.047.270.280.050.576.758.650.361.837.274.069.427.827.738.937.453.576.186.766.462.352.631.569.961.969.0
3414147226615210249204101247175113792512722702085518395263181047285121155161212233233206784427711381
9.045.129.560.561.352.327.738.648.353.847.867.731.150.868.037.664.647.434.246.621.561.660.118.715.530.421.237.464.172.454.450.733.320.158.847.351.3
071802054205211614215106141131201211814450123391003
02.21.10
8.12.62.30.40
1.15.89.60.40.85.30.73.15.22.60.510.72.30
3.12.02.01.90.91.50
2.80.717.00.500
1.9

The Many Faces of Poverty (Volume 4)
21
Map 14. Unemployment Rate (15 years old and above), by Barangay, 2005
CBMS Poverty Maps: Science City of Muñoz
Mangandingay
Villa Isla
MapangpangSan Felipe
Rizal
Linglingay
Franza
San Andres
Licaong
CabisuculanMagtanggol
Villa CuizonBagong Sikat
Villa Santos
Calisitan Rang-ayan Bical
Pandalla
LabneyCalabalabaan
Naglabrahan
San Antonio
Curva
Maligaya
Palusapis
Matingkis
Gabaldon
Catalanacan
Pob South
Pob WestPob North
Pob EastVilla Nati
Sapang Cawayan
BantugBalante
Maragol
Bar angay M ag n i tude P r opor t i on
Bot tom 10 Barangays
BalanteMangandingayPandallaMapangpangMaligayaMaragolSapang CawayanPoblacion WestFranzaLinglingay
1451215246
25719081
216125131
26.423.220.720.019.918.418.217.417.317.2

22
The Many Faces of Poverty (Volume 4)
Map 15. Proportion of Persons who are Victims of Crime, by Barangay, 2005
Mangandingay
Villa Isla
MapangpangSan Felipe
Rizal
Linglingay
Franza
San Andres
Licaong
CabisuculanMagtanggol
Villa CuizonBagong Sikat
Villa Santos
Calisitan Rang-ayan Bical
Pandalla
LabneyCalabalabaan
Naglabrahan
San Antonio
Curva
Maligaya
Palusapis
Matingkis
Gabaldon
Catalanacan
Pob South
Pob WestPob North
Pob EastVilla Nati
Sapang Cawayan
BantugBalante
Maragol
CBMS Poverty Maps: Science City of Muñoz
Bar angay M ag n i tude P r opor t i on
Bot tom 16 Barangays
MangandingayLabneySapang CawayanMapangpangPoblacion SouthVilla NatiCalisitanBantugPoblacion Nor thRizalVilla SantosBagong SikatGabaldonBicalCatalanacanPoblacion West
2511154832
1442122222
1.81.51.50.80.40.30.20.20.20.10.10.10.10.10.10.1

The Many Faces of Poverty (Volume 4)
23
Table 5. Unemployment and Victims of Crime Indicators, by Barangay, Science City of Muñoz,2005
Unemployment rate(15 years old and above)
Persons who are vict ims ofcr imes
Number o f personsin the labor fo rce
(15 years old and above)
Ba rang a y
P r opor t i onP r opor t i on M ag n i tudeM ag n i tude
Bagong SikatBalanteBantugBicalCabisuculanCalabalabaanCalisitanCatalanacanCurvaFranzaGabaldonLabneyLicaongLinglingayMagtanggolMaligayaMangandingayMapangpangMaragolMatingkisNaglabrahanPalusapisPandallaPoblacion EastPoblacion NorthPoblacion SouthPoblacion WestRang-ayanRizalSan AndresSan AntonioSan FelipeSapang CawayanVilla CuizonVilla IslaVilla NatiVilla Santos
5825502466784339309337887450723604289384764670129252123010353061788922516209856881243757493466793705446361708451330
6014530876153245702012528266413188257121461903618147525415611321685781876748137726428
10.326.412.59.74.410.413.47.94.417.34.69.016.717.213.119.923.220.018.411.810.116.520.78.715.816.417.411.215.83.99.610.518.210.310.214.28.5
20142002201211000125400010048202000150031
0.10
0.20.100
0.20.10
0.00.11.5000
0.01.80.8000
0.000
0.20.40.10
0.1000
1.500
0.30.1

24
The Many Faces of Poverty (Volume 4)
Map 16. CBMS Composite Indicator, by Barangay, 2005
Mangandingay
Villa Isla
MapangpangSan Felipe
Rizal
Linglingay
Franza
San Andres
Licaong
CabisuculanMagtanggol
Villa CuizonBagong Sikat
Villa Santos
Calisitan Rang-ayan Bical
Pandalla
LabneyCalabalabaan
Naglabrahan
San Antonio
Curva
Maligaya
Palusapis
Matingkis
Gabaldon
Catalanacan
Pob South
Pob WestPob North
Pob EastVilla Nati
Sapang Cawayan
BantugBalante
Maragol
Bar angay A v er ag e
Bot tom 10 Barangays
CBMS Poverty Maps: Science City of Muñoz
San AndresMangandingayLabneyMagtanggolRizalSapang CawayanCabisuculanRang-ayanPalusapisBical
2.32.32.32.11.91.91.91.91.91.9
The Many Faces of Poverty (Volume 4)
25
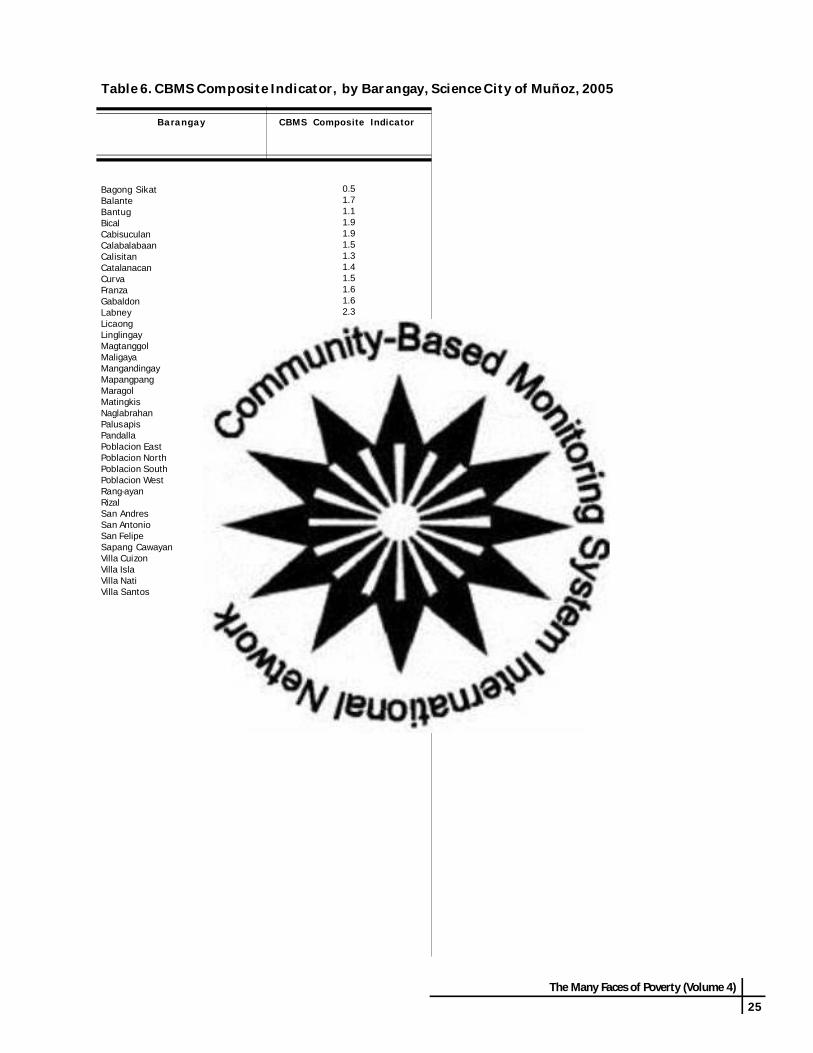
Table 6. CBMS Composite Indicator, by Barangay, Science City of Muñoz, 2005
Ba rang a y CBMS Composite Indicator
Bagong SikatBalanteBantugBicalCabisuculanCalabalabaanCalisitanCatalanacanCurvaFranzaGabaldonLabneyLicaongLinglingayMagtanggolMaligayaMangandingayMapangpangMaragolMatingkisNaglabrahanPalusapisPandallaPoblacion EastPoblacion NorthPoblacion SouthPoblacion WestRang-ayanRizalSan AndresSan AntonioSan FelipeSapang CawayanVilla CuizonVilla IslaVilla NatiVilla Santos
0.51.71.11.91.91.51.31.41.51.61.62.31.31.72.11.42.31.61.51.41.01.91.60.90.91.11.11.91.92.31.61.61.90.91.71.71.7
