faces of poverty report 2012
DESCRIPTION
Greater Twin Cities United Way has identified poverty as one of the biggest issues threatening our region. This in-depth report provides the most current information about how poverty is affecting the Twin Cities metro area and how United Way is working to create pathways out of poverty for those in need in our community.TRANSCRIPT

GREATER TWIN CITIES UNITED WAYF A C E S O F P O V E R T Y 2 0 1 2

1 | P a g e
Acknowledgements:
Greater Twin Cities United Way would like to thank our external reviewers who reviewed an earlier
version of this report: Timothy M. Smeeding, director of the Institute for Research on Poverty in
Madison, Wisconsin, and Pamela J. Loprest, director of the Center on Income and Benefits Policy at the
Urban Institute in Washington, D.C. Both provided detailed feedback about the report. We appreciate
the time and effort that they put into the review process, which resulted in a much-improved document.
Authors:
Devon Meade
Devon Meade is a senior research analyst at Greater Twin Cities United Way. He holds an MSc from the
London School of Economics and Political Science in international housing and social change. Devon’s
focus areas include poverty, economics, demography, return-on-investment analysis, and geographic
information systems. He has been with United Way for 11 years and authored several reports on basic
needs, immigration, health and education. Contact Devon at (612) 340-7420 or
Elizabeth Peterson
Elizabeth Peterson is the director of research and planning at Greater Twin Cities United Way. She has a
Ph.D. in educational psychology with special emphases in statistics and research methods. She has been
with United Way for 20 years, and is in charge of tracking community trends and issues, identifying
community needs, measurement, researching best practices, and working with impact area directors on
strategic planning. She also authors the United Way Blog at www.unitedwaytwincities.org/blog. Contact
Liz at (612) 340-7429 or [email protected].
Copyright ©2012 by Greater Twin Cities United Way.
Greater Twin Cities United Way
404 South Eighth Street Minneapolis, MN 55404
www.unitedwaytwincities.org

2 | P a g e
Table of Contents Table of Contents .......................................................................................................................................... 2
Acknowledgements ....................................................................................................................................... 1
Introduction .................................................................................................................................................. 3
Defining Poverty............................................................................................................................................ 8
Poverty Dynamics ....................................................................................................................................... 11
Macroeconomic Impacts on Poverty ...................................................................................................... 11
Income Distribution ................................................................................................................................ 13
Poverty Transitions and Intragenerational Income Mobility .................................................................. 14
Situational Poverty ...................................................................................................................................... 19
Employment Stability .............................................................................................................................. 21
Family Stability and Change .................................................................................................................... 25
Immigrants .............................................................................................................................................. 28
Poverty and Health Care Costs ............................................................................................................... 30
Chronic and Intergenerational Poverty ...................................................................................................... 34
Intergenerational Income Mobility ......................................................................................................... 35
Asset Poverty and Wealth Mobility ........................................................................................................ 36
Children in Poverty.................................................................................................................................. 39
Hard-To-Serve Singles ............................................................................................................................. 42
Veterans .............................................................................................................................................. 42
Ex-Inmates........................................................................................................................................... 43
Victims of Domestic Violence ............................................................................................................. 44
Seniors ..................................................................................................................................................... 45
People with Disabilities ........................................................................................................................... 48
Conclusion ................................................................................................................................................... 50
Appendix ..................................................................................................................................................... 50
Data Tables.................................................................................................................................................. 54
References .................................................................................................................................................. 59

3 | P a g e
Introduction The negative consequences of poverty are undeniable–both on individual and community levels.
Growing up in poverty can have tremendous long-term consequences on a person’s well-being. Among
these are developmental declines, more difficulty in school, and worse health outcomes. At a societal
level, having a significant and increasing population in poverty strains our resources as we provide basic
needs for those without and provide health care through largely inadequate mechanisms. Poverty also
threatens the long-term competitiveness of our region because a well-trained and educated,
technologically sophisticated workforce is key to economic success in the 21st century. Finally, poverty
also has a nonfinancial cost: Having many of our neighbors living on the edge rends the very fabric of our
community. For these reasons and others, Greater Twin Cities United Way leads efforts to create
pathways out of poverty. However, dealing with this complex problem requires an understanding of
poverty from a variety of angles. That is the purpose of this report.
Current Economic Context
Three tumultuous macroeconomic trends over the last decade created the context for an increase in
poverty and inequality: the bursting of the housing price bubble and home mortgage foreclosure crisis,
sharp declines in stock market prices, and record-breaking unemployment levels.
After a period of hyperinflation, home prices began to fall, and between 2005 and 2009, Minnesota
home prices decreased 19 percent (Taylor, Kochhar, Fry, Velasco, & Motel, 2011). Along with these
steep declines was a dramatic increase in foreclosures, with more than 100,000 home mortgages ending
in foreclosure since 2007 in Minnesota (HousingLink, 2011).
The Great Recession was historic in many ways. The most visible labor market effect was the loss
nationally of 7.5 million jobs during its official duration, causing Minnesota’s unemployment rate to rise
from 4.7 percent in December 2007 to 8.5 percent in May 2009. One of the most troubling impacts has
been an increase in the number of long-term unemployed. Minnesota had 17,400 residents that had
been unemployed for more than six months in 2007. Four years later, in June 2011, this had increased to
75,800, including 47,700 that had been unemployed for more than a year (Rohrer, 2011). Not
surprisingly, employment and income have significant impacts on poverty rates. In Minnesota, an
increase in the unemployment rate of 1 percent increases the poverty rate by 0.2 percentage points,
and a 1 percent increase in median earnings reduces poverty by 0.2 percentage points (Grunewald,
2006).
These trends, along with others, are all part of a larger trend of increasing income inequality. Recently
released research from the Congressional Budget Office shows that between 1979 and 2007 the average
real after-tax household income for the lowest 20 percent of earners had grown just 18 percent. This is
compared to 65 percent growth among the 20 percent with the highest incomes and a startling 275
percent growth for the top 1 percent of earners (2011).

4 | P a g e
Poverty in a Static View
There are two ways we seek to understand this issue. The first is to perform a static census–that is, to
take a snapshot of those in poverty at a given point in time. This allows us to consider the demographics
of those in poverty and to compare them to those of our community at large. From this we see that
nationally and locally, more people are living in poverty today than at any time in the measure’s 50-year
recorded history. In the United States, 1 in 7 people lives at or below the federal poverty level. In
Minnesota, the figure is 1 in 10.1
But who are the people struggling to make ends meet? Generally speaking poverty is highest, and
increasing fastest, for children, populations of color (particularly, African Americans, American Indians,
and Hispanics/Latinos), those with low-education levels, and single mothers.
There are also varying degrees of poverty. United Way typically uses 200 percent of poverty to define
those most in need. If you consider the number of people living at or below 200 percent of poverty
($44,700 for a family of four—an income that still doesn’t stretch to meet a household’s basic needs),
the numbers jump to 1 in 3 nationally and 1 in 4 in Minnesota. Even at twice the official poverty level
families are not earning enough to meet their basic needs. According to the Jobs Now Coalition, basic
necessities (food, housing, clothing, health care, child care) for a Minnesota family of four require an
annual income of $56,400. A family of four living at 200 percent of poverty ($44,700) has a gap of
$11,700 in meeting their basic needs by this measure.
1 For purposes of this report, we will primarily use the official poverty line as defined by the federal government,
despite its shortcomings (see “Defining Poverty” on the following pages), because that is the focus of the vast majority of the poverty research.
Wh
ite
Afr
ican
Am
eri
can
0 t
o 5
24
.8%
7.0
%
Am
eri
can
Ind
ian
6 t
o 1
7
10
.1%
4.3
%
Asi
an/P
I
18
to
64
7.2
%
34
.0%
His
pan
ic/L
atin
o
65
+
3.0
%
Race Age Education Household Composition
Minnesota Poverty Rates, 2010
Source: 2010 American Community Survey, 3-year estimates
8.6
%
34
.8%
37
.9%
16
.9%
24
.4%
16
.1%
12
.9%
10
.3%
8.6
%
Less
th
an h
igh
sch
oo
l
Hig
h s
cho
ol g
rad
. (o
r e
qu
iv.)
Som
e c
olle
ge
BA
de
gre
e o
r h
igh
er
All
fam
ilie
s
Mar
rie
d c
ou
ple
, kid
s <
18
Fem
ale
-he
ade
d,
kid
s <
18

5 | P a g e
At the other end of the poverty spectrum is extreme (or deep) poverty—people with family incomes less
than half the official poverty level, or $11,175 for a family of four. The percentage of people
experiencing extreme poverty has increased over the last few years and nationally, as of 2010 (the most
recent year for which data are available), 43.6 percent of the poverty population (i.e., people living at or
below 100% of the official federal poverty line) was living in extreme poverty, up from 43.3 percent in
2009 and 42.9 percent in 2008. In Minnesota, the percentage of the poverty population living in extreme
poverty increased from 42.3 percent in 2008, to 43.7 percent in 2010 (U.S. Census Bureau, 2010).
Because families living in extreme poverty have such limited resources (even compared to people at
100% of poverty), it is much more challenging for them to climb out of poverty and they are almost
certainly overrepresented in the long-term or chronic poverty population. Rates of extreme poverty are
higher among children and African Americans and lower among whites, Asians, and elders (Iceland,
2006).
Poverty in a Dynamic View
But what happens when you look a little deeper? A second way to understand the population of those in
poverty is from a dynamic perspective. To do this, we consider not only who is in poverty at a given
point in time, but also who is moving into or out of poverty. This approach has three advantages. First, it
gives us a more complete view of the number of people living on the edge. While the fact that 11
percent of Minnesota’s population is living in poverty is startling, this statistic underrepresents the true
scale of the problem because of the rate at which people cycle into and out of poverty. The second
advantage of this approach is that it can help us understand the life events most often associated with
moving in and out of poverty. Finally, it can help us understand for what portions of the population
poverty is an intransigent problem. That is, it can uncover which people are most likely to stay in poverty
for years and even generations.
Recently released longitudinal research shows that approximately three-quarters of those that are poor
are experiencing short-term poverty compared to roughly a quarter that are considered chronically poor
0
5
10
15
20
25
30
35
40
45
1975 1980 1985 1990 1995 2000 2005 2010
Pe
rce
nt
Percent of Poverty Population in Extreme Poverty, U.S. (below 50% Federal Poverty Guidelines)
Recession Extreme PovertySource: U.S. Census Bureau
6 | P a g e
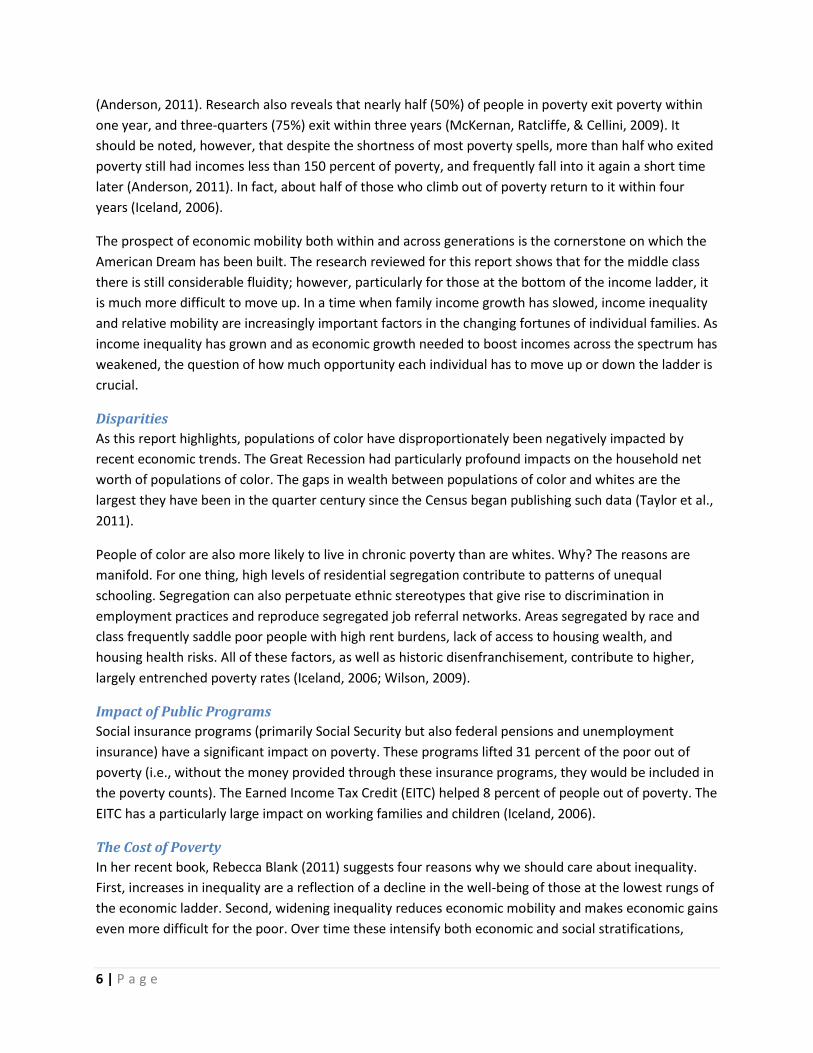
(Anderson, 2011). Research also reveals that nearly half (50%) of people in poverty exit poverty within
one year, and three-quarters (75%) exit within three years (McKernan, Ratcliffe, & Cellini, 2009). It
should be noted, however, that despite the shortness of most poverty spells, more than half who exited
poverty still had incomes less than 150 percent of poverty, and frequently fall into it again a short time
later (Anderson, 2011). In fact, about half of those who climb out of poverty return to it within four
years (Iceland, 2006).
The prospect of economic mobility both within and across generations is the cornerstone on which the
American Dream has been built. The research reviewed for this report shows that for the middle class
there is still considerable fluidity; however, particularly for those at the bottom of the income ladder, it
is much more difficult to move up. In a time when family income growth has slowed, income inequality
and relative mobility are increasingly important factors in the changing fortunes of individual families. As
income inequality has grown and as economic growth needed to boost incomes across the spectrum has
weakened, the question of how much opportunity each individual has to move up or down the ladder is
crucial.
Disparities
As this report highlights, populations of color have disproportionately been negatively impacted by
recent economic trends. The Great Recession had particularly profound impacts on the household net
worth of populations of color. The gaps in wealth between populations of color and whites are the
largest they have been in the quarter century since the Census began publishing such data (Taylor et al.,
2011).
People of color are also more likely to live in chronic poverty than are whites. Why? The reasons are
manifold. For one thing, high levels of residential segregation contribute to patterns of unequal
schooling. Segregation can also perpetuate ethnic stereotypes that give rise to discrimination in
employment practices and reproduce segregated job referral networks. Areas segregated by race and
class frequently saddle poor people with high rent burdens, lack of access to housing wealth, and
housing health risks. All of these factors, as well as historic disenfranchisement, contribute to higher,
largely entrenched poverty rates (Iceland, 2006; Wilson, 2009).
Impact of Public Programs
Social insurance programs (primarily Social Security but also federal pensions and unemployment
insurance) have a significant impact on poverty. These programs lifted 31 percent of the poor out of
poverty (i.e., without the money provided through these insurance programs, they would be included in
the poverty counts). The Earned Income Tax Credit (EITC) helped 8 percent of people out of poverty. The
EITC has a particularly large impact on working families and children (Iceland, 2006).
The Cost of Poverty
In her recent book, Rebecca Blank (2011) suggests four reasons why we should care about inequality.
First, increases in inequality are a reflection of a decline in the well-being of those at the lowest rungs of
the economic ladder. Second, widening inequality reduces economic mobility and makes economic gains
even more difficult for the poor. Over time these intensify both economic and social stratifications,

7 | P a g e
having particularly negative long-term impacts on populations of color and single mothers. Third,
inequality may have an impact on aggregate economic growth over time. Finally, increasing inequality
may affect civic and social behavior outside of economic markets.
The costs of childhood poverty to the United States total about $500 billion per year—the equivalent of
nearly 4 percent of the GDP.2 Specifically:
Childhood poverty reduces productivity and economic output by about 1.3 percent of GDP annually.
Childhood poverty raises the costs of crime by about 1.3 percent of GDP annually.
Childhood poverty raises health expenditures and reduces the value of health by 1.2 percent of GDP annually. (Holzer, Schanzenbach, Duncan, & Ludwig, 2007).
Thus it is not just a moral case that can be made for ending poverty, but an economic case as well.
Poverty carries a cost for all of society, not just those who experience it; it reduces the economic
potential of our country as a whole. According to calculations conducted by the Center for American
Progress, “we could raise our overall consumption of goods and services and our quality of life by about
a half trillion dollars a year if childhood poverty were eliminated”3 (Holzer, Schanzenbach, Duncan, &
Ludwig, 2007).
2 GDP, or Gross Domestic Product, is a measure representing the total value of all goods and services produced by
labor and property in the United States. 3 These are conservative estimates. The range of estimates is fairly high, and the authors consistently tended
towards the lower ends of the estimates.

8 | P a g e
Defining Poverty Poverty in essence refers to economic or income deprivation. Poverty can be defined by absolute
measures or by relative measures. Absolute measures attempt to define a basic (absolute) needs
standard and they remain constant over time (adjusted for inflation). The current U.S. poverty measure
is an absolute measure. Relative measures (more common in Europe) define poverty as a condition of
comparative disadvantage, and they are adjusted as standards of living rise or fall. In the 1990s, the
National Academy of Sciences developed a quasi-relative measure which combines elements of absolute
and relative measures.
There are also subjective measures of poverty, which are based on public opinion of what minimum
income is needed to exceed the threshold of “poor.”
Official Poverty Measure
The official U.S. poverty measure was developed in the mid-1960s, when food accounted for one-third
of the average household budget. Poverty levels are set by using the U.S. Department of Agriculture’s
Thrifty Food Plan for different family sizes and multiplying it by three. Spending patterns have changed
since the 1960s, however, and food now accounts for only 10-15 percent of the average household
budget. If the same logic was used today to calculate poverty levels, using the more conservative
estimate of 15 percent of household income for food, the poverty level for an individual would be
$24,200 rather than the official $10,890; and the poverty level for a family of four would be $49,667
rather than $22,350. These numbers are comparable to the income guidelines provided by the Jobs Now
Coalition for a Minnesota family to meet its basic needs.
2011 HHS Poverty Guidelines
48 Contiguous States and D.C.
Persons in Family 100% 200%
1 $10,890 $21,780
2 $14,710 $29,420
3 $18,530 $37,060
4 $22,350 $44,700
5 $26,170 $52,340
6 $29,990 $59,980
7 $33,810 $67,620
8 $37,630 $74,720
For each additional person, add
$3,820 $7,640
Source: Federal Register, Vol. 76, No. 13, January 20, 2011, pp. 3637-3638

9 | P a g e
Supplemental Poverty Measure
In 2010 an interagency technical working group which included representatives from the Bureau of
Labor Statistics, Census Bureau, Council of Economic Advisors, the U.S. Department of Health and
Human Services along with others, issued a series of suggestions to the Census Bureau on how to
develop a Supplemental Poverty Measure. The new measure is a more complex statistic which
incorporates items such as tax payments and work expenses in its family resource estimates. The
thresholds are derived from the Consumer Expenditure survey expenditure data on basic necessities
(food, shelter, clothing and utilities) and are adjusted for geographic differences in the cost of housing.
The new measure is intended to be an indicator of economic well-being and will provide a better
understanding of economic conditions and policy effects.
Poverty Measure Concepts: Official and Supplemental Official Poverty Measure Supplemental Poverty Measure
Measurement units Families and unrelated individuals
All related individuals who live at the same address, including any co-resident unrelated children who are cared for by the family (such as foster children) and any cohabitors and their children.
Poverty threshold Three times the cost of minimum food diet in 1963
The 33rd
percentile of expenditures on food, clothing, shelter, and utilities (FCSU) of consumer units with exactly two children multiplied by 1.2.
Threshold adjustments Vary by family size, composition, and age of householder
Geographic adjustments for differences in housing costs and a three parameter equivalence scale for family size and composition.
Updating thresholds Consumer Price Index: all items Five year moving average of expenditures on FCSU.
Resource measure Gross before-tax cash income Sum of cash income, plus in-kind benefits that families can use to meet their FCSU needs, minus taxes (or plus tax credits), minus work expenses, minus out-of-pocket medical expenses.
Source: Short, 2011
The most significant difference between the old measure and the new comes from a special tabulation
of data of those individuals between 100 and 150 percent of poverty defined by the Supplemental
Poverty measure. This data shows that 51 million individuals have incomes in this range, which is 76
percent higher than the official account for 2010. This places 100 million people, or roughly 30 percent,
of the American population either in poverty or just above.
Comparison of Poverty Measures United States, 2010
Numbers in thousands Official Poverty Measure Supplemental Poverty Measure
Less than 100% 46,602 49,094 100-150% 29,111 51,365 150+% 230,397 205,651 Total 306,110 306,110
Source: U.S. Census Bureau Special Tabulation

GREATER TWIN CITIES UNITED WAYF A C E S O F P O V E R T Y 2 0 1 2
P O V E R T Y D Y N A M I C S

11 | P a g e
Poverty Dynamics Poverty dynamics reflect a complex set of interactions between demographic trends and labor market
conditions. Influencing factors include education, family structure, workforce participation, gender, age,
country of birth, geography, and socialization. The biggest influencing factor is the economy.
Macroeconomic Impacts on Poverty It comes as no surprise that overall economic performance has a cyclical impact on poverty. A strong
economy means higher job creation and lower unemployment. For those living in poverty, labor force
expansions are particularly beneficial. A tight labor market also means that previously unemployed and
part-time workers have more opportunity for employment. Employers often turn to less traditional
sources of labor, providing training to workers who otherwise might not have been considered for more
skilled positions under different economic conditions (Blank, 2000).
Historically, poverty has increased during recessions and decreased during times of economic growth.
Research over the last decade, however, has found that the relationship between changes in the
poverty rate and macroeconomic variables is weakening. The mid 1980s economic expansion was the
first in recent history not to be linked to a notable decline in poverty. The reason for this is that, unlike
previous lengthy expansions, it was not accompanied by wage growth (Blank, 2000; Hoynes, Page, &
Stevens, 2005; Wirtz, 2006a).
As can be seen in the figure above, after the 1980s recession, there was significant income growth
among the highest earners. However, wages actually declined for the poorest. During the expansion
from 1983 to 1990, people in the lowest quartile saw a decrease in unemployment due to an increase in
$0
$20,000
$40,000
$60,000
$80,000
$100,000
$120,000
$140,000
$160,000
$180,000
1968 1971 1974 1977 1980 1983 1986 1989 1992 1995 1998 2001 2004 2007 2010
Mean Household Income Received by Income Quintile: U.S. 1967 to 2010 (in 2010 Dollars)
Richest
Fourth
Third
Second
Poorest
Recession
Sources: U.S. Census Bureau & Bureau of Labor Statistics

12 | P a g e
hours worked; however, the decline in wages offset the gains in income that they would have otherwise
experienced. The expansion in the 1990s brought some increase in wages, but not enough to make up
for the previous two decades of wage decline. This reinforced the premise that sustained economic
growth is beneficial to the poor only to the extent to which wage growth occurs (Blank, 2000).
Several structural shifts and influencing
factors have contributed to the downward
trend in wages of less-educated workers.
One of the leading forces shaping this
trajectory has been the significant change in
the structure of the job market in the United
States. This market has become steeply
polarized over the past two decades with the
strongest growth in high-skill, high-wage
occupations and low-skill, low-wage
occupations, coupled with contracting
opportunities in middle-wage, middle-skill
jobs. In the years leading up to the Great
Recession employment growth was heavily
concentrated among low-wage jobs in the
service sector such as fast food, banking, child
care, and health care attendants (Autor, 2010;
Brady, 2006; Newman, 1995; Rynell, 2008).
The slowing rate of four-year college degree
attainment among young adults is another contributing factor. Since the late 1970s, the rate of college
degree attainment has not kept up with rising demand for skilled workers; this trend has been
particularly severe for males. The rising wage premium that accompanies educational attainment
conveys positive economic news but it also masks a more discouraging truth: The increase in relative
earnings of college graduates are not just due to a rise in real earnings but also to the falling real
earnings of noncollege graduates (Autor, 2010).
A related consequence of these economic trends has been a decline in household wealth and income as
well as an increase in income inequality. The inflation-adjusted real median income in the Twin Cities
metro area fell more than 11 percent, from $70,399 in 2000 to $62,352 in 2010. Statewide, median
income fell almost $6,000 over the last decade, to levels not seen since 1989 (U.S. Census Bureau, 2000,
2010).
This “hollowing out” of the middle of the job market has had different consequences for men and
women. Females generally moved upward in the occupational distribution as they departed the center
while males moved in roughly equal measures towards the top and the bottom. The Great Recession
generally reinforced this trend rather than moderating it. In particular, jobs and earnings losses were far
0%
10%
20%
30%
40%
50%
60%
70%
80%
90%
100%
1965 1970 1975 1980 1985 1990 1995 2000 2005 2010
Per
cen
t o
f To
tal E
mp
loym
ent
Changes in Goods and Service Producing Sectors, U.S. 1965 to 2010
Goods Producing Employment
Service Providing Employment
Source: Bureau of Labor Statistics

13 | P a g e
greater for men with low educational attainment than for women with lower levels of education. As
these males have moved out of the middle-skill blue-collar jobs, they have generally moved down in
occupational skill and earnings (Autor, 2010).
William Julius Wilson’s work highlights the role that manufacturing jobs played for African-American
men and how the disappearance of these jobs in the U.S. increased poverty rates for less-skilled workers
and families—particularly in urban areas. Not only do African Americans more often reside in
communities that have higher jobless rates and lower unemployment growth, but as over two-thirds of
employment growth in metropolitan areas has occurred in the suburbs, many have become physically
isolated from places of employment and socially isolated from the informal job networks that are often
crucial for job placement (Wilson, 1996, 2009).
Other factors include competition for jobs on a global scale, immigration, the decline in the real value of
the minimum wage, the increase in use of temporary workers, and the decline of unions (Jones &
Weinberg, 2000).
Income Distribution The Great Recession had significant impacts on household wealth. After adjusting for inflation, the
median net wealth, or net worth, of U.S. households fell from $96,894 in 2005 to $70,000 in 2009, a
drop of 28 percent for the general population. While all racial and ethnic groups experienced drops in
wealth there were sharp differences among them. From 2005
to 2009, the inflation-adjusted median wealth of Hispanic
households fell 66 percent; it declined 53 percent among
African Americans and 16 percent among whites. As a result of
these declines, in 2009, the typical African American household
had just $5,677 in wealth (assets minus debts), and the typical
Hispanic household had $6,325. This is compared to a typical
white household which had on average $113,149 in wealth. In
other words, the median wealth of white households is 20
times that of African American households and 18 times that of
Hispanic households. These ratios are the largest since the
government began publishing this data 25 years ago, and
roughly twice the size of what they had been for the two
decades prior to the Great Recession (Taylor et al., 2011).
The use of quintiles, for comparing aggregate shares of household income received by each fifth of the
distribution, is a common method of examining income inequality. The table on the next page shows the
income quintile cutoffs for Minnesota in 2010. The aggregate share of income held by households in the
poorest quintile is 3.8 percent compared to 47.9 percent in the highest.
-16%
-66%
-53%
Whites
Hispanics
African Americans
Percent Change in Median Net Worth of Households,
U.S., 2005 to 2009
Source: Taylor et. al., 2011, Pew Research Center

14 | P a g e
Income Distribution Quintiles, Minnesota 2010 Quintile Quintile Upper
Limits Mean Income of
Quintile Percent Shares of Aggregate Income
Poorest $24,549 $13,727 3.8% 2nd $45,171 $34,694 9.5% 3rd $69,305 $56,689 15.6% 4th $103,492 $84,827 23.3%
Richest (lower limit)
$181,155 $174,314 47.9%
Source: 2010 American Community Survey, 3 year estimates
The median wage for all job vacancies in Minnesota (2th Qtr. 2011) falls within the lowest quintile
($20,800 if the job is full-time). Jobs within this quintile are often part-time (38%) and require no
education beyond high school (58%). Of the top 10 highest demand jobs in Minnesota, seven have no
educational requirements and provide on-the-job training. Two require vocational training, and one
requires an associate degree. The average median wage for these 10 occupations if the work is full-time,
is $30,731 ($14.77/hour). If registered nurses are taken out of the equation (median annual wage of
$73,384) the median wage for the remaining nine drops to $25,991 ($12.50/hour) (Minnesota
Department of Employment and Economic Development, 2011).
Poverty Transitions and Intragenerational Income Mobility Understanding how, why, and when an individual or family moves into or out of poverty reveals a much
more complete picture of the nation’s poor. It’s important to know what events lead people into
poverty and what helps them leave poverty. Findings from research show that, contrary to common
belief, large portions of the U.S. population will experience poverty at some point, and that poverty
spells most often are between one and four years long. Half (50%) of those who become poor in a given
year exit poverty a year later, and three-quarters (75%) of poverty spells last less than four years (Cellini,
McKernan, & Ratliffe, 2008). Research has shown that slightly more than half (51%) of the U.S.
population experiences poverty at some point before the age of 65, and that increases to 59 percent by
age 75. One’s chances of becoming poor are higher for younger people, African Americans,
Hispanics/Latinos, those in households headed by women, and those with lower levels of education
(McKernan, Ratcliffe, & Cellini, 2009; Rank, 2007).
The likelihood of exiting poverty in any given year is about 1 in 3. For African Americans, households
headed by single women, and households with more children, the chances are lower. Among those who
exit poverty, roughly half will become poor again within five years. Further, for those who were in a
poverty spell for at least five years and then escaped, the chances of their returning to poverty are two-
thirds. The longer the poverty spell, the less likely one is to escape and the more likely to return to
poverty after exiting (Cellini, McKernan, & Ratliffe, 2008).
While the notion that poverty is transient is important, it is different from the notion of income mobility.
Mobility is a more accurate measure of moving individuals from the bottom 20 percent of earners to a
higher bracket over time, rather than just over the poverty line. It answers the question of whether it is

15 | P a g e
harder or easier for one to get ahead and stay ahead. Changes in economic mobility are crucial during
times of growing economic inequality as it impacts the degree to which families and individuals can
move up and down the economic ladder (Bradbury & Katz, 2009; Wirtz, 2006a).
The Survey of Income and Program Participation (SIPP) is the U.S. Census Bureau’s longitudinal study
that provides a dynamic view of poverty. The SIPP interviews a representative sample of U.S. households
every four months. The most recently released analysis, March 2011, focuses on data collected in the
first 36 months of the 2004 panel. Results show that overall, 55.4 percent of households remained in the
same income quintile in 2007 as they had three years earlier, with the remaining 44.6 percent
experiencing either upward or downward mobility across the income distribution (Hisnanick & Giefer,
2011). The most interquartile movement occurred in the middle three quartiles, and the least mobility
occurred among those in the top and bottom groups.
Among U.S. households, 69.1 percent in the bottom quintile and 67.8 percent in the top were in the
same quintile in 2004 and 2007. In comparison, 49.2 percent of those that began in the second, 44.4
percent of those that began in the middle, and 46.5 percent of those that began in the fourth remained
in the same quintile (Hisnanick & Giefer, 2011).
69.1
20.2
6.3 3.2 1.3
19.3
49.2
22.0
7.5 2.0
6.3
19.2
44.4
22.6
7.4
3.7 8.1
20.3
46.5
21.5
1.6 3.3 7.0
20.3
67.8
Bottom quintile in2004 (<$22,367)
Second quintile in2004 (<$22,367-
$40,015)
Middle quintile in2004 (<$40,016-
$60,895)
Fourth quintile in2004 (<$60,896-
$92,886)
Top quintile in 2004(>$92,886)
Percent Distribution of Households by Income Quintile: 2004 and 2007
Top quintile in 2007 (>$92,899) Fourth quintile in 2007 ($60,577-$92,899)Middle quintile in 2007 ($39,247-$60,576) Second quintile in 2007 ($21,648-$39,246)Bottom quintile in 2007 (<$21,648)
Source: U.S. Census Bureau, Survey of Income and Program Participation, 2004 Panel; Hisnanick & Giefer, 2011

16 | P a g e
The amount of income fluctuation varies; among those that stayed in the same quintile, a majority
experienced a change in real income of at least 10 percent. Among all households, approximately half
experienced either an increase or decrease of less than 25 percent in their income, and another quarter
experienced a change of 25 percent or more between 2004 and 2007 (Hisnanick & Giefer, 2011).
Between 2004 and 2007, total household income increased $69.9 billion, while the proportion of income
in each of the quintiles remained (statistically) unchanged. The increase in household income is
explained by the increases experienced by households in the top two quintiles, which offset the declines
experienced by households in the other three quintiles (Hisnanick & Giefer, 2011).
Approximately one-third of Americans raised in the middle class fall out of the middle class as adults.
Research conducted by Pew Charitable Trusts has shown that marital status, education, and race have a
strong influence on whether a child that is born into the middle class loses this economic standing as an
adult (Acs, 2011).
While both men and women who are divorced, widowed, or separated are more likely to slip out of the
middle class than are never-married men and women, the impact is particularly strong for women.
Married women who experience a change in marital status (divorce, separation, or death) are
approximately twice as likely to fall down the economic ladder as never-married women (31-36%
compared to 16-19%) (Acs, 2011).
Race is also a factor in who falls out of the middle class, but only among men. White, African American,
and Hispanic women are equally likely to experience downward mobility out of the middle class. In
contrast, nearly 40 percent of African American men fall out, double the percentage of white men who
do so. Hispanic men also appear more likely than white men to fall out of the middle class, but the
difference is not statistically significant (Acs, 2011).
Levels of educational attainment have a strong impact on whether householders are likely to move up
or down an income quintile. The strongest patterns of interquartile movement between 2004 and 2007
were for householders with less than a high school education and householders with a bachelor’s
degree or higher. Householders with less than a high school education (42.3%) were more than five
times as likely as those with a bachelor’s degree or higher (7.6%) to experience a change in income that
resulted moving down two or more quintiles in 2007. On the other end of the income distribution,
householders with a bachelor’s degree or higher were more likely to experience an increase in income.
For example, those with a bachelor’s degree or higher in the bottom quintile (25.1%) in 2004 were more
than three times as likely to experience an increase in income that resulted in moving up two or more
quintiles in 2007 compared with those with less than a high school education (5.3%) (Hisnanick & Giefer,
2011).

17 | P a g e
Changes in educational attainment also affect household income. During this study period, 12.7 percent
of householders experienced a change in their level of educational attainment, which could result in an
increase in their household income. Individuals with higher levels of educational attainment are, on
average, paid higher salaries and wages. Nearly 15 percent of householders who moved up at least two
quintiles from the bottom, the second, or the middle quintile experienced a change in educational
attainment between 2004 and 2007 (Hisnanick & Giefer, 2011).
Poverty Triggers
The most common event triggering a poverty episode is a job loss or pay cut. Between 40 and 50
percent of those who become poor live in a household where the head, spouse, or other family member
lost his or her job. Other events triggering poverty entry are the addition of a child under age 6 into the
household, the shift from a two-parent household to a single female-headed one, or a change in the
disability status of a household head (Bane & Ellwood, 1986; McKernan & Ratcliffe, 2005).
Employment gains and pay increases are the most common events that lift a household out of poverty.
Generally, between 50 and 70 percent of those leaving poverty do so because they, or a family member,
obtained employment or had increased earnings. Educational gains, such as receiving a post-secondary
degree or certificate, are the second most common. Other events such as a shift in household structure
from single female-headed to dual earner or a change in disability status of the head of household also
have strong impacts on one’s chances of exiting poverty (Bane & Ellwood, 1986; McKernan & Ratcliffe,
2005).
5.3
5.1
5.3
14.0
25.1
42.3
25.1
16.9
11.9
3.8
8.5
7.6
80.0 60.0 40.0 20.0 0.0 20.0 40.0 60.0 80.0
Bottom
Second
Middle
Middle
Fourth
Top
Percent of Households That Moved Across Income Quintiles Between 2004 and 2007 by Educational Attainment of
the Householder
Bachelor's degree or higher
Less than High School
Households that moved down two or more income quintiles in 2007
Households that moved up two or more income
quintiles in 2007
Income quintile in
2004
Source: U.S. Census Bureau, Survey of Income and Program Participation, 2004 Panel; Hisnanick & Giefer, 2011

18 | P a g e
Income Mobility Triggers
While employment may be the most common event to pull one above the poverty line, education,
particularly schooling beyond high school, is the primary and most consistent driver of sustained upward
income mobility. The probability that an individual is able to leave the bottom quintile is more than 30
percentage points higher for those with a high school diploma or more. The second most important
characteristic is race, although it should be noted that this has greatly diminished over time. Between
1984 and 1994, the probability that a white person would leave the bottom quintile was 21 percentage
points higher than someone of a different race. The strength of this relationship had dramatically
decreased during the 1994-2004 period to 8 percentage points. The third characteristic is an increase in
the number of hours worked. An extra 1,000 hours of work per year (about 20 hours/week) increased
the probability of leaving the bottom quintile by 12 percentage points. This relationship has grown over
time and may be a result of the high unemployment rate and the lack of real wage growth for less-
educated workers. Research has found few factors that consistently predict downward income mobility
(Acs & Zimmerman, 2008).

GREATER TWIN CITIES UNITED WAYF A C E S O F P O V E R T Y 2 0 1 2
S I T U A T I O N A L P O V E R T Y

20 | P a g e
Situational Poverty Situational or episodic poverty refers to people who are in poverty for a relatively short period of time
(i.e., at least two months but less than two years). Situational poverty is in contrast to chronic or long-
term poverty. According to the most recently released Survey of Income and Program Participation data
(March 2011), approximately three-quarters of those that were poor had been in poverty for at least
two or more consecutive months, but not for the entire study period. While local data is not available in
this area, if national trends apply, this would roughly equate to an estimated 400,000 people in
situational poverty in Minnesota. The survey also found that more than half of those that were in
poverty at the beginning of the study and exited by the end continued to have incomes less than 150
percent of poverty (Anderson, 2011).
The figures above show episodic poverty rates based on selected characteristics (left) and the
distribution of people across those groups (right). For example, over the course of three years, 39.4
percent of unrelated individuals experienced episodic poverty (i.e., at least two months in poverty);
unrelated individuals account for 15.6 percent of the total U.S. population, but 21.2 percent of those
experiencing episodic poverty.
Episodic Poverty Rates
26.0%
22.6%
45.5%
36.4%
27.7%
18.1%
20.9%
51.8%
37.3%
39.4%
White alone
White alone, non-Hispanic
African American alone
Under 18
18 to 64
65 and over
Married-couple families
Female-householder fam.
Male-householder fam.
Unrelated individuals
72.5
80.7
19.6
12.5
7.8
6.8
EpisodicallyPoor
Population
White alone African American alone Other race groups
21.2
15.6
25.8
14.4
5.3
4.1
47.7
65.9
EpisodicallyPoor
Population
Unrelated individuals Female-householder families
Male-householder families Married-couple families
32.8
26.1
60.4
63.0
6.9
11.0
EpisodicallyPoor
Population
Under 18 years 18 to 64 years 65 years and over
Sources: U.S. Census Bureau, Survey of Income and Program Participation, 2004-2006 Panel; Anderson, 2011
Distribution of People

21 | P a g e
Key findings:
Non-Hispanic whites had a lower episodic poverty rate (22.6%) than African Americans (45.5%) and
Hispanics (45.8%).
The episodic poverty rate for children under 18 (36.4%) was higher than the episodic poverty rates
for adults. Adults 65 years and over had a lower episodic poverty rate (18.1%) than adults aged 18 to
64 (27.7%).
The episodic poverty rate for people in female-householder families (51.8%) exceeded the episodic
poverty rates for people in other types of families. People in married-couple families had the lowest
episodic poverty rate (20.9%).
Female-householder families make up twice the proportion of the episodically poor compared to
their proportion of the overall population. And while they only make up approximately a quarter of
the episodically poor they are significantly more likely to be in poverty than other types of families
(Anderson, 2011).
Employment Stability As one might logically assume, poverty is highly correlated with employment. Poverty is linked to
income, and work is the largest overall contributor to income, especially at low-income levels. The
importance of employment can be seen in the significant impact that acquiring or losing a job, or an
increase or decrease in wages, has on poverty. As mentioned previously, individuals in households that
have experienced the loss of a job are the most likely to enter poverty. It is estimated that 40 percent of
people who enter poverty live in a household where they or another member experienced a job loss.
The proportion is even higher (49.3%) for households that have experienced a decline in earnings (Bane
& Ellwood, 1986; Rynell, 2008).
Three labor market problems most often hinder a worker’s ability to stay above the poverty line: low
earnings, periods of unemployment, and involuntary part-time employment.
Unemployment rates in Minnesota are typically lower than those of the nation. The annual average (not
seasonally adjusted) rate for Minnesota in 2010 was 7.3 percent which is a 0.8 percentage point
decrease since 2009. Minnesota’s unemployment spike during the 2007-2009 recession was notably
higher than the previous two recessions. Finding a job was considered moderately more difficult during
the last two recessions than in normal times, but it was still much easier than it is in today’s job market
(Senf, 2010).

22 | P a g e
Unemployment rates vary considerably by race, and the Great Recession was particularly difficult for
African American and Hispanic/Latino population groups (Asian and American Indian data not available).
The Minnesota unemployment rate for African Americans in 2009 (22.5%) was three times higher than
that of whites (7.1%) and the Hispanic/Latino rate (15.5%) was two times higher.
Economic restructuring has led to an increasing number of permanent job separations. Nationally, in
2010, 43 percent of the total unemployed had been so for more than six months. This is the highest
proportion since 1946 (Bureau of Labor Statistics, 2011). The exhaustion rate for unemployment
benefits has climbed steadily over the last two decades and on average was 55.3 percent in Minnesota
in 2010. This was higher than the national rate of 53.4 percent. The average number of weeks of
unemployment insurance benefits followed a similar increasing pattern which averaged 20.2 weeks
0
2
4
6
8
10
12
1980 1982 1984 1986 1988 1990 1992 1994 1996 1998 2000 2002 2004 2006 2008 2010
Per
cen
t U
nem
plo
yed
Annual Average Unemployment Rates,
Not Seasonally Adjusted: 1980-2010 Recession MN U.S.
Source: Bureau of Labor Statistics
6.4%
22.0%
12.3%
0%
5%
10%
15%
20%
25%
2002 2003 2004 2005 2006 2007 2008 2009 2010
Unemployment by Race, Minnesota
White African American Hispanic/Latino
Source: Bureau of Labor Statistics

23 | P a g e
during 2010 (slightly higher than the U.S., which was 18.9) (American Institute for Full Employment,
2011).
An analysis of longitudinal data from the 2004 panel of the Survey of Income and Program Participation
(SIPP) offers a deeper look into the unemployment patterns of various demographic groups. Over the
four-year period of 2004-2007, 43 million people were impacted by unemployment nationally with an
average of 1.5 spells per unemployed worker during the time period. Spell length is influenced by a
number of things, such as types of jobs typically sought by members of the group, the extent and
intensity of job search efforts, and the propensity to accept job offers (Palumbo, 2010).
Among racial and ethnic groups, non-Hispanic whites had the shortest spells of unemployment, while
spells for African Americans, Asians, and Hispanic/Latino workers were about a third longer. An analysis
by age groups shows that people under age 25 tended to have shorter spells than those that were older.
The shorter durations may be a result of younger workers having more current or flexible job skills as
well as fewer constraints by family or financial responsibilities on job and residential mobility. Among
people 21 and over the median length of unemployment spell for those with at least some college
education was considerably lower than for those with less education. Those with at least some college
had a median spell length which is about 35 percent shorter than someone with less than a high school
diploma (Palumbo, 2010).
Increasing numbers of unemployment spells, coupled with much longer spell duration, has led to
increasing income volatility in households. Volatility of earnings per hour has risen more sharply than
volatility in the number of hours, which indicates that the changes are increasingly more involuntary.
The current economic outlook suggests that income volatility will be unusually elevated for several years
(Dynan, 2010).
0
5
10
15
20
25
30
35
40
45
50
1966 1970 1974 1978 1982 1986 1990 1994 1998 2002 2006 2010
Per
cen
t
Percent Unemployed for 6 Months or Longer, U.S.: 1966-2010 Recession Percent unemployed 27 weeks or longer
Source: Bureau of Labor Statistics

24 | P a g e
Having a job doesn’t mean you are free of poverty. More than half (51.9%) of Minnesota’s poverty
population in 2010 worked during the prior 12 months, and 8.3 percent worked full-time year-round.
Structural economic changes have contributed to a rise in low-wage employment. As mentioned earlier
in this report, workers at the lower end of the wage distribution have not fared well in recent decades
(with the exception of small improvements in the latter half of the 1990s).
Work Experience* of Population in Poverty, 2010 9-County
Metro4 MN U.S.
Population in poverty (ages 16+) 208,682 408,209 29,768,568 Worked full-time year-round 7.2% 8.3% 9.1% Worked part-time or part-year 42.1% 43.5% 34.2% Did not work 50.7% 48.2% 56.7% Total 100% 100% 100% *Work experience over a 12-month period. Source: 2010 American Community Survey, three-year estimates
When the economy is in a recovery period, growth is sluggish, and employers are unsure if there will be
a sustained pattern of expansion. As a result they are reluctant to add permanent positions and instead
hire temporary workers. Minnesota’s temporary employment services sector began cutting jobs in
December of 2006, a year prior to the beginning of the recession. Overall, the temp workforce was
reduced from a seasonally adjusted peak of 58,900 in late 2006 to 39,200 in September 2009 (a 33.4%
decline). Since then the industry has begun to rebound, adding 6,200 jobs through July of 2010. That is
about 14 percent of the 44,000 jobs that the state added through July 2010, after accounting for roughly
12 percent of the jobs lost during the recession. The temporary employment services industry accounts
for a lower share of wage and salary employment in Minnesota than the nation and Minnesota ranks
roughly in the middle of all states (Senf, 2010).
4This area consists of the following counties: Anoka, Carver, Chisago, Dakota, Hennepin, Isanti, Ramsey, Scott, and
Washington.

25 | P a g e
Family Stability and Change Collapses in the housing and stock markets, along with a tightening of consumer credit, have eroded
families’ savings and assets and diminished their capacity to weather economic downturns. Regardless
of how families were doing through 2007, the recession has set them back by about a decade (Acs &
Nichols, 2010). For lower-income families, a distinguishing attribute of their economic success lies in
their ability to work full-time year-round. With monthly unemployment rates that have at times
exceeded 10 percent and the ranks of the long-term unemployed at all-time highs, families are being cut
off from their surest path to economic security. In 2010, 2.8 percent (or 38,247) of Minnesota’s families
were in extreme poverty, 7 percent (or 94,947) were at or below poverty, and 19.5 percent (or 264,138)
had incomes below 200 percent of the poverty guidelines.
While there has been some slow and steady real
economic growth, family incomes have become
increasingly volatile. More than 13 percent of
families with children experience a drop in
income of at least 50 percent over the course of a
year. For some this is a short-term loss, but for 3
out of 5 of these families their income fails to
recover to its prior level within a year. The
poorest and the richest families are more likely to
experience losses than middle-income families
(Acs, Loprest, & Nichols, 2009).
Household composition factors such as
having children, teen parenthood, marital
status, and female-headed households are
highly correlated with income and poverty.
Generally speaking, both nationally and
locally households headed by women are
far more likely to be poor than other types
of households. Poverty rates in female-
headed households are typically 3-4 times
higher than for the overall population; this
is most commonly attributed to lower
wages paid to women, fewer hours worked
in households with one earner, and fewer
hours available to work due to parenting
responsibilities (Rynell, 2008).
13.6%
20.2%
12.0% 10.2% 9.9%
16.4%
AllRichestQuintile2
Quintile3
Quintile4
Poorest
Probability of Experiencing a Substantial Income Drop by Income Quintile
Source: Acs, Loprest, & Nichols, 2009
5.2
%
2.5
%
21
.5%
30
.5%
16
.4%
43
.8%
35
.6%
12
.6%
57
.6%
12
.5%
9.0
%
30
.2%
18
.3%
8.2
%
36
.9%
23
.4%
14
.2%
42
.7%
% All families inpoverty
% Married-couplefamilies in poverty
% Female-headedfamilies in poverty
Families in Poverty, MN 2010 White African American
American Indian Asian
Other/2+ Hispanic/Latino
Source: 2010 American Community Survey, three-year estimates

26 | P a g e
Families in Poverty, 2010 9-County Metro MN U.S.
# % # % # %
All Families All families in poverty 47,887 6.6% 94,947 7.0% 8,000,664 10.5% Married couple families in poverty 15,730 2.8% 33,341 3.1% 2,897,764 5.1% Female-headed households in poverty 26,569 22.9% 50,897 26.3% 4,285,222 29.2% Families with children under 18 All families in poverty 39,767 10.7% 75,790 11.5% 6,247,791 16.5% Married couple families in poverty 10,879 4.1% 20,474 4.3% 1,870,330 7.5% Female-headed households in poverty 24,328 30.5% 46,668 34.0% 3,755,711 38.1% Source: 2010 American Community Survey, 3-year estimates
A longitudinal analysis of poor households reveals that poverty rates for all families as well as those
headed by females have generally declined. However, the proportion of poor families headed by
females has increased dramatically. Currently, more than 50 percent of all poor families nationally are
headed by females, compared to 23 percent in 1959. In 2010, this rate was 53.6 percent in Minnesota
and 55.4 percent in the nine-county metro area. Female-headed families are also more sensitive to
business cycles than other poor families. Declines in poverty rates are steeper for female-headed
households during times of economic prosperity and poverty rates increase faster for these households
during recessions (U.S. Census Bureau).
0
10
20
30
40
50
60
1959 1962 1965 1968 1971 1974 1977 1980 1983 1986 1989 1992 1995 1998 2001 2004 2007 2010
Per
cen
t
Poverty Rates, U.S. 1959 to 2010
Percent of poor families headed by a single female
Poverty rate for families with female householder
Poverty rate for families
Source: U.S. Census

27 | P a g e
As mentioned earlier in this report, the transition from a two-parent family to a single-parent family is a
leading trigger of poverty spell entry among households. This transition accounts for 59 percent of the
poverty beginnings for female heads of household with children. Research has found considerable
evidence that after a divorce, women and children experience a substantial financial decline while
divorced men’s income remains stable or increases (Rynell, 2008).
At the end of the last century, among female-headed households, average annual poverty rates fell
while earnings rose. Concurrently, however, the incidence of poverty spells actually increased, especially
among single heads of households. In other words, poverty spells were more frequent but less
persistent. Generally, women entered poverty from higher positions on the income ladder. Over the last
20 years, increasingly women’s economic fortunes have become more dependent upon the labor
market, exposing them to greater risks of short-term income fluctuations and spells of poverty (Card &
Blank, 2008).
Changes in policy and larger labor market trends have led to a growing number of female-headed
households that have become disconnected from the labor market. They have lost access to public
assistance but are still unable to find stable employment. The main wage earners in these households
are likely to face multiple barriers such as caring for someone with poor health or a disability, having a
history of being a victim of domestic violence, or past or present problems with substance abuse (Blank
& Kovak, 2008).
The impact of a change in household composition from two parents to single parent is particularly
pronounced in the economic mobility of lower-income children in these households. Among children
who start in the bottom third of the income distribution, only 26 percent with divorced parents move up
to the middle or top third as adults, compared with 42 percent of children born to unmarried mothers
and 50 percent of children born to continuously married parents.
Longitudinal research has been done as single mothers move off welfare, to better understand the
characteristics that impact their prospects for long-term self-sufficiency. Findings show that 46 percent
of single mothers were never in poverty, 30 percent were poor but eventually left poverty, and 24
percent were poor and stayed poor (Moore, Rangarajan, & Schochet, 2007).

28 | P a g e
Immigrants According to the 2009 American Community Survey (three-year estimates), Minnesota is home to
approximately 376,000 people born outside the United States (7.1% of the total population). Twenty-
one percent of this population lives below the poverty level (approximately 78,000 persons). While the
poverty rates of immigrants from many global regions have declined, the distribution in countries of
origin of U.S. immigrants has shifted strongly towards source countries from which immigrants are
typically more likely to be poor in the U.S. Research examining the relationship between immigration to
the U.S. between 1970 and 2008 and the nation’s poverty rate finds that this is the only substantive
contribution to the overall poverty rate. Recent immigrants from Latin America and Asia tend to
experience higher initial poverty rates. While this may increase the overall poverty rate relative to what
it would otherwise be, the effect is small and through wage growth and selective out-migration,
immigrant poverty declines quickly with time in the U.S. (Raphael & Smolensky, 2009). Citizenship status
also has an important correlation to poverty rates. In Minnesota, 14.3 percent of the naturalized
foreign-born population is in poverty, compared to 26.2 percent of the foreign born that are not U.S.
citizens (2010 American Community Survey, three-year estimates).
Research on employment trends shows that Minnesota immigrants are slightly more likely to be
employed than U.S.-born residents. Among the population ages 16 and older in Minnesota, 66.2 percent
of foreign-born persons were working compared to 65.9 percent of native-born Minnesotans in the
2006 to 2008 period. The employment gap between native born and foreign born has been closing over
the last decade: In 1990, 64 percent of foreign-born Minnesotans were working compared to 78 percent
for native born. Length of time in the U.S. has a significant impact on employment rates: Those with five
or fewer years had an employment rate of 61 percent, compared to 73 percent for those here six to 10
years, and 79 percent for those here 11 to 15 years (Minnesota Compass, 2011). National research has
0%
10%
20%
30%
40%
50%
60%
70%
80%
90%
100%
1970 1980 1990 2000 2008-2010
Percent of Foreign Born Population by Region of Birth, Minnesota
Oceania
North America
Africa
Latin America
Asia
Europe
Source: U.S. Census Bureau, American Community Survey and U.S. Census Bureau, Decennial Census

29 | P a g e
found that after controlling for education, English language, and other risk factors, most immigrant
groups had substantially higher chances of being employed than U.S.-born individuals. That said, those
with limited English language skills experienced much higher odds of poverty and hardship. They also
had lower rates of employer-provided health insurance, savings accounts, and home ownership than
those that were more English proficient. This underscores again that education is the most important
determinant of economic advancement regardless of race or ethnicity (Rawlings, Capps, Gentsch, &
Fortuny, 2007).
Research shows that overall, immigration has very little effect on the poverty rates of U.S.-born
residents through labor market competition. Both national and local studies have shown that the net
economic effects of immigration are positive. It should be noted, however, that not all groups benefit at
the same level. Workers with higher education levels see more job opportunities associated with
general population and economic growth. Workers with a high school diploma or less may suffer from a
decline in wages due to higher concentrations of immigrant workers in those areas. The degree to which
this has a negative impact is heavily debated. While research from more conservative sources shows a
sizeable earnings disadvantage, other sources conclude that the overall impacts are negligible. This is
primarily attributed to the fact that most U.S.-born resident poor households have at least one working
adult with at least a high school education (Borjas, 2006; Owen, 2010; Raphael & Smolensky, 2009).
Economic Mobility among Immigrants
Economic mobility among immigrants is highly dependent upon legal status and length of time in the
U.S. Many key characteristics contributing to poverty entry and exit shift dramatically between first- and
second-generation immigrants. All of these cross-generational integration patterns are important to
consider together. For example, changes in family composition such as the doubling of the divorce rate
between the first and second generations typically increase the probability of entering poverty.
However, other trends such as increasing educational attainment, higher English language proficiency,
and continued high rates of labor force participation all have positive impacts (Fix, Zimmerman, &
Passel, 2001).
Among first-generation immigrants, legal status is a critical component to short- and long-term financial
success. Adult unauthorized immigrants are disproportionately likely to have lower educational
attainment and have jobs at the lower end of the earnings ladder. In contrast to other immigrants, if
legal status does not change, undocumented immigrants do not experience the same rates of income
growth the longer they live in the U.S. (Passel & Cohn, 2009). Generally speaking, across generations and
regardless of legal status, it is thought that about half the economic status of one generation persists
into the next. This level has remained stable over the past several decades (Borjas, 2006; Fix,
Zimmerman, & Passel, 2001).

30 | P a g e
Poverty and Health Care Costs The increasing cost of health care through the growth of health insurance premiums and out-of-pocket
costs, as well as increased difficulty in obtaining health insurance coverage in the United States, has led
to more and more households struggling to meet their needs because of medical debt. More than 6
percent of people (291,000 individuals) in Minnesota spent more than 25 percent of their pretax income
on health care costs during 2009, nearly double the percentage in 2000 (3.2%) (Families USA, 2009). An
estimated 64.4 million people under age 65 (nearly 1 in 4 nonelderly Americans) are in families that
spend more than 10 percent of their pretax income on health care. Even more startling, nearly 4 out of 5
of these families have health insurance. More than 18.7 million nonelderly people are in families that
spend more than 25 percent of their income on health care, and more than three-quarters of this group
has health insurance (Families USA, 2009).
As health care costs and medical debt continue to consume a growing share of budgets, many families
have no choice except bankruptcy. Between 2005 and 2007 alone, 5 million families in the U.S. filed for
bankruptcy following a serious medical problem. Economists estimate that 16 times as many families
are on the brink of filing for bankruptcy due to medical expenses (Families USA, 2009). Medical debt is
now the leading cause of personal bankruptcy and is a significant trigger into poverty. In 2007, 62
percent of bankruptcies were medical, a 50 percent increase from 2001. Medical debt is not limited to
low-income or uninsured households, either: Most individuals declaring medical bankruptcy had health
insurance (75%), attended college (62%), and are homeowners (52%) (Himmelstein, Thorne, Warren, &
Woolhandler, 2009).
Among those with medical debt, significant trade-offs are often made which impact basic needs. Nearly
1 in 3 had been unable to pay for their basic necessities like food, heat, or rent; 39 percent had used
their savings to pay bills; and 30 percent took on credit card debt (Collins, Kriss, Doty, & Rustgi, 2008).
Results from surveys of people filing tax returns at VITA sites show that more than one-quarter of
respondents with medical debt reported housing problems. These problems included an inability to
qualify for a mortgage, make rent or mortgage payments, and being turned down from renting a home
(Seifert, 2005).
Medical Bill Problems and Accrued Medical Debt, U.S.
Percent of Adults Ages 19-64 2005 2007
In the past 12 months: Had problems paying or unable to pay medical bills 23% (39 mil) 27% (48 mil) Contacted by collection agency for unpaid medical bills 13% (22 mil) 16% (28mil) Had to change way of life to pay bills 14% (24 mil) 18% (32 mil) Any of the above problems 28% (48 mil) 33% (59 mil) Medical bills being paid off over time 21% (37 mil) 28% (49 mil) Any bill problems or medical debt 34% (58 mil) 41% (72 mil) Source: Collins, Kriss, Doty, & Rustgi, 2008

31 | P a g e
The increase in health insurance premiums has forced employers to make tough decisions about the
coverage they offer. Some have chosen to drop coverage completely (especially small businesses);
others increase the share of premium that employees must pay; and many are offering insurance that
covers less and/or requires higher out-of-pocket costs. The culmination of these trends means that
families are shouldering ever-increasing amounts of health care costs themselves. Health insurance
premiums for both single and family coverage more than doubled between 1996 and 2009. For family
coverage, the average premium in Minnesota was $5,067 in 1996-1997 and $13,424 in 2008-2009, an
increase of 165 percent (MDH Health Economics Program).
Lack of Insurance
The unstable job market and current high rates of unemployment mean frequent lapses in health
coverage for millions of Americans. With more than 50 percent of people in Minnesota receiving health
care coverage through their jobs (or a family member’s job), changes in employment rates have strong
correlations with lack of coverage as well as with medical debt. For every percentage point increase in
the seasonally adjusted unemployment rate, the percentage of uninsured working-age adults is
estimated to grow by 0.59 percentage points (Families USA, 2009).
Approximately 7 percent of Minnesota’s population was uninsured in 2009. Among those that are
uninsured and had annual incomes below 200 percent of the federal poverty guidelines, just under one-
third had been offered insurance by their employer (32%). With the increasing premiums among the
many financial stresses a family in poverty faces, the take-up rate for employer-offered insurance has
been steadily declining. The table below shows the potential sources of health insurance coverage for
the low-income uninsured (MDH Health Economics Program).
Potential Sources of Coverage for Low-income Uninsured, Minnesota 2001 2004 2007 2009
Employer offer* 35.7% 34.8% 40.2% 31.9% Employer eligible** 23.6% 17.2% 23.4% 15.5% Potentially public eligible 82.5% 88.3% 79.6% 89.2% Not eligible for employer or public 4.8% 3.2% 6.2% 2.2% Source: MDH Health Economics Program *Connection to employer that offers coverage **Among people with a connection to an employer offering coverage.

32 | P a g e
Sources of health insurance vary
significantly by income. While only
26 percent of low-income (at or
below 200% poverty) Minnesotans
had group coverage, the rate was
much higher for higher income
(above 200% poverty) Minnesotans,
at 69 percent (MDH Health
Economics Program).
Among those with insurance, those
with medical debt are similar in
many ways to the uninsured.
Compared to those with coverage,
those who have medical debt were more than three times as likely to have skipped a recommended test
or treatment due to its cost. They were more than twice as likely to have neglected to fill a drug
prescription due to cost, and were four times as likely to postpone care due to cost (Hoffman, Rowland,
& Hamel, 2005).
8% 9% 6%
30%
24%
28% 29%
25%
30%
25% 27%
29%
Percent skippingtest/treatment due to
cost
Percent not filling aprescription due to cost
Percent postponing caredue to cost
Health Care Choices Among Insured and Uninsured, U.S.
Insured: no medical debt
Insured: with medical debt
Uninsured part-year
Uninsured full-year
Source: Hoffman, Rowland, & Hamel, 2005
26.0%
69.2% 3.6%
5.6%
53.4%
19.1% 17.0%
6.0%
0%
10%
20%
30%
40%
50%
60%
70%
80%
90%
100%
At or below 200% poverty Above 200% poverty
Sources of Health Insurance Coverage, MN 2009
Uninsured
Public
Individual
Group
Source: MDH Health Economics Program

GREATER TWIN CITIES UNITED WAYF A C E S O F P O V E R T Y 2 0 1 2
C H R O N I C / I N T E R G E N E R A T I O N A L P O V E R T Y

34 | P a g e
Chronic and Intergenerational Poverty Chronic or long-term poverty refers to people who are enmeshed in poverty and unable to rise above
the poverty line. According to the most recently released Survey of Income and Program Participation
data (March 2011), nearly one-quarter (23.1%) of the population in poverty is chronically poor
(Anderson, 2011). This means they were in poverty for the entire monitored period (2004-2006). While
local data is not available, if national trends apply, this would roughly equate to an estimated 120,000
people in chronic poverty in Minnesota. The figures below show chronic poverty rates based on selected
characteristics (left) and the distribution of people across those groups (right). For example, over the
course of three years, 9.7 percent of female-householder families experienced chronic poverty (i.e., in
poverty for the entire three-year period). Female-householder families represent 14.4 percent of U.S.
households, but 49.9 percent of households experiencing chronic poverty.
Key findings:
As was the case with episodic poverty rates, children, African Americans, and female-householder
families have the highest chronic poverty rates.
Unlike the patterns found in episodic poverty, the chronic poverty rate for adults 18 to 64 is lower
than the rate for adults 65 years and older.
While children make up 26 percent of the total population, they represent around 45 percent of
those who are chronically poor. Similarly, while African Americans make up only 12.5 percent of the
population, their proportion of the chronically poor is three times higher (37.6%).
Chronic Poverty Rates
1.9%
1.4%
8.4%
4.8%
1.9%
3.0%
0.7%
9.7%
2.6%
5.2%
White alone
White alone, non-Hispanic
African American alone
Under 18
18 to 64
65 and over
Married-couple families
Female-householder fam.
Male-householder fam.
Unrelated individuals
54.5
80.7
37.6
12.5
7.9
6.8
ChronicallyPoor
Population
White alone African American alone Other race groups
29.2
15.6
49.9
14.4
3.8
4.1
17.0
65.9
ChronicallyPoor
Population
Unrelated individuals Female-householder families
Male-householder families Married-couple families
44.9
26.1
43.3
63.0
11.8
11.0
ChronicallyPoor
Population
Under 18 years 18 to 64 years 65 years and over
Source: U.S. Census Bureau, Survey of Income and Program Participation, 2004-2006 Panel; Anderson, 2011
Distribution of People
35 | P a g e
Among those in poverty at the beginning of the study, 38 percent of seniors (65+), and 30 percent of
female-householder families were chronically poor (Anderson, 2011).
Intergenerational Income Mobility “For more than two centuries, economic opportunity and the prospect of upward mobility have formed
the bedrock upon which the American story has been anchored“ (Sawhill, 2008, p.1).
Broadly speaking, intergenerational mobility is the term used to describe the ability of people to move
up or down the economic ladder between one generation and the next. Important components of this
include income mobility, social mobility, and wealth mobility. Economic mobility across generations is a
result of both absolute mobility, economic growth boosting everyone’s incomes, and relative mobility,
taking into account income inequality.
Economic growth is an important source of mobility and a growing economy ensures that each
generation has a greater chance of being better off than the previous one. Between 1947 and 1973, the
growth rate of a typical family’s income was unusually robust, roughly doubling in a generation’s time.
However, over the last four decades, the level of connection between people’s current income and
occupation, and those of their parents, has been much smaller, at roughly 20 percent. The tide lifting all
boats has weakened and in turn the improvements for the current generation were not able to keep
pace with those that their parents and grandparents experienced. This has been particularly felt among
men in their 30s today (Beller & Hout, 2006; Isaacs, 2008a; Sawhill, 2008b). Despite this, family incomes
have continued to rise, although slowly. The main reason attributed to this has been the increase in
women’s education and workforce participation levels; it is generally no longer the case that a typical
family can depend on a single earner to move them up the economic ladder. Research has now shown
that the growth of the two-earner family has been the primary factor that has saved the typical family
from downward mobility (Blank, 2011; Isaacs, 2008a; Sawhill, 2008a).
So how much opportunity exists for economic mobility? What are the chances of today’s rich becoming
tomorrow’s poor and vice versa? These questions about relative mobility are particularly critical during
periods such as this when inequalities in income and wealth are on the rise. As inequality has grown, the
ability of economic growth to make each generation better off than the next has weakened (Sawhill,
2008a). “All Americans do not have an equal shot at getting ahead, and one’s chances are largely
dependent on one’s parents’ economic position” (Isaacs, 2008a, p.19).
The chart on page 36 shows the probability of transitioning from one income group to another over a
generation. Generally speaking, there is what is referred to as a “stickiness” in the mobility distribution:
The tendency of children’s incomes to look like that of their parents’ is strongest at the top and bottom
of the income distribution. In other words, children born into poverty have a much higher chance of
living in chronic poverty than children born into higher-income households. Forty-two percent of
children born to families with incomes in the bottom fifth remain in the bottom fifth, and another 23
percent end up in the second quintile which is still low-income. Only 17 percent of those born to parents
in the bottom quintile climb to one of the top two income groups (Beller & Hout, 2006; Isaacs, 2008a).

36 | P a g e
It is important to also think of mobility in terms of gaining higher incomes (absolute mobility) as well as
rising in society (relative mobility). Research done at Brookings combining both absolute and relative
mobility shows that about a third of Americans are “riding the tide,” meaning they experience an
increase in real income over their parents without actually moving up in relative standing. In addition,
another third are actually downwardly mobile in both family income and relative rank (Isaacs, 2008a).
While research is limited, studies comparing differences in economic mobility between white and
African American families show important differences. The data reveals significant disparities in the
extent to which parents are able to pass their economic advantages on to their children. For every
parental income grouping, white children are more likely than African American children to move ahead
of their parents’ income ranking, while African American children are more likely to fall behind. An
estimated 45 percent of African American children, whose parents were solidly middle-income, end up
falling to the bottom income quintile compared to only 16 percent of white children. Among those who
start at the bottom of the income distribution, 54 percent of African American children remain there,
compared to 31 percent of white children. Economic success in the parental generation, as measured by
family income, does not appear to protect African American children from future economic hardship in
the same way that it protects white children (Isaacs, 2008b).
Asset Poverty and Wealth Mobility While income represents the flow of resources earned in a particular time period, wealth and assets are
a pool of money generally used for improving life, increasing opportunities, and passing along to the
next generation. In other words, wealth is special in that it is utilized to launch social mobility. Two
families with similar incomes but different wealth most likely do not share similar life trajectories
(Shapiro, 2006).
42% 25%
17% 8% 9%
23%
23% 24%
15% 15%
19%
24% 23%
19% 14%
11% 18%
17%
32% 23%
6% 10% 19% 26%
39%
0%
10%
20%
30%
40%
50%
60%
70%
80%
90%
100%
BottomQuintile
SecondQuintile
MiddleQuintile
FourthQuintile
TopQuintile
Pe
rce
nt
of
Ad
ult
Ch
ildre
n in
Ea
ch F
amily
In
com
e G
rou
p
Parents' Family Income Group
Children's Chances of Getting Ahead or Falling Behind, by Parents' Family Income
Percent adult children withincome in top quintile
Percent adult children withincome in fourth quintile
Percent adult children withincome in middle quintile
Percent adult children withincome in second quintile
Percent adult children withincome in bottom quintile
Source: Brookings tabulations of PSID data on family income over several years and reported in 2006 dollars. Isaacs, 2008a.

37 | P a g e
The persistence of wealth across generations is even stronger than the persistence of income. Wealth
mobility is particularly important because its distribution is more unequal than income. It also has
greater effects on other aspects of well-being such as investment in children’s education and
homeownership. Family inheritances, especially financial resources, are the primary way that class and
race advantages and disadvantages are passed from one generation to the next. The wealth gap will
continue to grow; not only does it persist between generations, it mushrooms. The probability of wealth
mobility is similar to that of income mobility, with ties being strongest at the highest and lowest ends.
Intergenerational Wealth Mobility, 1979-2000 Origin
quintile Destination quintile
Poorest Second Third Fourth Richest Total
Poorest 45 27 11 9 9 100 Second 24 35 20 14 7 100 Third 11 20 35 21 13 100
Fourth 7 11 23 33 25 100 Richest 5 6 9 25 55 100
Source: Beller & Hout, 2006
Research conducted on the differences between
white and African American wealth mobility show
that whites are about one and a half times more
likely to come from families with assets and are
three and a half times more likely to receive an
inheritance than African Americans. Even this does
not represent the full measure of inequality,
because for white families the average inheritance
amounted to $52,430, while for African Americans
it was $21,796. Median amounts were $10,000 for
white families and $798 for black families. In other
words, among those who receive a bequest,
African Americans receive 8 cents of inheritance for every dollar inherited by whites (Shapiro, 2004).
The three main channels through which intergenerational wealth impacts mobility are increased
educational investments, neighborhood choice and homeownership, and expanded occupational choice.
An often overlooked characteristic of inherited wealth is that it doesn’t just occur when parents die.
Wealth transfers occur throughout the life span and this is particularly apparent when looking at
spending on education. Families with greater wealth are better able to finance education investments in
their children (Shapiro, 2004). Education, in some respects, has been found to level the playing field:
Research has found that college graduates have mobility that no longer depends on family background.
While this may be the case, it should also be noted that in many cases obtaining a college degree is very
dependent on class or family income (Barnett & Belfield, 2006).
45%
35% 35% 33%
55%
Poorest Second Third Fourth Richest
Probability of Child Having the Same Wealth Quintile as Parents,
1979-2000
Source: Beller & Hout, 2006
38 | P a g e
Differences in wealth also affect neighborhood choices and first-time homeownership. Home equity is
estimated to account for 60 percent of the total wealth of America’s middle class. For many, this story
seems as though it results primarily from individual hard work, discipline, and savings. However, for
most, it is in large part also assisted by a series of federal policies that helped create a mortgage market
with long-term, low-interest loans, with relatively small down payments (mostly administered through
the Federal Housing Administration, Veterans Administration, and the GI Bill). While these policies
succeeded in many ways at anchoring the white middle class in homeownership, the same policies also
contributed heavily to residential segregation and blocked the path to homeownership, the
establishment of a positive credit history, and wealth accumulation for African Americans through
redlining and discriminatory lending practices. More recently, the subprime lending market emerged to
target prospective buyers with blemished credit or high levels of debt. In return for the riskier
investments, financial institutions charge higher interest rates, prepayment penalties, and often include
balloon payments, adjustable interest rates, and higher processing and closing fees (Shapiro, 2006).
The impact that neighborhoods have on current and future economic prosperity is both highly
correlated and well-researched. For instance, for children whose family income is in the top three
quintiles, spending childhood in a high-poverty neighborhood (vs. a low-poverty neighborhood) raises
the chances of downward mobility by 52 percent. Neighborhood poverty also explains one-quarter to
one-third of the African American-white gap in downward mobility. A change in neighborhood also has
an impact on economic success. African American children who lived in neighborhoods that saw a
decline in poverty of 10 percentage points in the 1980s had annual adult incomes almost $7,000 greater
than those who grew up in neighborhoods where the poverty rate was stable (Sharkey, 2009).
Finally, wealth may expand occupational choice. This particularly impacts level of self-employment.
People with inheritances are twice as likely to become self-employed, most likely because of access to
significant start-up capital. Self-employed individuals are much more likely to experience upward
mobility within the wealth distribution. Research also shows that this may further extend into the third
generation, as children of entrepreneurs are twice as likely as children in general to be self-employed
(Grawe, 2008).

39 | P a g e
Children in Poverty
Children are the most likely age group to live
in poverty, and growing up in poverty can
have devastating long-term consequences.
More than one-third of Minnesota’s children
under age 5 live in households with incomes
below 200 percent of poverty (46.0%
nationally, and 33.5% in the nine-county
metro area), and 16.1 percent are under 100
percent of poverty (23.1% nationally, and
15.1% in the nine-county metro area). The
Great Recession has had a negative impact on
children in poverty, increasing both the
number of children in poverty and the child
poverty rate. Of even greater concern is the
increase in the number and percentage of children living in extreme poverty (households with incomes
below 50% of the federal poverty level). In 2010, 6.1 percent (or 76,664) of Minnesota’s children under
18 were living in extreme poverty, a rate that is still well below the nation (8.8 percent, or 6,437,076),
but significantly higher than in 2000, when 3.9 percent of Minnesota children under 18 were in extreme
poverty (7.4% for the U.S.).
Children in Poverty, 2010 U.S. MN 9 County Metro
Age 0 to 5 Below 100% 5,503,690 23.1% 67,286 16.1% 35,756 15.1% Below 200% 10,973,814 46.0% 150,751 36.0% 79,333 33.5%
Age 6 to 11 Below 100% 4,766,164 19.9% 55,716 13.4% 32,323 13.7% Below 200% 10,123,929 42.2% 133,900 32.3% 71,354 30.3%
Age 12 to 17 Below 100% 4,372,186 17.4% 53,188 12.4% 31,136 12.8% Below 200% 9,631,887 38.3% 125,838 29.3% 66,363 27.3%
Source: 2010 American Community Survey, three-year estimates
The negative effects of poverty are pervasive, cumulative, and increase with age (Shore, 1997). Children
who are raised in poverty show a negative impact even when they are born healthy and free of medical
problems. They tend to show gradual declines in mental, motor, and socio-emotional development; they
have poorer quality relationships with their caregivers; and they are more likely to exhibit anxious
attachment. In preschool, they are more likely to have problems getting along with other children and
functioning on their own. By the time they start school they are more likely to need special education
services, and as they progress through school they are more likely to be held back.
16.1% 12.9%
10.3% 8.6%
36.0%
30.7%
23.2%
30.0%
0 to 5 6 to 17 18 to 64 65+
Poverty Rates by Age, MN 2010 Below 100% Poverty Below 200% Poverty
Source: 2010 American Community Survey, three-year estimates
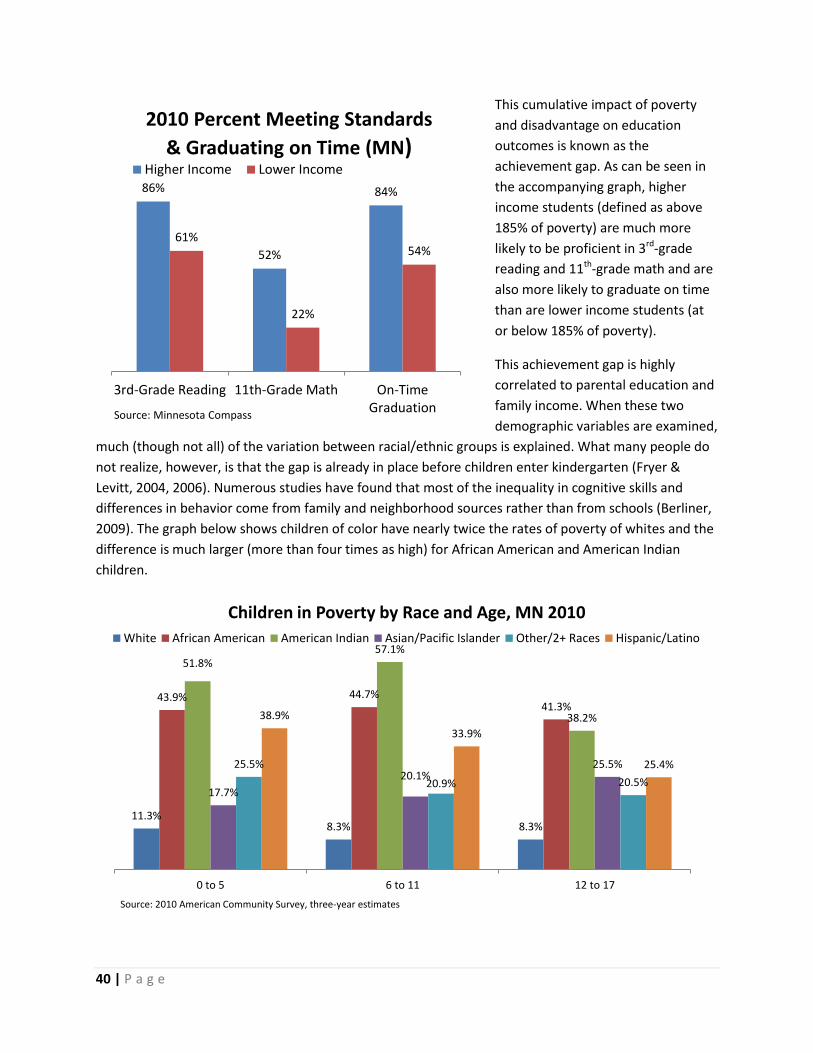
40 | P a g e
This cumulative impact of poverty
and disadvantage on education
outcomes is known as the
achievement gap. As can be seen in
the accompanying graph, higher
income students (defined as above
185% of poverty) are much more
likely to be proficient in 3rd-grade
reading and 11th-grade math and are
also more likely to graduate on time
than are lower income students (at
or below 185% of poverty).
This achievement gap is highly
correlated to parental education and
family income. When these two
demographic variables are examined,
much (though not all) of the variation between racial/ethnic groups is explained. What many people do
not realize, however, is that the gap is already in place before children enter kindergarten (Fryer &
Levitt, 2004, 2006). Numerous studies have found that most of the inequality in cognitive skills and
differences in behavior come from family and neighborhood sources rather than from schools (Berliner,
2009). The graph below shows children of color have nearly twice the rates of poverty of whites and the
difference is much larger (more than four times as high) for African American and American Indian
children.
11.3% 8.3% 8.3%
43.9% 44.7% 41.3%
51.8% 57.1%
38.2%
17.7%
20.1% 25.5% 25.5%
20.9% 20.5%
38.9%
33.9%
25.4%
0 to 5 6 to 11 12 to 17
Children in Poverty by Race and Age, MN 2010
White African American American Indian Asian/Pacific Islander Other/2+ Races Hispanic/Latino
Source: 2010 American Community Survey, three-year estimates
86%
52%
84%
61%
22%
54%
3rd-Grade Reading 11th-Grade Math On-TimeGraduation
2010 Percent Meeting Standards
& Graduating on Time (MN) Higher Income Lower Income
Source: Minnesota Compass

41 | P a g e
Evans and Schamberg (2009) provide evidence that living in poverty results in chronically elevated
physiological stress, which in turn affects working memory. Working memory is essential to language
comprehension, reading, and problem solving; it is a critical prerequisite for long-term storage of
information. The longer the period of childhood poverty, the higher the stress load is during childhood,
and the greater the long-term effect on working memory.
Children growing up in poverty are, as a rule, exposed to more risk factors (e.g., substandard housing,
highly segregated neighborhoods) than children growing up in middle-income households. Evans and
English (2002) report that exposure to one risk factor generally has a negligible impact on children, while
exposure to two or more risks has a cumulative, adverse psychological impact. Not surprisingly, the
environment of poverty is characterized by exposure to cumulative, adverse, physical and social
stressors. The housing is noisier, more crowded, and of lower quality. People living in poverty
experience elevated levels of family turmoil, greater child-family separation, and higher levels of
violence.
According to Dearing (2008), the economic costs of childhood poverty in the United States could be as
high as $500 billion a year—about 4 percent of the U.S. GDP. The impact of poverty manifests in many
ways, including the avenues of prenatal care, health care, food insecurity, environmental concerns (e.g.,
lead paint), family relations and family stress, and neighborhood characteristics. See Berliner (2009) for
a detailed discussion of the impact of poverty on children in each of these areas.
Persistent Childhood Poverty
A strong predictor of future economic success is poverty status at birth. Children who are born into
poverty and spend multiple years living in poor families have worse adult outcomes than their
counterparts in higher-income families. Understanding the dynamics of persistent childhood poverty is
particularly important, as the cumulative effect of being poor may lead to numerous negative outcomes
and limited opportunities that can have ripple effects for generations. To put into context the
importance of understanding the dynamics of childhood poverty, compare the fact that in 2008, 34.7
percent of African American children lived below the poverty threshold. Yet more than twice as many
(77%) are poor at some point during their childhoods, and 37 percent are persistently poor (Ratcliffe &
McKernan, 2010).
Research shows that approximately 13 percent of children in the United States are poor at birth. This
rate varies greatly by race: 8 percent of white children compared to 40 percent of African American
children. Further, very few children who are poor for multiple years have a single uninterrupted poverty
spell. They tend to cycle into and out of poverty over time. Among children who are poor nine or more
years, only 17 percent have a single uninterrupted spell, while 58 percent experience three or more
poverty spells. Put another way, African American children are roughly two and a half times more likely
than white children to ever be poor and seven times more likely to be persistently poor (Ratcliffe &
McKernan, 2010).
Much of the importance of understanding persistent childhood poverty lies in the fact that its four most
highly correlated outcomes are also those that are the strongest predictors of adult poverty. First, being

42 | P a g e
born into poverty is a significant predictor of adult poverty. While 4 percent of individuals in
economically stable families at birth go on to spend at least half of their early adult years living in
poverty, the rate for individuals born into poverty is 21 percent. Second, the likelihood of not
completing high school is three times greater for individuals who are poor versus not poor at birth.
While 7 percent of individuals born in economically stable households lack high school diplomas, rates
are much higher (22%) for those born in into poor households. Third, the likelihood of having a teen
nonmarital birth is three times as likely for women who are poor versus not poor at birth (31% versus
10%). Fourth, among certain demographic groups, poverty at birth is a predictor of being consistently
employed as a young adult. For men in general, there is no statistically significant difference; however,
upon closer look at the data by race, we see that African American males born into poverty are 33
percentage points less likely to be consistently employed than those not poor at birth. There is a similar
pattern for African American females, although the differences are not as large (Ratcliffe & McKernan,
2010).
Hard-To-Serve Singles Hard-to-serve singles represent a small percentage of people in poverty but they tend to account for a significant portion of the expenses associated with poverty. Hard-to-serve singles generally experience issues that either exacerbate or are exacerbated by poverty, such as mental illness (including Post-traumatic Stress Disorder or PTSD), substance abuse and addiction, prison records, and domestic violence. Many hard-to-serve singles are dealing with several of these challenges simultaneously, and difficulties are often compounded by chronic homelessness, the most extreme form of poverty.
The 2009 Wilder Homeless Study (2010b) found high co-occurring levels of serious mental illness, chronic health conditions, and substance abuse disorders among homeless adults. Only 1 in 4 homeless individuals (26%) reported none of the three disabilities.
11 percent experienced serious mental illness, chronic health conditions, and substance abuse disorders.
19 percent experienced chronic health conditions and mental illness.
8 percent experienced substance abuse disorders and serious mental illness.
2 percent experienced substance abuse disorders and chronic health conditions.
Veterans
More than 400,000 Minnesotans have served in the military, approximately 10 percent of the adult population. Veterans overall tend to have higher incomes than nonveterans (31% higher in 2007). Veterans also have lower poverty rates than the nonveteran population: 4.1 percent of veterans live at or below the poverty level, compared to 9.2 percent of nonveterans (Vilsack, 2009).
Veterans are much more likely than nonveterans to have a disability. For veterans at or below the poverty level, 44 percent have a disability compared to 30 percent of the nonveteran poverty population. Of the nonpoverty population, 21 percent of veterans have a disability compared to 13 percent of nonveterans (Vilsack, 2009).
While veterans are less likely to live in poverty overall, they represent a distinct subset of the chronic homeless population. Chronically homeless individuals, in addition to living below the poverty level,

43 | P a g e
often suffer from additional problems such as mental illness (including PTSD) and substance abuse disorders.
In Minnesota, 11 percent of homeless adults counted in the 2009 homeless survey were veterans (Wilder Research, 2010a), mirroring their presence in the statewide population. While the large majority of homeless veterans are male, the homeless female veteran population increased significantly between 2006 and 2009, from 29 to 64, an increase of 120 percent. Nearly half of homeless vets are people of color (46%) and the overrepresentation is particularly strong among African Americans and American Indians.
Nearly two-thirds of Minnesota’s homeless vets (63%) are long-term homeless (homeless a year or longer or homeless four or more times in the last three years). Two-thirds (67%) had experienced at least one institutional or treatment program such as a drug or alcohol treatment facility, a halfway house, a mental health treatment facility, a group home, or a foster home. More than half (59%) had been in a correctional facility (Wilder, 2010a). Many homeless veterans face multiple challenges:
44 percent report a service-related health problem.
43 percent have at least one chronic medical condition.
57 percent have serious mental health problems (e.g., schizophrenia, bipolar disorder, major depression, PTSD).
45 percent are alcoholic or chemically dependent.
23 percent have a dual diagnosis of mental illness and chemical dependency.
54 percent have a physical, mental, or other health condition that limits the amount or type of work they can do.
84 percent have at least one serious or chronic disability.
Ex-Inmates
About 2.3 million Americans are behind bars—more than 1 in 100 adults. This is an increase of over 300 percent from 1980, giving the United States the highest rate of incarceration in the world. Prior to incarceration, more than two-thirds of male inmates were employed, and more than half were the primary source of financial support for their children (Pew Charitable Trusts, 2010). In 2008, about 1 in 33 working-age adults was an ex-prisoner and about 1 in 15 was an ex-felon. Looking solely at men, about 1 in 17 was an ex-prisoner and about 1 in 8 was an ex-felon (Pew Charitable Trusts, 2010; Schmitt & Warner, 2010).
Currently 1 in every 28 children in the United States—nearly 4 percent—has a parent in jail or prison. Twenty-five years ago, 1 in 125 had a parent in jail or prison. The numbers are even starker for African Americans: More than 10 percent of African American children have an incarcerated father and 1 percent have an incarcerated mother (Pew Charitable Trusts, 2010). Incarceration has a significant impact on earning power: Former inmates saw subsequent wages reduced by 11 percent, annual employment reduced by nine weeks, and annual earnings reduced by 40 percent (from $39,100 to $23,500; Pew Charitable Trusts, 2010). This affects not only ex-felons, but their families as well.
People with Mental Disorders
Approximately 6 percent of the U.S.
population suffers from a serious
mental disorder (National Institute of
Mental Health, 2010). There is a
strong, consistent, negative
relationship between mental illness
and socioeconomic status: The lower
the socioeconomic status of an
individual, the higher the risk of
mental illness (Hudson, 2005).
The relationship between mental
illness and poverty is complex and
multidirectional. In some
circumstances, the stress associated
with adverse circumstances, such as
poverty, influences the development
of mental illness (Perese, 2007).
Conversely, developing a mental
illness can impact ability to maintain
employment, which can trigger
descent into poverty. But while the
relationship can and does go in both
directions, research has found that
socioeconomic status does impact the
development of mental illness
directly as well as indirectly; thus if
poverty is reduced, mental illness by
necessity will also be reduced.
Serious mental illness is a significant
cause of homelessness. It disrupts
one’s ability to carry out essential
aspects of daily life, such as working,
self-care, and household
management. The 2009 Wilder
Homeless Study found that more than
half (59%) of adults who are
homeless for at least a year have a
serious mental illness. Among youth,
46 percent report a serious mental
illness.
Between one-third and one-half of
people with serious mental illness are
at or near the poverty level (Cook,
2006).

44 | P a g e
Bruce Western (2002) characterizes incarceration as a key life event that triggers a cumulative spiral of disadvantage: It reduces not just the level of wages but also the rate of wage growth over the life course. Incarceration reduces access to the steady job market: Employers are less likely to hire ex-offenders than comparable job applicants without criminal records. Incarceration also erodes job skills and may exacerbate pre-existing mental or physical illness which also impact the likelihood of finding gainful employment. As a result, ex-inmates tend to follow the low-wage trajectories common among day laborers and other contingent workers. In general, career jobs are inaccessible to ex-offenders (Western, 2002).
To further exacerbate their situation, many felons emerge from prison not only with a criminal record but also substantial debt (Harris, Evans, & Beckett, 2010). Monetary sanctions are imposed on a substantial majority of people convicted of crimes. More than three-quarters (80%) of individuals on probation have fines, fees, and/or restitution orders imposed on them, and two-thirds (66%) of prison inmates were assessed monetary sanctions by the courts in 2004 (up from 25% in 1991). This debt further reduces income and adds an additional challenge to obtaining a living-wage job. Minnesota numbers are higher than the national average: 78 percent of prison inmates experienced court-imposed monetary sanctions (Harris, Evans, & Beckett, 2010). These monetary sanctions have a significant and long-term impact: It will take more than a decade for an ex-inmate paying $100/month to pay off his debt. Those who make payments of $50/month will remain in arrears 30 years later.
While poverty estimates are not available for ex-prisoners, this is an important population to keep in mind when addressing poverty, as the proportion of ex-offenders in the working-age population is expected to increase substantially in coming decades. According to Wilder Research (2010b), the proportion of people experiencing homelessness who are ex-offenders has been on the increase for a decade. In 2009, 63 percent of homeless adult men and 28 percent of homeless adult women had been incarcerated at least once. To get an idea of the scope of future incarceration, the Bureau of Justice Statistics has estimated that 11.3 percent of males born in 2001 will be imprisoned at some point during their lifetime compared to just 3.6 percent of those born in 1974. These higher imprisonment rates will result in large increases in the ex-offender population over time (Schmitt & Warner, 2010).
Victims of Domestic Violence
Domestic violence is a significant contributor to poverty and homelessness, most particularly for women. Women seeking to leave abusive partners often report economic concerns as a major barrier (Postmus, 2010). Numerous studies have found that between 25 and 50 percent of homeless women are homeless because of domestic violence. In the 2009 Wilder Homeless study, 29 percent of homeless women indicated domestic violence was a primary reason for their homelessness (Wilder, 2010b).
Poverty limits women’s choices and makes it harder for them to escape violent relationships. While women of all income levels experience domestic violence, low-income women experience domestic violence at higher rates than middle- and upper-income women (Buskovick & Peterson, 2009).

45 | P a g e
Seniors
Nearly 1 in 10 adults age 65+ lives in poverty and more than 1 in 3 (36%) live below 200 percent of the federal poverty level (O’Brien, Wu, & Baer, 2010). It should be noted that poverty thresholds5 for seniors are higher than for the rest of the population, based on an assumption that elders need less cash income (and less food) to meet basic needs than do younger adults. For example, in 2010, the poverty threshold for a single person under 65 years of age was $11,344 while for a single person age 65 or older it was 8 percent lower, or $10,458 (Gerontology Institute, 2009; U.S. Census Bureau, 2011).
The method used to measure poverty makes a large difference when calculating elder poverty rates. Alternative poverty measures that account for out-of-pocket health care costs (a major expense for elders that increases with age) indicate poverty rates 17 to 89 percent higher than the official rate, depending on subgroup (Butrica, Murphy, & Zedlewski, 2008).
Significant progress has been made in addressing elder poverty in the last 50 years. In the 1960s, poverty rates for elders stood at 25 percent. Poverty declined throughout the 1970s as Social Security benefits expanded. The elder poverty rate stabilized at about 10 percent in the late 1990s, and has remained at or near that level since.
5 Federal poverty thresholds are different from federal poverty guidelines. The poverty thresholds are updated
each year by the U.S. Census Bureau and vary by family size and age of members. The poverty guidelines are based on the poverty thresholds and are updated each year by the U.S. Department of Health and Human Services. The guidelines are a simplification of the thresholds and are used primarily for administrative purposes, such as determining eligibility for certain federal programs.
0
5
10
15
20
25
1970 1974 1978 1982 1986 1990 1994 1998 2002 2006 2010
Pe
rce
nt
Percent of Population 65+ in Poverty, U.S.
Recession People 65+ PovertySource: U.S. Census Bureau

46 | P a g e
Social Security continues to play a significant role in alleviating poverty among elders: More than 30 percent of our elder population is lifted out of poverty via Social Security (Johnson & Mermin, 2009; Van de Water & Sherman, 2010). Poverty is not evenly distributed among elders, and some subgroups are significantly more likely to struggle to meet their basic needs than others:
Elders of color, particularly blacks (20%) and Hispanics/Latinos (19%)
Elder women (12%) Widows (14%) Elder women of color, particularly blacks (24%) and
Hispanics/Latinos (22%) Elders with less than a high school diploma (19%) Elders who never married (18%) or are divorced or
separated (17%) Elders living alone (17%) Those age 85+ (13%) Noncitizens (21%)
Older women are more likely to be poor than older men because of
fewer economic resources due to lower wages, lower lifetime
earnings, and less time in the workforce. Women also have longer life
expectancies accompanied by chronic illness, and are more likely than men to experience loss of income
when widowed (Gerontology Institute, 2009). Elder women in Minnesota are nearly twice as likely to
live in poverty as men: 10.5 percent of Minnesota women age 65+ are at or below poverty compared to
6.2 percent of 65+ men (2010 American Community Survey, three-year estimates).
Widowhood is a significant risk factor or trigger into poverty. Approximately half of women over age 65
are widows. Nearly 1 in 3 will experience poverty in any given year, and their risk of being poor at some
point over a 10-year span is over 50 percent. Two leading causes of these high poverty rates are
9.7%
45.2%
11.9%
49.7%
With Social Security Without Social Security
Elder Poverty Rates with and without Social Security
(U.S., 2008) All 65+
Women 65+
Source: Van de Water & Sherman, 2010
According to the Elder
Economic Security Standard
Index (Elder Index) for
Minnesota:
For single elders in good health, the
statewide Minnesota Elder Index (the
amount of money required to meet
basic needs in Minnesota) is $16,767
for homeowners without a mortgage
or $19,090 for renters and
homeowners with a mortgage.
The average Social Security benefit
for Minnesota elders is $13,059 per
year for an individual.
For elder couples in good health, the
statewide Minnesota Elder Index is
$26,486 for homeowners without a
mortgage or $28,809 for renters and
homeowners with a mortgage.
The federal poverty guideline is
$14,000 per year for elder couples.
This is only 53 percent of the Elder
Index for homeowners without a
mortgage or 49 percent for renters
and homeowners with a mortgage.
The average Social Security benefit
for Minnesota couples is estimated to
be $21,143 per year. This represents
80 percent of the statewide Elder
Index for homeowners without a
mortgage or 74 percent for renters
and homeowners with a mortgage.
Source: The Elder Economic Security
Standard Index for Minnesota, Gerontology
Institute, University of Massachusetts
Boston, 2009.

47 | P a g e
insufficient wealth accumulation prior to widowhood and significant health care expenses immediately
prior to the death of a spouse. Out-of-pocket spending averages approximately $6,000 in the last year of
life, a 50 percent increase over previous years. One study found that mean family income for women
before and after the death of a spouse dropped from $23,284 to $11,121 and the poverty rate jumped
from 14 percent to 26 percent (Lee & Lee, 2006; McGarry & Schoeni, 2005).
Seniors of color are also at greater risk: A recent study found that significant majorities of African
American senior households (76%) and Hispanic/Latino senior households (85%) are at risk of having
insufficient financial resources to meet median projected expenses for their projected life expectancy,
based on financial net worth and projected Social Security and pension income. This is due in large part
to health care costs. Health care premiums are rising disproportionately to income for seniors on fixed
incomes, posing an even larger burden for economic security in the future (Meschede, Shapiro, Sullivan,
& Wheary, 2010). The figure below shows that in 2010, African American and American Indian seniors
had the highest poverty rates of all racial and ethnic groups, and in Minnesota and the Minneapolis/St.
Paul Metropolitan Statistical Area (MSA)6 rates for these two population groups were three or more
times higher than for whites and significantly higher than the national average.
Nearly 40 percent of elders age 65+ report having a disability of some kind, while more than half (53%)
of elders at or below poverty report a disability of some kind. Not surprisingly, low-income elders are
much more likely to experience financial hardship due to medical expenses. While the majority of elders
spend less than one-eighth of their income on health care (primarily on premiums), over one-quarter
(28%) spend more than 20 percent of their income on health care, and nearly half of low-income elders
6This area consists of the following counties: Anoka, Carver, Chisago, Dakota, Hennepin, Isanti, Ramsey, Scott,
Sherburne, Washington, and Wright.
8.0
%
7.9
%
6.3
%
19
.4%
31
.9%
30
.9%
19
.3%
26
.1%
30
.2%
12
.8%
21
.7%
21
.9%
18
.0%
15
.3%
16
.2%
19
.0%
21
.1%
20
.0%
U.S. MN Minneapolis/St. Paul MSA
Population 65+ in Poverty by Race, 2010 White African American American Indian
Asian/Pacific Islander Other/2+ Races Hispanic/Latino
Source: 2010 American Community Survey, 3-year estimates

48 | P a g e
(< 200% poverty) spend more than 20 percent of their income on health care. Twenty percent is a
common indicator for financially burdensome health care costs (Johnson & Mommaerts, 2009).
It should be noted that elders with very low incomes may qualify for Medicaid, which covers virtually all
heath care costs and is much more comprehensive than Medicare. About a quarter of older adults in
poverty are currently enrolled in Medicaid—only half of those eligible (Butrica, Murphy, & Zedlewski,
2008; Johnson & Mommaerts, 2009; O’Brien, Wu, & Baer, 2010).
While elder households are generally less likely to be food insecure than households with children,
those that are food insecure are less likely to be enrolled in the food stamp program: only 30 to 40
percent of eligible elders receive SNAP (federal food stamp program) benefits (O’Brien, Wu, & Baer,
2010).
While the situation of elders currently in poverty is of concern, it should be noted that today’s elders are
better prepared for retirement than upcoming generations will be. This is because subsequent
generations are experiencing declining employer-based retirement savings and rising debt (Meschede,
Shapiro, Sullivan, & Wheary, 2010).
In general, older people are more likely to fall into poverty for a long period of time compared to
younger people, and they are also less likely to escape poverty after they fall into it. In a five-year
period, 24 percent of elders will experience at least one year in poverty compared to 20 percent for the
younger population. Once they have fallen into poverty, the likelihood that elders will exit poverty is 35
percent compared to 40 percent for the younger population. And after three consecutive years in
poverty, the likelihood of escaping poverty is substantially lower for elders, especially elder women
(7.3% vs. 21.3% for younger people). Among the 65+ population who fall into poverty, 31 percent
remain poor for 10 or more years compared to 11 percent for the younger population (Public Policy
Institute, 2003).
People with Disabilities
Disability has a strong intersect with aging, as disability rates increase steadily when people approach retirement: Disability rates approximately double from age 55 to age 64. Disability is particularly common among low-income individuals with little education: High school dropouts are nearly three times as likely to be disabled as college graduates. These higher disability rates are likely due to a combination of limited access to health care, higher stress levels, and, potentially, less healthy behaviors. In addition, disability rates are higher for women than for men and
7.4%
17.0% 15.5%
30.5%
All Adults Single Adults
Poverty Rates Before and After Disability (Ages 51-64)
Before Disability
After Disability
Source: Johnson, Favreault, & Mommaerts, 2010

49 | P a g e
higher for African Americans and Hispanics/Latinos than for non-Hispanic whites (Johnson, Favreault, & Mommaerts, 2010).
One reason that the links between poverty and disability have received so little attention is that there is no official or consistent definition of disability across surveys. However, studies on the dynamics of poverty have found that changes in disability are second only to changes in employment status as a predictor of poverty entry and exit, followed by shifts to and from a female-headed household (She & Livermore, 2009).
For adults who become disabled between the ages of 51 and 64, the percentage in poverty increases from 7.4 percent (prior to disability) to 15.5 percent (after disability). Poverty rates are much higher for single adults, both before disability (17%) as well as after disability onset (30.5%) (Johnson, Favreault, & Mommaerts, 2010). Poverty rates are high because many people with disabilities do not receive benefits. For those that do receive benefits, they are often not generous enough to lift them out of poverty.
The connection between poverty and disability is complex and multidirectional. For working adults who become disabled, disability can be a trigger into poverty. Even if the individual is able to continue to work, people with disabilities are often excluded from the labor market because of fears of increased costs and the potential need for accommodations. Poverty can also contribute to the likelihood of disability, as people in poverty often have less access to health care in general and preventive care in particular. People living in poverty are also exposed to risk factors that increase the likelihood of impairment and disability, including insufficient nutrition and substandard and crowded housing (Kessler Foundation, 2010).
Disability rates in Minnesota are below the national average: Nationally, 10 percent of the working age population (ages 21-64) has some type of disability compared to 8 percent in Minnesota. Likelihood of disability increases with age. Children under age 5 are the least likely to experience disability (< 1%). For children ages 5 to 15 the prevalence increases to 5 percent. Moving up the age spectrum, 27 percent of those ages 65 to 74 have some type of disability, as do 52 percent of those age 75+ (Erickson & von Schrader, 2010).
The poverty rate for working-age people with disabilities is significantly higher than that of the nondisabled population: 25 percent compared to about 10 percent nationally. Poverty rates vary by type of disability.7 Among the working-age population, poverty levels are highest for individuals with cognitive disabilities (32% in poverty), independent living disabilities (31%), and self-care disabilities (31%). However, high poverty rates are also seen for people with visual and ambulatory disabilities (28% each) and hearing disabilities (18%) (Erickson & von Schrader, 2010).
Long-term poverty rates among people with disabilities are much higher than short-term poverty rates. People with disabilities represented 47 percent of those in poverty according to a short-term measure but 65 percent of those in poverty according to a long-term measure (She & Livermore, 2009).
7 The Census Bureau defines six types of disability: visual, hearing, ambulatory, cognitive, self-care, and
independent living (Erickson & von Schrader, 2010).
GREATER TWIN CITIES UNITED WAYF A C E S O F P O V E R T Y 2 0 1 2
C O N C L U S I O N

51 | P a g e
Conclusion
Poverty is a growing part of the American experience. Structural changes in the economy make it
increasingly likely that the average American will spend a year or more in poverty at some point in his or
her life. Economic factors that contribute to the increase in situational poverty include job loss, flat and
declining wages, more low-paying service jobs and fewer high-paying manufacturing jobs, a decline in
unions, and the increasingly common experience of significant medical debt. Between the ages of 20
and 75, more than half the population (59%) will have experienced at least one year in poverty and two-
thirds (65%) will at some point reside in a household that receives a means-tested welfare program such
as food stamps, SSI, Medicaid, Temporary Assistance for Needy Families (TANF), or some other cash
assistance (Rank, 2007).
Most spells of poverty are relatively short. Typically, households are in poverty for a year or two and
then come out the other side. However, an increasing segment of the poverty population—44 percent in
Minnesota—are in extreme poverty (half of the federal poverty guidelines, or $11,175 for a family of
four). These households struggle more to emerge from poverty and are more likely to stay in poverty for
extended periods of time. One reason for this is that they do not have the wealth, assets, and social
networks available to more resourced households. This is also why populations of color are more likely
to live in poverty: Because of historical disenfranchisement, they are less likely to have the accumulation
of wealth, assets, and social connections to weather a poverty spell and are more likely to live in long-
term, intergenerational poverty.
Poverty is not one size fits all. A college student living below the poverty line and eating ramen noodles
does not have the same experience as a homeless veteran with serious and persistent mental illness. A
person unable to work because of a severe disability does not have the same poverty experience as a
newly arrived immigrant. For children growing up in poverty, however, the risks cross all boundaries:
The negative effects of poverty are pervasive, cumulative, and increase with age. Children who are
raised in poverty show a negative impact on their lives, even when they are born healthy. For example,
they tend to show gradual declines in mental, motor, and socio-emotional development. They have
poorer quality relationships with their caregivers. In preschool, they are more likely to have problems
getting along with other children. By the time they start school they are more likely to need special
services and are more likely to be held back a grade (or more) as they age. They are more likely to drop
out of high school and are more likely to live in poverty as adults.
While there are no panaceas, education in general is one of the best antipoverty strategies known.
People with higher levels of academic achievement and more years of school earn more than those with
less education. Early intervention in the form of high-quality childcare and preschool can help to level
the playing field. Continuing support throughout the school years and helping to connect these youth to
postsecondary education will have a positive, long-term effect on lifetime earnings.

52 | P a g e
For adults, workforce development programs can be an effective pathway out of poverty. Programs that
give workers a postsecondary credential, have direct ties to employers and industries with well-paying
jobs, and supports and services during training and initial placement have been found to have the
strongest results.

53 | P a g e
Appendix

54 | P a g e
Data Tables
Poverty by Age and Race
Minneapolis/ St. Paul MSA
Total African
American White
American Indian
Asian/ Pac. Isl.
Other/ 2+ Hispanic/
Latino
Total 3,204,209 229,652 2,643,103 18,924 181,849 130,681 169,102 # poverty 321,033 77,033 182,771 5,753 31,476 24,000 37,021 % poverty 10.0% 33.5% 6.9% 30.4% 17.3% 18.4% 21.9%
0 to 5 268,000 30,163 189,314 1,547 21,214 25,762 26,581 # poverty 38,591 12,964 15,626 472 4,041 5,488 7,931 % poverty 14.4% 43.0% 8.3% 30.5% 19.0% 21.3% 29.8%
6 to 17 541,265 50,838 408,793 3,894 38,716 39,024 40,267 # poverty 68,697 21,309 29,120 1,600 9,308 7,360 10,182 % poverty 12.7% 41.9% 7.1% 41.1% 24.0% 18.9% 25.3%
18 to 64 2,067,544 139,540 1,737,684 12,827 113,711 63,782 98,566 # poverty 189,206 39,941 118,641 3,483 16,331 10,810 18,170 % poverty 9.2% 28.6% 6.8% 27.2% 14.4% 16.9% 18.4%
65+ 327,400 9,111 307,312 656 8,208 2,113 3,688 # poverty 24,539 2,819 19,384 198 1,796 342 738 % poverty 7.5% 30.9% 6.3% 30.2% 21.9% 16.2% 20.0%
Minnesota Total African
American White
American Indian
Asian/ Pac. Isl.
Other/ 2+ Hispanic/
Latino
Total 5,155,446 254,507 4,464,311 52,938 205,594 178,096 238,076 # poverty 565,433 88,562 385,276 20,049 34,759 36,787 58,151 % poverty 11.0% 34.8% 8.6% 37.9% 16.9% 20.7% 24.4%
0 to 5 417,946 33,783 320,033 5,810 23,416 34,904 37,833 # poverty 67,215 14,826 36,301 3,008 4,144 8,936 12,823 % poverty 16.1% 43.9% 11.3% 51.8% 17.7% 25.6% 33.9%
6 to 17 844,527 56,404 680,598 11,391 42,453 53,681 58,688 # poverty 108,883 24,234 58,450 5,403 9,678 11,118 15,378 % poverty 12.9% 43.0% 8.6% 47.4% 22.8% 20.7% 26.2%
18 to 64 3,251,358 154,610 2,847,762 33,013 130,159 85,814 136,079 # poverty 334,340 46,409 241,972 10,928 18,862 16,169 28,792 % poverty 10.3% 30.0% 8.5% 33.1% 14.5% 18.8% 21.2%
65+ 641,615 9,710 615,918 2,724 9,566 3,697 5,476 # poverty 54,995 3,093 48,553 710 2,075 564 1,158 % poverty 8.6% 31.9% 7.9% 26.1% 21.7% 15.3% 21.1%
USA Total African
American White
American Indian
Asian/ Pac. Isl.
Other/ 2+ Hispanic/
Latino
Total 298,931,525 36,797,544 222,663,718 2,421,062 14,759,532 22,289,669 48,267,138 # poverty 42,931,760 9,475,042 25,988,866 644,423 1,745,726 5,077,703 11,259,201 % poverty 14.4% 25.7% 11.7% 26.6% 11.8% 22.8% 23.3%
0 to 5 23,860,449 3,353,036 15,996,196 230,221 1,114,994 3,166,002 5,925,798 # poverty 5,503,690 1,399,283 2,937,137 88,358 126,453 952,459 1,975,526 % poverty 23.1% 41.7% 18.4% 38.4% 11.3% 30.1% 33.3%
6 to 17 49,138,544 7,232,194 33,861,930 485,849 2,204,526 5,354,045 10,595,767 # poverty 9,138,350 2,428,260 4,862,968 151,822 290,176 1,405,124 3,057,160 % poverty 18.6% 33.6% 14.4% 31.2% 13.2% 26.2% 28.9%
18 to 64 187,652,919 22,995,979 140,181,847 1,531,223 10,076,099 12,867,771 29,130,873 # poverty 24,673,397 5,022,626 15,567,531 370,749 1,155,080 2,557,411 5,730,086 % poverty 13.1% 21.8% 11.1% 24.2% 11.5% 19.9% 19.7%
65+ 38,279,613 3,216,335 32,623,745 173,769 1,363,913 901,851 2,614,700 # poverty 3,616,323 624,873 2,621,230 33,494 174,017 162,709 496,429 % poverty 9.4% 19.4% 8.0% 19.3% 12.8% 18.0% 19.0%
Source: 2010 American Community Survey (3-year estimates)

55 | P a g e
Children in Poverty by Age and Race
Minneapolis/ St. Paul MSA
Total African
American White
American Indian
Asian/ Pac. Isl.
Other/ 2+ Hispanic/
Latino
0 to 17 809,265 81,001 598,107 5,441 59,930 64,786 66,848 # poverty 107,288 34,273 44,746 2,072 13,349 12,848 18,113 % poverty 13.3% 42.3% 7.5% 38.1% 22.3% 19.8% 27.1%
0 to 5 268,000 30,163 189,314 1,547 21,214 25,762 26,581 # poverty 38,591 12,964 15,626 472 4,041 5,488 7,931 % poverty 14.4% 43.0% 8.3% 30.5% 19.0% 21.3% 29.8%
6 to 11 268,265 24,988 199,112 1,977 19,801 22,387 23,336 # poverty 35,001 10,874 14,644 1,124 4,232 4,127 6,031 % poverty 13.0% 43.5% 7.4% 56.9% 21.4% 18.4% 25.8%
12 to 17 273,000 25,850 209,681 1,917 18,915 16,637 16,931 # poverty 33,696 10,435 14,476 476 5,076 3,233 4,151 % poverty 12.3% 40.4% 6.9% 24.8% 26.8% 19.4% 24.5%
Minnesota Total African
American White
American Indian
Asian/ Pac. Isl.
Other/ 2+ Hispanic/
Latino
0 to 17 1,262,473 90,187 1,000,631 17,201 65,869 88,585 96,521 # poverty 176,098 39,060 94,751 8,411 13,822 20,054 28,201 % poverty 13.9% 43.3% 9.5% 48.9% 21.0% 22.6% 29.2%
0 to 5 417,946 33,783 320,033 5,810 23,416 34,904 37,833 # poverty 67,215 14,826 36,301 3,008 4,144 8,936 12,823 % poverty 16.1% 43.9% 11.3% 51.8% 17.7% 25.6% 33.9%
6 to 11 414,472 27,896 329,253 5,561 21,733 30,029 32,991 # poverty 55,716 12,472 29,418 3,176 4,385 6,265 8,859 % poverty 13.4% 44.7% 8.9% 57.1% 20.2% 20.9% 26.9%
12 to 17 430,055 28,508 351,345 5,830 20,720 23,652 25,697 # poverty 53,167 11,762 29,032 2,227 5,293 4,853 6,519 % poverty 12.4% 41.3% 8.3% 38.2% 25.5% 20.5% 25.4%
USA Total African
American White
American Indian
Asian/ Pac. Isl.
Other/ 2+ Hispanic/
Latino
0 to 17 72,998,993 10,585,230 49,858,126 716,070 3,319,520 8,520,047 16,521,565 # poverty 14,642,040 3,827,543 7,800,105 240,180 416,629 2,357,583 5,032,686 % poverty 20.1% 36.2% 15.6% 33.5% 12.6% 27.7% 30.5%
0 to 5 529,516,204 69,268,565 388,834,431 4,596,708 1,114,994 3166002 88,657,212 # poverty 341,863,285 46,272,586 248,652,584 3,065,485 126,453 952459 59,526,339 % poverty 64.6% 66.8% 63.9% 66.7% 11.3% 30.1% 67.1%
6 to 11 24,009,371 3,439,383 16,460,877 233,772 1,111,055 2,764,284 5,402,312 # poverty 4,766,164 1,243,916 2,550,179 78,155 133,030 760,884 1,652,635 % poverty 19.9% 36.2% 15.5% 33.4% 12.0% 27.5% 30.6%
12 to 17 25,129,173 3,792,811 17,401,053 252,077 1,093,471 2,589,761 5,193,455 # poverty 4,372,186 1,184,344 2,312,789 73,667 157,146 644,240 1,404,525 % poverty 17.4% 31.2% 13.3% 29.2% 14.4% 24.9% 27.0%
Source: 2010 American Community Survey (3-year estimates)

56 | P a g e
Seniors in Poverty by Age and Race
Minneapolis/ St. Paul MSA
Total African
American White
American Indian
Asian/ Pac. Isl.
Other/ 2+ Hispanic/
Latino
55 to 64 350,866 13,283 322,057 1,706 9,982 3,779 5,803 # poverty 22,384 4,315 15,500 271 1,614 684 938 % poverty 6.4% 32.5% 4.8% 15.9% 16.2% 18.1% 16.2%
65 to 74 178,964 5,813 165,819 493 5,440 1,386 2,599 # poverty 11,874 1,921 8,256 143 1,314 240 468 % poverty 6.6% 33.0% 5.0% 29.0% 24.2% 17.3% 18.0%
75+ 148,483 3,298 141,493 163 2,768 727 1,089 # poverty 12,665 898 11,128 55 482 102 270 % poverty 8.5% 27.2% 7.9% 33.7% 17.4% 14.0% 24.8%
Minnesota Total African
American White
American Indian
Asian/ Pac. Isl.
Other/ 2+ Hispanic/
Latino
55 to 64 599,269 14,626 562,109 4,598 11,893 5,938 8,446 # poverty 39,869 4,721 31,264 1,070 1,753 1,061 1,509 % poverty 6.7% 32.3% 5.6% 23.3% 14.7% 17.9% 17.9%
65 to 74 341,719 6,231 324,630 1,990 6,293 2,536 3,469 # poverty 22,731 2,177 18,110 530 1,508 385 620 % poverty 6.7% 34.9% 5.6% 26.6% 24.0% 15.2% 17.9%
75+ 299,969 3,479 291,288 734 3,273 1,161 2,007 # poverty 32,285 916 30,443 180 567 179 538 % poverty 10.8% 26.3% 10.5% 24.5% 17.3% 15.4% 26.8%
USA Total African
American White
American Indian
Asian/ Pac. Isl.
Other/ 2+ Hispanic/
Latino
55 to 64 34,468,714 3,504,847 28,062,519 221,460 1,494,969 1,184,919 2,932,869 # poverty 3,233,413 661,649 2,193,228 46,785 132,963 198,788 468,222 % poverty 9.4% 18.9% 7.8% 21.1% 8.9% 16.8% 16.0%
65 to 74 20,968,815 1,925,314 17,535,995 112,670 825,376 569,460 1,566,311 # poverty 1,751,043 339,984 1,201,471 20,383 91,647 97,558 278,842 % poverty 8.4% 17.7% 6.9% 18.1% 11.1% 17.1% 17.8%
75+ 17,310,798 1,291,021 15,087,750 61,099 538,537 332,391 1,048,389 # poverty 1,865,280 284,889 1,419,759 13,111 82,370 65,151 217,587 % poverty 10.8% 22.1% 9.4% 21.5% 15.3% 19.6% 20.8%
Source: 2010 American Community Survey (3-year estimates)

57 | P a g e
Ratio of Income to Poverty by Age
9 County Metro MN U.S. # % # % # % Total Population 2,876,625 100.0% 5,157,470 100.0% 298,931,525 100.0%
Below 50% 135,931 4.7% 247,275 4.8% 18,723,394 6.3% Below 100% 296,696 10.3% 565,594 11.0% 42,931,760 14.4% Below 200% 679,993 23.6% 1,356,333 26.3% 98,122,034 32.8%
0 to 5 237,002 100.0% 418,202 100.0% 23,860,449 100.0%
Below 50% 16,529 7.0% 29,771 7.1% 2,536,400 10.6% Below 100% 35,756 15.1% 67,286 16.1% 5,503,690 23.1% Below 200% 79,333 33.5% 150,751 36.0% 10,973,814 46.0%
0 to 17 715,426 100.0% 1,263,008 100.0% 72,998,993 100.0%
Below 50% 45,375 6.3% 76,664 6.1% 6,437,076 8.8% Below 100% 99,215 13.9% 176,190 14.0% 14,642,040 20.1% Below 200% 217,050 30.3% 410,489 32.5% 30,729,630 42.1%
18 to 64 1,862,565 100.0% 3,252,774 100.0% 187,652,919 100.0%
Below 50% 84,295 4.5% 156,708 4.8% 11,329,918 6.0% Below 100% 175,014 9.4% 334,388 10.3% 24,673,397 13.1% Below 200% 388,499 20.9% 753,110 23.2% 55,239,888 29.4%
65+ 298,634 100.0% 641,688 100.0% 38,279,613 100.0%
Below 50% 6,261 2.1% 13,903 2.2% 956,400 2.5% Below 100% 22,467 7.5% 55,016 8.6% 3,616,323 9.4% Below 200% 74,444 24.9% 192,734 30.0% 12,152,516 31.7%
Source: 2010 American Community Survey (3-year estimates)
Work Experience of Those in Poverty
9 County Metro MN U.S. In the past 12 months income below poverty level*:
# % # % # %
208,682 100.0 408,209 100.0 29,768,568 100.0
Worked full time, year-round 15,000 7.2 33,723 8.3 2,697,795 9.1 Worked part-time or part-year 87,821 42.1 177,786 43.6 10,178,501 34.2 Did not work 105,861 50.7 196,700 48.2 16,892,272 56.7
Source: 2010 American Community Survey (3-year estimates) *Population 16 years and over
Employment Status of Those in Poverty
9 County Metro MN U.S. # % # % # %
Among those in poverty*: 208,610 100.0 408,107 100.0 29,750,677 100.0
In the labor force: 104,313 50.0 205,947 50.5 13,355,675 44.9 Employed 75,521 72.4 154,432 75.0 9,375,495 70.2 Unemployed 28,792 27.6 51,515 25.0 3,980,180 29.8
Not in the labor force 104,297 50.0 202,160 49.5 16,395,002 55.1
Source: 2010 American Community Survey (3-year estimates) *Population 16 years and over

58 | P a g e
Highest Level of Educational Attainment
9 County Metro MN U.S.
Among total population ages 25+: # % # % # %
Total Population 1,908,486 100.0% 3,441,768 100.0% 198,503,896 100.0%
Less than High School Diploma 140,006 7.3% 280,865 8.2% 28,445,571 14.3% High School Dip. or Equivalent 436,746 22.9% 944,198 27.4% 56,123,802 28.3% Some College 584,119 30.6% 1,118,848 32.5% 57,616,224 29.0% Bachelor’s Degree or Higher 747,615 39.2% 1,097,857 31.9% 56,318,299 28.4% Source: 2010 American Community Survey (3-year estimates)
9 County Metro MN U.S.
Among those in poverty ages 25+: # % # % # %
Total in Poverty 144,559 100.0% 278,211 100.0% 21,678,727 100.0%
Less than High School Diploma 38,647 26.7% 69,659 25.0% 7,293,434 33.6% High School Dip. or Equivalent 45,077 31.2% 95,798 34.4% 7,015,324 32.4% Some College 38,966 27.0% 80,366 28.9% 5,150,707 23.8% Bachelor’s Degree or Higher 21,869 15.1% 32,388 11.6% 2,219,262 10.2% Source: 2010 American Community Survey (3-year estimates)

59 | P a g e
Poverty Status of Families with Children under 18
Minneapolis/ St. Paul MSA All
Asian/ Pacific
Islander
African American
American Indian
White Other/ 2+ Hispanic/
Latino
All families 816,833 4,637 49,376 4,637 705,242 19,500 32,019 # in Poverty 52,216 1,275 14,564 1,275 28,234 3,294 6,485 % in Poverty 6.4% 27.5% 29.5% 27.5% 4.0% 16.9% 20.3%
Married couple 641,180 2,061 19,746 2,061 579,111 10,496 18,939 # in Poverty 17,410 98 2,960 98 11,000 604 2,061 % in Poverty 2.7% 4.8% 15.0% 4.8% 1.9% 5.8% 10.9%
Male householder, no wife present 50,146 685 5,730 685 38,036 2,875 4,921
# in Poverty 5,986 190 1,317 190 3,389 637 1,282 % in Poverty 11.9% 27.7% 23.0% 27.7% 8.9% 22.2% 26.1%
Female householder, no husband present 125,507 1,891 23,900 1,891 88,095 6,129 8,159
# in Poverty 28,820 987 10,287 987 13,845 2,053 3,142 % in Poverty 23.0% 52.2% 43.0% 52.2% 15.7% 33.5% 38.5%
Minnesota All Asian/ Pacific
Islander
African American
American Indian
White Other/ 2+ Hispanic/
Latino
All families 1,356,375 12,578 53,481 12,578 1,219,708 27,333 45,106 # in Poverty 94,947 4,482 16,319 4,482 63,801 5,009 10,552 % in Poverty 7.0% 35.6% 30.5% 35.6% 5.2% 18.3% 23.4%
Married couple 1,080,197 5,105 21,723 5,105 1,004,187 15,562 26,720 # in Poverty 33,341 641 3,561 641 24,862 1,270 3,790 % in Poverty 3.1% 12.6% 16.4% 12.6% 2.5% 8.2% 14.2%
Male householder, no wife present 82,633 1,969 6,624 1,969 66,760 3,695 6,586
# in Poverty 10,709 672 1,753 672 6,991 760 1,719 % in Poverty 13.0% 34.1% 26.5% 34.1% 10.5% 20.6% 26.1%
Female householder, no husband present 193,545 5,504 25,134 5,504 148,761 8,076 11,800
# in Poverty 50,897 3,169 11,005 3,169 31,948 2,979 5,043 % in Poverty 26.3% 57.6% 43.8% 57.6% 21.5% 36.9% 42.7%
USA All Asian/ Pacific
Islander
African American
American Indian
White Other/ 2+ Hispanic/
Latino
All families 76,262,975 657,863 8,737,081 553,564 59,153,642 4,322,415 10,189,850 # in Poverty 8,000,664 136,136 1,919,346 121,845 4,745,633 906,523 2,127,777 % in Poverty 10.5% 20.7% 22.0% 22.0% 8.0% 21.0% 20.9%
Married couple 56,319,371 392,093 3,872,473 321,039 46,683,264 2,618,237 6,424,536 # in Poverty 2,897,764 44,433 288,826 38,078 2,039,930 340,939 896,510 % in Poverty 5.1% 11.3% 7.5% 11.9% 4.4% 13.0% 14.0%
Male householder, no wife present 5,286,720 74,428 822,240 63,657 3,648,549 526,369 1,167,617
# in Poverty 817,678 19,218 186,296 17,238 483,610 102,796 224,147 % in Poverty 15.5% 25.8% 22.7% 27.1% 13.3% 19.5% 19.2%
Female householder, no husband present 14,656,884 191,342 4,042,368 168,868 8,821,829 1,177,809 2,597,697
# in Poverty 4,285,222 72,485 1,444,224 66,529 2,222,093 462,788 1,007,120 % in Poverty 29.2% 37.9% 35.7% 39.4% 25.2% 39.3% 38.8%
Source: 2010 American Community Survey (3-year estimates)

60 | P a g e
References

61 | P a g e
References
Acs, G. (2011). Downward Mobility from the Middle Class : Waking Up from the American Dream. Washington, DC: Pew Charitable Trusts.
Acs, G., Loprest, P., & Nichols, A. (2009). Understanding the Changing Risks to Family Incomes. Low-
Income Working Families No. 14. Washington, DC: The Urban Institute.
Acs, G., & Nichols, A. (2010). Changes in the Economic Security of American Families. Low Income
Working Families No. 16. Washington, DC: The Urban Institute.
Acs, G., & Zimmerman, S. (2008). U.S. Intragenerational Economic Mobility from 1984 to 2004: Trends
and Implications. Washington, DC: The Economic Mobility Project and The Pew Charitable
Trusts.
American Institute for Full Employment (2011, June). Minnesota Unemployment Insurance: Opportunity
Report. American Institute for Full Employment: Klamath Falls, OR.
Anderson, R.J. (2011). Dynamics of Economic Well-Being: Poverty, 2004-2006. Current Population
Reports, Series P70-123, U.S. Census Bureau: Washington, DC.
Autor, D. (2010). The Polarization of Job Opportunities in the U.S. Labor Market. Washington, DC.: Center
for American Progress and The Hamilton Project.
Bane, M. J., & Ellwod, D. T. (1986). Slipping into and out of Poverty: The Dynamics of Spells. The Journal
of Human Resources, 21(1), pp. 1-23.
Barnett, W. S., & Belfield, C. R. (2006). Early Childhood Development and Social Mobility. The Future of
Children, 16(2), pp. 73-98.
Beller, E., & Hout, M. (2006). Intergenerational Mobility for Women and Minorities in the United States.
The Future of Children, 16(2), pp. 19-36.
Berliner, D. (2009). Poverty and Potential: Out-of-School Factors and School Success. East Lansing, MI:
The Great Lakes Center for Education Research & Practice.
Blank, R. M. (2000). Fighting Poverty: Lessons from Recent U.S. History. Journal of Economic
Perspectives, 14(2), pp. 3-19.
Blank, R. M. (2011). Changing Inequality. Berkeley, CA: University of California Press.
Blank, R. M., & Kovak, B. (2008). The Growing Problem of Disconnected Single Mothers. National Poverty
Center Working Paper Series, #07-28. Washington, DC: National Poverty Center.

62 | P a g e
Borjas, G. J. (2006). Making It in America: Social Mobility in the Immigrant Population. Future of Children
16(2), pp. 55-71.
Bradbury, K., & Katz, J. (2009). Trends in U.S. Family Income Mobility, 1967-2004. Working Paper No. 09-
7. Federal Reserve Bank of Boston.
Brady, D. (2006). Structural theory and Relative Poverty in Rich Western Democracies, 1869-2000.
Research in Social Stratification and Mobility. 24, pp. 153-175.
Bureau of Labor Statistics (2011, December). Unemployed Persons by Duration of Unemployment.
Retrieved from http://www.bls.gov/webapps/legacy/cpsatab12.htm.
Buskovick, D., & Peterson, E. A. (2009, July). Domestic Violence: Results from the 2008 Minnesota Crime
Victim Survey. St. Paul, MN: Department of Public Safety & Greater Twin Cities United Way.
Butrica, B. A., Murphy, D., & Zedlewski, S. R. (2008, January). How Many Struggle to Get By in
Retirement? Washington, DC: Urban Institute.
Card, D., & Blank, R. M. (2008). The Changing Incidence and Severity of Poverty Spells Among Female-
Headed Families. American Economic Review, 98(2), pp. 387-391.
Cellini, S. R., McKernan, S., & Ratcliffe, C. (2008). The Dynamics of Poverty in the United States: A Review
of Data, Methods, and Findings. Journal of Policy Analysis and Management 27(3), pp. 577-605.
Collard, C. S. (2007). Linking Housing, Social Services, and Family Well-Being: A Model for Reducing
Welfare-Dependency Among the Hard-to-Employ. Journal of Human Behavior in the Social
Environment, 15(2/3), 415-433.
Collins, S. R., Kriss, J. L., Doty, M. M., & Rustgi, S. D. (2008). Losing Ground: How the Loss of Adequate
Health Insurance Is Burdening Working Families. Washington DC: The Commonwealth Fund.
Congressional Budget Office (2011). Trends in the Distribution of Household Income Between 1979 and
2007. Washington, DC: The Congress of the United States.
Cook, J. A. (2006). Employment Barriers for Persons with Psychiatric Disabilities: Update of a Report for
the President’s Commission. Psychiatric Services, 57(10), 1391-1405. Retrieved from
http://psychservices.psychiatryonline.org/cgi/reprint/57/10/1391.
Cunha, F., & Heckman, J. J. (2006, November). Investing in Our Young People. Bethesda, MD: National
Institutes of Health.
Dearing, E. (2008). Psychological Costs of Growing Up Poor. Annals of the New York Academy of
Sciences, 324-332.
Dickens, W. T., Sawhill, I., & Tebbs, J. (2006). The Effects of Investing in Early Education on Economic
Growth. Washington, DC: The Brookings Institution.

63 | P a g e
Dynan, K. (2010). The Income Rollercoaster: Rising Volatility and its Implications. Pathways. Washington
DC: Brookings Institute.
Erickson, W. L., & von Schrader, S. (2010). 2008 Disability Status Report: The United States. Ithaca, NY:
Cornell University Rehabilitation Research and Training Center on Disability Demographics and
Statistics.
Evans, G. W., & English, K. (2002). The Environment of Poverty: Multiple Stressor Exposure,
Psychophysiological Stress, and Socioemotional Adjustment. Child Development, 73(4), 1238-
1248.
Evans, G. W., & Schamberg, M. A. (2009). Childhood Poverty, Chronic Stress, and Adult Working
Memory. Proceedings of the National Academy of Sciences, PNAS Early Edition, Retrieved from
www.pnas.org/cgi/doi/10.1073/pnas0811910106.
Families USA. (2009). Too Great a Burden: Americans Face Rising Health Care Costs. Washington DC:
Families USA.
Fix, M., Zimmermann, W., & Passel, J. S. (2001). The Integration of Immigrant Families in the United
States. Washington DC: The Urban Institute.
Fryer, R. G., Jr., & Levitt, S. D. (2004). Understanding the Black-White Test Score Gap in the First Two
Years of School. The Review of Economics and Statistics, 86(2), 447-464.
Fryer, R. G., Jr., & Levitt, S. D. (2006). The Black-White Test Score Gap Through Third Grade. American
Law and Economic Review, 8, pp. 249-281.
Grawe, N. (2008). Wealth and Economic Mobility. Washington, DC: Urban Institute.
Gerontology Institute, John W. McCormack Graduate School of Policy Studies, University of
Massachusetts Boston, & Wider Opportunities for Women. (2009). Elder Economic Security
Initiative Program: The Elder Economic Security Index for Minnesota.
Grunewald, R. (2006, November). The Connection Between Poverty and the Economy. Fedgazette.
Minneapolis, MN: The Federal Reserve Bank of Minneapolis. Retrieved from
http://www.minneapolisfed.org/publications_papers/pub_display.cfm?id=1296.
Harris, A., Evans, H., & Beckett, K. (2010). Drawing Blood from Stones: Legal Debt and Social Inequality in
the Contemporary United States. American Journal of Sociology, 115(6), 1753-1799.
Heckman, J. J. (2000). Policies to Foster Human Capital. Research in Economics, 54, 3-56.
Heckman, J. J. (2006). Skill formation and the economics of investing in disadvantaged children. Science,
312, 1900-1902.
Heckman, J. J. (2008, May). Schools, Skills, and Synapses. IZA Discussion Paper No. 3515. Bonn, Germany:
IZA.

64 | P a g e
Heckman, J. J., & Masterov, D. V. (2006, August). The Productivity Argument for Investing in Young
Children. (Early Childhood Research Collaborative Discussion Paper, ECRC Paper Series).
Minneapolis: University of Minnesota and The Federal Reserve Bank of Minneapolis.
Himmelstein, D. U., Thorne, D., Warren, E., & Woolhandler, S. (2009). Medical Bankruptcy in the United
States, 2007: Results of a National Study. The American Journal of Medicine, 122(8), 741-746.
Hisnanick, J.J. & Giefer, G.K. (2011). Dynamics of Economic Well-Being: Fluctuations in the U.S. Income
Distribution, 2004-2007. Current Population Reports, P70-124. Washington DC: U.S. Census
Bureau.
Hoffman, C., Rowland, D. & Hamel, E. C. (2005). Medical Debt and Access to Health Care. Washington
DC: Kaiser Family Foundation.
Holzer, H. J. (2009). Workforce Development as an Antipoverty Strategy: What Do We Know? What
Should We Do? Focus 26(2), 62-68.
Holzer, H. J., Schanzenbach, D. W., Duncan, G. J., & Ludwig, J. (2007). The Economic Costs of Poverty in
the United States: Subsequent Effect of Children Growing up Poor. Washington, DC: Center for
American Progress.
HousingLink (2011). 2010 Foreclosures in Minnesota: A Report Based on County Sheriff’s Sale Data.
Minneapolis, MN: HousingLink.
Hoynes, H., Page, M., & Stevens, A. (2005). Poverty in America: Trends and Explanations. Working Paper
11681. Cambridge, MA: National Bureau of Economic Research.
Hudson, C. G. (2005). Socioeconomic Status and Mental Illness: Tests of the Social Causation and
Selection Hypotheses. American Journal of Orthopsychiatry, 75(1), 3-18. Retrieved from
http://www.salemstate.edu/~chudson/papers/final_copy_sesmi.pdf.
Iceland, J. (2006). Poverty in America: A Handbook. Berkeley: University of California Press.
Isaacs, J. (2008a). Economic Mobility of Families Across Generations. In J. B. Isaacs, I. V. Sawhill, & R.
Haskins (Eds.), Getting Ahead or Losing Ground: Economic Mobility in America (pp. 15-26).
Washington, DC: The Brookings Institution.
Isaacs, J. (2008b). Economic Mobility of Black and White Families. In J. B. Isaacs, I. V. Sawhill, & R.
Haskins (Eds.), Getting Ahead or Losing Ground: Economic Mobility in America (pp. 71-80).
Washington, DC: The Brookings Institution.
Jacob, B. A., & Ludwig, J. (2010). Improving Educational Outcomes for Poor Children. In M. Cancian & S.
Danziger (Eds.), Changing Poverty, Changing Policies (pp. 266-300). New York, NY: Russell Sage
Foundation.

65 | P a g e
Jobs Now Coalition. (2010). Family Wage and Budget Calculator. Retrieved from
http://www.jobsnowcoalition.org/calculator/calculator.html.
Johnson, R. W., Favreault, M. M., & Mommaerts, C. (2010, January). Disability Just Before Retirement
Often Leads to Poverty. Washington, DC: Urban Institute.
Johnson, R. W., & Mermin, G. B. T. (2009, March). Financial Hardship before and after Social Security’s
Eligibility Age. Washington, DC: Urban Institute.
Johnson, R. W., & Mommaerts, C. (2009, July). Are Health Care Costs a Burden for Older Americans?
Washington, DC: Urban Institute.
Jones, A. F., Jr., & Weinberg, D. H. (2000). The Changing Shape of the Nation’s Income Distribution: 1947-
1998. Washington, DC: U.S. Census Bureau.
Kaiser Family Foundation. (2011, March). Kaiser Health Tracking Poll. Washington DC: Kaiser Family
Foundation.
Kearney, M. S. (2006). Intergenerational Mobility for Women and Minorities in the United States. The
Future of Children, 16(2), 37-54.
Kemple, J. J. (2008, June). Career Academies: Long-Term Impacts on Labor Market Outcomes,
Educational Attainment, and Transitions to Adulthood. New York, NY: MRDC.
Kessler Foundation & National Organization on Disability (2010, July). The ADA, 20 Years Later. New
York: Harris Interactive.
Lee, Y., & Lee, J. (2006). The Poverty of Widows: How Do They Become the Poor? Paper presented at the
Population Association of American 2006 Annual Meeting. Retrieved from
http://paa2006.princeton.edu/download.aspx?submissionId=61592.
Levine, P. B., & Zimmerman, D. J. (Eds.). (2010). Targeting Investments in Children: Fighting Poverty
When Resources Are Limited. Chicago: University of Chicago Press.
McGarry, K., & Schoeni, R. F. (2005). Medicare Gaps and Widow Poverty. Social Security Bulletin, 66(1).
McKernan, S., & Ratcliffe, C. (2005). Events that Trigger Poverty Entries and Exits. Social Science
Quarterly, 86, pp. 1146-1169.
McKernan, S., Ratcliffe, C., & Cellini, S. R. (2009). Transitioning In and Out of Poverty. Understanding
Poverty. Fact Sheet No. 1. Washington DC: The Urban Institute.
Meschede, T., Shapiro, T. M., Sullivan, L., & Wheary, J. (2010). Severe Financial Insecurity among African-
American and Latino Seniors. Waltham, MA: Institute on Assets and Social Policy.

66 | P a g e
Minnesota Compass (2011, December). Proportion of Adults working. Retrieved from
http://www.mncompass.org/immigration/key-
measures.php?km=Proportionofadultsworking#7-3025-g.
Minnesota Department of Employment and Economic Development. (2011). Job Vacancy Survey 2nd
Quarter 2011. Retrieved from
http://www.positivelyminnesota.com/Data_Publications/Data/All_Data_Tools/Job_Vacancy_Su
rvey_2.aspx.
Minnesota Department of Health (2011). Health Economics Program. [Data Query Program]. Retrieved
from http://www.health.state.mn.us/healtheconomics.
Moore, Q., Rangarajan, A., & Schochet, P. (2007). Economic Patterns of Single Mothers Following Their
Poverty Exits. Princeton, NJ: Mathematica Policy Research, Inc.
National Institutes of Mental Health. (2010). The Numbers Count: Mental Disorders in America.
Retrieved from http://www.nimh.nih.gov/health/publications/the-numbers-count-mental-
disorders-in-america/index.shtml#Intro.
Neuman, S. B. (2009). Changing the Odds for Children at Risk: Seven Essential Principles of Educational
Programs that Break the Cycle of Poverty. Westport, CT: Praeger.
Newman, K. S. (1995). Deindustrialization, Poverty, and Downward Mobility: Toward an Anthropology of
Economic Disaster. In S. Forman, (Ed.), Diagnosing America: Anthropology and Public
Engagement (pp. 121-161). Ann Arbor, MI: The University of Michigan Press.
O’Brien, E., Wu, K. B., & Baer, D. (2010, April). Older Americans in Poverty: A Snapshot. Washington, DC:
AARP.
Owen, G. (2010). A New Age of Immigrants: Making Immigration Work for Minnesota. Minneapolis, MN:
Minneapolis Foundation.
Palumbo, T. J. (2010). Dynamics of Economic Well-Being: Spells of Unemployment, 2004-2007. Current
Population Reports P70-120. Washington DC: U.S. Census Bureau.
Passel, J. S., & Cohn, D. (2009). A Portrait of Unauthorized Immigrants in the United States. Washington
DC: Pew Hispanic Research Center.
Perese, E. F. (2007). Stigma, Poverty, and Victimization: Roadblocks to Recovery for Individuals with
Severe Mental Illness. Journal of the American Psychiatric Nurses Association. 13(5), 285-295.
Pew Charitable Trusts. (2010). Collateral Costs: Incarceration’s Effect on Economic Mobility: Washington,
DC: The Pew Charitable Trusts.

67 | P a g e
Postmus, J. L. (2010, October). Economic Empowerment of Domestic Violence Survivors. Applied
Research Forum: National Online Resource Center on Violence Against Women. Retrieved from
http://new.vawnet.org/Assoc_Files_VAWnet/AR_EcoEmpowerment.pdf.
Prince, D., & Jenkins, D. (2005, April). Building Pathways to Success for Low-Skill Adult Students.
Retrieved from http://ccrc.tc.columbia.edu/Publication.asp?UID=204.
Public Policy Institute. (2003). In Brief: Poverty Experience of Older Persons: A Poverty Study from a Long-
Term Perspective. Washington, DC: AARP.
Purcell, P. J. (2009, October). Income and Poverty Among Older Americans in 2008. Washington, DC:
Congressional Research Service.
Rank, M. R. (2007). Rethinking the Scope and Impact of Poverty in the United States, Connecticut Public
Interest Law Journal, 6(2), 165-181.
Raphael, S., & Smolensky E. (2009). Immigration and Poverty in the United States. Focus 26(2).
Ratcliffe, C., & McKernan, S. (2010). Childhood Poverty Persistence. Washington DC: the Urban Institute.
Rawlings, L. A., Capps, R., Gentsch, K., & Fortuny, K. (2007). Immigrant Integration in Low-Income Urban
Neighborhoods: Improving Economic Prospects and Strengthening Connections for Vulnerable
Families. Washington, DC: The Urban Institute.
Rohrer, A. (2011). Left Behind by the Job Market. Minnesota Economic Trends. September 2011, pp. 2-8.
Rynell, A. (2008). Causes of Poverty: Findings from Recent Research. Chicago, IL: Heartland Alliance.
Sawhill, I. V. (2008a). Overview. In J.B. Isaacs, I.V. Sawhill, & R. Haskins (Eds.), Getting Ahead or Losing
Ground: Economic Mobility in America (pp. 1-14). Washington, DC: The Brookings Institution.
Sawhill, I. V. (2008b). Trends in Intergenerational Mobility. In J.B. Isaacs, I.V. Sawhill, & R. Haskins (Eds.),
Getting Ahead or Losing Ground: Economic Mobility in America (pp. 27-36). Washington, DC: The
Brookings Institution.
Sawhill, I. V., & McLanahan, S. (2006). Introducing the Issue. The Future of Children. 16(2) pp. 3-18.
Schmitt, J., & Warner, K. (2010, November). Ex-offenders and the Labor Market. Washington, DC: Center
for Economic and Policy Research.
Seifert, R. W. (2005). Home Sick: How Medical Debt Undermines Housing Security. Boston, MA: The
Access Project.
Senf, D. (2010). The Great Recession Lives Up To Its Name. Economic Trends Magazine, September,
2010.

68 | P a g e
Shapiro, T. M. (2004). Hidden Cost of Being African American: How Wealth Perpetuates Inequality. New
York: Oxford Press.
Shapiro, T. M. (2006). Race, Homeownership, and Wealth. Journal of Law and Policy, 20(53), 53-74.
Sharkey, P. (2009). Neighborhoods and the Black-White Mobility Gap. Washington DC: The Pew
Charitable Trusts.
She, P., & Livermore, G. A. (2009). Long-Term Poverty and Disability Among Working-Age Adults. Journal
of Disability Policy Studies, 19(4), 244-256.
Shore, R. (1997). Rethinking the Brain: New Insights into Early Development. New York: Families and
Work Institute.
Short, K. (2011). The Research SUPPLEMENTAL POVERTY MEASURE: 2010. Current Population Reports
P60-241. Washington, DC: U.S. Census Bureau.
Soares, L. (2009, June). Working Learners: Educating Our Entire Workforce for Success in the 21st
Century. Washington, DC: Center for American Progress.
Taylor, P., Kochhar, R., Fry, R., Velasco, G., & Motel, S. (2011). Wealth Gaps Rise to Record Highs
Between Whites, Blacks and Hispanics. Washington, DC: Pew Research Center.
U.S. Census Bureau. (2008, August). Income, Poverty, and Health Insurance Coverage in the United
States: 2007. Washington, DC: U.S. Department of Commerce.
U.S. Census Bureau. (2008, December). Americans with Disabilities: 2005. Washington, DC: U.S.
Department of Commerce.
U.S. Census Bureau. (2009, September). Income, Poverty, and Health Insurance Coverage in the United
States: 2008. Washington, DC: U.S. Department of Commerce.
U.S. Census Bureau. (2010, September). Income, Poverty, and Health Insurance Coverage in the United
States: 2009. Washington, DC: U.S. Department of Commerce.
U.S. Census Bureau. (2011, January). Preliminary Estimate of Weighted Average Poverty Thresholds for
2010. Retrieved from http://www.census.gov/hhes/www/poverty/data/threshld/index.html.
Uphoff, K. (2010, September). More Eggs In Fewer Baskets. Minnesota Economic Trends. St. Paul, MN:
Minnesota Department of Employment and Economic Development.
Van de Water, P. N., & Sherman, A. (2010, August). Social Security Keeps 20 Million Americans Out of
Poverty: A State-By-State Analysis. Washington, DC: Center of Budget and Policy Priorities.
Vericker, T., Fortuny, K., Finegold, K., & Ozdemir, S. B. (2010) Effects of Immigration on WIC and NSLP
Caseloads. Washington DC: The Urban Institute.

69 | P a g e
Vilsack, R. (2009, June). By the Numbers: A Snapshot of Minnesota Veterans. Minnesota Economic
Trends. St. Paul, MN: Minnesota Department of Employment and Economic Development.
Western, B. (2002). The Impact of Incarceration on Wage Mobility and Inequality. American Sociological
Review 67(4), 526-546.
Wilder Research. (2010a, December). Homeless Veterans in Minnesota 2009. St. Paul, MN: Wilder
Research.
Wilder Research. (2010b, October). Homelessness in Minnesota 2009. St. Paul, MN: Wilder Research.
Wilson, W. J. (1996). When Work Disappears: The World of the New Urban Poor. New York: Vintage.
Wilson, W. J. (2009). More Than Just Race: Being Black and Poor in the Inner City. New York: W. W.
Norton & Co.
Wirtz, R.A. (2006a, November). Excuse me, Which Way Is Up? Fedgazette. Minnepolis, MN: The Federal
Reserve Bank of Minneapolis.
Wirtz, R.A. (2006b, November). The Myriad, Changing Faces of Poverty. Fedgazette. Minneapolis, MN:
The Federal Reserve Bank of Minneapolis.