the logistics product1 chapter 3 the logistics product 1.nature of the logistics product 2.the 80-20...
TRANSCRIPT
The Logistics Product 1
Chapter 3 The logistics product Chapter 3 The logistics product
1.Nature of the logistics product
2.The 80-20 curve
3.Product characteristics
4.Product packaging
5.Product pricing
6.Incentive pricing arrangement
The Logistics Product 2
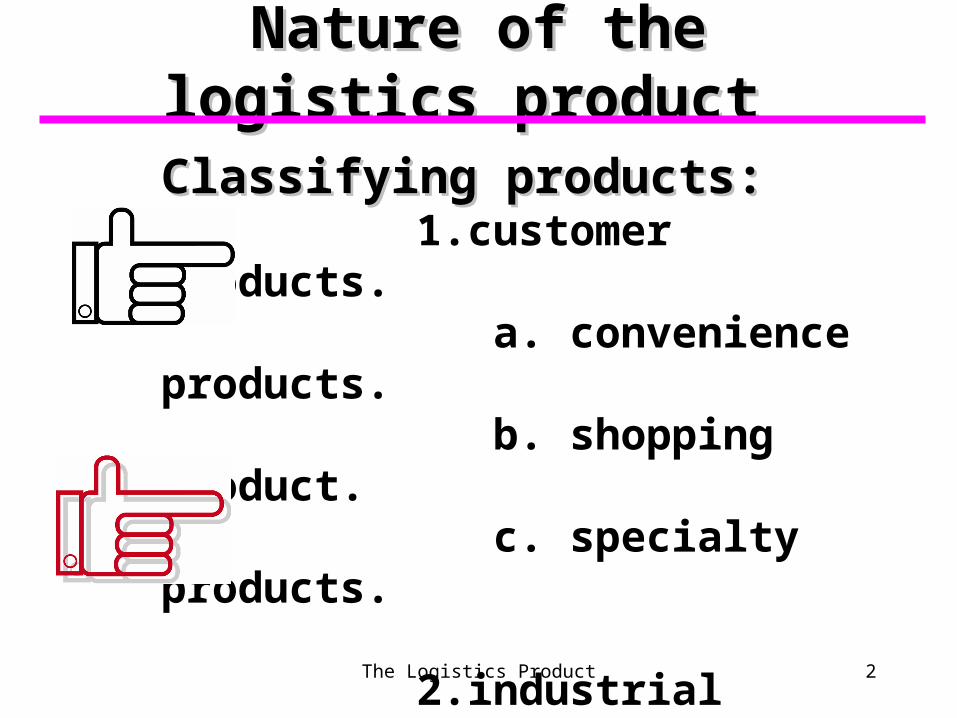
Nature of the logistics product Nature of the logistics product
Classifying products:Classifying products: 1.customer products. a. convenience products. b. shopping product. c. specialty products. 2.industrial products. Ex: raw materials, component parts, used in the manufacturing process.

The Logistics Product 3
Customer products
a.convenience productsa.convenience productsthere products require wide distribution
ex: Pepsi-cola and coca-cola
telephone companies
banking services.
b. shopping productb. shopping productcustomers are willing to seek and compare

The Logistics Product 4
Customer products
distribution costs for such suppliers are somewhat lower than for convenience products, and product distribution need not be as widespread.
Ex: fashion clothes, automobiles, home furnishings and medical care.
c.specialty productsc.specialty products Buyers are willing to expend a substantial
effort and often to wait a significant amount of time in order to acquire them.
Ex. Custom-made automobiles, professional musicians.

The Logistics Product 5
The product life cycle The product life cycle Introduction : new product.
Growth : increase rapidly.
Maturity : growth is slow or stabilized at a peak.
Decline : the sales volume declines.

The Logistics Product 6
The 80-20 curve The 80-20 curve Pareto’s law80% of a firm’s sales are generated by 20% of
product line items.Useful in distribution planning when the
products are grouped or classified by their sales activity.
The top 20% might be called A items, the next 30% B items, and the remainder C items
ITEMS(%) SALES(%)A 10-20 60-70B 20-30 20-30C 60-70 10-20
The Logistics Product 7
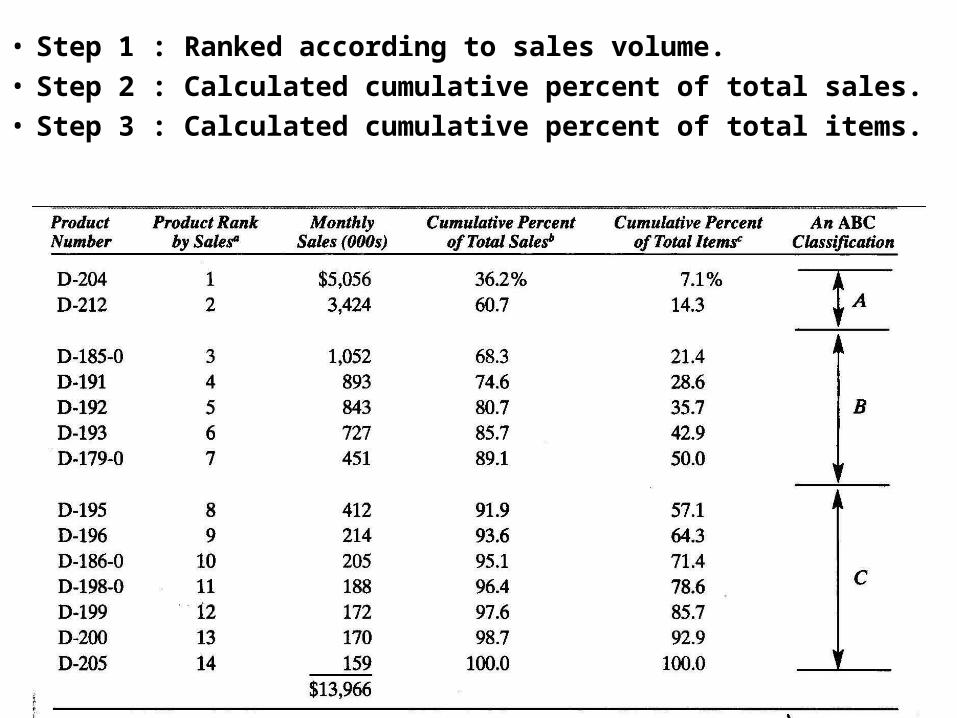
• Step 1 : Ranked according to sales volume.• Step 2 : Calculated cumulative percent of total sales.• Step 3 : Calculated cumulative percent of total items.

The Logistics Product 8
Advanced decisions Determine the relationship between various percentages of items and sales.
XA
XAY
)1(
where Y = cumulative fraction of sales X = cumulative fraction of items A = a constant to be determined.
)(
)1(
)1()(
)1(
XY
YXA
YXXYA
AYXXYAYXA
XAY
Ex: If 25 percent of the items (X) represent 70 percent of the sales (Y), then
1667.0)25.070.0(
)70.01(25.0
)(
)1(
XY
YXA
The Logistics Product 9
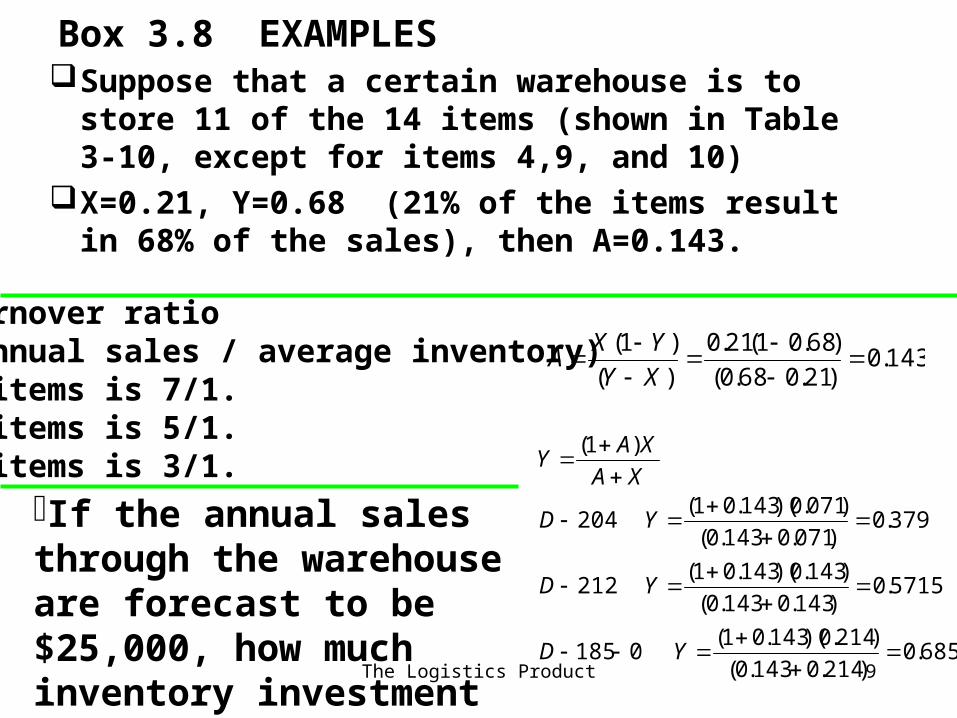
Box 3.8 EXAMPLESSuppose that a certain warehouse is to store 11
of the 14 items (shown in Table 3-10, except for items 4,9, and 10)
X=0.21, Y=0.68 (21% of the items result in 68% of the sales), then A=0.143.
143.0)21.068.0(
)68.01(21.0
)(
)1(
XY
YXA
685.0)214.0143.0(
)214.0)(143.01(0185
5715.0)143.0143.0(
)143.0)(143.01(212
379.0)071.0143.0(
)071.0)(143.01(204
)1(
YD
YD
YD
XA
XAY
If the annual sales through the warehouse are forecast to be $25,000, how much inventory investment in the warehouse can be expected?
Turnover ratio(annual sales / average inventory)A items is 7/1.B items is 5/1.C items is 3/1.

The Logistics Product 10
11105
4442.0*25000
)0909.0143.0(
)0909.0)(143.01(*25000
)(*25000 1
Y
15994
)1818.0143.0(
)1818.0)(143.01(*25000
)(*25000 2
Y
11107/7=1586.44889/ 7= 698.4
2284.8
(-)

The Logistics Product 11
Product characteristics
WeightVolumeValuePerishabilityFlammabilitySubstitutability
Influence logistic strategyInfluence logistic strategy
The Logistics Product 12
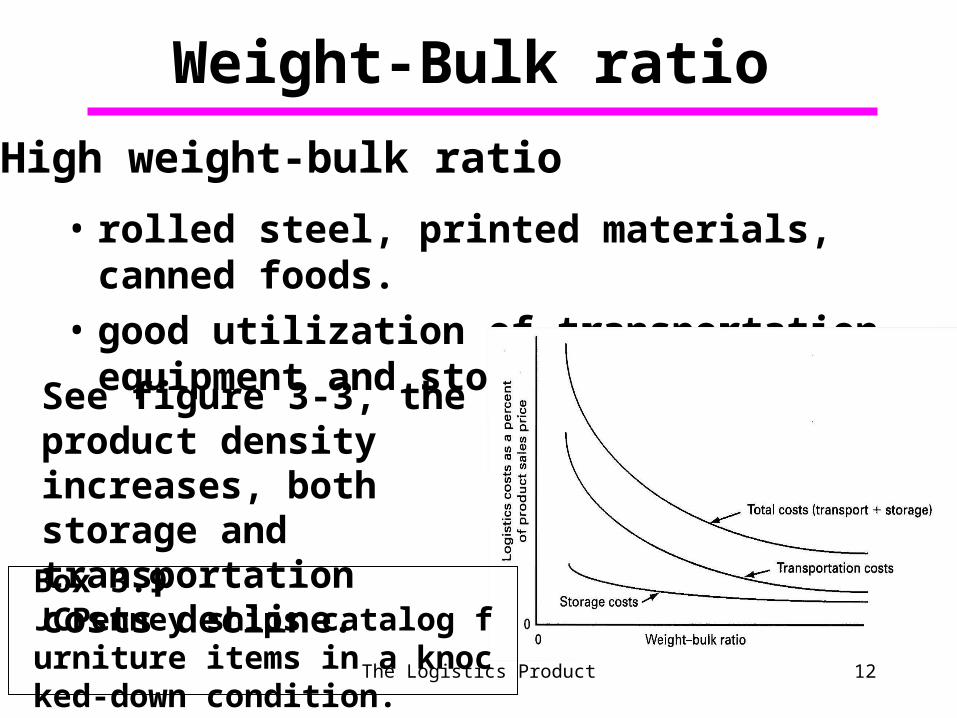
Weight-Bulk ratio
• rolled steel, printed materials, canned foods.
• good utilization of transportation equipment and storage facilities.
High weight-bulk ratio
See figure 3-3, the product density increases, both storage and transportation costs decline.
Box 3.9JCPenney ships catalog furniture items in a knocked-down condition.
The Logistics Product 13
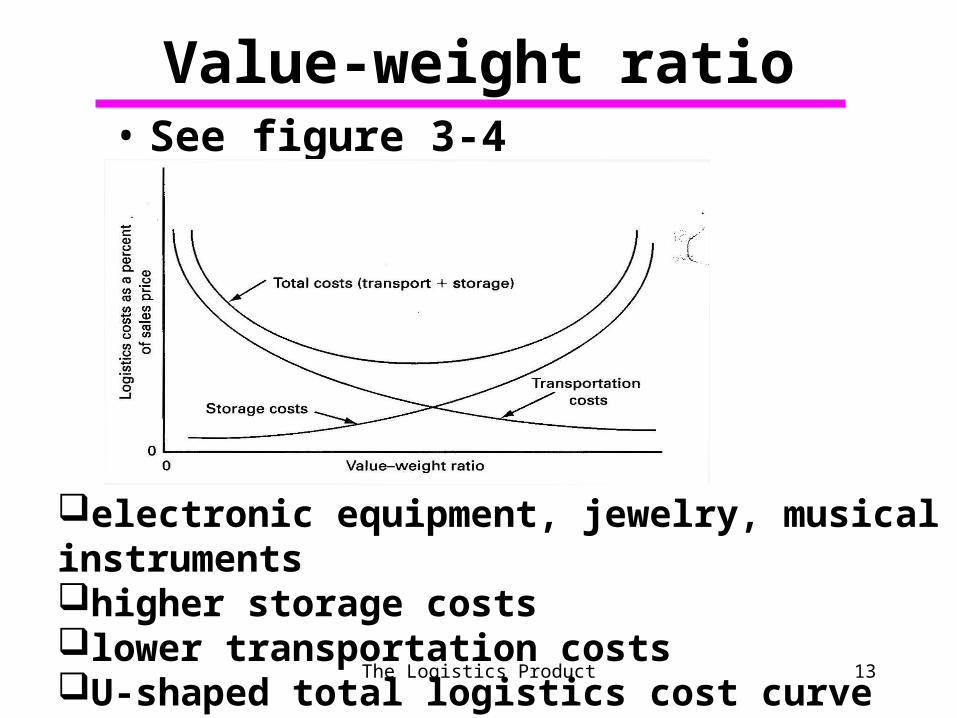
Value-weight ratio• See figure 3-4
electronic equipment, jewelry, musical instrumentshigher storage costslower transportation costsU-shaped total logistics cost curve (trade-off)

The Logistics Product 14
Substitutability
• Little or no difference between a firm’s product
• Many food and drug products have a highly substitutable
• Substitutability can be viewed in terms of lost sales to the suppliers
The Logistics Product 15
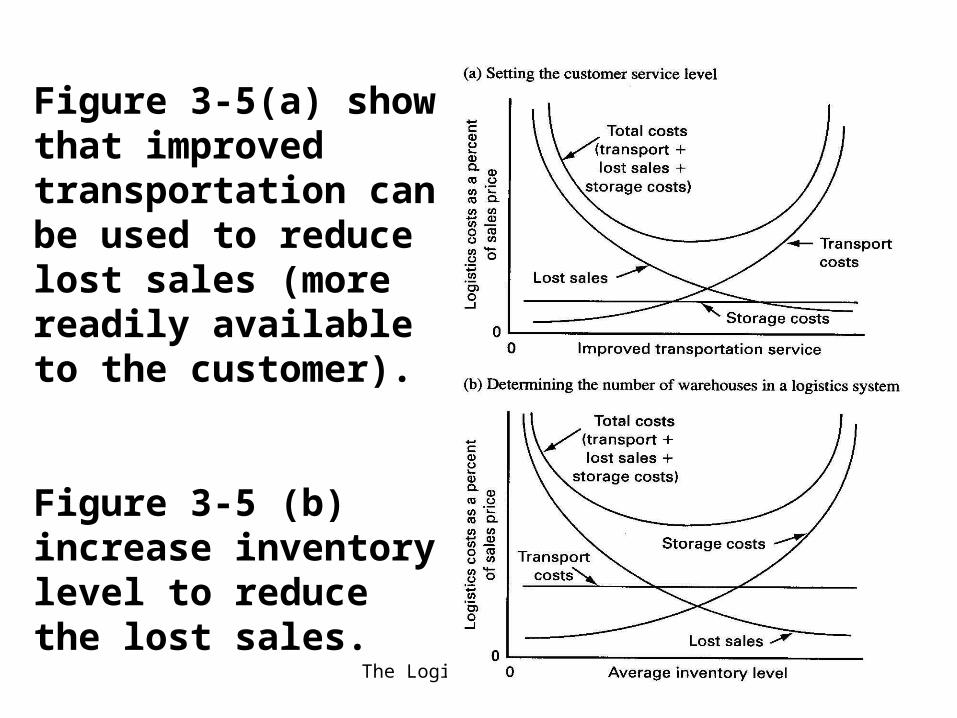
Figure 3-5(a) show that improved transportation can be used to reduce lost sales (more readily available to the customer).
Figure 3-5 (b) increase inventory level to reduce the lost sales.

The Logistics Product 16
Risk characteristics ※Perishability (fresh fruits and whole blood)
※Flammability tendency to explore (gas, oil)
※Value, ease be stolen (pens. watches. cigarettes)
※Special treatment, whether transportation, storage or packaging, adds to the cost of distribution.
※See figure 3-6.
The Logistics Product 17
Product packaging
To facilitate storage and handling. To promote better utilization of transport
equipment. To provide product protection. To promote the sale of the product. To change the product density. To facilitate the use of the product. To provide reuse value for the customer.

The Logistics Product 18
Box 3.10 Johnson & Johnson
Diapers Be packaged 12 or 24 to the box. Change the product density. Not only did this satisfy marketing, but it
would save on storage, transportation and packaging costs as well.

The Logistics Product 19
Product pricing
F.o.b pricing (free on board) ,see figure 3-7.
Zone pricing, see figure 3-8. Single, or uniform pricing. Freight equalization pricing. Basing point pricing.
Geographic pricing methods
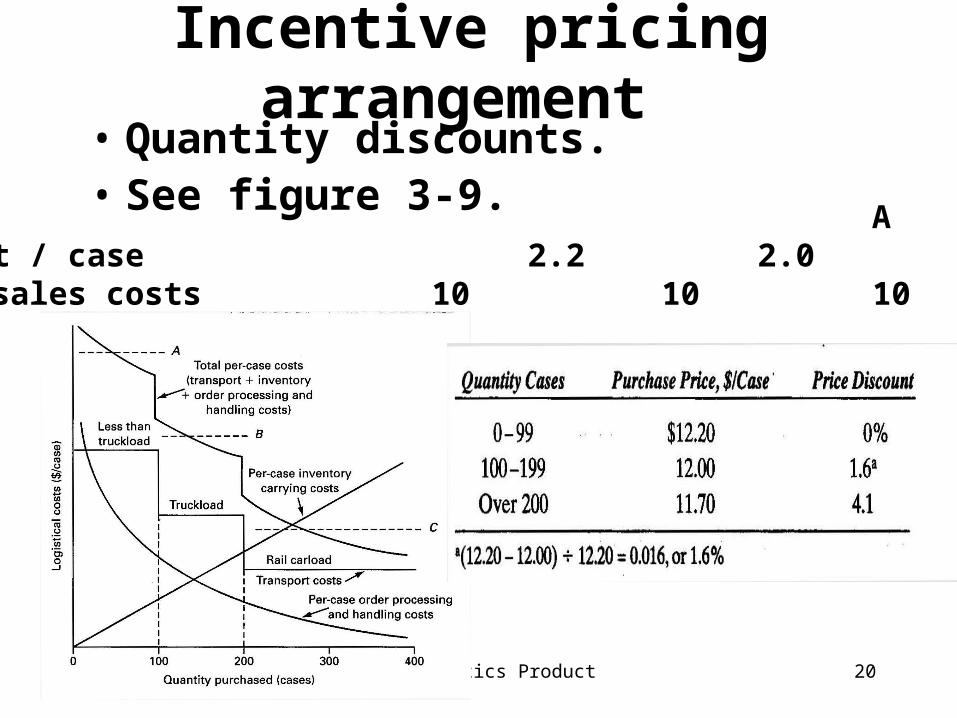
The Logistics Product 20
Incentive pricing arrangement • Quantity discounts.• See figure 3-9. A B CTransportation cost / case 2.2 2.0 1.7Manufacturing and sales costs 10 10 10