the little data book on information and communication
TRANSCRIPT


2017 THE LITTLE DATA BOOKON INFORMATION ANDCOMMUNICATIONTECHNOLOGY

© 2017 International Bank for Reconstruction and Development / The World Bank1818 H Street NW, Washington, DC 20433Telephone: 202-473-1000; Internet: www.worldbank.orgSome rights reserved1 2 3 4 19 20 18 17
This work is a product of the staff of The World Bank with external contributions. The find-ings, interpretations, and conclusions expressed in this work do not necessarily reflect the views of The World Bank, its Board of Executive Directors, or the governments they repre-sent. The World Bank does not guarantee the accuracy of the data included in this work. The boundaries, colors, denominations, and other information shown on any map in this work do not imply any judgment on the part of The World Bank concerning the legal status of any territory or the endorsement or acceptance of such boundaries.
Nothing herein shall constitute or be considered to be a limitation upon or waiver of the privileges and immunities of The World Bank, all of which are specifically reserved.
Rights and Permissions
This work is available under the Creative Commons Attribution 3.0 IGO license (CC BY 3.0 IGO) http://creativecommons.org/licenses/by/3.0/igo. Under the Creative Commons Attribution license, you are free to copy, distribute, transmit, and adapt this work, including for commercial purposes, under the following conditions:
Attribution—Please cite the work as follows: World Bank. 2017. The Little Data Book on Information and Communication Technology 2017. Washington, DC: World Bank. doi:10.1596/978-1-4648-1028-2. License: Creative Commons Attribution CC BY 3.0 IGO
Translations—If you create a translation of this work, please add the following disclaimer along with the attribution: This translation was not created by The World Bank and should not be considered an official World Bank translation. The World Bank shall not be liable for any content or error in this translation.
Adaptations—If you create an adaptation of this work, please add the following disclaimer along with the attribution: This is an adaptation of an original work by The World Bank. Views and opinions expressed in the adaptation are the sole responsibility of the author or authors of the adaptation and are not endorsed by The World Bank.
Third-party content—The World Bank does not necessarily own each component of the content contained within the work. The World Bank therefore does not warrant that the use of any third-party-owned individual component or part contained in the work will not infringe on the rights of those third parties. The risk of claims resulting from such infringement rests solely with you. If you wish to re-use a component of the work, it is your responsibility to determine whether permission is needed for that re-use and to obtain permission from the copyright owner. Examples of components can include, but are not limited to, tables, figures, or images.
All queries on rights and licenses should be addressed to World Bank Publications, The World Bank Group, 1818 H Street NW, Washington, DC 20433, USA; e-mail: [email protected].
ISBN (paper): 978-1-4648-1028-2ISBN (electronic): 978-1-4648-1029-9DOI: 10.1596/978-1-4648-1028-2
Design by Communications Development Incorporated, Washington, DC.

iiiThe Little Data Book on Information and Communication Technology 2017
Acknowledgments . . . . . . . . . . . . . . . . . . . . . . . . . . . . . . . . . . . . . . . . . iv
Preface . . . . . . . . . . . . . . . . . . . . . . . . . . . . . . . . . . . . . . . . . . . . . . . . . .v
Data notes . . . . . . . . . . . . . . . . . . . . . . . . . . . . . . . . . . . . . . . . . . . . . . vi
Regional tables . . . . . . . . . . . . . . . . . . . . . . . . . . . . . . . . . . . . . . . . . . . 1
World . . . . . . . . . . . . . . . . . . . . . . . . . . . . . . . . . . . . . . . . . . . . . . . 2
East Asia and Pacific . . . . . . . . . . . . . . . . . . . . . . . . . . . . . . . . . . . . 3
Europe and Central Asia . . . . . . . . . . . . . . . . . . . . . . . . . . . . . . . . . . 4
Latin America and the Caribbean . . . . . . . . . . . . . . . . . . . . . . . . . . . 5
Middle East and North Africa . . . . . . . . . . . . . . . . . . . . . . . . . . . . . . 6
North America . . . . . . . . . . . . . . . . . . . . . . . . . . . . . . . . . . . . . . . . . 7
South Asia . . . . . . . . . . . . . . . . . . . . . . . . . . . . . . . . . . . . . . . . . . . 8
Sub-Saharan Africa . . . . . . . . . . . . . . . . . . . . . . . . . . . . . . . . . . . . . 9
Income group tables . . . . . . . . . . . . . . . . . . . . . . . . . . . . . . . . . . . . . . 10
Low income . . . . . . . . . . . . . . . . . . . . . . . . . . . . . . . . . . . . . . . . . . 11
Middle income . . . . . . . . . . . . . . . . . . . . . . . . . . . . . . . . . . . . . . . . 12
Lower middle income . . . . . . . . . . . . . . . . . . . . . . . . . . . . . . . . . . . 13
Upper middle income . . . . . . . . . . . . . . . . . . . . . . . . . . . . . . . . . . . 14
Low and middle income . . . . . . . . . . . . . . . . . . . . . . . . . . . . . . . . . 15
High income . . . . . . . . . . . . . . . . . . . . . . . . . . . . . . . . . . . . . . . . . 16
Country tables (in alphabetical order) . . . . . . . . . . . . . . . . . . . . . . . . . . 17
Notes . . . . . . . . . . . . . . . . . . . . . . . . . . . . . . . . . . . . . . . . . . . . . . . . 235
Glossary . . . . . . . . . . . . . . . . . . . . . . . . . . . . . . . . . . . . . . . . . . . . . . 236
Contents

iv 2017 The Little Data Book on Information and Communication Technology
The Little Data Book on Information and Communication Technology 2017
is a joint publication between the World Bank and the International Telecommunication Union (ITU) .
For the World Bank team, the work was the result of close collaboration between the staff of the Development Data Group of the Development Economics Vice Presidency and the Transport and Information Communica-tion Technologies Global Practice . The Development Data Group team included Buyant Erdene Khaltarkhuu, Ana Florina Pirlea, William Prince, and Jomo Tariku . The Information and Communication Technologies team was represented by Kaoru Kimura . The work was carried out under the management of Haishan Fu and Pierre Guislain . Jewel McFadden, Nora Ridolfi, and Janice Tuten from World Bank Publications oversaw publication and dissemination of the book .
The ITU contribution was provided by the ICT Data and Statistics Division under the overall direction of Cosmas Zavazava, Chief, Projects and Knowl-edge Management Department of the Telecommunication Development Bureau . The team included Susan Teltscher (Head of Division), Fredrik Eriksson , Vanessa Gray, Esperanza Magpantay, and Ivan Vallejo . Regulatory data were provided by the Regulatory and Market Environment Division of the Telecommunication Development Bureau team, which included Sofie Maddens (Head of Division), Youlia Lozanova, and Nancy Sundberg .
The World Bank and ITU acknowledge the data provided by other sources: IMF, Netcraft, OECD, UNCTAD, UNDESA/UNPAN, UNESCO, UNPD, and UNSD .
Acknowledgments

vThe Little Data Book on Information and Communication Technology 2017
PrefaceSince the late 1990s access to information and communication technolo-gies (ICTs) has seen tremendous growth—driven primarily by the wireless technologies and liberalization of telecommunications markets . Mobile com-munications have evolved from simple voice and text services to diversified innovative applications and mobile broadband Internet . In 2016, there were more than 7 .3 billion mobile-cellular subscriptions worldwide . Globally, 3 .5 billion people were using the Internet, of which 2 .5 billion were from developing countries . Mobile-broadband subscriptions have risen constantly to reach 3 .6 billion, while the number of fixed-broadband subscriptions reached more than 884 million during the same period .
The impacts of ICTs cross all sectors . Research has shown that investment in information and communication technologies is associated with such economic benefits as higher productivity, lower costs, new economic oppor-tunities, job creation, innovation, and increased trade . ICTs also help provide better services in health and education, and strengthen social cohesion .
The Little Data Book on Information and Communication Technology 2017
illustrates the progress of this revolution for 217 economies around the world . It provides comparable statistics on the sector for 2005 and 2015 across a range of indicators, enabling readers to readily compare econo-mies . This book includes indicators covering the economic and social context, the structure of the information and communication technology sector, sector efficiency and capacity, and sector performance related to access, usage, quality, affordability, trade, and applications . The glossary contains definitions of the terms used in the tables .
For more information and other World Bank data publications, visit our data Web site at data .worldbank .org or the Web site of the Information and Communication Technologies Department at www .worldbank .org/ict .
For more statistics on information and communication technology infra- structure, access, and usage, as well as analytical reports such as the annual Measuring the Information Society Report, visit ITU’s Web site at www .itu .int/en/ITU-D/Statistics/Pages/default .aspx and the ITU ICT Eye at www .itu .int/icteye .

vi 2017 The Little Data Book on Information and Communication Technology
Data notesThe data in this book are for 2010 and 2015 or the most recent year unless otherwise noted in the table or the glossary .
• Growth rates are proportional changes from the previous year unless
otherwise noted .
• Regional aggregates include data for low- and middle-income econo-
mies only .
• Figures in italics indicate data for years or periods other than those specified .
Symbols used:
. . indicates that data are not available or that aggregates cannot be calculated because of missing data .
0 or 0 .0 indicates zero or small enough that the number would round to zero at the displayed number of decimal places .
$ indicates current U .S . dollars .
Lettered notes on some country tables can be found in the notes on page 235 .
Data are shown for economies with populations greater than 30,000 or for smaller economies if they are members of the World Bank or the ITU . The term country (used interchangeably with economy) does not imply political independence or official recognition by the World Bank or the ITU but refers to any economy for which the authorities report separate social or economic statistics .
Aggregates for groups of economies are based on the World Bank’s regional and income classifications, and may differ from those published by the ITU . Because of missing data, aggregates should be treated as approxi-mations of unknown totals or average values . The aggregation method for each indicator is noted in the glossary . Sums (s) are simple totals of available data . Weighted averages (w) are calculated using the value of the denominator or, in some cases, another indicator as the weight . Median (m) calculations are based on available data and exclude economies with populations below 1 million . For more information about aggregation meth-ods visit datahelpdesk .worldbank .org .
The cutoff date for data is June 18, 2016 .

1The Little Data Book on Information and Communication Technology 2017
The country composition of regions is based on the World Bank’s analytical regions and may differ from common geographic usage .
East Asia and PacificAmerican Samoa; Australia; Brunei Darussalam; Cambodia; China; Fiji; French Polynesia; Guam; Hong Kong SAR, China; Indonesia; Japan; Kiribati; Democratic People’s Republic of Korea; Republic of Korea; Lao People’s Democratic Republic; Macao SAR, China; Malaysia; Marshall Islands; Federated States of Micronesia; Mongolia; Myanmar; Nauru; New Caledonia; New Zealand; Northern Mariana Islands; Palau; Papua New Guinea; Philippines; Samoa; Singapore; Solomon Islands; Thailand; Timor-Leste; Tonga; Tuvalu; Vanuatu; Vietnam
Europe and Central AsiaAlbania, Andorra, Armenia, Austria, Azerbaijan, Belarus, Belgium, Bosnia and Herzegovina, Bulgaria, Channel Islands, Croatia, Cyprus, Czech Republic, Denmark, Estonia, Faroe Islands, Finland, France, Georgia, Germany, Gibraltar, Greece, Greenland, Hungary, Iceland, Ireland, Isle of Man, Italy, Kazakhstan, Kosovo, Kyrgyz Republic, Latvia, Liechtenstein, Lithuania, Luxembourg, former Yugoslav Republic of Macedonia, Moldova, Monaco, Montenegro, Netherlands, Norway, Poland, Portugal, Romania, Russian Federation, San Marino, Serbia, Slovak Republic, Slovenia, Spain, Sweden, Switzerland, Tajikistan, Turkey, Turkmenistan, Ukraine, United Kingdom, Uzbekistan
Latin America and the CaribbeanAntigua and Barbuda, Argentina, Aruba, The Bahamas, Barbados, Belize, Bolivia, Brazil, British Virgin Islands, Cayman Islands, Chile, Colombia, Costa Rica, Cuba, Curaçao, Dominica, Dominican Republic, Ecuador, El Salvador, Grenada, Guatemala, Guyana, Haiti, Honduras, Jamaica, Mexico, Nicaragua, Panama, Paraguay, Peru, Puerto Rico, Sint Marrten (Dutch part), St . Kitts and Nevis, St . Lucia, St . Martin (French part), St . Vincent and the Grenadines, Suriname, Trinidad and Tobago, Turks and Caicos Islands, Uruguay, República Bolivariana de Venezuela, Virgin Islands (U .S .)
Middle East and North AfricaAlgeria, Bahrain, Djibouti, Arab Republic of Egypt, Islamic Republic of Iran, Iraq, Israel, Jordan, Kuwait, Lebanon, Libya, Malta, Morocco, Oman, Qatar, Saudi Arabia, Syrian Arab Republic, Tunisia, United Arab Emirates, West Bank and Gaza, Republic of Yemen
North AmericaBermuda, Canada, United States
South AsiaAfghanistan, Bangladesh, Bhutan, India, Maldives, Nepal, Pakistan, Sri Lanka
Sub-Saharan AfricaAngola, Benin, Botswana, Burkina Faso, Burundi, Cabo Verde, Cameroon, Central African Republic, Chad, Comoros, Democratic Republic of Congo, Republic of Congo, Côte d’Ivoire, Equatorial Guinea, Eritrea, Ethiopia, Gabon, The Gambia, Ghana, Guinea, Guinea-Bissau, Kenya, Lesotho, Liberia, Madagascar, Malawi, Mali, Mauritania, Mauritius, Mozambique, Namibia, Niger, Nigeria, Rwanda, São Tomé and Príncipe, Senegal, Seychelles, Sierra Leone, Somalia, South Africa, South Sudan, Sudan, Swaziland, Tanzania, Togo, Uganda, Zambia, Zimbabwe
Regional tables

2 2017 The Little Data Book on Information and Communication Technology
2010 2015
Economic and social contextPopulation (millions)Urban population (% of total)GNI per capita, World Bank Atlas method ($)GDP growth, 2005–10 and 2010–15 (avg. annual %)Adult literacy rate (% ages 15 and older) Gross primary, secondary, and tertiary school enrollment (%)
Sector structureSeparate telecommunications/ICT regulatorStatus of main fixed-line telephone operatorLevel of competition (competition, partial comp., monopoly) International gateway(s) Mobile telephone service Internet serviceForeign ownership (not allowed, restricted, allowed)Reg. treatment of VoIP (banned, closed, no framework, allowed)
Sector efficiency and capacityTelecommunications revenue (% of GDP)Telecommunications investment (% of revenue)
Sector performanceAccessFixed-telephone subscriptions (per 100 people)Mobile-cellular telephone subscriptions (per 100 people)Fixed-broadband subscriptions (per 100 people)Households with a computer (%)Households with Internet access at home (%)
Usage Int’l. voice traffic, total (minutes/subscription/month)Domestic mobile traffic (minutes/subscription/month)Individuals using the Internet (%)
Quality Population covered by at least a 3G mobile network (%)International Internet bandwidth (bit/s per Internet user)
AffordabilityMobile-cellular sub-basket ($ a month)Fixed-broadband sub-basket ($ a month)Mobile-b’band, prepaid handset-based, 500 MB ($ a month)Mobile-b’band, postpaid computer-based, 1 GB ($ a month)
TradeICT goods exports (% of total goods exports)ICT goods imports (% of total goods imports)ICT service exports (% of total service exports)
ApplicationsOnline service index (0-1, 1=highest presence)Secure Internet servers (per million people)
6,924 7,34751 54
9,355 10,4332.3 2.685 ..71 74
2.7 2.418.4 18.8
17.8 14.376.5 98.6
7.9 11.336.0 44.930.1 48.5
7.1 ..207 16629.1 44.0
.. 7330,636 57,311
15.4 9.826.3 20.215.0 8.018.4 12.0
11.8 10.812.7 11.628.3 31.1
0.26 0.36154.4 208.7
World
3The Little Data Book on Information and Communication Technology 2017
2010 2015
Economic and social contextPopulation (millions)Urban population (% of total)GNI per capita, World Bank Atlas method ($)GDP growth, 2005–10 and 2010–15 (avg. annual %)Adult literacy rate (% ages 15 and older) Gross primary, secondary, and tertiary school enrollment (%)
Sector structureSeparate telecommunications/ICT regulatorStatus of main fixed-line telephone operatorLevel of competition (competition, partial comp., monopoly) International gateway(s) Mobile telephone service Internet serviceForeign ownership (not allowed, restricted, allowed)Reg. treatment of VoIP (banned, closed, no framework, allowed)
Sector efficiency and capacityTelecommunications revenue (% of GDP)Telecommunications investment (% of revenue)
Sector performanceAccessFixed-telephone subscriptions (per 100 people)Mobile-cellular telephone subscriptions (per 100 people)Fixed-broadband subscriptions (per 100 people)Households with a computer (%)Households with Internet access at home (%)
Usage Int’l. voice traffic, total (minutes/subscription/month)Domestic mobile traffic (minutes/subscription/month)Individuals using the Internet (%)
Quality Population covered by at least a 3G mobile network (%)International Internet bandwidth (bit/s per Internet user)
AffordabilityMobile-cellular sub-basket ($ a month)Fixed-broadband sub-basket ($ a month)Mobile-b’band, prepaid handset-based, 500 MB ($ a month)Mobile-b’band, postpaid computer-based, 1 GB ($ a month)
TradeICT goods exports (% of total goods exports)ICT goods imports (% of total goods imports)ICT service exports (% of total service exports)
ApplicationsOnline service index (0-1, 1=highest presence)Secure Internet servers (per million people)
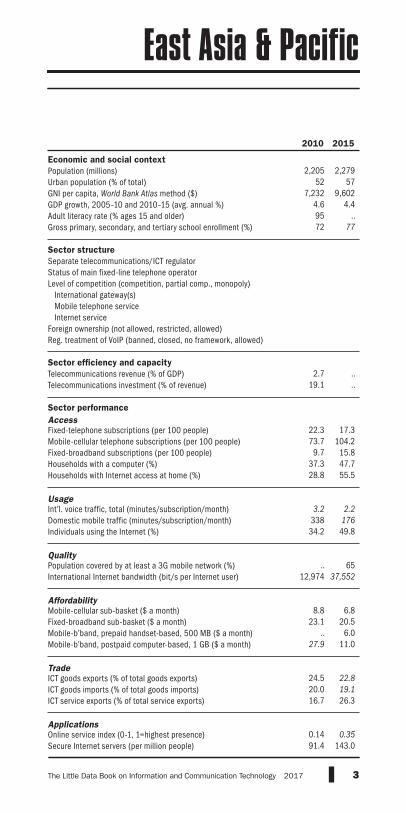
2,205 2,27952 57
7,232 9,6024.6 4.495 ..72 77
2.7 ..19.1 ..
22.3 17.373.7 104.2
9.7 15.837.3 47.728.8 55.5
3.2 2.2338 17634.2 49.8
.. 6512,974 37,552
8.8 6.823.1 20.5
.. 6.027.9 11.0
24.5 22.820.0 19.116.7 26.3
0.14 0.3591.4 143.0
East Asia & Pacific

4 2017 The Little Data Book on Information and Communication Technology
2010 2015
Economic and social contextPopulation (millions)Urban population (% of total)GNI per capita, World Bank Atlas method ($)GDP growth, 2005–10 and 2010–15 (avg. annual %)Adult literacy rate (% ages 15 and older) Gross primary, secondary, and tertiary school enrollment (%)
Sector structureSeparate telecommunications/ICT regulatorStatus of main fixed-line telephone operatorLevel of competition (competition, partial comp., monopoly) International gateway(s) Mobile telephone service Internet serviceForeign ownership (not allowed, restricted, allowed)Reg. treatment of VoIP (banned, closed, no framework, allowed)
Sector efficiency and capacityTelecommunications revenue (% of GDP)Telecommunications investment (% of revenue)
Sector performanceAccessFixed-telephone subscriptions (per 100 people)Mobile-cellular telephone subscriptions (per 100 people)Fixed-broadband subscriptions (per 100 people)Households with a computer (%)Households with Internet access at home (%)
Usage Int’l. voice traffic, total (minutes/subscription/month)Domestic mobile traffic (minutes/subscription/month)Individuals using the Internet (%)
Quality Population covered by at least a 3G mobile network (%)International Internet bandwidth (bit/s per Internet user)
AffordabilityMobile-cellular sub-basket ($ a month)Fixed-broadband sub-basket ($ a month)Mobile-b’band, prepaid handset-based, 500 MB ($ a month)Mobile-b’band, postpaid computer-based, 1 GB ($ a month)
TradeICT goods exports (% of total goods exports)ICT goods imports (% of total goods imports)ICT service exports (% of total service exports)
ApplicationsOnline service index (0-1, 1=highest presence)Secure Internet servers (per million people)
889 90870 71
24,350 24,1471.0 1.099 ..88 92
2.1 1.716.2 19.1
37.5 32.7120.1 126.9
19.0 24.763.7 76.358.2 77.4
.. ..119 14956.1 71.7
85 8868,905 122,145
21.3 9.722.8 14.612.8 6.615.9 8.3
5.4 4.48.6 7.2
32.3 35.4
0.39 0.55383.4 616.9
Europe & Central Asia

5The Little Data Book on Information and Communication Technology 2017
2010 2015
Economic and social contextPopulation (millions)Urban population (% of total)GNI per capita, World Bank Atlas method ($)GDP growth, 2005–10 and 2010–15 (avg. annual %)Adult literacy rate (% ages 15 and older) Gross primary, secondary, and tertiary school enrollment (%)
Sector structureSeparate telecommunications/ICT regulatorStatus of main fixed-line telephone operatorLevel of competition (competition, partial comp., monopoly) International gateway(s) Mobile telephone service Internet serviceForeign ownership (not allowed, restricted, allowed)Reg. treatment of VoIP (banned, closed, no framework, allowed)
Sector efficiency and capacityTelecommunications revenue (% of GDP)Telecommunications investment (% of revenue)
Sector performanceAccessFixed-telephone subscriptions (per 100 people)Mobile-cellular telephone subscriptions (per 100 people)Fixed-broadband subscriptions (per 100 people)Households with a computer (%)Households with Internet access at home (%)
Usage Int’l. voice traffic, total (minutes/subscription/month)Domestic mobile traffic (minutes/subscription/month)Individuals using the Internet (%)
Quality Population covered by at least a 3G mobile network (%)International Internet bandwidth (bit/s per Internet user)
AffordabilityMobile-cellular sub-basket ($ a month)Fixed-broadband sub-basket ($ a month)Mobile-b’band, prepaid handset-based, 500 MB ($ a month)Mobile-b’band, postpaid computer-based, 1 GB ($ a month)
TradeICT goods exports (% of total goods exports)ICT goods imports (% of total goods imports)ICT service exports (% of total service exports)
ApplicationsOnline service index (0-1, 1=highest presence)Secure Internet servers (per million people)
599 63378 80
7,989 8,9393.5 2.092 ..82 83
3.1 ..18.3 15.7
17.9 17.496.4 110.4
6.7 10.530.8 47.022.4 43.4
.. ..90 ..
34.7 54.5
.. 8813,430 43,386
16.9 13.624.9 21.217.9 12.917.8 14.4
7.4 6.312.4 11.1
.. ..
0.28 0.3728.3 56.6
Latin America & Caribbean

6 2017 The Little Data Book on Information and Communication Technology
2010 2015
Economic and social contextPopulation (millions)Urban population (% of total)GNI per capita, World Bank Atlas method ($)GDP growth, 2005–10 and 2010–15 (avg. annual %)Adult literacy rate (% ages 15 and older) Gross primary, secondary, and tertiary school enrollment (%)
Sector structureSeparate telecommunications/ICT regulatorStatus of main fixed-line telephone operatorLevel of competition (competition, partial comp., monopoly) International gateway(s) Mobile telephone service Internet serviceForeign ownership (not allowed, restricted, allowed)Reg. treatment of VoIP (banned, closed, no framework, allowed)
Sector efficiency and capacityTelecommunications revenue (% of GDP)Telecommunications investment (% of revenue)
Sector performanceAccessFixed-telephone subscriptions (per 100 people)Mobile-cellular telephone subscriptions (per 100 people)Fixed-broadband subscriptions (per 100 people)Households with a computer (%)Households with Internet access at home (%)
Usage Int’l. voice traffic, total (minutes/subscription/month)Domestic mobile traffic (minutes/subscription/month)Individuals using the Internet (%)
Quality Population covered by at least a 3G mobile network (%)International Internet bandwidth (bit/s per Internet user)
AffordabilityMobile-cellular sub-basket ($ a month)Fixed-broadband sub-basket ($ a month)Mobile-b’band, prepaid handset-based, 500 MB ($ a month)Mobile-b’band, postpaid computer-based, 1 GB ($ a month)
TradeICT goods exports (% of total goods exports)ICT goods imports (% of total goods imports)ICT service exports (% of total service exports)
ApplicationsOnline service index (0-1, 1=highest presence)Secure Internet servers (per million people)
385 42463 64
6,943 8,2074.7 3.080 ..74 78
2.9 2.220.8 ..
16.7 15.392.9 113.0
2.6 7.134.1 49.825.0 48.5
7.1 12.7.. ..
24.9 43.7
51 768,885 29,072
12.2 10.225.3 17.523.3 13.013.7 13.0
1.7 ..5.2 ..
.. ..
0.27 0.5517.5 29.2
Middle East & North Africa

7The Little Data Book on Information and Communication Technology 2017
2010 2015
Economic and social contextPopulation (millions)Urban population (% of total)GNI per capita, World Bank Atlas method ($)GDP growth, 2005–10 and 2010–15 (avg. annual %)Adult literacy rate (% ages 15 and older) Gross primary, secondary, and tertiary school enrollment (%)
Sector structureSeparate telecommunications/ICT regulatorStatus of main fixed-line telephone operatorLevel of competition (competition, partial comp., monopoly) International gateway(s) Mobile telephone service Internet serviceForeign ownership (not allowed, restricted, allowed)Reg. treatment of VoIP (banned, closed, no framework, allowed)
Sector efficiency and capacityTelecommunications revenue (% of GDP)Telecommunications investment (% of revenue)
Sector performanceAccessFixed-telephone subscriptions (per 100 people)Mobile-cellular telephone subscriptions (per 100 people)Fixed-broadband subscriptions (per 100 people)Households with a computer (%)Households with Internet access at home (%)
Usage Int’l. voice traffic, total (minutes/subscription/month)Domestic mobile traffic (minutes/subscription/month)Individuals using the Internet (%)
Quality Population covered by at least a 3G mobile network (%)International Internet bandwidth (bit/s per Internet user)
AffordabilityMobile-cellular sub-basket ($ a month)Fixed-broadband sub-basket ($ a month)Mobile-b’band, prepaid handset-based, 500 MB ($ a month)Mobile-b’band, postpaid computer-based, 1 GB ($ a month)
TradeICT goods exports (% of total goods exports)ICT goods imports (% of total goods imports)ICT service exports (% of total service exports)
ApplicationsOnline service index (0-1, 1=highest presence)Secure Internet servers (per million people)
North America
343 35781 82
48,513 54,2170.5 2.0
.. ..96 95
3.3 3.317.0 31.9
48.5 38.289.8 114.027.5 32.076.2 87.171.8 82.6
16.8 ..348 32472.5 75.9
98 10041,790 89,316
37.3 30.423.1 32.954.4 30.340.3 28.5
8.7 7.313.4 12.024.9 24.4
0.91 0.931,425.8 1,616.7

8 2017 The Little Data Book on Information and Communication Technology
2010 2015
Economic and social contextPopulation (millions)Urban population (% of total)GNI per capita, World Bank Atlas method ($)GDP growth, 2005–10 and 2010–15 (avg. annual %)Adult literacy rate (% ages 15 and older) Gross primary, secondary, and tertiary school enrollment (%)
Sector structureSeparate telecommunications/ICT regulatorStatus of main fixed-line telephone operatorLevel of competition (competition, partial comp., monopoly) International gateway(s) Mobile telephone service Internet serviceForeign ownership (not allowed, restricted, allowed)Reg. treatment of VoIP (banned, closed, no framework, allowed)
Sector efficiency and capacityTelecommunications revenue (% of GDP)Telecommunications investment (% of revenue)
Sector performanceAccessFixed-telephone subscriptions (per 100 people)Mobile-cellular telephone subscriptions (per 100 people)Fixed-broadband subscriptions (per 100 people)Households with a computer (%)Households with Internet access at home (%)
Usage Int’l. voice traffic, total (minutes/subscription/month)Domestic mobile traffic (minutes/subscription/month)Individuals using the Internet (%)
Quality Population covered by at least a 3G mobile network (%)International Internet bandwidth (bit/s per Internet user)
AffordabilityMobile-cellular sub-basket ($ a month)Fixed-broadband sub-basket ($ a month)Mobile-b’band, prepaid handset-based, 500 MB ($ a month)Mobile-b’band, postpaid computer-based, 1 GB ($ a month)
TradeICT goods exports (% of total goods exports)ICT goods imports (% of total goods imports)ICT service exports (% of total service exports)
ApplicationsOnline service index (0-1, 1=highest presence)Secure Internet servers (per million people)
1,629 1,74431 33
1,191 1,5337.1 6.467 ..63 67
2.4 1.812.2 16.2
2.9 1.959.6 78.4
0.8 1.46.6 13.84.2 19.0
7.1 9.0129 1747.2 23.6
1 ..5,357 5,112
2.8 2.38.3 6.65.3 3.46.6 4.9
1.7 0.95.7 6.0
63.2 63.2
0.24 0.331.8 5.8
South Asia

9The Little Data Book on Information and Communication Technology 2017
2010 2015
Economic and social contextPopulation (millions)Urban population (% of total)GNI per capita, World Bank Atlas method ($)GDP growth, 2005–10 and 2010–15 (avg. annual %)Adult literacy rate (% ages 15 and older) Gross primary, secondary, and tertiary school enrollment (%)
Sector structureSeparate telecommunications/ICT regulatorStatus of main fixed-line telephone operatorLevel of competition (competition, partial comp., monopoly) International gateway(s) Mobile telephone service Internet serviceForeign ownership (not allowed, restricted, allowed)Reg. treatment of VoIP (banned, closed, no framework, allowed)
Sector efficiency and capacityTelecommunications revenue (% of GDP)Telecommunications investment (% of revenue)
Sector performanceAccessFixed-telephone subscriptions (per 100 people)Mobile-cellular telephone subscriptions (per 100 people)Fixed-broadband subscriptions (per 100 people)Households with a computer (%)Households with Internet access at home (%)
Usage Int’l. voice traffic, total (minutes/subscription/month)Domestic mobile traffic (minutes/subscription/month)Individuals using the Internet (%)
Quality Population covered by at least a 3G mobile network (%)International Internet bandwidth (bit/s per Internet user)
AffordabilityMobile-cellular sub-basket ($ a month)Fixed-broadband sub-basket ($ a month)Mobile-b’band, prepaid handset-based, 500 MB ($ a month)Mobile-b’band, postpaid computer-based, 1 GB ($ a month)
TradeICT goods exports (% of total goods exports)ICT goods imports (% of total goods imports)ICT service exports (% of total service exports)
ApplicationsOnline service index (0-1, 1=highest presence)Secure Internet servers (per million people)
874 1,00135 38
1,281 1,6285.4 4.160 ..58 59
3.4 ..23.1 ..
1.5 1.144.4 75.7
0.2 0.55.6 10.04.3 14.5
5.1 ..56 689.8 22.4
.. 6130,798 26,590
16.3 8.750.1 31.619.7 8.5
.. 14.0
0.5 0.86.6 5.4
15.7 17.7
0.10 0.154.8 9.9
Sub-Saharan Africa
10 2017 The Little Data Book on Information and Communication Technology
For operational and analytical purposes the World Bank’s main criterion for classifying economies is gross national income (GNI) per capita . Every economy in The Little Data Book on Information and Communication Technology is clas-sified as low income, middle income, or high income . Note: Classifications are fixed during the World Bank’s fiscal year (ending on June 30), thus countries remain in the categories in which they are classified irrespective of any revisions to their per capita income data .
Low-income economies are those with a GNI per capita of $1,025 or less in 2015 .
Lower middle-income economies are those with a GNI per capita between $1,026 and $4,035 .
Upper middle-income economies are those with a GNI per capita between $4,036 and $12,475 .
High-income economies are those with a GNI per capita of $12,476 or more .
Income group tables

11The Little Data Book on Information and Communication Technology 2017
2010 2015
Economic and social contextPopulation (millions)Urban population (% of total)GNI per capita, World Bank Atlas method ($)GDP growth, 2005–10 and 2010–15 (avg. annual %)Adult literacy rate (% ages 15 and older) Gross primary, secondary, and tertiary school enrollment (%)
Sector structureSeparate telecommunications/ICT regulatorStatus of main fixed-line telephone operatorLevel of competition (competition, partial comp., monopoly) International gateway(s) Mobile telephone service Internet serviceForeign ownership (not allowed, restricted, allowed)Reg. treatment of VoIP (banned, closed, no framework, allowed)
Sector efficiency and capacityTelecommunications revenue (% of GDP)Telecommunications investment (% of revenue)
Sector performanceAccessFixed-telephone subscriptions (per 100 people)Mobile-cellular telephone subscriptions (per 100 people)Fixed-broadband subscriptions (per 100 people)Households with a computer (%)Households with Internet access at home (%)
Usage Int’l. voice traffic, total (minutes/subscription/month)Domestic mobile traffic (minutes/subscription/month)Individuals using the Internet (%)
Quality Population covered by at least a 3G mobile network (%)International Internet bandwidth (bit/s per Internet user)
AffordabilityMobile-cellular sub-basket ($ a month)Fixed-broadband sub-basket ($ a month)Mobile-b’band, prepaid handset-based, 500 MB ($ a month)Mobile-b’band, postpaid computer-based, 1 GB ($ a month)
TradeICT goods exports (% of total goods exports)ICT goods imports (% of total goods imports)ICT service exports (% of total service exports)
ApplicationsOnline service index (0-1, 1=highest presence)Secure Internet servers (per million people)
557 63829 31
502 6205.8 5.457 ..58 60
.. ..
.. ..
1.0 0.928.7 60.0
0.1 0.32.3 4.81.7 7.1
.. ..45 493.3 9.5
.. 511,753 4,245
14.2 9.448.5 33.610.7 8.0
.. 10.8
.. ..4.5 3.4
.. ..
0.08 0.110.5 1.5
Low income

12 2017 The Little Data Book on Information and Communication Technology
2010 2015
Economic and social contextPopulation (millions)Urban population (% of total)GNI per capita, World Bank Atlas method ($)GDP growth, 2005–10 and 2010–15 (avg. annual %)Adult literacy rate (% ages 15 and older) Gross primary, secondary, and tertiary school enrollment (%)
Sector structureSeparate telecommunications/ICT regulatorStatus of main fixed-line telephone operatorLevel of competition (competition, partial comp., monopoly) International gateway(s) Mobile telephone service Internet serviceForeign ownership (not allowed, restricted, allowed)Reg. treatment of VoIP (banned, closed, no framework, allowed)
Sector efficiency and capacityTelecommunications revenue (% of GDP)Telecommunications investment (% of revenue)
Sector performanceAccessFixed-telephone subscriptions (per 100 people)Mobile-cellular telephone subscriptions (per 100 people)Fixed-broadband subscriptions (per 100 people)Households with a computer (%)Households with Internet access at home (%)
Usage Int’l. voice traffic, total (minutes/subscription/month)Domestic mobile traffic (minutes/subscription/month)Individuals using the Internet (%)
Quality Population covered by at least a 3G mobile network (%)International Internet bandwidth (bit/s per Internet user)
AffordabilityMobile-cellular sub-basket ($ a month)Fixed-broadband sub-basket ($ a month)Mobile-b’band, prepaid handset-based, 500 MB ($ a month)Mobile-b’band, postpaid computer-based, 1 GB ($ a month)
TradeICT goods exports (% of total goods exports)ICT goods imports (% of total goods imports)ICT service exports (% of total service exports)
ApplicationsOnline service index (0-1, 1=highest presence)Secure Internet servers (per million people)
5,212 5,52148 51
3,616 4,9256.2 4.783 ..69 73
2.6 2.119.2 ..
13.0 10.174.4 97.5
4.5 8.324.2 34.717.1 39.0
4.2 4.7199 16422.3 39.8
.. 689,178 20,739
11.9 8.019.8 15.013.1 7.515.4 10.9
14.6 13.913.3 12.825.9 27.0
0.25 0.317.9 20.2
Middle income

13The Little Data Book on Information and Communication Technology 2017
2010 2015
Economic and social contextPopulation (millions)Urban population (% of total)GNI per capita, World Bank Atlas method ($)GDP growth, 2005–10 and 2010–15 (avg. annual %)Adult literacy rate (% ages 15 and older) Gross primary, secondary, and tertiary school enrollment (%)
Sector structureSeparate telecommunications/ICT regulatorStatus of main fixed-line telephone operatorLevel of competition (competition, partial comp., monopoly) International gateway(s) Mobile telephone service Internet serviceForeign ownership (not allowed, restricted, allowed)Reg. treatment of VoIP (banned, closed, no framework, allowed)
Sector efficiency and capacityTelecommunications revenue (% of GDP)Telecommunications investment (% of revenue)
Sector performanceAccessFixed-telephone subscriptions (per 100 people)Mobile-cellular telephone subscriptions (per 100 people)Fixed-broadband subscriptions (per 100 people)Households with a computer (%)Households with Internet access at home (%)
Usage Int’l. voice traffic, total (minutes/subscription/month)Domestic mobile traffic (minutes/subscription/month)Individuals using the Internet (%)
Quality Population covered by at least a 3G mobile network (%)International Internet bandwidth (bit/s per Internet user)
AffordabilityMobile-cellular sub-basket ($ a month)Fixed-broadband sub-basket ($ a month)Mobile-b’band, prepaid handset-based, 500 MB ($ a month)Mobile-b’band, postpaid computer-based, 1 GB ($ a month)
TradeICT goods exports (% of total goods exports)ICT goods imports (% of total goods imports)ICT service exports (% of total service exports)
ApplicationsOnline service index (0-1, 1=highest presence)Secure Internet servers (per million people)
2,719 2,92737 39
1,531 2,0356.1 5.473 ..65 68
2.5 ..20.6 ..
5.6 3.567.6 90.5
1.0 1.910.0 19.3
7.0 24.3
7.4 7.5113 15211.8 28.6
.. ..5,468 10,372
10.0 6.926.7 14.310.9 5.815.0 10.0
3.9 5.77.3 7.6
44.1 48.0
0.18 0.262.4 7.4
Lower middle income

14 2017 The Little Data Book on Information and Communication Technology
2010 2015
Economic and social contextPopulation (millions)Urban population (% of total)GNI per capita, World Bank Atlas method ($)GDP growth, 2005–10 and 2010–15 (avg. annual %)Adult literacy rate (% ages 15 and older) Gross primary, secondary, and tertiary school enrollment (%)
Sector structureSeparate telecommunications/ICT regulatorStatus of main fixed-line telephone operatorLevel of competition (competition, partial comp., monopoly) International gateway(s) Mobile telephone service Internet serviceForeign ownership (not allowed, restricted, allowed)Reg. treatment of VoIP (banned, closed, no framework, allowed)
Sector efficiency and capacityTelecommunications revenue (% of GDP)Telecommunications investment (% of revenue)
Sector performanceAccessFixed-telephone subscriptions (per 100 people)Mobile-cellular telephone subscriptions (per 100 people)Fixed-broadband subscriptions (per 100 people)Households with a computer (%)Households with Internet access at home (%)
Usage Int’l. voice traffic, total (minutes/subscription/month)Domestic mobile traffic (minutes/subscription/month)Individuals using the Internet (%)
Quality Population covered by at least a 3G mobile network (%)International Internet bandwidth (bit/s per Internet user)
AffordabilityMobile-cellular sub-basket ($ a month)Fixed-broadband sub-basket ($ a month)Mobile-b’band, prepaid handset-based, 500 MB ($ a month)Mobile-b’band, postpaid computer-based, 1 GB ($ a month)
TradeICT goods exports (% of total goods exports)ICT goods imports (% of total goods imports)ICT service exports (% of total service exports)
ApplicationsOnline service index (0-1, 1=highest presence)Secure Internet servers (per million people)
2,493 2,59460 64
5,889 8,1866.2 4.594 ..75 81
2.7 2.118.4 18.8
20.9 17.381.7 105.1
8.1 15.435.7 48.725.1 52.2
2.6 2.3273 17333.6 52.1
.. 6910,564 26,098
15.4 8.518.0 15.516.2 7.715.6 11.1
17.1 15.715.2 14.415.1 25.7
0.28 0.3713.9 34.7
Upper middle income

15The Little Data Book on Information and Communication Technology 2017
2010 2015
Economic and social contextPopulation (millions)Urban population (% of total)GNI per capita, World Bank Atlas method ($)GDP growth, 2005–10 and 2010–15 (avg. annual %)Adult literacy rate (% ages 15 and older) Gross primary, secondary, and tertiary school enrollment (%)
Sector structureSeparate telecommunications/ICT regulatorStatus of main fixed-line telephone operatorLevel of competition (competition, partial comp., monopoly) International gateway(s) Mobile telephone service Internet serviceForeign ownership (not allowed, restricted, allowed)Reg. treatment of VoIP (banned, closed, no framework, allowed)
Sector efficiency and capacityTelecommunications revenue (% of GDP)Telecommunications investment (% of revenue)
Sector performanceAccessFixed-telephone subscriptions (per 100 people)Mobile-cellular telephone subscriptions (per 100 people)Fixed-broadband subscriptions (per 100 people)Households with a computer (%)Households with Internet access at home (%)
Usage Int’l. voice traffic, total (minutes/subscription/month)Domestic mobile traffic (minutes/subscription/month)Individuals using the Internet (%)
Quality Population covered by at least a 3G mobile network (%)International Internet bandwidth (bit/s per Internet user)
AffordabilityMobile-cellular sub-basket ($ a month)Fixed-broadband sub-basket ($ a month)Mobile-b’band, prepaid handset-based, 500 MB ($ a month)Mobile-b’band, postpaid computer-based, 1 GB ($ a month)
TradeICT goods exports (% of total goods exports)ICT goods imports (% of total goods imports)ICT service exports (% of total service exports)
ApplicationsOnline service index (0-1, 1=highest presence)Secure Internet servers (per million people)
5,769 6,15946 49
3,315 4,4796.2 4.781 ..67 71
2.6 2.120.3 ..
11.8 9.170.0 93.6
4.1 7.522.7 32.416.0 36.5
4.3 4.7217 15820.5 36.8
.. 669,070 20,323
13.4 8.123.5 18.312.8 7.816.2 10.8
14.5 13.813.2 12.725.8 26.9
0.18 0.277.3 18.3
Low and middle income
16 2017 The Little Data Book on Information and Communication Technology
2010 2015
Economic and social contextPopulation (millions)Urban population (% of total)GNI per capita, World Bank Atlas method ($)GDP growth, 2005–10 and 2010–15 (avg. annual %)Adult literacy rate (% ages 15 and older) Gross primary, secondary, and tertiary school enrollment (%)
Sector structureSeparate telecommunications/ICT regulatorStatus of main fixed-line telephone operatorLevel of competition (competition, partial comp., monopoly) International gateway(s) Mobile telephone service Internet serviceForeign ownership (not allowed, restricted, allowed)Reg. treatment of VoIP (banned, closed, no framework, allowed)
Sector efficiency and capacityTelecommunications revenue (% of GDP)Telecommunications investment (% of revenue)
Sector performanceAccessFixed-telephone subscriptions (per 100 people)Mobile-cellular telephone subscriptions (per 100 people)Fixed-broadband subscriptions (per 100 people)Households with a computer (%)Households with Internet access at home (%)
Usage Int’l. voice traffic, total (minutes/subscription/month)Domestic mobile traffic (minutes/subscription/month)Individuals using the Internet (%)
Quality Population covered by at least a 3G mobile network (%)International Internet bandwidth (bit/s per Internet user)
AffordabilityMobile-cellular sub-basket ($ a month)Fixed-broadband sub-basket ($ a month)Mobile-b’band, prepaid handset-based, 500 MB ($ a month)Mobile-b’band, postpaid computer-based, 1 GB ($ a month)
TradeICT goods exports (% of total goods exports)ICT goods imports (% of total goods imports)ICT service exports (% of total service exports)
ApplicationsOnline service index (0-1, 1=highest presence)Secure Internet servers (per million people)
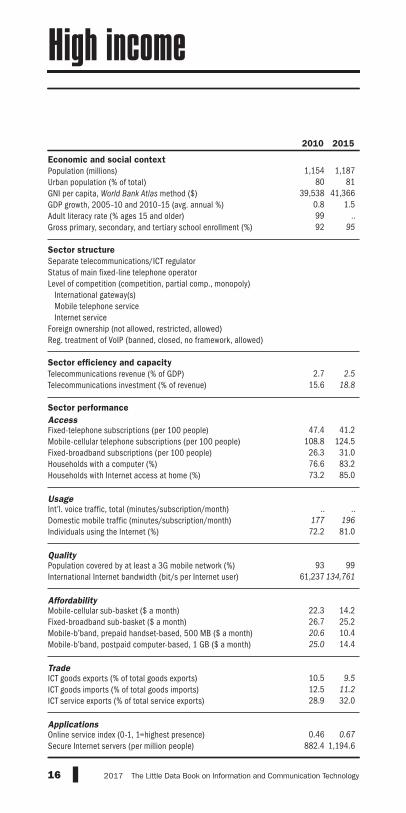
1,154 1,18780 81
39,538 41,3660.8 1.599 ..92 95
2.7 2.515.6 18.8
47.4 41.2108.8 124.5
26.3 31.076.6 83.273.2 85.0
.. ..177 19672.2 81.0
93 9961,237 134,761
22.3 14.226.7 25.220.6 10.425.0 14.4
10.5 9.512.5 11.228.9 32.0
0.46 0.67882.4 1,194.6
High income

17The Little Data Book on Information and Communication Technology 2017
China
Data for China do not include data for Hong Kong SAR, China; Macao SAR, China; or Taiwan, China .
Cyprus
GNI and GDP data and data calculated using GNI and GDP refer to the area controlled by the government of Cyprus .
Georgia
GNI, GDP, and population data and data calculated using GNI, GDP, and population exclude Abkhazia and South Ossetia .
Kosovo, Montenegro, and Serbia
Montenegro declared independence from Serbia and Montenegro on June 3, 2006 . Where available, data for each country are shown separately . However, some indicators for Serbia prior to 2006 include data for Montenegro . Moreover, data for most indicators for Serbia from 1999 onward exclude data for Kosovo, which in 1999 became a territory under international administration pursuant to UN Security Council Resolution 1244 (1999) . Kosovo became a member of the World Bank on June 29, 2009, and its data are shown where available .
Moldova
GNI, GDP, and population data and data calculated using GNI, GDP, and population exclude Transnistria .
Morocco
GNI and GDP data and data calculated using GNI and GDP include former Spanish Sahara .
South Sudan and Sudan
South Sudan declared its independence on July 9, 2011 . Data are shown separately for South Sudan where available . Data reported for Sudan exclude South Sudan after 2011 unless otherwise noted .
Tanzania
GNI and GDP data and data calculated using GNI and GDP refer to main-land Tanzania only .
For more information, see World Development Indicators 2017 or data .worldbank .org .
Country tables

Economic and social contextPopulation (millions)Urban population (% of total)GNI per capita, World Bank Atlas method ($)GDP growth, 2005–10 and 2010–15 (avg. annual %)Adult literacy rate (% ages 15 and older) Gross primary, secondary, and tertiary school enrollment (%)
Sector structureSeparate telecommunications/ICT regulatorStatus of main fixed-line telephone operatorLevel of competition (competition, partial comp., monopoly) International gateway(s) Mobile telephone service Internet serviceForeign ownership (not allowed, restricted, allowed)Reg. treatment of VoIP (banned, closed, no framework, allowed)
Sector efficiency and capacityTelecommunications revenue (% of GDP)Telecommunications investment (% of revenue)
Sector performanceAccessFixed-telephone subscriptions (per 100 people)Mobile-cellular telephone subscriptions (per 100 people)Fixed-broadband subscriptions (per 100 people)Households with a computer (%)Households with Internet access at home (%)
Usage Int’l. voice traffic, total (minutes/subscription/month)Domestic mobile traffic (minutes/subscription/month)Individuals using the Internet (%)
Quality Population covered by at least a 3G mobile network (%)International Internet bandwidth (bit/s per Internet user)
AffordabilityMobile-cellular sub-basket ($ a month)Fixed-broadband sub-basket ($ a month)Mobile-b’band, prepaid handset-based, 500 MB ($ a month)Mobile-b’band, postpaid computer-based, 1 GB ($ a month)
TradeICT goods exports (% of total goods exports)ICT goods imports (% of total goods imports)ICT service exports (% of total service exports)
ApplicationsOnline service index (0-1, 1=highest presence)Secure Internet servers (per million people)
18 2017 The Little Data Book on Information and Communication Technology
South Asia Low income
Afghanistan
2010 2015 2015
Low-incomegroupCountry data
28 33 63825 27 31
520 630 62010.7 5.1 5.4
32 38 ..65 70 60
Yes YesPublic Public
P ..P PP CA AC C
.. .. ..
.. .. ..
0.1 0.3 0.936.0 61.6 60.0
0.0 0.0 0.31.9a 2.9a 4.81.5a 3.9a 7.1
.. .. ..
.. .. 48.94.0a 8.3a 9.5
.. 40 511,761 10,213 4,245
9.7 5.4 9.453.5 20.8 33.6
6.9 5.8 8.0.. 5.8 10.8
.. .. ..0.4 0.1 3.4
32.6 27.7 ..
0.23 0.18 0.110.7 1.4 1.5

Economic and social contextPopulation (millions)Urban population (% of total)GNI per capita, World Bank Atlas method ($)GDP growth, 2005–10 and 2010–15 (avg. annual %)Adult literacy rate (% ages 15 and older) Gross primary, secondary, and tertiary school enrollment (%)
Sector structureSeparate telecommunications/ICT regulatorStatus of main fixed-line telephone operatorLevel of competition (competition, partial comp., monopoly) International gateway(s) Mobile telephone service Internet serviceForeign ownership (not allowed, restricted, allowed)Reg. treatment of VoIP (banned, closed, no framework, allowed)
Sector efficiency and capacityTelecommunications revenue (% of GDP)Telecommunications investment (% of revenue)
Sector performanceAccessFixed-telephone subscriptions (per 100 people)Mobile-cellular telephone subscriptions (per 100 people)Fixed-broadband subscriptions (per 100 people)Households with a computer (%)Households with Internet access at home (%)
Usage Int’l. voice traffic, total (minutes/subscription/month)Domestic mobile traffic (minutes/subscription/month)Individuals using the Internet (%)
Quality Population covered by at least a 3G mobile network (%)International Internet bandwidth (bit/s per Internet user)
AffordabilityMobile-cellular sub-basket ($ a month)Fixed-broadband sub-basket ($ a month)Mobile-b’band, prepaid handset-based, 500 MB ($ a month)Mobile-b’band, postpaid computer-based, 1 GB ($ a month)
TradeICT goods exports (% of total goods exports)ICT goods imports (% of total goods imports)ICT service exports (% of total service exports)
ApplicationsOnline service index (0-1, 1=highest presence)Secure Internet servers (per million people)
19The Little Data Book on Information and Communication Technology 2017
Europe & Central Asia Upper middle income
Albania
2010 2015 2015
Uppermiddle-incomegroupCountry data
3 3 2,59452 57 64
4,360 4,290 8,1865.3 1.8 4.597 98 ..78 88 81
Yes YesMixed Mixed
P CP PC CR AA A
4.6 1.7 2.117.2 32.0 18.8
10.6 7.1 17.385.5 106.4 105.1
3.4 7.6 15.415.6a 25.7a 48.713.7a 35.5a 52.2
21.8 28.2 2.3141.8 165.6 173.1
45.0 63.3a 52.1
86 99 6911,992 30,660 26,098
25.8 6.4 8.510.7 9.5 15.5
4.6 4.4 7.715.7 4.4 11.1
0.8 0.1 15.74.1 1.0 14.4
10.8 10.1 25.7
0.31 0.45 0.379.3 37.7 34.7

Economic and social contextPopulation (millions)Urban population (% of total)GNI per capita, World Bank Atlas method ($)GDP growth, 2005–10 and 2010–15 (avg. annual %)Adult literacy rate (% ages 15 and older) Gross primary, secondary, and tertiary school enrollment (%)
Sector structureSeparate telecommunications/ICT regulatorStatus of main fixed-line telephone operatorLevel of competition (competition, partial comp., monopoly) International gateway(s) Mobile telephone service Internet serviceForeign ownership (not allowed, restricted, allowed)Reg. treatment of VoIP (banned, closed, no framework, allowed)
Sector efficiency and capacityTelecommunications revenue (% of GDP)Telecommunications investment (% of revenue)
Sector performanceAccessFixed-telephone subscriptions (per 100 people)Mobile-cellular telephone subscriptions (per 100 people)Fixed-broadband subscriptions (per 100 people)Households with a computer (%)Households with Internet access at home (%)
Usage Int’l. voice traffic, total (minutes/subscription/month)Domestic mobile traffic (minutes/subscription/month)Individuals using the Internet (%)
Quality Population covered by at least a 3G mobile network (%)International Internet bandwidth (bit/s per Internet user)
AffordabilityMobile-cellular sub-basket ($ a month)Fixed-broadband sub-basket ($ a month)Mobile-b’band, prepaid handset-based, 500 MB ($ a month)Mobile-b’band, postpaid computer-based, 1 GB ($ a month)
TradeICT goods exports (% of total goods exports)ICT goods imports (% of total goods imports)ICT service exports (% of total service exports)
ApplicationsOnline service index (0-1, 1=highest presence)Secure Internet servers (per million people)
20 2017 The Little Data Book on Information and Communication Technology
Middle East & North Africa Upper middle income
Algeria
2010 2015 2015
Uppermiddle-incomegroupCountry data
36 40 2,59468 71 64
4,470 4,870 8,1862.5 3.3 4.575 80 ..79 .. 81
Yes YesPublic Public
P MP CC C.. RA A
3.1 2.9 2.1.. .. 18.8
7.9 8.0 17.388.4 113.0 105.1
2.4 5.6 15.420.0a 37.0 48.7
9.0a 31.9 52.2
4.4 4.9 2.3164.3 166.6 173.1
12.5 38.2a 52.1
.. 46 697,771 30,119 26,098
13.8 10.2 8.514.8 15.5 15.5
.. 6.0 7.7
.. 19.9 11.1
0.0 0.0 15.73.0 5.1 14.4
56.7 50.7 25.7
0.10 0.08 0.370.9 2.5 34.7

Economic and social contextPopulation (millions)Urban population (% of total)GNI per capita, World Bank Atlas method ($)GDP growth, 2005–10 and 2010–15 (avg. annual %)Adult literacy rate (% ages 15 and older) Gross primary, secondary, and tertiary school enrollment (%)
Sector structureSeparate telecommunications/ICT regulatorStatus of main fixed-line telephone operatorLevel of competition (competition, partial comp., monopoly) International gateway(s) Mobile telephone service Internet serviceForeign ownership (not allowed, restricted, allowed)Reg. treatment of VoIP (banned, closed, no framework, allowed)
Sector efficiency and capacityTelecommunications revenue (% of GDP)Telecommunications investment (% of revenue)
Sector performanceAccessFixed-telephone subscriptions (per 100 people)Mobile-cellular telephone subscriptions (per 100 people)Fixed-broadband subscriptions (per 100 people)Households with a computer (%)Households with Internet access at home (%)
Usage Int’l. voice traffic, total (minutes/subscription/month)Domestic mobile traffic (minutes/subscription/month)Individuals using the Internet (%)
Quality Population covered by at least a 3G mobile network (%)International Internet bandwidth (bit/s per Internet user)
AffordabilityMobile-cellular sub-basket ($ a month)Fixed-broadband sub-basket ($ a month)Mobile-b’band, prepaid handset-based, 500 MB ($ a month)Mobile-b’band, postpaid computer-based, 1 GB ($ a month)
TradeICT goods exports (% of total goods exports)ICT goods imports (% of total goods imports)ICT service exports (% of total service exports)
ApplicationsOnline service index (0-1, 1=highest presence)Secure Internet servers (per million people)
21The Little Data Book on Information and Communication Technology 2017
East Asia & Pacific Upper middle income
American Samoa
2010 2015 2015
Uppermiddle-incomegroupCountry data
0.06 0.06 2,59488 87 64
.. .. 8,186
.. .. 4.5
.. .. ..
.. .. 81
.. ..
.. ..
.. ..
.. ..
.. ..
.. ..
.. ..
.. .. 2.1
.. .. 18.8
18.7 18.0 17.3.. .. 105.1.. .. 15.4.. .. 48.7.. .. 52.2
.. .. 2.3
.. .. 173.1
.. .. 52.1
.. .. 69
.. .. 26,098
.. .. 8.5
.. .. 15.5
.. .. 7.7
.. .. 11.1
.. .. 15.7
.. .. 14.4
.. .. 25.7
.. .. 0.3735.9 72.0 34.7

Economic and social contextPopulation (millions)Urban population (% of total)GNI per capita, World Bank Atlas method ($)GDP growth, 2005–10 and 2010–15 (avg. annual %)Adult literacy rate (% ages 15 and older) Gross primary, secondary, and tertiary school enrollment (%)
Sector structureSeparate telecommunications/ICT regulatorStatus of main fixed-line telephone operatorLevel of competition (competition, partial comp., monopoly) International gateway(s) Mobile telephone service Internet serviceForeign ownership (not allowed, restricted, allowed)Reg. treatment of VoIP (banned, closed, no framework, allowed)
Sector efficiency and capacityTelecommunications revenue (% of GDP)Telecommunications investment (% of revenue)
Sector performanceAccessFixed-telephone subscriptions (per 100 people)Mobile-cellular telephone subscriptions (per 100 people)Fixed-broadband subscriptions (per 100 people)Households with a computer (%)Households with Internet access at home (%)
Usage Int’l. voice traffic, total (minutes/subscription/month)Domestic mobile traffic (minutes/subscription/month)Individuals using the Internet (%)
Quality Population covered by at least a 3G mobile network (%)International Internet bandwidth (bit/s per Internet user)
AffordabilityMobile-cellular sub-basket ($ a month)Fixed-broadband sub-basket ($ a month)Mobile-b’band, prepaid handset-based, 500 MB ($ a month)Mobile-b’band, postpaid computer-based, 1 GB ($ a month)
TradeICT goods exports (% of total goods exports)ICT goods imports (% of total goods imports)ICT service exports (% of total service exports)
ApplicationsOnline service index (0-1, 1=highest presence)Secure Internet servers (per million people)
22 2017 The Little Data Book on Information and Communication Technology
Europe & Central Asia High income
Andorra
2010 2015 2015
High-incomegroupCountry data
0.08 0.07 1,18788 85 81
41,670 43,270 41,366–3.3 –2.2 1.5
.. .. ..
.. .. 95
No NoPublic Public
M MM MM ..
No A.. A
3.6 3.4 2.5.. .. 18.8
49.0 48.0 41.284.1 88.1 124.531.5 37.9 31.083.2a 82.7a 83.267.2 84.8a 85.0
91.9 67.2 ..57.6 52.4 195.981.0 96.9a 81.0
95 97 9936,447 82,857 134,761
.. 31.0 14.2
.. 17.4 25.2
.. 24.9 10.455.1 15.1 14.4
25.0 21.7 9.57.1 6.7 11.2
.. .. 32.0
0.23 0.43 0.67924.0 1,631.8 1,194.6

Economic and social contextPopulation (millions)Urban population (% of total)GNI per capita, World Bank Atlas method ($)GDP growth, 2005–10 and 2010–15 (avg. annual %)Adult literacy rate (% ages 15 and older) Gross primary, secondary, and tertiary school enrollment (%)
Sector structureSeparate telecommunications/ICT regulatorStatus of main fixed-line telephone operatorLevel of competition (competition, partial comp., monopoly) International gateway(s) Mobile telephone service Internet serviceForeign ownership (not allowed, restricted, allowed)Reg. treatment of VoIP (banned, closed, no framework, allowed)
Sector efficiency and capacityTelecommunications revenue (% of GDP)Telecommunications investment (% of revenue)
Sector performanceAccessFixed-telephone subscriptions (per 100 people)Mobile-cellular telephone subscriptions (per 100 people)Fixed-broadband subscriptions (per 100 people)Households with a computer (%)Households with Internet access at home (%)
Usage Int’l. voice traffic, total (minutes/subscription/month)Domestic mobile traffic (minutes/subscription/month)Individuals using the Internet (%)
Quality Population covered by at least a 3G mobile network (%)International Internet bandwidth (bit/s per Internet user)
AffordabilityMobile-cellular sub-basket ($ a month)Fixed-broadband sub-basket ($ a month)Mobile-b’band, prepaid handset-based, 500 MB ($ a month)Mobile-b’band, postpaid computer-based, 1 GB ($ a month)
TradeICT goods exports (% of total goods exports)ICT goods imports (% of total goods imports)ICT service exports (% of total service exports)
ApplicationsOnline service index (0-1, 1=highest presence)Secure Internet servers (per million people)
23The Little Data Book on Information and Communication Technology 2017
Sub-Saharan Africa Upper middle income
Angola
2010 2015 2015
Uppermiddle-incomegroupCountry data
21 25 2,59440 44 64
3,570 4,180 8,18612.4 5.0 4.5
.. 71 ..60 .. 81
Yes YesPublic Public
M MC CC CR R
No No
2.2 1.8 2.134.2 18.9 18.8
1.4 1.2 17.348.1 60.8 105.1
0.1 0.7 15.47.1a 11.1a 48.75.7a 10.2a 52.2
3.7 4.8 2.387.2 112.5 173.1
2.8a 12.4a 52.1
40 60 692,192 6,518 26,098
19.2 15.4 8.5133.4 40.8 15.5
94.3 15.0 7.7.. 149.9 11.1
.. .. 15.7
.. .. 14.45.9 2.7 25.7
0.34 0.30 0.372.5 5.5 34.7

Economic and social contextPopulation (millions)Urban population (% of total)GNI per capita, World Bank Atlas method ($)GDP growth, 2005–10 and 2010–15 (avg. annual %)Adult literacy rate (% ages 15 and older) Gross primary, secondary, and tertiary school enrollment (%)
Sector structureSeparate telecommunications/ICT regulatorStatus of main fixed-line telephone operatorLevel of competition (competition, partial comp., monopoly) International gateway(s) Mobile telephone service Internet serviceForeign ownership (not allowed, restricted, allowed)Reg. treatment of VoIP (banned, closed, no framework, allowed)
Sector efficiency and capacityTelecommunications revenue (% of GDP)Telecommunications investment (% of revenue)
Sector performanceAccessFixed-telephone subscriptions (per 100 people)Mobile-cellular telephone subscriptions (per 100 people)Fixed-broadband subscriptions (per 100 people)Households with a computer (%)Households with Internet access at home (%)
Usage Int’l. voice traffic, total (minutes/subscription/month)Domestic mobile traffic (minutes/subscription/month)Individuals using the Internet (%)
Quality Population covered by at least a 3G mobile network (%)International Internet bandwidth (bit/s per Internet user)
AffordabilityMobile-cellular sub-basket ($ a month)Fixed-broadband sub-basket ($ a month)Mobile-b’band, prepaid handset-based, 500 MB ($ a month)Mobile-b’band, postpaid computer-based, 1 GB ($ a month)
TradeICT goods exports (% of total goods exports)ICT goods imports (% of total goods imports)ICT service exports (% of total service exports)
ApplicationsOnline service index (0-1, 1=highest presence)Secure Internet servers (per million people)
24 2017 The Little Data Book on Information and Communication Technology
Latin America & Caribbean High income
Antigua and Barbuda
2010 2015 2015
High-incomegroupCountry data
0.09 0.09 1,18726 24 81
12,620 13,390 41,366–0.1 2.2 1.5
.. 99 ..84 .. 95
No NoPublic Public
M PP PP PA AB A
.. .. 2.5
.. .. 18.8
41.6 13.1 41.2192.6 137.2 124.5
8.2 13.1 31.048.9a 57.6a 83.240.0a 56.3a 85.0
19.0 .. ..126.7 148.9 195.9
47.0a 65.2a 81.0
0 98 9929,269 71,825 134,761
25.3 23.4 14.254.9 54.9 25.227.8 9.3 10.429.3 30.7 14.4
2.2 2.2 9.53.1 3.8 11.26.4 6.7 32.0
0.12 0.42 0.671,100.5 305.0 1,194.6

Economic and social contextPopulation (millions)Urban population (% of total)GNI per capita, World Bank Atlas method ($)GDP growth, 2005–10 and 2010–15 (avg. annual %)Adult literacy rate (% ages 15 and older) Gross primary, secondary, and tertiary school enrollment (%)
Sector structureSeparate telecommunications/ICT regulatorStatus of main fixed-line telephone operatorLevel of competition (competition, partial comp., monopoly) International gateway(s) Mobile telephone service Internet serviceForeign ownership (not allowed, restricted, allowed)Reg. treatment of VoIP (banned, closed, no framework, allowed)
Sector efficiency and capacityTelecommunications revenue (% of GDP)Telecommunications investment (% of revenue)
Sector performanceAccessFixed-telephone subscriptions (per 100 people)Mobile-cellular telephone subscriptions (per 100 people)Fixed-broadband subscriptions (per 100 people)Households with a computer (%)Households with Internet access at home (%)
Usage Int’l. voice traffic, total (minutes/subscription/month)Domestic mobile traffic (minutes/subscription/month)Individuals using the Internet (%)
Quality Population covered by at least a 3G mobile network (%)International Internet bandwidth (bit/s per Internet user)
AffordabilityMobile-cellular sub-basket ($ a month)Fixed-broadband sub-basket ($ a month)Mobile-b’band, prepaid handset-based, 500 MB ($ a month)Mobile-b’band, postpaid computer-based, 1 GB ($ a month)
TradeICT goods exports (% of total goods exports)ICT goods imports (% of total goods imports)ICT service exports (% of total service exports)
ApplicationsOnline service index (0-1, 1=highest presence)Secure Internet servers (per million people)
25The Little Data Book on Information and Communication Technology 2017
Latin America & Caribbean Upper middle income
Argentina
2010 2015 2015
Uppermiddle-incomegroupCountry data
41 43 2,59491 92 64
9,240 12,460 8,1864.2 0.9 4.5
.. 98 ..99 100 81
Yes YesPrivate Private
.. ..C CC CR RA A
2.7 2.4 2.115.9 21.2 18.8
24.6 24.0 17.3141.4 143.9 105.1
10.0 16.1 15.447.0 65.1a 48.734.0a 55.5a 52.2
.. .. 2.319.5 119.2 173.145.0a 69.4a 52.1
.. 90a 6931,373 46,145 26,098
41.1 30.8 8.524.3 41.2 15.5
.. 10.0 7.719.8 16.2 11.1
0.1 0.2 15.79.0 7.4 14.4
42.6 45.1 25.7
0.41 0.55 0.3725.6 63.3 34.7

Economic and social contextPopulation (millions)Urban population (% of total)GNI per capita, World Bank Atlas method ($)GDP growth, 2005–10 and 2010–15 (avg. annual %)Adult literacy rate (% ages 15 and older) Gross primary, secondary, and tertiary school enrollment (%)
Sector structureSeparate telecommunications/ICT regulatorStatus of main fixed-line telephone operatorLevel of competition (competition, partial comp., monopoly) International gateway(s) Mobile telephone service Internet serviceForeign ownership (not allowed, restricted, allowed)Reg. treatment of VoIP (banned, closed, no framework, allowed)
Sector efficiency and capacityTelecommunications revenue (% of GDP)Telecommunications investment (% of revenue)
Sector performanceAccessFixed-telephone subscriptions (per 100 people)Mobile-cellular telephone subscriptions (per 100 people)Fixed-broadband subscriptions (per 100 people)Households with a computer (%)Households with Internet access at home (%)
Usage Int’l. voice traffic, total (minutes/subscription/month)Domestic mobile traffic (minutes/subscription/month)Individuals using the Internet (%)
Quality Population covered by at least a 3G mobile network (%)International Internet bandwidth (bit/s per Internet user)
AffordabilityMobile-cellular sub-basket ($ a month)Fixed-broadband sub-basket ($ a month)Mobile-b’band, prepaid handset-based, 500 MB ($ a month)Mobile-b’band, postpaid computer-based, 1 GB ($ a month)
TradeICT goods exports (% of total goods exports)ICT goods imports (% of total goods imports)ICT service exports (% of total service exports)
ApplicationsOnline service index (0-1, 1=highest presence)Secure Internet servers (per million people)
26 2017 The Little Data Book on Information and Communication Technology
Europe & Central Asia Lower middle income
Armenia
2010 2015 2015
Lowermiddle-incomegroupCountry data
3 3 2,92764 63 39
3,370 3,880 2,0353.3 4.4 5.4
100 100 ..78 .. 68
Yes YesMixed Private
.. CP CC CA AA A
4.4 3.3 ..29.0 22.1 ..
20.0 18.4 3.5130.4 115.1 90.5
3.2 9.6 1.920.0 64.7a 19.313.6 56.2a 24.3
23.1 17.9 7.598.9 210.1 152.025.0a 58.2a 28.6
93 100 ..14,236 67,871 10,372
8.8 7.0 6.932.4 8.4 14.312.5 8.4 5.829.0 7.3 10.0
0.8 0.3 5.74.7 3.5 7.6
13.5 11.4 48.0
0.17 0.61 0.2618.2 49.0 7.4

Economic and social contextPopulation (millions)Urban population (% of total)GNI per capita, World Bank Atlas method ($)GDP growth, 2005–10 and 2010–15 (avg. annual %)Adult literacy rate (% ages 15 and older) Gross primary, secondary, and tertiary school enrollment (%)
Sector structureSeparate telecommunications/ICT regulatorStatus of main fixed-line telephone operatorLevel of competition (competition, partial comp., monopoly) International gateway(s) Mobile telephone service Internet serviceForeign ownership (not allowed, restricted, allowed)Reg. treatment of VoIP (banned, closed, no framework, allowed)
Sector efficiency and capacityTelecommunications revenue (% of GDP)Telecommunications investment (% of revenue)
Sector performanceAccessFixed-telephone subscriptions (per 100 people)Mobile-cellular telephone subscriptions (per 100 people)Fixed-broadband subscriptions (per 100 people)Households with a computer (%)Households with Internet access at home (%)
Usage Int’l. voice traffic, total (minutes/subscription/month)Domestic mobile traffic (minutes/subscription/month)Individuals using the Internet (%)
Quality Population covered by at least a 3G mobile network (%)International Internet bandwidth (bit/s per Internet user)
AffordabilityMobile-cellular sub-basket ($ a month)Fixed-broadband sub-basket ($ a month)Mobile-b’band, prepaid handset-based, 500 MB ($ a month)Mobile-b’band, postpaid computer-based, 1 GB ($ a month)
TradeICT goods exports (% of total goods exports)ICT goods imports (% of total goods imports)ICT service exports (% of total service exports)
ApplicationsOnline service index (0-1, 1=highest presence)Secure Internet servers (per million people)
27The Little Data Book on Information and Communication Technology 2017
Latin America & Caribbean High income
Aruba
2010 2015 2015
High-incomegroupCountry data
0.10 0.10 1,18743 42 81
.. .. 41,366–3.9 .. 1.5
97 98 ..87 .. 95
.. ..
.. ..
.. ..
.. ..
.. ..
.. ..
.. ..
5.6 .. 2.515.8 .. 18.8
34.5 33.7 41.2129.7a 135.7 124.5
18.9 18.3 31.062.5 76.6a 83.263.0 .. 85.0
.. .. ..
.. .. 195.962.0a 88.7a 81.0
.. 80a 9981,283 .. 134,761
.. .. 14.2
.. .. 25.2
.. .. 10.4
.. .. 14.4
0.4 0.9 9.54.8 5.2 11.2
14.0 13.0 32.0
.. .. 0.67364.2 279.1 1,194.6

Economic and social contextPopulation (millions)Urban population (% of total)GNI per capita, World Bank Atlas method ($)GDP growth, 2005–10 and 2010–15 (avg. annual %)Adult literacy rate (% ages 15 and older) Gross primary, secondary, and tertiary school enrollment (%)
Sector structureSeparate telecommunications/ICT regulatorStatus of main fixed-line telephone operatorLevel of competition (competition, partial comp., monopoly) International gateway(s) Mobile telephone service Internet serviceForeign ownership (not allowed, restricted, allowed)Reg. treatment of VoIP (banned, closed, no framework, allowed)
Sector efficiency and capacityTelecommunications revenue (% of GDP)Telecommunications investment (% of revenue)
Sector performanceAccessFixed-telephone subscriptions (per 100 people)Mobile-cellular telephone subscriptions (per 100 people)Fixed-broadband subscriptions (per 100 people)Households with a computer (%)Households with Internet access at home (%)
Usage Int’l. voice traffic, total (minutes/subscription/month)Domestic mobile traffic (minutes/subscription/month)Individuals using the Internet (%)
Quality Population covered by at least a 3G mobile network (%)International Internet bandwidth (bit/s per Internet user)
AffordabilityMobile-cellular sub-basket ($ a month)Fixed-broadband sub-basket ($ a month)Mobile-b’band, prepaid handset-based, 500 MB ($ a month)Mobile-b’band, postpaid computer-based, 1 GB ($ a month)
TradeICT goods exports (% of total goods exports)ICT goods imports (% of total goods imports)ICT service exports (% of total service exports)
ApplicationsOnline service index (0-1, 1=highest presence)Secure Internet servers (per million people)
28 2017 The Little Data Book on Information and Communication Technology
East Asia & Pacific High income
Australia
2010 2015 2015
High-incomegroupCountry data
22 24 1,18789 89 81
46,530 60,070 41,3662.9 2.7 1.5
.. .. ..111 116 95
Yes YesMixed Mixed
P CC CC CA AA A
3.3 2.5 2.516.5 .. 18.8
47.4 38.0 41.2100.4 132.8 124.5
24.6 27.9 31.081.1a 80.4 83.274.1a 85.9 85.0
.. .. ..
.. .. 195.976.0a 84.6 81.0
99 99 9941,110 81,564 134,761
27.7 14.7 14.236.9 37.5 25.220.7 15.0 10.441.4 18.8 14.4
1.0 1.1 9.510.4 9.2 11.217.7 19.1 32.0
0.77 0.93 0.671,784.6 1,460.9 1,194.6

Economic and social contextPopulation (millions)Urban population (% of total)GNI per capita, World Bank Atlas method ($)GDP growth, 2005–10 and 2010–15 (avg. annual %)Adult literacy rate (% ages 15 and older) Gross primary, secondary, and tertiary school enrollment (%)
Sector structureSeparate telecommunications/ICT regulatorStatus of main fixed-line telephone operatorLevel of competition (competition, partial comp., monopoly) International gateway(s) Mobile telephone service Internet serviceForeign ownership (not allowed, restricted, allowed)Reg. treatment of VoIP (banned, closed, no framework, allowed)
Sector efficiency and capacityTelecommunications revenue (% of GDP)Telecommunications investment (% of revenue)
Sector performanceAccessFixed-telephone subscriptions (per 100 people)Mobile-cellular telephone subscriptions (per 100 people)Fixed-broadband subscriptions (per 100 people)Households with a computer (%)Households with Internet access at home (%)
Usage Int’l. voice traffic, total (minutes/subscription/month)Domestic mobile traffic (minutes/subscription/month)Individuals using the Internet (%)
Quality Population covered by at least a 3G mobile network (%)International Internet bandwidth (bit/s per Internet user)
AffordabilityMobile-cellular sub-basket ($ a month)Fixed-broadband sub-basket ($ a month)Mobile-b’band, prepaid handset-based, 500 MB ($ a month)Mobile-b’band, postpaid computer-based, 1 GB ($ a month)
TradeICT goods exports (% of total goods exports)ICT goods imports (% of total goods imports)ICT service exports (% of total service exports)
ApplicationsOnline service index (0-1, 1=highest presence)Secure Internet servers (per million people)
29The Little Data Book on Information and Communication Technology 2017
Europe & Central Asia High income
Austria
2010 2015 2015
High-incomegroupCountry data
8 9 1,18766 66 81
49,350 47,120 41,3661.1 0.9 1.5
.. .. ..94 95 95
Yes YesMixed Mixed
C CC CC CA RA No
1.6 1.1 2.514.6 15.3 18.8
40.4 42.2 41.2145.7 157.4 124.5
24.4 28.6 31.076.2 82.1 83.272.9 82.4 85.0
16.6 15.6 ..149.5 131.4 195.9
75.2 83.9 81.0
96 98a 9939,584 90,501 134,761
13.9 6.7 14.239.3 23.5 25.2
5.1 5.5 10.45.1 6.5 14.4
3.9 4.3 9.55.8 5.3 11.2
25.0 31.5 32.0
0.48 0.75 0.67858.7 1,500.5 1,194.6

Economic and social contextPopulation (millions)Urban population (% of total)GNI per capita, World Bank Atlas method ($)GDP growth, 2005–10 and 2010–15 (avg. annual %)Adult literacy rate (% ages 15 and older) Gross primary, secondary, and tertiary school enrollment (%)
Sector structureSeparate telecommunications/ICT regulatorStatus of main fixed-line telephone operatorLevel of competition (competition, partial comp., monopoly) International gateway(s) Mobile telephone service Internet serviceForeign ownership (not allowed, restricted, allowed)Reg. treatment of VoIP (banned, closed, no framework, allowed)
Sector efficiency and capacityTelecommunications revenue (% of GDP)Telecommunications investment (% of revenue)
Sector performanceAccessFixed-telephone subscriptions (per 100 people)Mobile-cellular telephone subscriptions (per 100 people)Fixed-broadband subscriptions (per 100 people)Households with a computer (%)Households with Internet access at home (%)
Usage Int’l. voice traffic, total (minutes/subscription/month)Domestic mobile traffic (minutes/subscription/month)Individuals using the Internet (%)
Quality Population covered by at least a 3G mobile network (%)International Internet bandwidth (bit/s per Internet user)
AffordabilityMobile-cellular sub-basket ($ a month)Fixed-broadband sub-basket ($ a month)Mobile-b’band, prepaid handset-based, 500 MB ($ a month)Mobile-b’band, postpaid computer-based, 1 GB ($ a month)
TradeICT goods exports (% of total goods exports)ICT goods imports (% of total goods imports)ICT service exports (% of total service exports)
ApplicationsOnline service index (0-1, 1=highest presence)Secure Internet servers (per million people)
30 2017 The Little Data Book on Information and Communication Technology
Europe & Central Asia Upper middle income
Azerbaijan
2010 2015 2015
Uppermiddle-incomegroupCountry data
9 10 2,59453 55 64
5,370 6,560 8,18615.8 2.6 4.5100 100 ..
70 75 81
No NoPublic Public
M CP CC CR AA C
2.6 2.9 2.118.3 18.0 18.8
16.6 18.7 17.3100.1 111.3 105.1
5.2 19.8 15.430.3 62.4 48.737.4a 76.7 52.2
6.7 5.4 2.379.2 155.2 173.146.0 77.0 52.1
69 97 699,083 35,127 26,098
7.3 8.0 8.512.5 9.8 15.5
5.1 3.9 7.711.5 6.8 11.1
0.0 0.0 15.73.5 3.0 14.4
20.1 10.7 25.7
0.32 0.43 0.375.1 16.4 34.7

Economic and social contextPopulation (millions)Urban population (% of total)GNI per capita, World Bank Atlas method ($)GDP growth, 2005–10 and 2010–15 (avg. annual %)Adult literacy rate (% ages 15 and older) Gross primary, secondary, and tertiary school enrollment (%)
Sector structureSeparate telecommunications/ICT regulatorStatus of main fixed-line telephone operatorLevel of competition (competition, partial comp., monopoly) International gateway(s) Mobile telephone service Internet serviceForeign ownership (not allowed, restricted, allowed)Reg. treatment of VoIP (banned, closed, no framework, allowed)
Sector efficiency and capacityTelecommunications revenue (% of GDP)Telecommunications investment (% of revenue)
Sector performanceAccessFixed-telephone subscriptions (per 100 people)Mobile-cellular telephone subscriptions (per 100 people)Fixed-broadband subscriptions (per 100 people)Households with a computer (%)Households with Internet access at home (%)
Usage Int’l. voice traffic, total (minutes/subscription/month)Domestic mobile traffic (minutes/subscription/month)Individuals using the Internet (%)
Quality Population covered by at least a 3G mobile network (%)International Internet bandwidth (bit/s per Internet user)
AffordabilityMobile-cellular sub-basket ($ a month)Fixed-broadband sub-basket ($ a month)Mobile-b’band, prepaid handset-based, 500 MB ($ a month)Mobile-b’band, postpaid computer-based, 1 GB ($ a month)
TradeICT goods exports (% of total goods exports)ICT goods imports (% of total goods imports)ICT service exports (% of total service exports)
ApplicationsOnline service index (0-1, 1=highest presence)Secure Internet servers (per million people)
31The Little Data Book on Information and Communication Technology 2017
Latin America & Caribbean High income
Bahamas, The
2010 2015 2015
High-incomegroupCountry data
0.36 0.39 1,18783 83 81
21,660 21,310 41,366–0.7 1.0 1.5
.. .. ..
.. .. 95
Yes YesPublic Mixed
C CM ..C CA R
No A
.. 7.6 2.5
.. 8.4 18.8
35.9 31.2 41.2118.8 80.3 124.5
6.9 20.9 31.0.. 69.2a 83.2.. 61.1a 85.0
.. 25.3 ..
.. 12.9 195.943.0a 78.0a 81.0
.. 98 994,000 225,877 134,761
17.5 17.5 14.230.0 30.0 25.2
.. 21.5 10.4
.. 26.9 14.4
0.2 0.6 9.52.8 3.0 11.2
.. .. 32.0
0.23 0.34 0.67352.0 337.6 1,194.6

Economic and social contextPopulation (millions)Urban population (% of total)GNI per capita, World Bank Atlas method ($)GDP growth, 2005–10 and 2010–15 (avg. annual %)Adult literacy rate (% ages 15 and older) Gross primary, secondary, and tertiary school enrollment (%)
Sector structureSeparate telecommunications/ICT regulatorStatus of main fixed-line telephone operatorLevel of competition (competition, partial comp., monopoly) International gateway(s) Mobile telephone service Internet serviceForeign ownership (not allowed, restricted, allowed)Reg. treatment of VoIP (banned, closed, no framework, allowed)
Sector efficiency and capacityTelecommunications revenue (% of GDP)Telecommunications investment (% of revenue)
Sector performanceAccessFixed-telephone subscriptions (per 100 people)Mobile-cellular telephone subscriptions (per 100 people)Fixed-broadband subscriptions (per 100 people)Households with a computer (%)Households with Internet access at home (%)
Usage Int’l. voice traffic, total (minutes/subscription/month)Domestic mobile traffic (minutes/subscription/month)Individuals using the Internet (%)
Quality Population covered by at least a 3G mobile network (%)International Internet bandwidth (bit/s per Internet user)
AffordabilityMobile-cellular sub-basket ($ a month)Fixed-broadband sub-basket ($ a month)Mobile-b’band, prepaid handset-based, 500 MB ($ a month)Mobile-b’band, postpaid computer-based, 1 GB ($ a month)
TradeICT goods exports (% of total goods exports)ICT goods imports (% of total goods imports)ICT service exports (% of total service exports)
ApplicationsOnline service index (0-1, 1=highest presence)Secure Internet servers (per million people)
32 2017 The Little Data Book on Information and Communication Technology
Middle East & North Africa High income
Bahrain
2010 2015 2015
High-incomegroupCountry data
1 1 1,18789 89 81
18,660 20,350 41,3665.6 3.9 1.595 96 ..
.. .. 95
Yes YesMixed Mixed
C CP PC CA AA A
3.7 3.4 2.551.0 11.1 18.8
18.2 20.5 41.2125.2 185.3 124.5
12.4 18.6 31.087.0 94.8 83.274.0 88.7 85.0
107.8 116.5 ..191.5 228.5 195.9
55.0 93.5 81.0
100 98 9914,528 47,205 134,761
15.0 11.1 14.226.6 13.3 25.2
6.7 8.0 10.413.3 18.6 14.4
0.3 1.7 9.52.8 3.8 11.2
23.1 21.6 32.0
0.73 0.94 0.6797.5 187.3 1,194.6

Economic and social contextPopulation (millions)Urban population (% of total)GNI per capita, World Bank Atlas method ($)GDP growth, 2005–10 and 2010–15 (avg. annual %)Adult literacy rate (% ages 15 and older) Gross primary, secondary, and tertiary school enrollment (%)
Sector structureSeparate telecommunications/ICT regulatorStatus of main fixed-line telephone operatorLevel of competition (competition, partial comp., monopoly) International gateway(s) Mobile telephone service Internet serviceForeign ownership (not allowed, restricted, allowed)Reg. treatment of VoIP (banned, closed, no framework, allowed)
Sector efficiency and capacityTelecommunications revenue (% of GDP)Telecommunications investment (% of revenue)
Sector performanceAccessFixed-telephone subscriptions (per 100 people)Mobile-cellular telephone subscriptions (per 100 people)Fixed-broadband subscriptions (per 100 people)Households with a computer (%)Households with Internet access at home (%)
Usage Int’l. voice traffic, total (minutes/subscription/month)Domestic mobile traffic (minutes/subscription/month)Individuals using the Internet (%)
Quality Population covered by at least a 3G mobile network (%)International Internet bandwidth (bit/s per Internet user)
AffordabilityMobile-cellular sub-basket ($ a month)Fixed-broadband sub-basket ($ a month)Mobile-b’band, prepaid handset-based, 500 MB ($ a month)Mobile-b’band, postpaid computer-based, 1 GB ($ a month)
TradeICT goods exports (% of total goods exports)ICT goods imports (% of total goods imports)ICT service exports (% of total service exports)
ApplicationsOnline service index (0-1, 1=highest presence)Secure Internet servers (per million people)
33The Little Data Book on Information and Communication Technology 2017
South Asia Lower middle income
Bangladesh
2010 2015 2015
Lowermiddle-incomegroupCountry data
152 161 2,92730 34 39
780 1,190 2,0356.1 6.3 5.4
.. 61 ..59 .. 68
Yes YesPublic Public
M PC PC CA RA A
5.7 1.9 ..4.0 29.3 ..
0.8 0.5 3.544.9 83.4 90.5
0.3 2.4 1.93.0 8.2a 19.31.4 11.0a 24.3
20.9 23.6 7.5152.2 160.5 152.0
3.7a 14.4a 28.6
1 71 ..1,431 6,181 10,372
2.3 1.5 6.98.3 4.4 14.37.0 2.8 5.88.4 4.1 10.0
0.0 .. 5.74.0 .. 7.6
36.2 28.3 48.0
0.36 0.35 0.260.3 1.3 7.4

Economic and social contextPopulation (millions)Urban population (% of total)GNI per capita, World Bank Atlas method ($)GDP growth, 2005–10 and 2010–15 (avg. annual %)Adult literacy rate (% ages 15 and older) Gross primary, secondary, and tertiary school enrollment (%)
Sector structureSeparate telecommunications/ICT regulatorStatus of main fixed-line telephone operatorLevel of competition (competition, partial comp., monopoly) International gateway(s) Mobile telephone service Internet serviceForeign ownership (not allowed, restricted, allowed)Reg. treatment of VoIP (banned, closed, no framework, allowed)
Sector efficiency and capacityTelecommunications revenue (% of GDP)Telecommunications investment (% of revenue)
Sector performanceAccessFixed-telephone subscriptions (per 100 people)Mobile-cellular telephone subscriptions (per 100 people)Fixed-broadband subscriptions (per 100 people)Households with a computer (%)Households with Internet access at home (%)
Usage Int’l. voice traffic, total (minutes/subscription/month)Domestic mobile traffic (minutes/subscription/month)Individuals using the Internet (%)
Quality Population covered by at least a 3G mobile network (%)International Internet bandwidth (bit/s per Internet user)
AffordabilityMobile-cellular sub-basket ($ a month)Fixed-broadband sub-basket ($ a month)Mobile-b’band, prepaid handset-based, 500 MB ($ a month)Mobile-b’band, postpaid computer-based, 1 GB ($ a month)
TradeICT goods exports (% of total goods exports)ICT goods imports (% of total goods imports)ICT service exports (% of total service exports)
ApplicationsOnline service index (0-1, 1=highest presence)Secure Internet servers (per million people)
34 2017 The Little Data Book on Information and Communication Technology
Latin America & Caribbean High income
Barbados
2010 2015 2015
High-incomegroupCountry data
0.28 0.28 1,18732 31 81
15,860 14,800 41,3660.4 0.3 1.5
.. .. ..97 .. 95
Yes YesMixed Mixed
.. ..P C.. CR RA A
.. 5.0 2.5
.. 12.1 18.8
49.0 54.6 41.2124.8 116.5 124.5
20.0 27.2 31.056.0 70.8a 83.246.9 62.9a 85.0
.. 22.9 ..
.. 115.0 195.965.1a 76.1a 81.0
20 98 9921,694 247,474 134,761
20.0 28.1 14.238.8 30.0 25.218.5 20.0 10.418.0 18.0 14.4
1.5 0.8 9.56.1 5.4 11.2
25.9 18.5 32.0
0.20 0.22 0.67321.9 457.4 1,194.6
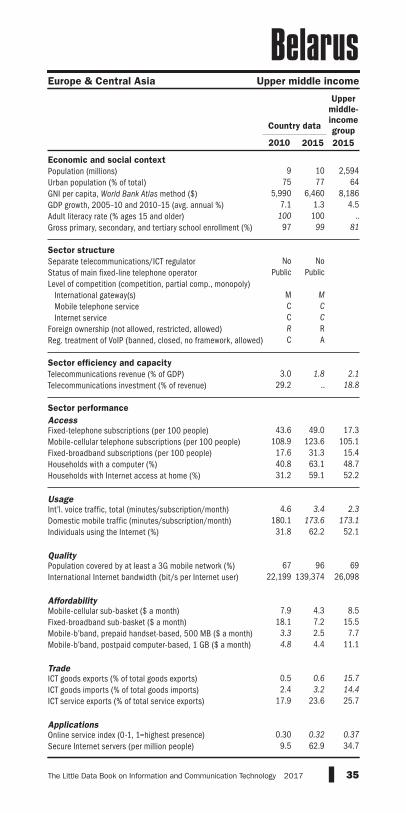
Economic and social contextPopulation (millions)Urban population (% of total)GNI per capita, World Bank Atlas method ($)GDP growth, 2005–10 and 2010–15 (avg. annual %)Adult literacy rate (% ages 15 and older) Gross primary, secondary, and tertiary school enrollment (%)
Sector structureSeparate telecommunications/ICT regulatorStatus of main fixed-line telephone operatorLevel of competition (competition, partial comp., monopoly) International gateway(s) Mobile telephone service Internet serviceForeign ownership (not allowed, restricted, allowed)Reg. treatment of VoIP (banned, closed, no framework, allowed)
Sector efficiency and capacityTelecommunications revenue (% of GDP)Telecommunications investment (% of revenue)
Sector performanceAccessFixed-telephone subscriptions (per 100 people)Mobile-cellular telephone subscriptions (per 100 people)Fixed-broadband subscriptions (per 100 people)Households with a computer (%)Households with Internet access at home (%)
Usage Int’l. voice traffic, total (minutes/subscription/month)Domestic mobile traffic (minutes/subscription/month)Individuals using the Internet (%)
Quality Population covered by at least a 3G mobile network (%)International Internet bandwidth (bit/s per Internet user)
AffordabilityMobile-cellular sub-basket ($ a month)Fixed-broadband sub-basket ($ a month)Mobile-b’band, prepaid handset-based, 500 MB ($ a month)Mobile-b’band, postpaid computer-based, 1 GB ($ a month)
TradeICT goods exports (% of total goods exports)ICT goods imports (% of total goods imports)ICT service exports (% of total service exports)
ApplicationsOnline service index (0-1, 1=highest presence)Secure Internet servers (per million people)
35The Little Data Book on Information and Communication Technology 2017
Europe & Central Asia Upper middle income
Belarus
2010 2015 2015
Uppermiddle-incomegroupCountry data
9 10 2,59475 77 64
5,990 6,460 8,1867.1 1.3 4.5
100 100 ..97 99 81
No NoPublic Public
M MC CC CR RC A
3.0 1.8 2.129.2 .. 18.8
43.6 49.0 17.3108.9 123.6 105.1
17.6 31.3 15.440.8 63.1 48.731.2 59.1 52.2
4.6 3.4 2.3180.1 173.6 173.1
31.8 62.2 52.1
67 96 6922,199 139,374 26,098
7.9 4.3 8.518.1 7.2 15.5
3.3 2.5 7.74.8 4.4 11.1
0.5 0.6 15.72.4 3.2 14.4
17.9 23.6 25.7
0.30 0.32 0.379.5 62.9 34.7

Economic and social contextPopulation (millions)Urban population (% of total)GNI per capita, World Bank Atlas method ($)GDP growth, 2005–10 and 2010–15 (avg. annual %)Adult literacy rate (% ages 15 and older) Gross primary, secondary, and tertiary school enrollment (%)
Sector structureSeparate telecommunications/ICT regulatorStatus of main fixed-line telephone operatorLevel of competition (competition, partial comp., monopoly) International gateway(s) Mobile telephone service Internet serviceForeign ownership (not allowed, restricted, allowed)Reg. treatment of VoIP (banned, closed, no framework, allowed)
Sector efficiency and capacityTelecommunications revenue (% of GDP)Telecommunications investment (% of revenue)
Sector performanceAccessFixed-telephone subscriptions (per 100 people)Mobile-cellular telephone subscriptions (per 100 people)Fixed-broadband subscriptions (per 100 people)Households with a computer (%)Households with Internet access at home (%)
Usage Int’l. voice traffic, total (minutes/subscription/month)Domestic mobile traffic (minutes/subscription/month)Individuals using the Internet (%)
Quality Population covered by at least a 3G mobile network (%)International Internet bandwidth (bit/s per Internet user)
AffordabilityMobile-cellular sub-basket ($ a month)Fixed-broadband sub-basket ($ a month)Mobile-b’band, prepaid handset-based, 500 MB ($ a month)Mobile-b’band, postpaid computer-based, 1 GB ($ a month)
TradeICT goods exports (% of total goods exports)ICT goods imports (% of total goods imports)ICT service exports (% of total service exports)
ApplicationsOnline service index (0-1, 1=highest presence)Secure Internet servers (per million people)
36 2017 The Little Data Book on Information and Communication Technology
Europe & Central Asia High income
Belgium
2010 2015 2015
High-incomegroupCountry data
11 11 1,18798 98 81
47,810 44,360 41,3661.2 0.8 1.5
.. .. ..94 119 95
Yes YesMixed Mixed
C CC CC CA AA No
2.2 1.5 2.514.2 24.4 18.8
42.4 40.1 41.2111.1 115.7 124.5
30.8 36.8 31.076.7 82.1 83.272.7 81.8 85.0
.. .. ..90.9 93.7 195.975.0 85.1 81.0
97 100 99109,676 241,805 134,761
40.2 28.5 14.224.8 30.5 25.225.7 11.1 10.425.7 20.9 14.4
2.3 1.8 9.53.5 2.9 11.2
37.6 47.2 32.0
0.63 0.68 0.67489.1 976.9 1,194.6
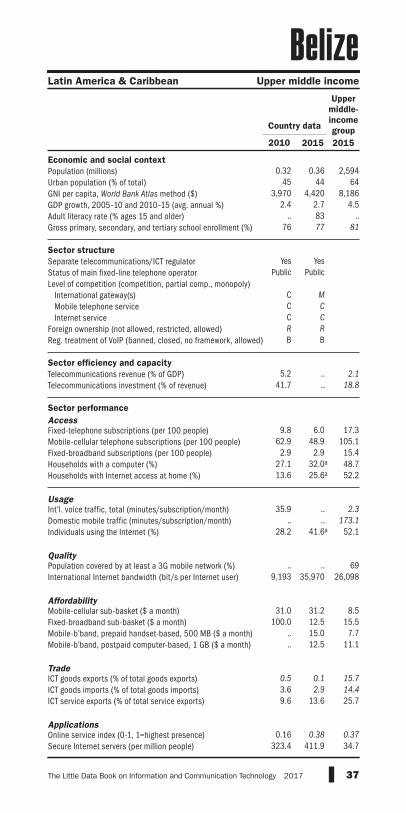
Economic and social contextPopulation (millions)Urban population (% of total)GNI per capita, World Bank Atlas method ($)GDP growth, 2005–10 and 2010–15 (avg. annual %)Adult literacy rate (% ages 15 and older) Gross primary, secondary, and tertiary school enrollment (%)
Sector structureSeparate telecommunications/ICT regulatorStatus of main fixed-line telephone operatorLevel of competition (competition, partial comp., monopoly) International gateway(s) Mobile telephone service Internet serviceForeign ownership (not allowed, restricted, allowed)Reg. treatment of VoIP (banned, closed, no framework, allowed)
Sector efficiency and capacityTelecommunications revenue (% of GDP)Telecommunications investment (% of revenue)
Sector performanceAccessFixed-telephone subscriptions (per 100 people)Mobile-cellular telephone subscriptions (per 100 people)Fixed-broadband subscriptions (per 100 people)Households with a computer (%)Households with Internet access at home (%)
Usage Int’l. voice traffic, total (minutes/subscription/month)Domestic mobile traffic (minutes/subscription/month)Individuals using the Internet (%)
Quality Population covered by at least a 3G mobile network (%)International Internet bandwidth (bit/s per Internet user)
AffordabilityMobile-cellular sub-basket ($ a month)Fixed-broadband sub-basket ($ a month)Mobile-b’band, prepaid handset-based, 500 MB ($ a month)Mobile-b’band, postpaid computer-based, 1 GB ($ a month)
TradeICT goods exports (% of total goods exports)ICT goods imports (% of total goods imports)ICT service exports (% of total service exports)
ApplicationsOnline service index (0-1, 1=highest presence)Secure Internet servers (per million people)
37The Little Data Book on Information and Communication Technology 2017
Latin America & Caribbean Upper middle income
Belize
2010 2015 2015
Uppermiddle-incomegroupCountry data
0.32 0.36 2,59445 44 64
3,970 4,420 8,1862.4 2.7 4.5
.. 83 ..76 77 81
Yes YesPublic Public
C MC CC CR RB B
5.2 .. 2.141.7 .. 18.8
9.8 6.0 17.362.9 48.9 105.1
2.9 2.9 15.427.1 32.0a 48.713.6 25.6a 52.2
35.9 .. 2.3.. .. 173.1
28.2 41.6a 52.1
.. .. 699,193 35,970 26,098
31.0 31.2 8.5100.0 12.5 15.5
.. 15.0 7.7
.. 12.5 11.1
0.5 0.1 15.73.6 2.9 14.49.6 13.6 25.7
0.16 0.38 0.37323.4 411.9 34.7

Economic and social contextPopulation (millions)Urban population (% of total)GNI per capita, World Bank Atlas method ($)GDP growth, 2005–10 and 2010–15 (avg. annual %)Adult literacy rate (% ages 15 and older) Gross primary, secondary, and tertiary school enrollment (%)
Sector structureSeparate telecommunications/ICT regulatorStatus of main fixed-line telephone operatorLevel of competition (competition, partial comp., monopoly) International gateway(s) Mobile telephone service Internet serviceForeign ownership (not allowed, restricted, allowed)Reg. treatment of VoIP (banned, closed, no framework, allowed)
Sector efficiency and capacityTelecommunications revenue (% of GDP)Telecommunications investment (% of revenue)
Sector performanceAccessFixed-telephone subscriptions (per 100 people)Mobile-cellular telephone subscriptions (per 100 people)Fixed-broadband subscriptions (per 100 people)Households with a computer (%)Households with Internet access at home (%)
Usage Int’l. voice traffic, total (minutes/subscription/month)Domestic mobile traffic (minutes/subscription/month)Individuals using the Internet (%)
Quality Population covered by at least a 3G mobile network (%)International Internet bandwidth (bit/s per Internet user)
AffordabilityMobile-cellular sub-basket ($ a month)Fixed-broadband sub-basket ($ a month)Mobile-b’band, prepaid handset-based, 500 MB ($ a month)Mobile-b’band, postpaid computer-based, 1 GB ($ a month)
TradeICT goods exports (% of total goods exports)ICT goods imports (% of total goods imports)ICT service exports (% of total service exports)
ApplicationsOnline service index (0-1, 1=highest presence)Secure Internet servers (per million people)
38 2017 The Little Data Book on Information and Communication Technology
Sub-Saharan Africa Low income
Benin
2010 2015 2015
Low-incomegroupCountry data
10 11 63842 44 31
760 860 6204.0 5.5 5.429 38 ..68 73 60
Yes YesPublic Public
P MC CP CA ..B C
5.7 5.3 ..23.3 16.9 ..
1.4 1.8 0.974.4 85.6 60.0
0.3 0.7 0.32.0 5.1a 4.81.2a 5.4a 7.1
6.5 7.2 ..32.6 40.9 48.9
3.1 6.8a 9.5
0 45 512,090 3,002 4,245
15.5 8.5 9.450.1 42.3 33.6
9.8 7.6 8.029.4 14.0 10.8
0.0 0.2 ..1.9 1.1 3.4
23.0 18.8 ..
0.12 0.11 0.110.1 3.9 1.5

Economic and social contextPopulation (millions)Urban population (% of total)GNI per capita, World Bank Atlas method ($)GDP growth, 2005–10 and 2010–15 (avg. annual %)Adult literacy rate (% ages 15 and older) Gross primary, secondary, and tertiary school enrollment (%)
Sector structureSeparate telecommunications/ICT regulatorStatus of main fixed-line telephone operatorLevel of competition (competition, partial comp., monopoly) International gateway(s) Mobile telephone service Internet serviceForeign ownership (not allowed, restricted, allowed)Reg. treatment of VoIP (banned, closed, no framework, allowed)
Sector efficiency and capacityTelecommunications revenue (% of GDP)Telecommunications investment (% of revenue)
Sector performanceAccessFixed-telephone subscriptions (per 100 people)Mobile-cellular telephone subscriptions (per 100 people)Fixed-broadband subscriptions (per 100 people)Households with a computer (%)Households with Internet access at home (%)
Usage Int’l. voice traffic, total (minutes/subscription/month)Domestic mobile traffic (minutes/subscription/month)Individuals using the Internet (%)
Quality Population covered by at least a 3G mobile network (%)International Internet bandwidth (bit/s per Internet user)
AffordabilityMobile-cellular sub-basket ($ a month)Fixed-broadband sub-basket ($ a month)Mobile-b’band, prepaid handset-based, 500 MB ($ a month)Mobile-b’band, postpaid computer-based, 1 GB ($ a month)
TradeICT goods exports (% of total goods exports)ICT goods imports (% of total goods imports)ICT service exports (% of total service exports)
ApplicationsOnline service index (0-1, 1=highest presence)Secure Internet servers (per million people)
39The Little Data Book on Information and Communication Technology 2017
North America High income
Bermuda
2010 2015 2015
High-incomegroupCountry data
0.07 0.07 1,187100 100 81
110,440 106,140 41,3660.3 –3.7 1.5
.. .. ..69 65 95
.. ..
.. ..
.. ..
.. ..
.. ..
.. ..
.. ..
.. .. 2.5
.. .. 18.8
89.0 18.3 41.2135.8 57.9 124.5
61.7 45.7 31.090.0 94.7a 83.268.4a 94.8a 85.0
.. .. ..
.. .. 195.984.2a 98.3a 81.0
.. 99a 99
.. .. 134,761
.. .. 14.2
.. .. 25.2
.. .. 10.4
.. .. 14.4
6.6 12.6 9.53.4 3.3 11.2
42.0 38.9 32.0
.. .. 0.675,850.4 7,204.7 1,194.6

Economic and social contextPopulation (millions)Urban population (% of total)GNI per capita, World Bank Atlas method ($)GDP growth, 2005–10 and 2010–15 (avg. annual %)Adult literacy rate (% ages 15 and older) Gross primary, secondary, and tertiary school enrollment (%)
Sector structureSeparate telecommunications/ICT regulatorStatus of main fixed-line telephone operatorLevel of competition (competition, partial comp., monopoly) International gateway(s) Mobile telephone service Internet serviceForeign ownership (not allowed, restricted, allowed)Reg. treatment of VoIP (banned, closed, no framework, allowed)
Sector efficiency and capacityTelecommunications revenue (% of GDP)Telecommunications investment (% of revenue)
Sector performanceAccessFixed-telephone subscriptions (per 100 people)Mobile-cellular telephone subscriptions (per 100 people)Fixed-broadband subscriptions (per 100 people)Households with a computer (%)Households with Internet access at home (%)
Usage Int’l. voice traffic, total (minutes/subscription/month)Domestic mobile traffic (minutes/subscription/month)Individuals using the Internet (%)
Quality Population covered by at least a 3G mobile network (%)International Internet bandwidth (bit/s per Internet user)
AffordabilityMobile-cellular sub-basket ($ a month)Fixed-broadband sub-basket ($ a month)Mobile-b’band, prepaid handset-based, 500 MB ($ a month)Mobile-b’band, postpaid computer-based, 1 GB ($ a month)
TradeICT goods exports (% of total goods exports)ICT goods imports (% of total goods imports)ICT service exports (% of total service exports)
ApplicationsOnline service index (0-1, 1=highest presence)Secure Internet servers (per million people)
40 2017 The Little Data Book on Information and Communication Technology
South Asia Lower middle income
Bhutan
2010 2015 2015
Lowermiddle-incomegroupCountry data
0.72 0.77 2,92735 39 39
1,990 2,370 2,0359.4 4.5 5.457 64 ..65 68 68
Yes YesPublic Public
C CC CC CR R
No A
2.4 2.3 ..21.1 42.2 ..
3.7 2.8 3.555.0 87.1 90.5
1.2 3.6 1.98.9a 24.6a 19.36.0a 31.7a 24.3
.. .. 7.544.6 15.2 152.013.6 39.8a 28.6
15 80 ..1,590 11,220 10,372
4.5 2.6 6.910.5 8.2 14.3
2.8 1.7 5.85.6 4.8 10.0
11.3 .. 5.72.5 .. 7.63.9 0.3 48.0
0.19 0.24 0.264.2 16.8 7.4

Economic and social contextPopulation (millions)Urban population (% of total)GNI per capita, World Bank Atlas method ($)GDP growth, 2005–10 and 2010–15 (avg. annual %)Adult literacy rate (% ages 15 and older) Gross primary, secondary, and tertiary school enrollment (%)
Sector structureSeparate telecommunications/ICT regulatorStatus of main fixed-line telephone operatorLevel of competition (competition, partial comp., monopoly) International gateway(s) Mobile telephone service Internet serviceForeign ownership (not allowed, restricted, allowed)Reg. treatment of VoIP (banned, closed, no framework, allowed)
Sector efficiency and capacityTelecommunications revenue (% of GDP)Telecommunications investment (% of revenue)
Sector performanceAccessFixed-telephone subscriptions (per 100 people)Mobile-cellular telephone subscriptions (per 100 people)Fixed-broadband subscriptions (per 100 people)Households with a computer (%)Households with Internet access at home (%)
Usage Int’l. voice traffic, total (minutes/subscription/month)Domestic mobile traffic (minutes/subscription/month)Individuals using the Internet (%)
Quality Population covered by at least a 3G mobile network (%)International Internet bandwidth (bit/s per Internet user)
AffordabilityMobile-cellular sub-basket ($ a month)Fixed-broadband sub-basket ($ a month)Mobile-b’band, prepaid handset-based, 500 MB ($ a month)Mobile-b’band, postpaid computer-based, 1 GB ($ a month)
TradeICT goods exports (% of total goods exports)ICT goods imports (% of total goods imports)ICT service exports (% of total service exports)
ApplicationsOnline service index (0-1, 1=highest presence)Secure Internet servers (per million people)
41The Little Data Book on Information and Communication Technology 2017
Latin America & Caribbean Lower middle income
Bolivia
2010 2015 2015
Lowermiddle-incomegroupCountry data
10 11 2,92766 69 39
1,810 3,080 2,0354.7 5.5 5.492 95 ..
.. .. 68
Yes YesPublic Public
.. ..C CC C
No ..A A
8.2 4.2 ..16.7 33.2 ..
8.4 8.0 3.570.7 92.2 90.5
0.9 1.6 1.922.8a 33.1a 19.3
6.0a 23.8a 24.3
8.8 4.1 7.536.0 35.2 152.022.4a 45.1a 28.6
2 27 ..3,728 19,673 10,372
11.3 10.7 6.935.0 14.3 14.310.9 5.8 5.817.2 7.2 10.0
0.0 .. 5.73.5 3.7 7.6
11.1 8.5 48.0
0.30 0.39 0.268.0 15.8 7.4

Economic and social contextPopulation (millions)Urban population (% of total)GNI per capita, World Bank Atlas method ($)GDP growth, 2005–10 and 2010–15 (avg. annual %)Adult literacy rate (% ages 15 and older) Gross primary, secondary, and tertiary school enrollment (%)
Sector structureSeparate telecommunications/ICT regulatorStatus of main fixed-line telephone operatorLevel of competition (competition, partial comp., monopoly) International gateway(s) Mobile telephone service Internet serviceForeign ownership (not allowed, restricted, allowed)Reg. treatment of VoIP (banned, closed, no framework, allowed)
Sector efficiency and capacityTelecommunications revenue (% of GDP)Telecommunications investment (% of revenue)
Sector performanceAccessFixed-telephone subscriptions (per 100 people)Mobile-cellular telephone subscriptions (per 100 people)Fixed-broadband subscriptions (per 100 people)Households with a computer (%)Households with Internet access at home (%)
Usage Int’l. voice traffic, total (minutes/subscription/month)Domestic mobile traffic (minutes/subscription/month)Individuals using the Internet (%)
Quality Population covered by at least a 3G mobile network (%)International Internet bandwidth (bit/s per Internet user)
AffordabilityMobile-cellular sub-basket ($ a month)Fixed-broadband sub-basket ($ a month)Mobile-b’band, prepaid handset-based, 500 MB ($ a month)Mobile-b’band, postpaid computer-based, 1 GB ($ a month)
TradeICT goods exports (% of total goods exports)ICT goods imports (% of total goods imports)ICT service exports (% of total service exports)
ApplicationsOnline service index (0-1, 1=highest presence)Secure Internet servers (per million people)
42 2017 The Little Data Book on Information and Communication Technology
Europe & Central Asia Upper middle income
Bosnia and Herzegovina
2010 2015 2015
Uppermiddle-incomegroupCountry data
4 4 2,59439 40 64
4,780 4,680 8,1862.9 1.2 4.5
.. 98 ..73 78 81
Yes YesMixed Mixed
.. ..C PC CA A
No A
4.1 5.3 2.123.8 18.7 18.8
26.0 20.2 17.380.9 90.2 105.110.2 16.6 15.433.7a 47.1a 48.723.0a 53.6a 52.2
20.1 16.7 2.345.2 60.7 173.142.8a 65.1a 52.1
60 96 6918,612 56,331 26,098
15.4 12.6 8.513.4 6.6 15.549.3 5.7 7.715.4 6.6 11.1
0.1 0.2 15.72.9 2.9 14.47.4 7.7 25.7
0.28 0.28 0.3715.6 42.8 34.7

Economic and social contextPopulation (millions)Urban population (% of total)GNI per capita, World Bank Atlas method ($)GDP growth, 2005–10 and 2010–15 (avg. annual %)Adult literacy rate (% ages 15 and older) Gross primary, secondary, and tertiary school enrollment (%)
Sector structureSeparate telecommunications/ICT regulatorStatus of main fixed-line telephone operatorLevel of competition (competition, partial comp., monopoly) International gateway(s) Mobile telephone service Internet serviceForeign ownership (not allowed, restricted, allowed)Reg. treatment of VoIP (banned, closed, no framework, allowed)
Sector efficiency and capacityTelecommunications revenue (% of GDP)Telecommunications investment (% of revenue)
Sector performanceAccessFixed-telephone subscriptions (per 100 people)Mobile-cellular telephone subscriptions (per 100 people)Fixed-broadband subscriptions (per 100 people)Households with a computer (%)Households with Internet access at home (%)
Usage Int’l. voice traffic, total (minutes/subscription/month)Domestic mobile traffic (minutes/subscription/month)Individuals using the Internet (%)
Quality Population covered by at least a 3G mobile network (%)International Internet bandwidth (bit/s per Internet user)
AffordabilityMobile-cellular sub-basket ($ a month)Fixed-broadband sub-basket ($ a month)Mobile-b’band, prepaid handset-based, 500 MB ($ a month)Mobile-b’band, postpaid computer-based, 1 GB ($ a month)
TradeICT goods exports (% of total goods exports)ICT goods imports (% of total goods imports)ICT service exports (% of total service exports)
ApplicationsOnline service index (0-1, 1=highest presence)Secure Internet servers (per million people)
43The Little Data Book on Information and Communication Technology 2017
Sub-Saharan Africa Upper middle income
Botswana
2010 2015 2015
Uppermiddle-incomegroupCountry data
2 2 2,59456 57 64
5,480 6,510 8,1864.0 5.1 4.5
.. 88 ..74 77 81
Yes YesPublic Public
C PC PC CA AA A
3.7 .. 2.121.0 .. 18.8
7.0 7.8 17.3120.0 169.0 105.1
0.6 1.8 15.49.2a 16.0a 48.76.1a 19.6a 52.2
.. .. 2.322.8 67.7 173.1
6.0 27.5a 52.1
40 92 696,559 11,379 26,098
14.7 8.8 8.529.7 28.6 15.550.5 14.7 7.778.7 66.4 11.1
0.3 0.1 15.73.1 2.6 14.4
12.1 12.3 25.7
0.20 0.31 0.378.3 17.2 34.7

Economic and social contextPopulation (millions)Urban population (% of total)GNI per capita, World Bank Atlas method ($)GDP growth, 2005–10 and 2010–15 (avg. annual %)Adult literacy rate (% ages 15 and older) Gross primary, secondary, and tertiary school enrollment (%)
Sector structureSeparate telecommunications/ICT regulatorStatus of main fixed-line telephone operatorLevel of competition (competition, partial comp., monopoly) International gateway(s) Mobile telephone service Internet serviceForeign ownership (not allowed, restricted, allowed)Reg. treatment of VoIP (banned, closed, no framework, allowed)
Sector efficiency and capacityTelecommunications revenue (% of GDP)Telecommunications investment (% of revenue)
Sector performanceAccessFixed-telephone subscriptions (per 100 people)Mobile-cellular telephone subscriptions (per 100 people)Fixed-broadband subscriptions (per 100 people)Households with a computer (%)Households with Internet access at home (%)
Usage Int’l. voice traffic, total (minutes/subscription/month)Domestic mobile traffic (minutes/subscription/month)Individuals using the Internet (%)
Quality Population covered by at least a 3G mobile network (%)International Internet bandwidth (bit/s per Internet user)
AffordabilityMobile-cellular sub-basket ($ a month)Fixed-broadband sub-basket ($ a month)Mobile-b’band, prepaid handset-based, 500 MB ($ a month)Mobile-b’band, postpaid computer-based, 1 GB ($ a month)
TradeICT goods exports (% of total goods exports)ICT goods imports (% of total goods imports)ICT service exports (% of total service exports)
ApplicationsOnline service index (0-1, 1=highest presence)Secure Internet servers (per million people)
44 2017 The Little Data Book on Information and Communication Technology
Latin America & Caribbean Upper middle income
Brazil
2010 2015 2015
Uppermiddle-incomegroupCountry data
199 208 2,59484 86 64
9,650 9,850 8,1864.3 1.2 4.590 93 ..88 89 81
Yes YesPrivate Private
C ..C CC CA AA A
3.2 .. 2.112.5 .. 18.8
21.6 21.4 17.3100.9 126.6 105.1
7.2 12.2 15.434.9 53.5a 48.727.1 54.5a 52.2
0.2 .. 2.360.4 .. 173.140.7 59.1a 52.1
67 94 6912,602 43,634 26,098
57.2 11.9 8.531.2 8.9 15.530.7 7.5 7.733.2 12.0 11.1
1.0 0.4 15.79.5 8.8 14.4
46.7 56.4 25.7
0.37 0.60 0.3740.0 77.1 34.7

Economic and social contextPopulation (millions)Urban population (% of total)GNI per capita, World Bank Atlas method ($)GDP growth, 2005–10 and 2010–15 (avg. annual %)Adult literacy rate (% ages 15 and older) Gross primary, secondary, and tertiary school enrollment (%)
Sector structureSeparate telecommunications/ICT regulatorStatus of main fixed-line telephone operatorLevel of competition (competition, partial comp., monopoly) International gateway(s) Mobile telephone service Internet serviceForeign ownership (not allowed, restricted, allowed)Reg. treatment of VoIP (banned, closed, no framework, allowed)
Sector efficiency and capacityTelecommunications revenue (% of GDP)Telecommunications investment (% of revenue)
Sector performanceAccessFixed-telephone subscriptions (per 100 people)Mobile-cellular telephone subscriptions (per 100 people)Fixed-broadband subscriptions (per 100 people)Households with a computer (%)Households with Internet access at home (%)
Usage Int’l. voice traffic, total (minutes/subscription/month)Domestic mobile traffic (minutes/subscription/month)Individuals using the Internet (%)
Quality Population covered by at least a 3G mobile network (%)International Internet bandwidth (bit/s per Internet user)
AffordabilityMobile-cellular sub-basket ($ a month)Fixed-broadband sub-basket ($ a month)Mobile-b’band, prepaid handset-based, 500 MB ($ a month)Mobile-b’band, postpaid computer-based, 1 GB ($ a month)
TradeICT goods exports (% of total goods exports)ICT goods imports (% of total goods imports)ICT service exports (% of total service exports)
ApplicationsOnline service index (0-1, 1=highest presence)Secure Internet servers (per million people)
45The Little Data Book on Information and Communication Technology 2017
Latin America & Caribbean High income
British Virgin Islands
2010 2015 2015
High-incomegroupCountry data
0.03 0.03 1,18745 46 81
.. .. 41,366
.. .. 1.5
.. .. ..87 .. 95
.. ..
.. ..
.. ..
.. ..
.. ..
.. ..
.. ..
.. .. 2.54.6 8.3 18.8
46.9 41.7 41.2174.6 145.8 124.5
25.3 24.3 31.0.. .. 83.2.. .. 85.0
139.8 84.7 ..176.8 118.4 195.9
37.0 .. 81.0
.. 91a 9937,131 .. 134,761
.. .. 14.2
.. .. 25.2
.. .. 10.4
.. .. 14.4
.. .. 9.5
.. .. 11.2
.. .. 32.0
.. .. 0.676,832.5 5,312.6 1,194.6

Economic and social contextPopulation (millions)Urban population (% of total)GNI per capita, World Bank Atlas method ($)GDP growth, 2005–10 and 2010–15 (avg. annual %)Adult literacy rate (% ages 15 and older) Gross primary, secondary, and tertiary school enrollment (%)
Sector structureSeparate telecommunications/ICT regulatorStatus of main fixed-line telephone operatorLevel of competition (competition, partial comp., monopoly) International gateway(s) Mobile telephone service Internet serviceForeign ownership (not allowed, restricted, allowed)Reg. treatment of VoIP (banned, closed, no framework, allowed)
Sector efficiency and capacityTelecommunications revenue (% of GDP)Telecommunications investment (% of revenue)
Sector performanceAccessFixed-telephone subscriptions (per 100 people)Mobile-cellular telephone subscriptions (per 100 people)Fixed-broadband subscriptions (per 100 people)Households with a computer (%)Households with Internet access at home (%)
Usage Int’l. voice traffic, total (minutes/subscription/month)Domestic mobile traffic (minutes/subscription/month)Individuals using the Internet (%)
Quality Population covered by at least a 3G mobile network (%)International Internet bandwidth (bit/s per Internet user)
AffordabilityMobile-cellular sub-basket ($ a month)Fixed-broadband sub-basket ($ a month)Mobile-b’band, prepaid handset-based, 500 MB ($ a month)Mobile-b’band, postpaid computer-based, 1 GB ($ a month)
TradeICT goods exports (% of total goods exports)ICT goods imports (% of total goods imports)ICT service exports (% of total service exports)
ApplicationsOnline service index (0-1, 1=highest presence)Secure Internet servers (per million people)
46 2017 The Little Data Book on Information and Communication Technology
East Asia & Pacific High income
Brunei Darussalam
2010 2015 2015
High-incomegroupCountry data
0.39 0.42 1,18776 77 81
32,190 .. 41,3660.1 –0.4 1.596 97 ..78 82 95
Yes YesPublic Public
P PM PP PR RA A
.. .. 2.5
.. .. 18.8
19.9 9.0 41.2108.6 108.1 124.5
5.4 8.0 31.079.6a 93.4a 83.265.0a 81.7a 85.0
.. .. ..
.. .. 195.953.0a 71.2a 81.0
.. 91 9923,551 63,090 134,761
19.5 9.0 14.249.9 28.4 25.256.0 18.6 10.424.0 20.4 14.4
0.3 0.2 9.54.1 4.9 11.2
21.4 .. 32.0
0.28 0.36 0.6766.1 203.2 1,194.6

Economic and social contextPopulation (millions)Urban population (% of total)GNI per capita, World Bank Atlas method ($)GDP growth, 2005–10 and 2010–15 (avg. annual %)Adult literacy rate (% ages 15 and older) Gross primary, secondary, and tertiary school enrollment (%)
Sector structureSeparate telecommunications/ICT regulatorStatus of main fixed-line telephone operatorLevel of competition (competition, partial comp., monopoly) International gateway(s) Mobile telephone service Internet serviceForeign ownership (not allowed, restricted, allowed)Reg. treatment of VoIP (banned, closed, no framework, allowed)
Sector efficiency and capacityTelecommunications revenue (% of GDP)Telecommunications investment (% of revenue)
Sector performanceAccessFixed-telephone subscriptions (per 100 people)Mobile-cellular telephone subscriptions (per 100 people)Fixed-broadband subscriptions (per 100 people)Households with a computer (%)Households with Internet access at home (%)
Usage Int’l. voice traffic, total (minutes/subscription/month)Domestic mobile traffic (minutes/subscription/month)Individuals using the Internet (%)
Quality Population covered by at least a 3G mobile network (%)International Internet bandwidth (bit/s per Internet user)
AffordabilityMobile-cellular sub-basket ($ a month)Fixed-broadband sub-basket ($ a month)Mobile-b’band, prepaid handset-based, 500 MB ($ a month)Mobile-b’band, postpaid computer-based, 1 GB ($ a month)
TradeICT goods exports (% of total goods exports)ICT goods imports (% of total goods imports)ICT service exports (% of total service exports)
ApplicationsOnline service index (0-1, 1=highest presence)Secure Internet servers (per million people)
47The Little Data Book on Information and Communication Technology 2017
Europe & Central Asia Upper middle income
Bulgaria
2010 2015 2015
Uppermiddle-incomegroupCountry data
7 7 2,59472 74 64
6,840 7,220 8,1863.1 1.4 4.598 98 ..81 90 81
Yes YesMixed Mixed
P PP PC CA AA A
3.4 2.6 2.131.8 26.9 18.8
29.3 23.3 17.3138.0 129.3 105.1
15.2 22.4 15.435.1 59.0 48.733.1 59.1 52.2
7.8 9.5 2.3108.9 144.2 173.1
46.2 56.7 52.1
93 100 6968,091 145,170 26,098
32.9 21.7 8.513.4 10.1 15.513.1 6.8 7.7
6.6 6.2 11.1
2.5 2.5 15.75.6 4.9 14.4
14.9 21.1 25.7
0.41 0.24 0.3774.9 181.5 34.7

Economic and social contextPopulation (millions)Urban population (% of total)GNI per capita, World Bank Atlas method ($)GDP growth, 2005–10 and 2010–15 (avg. annual %)Adult literacy rate (% ages 15 and older) Gross primary, secondary, and tertiary school enrollment (%)
Sector structureSeparate telecommunications/ICT regulatorStatus of main fixed-line telephone operatorLevel of competition (competition, partial comp., monopoly) International gateway(s) Mobile telephone service Internet serviceForeign ownership (not allowed, restricted, allowed)Reg. treatment of VoIP (banned, closed, no framework, allowed)
Sector efficiency and capacityTelecommunications revenue (% of GDP)Telecommunications investment (% of revenue)
Sector performanceAccessFixed-telephone subscriptions (per 100 people)Mobile-cellular telephone subscriptions (per 100 people)Fixed-broadband subscriptions (per 100 people)Households with a computer (%)Households with Internet access at home (%)
Usage Int’l. voice traffic, total (minutes/subscription/month)Domestic mobile traffic (minutes/subscription/month)Individuals using the Internet (%)
Quality Population covered by at least a 3G mobile network (%)International Internet bandwidth (bit/s per Internet user)
AffordabilityMobile-cellular sub-basket ($ a month)Fixed-broadband sub-basket ($ a month)Mobile-b’band, prepaid handset-based, 500 MB ($ a month)Mobile-b’band, postpaid computer-based, 1 GB ($ a month)
TradeICT goods exports (% of total goods exports)ICT goods imports (% of total goods imports)ICT service exports (% of total service exports)
ApplicationsOnline service index (0-1, 1=highest presence)Secure Internet servers (per million people)
48 2017 The Little Data Book on Information and Communication Technology
Sub-Saharan Africa Low income
Burkina Faso
2010 2015 2015
Low-incomegroupCountry data
16 18 63826 30 31
610 660 6205.9 4.8 5.429 38 ..40 47 60
Yes YesMixed Mixed
P CP PP CR RA B
.. 5.0 ..
.. 9.4 ..
0.9 0.4 0.936.7 80.6 60.0
0.1 0.0 0.32.1a 5.2a 4.82.0a 12.5a 7.1
.. 3.9 ..28.4 32.3 48.9
2.4a 11.4a 9.5
0 .. 512,148 2,862 4,245
21.7 9.7 9.483.1 37.2 33.6
.. 8.5 8.0
.. 8.5 10.8
0.0 0.0 ..2.5 2.3 3.4
21.1 12.8 ..
0.16 0.30 0.110.3 0.7 1.5

Economic and social contextPopulation (millions)Urban population (% of total)GNI per capita, World Bank Atlas method ($)GDP growth, 2005–10 and 2010–15 (avg. annual %)Adult literacy rate (% ages 15 and older) Gross primary, secondary, and tertiary school enrollment (%)
Sector structureSeparate telecommunications/ICT regulatorStatus of main fixed-line telephone operatorLevel of competition (competition, partial comp., monopoly) International gateway(s) Mobile telephone service Internet serviceForeign ownership (not allowed, restricted, allowed)Reg. treatment of VoIP (banned, closed, no framework, allowed)
Sector efficiency and capacityTelecommunications revenue (% of GDP)Telecommunications investment (% of revenue)
Sector performanceAccessFixed-telephone subscriptions (per 100 people)Mobile-cellular telephone subscriptions (per 100 people)Fixed-broadband subscriptions (per 100 people)Households with a computer (%)Households with Internet access at home (%)
Usage Int’l. voice traffic, total (minutes/subscription/month)Domestic mobile traffic (minutes/subscription/month)Individuals using the Internet (%)
Quality Population covered by at least a 3G mobile network (%)International Internet bandwidth (bit/s per Internet user)
AffordabilityMobile-cellular sub-basket ($ a month)Fixed-broadband sub-basket ($ a month)Mobile-b’band, prepaid handset-based, 500 MB ($ a month)Mobile-b’band, postpaid computer-based, 1 GB ($ a month)
TradeICT goods exports (% of total goods exports)ICT goods imports (% of total goods imports)ICT service exports (% of total service exports)
ApplicationsOnline service index (0-1, 1=highest presence)Secure Internet servers (per million people)
49The Little Data Book on Information and Communication Technology 2017
Sub-Saharan Africa Low income
Burundi
2010 2015 2015
Low-incomegroupCountry data
9 11 63811 12 31
200 260 6204.5 3.4 5.487 85 ..58 62 60
Yes YesPublic Public
C CC CC CA AB B
3.8 3.5 .... .. ..
0.4 0.2 0.918.2a 46.2 60.0
0.0 0.0 0.30.2a 1.2a 4.80.2a 4.0a 7.1
5.9 1.9 ..23.9 1.5 48.9
1.0a 4.9a 9.5
0 .. 511,652 5,702 4,245
.. 8.0 9.4
.. 82.9 33.6
.. .. 8.0
.. .. 10.8
0.4 0.6 ..5.8 4.5 3.43.5 14.1 ..
0.04 0.02 0.110.2 0.5 1.5

Economic and social contextPopulation (millions)Urban population (% of total)GNI per capita, World Bank Atlas method ($)GDP growth, 2005–10 and 2010–15 (avg. annual %)Adult literacy rate (% ages 15 and older) Gross primary, secondary, and tertiary school enrollment (%)
Sector structureSeparate telecommunications/ICT regulatorStatus of main fixed-line telephone operatorLevel of competition (competition, partial comp., monopoly) International gateway(s) Mobile telephone service Internet serviceForeign ownership (not allowed, restricted, allowed)Reg. treatment of VoIP (banned, closed, no framework, allowed)
Sector efficiency and capacityTelecommunications revenue (% of GDP)Telecommunications investment (% of revenue)
Sector performanceAccessFixed-telephone subscriptions (per 100 people)Mobile-cellular telephone subscriptions (per 100 people)Fixed-broadband subscriptions (per 100 people)Households with a computer (%)Households with Internet access at home (%)
Usage Int’l. voice traffic, total (minutes/subscription/month)Domestic mobile traffic (minutes/subscription/month)Individuals using the Internet (%)
Quality Population covered by at least a 3G mobile network (%)International Internet bandwidth (bit/s per Internet user)
AffordabilityMobile-cellular sub-basket ($ a month)Fixed-broadband sub-basket ($ a month)Mobile-b’band, prepaid handset-based, 500 MB ($ a month)Mobile-b’band, postpaid computer-based, 1 GB ($ a month)
TradeICT goods exports (% of total goods exports)ICT goods imports (% of total goods imports)ICT service exports (% of total service exports)
ApplicationsOnline service index (0-1, 1=highest presence)Secure Internet servers (per million people)
50 2017 The Little Data Book on Information and Communication Technology
Sub-Saharan Africa Lower middle income
Cabo Verde
2010 2015 2015
Lowermiddle-incomegroupCountry data
0.49 0.52 2,92762 66 39
3,410 3,290 2,0356.1 2.1 5.485 88 ..74 77 68
Yes YesMixed Mixed
C ..C CC CA AA A
6.9 3.9 ..32.4 20.7 ..
14.8 11.5 3.576.3 127.2 90.5
3.3 3.0 1.920.4 34.2a 19.3
7.1 27.0a 24.3
18.6 16.5 7.565.9 81.1 152.030.0a 43.0a 28.6
50 87 ..3,179 17,149 10,372
31.6 23.9 6.931.5 10.0 14.3
5.8 3.5 5.818.5 16.0 10.0
.. .. 5.77.5 4.4 7.64.8 7.4 48.0
0.27 0.17 0.2614.3 51.9 7.4

Economic and social contextPopulation (millions)Urban population (% of total)GNI per capita, World Bank Atlas method ($)GDP growth, 2005–10 and 2010–15 (avg. annual %)Adult literacy rate (% ages 15 and older) Gross primary, secondary, and tertiary school enrollment (%)
Sector structureSeparate telecommunications/ICT regulatorStatus of main fixed-line telephone operatorLevel of competition (competition, partial comp., monopoly) International gateway(s) Mobile telephone service Internet serviceForeign ownership (not allowed, restricted, allowed)Reg. treatment of VoIP (banned, closed, no framework, allowed)
Sector efficiency and capacityTelecommunications revenue (% of GDP)Telecommunications investment (% of revenue)
Sector performanceAccessFixed-telephone subscriptions (per 100 people)Mobile-cellular telephone subscriptions (per 100 people)Fixed-broadband subscriptions (per 100 people)Households with a computer (%)Households with Internet access at home (%)
Usage Int’l. voice traffic, total (minutes/subscription/month)Domestic mobile traffic (minutes/subscription/month)Individuals using the Internet (%)
Quality Population covered by at least a 3G mobile network (%)International Internet bandwidth (bit/s per Internet user)
AffordabilityMobile-cellular sub-basket ($ a month)Fixed-broadband sub-basket ($ a month)Mobile-b’band, prepaid handset-based, 500 MB ($ a month)Mobile-b’band, postpaid computer-based, 1 GB ($ a month)
TradeICT goods exports (% of total goods exports)ICT goods imports (% of total goods imports)ICT service exports (% of total service exports)
ApplicationsOnline service index (0-1, 1=highest presence)Secure Internet servers (per million people)
51The Little Data Book on Information and Communication Technology 2017
East Asia & Pacific Lower middle income
Cambodia
2010 2015 2015
Lowermiddle-incomegroupCountry data
14 16 2,92720 21 39
750 1,070 2,0356.4 7.2 5.474 78 ..63 .. 68
No YesPublic Public
P CC CC CA A
No A
5.5 .. ..69.8 .. ..
2.5 1.6 3.556.7 133.0 90.5
0.2 0.5 1.94.3a 16.0a 19.31.6a 21.0a 24.3
.. 7.8 7.5
.. 44.2 152.01.3 19.0a 28.6
43 70 ..27,625 17,792 10,372
7.7 6.8 6.945.0 12.0 14.3
.. 1.0 5.8
.. 2.0 10.0
0.1 1.2 5.72.5 1.5 7.65.8 7.9 48.0
0.14 0.17 0.261.7 5.1 7.4

Economic and social contextPopulation (millions)Urban population (% of total)GNI per capita, World Bank Atlas method ($)GDP growth, 2005–10 and 2010–15 (avg. annual %)Adult literacy rate (% ages 15 and older) Gross primary, secondary, and tertiary school enrollment (%)
Sector structureSeparate telecommunications/ICT regulatorStatus of main fixed-line telephone operatorLevel of competition (competition, partial comp., monopoly) International gateway(s) Mobile telephone service Internet serviceForeign ownership (not allowed, restricted, allowed)Reg. treatment of VoIP (banned, closed, no framework, allowed)
Sector efficiency and capacityTelecommunications revenue (% of GDP)Telecommunications investment (% of revenue)
Sector performanceAccessFixed-telephone subscriptions (per 100 people)Mobile-cellular telephone subscriptions (per 100 people)Fixed-broadband subscriptions (per 100 people)Households with a computer (%)Households with Internet access at home (%)
Usage Int’l. voice traffic, total (minutes/subscription/month)Domestic mobile traffic (minutes/subscription/month)Individuals using the Internet (%)
Quality Population covered by at least a 3G mobile network (%)International Internet bandwidth (bit/s per Internet user)
AffordabilityMobile-cellular sub-basket ($ a month)Fixed-broadband sub-basket ($ a month)Mobile-b’band, prepaid handset-based, 500 MB ($ a month)Mobile-b’band, postpaid computer-based, 1 GB ($ a month)
TradeICT goods exports (% of total goods exports)ICT goods imports (% of total goods imports)ICT service exports (% of total service exports)
ApplicationsOnline service index (0-1, 1=highest presence)Secure Internet servers (per million people)
52 2017 The Little Data Book on Information and Communication Technology
Sub-Saharan Africa Lower middle income
Cameroon
2010 2015 2015
Lowermiddle-incomegroupCountry data
21 23 2,92752 54 39
1,170 1,330 2,0352.9 5.3 5.471 75 ..62 .. 68
Yes YesPublic Public
.. PC PC CA ..B B
3.5 .. ..28.0 .. ..
2.6 4.5 3.541.9 71.8 90.5
0.0 0.1 1.97.2 12.7a 19.31.9 8.6a 24.3
5.1 .. 7.538.7 .. 152.0
4.3a 20.7a 28.6
.. 50a ..363 992 10,372
18.8 10.3 6.980.2 50.6 14.3
.. 10.1 5.8
.. 13.5 10.0
0.0 0.0 5.72.6 4.2 7.6
30.6 27.4 48.0
0.15 0.20 0.260.5 2.5 7.4

Economic and social contextPopulation (millions)Urban population (% of total)GNI per capita, World Bank Atlas method ($)GDP growth, 2005–10 and 2010–15 (avg. annual %)Adult literacy rate (% ages 15 and older) Gross primary, secondary, and tertiary school enrollment (%)
Sector structureSeparate telecommunications/ICT regulatorStatus of main fixed-line telephone operatorLevel of competition (competition, partial comp., monopoly) International gateway(s) Mobile telephone service Internet serviceForeign ownership (not allowed, restricted, allowed)Reg. treatment of VoIP (banned, closed, no framework, allowed)
Sector efficiency and capacityTelecommunications revenue (% of GDP)Telecommunications investment (% of revenue)
Sector performanceAccessFixed-telephone subscriptions (per 100 people)Mobile-cellular telephone subscriptions (per 100 people)Fixed-broadband subscriptions (per 100 people)Households with a computer (%)Households with Internet access at home (%)
Usage Int’l. voice traffic, total (minutes/subscription/month)Domestic mobile traffic (minutes/subscription/month)Individuals using the Internet (%)
Quality Population covered by at least a 3G mobile network (%)International Internet bandwidth (bit/s per Internet user)
AffordabilityMobile-cellular sub-basket ($ a month)Fixed-broadband sub-basket ($ a month)Mobile-b’band, prepaid handset-based, 500 MB ($ a month)Mobile-b’band, postpaid computer-based, 1 GB ($ a month)
TradeICT goods exports (% of total goods exports)ICT goods imports (% of total goods imports)ICT service exports (% of total service exports)
ApplicationsOnline service index (0-1, 1=highest presence)Secure Internet servers (per million people)
53The Little Data Book on Information and Communication Technology 2017
North America High income
Canada
2010 2015 2015
High-incomegroupCountry data
34 36 1,18781 82 81
44,400 47,500 41,3660.8 2.1 1.5
.. .. ..
.. .. 95
Yes YesPublic Public
C CC CC CR RA A
2.5 2.3 2.520.1 31.9 18.8
53.9 44.3 41.275.7 81.9 124.531.7 36.4 31.082.7 85.1a 83.278.4 86.6a 85.0
.. .. ..366.0 409.0 195.9
80.3 88.5a 81.0
98 99a 9954,738 135,496 134,761
38.9 25.1 14.226.2 49.4 25.2
.. 22.5 10.458.8 40.5 14.4
2.8 1.9 9.58.4 6.9 11.2
42.7 40.6 32.0
0.88 0.91 0.671,242.7 1,308.8 1,194.6

Economic and social contextPopulation (millions)Urban population (% of total)GNI per capita, World Bank Atlas method ($)GDP growth, 2005–10 and 2010–15 (avg. annual %)Adult literacy rate (% ages 15 and older) Gross primary, secondary, and tertiary school enrollment (%)
Sector structureSeparate telecommunications/ICT regulatorStatus of main fixed-line telephone operatorLevel of competition (competition, partial comp., monopoly) International gateway(s) Mobile telephone service Internet serviceForeign ownership (not allowed, restricted, allowed)Reg. treatment of VoIP (banned, closed, no framework, allowed)
Sector efficiency and capacityTelecommunications revenue (% of GDP)Telecommunications investment (% of revenue)
Sector performanceAccessFixed-telephone subscriptions (per 100 people)Mobile-cellular telephone subscriptions (per 100 people)Fixed-broadband subscriptions (per 100 people)Households with a computer (%)Households with Internet access at home (%)
Usage Int’l. voice traffic, total (minutes/subscription/month)Domestic mobile traffic (minutes/subscription/month)Individuals using the Internet (%)
Quality Population covered by at least a 3G mobile network (%)International Internet bandwidth (bit/s per Internet user)
AffordabilityMobile-cellular sub-basket ($ a month)Fixed-broadband sub-basket ($ a month)Mobile-b’band, prepaid handset-based, 500 MB ($ a month)Mobile-b’band, postpaid computer-based, 1 GB ($ a month)
TradeICT goods exports (% of total goods exports)ICT goods imports (% of total goods imports)ICT service exports (% of total service exports)
ApplicationsOnline service index (0-1, 1=highest presence)Secure Internet servers (per million people)
54 2017 The Little Data Book on Information and Communication Technology
Latin America & Caribbean High income
Cayman Islands
2010 2015 2015
High-incomegroupCountry data
0.06 0.06 1,187100 100 81
.. .. 41,366
.. .. 1.599 .. ..
.. .. 95
.. ..
.. ..
.. ..
.. ..
.. ..
.. ..No ..
.. .. 2.5
.. 21.5 18.8
67.3 55.9 41.2181.2 155.5 124.5
34.0 45.7 31.073.8 72.1 83.265.2 70.1 85.0
.. .. ..
.. .. 195.966.0a 77.0a 81.0
100 100 99.. .. 134,761
.. .. 14.2
.. .. 25.2
.. .. 10.4
.. .. 14.4
.. .. 9.5
.. .. 11.2
.. .. 32.0
.. .. 0.671,927.6 2,284.6 1,194.6

Economic and social contextPopulation (millions)Urban population (% of total)GNI per capita, World Bank Atlas method ($)GDP growth, 2005–10 and 2010–15 (avg. annual %)Adult literacy rate (% ages 15 and older) Gross primary, secondary, and tertiary school enrollment (%)
Sector structureSeparate telecommunications/ICT regulatorStatus of main fixed-line telephone operatorLevel of competition (competition, partial comp., monopoly) International gateway(s) Mobile telephone service Internet serviceForeign ownership (not allowed, restricted, allowed)Reg. treatment of VoIP (banned, closed, no framework, allowed)
Sector efficiency and capacityTelecommunications revenue (% of GDP)Telecommunications investment (% of revenue)
Sector performanceAccessFixed-telephone subscriptions (per 100 people)Mobile-cellular telephone subscriptions (per 100 people)Fixed-broadband subscriptions (per 100 people)Households with a computer (%)Households with Internet access at home (%)
Usage Int’l. voice traffic, total (minutes/subscription/month)Domestic mobile traffic (minutes/subscription/month)Individuals using the Internet (%)
Quality Population covered by at least a 3G mobile network (%)International Internet bandwidth (bit/s per Internet user)
AffordabilityMobile-cellular sub-basket ($ a month)Fixed-broadband sub-basket ($ a month)Mobile-b’band, prepaid handset-based, 500 MB ($ a month)Mobile-b’band, postpaid computer-based, 1 GB ($ a month)
TradeICT goods exports (% of total goods exports)ICT goods imports (% of total goods imports)ICT service exports (% of total service exports)
ApplicationsOnline service index (0-1, 1=highest presence)Secure Internet servers (per million people)
55The Little Data Book on Information and Communication Technology 2017
Sub-Saharan Africa Low income
Central African Republic
2010 2015 2015
Low-incomegroupCountry data
4 5 63839 40 31
470 320 6202.9 –9.8 5.437 37 ..42 .. 60
Yes YesMixed Public
C ..C CC CA AC C
2.4 2.7 ..56.3 .. ..
0.0 0.0 0.922.5 20.4 60.0
0.0 .. 0.32.1a 3.5a 4.81.6a 2.9a 7.1
4.5 2.8 ..23.8 40.6 48.9
2.0a 4.6a 9.5
0 23 51207 100 4,245
12.9 11.5 9.41,329.5 488.6 33.6
.. .. 8.0
.. .. 10.8
0.2 0.0 ..7.7 6.6 3.4
.. .. ..
0.00 0.04 0.110.2 0.2 1.5

Economic and social contextPopulation (millions)Urban population (% of total)GNI per capita, World Bank Atlas method ($)GDP growth, 2005–10 and 2010–15 (avg. annual %)Adult literacy rate (% ages 15 and older) Gross primary, secondary, and tertiary school enrollment (%)
Sector structureSeparate telecommunications/ICT regulatorStatus of main fixed-line telephone operatorLevel of competition (competition, partial comp., monopoly) International gateway(s) Mobile telephone service Internet serviceForeign ownership (not allowed, restricted, allowed)Reg. treatment of VoIP (banned, closed, no framework, allowed)
Sector efficiency and capacityTelecommunications revenue (% of GDP)Telecommunications investment (% of revenue)
Sector performanceAccessFixed-telephone subscriptions (per 100 people)Mobile-cellular telephone subscriptions (per 100 people)Fixed-broadband subscriptions (per 100 people)Households with a computer (%)Households with Internet access at home (%)
Usage Int’l. voice traffic, total (minutes/subscription/month)Domestic mobile traffic (minutes/subscription/month)Individuals using the Internet (%)
Quality Population covered by at least a 3G mobile network (%)International Internet bandwidth (bit/s per Internet user)
AffordabilityMobile-cellular sub-basket ($ a month)Fixed-broadband sub-basket ($ a month)Mobile-b’band, prepaid handset-based, 500 MB ($ a month)Mobile-b’band, postpaid computer-based, 1 GB ($ a month)
TradeICT goods exports (% of total goods exports)ICT goods imports (% of total goods imports)ICT service exports (% of total service exports)
ApplicationsOnline service index (0-1, 1=highest presence)Secure Internet servers (per million people)
56 2017 The Little Data Book on Information and Communication Technology
Sub-Saharan Africa Low income
Chad
2010 2015 2015
Low-incomegroupCountry data
12 14 63822 22 31
910 880 6204.5 5.3 5.4
.. 40 ..43 .. 60
Yes YesPublic Public
.. ..
.. ..C CR AB B
2.1 2.6 .... .. ..
0.4 0.1 0.924.5 40.2 60.0
0.0 0.1 0.31.1a 3.5a 4.80.9a 3.1a 7.1
3.4 3.5 ..31.1 41.2 48.9
1.7a 2.7a 9.5
.. 13 5196 2,575 4,245
.. 15.8 9.4
.. 500.8 33.6
.. 8.5 8.0
.. 17.4 10.8
.. .. ..
.. .. 3.4
.. .. ..
0.02 0.05 0.11.. 0.2 1.5

Economic and social contextPopulation (millions)Urban population (% of total)GNI per capita, World Bank Atlas method ($)GDP growth, 2005–10 and 2010–15 (avg. annual %)Adult literacy rate (% ages 15 and older) Gross primary, secondary, and tertiary school enrollment (%)
Sector structureSeparate telecommunications/ICT regulatorStatus of main fixed-line telephone operatorLevel of competition (competition, partial comp., monopoly) International gateway(s) Mobile telephone service Internet serviceForeign ownership (not allowed, restricted, allowed)Reg. treatment of VoIP (banned, closed, no framework, allowed)
Sector efficiency and capacityTelecommunications revenue (% of GDP)Telecommunications investment (% of revenue)
Sector performanceAccessFixed-telephone subscriptions (per 100 people)Mobile-cellular telephone subscriptions (per 100 people)Fixed-broadband subscriptions (per 100 people)Households with a computer (%)Households with Internet access at home (%)
Usage Int’l. voice traffic, total (minutes/subscription/month)Domestic mobile traffic (minutes/subscription/month)Individuals using the Internet (%)
Quality Population covered by at least a 3G mobile network (%)International Internet bandwidth (bit/s per Internet user)
AffordabilityMobile-cellular sub-basket ($ a month)Fixed-broadband sub-basket ($ a month)Mobile-b’band, prepaid handset-based, 500 MB ($ a month)Mobile-b’band, postpaid computer-based, 1 GB ($ a month)
TradeICT goods exports (% of total goods exports)ICT goods imports (% of total goods imports)ICT service exports (% of total service exports)
ApplicationsOnline service index (0-1, 1=highest presence)Secure Internet servers (per million people)
57The Little Data Book on Information and Communication Technology 2017
Europe & Central Asia High income
Channel Islands
2010 2015 2015
High-incomegroupCountry data
0.16 0.16 1,18731 31 81
.. .. 41,366
.. .. 1.5
.. .. ..
.. .. 95
.. ..
.. ..
.. ..
.. ..
.. ..
.. ..
.. ..
.. .. 2.5
.. .. 18.8
.. .. 41.2
.. .. 124.5
.. .. 31.0
.. .. 83.2
.. .. 85.0
.. .. ..
.. .. 195.9
.. .. 81.0
.. .. 99
.. .. 134,761
.. .. 14.2
.. .. 25.2
.. .. 10.4
.. .. 14.4
.. .. 9.5
.. .. 11.2
.. .. 32.0
.. .. 0.67
.. .. 1,194.6

Economic and social contextPopulation (millions)Urban population (% of total)GNI per capita, World Bank Atlas method ($)GDP growth, 2005–10 and 2010–15 (avg. annual %)Adult literacy rate (% ages 15 and older) Gross primary, secondary, and tertiary school enrollment (%)
Sector structureSeparate telecommunications/ICT regulatorStatus of main fixed-line telephone operatorLevel of competition (competition, partial comp., monopoly) International gateway(s) Mobile telephone service Internet serviceForeign ownership (not allowed, restricted, allowed)Reg. treatment of VoIP (banned, closed, no framework, allowed)
Sector efficiency and capacityTelecommunications revenue (% of GDP)Telecommunications investment (% of revenue)
Sector performanceAccessFixed-telephone subscriptions (per 100 people)Mobile-cellular telephone subscriptions (per 100 people)Fixed-broadband subscriptions (per 100 people)Households with a computer (%)Households with Internet access at home (%)
Usage Int’l. voice traffic, total (minutes/subscription/month)Domestic mobile traffic (minutes/subscription/month)Individuals using the Internet (%)
Quality Population covered by at least a 3G mobile network (%)International Internet bandwidth (bit/s per Internet user)
AffordabilityMobile-cellular sub-basket ($ a month)Fixed-broadband sub-basket ($ a month)Mobile-b’band, prepaid handset-based, 500 MB ($ a month)Mobile-b’band, postpaid computer-based, 1 GB ($ a month)
TradeICT goods exports (% of total goods exports)ICT goods imports (% of total goods imports)ICT service exports (% of total service exports)
ApplicationsOnline service index (0-1, 1=highest presence)Secure Internet servers (per million people)
58 2017 The Little Data Book on Information and Communication Technology
Latin America & Caribbean High income
Chile
2010 2015 2015
High-incomegroupCountry data
17 18 1,18789 90 81
10,800 14,060 41,3663.2 3.8 1.597 97 ..90 96 95
Yes YesPrivate Private
C CC CC CA AA A
3.8 3.8 2.524.7 19.4 18.8
20.2 19.2 41.2115.8 129.5 124.5
10.4 15.2 31.046.8a 63.6a 83.235.0a 59.7a 85.0
2.3 1.6 ..87.3 104.4 195.945.0a 64.3a 81.0
.. 90a 9919,099 129,825 134,761
23.7 20.0 14.239.4 26.0 25.220.5 6.1 10.426.5 18.2 14.4
0.4 0.5 9.57.9 7.2 11.2
20.2 30.4 32.0
0.61 0.82 0.6753.1 145.1 1,194.6

Economic and social contextPopulation (millions)Urban population (% of total)GNI per capita, World Bank Atlas method ($)GDP growth, 2005–10 and 2010–15 (avg. annual %)Adult literacy rate (% ages 15 and older) Gross primary, secondary, and tertiary school enrollment (%)
Sector structureSeparate telecommunications/ICT regulatorStatus of main fixed-line telephone operatorLevel of competition (competition, partial comp., monopoly) International gateway(s) Mobile telephone service Internet serviceForeign ownership (not allowed, restricted, allowed)Reg. treatment of VoIP (banned, closed, no framework, allowed)
Sector efficiency and capacityTelecommunications revenue (% of GDP)Telecommunications investment (% of revenue)
Sector performanceAccessFixed-telephone subscriptions (per 100 people)Mobile-cellular telephone subscriptions (per 100 people)Fixed-broadband subscriptions (per 100 people)Households with a computer (%)Households with Internet access at home (%)
Usage Int’l. voice traffic, total (minutes/subscription/month)Domestic mobile traffic (minutes/subscription/month)Individuals using the Internet (%)
Quality Population covered by at least a 3G mobile network (%)International Internet bandwidth (bit/s per Internet user)
AffordabilityMobile-cellular sub-basket ($ a month)Fixed-broadband sub-basket ($ a month)Mobile-b’band, prepaid handset-based, 500 MB ($ a month)Mobile-b’band, postpaid computer-based, 1 GB ($ a month)
TradeICT goods exports (% of total goods exports)ICT goods imports (% of total goods imports)ICT service exports (% of total service exports)
ApplicationsOnline service index (0-1, 1=highest presence)Secure Internet servers (per million people)
59The Little Data Book on Information and Communication Technology 2017
East Asia & Pacific Upper middle income
China
2010 2015 2015
Uppermiddle-incomegroupCountry data
1,338 1,371 2,59449 56 64
4,300 7,820 8,18611.1 7.7 4.5
95 96 ..69 78 81
No NoMixed Mixed
P P.. P.. CR RC No
2.2 1.8 2.135.6 34.6 18.8
21.6 16.5 17.363.2 93.2 105.1
9.3 18.6 15.435.4a 49.6a 48.723.7a 54.2a 52.2
1.3 0.8 2.3419.1 189.7 173.1
34.3 50.3a 52.1
.. 57 692,356 6,530 26,098
6.0 4.0 8.517.8 19.3 15.5
.. 4.8 7.7185.4 8.0 11.1
29.1 25.9 15.720.4 19.7 14.4–6.1 28.9 25.7
0.37 0.61 0.371.9 10.1 34.7

Economic and social contextPopulation (millions)Urban population (% of total)GNI per capita, World Bank Atlas method ($)GDP growth, 2005–10 and 2010–15 (avg. annual %)Adult literacy rate (% ages 15 and older) Gross primary, secondary, and tertiary school enrollment (%)
Sector structureSeparate telecommunications/ICT regulatorStatus of main fixed-line telephone operatorLevel of competition (competition, partial comp., monopoly) International gateway(s) Mobile telephone service Internet serviceForeign ownership (not allowed, restricted, allowed)Reg. treatment of VoIP (banned, closed, no framework, allowed)
Sector efficiency and capacityTelecommunications revenue (% of GDP)Telecommunications investment (% of revenue)
Sector performanceAccessFixed-telephone subscriptions (per 100 people)Mobile-cellular telephone subscriptions (per 100 people)Fixed-broadband subscriptions (per 100 people)Households with a computer (%)Households with Internet access at home (%)
Usage Int’l. voice traffic, total (minutes/subscription/month)Domestic mobile traffic (minutes/subscription/month)Individuals using the Internet (%)
Quality Population covered by at least a 3G mobile network (%)International Internet bandwidth (bit/s per Internet user)
AffordabilityMobile-cellular sub-basket ($ a month)Fixed-broadband sub-basket ($ a month)Mobile-b’band, prepaid handset-based, 500 MB ($ a month)Mobile-b’band, postpaid computer-based, 1 GB ($ a month)
TradeICT goods exports (% of total goods exports)ICT goods imports (% of total goods imports)ICT service exports (% of total service exports)
ApplicationsOnline service index (0-1, 1=highest presence)Secure Internet servers (per million people)
60 2017 The Little Data Book on Information and Communication Technology
Latin America & Caribbean Upper middle income
Colombia
2010 2015 2015
Uppermiddle-incomegroupCountry data
46 48 2,59475 76 64
5,540 7,130 8,1864.4 4.6 4.593 95 ..89 88 81
Yes YesMixed Mixed
C CP CC CA AA A
4.2 5.0 2.117.8 .. 18.8
15.5 14.4 17.395.8 115.7 105.1
5.7 11.2 15.426.1 45.5 48.719.3 41.8 52.2
6.2 7.8 2.3323.2 364.7 173.1
36.5 55.9 52.1
100 100 6910,212 105,050 26,098
22.2 13.3 8.535.2 13.5 15.530.6 15.0 7.717.8 10.9 11.1
0.1 0.2 15.79.6 10.2 14.4
17.1 13.9 25.7
0.71 0.79 0.3714.4 57.3 34.7

Economic and social contextPopulation (millions)Urban population (% of total)GNI per capita, World Bank Atlas method ($)GDP growth, 2005–10 and 2010–15 (avg. annual %)Adult literacy rate (% ages 15 and older) Gross primary, secondary, and tertiary school enrollment (%)
Sector structureSeparate telecommunications/ICT regulatorStatus of main fixed-line telephone operatorLevel of competition (competition, partial comp., monopoly) International gateway(s) Mobile telephone service Internet serviceForeign ownership (not allowed, restricted, allowed)Reg. treatment of VoIP (banned, closed, no framework, allowed)
Sector efficiency and capacityTelecommunications revenue (% of GDP)Telecommunications investment (% of revenue)
Sector performanceAccessFixed-telephone subscriptions (per 100 people)Mobile-cellular telephone subscriptions (per 100 people)Fixed-broadband subscriptions (per 100 people)Households with a computer (%)Households with Internet access at home (%)
Usage Int’l. voice traffic, total (minutes/subscription/month)Domestic mobile traffic (minutes/subscription/month)Individuals using the Internet (%)
Quality Population covered by at least a 3G mobile network (%)International Internet bandwidth (bit/s per Internet user)
AffordabilityMobile-cellular sub-basket ($ a month)Fixed-broadband sub-basket ($ a month)Mobile-b’band, prepaid handset-based, 500 MB ($ a month)Mobile-b’band, postpaid computer-based, 1 GB ($ a month)
TradeICT goods exports (% of total goods exports)ICT goods imports (% of total goods imports)ICT service exports (% of total service exports)
ApplicationsOnline service index (0-1, 1=highest presence)Secure Internet servers (per million people)
61The Little Data Book on Information and Communication Technology 2017
Sub-Saharan Africa Low income
Comoros
2010 2015 2015
Low-incomegroupCountry data
0.70 0.79 63828 28 31
760 790 6201.4 2.9 5.4
.. 78 ..
.. 65 60
Yes YesPublic Public
M MM MM MA AB C
4.5 .. ..13.8 .. ..
3.1 3.1 0.924.2 54.8 60.0
0.0 0.3 0.35.2a 8.1a 4.82.4a 4.7a 7.1
.. .. ..42.1 .. 48.9
5.1a 7.5a 9.5
.. .. 514,765 11,664 4,245
13.5 8.9 9.480.2 41.7 33.6
.. 11.3 8.0
.. 16.9 10.8
0.1 0.0 ..1.8 5.9 3.4
22.2 .. ..
0.03 0.02 0.111.4 1.3 1.5

Economic and social contextPopulation (millions)Urban population (% of total)GNI per capita, World Bank Atlas method ($)GDP growth, 2005–10 and 2010–15 (avg. annual %)Adult literacy rate (% ages 15 and older) Gross primary, secondary, and tertiary school enrollment (%)
Sector structureSeparate telecommunications/ICT regulatorStatus of main fixed-line telephone operatorLevel of competition (competition, partial comp., monopoly) International gateway(s) Mobile telephone service Internet serviceForeign ownership (not allowed, restricted, allowed)Reg. treatment of VoIP (banned, closed, no framework, allowed)
Sector efficiency and capacityTelecommunications revenue (% of GDP)Telecommunications investment (% of revenue)
Sector performanceAccessFixed-telephone subscriptions (per 100 people)Mobile-cellular telephone subscriptions (per 100 people)Fixed-broadband subscriptions (per 100 people)Households with a computer (%)Households with Internet access at home (%)
Usage Int’l. voice traffic, total (minutes/subscription/month)Domestic mobile traffic (minutes/subscription/month)Individuals using the Internet (%)
Quality Population covered by at least a 3G mobile network (%)International Internet bandwidth (bit/s per Internet user)
AffordabilityMobile-cellular sub-basket ($ a month)Fixed-broadband sub-basket ($ a month)Mobile-b’band, prepaid handset-based, 500 MB ($ a month)Mobile-b’band, postpaid computer-based, 1 GB ($ a month)
TradeICT goods exports (% of total goods exports)ICT goods imports (% of total goods imports)ICT service exports (% of total service exports)
ApplicationsOnline service index (0-1, 1=highest presence)Secure Internet servers (per million people)
62 2017 The Little Data Book on Information and Communication Technology
Sub-Saharan Africa Low income
Congo, Dem. Rep.
2010 2015 2015
Low-incomegroupCountry data
66 77 63840 42 31
300 410 6205.4 7.8 5.475 77 ..57 59 60
Yes YesPublic Public
C CC CC CR RC C
2.9 3.0 ..20.3 .. ..
0.1 0.0 0.919.0 53.0 60.0
0.0 0.0 0.30.7a 2.3a 4.80.6a 2.4a 7.1
3.2 2.1 ..55.1 33.0 48.9
0.7 3.8a 9.5
0 20 51246 369 4,245
11.9 9.8 9.4400.2 397.7 33.6
20.0 15.0 8.050.0 20.0 10.8
.. .. ..
.. .. 3.437.3 10.0 ..
0.09 0.05 0.110.1 0.3 1.5

Economic and social contextPopulation (millions)Urban population (% of total)GNI per capita, World Bank Atlas method ($)GDP growth, 2005–10 and 2010–15 (avg. annual %)Adult literacy rate (% ages 15 and older) Gross primary, secondary, and tertiary school enrollment (%)
Sector structureSeparate telecommunications/ICT regulatorStatus of main fixed-line telephone operatorLevel of competition (competition, partial comp., monopoly) International gateway(s) Mobile telephone service Internet serviceForeign ownership (not allowed, restricted, allowed)Reg. treatment of VoIP (banned, closed, no framework, allowed)
Sector efficiency and capacityTelecommunications revenue (% of GDP)Telecommunications investment (% of revenue)
Sector performanceAccessFixed-telephone subscriptions (per 100 people)Mobile-cellular telephone subscriptions (per 100 people)Fixed-broadband subscriptions (per 100 people)Households with a computer (%)Households with Internet access at home (%)
Usage Int’l. voice traffic, total (minutes/subscription/month)Domestic mobile traffic (minutes/subscription/month)Individuals using the Internet (%)
Quality Population covered by at least a 3G mobile network (%)International Internet bandwidth (bit/s per Internet user)
AffordabilityMobile-cellular sub-basket ($ a month)Fixed-broadband sub-basket ($ a month)Mobile-b’band, prepaid handset-based, 500 MB ($ a month)Mobile-b’band, postpaid computer-based, 1 GB ($ a month)
TradeICT goods exports (% of total goods exports)ICT goods imports (% of total goods imports)ICT service exports (% of total service exports)
ApplicationsOnline service index (0-1, 1=highest presence)Secure Internet servers (per million people)
63The Little Data Book on Information and Communication Technology 2017
Sub-Saharan Africa Lower middle income
Congo, Rep.
2010 2015 2015
Lowermiddle-incomegroupCountry data
4 5 2,92763 65 39
2,230 2,540 2,0354.9 4.2 5.479 79 ..67 .. 68
Yes YesPublic Public
C ..C ..C ..A RC A
3.5 .. ..17.7 .. ..
0.3 0.4 3.590.4 111.7 90.5
0.0 0.0 1.93.5a 5.2a 19.30.7a 2.3a 24.3
8.2 .. 7.521.1 .. 152.0
5.0a 7.6a 28.6
.. .. ..117 185 10,372
.. 8.2 6.9
.. 81.8 14.324.5 5.0 5.8
.. 16.9 10.0
0.0 0.0 5.70.9 2.1 7.6
.. .. 48.0
0.08 0.10 0.261.2 1.7 7.4
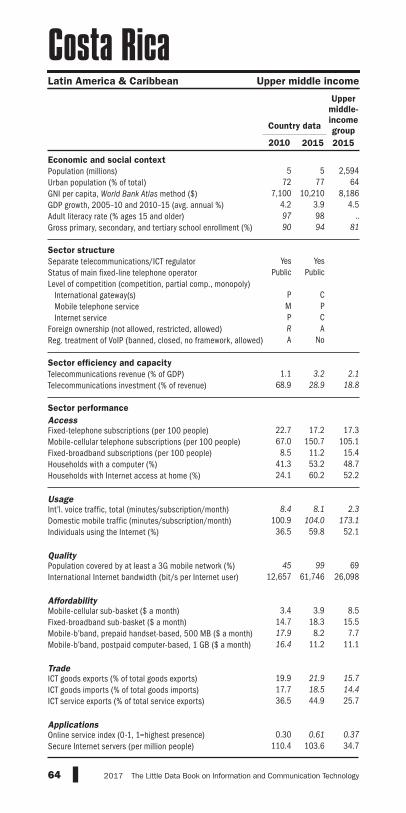
Economic and social contextPopulation (millions)Urban population (% of total)GNI per capita, World Bank Atlas method ($)GDP growth, 2005–10 and 2010–15 (avg. annual %)Adult literacy rate (% ages 15 and older) Gross primary, secondary, and tertiary school enrollment (%)
Sector structureSeparate telecommunications/ICT regulatorStatus of main fixed-line telephone operatorLevel of competition (competition, partial comp., monopoly) International gateway(s) Mobile telephone service Internet serviceForeign ownership (not allowed, restricted, allowed)Reg. treatment of VoIP (banned, closed, no framework, allowed)
Sector efficiency and capacityTelecommunications revenue (% of GDP)Telecommunications investment (% of revenue)
Sector performanceAccessFixed-telephone subscriptions (per 100 people)Mobile-cellular telephone subscriptions (per 100 people)Fixed-broadband subscriptions (per 100 people)Households with a computer (%)Households with Internet access at home (%)
Usage Int’l. voice traffic, total (minutes/subscription/month)Domestic mobile traffic (minutes/subscription/month)Individuals using the Internet (%)
Quality Population covered by at least a 3G mobile network (%)International Internet bandwidth (bit/s per Internet user)
AffordabilityMobile-cellular sub-basket ($ a month)Fixed-broadband sub-basket ($ a month)Mobile-b’band, prepaid handset-based, 500 MB ($ a month)Mobile-b’band, postpaid computer-based, 1 GB ($ a month)
TradeICT goods exports (% of total goods exports)ICT goods imports (% of total goods imports)ICT service exports (% of total service exports)
ApplicationsOnline service index (0-1, 1=highest presence)Secure Internet servers (per million people)
64 2017 The Little Data Book on Information and Communication Technology
Latin America & Caribbean Upper middle income
Costa Rica
2010 2015 2015
Uppermiddle-incomegroupCountry data
5 5 2,59472 77 64
7,100 10,210 8,1864.2 3.9 4.597 98 ..90 94 81
Yes YesPublic Public
P CM PP CR AA No
1.1 3.2 2.168.9 28.9 18.8
22.7 17.2 17.367.0 150.7 105.1
8.5 11.2 15.441.3 53.2 48.724.1 60.2 52.2
8.4 8.1 2.3100.9 104.0 173.1
36.5 59.8 52.1
45 99 6912,657 61,746 26,098
3.4 3.9 8.514.7 18.3 15.517.9 8.2 7.716.4 11.2 11.1
19.9 21.9 15.717.7 18.5 14.436.5 44.9 25.7
0.30 0.61 0.37110.4 103.6 34.7

Economic and social contextPopulation (millions)Urban population (% of total)GNI per capita, World Bank Atlas method ($)GDP growth, 2005–10 and 2010–15 (avg. annual %)Adult literacy rate (% ages 15 and older) Gross primary, secondary, and tertiary school enrollment (%)
Sector structureSeparate telecommunications/ICT regulatorStatus of main fixed-line telephone operatorLevel of competition (competition, partial comp., monopoly) International gateway(s) Mobile telephone service Internet serviceForeign ownership (not allowed, restricted, allowed)Reg. treatment of VoIP (banned, closed, no framework, allowed)
Sector efficiency and capacityTelecommunications revenue (% of GDP)Telecommunications investment (% of revenue)
Sector performanceAccessFixed-telephone subscriptions (per 100 people)Mobile-cellular telephone subscriptions (per 100 people)Fixed-broadband subscriptions (per 100 people)Households with a computer (%)Households with Internet access at home (%)
Usage Int’l. voice traffic, total (minutes/subscription/month)Domestic mobile traffic (minutes/subscription/month)Individuals using the Internet (%)
Quality Population covered by at least a 3G mobile network (%)International Internet bandwidth (bit/s per Internet user)
AffordabilityMobile-cellular sub-basket ($ a month)Fixed-broadband sub-basket ($ a month)Mobile-b’band, prepaid handset-based, 500 MB ($ a month)Mobile-b’band, postpaid computer-based, 1 GB ($ a month)
TradeICT goods exports (% of total goods exports)ICT goods imports (% of total goods imports)ICT service exports (% of total service exports)
ApplicationsOnline service index (0-1, 1=highest presence)Secure Internet servers (per million people)
65The Little Data Book on Information and Communication Technology 2017
Sub-Saharan Africa Lower middle income
Côte d’Ivoire
2010 2015 2015
Lowermiddle-incomegroupCountry data
20 23 2,92751 54 39
1,210 1,410 2,0352.3 7.2 5.441 43 ..
.. 52 68
Yes YesMixed Mixed
M MP PC CA AB No
6.4 5.8 ..18.2 13.2 ..
1.5 1.3 3.582.2 119.3 90.5
0.1 0.5 1.91.8a 8.8a 19.31.1a 17.2a 24.3
5.9 4.7 7.543.9 67.9 152.0
2.7a 21.0a 28.6
0 71 ..7,807 5,194 10,372
16.1 14.2 6.940.1 34.8 14.329.4 10.0 5.829.4 25.4 10.0
0.2 0.2 5.73.3 2.5 7.6
28.5 29.9 48.0
0.32 0.17 0.261.0 4.1 7.4

Economic and social contextPopulation (millions)Urban population (% of total)GNI per capita, World Bank Atlas method ($)GDP growth, 2005–10 and 2010–15 (avg. annual %)Adult literacy rate (% ages 15 and older) Gross primary, secondary, and tertiary school enrollment (%)
Sector structureSeparate telecommunications/ICT regulatorStatus of main fixed-line telephone operatorLevel of competition (competition, partial comp., monopoly) International gateway(s) Mobile telephone service Internet serviceForeign ownership (not allowed, restricted, allowed)Reg. treatment of VoIP (banned, closed, no framework, allowed)
Sector efficiency and capacityTelecommunications revenue (% of GDP)Telecommunications investment (% of revenue)
Sector performanceAccessFixed-telephone subscriptions (per 100 people)Mobile-cellular telephone subscriptions (per 100 people)Fixed-broadband subscriptions (per 100 people)Households with a computer (%)Households with Internet access at home (%)
Usage Int’l. voice traffic, total (minutes/subscription/month)Domestic mobile traffic (minutes/subscription/month)Individuals using the Internet (%)
Quality Population covered by at least a 3G mobile network (%)International Internet bandwidth (bit/s per Internet user)
AffordabilityMobile-cellular sub-basket ($ a month)Fixed-broadband sub-basket ($ a month)Mobile-b’band, prepaid handset-based, 500 MB ($ a month)Mobile-b’band, postpaid computer-based, 1 GB ($ a month)
TradeICT goods exports (% of total goods exports)ICT goods imports (% of total goods imports)ICT service exports (% of total service exports)
ApplicationsOnline service index (0-1, 1=highest presence)Secure Internet servers (per million people)
66 2017 The Little Data Book on Information and Communication Technology
Europe & Central Asia High income
Croatia
2010 2015 2015
High-incomegroupCountry data
4 4 1,18758 59 81
13,750 12,690 41,3660.3 –0.7 1.599 99 ..84 90 95
Yes YesMixed Mixed
C ..C CC ..A AA A
4.7 2.8 2.512.6 20.4 18.8
43.0 34.7 41.2113.6a 103.8 124.5
19.3 23.2 31.060.0 76.8 83.256.5 76.7 85.0
11.6 8.5 ..99.0 158.5 195.956.6 69.8 81.0
79 99 9922,420 72,381 134,761
17.1 9.7 14.218.2 14.8 25.2
8.5 5.8 10.4.. 11.5 14.4
2.1 2.0 9.55.5 4.9 11.2
12.8 13.0 32.0
0.42 0.46 0.67168.9 264.4 1,194.6
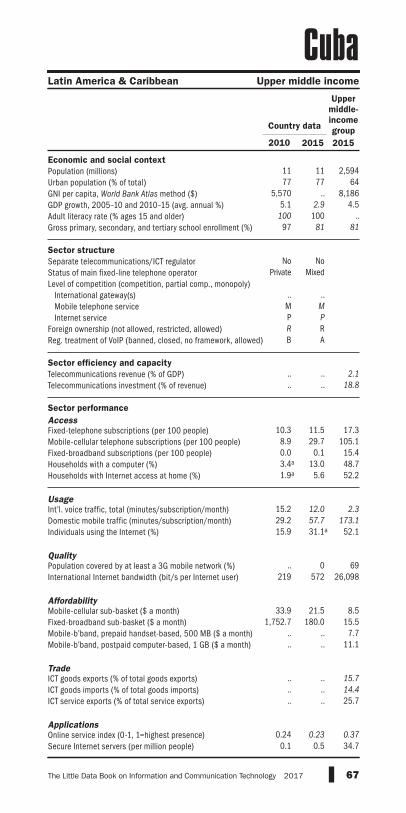
Economic and social contextPopulation (millions)Urban population (% of total)GNI per capita, World Bank Atlas method ($)GDP growth, 2005–10 and 2010–15 (avg. annual %)Adult literacy rate (% ages 15 and older) Gross primary, secondary, and tertiary school enrollment (%)
Sector structureSeparate telecommunications/ICT regulatorStatus of main fixed-line telephone operatorLevel of competition (competition, partial comp., monopoly) International gateway(s) Mobile telephone service Internet serviceForeign ownership (not allowed, restricted, allowed)Reg. treatment of VoIP (banned, closed, no framework, allowed)
Sector efficiency and capacityTelecommunications revenue (% of GDP)Telecommunications investment (% of revenue)
Sector performanceAccessFixed-telephone subscriptions (per 100 people)Mobile-cellular telephone subscriptions (per 100 people)Fixed-broadband subscriptions (per 100 people)Households with a computer (%)Households with Internet access at home (%)
Usage Int’l. voice traffic, total (minutes/subscription/month)Domestic mobile traffic (minutes/subscription/month)Individuals using the Internet (%)
Quality Population covered by at least a 3G mobile network (%)International Internet bandwidth (bit/s per Internet user)
AffordabilityMobile-cellular sub-basket ($ a month)Fixed-broadband sub-basket ($ a month)Mobile-b’band, prepaid handset-based, 500 MB ($ a month)Mobile-b’band, postpaid computer-based, 1 GB ($ a month)
TradeICT goods exports (% of total goods exports)ICT goods imports (% of total goods imports)ICT service exports (% of total service exports)
ApplicationsOnline service index (0-1, 1=highest presence)Secure Internet servers (per million people)
67The Little Data Book on Information and Communication Technology 2017
Latin America & Caribbean Upper middle income
Cuba
2010 2015 2015
Uppermiddle-incomegroupCountry data
11 11 2,59477 77 64
5,570 .. 8,1865.1 2.9 4.5
100 100 ..97 81 81
No NoPrivate Mixed
.. ..M MP PR RB A
.. .. 2.1
.. .. 18.8
10.3 11.5 17.38.9 29.7 105.10.0 0.1 15.43.4a 13.0 48.71.9a 5.6 52.2
15.2 12.0 2.329.2 57.7 173.115.9 31.1a 52.1
.. 0 69219 572 26,098
33.9 21.5 8.51,752.7 180.0 15.5
.. .. 7.7
.. .. 11.1
.. .. 15.7
.. .. 14.4
.. .. 25.7
0.24 0.23 0.370.1 0.5 34.7

Economic and social contextPopulation (millions)Urban population (% of total)GNI per capita, World Bank Atlas method ($)GDP growth, 2005–10 and 2010–15 (avg. annual %)Adult literacy rate (% ages 15 and older) Gross primary, secondary, and tertiary school enrollment (%)
Sector structureSeparate telecommunications/ICT regulatorStatus of main fixed-line telephone operatorLevel of competition (competition, partial comp., monopoly) International gateway(s) Mobile telephone service Internet serviceForeign ownership (not allowed, restricted, allowed)Reg. treatment of VoIP (banned, closed, no framework, allowed)
Sector efficiency and capacityTelecommunications revenue (% of GDP)Telecommunications investment (% of revenue)
Sector performanceAccessFixed-telephone subscriptions (per 100 people)Mobile-cellular telephone subscriptions (per 100 people)Fixed-broadband subscriptions (per 100 people)Households with a computer (%)Households with Internet access at home (%)
Usage Int’l. voice traffic, total (minutes/subscription/month)Domestic mobile traffic (minutes/subscription/month)Individuals using the Internet (%)
Quality Population covered by at least a 3G mobile network (%)International Internet bandwidth (bit/s per Internet user)
AffordabilityMobile-cellular sub-basket ($ a month)Fixed-broadband sub-basket ($ a month)Mobile-b’band, prepaid handset-based, 500 MB ($ a month)Mobile-b’band, postpaid computer-based, 1 GB ($ a month)
TradeICT goods exports (% of total goods exports)ICT goods imports (% of total goods imports)ICT service exports (% of total service exports)
ApplicationsOnline service index (0-1, 1=highest presence)Secure Internet servers (per million people)
68 2017 The Little Data Book on Information and Communication Technology
Latin America & Caribbean High income
Curaçao
2010 2015 2015
High-incomegroupCountry data
0.15 0.16 1,18790 89 81
.. .. 41,366
.. .. 1.5
.. .. ..
.. 107 95
.. ..
.. ..
.. ..
.. ..
.. ..
.. ..
.. ..
.. .. 2.5
.. .. 18.8
53.4 38.2 41.2138.3 114.2 124.5
21.0 24.3 31.062.7 .. 83.253.2 .. 85.0
.. .. ..
.. .. 195.9
.. .. 81.0
.. 82a 99
.. .. 134,761
.. .. 14.2
.. .. 25.2
.. .. 10.4
.. .. 14.4
.. .. 9.5
.. .. 11.221.2 22.2 32.0
.. .. 0.6739.5 537.8 1,194.6

Economic and social contextPopulation (millions)Urban population (% of total)GNI per capita, World Bank Atlas method ($)GDP growth, 2005–10 and 2010–15 (avg. annual %)Adult literacy rate (% ages 15 and older) Gross primary, secondary, and tertiary school enrollment (%)
Sector structureSeparate telecommunications/ICT regulatorStatus of main fixed-line telephone operatorLevel of competition (competition, partial comp., monopoly) International gateway(s) Mobile telephone service Internet serviceForeign ownership (not allowed, restricted, allowed)Reg. treatment of VoIP (banned, closed, no framework, allowed)
Sector efficiency and capacityTelecommunications revenue (% of GDP)Telecommunications investment (% of revenue)
Sector performanceAccessFixed-telephone subscriptions (per 100 people)Mobile-cellular telephone subscriptions (per 100 people)Fixed-broadband subscriptions (per 100 people)Households with a computer (%)Households with Internet access at home (%)
Usage Int’l. voice traffic, total (minutes/subscription/month)Domestic mobile traffic (minutes/subscription/month)Individuals using the Internet (%)
Quality Population covered by at least a 3G mobile network (%)International Internet bandwidth (bit/s per Internet user)
AffordabilityMobile-cellular sub-basket ($ a month)Fixed-broadband sub-basket ($ a month)Mobile-b’band, prepaid handset-based, 500 MB ($ a month)Mobile-b’band, postpaid computer-based, 1 GB ($ a month)
TradeICT goods exports (% of total goods exports)ICT goods imports (% of total goods imports)ICT service exports (% of total service exports)
ApplicationsOnline service index (0-1, 1=highest presence)Secure Internet servers (per million people)
69The Little Data Book on Information and Communication Technology 2017
Europe & Central Asia High income
Cyprus
2010 2015 2015
High-incomegroupCountry data
1 1 1,18768 67 81
30,910 25,930 41,3662.4 –2.4 1.599 99 ..79 83 95
Yes YesPublic Public
C CP PC CA AA A
2.7 3.1 2.523.7 10.8 18.8
37.4 27.8 41.293.7 95.4 124.517.6 22.4 31.060.5 71.5 83.253.7 71.2 85.0
52.4 31.5 ..237.0 214.1 195.9
53.0 71.7 81.0
85 90 9951,638 89,791 134,761
7.7 6.9 14.234.8 17.8 25.238.6 22.2 10.423.5 16.6 14.4
9.2 5.0 9.54.7 4.3 11.28.8 14.6 32.0
0.37 0.47 0.67838.1 677.1 1,194.6

Economic and social contextPopulation (millions)Urban population (% of total)GNI per capita, World Bank Atlas method ($)GDP growth, 2005–10 and 2010–15 (avg. annual %)Adult literacy rate (% ages 15 and older) Gross primary, secondary, and tertiary school enrollment (%)
Sector structureSeparate telecommunications/ICT regulatorStatus of main fixed-line telephone operatorLevel of competition (competition, partial comp., monopoly) International gateway(s) Mobile telephone service Internet serviceForeign ownership (not allowed, restricted, allowed)Reg. treatment of VoIP (banned, closed, no framework, allowed)
Sector efficiency and capacityTelecommunications revenue (% of GDP)Telecommunications investment (% of revenue)
Sector performanceAccessFixed-telephone subscriptions (per 100 people)Mobile-cellular telephone subscriptions (per 100 people)Fixed-broadband subscriptions (per 100 people)Households with a computer (%)Households with Internet access at home (%)
Usage Int’l. voice traffic, total (minutes/subscription/month)Domestic mobile traffic (minutes/subscription/month)Individuals using the Internet (%)
Quality Population covered by at least a 3G mobile network (%)International Internet bandwidth (bit/s per Internet user)
AffordabilityMobile-cellular sub-basket ($ a month)Fixed-broadband sub-basket ($ a month)Mobile-b’band, prepaid handset-based, 500 MB ($ a month)Mobile-b’band, postpaid computer-based, 1 GB ($ a month)
TradeICT goods exports (% of total goods exports)ICT goods imports (% of total goods imports)ICT service exports (% of total service exports)
ApplicationsOnline service index (0-1, 1=highest presence)Secure Internet servers (per million people)
70 2017 The Little Data Book on Information and Communication Technology
Europe & Central Asia High income
Czech Republic
2010 2015 2015
High-incomegroupCountry data
10 11 1,18773 73 81
19,210 18,050 41,3662.1 1.0 1.5
.. .. ..87 94 95
Yes YesPrivate Private
.. ..
.. ..C CR AA A
3.1 1.8 2.512.4 28.9 18.8
22.4 18.1 41.2122.6 129.2 124.5
21.4 27.9 31.064.1 78.9 83.260.5 79.0 85.0
9.7 10.9 ..94.5 121.0 195.968.8 81.3 81.0
90 99 9968,842 119,841 134,761
28.1 13.3 14.231.2 14.2 25.224.4 12.2 10.425.5 14.2 14.4
15.0 13.4 9.517.8 14.1 11.227.8 31.6 32.0
0.45 0.37 0.67319.7 866.8 1,194.6

Economic and social contextPopulation (millions)Urban population (% of total)GNI per capita, World Bank Atlas method ($)GDP growth, 2005–10 and 2010–15 (avg. annual %)Adult literacy rate (% ages 15 and older) Gross primary, secondary, and tertiary school enrollment (%)
Sector structureSeparate telecommunications/ICT regulatorStatus of main fixed-line telephone operatorLevel of competition (competition, partial comp., monopoly) International gateway(s) Mobile telephone service Internet serviceForeign ownership (not allowed, restricted, allowed)Reg. treatment of VoIP (banned, closed, no framework, allowed)
Sector efficiency and capacityTelecommunications revenue (% of GDP)Telecommunications investment (% of revenue)
Sector performanceAccessFixed-telephone subscriptions (per 100 people)Mobile-cellular telephone subscriptions (per 100 people)Fixed-broadband subscriptions (per 100 people)Households with a computer (%)Households with Internet access at home (%)
Usage Int’l. voice traffic, total (minutes/subscription/month)Domestic mobile traffic (minutes/subscription/month)Individuals using the Internet (%)
Quality Population covered by at least a 3G mobile network (%)International Internet bandwidth (bit/s per Internet user)
AffordabilityMobile-cellular sub-basket ($ a month)Fixed-broadband sub-basket ($ a month)Mobile-b’band, prepaid handset-based, 500 MB ($ a month)Mobile-b’band, postpaid computer-based, 1 GB ($ a month)
TradeICT goods exports (% of total goods exports)ICT goods imports (% of total goods imports)ICT service exports (% of total service exports)
ApplicationsOnline service index (0-1, 1=highest presence)Secure Internet servers (per million people)
71The Little Data Book on Information and Communication Technology 2017
Europe & Central Asia High income
Denmark
2010 2015 2015
High-incomegroupCountry data
6 6 1,18787 88 81
60,820 58,590 41,366–0.4 0.5 1.5
.. .. ..100 105 95
Yes YesPrivate Private
C CP PC CA AA A
2.3 1.8 2.518.2 18.0 18.8
47.1 29.9 41.2115.7 128.3 124.5
38.1 42.5 31.088.0 92.3 83.286.1 91.7 85.0
18.8 18.1 ..139.3 142.5 195.9
88.7 96.3 81.0
70 100 99142,137 328,018 134,761
7.9 35.2 14.243.9 38.5 25.285.5 44.6 10.417.1 7.3 14.4
3.7 3.6 9.57.9 7.3 11.2
.. 16.9 32.0
0.67 0.66 0.671,872.1 1,975.9 1,194.6

Economic and social contextPopulation (millions)Urban population (% of total)GNI per capita, World Bank Atlas method ($)GDP growth, 2005–10 and 2010–15 (avg. annual %)Adult literacy rate (% ages 15 and older) Gross primary, secondary, and tertiary school enrollment (%)
Sector structureSeparate telecommunications/ICT regulatorStatus of main fixed-line telephone operatorLevel of competition (competition, partial comp., monopoly) International gateway(s) Mobile telephone service Internet serviceForeign ownership (not allowed, restricted, allowed)Reg. treatment of VoIP (banned, closed, no framework, allowed)
Sector efficiency and capacityTelecommunications revenue (% of GDP)Telecommunications investment (% of revenue)
Sector performanceAccessFixed-telephone subscriptions (per 100 people)Mobile-cellular telephone subscriptions (per 100 people)Fixed-broadband subscriptions (per 100 people)Households with a computer (%)Households with Internet access at home (%)
Usage Int’l. voice traffic, total (minutes/subscription/month)Domestic mobile traffic (minutes/subscription/month)Individuals using the Internet (%)
Quality Population covered by at least a 3G mobile network (%)International Internet bandwidth (bit/s per Internet user)
AffordabilityMobile-cellular sub-basket ($ a month)Fixed-broadband sub-basket ($ a month)Mobile-b’band, prepaid handset-based, 500 MB ($ a month)Mobile-b’band, postpaid computer-based, 1 GB ($ a month)
TradeICT goods exports (% of total goods exports)ICT goods imports (% of total goods imports)ICT service exports (% of total service exports)
ApplicationsOnline service index (0-1, 1=highest presence)Secure Internet servers (per million people)
72 2017 The Little Data Book on Information and Communication Technology
Middle East & North Africa Lower middle income
Djibouti
2010 2015 2015
Lowermiddle-incomegroupCountry data
0.83 0.89 2,92777 77 39
.. .. 2,0355.0 5.0 5.4
.. .. ..37 .. 68
No NoPublic Public
M MM MM M
No NoB C
5.7 .. ..14.3 .. ..
2.2 2.6 3.519.9 34.7 90.5
1.0 2.3 1.913.0a 19.1a 19.3
3.5a 8.1a 24.3
124.9 .. 7.532.0 .. 152.0
6.5a 11.9a 28.6
0 .. ..15,439 10,255 10,372
13.0 11.3 6.941.8 31.6 14.3
.. .. 5.8
.. .. 10.0
0.1 .. 5.75.4 .. 7.64.7 .. 48.0
0.05 0.06 0.266.0 9.0 7.4

Economic and social contextPopulation (millions)Urban population (% of total)GNI per capita, World Bank Atlas method ($)GDP growth, 2005–10 and 2010–15 (avg. annual %)Adult literacy rate (% ages 15 and older) Gross primary, secondary, and tertiary school enrollment (%)
Sector structureSeparate telecommunications/ICT regulatorStatus of main fixed-line telephone operatorLevel of competition (competition, partial comp., monopoly) International gateway(s) Mobile telephone service Internet serviceForeign ownership (not allowed, restricted, allowed)Reg. treatment of VoIP (banned, closed, no framework, allowed)
Sector efficiency and capacityTelecommunications revenue (% of GDP)Telecommunications investment (% of revenue)
Sector performanceAccessFixed-telephone subscriptions (per 100 people)Mobile-cellular telephone subscriptions (per 100 people)Fixed-broadband subscriptions (per 100 people)Households with a computer (%)Households with Internet access at home (%)
Usage Int’l. voice traffic, total (minutes/subscription/month)Domestic mobile traffic (minutes/subscription/month)Individuals using the Internet (%)
Quality Population covered by at least a 3G mobile network (%)International Internet bandwidth (bit/s per Internet user)
AffordabilityMobile-cellular sub-basket ($ a month)Fixed-broadband sub-basket ($ a month)Mobile-b’band, prepaid handset-based, 500 MB ($ a month)Mobile-b’band, postpaid computer-based, 1 GB ($ a month)
TradeICT goods exports (% of total goods exports)ICT goods imports (% of total goods imports)ICT service exports (% of total service exports)
ApplicationsOnline service index (0-1, 1=highest presence)Secure Internet servers (per million people)
73The Little Data Book on Information and Communication Technology 2017
Latin America & Caribbean Upper middle income
Dominica
2010 2015 2015
Uppermiddle-incomegroupCountry data
0.07 0.07 2,59468 70 64
6,700 6,760 8,1863.5 1.1 4.5
.. .. ..
.. .. 81
Yes YesMixed Mixed
C CC CC CA A
No No
6.9 .. 2.118.5 .. 18.8
21.8 20.8 17.3148.3 106.3 105.1
11.7 20.9 15.430.0a 50.0a 48.728.0a 58.4a 52.2
14.6 .. 2.3112.1 .. 173.1
47.5 67.6a 52.1
0 60a 6963,816 193,358 26,098
16.7 21.1 8.547.8 32.2 15.5
.. 34.1 7.7
.. 22.2 11.1
2.5 .. 15.74.8 .. 14.4
22.4 21.0 25.7
0.05 0.19 0.37309.1 454.0 34.7
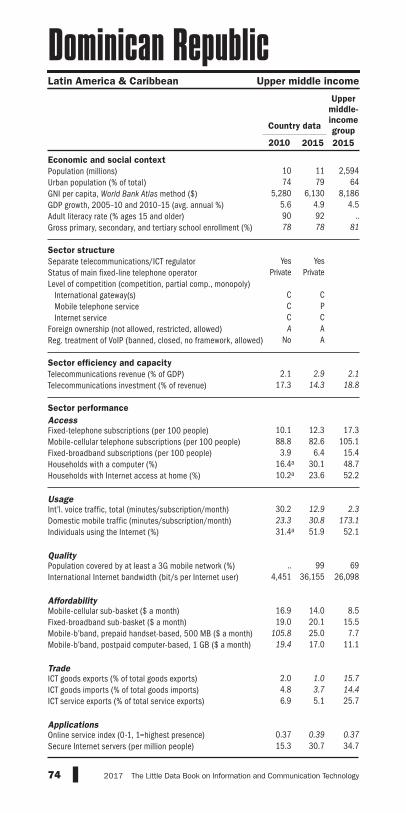
Economic and social contextPopulation (millions)Urban population (% of total)GNI per capita, World Bank Atlas method ($)GDP growth, 2005–10 and 2010–15 (avg. annual %)Adult literacy rate (% ages 15 and older) Gross primary, secondary, and tertiary school enrollment (%)
Sector structureSeparate telecommunications/ICT regulatorStatus of main fixed-line telephone operatorLevel of competition (competition, partial comp., monopoly) International gateway(s) Mobile telephone service Internet serviceForeign ownership (not allowed, restricted, allowed)Reg. treatment of VoIP (banned, closed, no framework, allowed)
Sector efficiency and capacityTelecommunications revenue (% of GDP)Telecommunications investment (% of revenue)
Sector performanceAccessFixed-telephone subscriptions (per 100 people)Mobile-cellular telephone subscriptions (per 100 people)Fixed-broadband subscriptions (per 100 people)Households with a computer (%)Households with Internet access at home (%)
Usage Int’l. voice traffic, total (minutes/subscription/month)Domestic mobile traffic (minutes/subscription/month)Individuals using the Internet (%)
Quality Population covered by at least a 3G mobile network (%)International Internet bandwidth (bit/s per Internet user)
AffordabilityMobile-cellular sub-basket ($ a month)Fixed-broadband sub-basket ($ a month)Mobile-b’band, prepaid handset-based, 500 MB ($ a month)Mobile-b’band, postpaid computer-based, 1 GB ($ a month)
TradeICT goods exports (% of total goods exports)ICT goods imports (% of total goods imports)ICT service exports (% of total service exports)
ApplicationsOnline service index (0-1, 1=highest presence)Secure Internet servers (per million people)
74 2017 The Little Data Book on Information and Communication Technology
Latin America & Caribbean Upper middle income
Dominican Republic
2010 2015 2015
Uppermiddle-incomegroupCountry data
10 11 2,59474 79 64
5,280 6,130 8,1865.6 4.9 4.590 92 ..78 78 81
Yes YesPrivate Private
C CC PC CA A
No A
2.1 2.9 2.117.3 14.3 18.8
10.1 12.3 17.388.8 82.6 105.1
3.9 6.4 15.416.4a 30.1 48.710.2a 23.6 52.2
30.2 12.9 2.323.3 30.8 173.131.4a 51.9 52.1
.. 99 694,451 36,155 26,098
16.9 14.0 8.519.0 20.1 15.5
105.8 25.0 7.719.4 17.0 11.1
2.0 1.0 15.74.8 3.7 14.46.9 5.1 25.7
0.37 0.39 0.3715.3 30.7 34.7

Economic and social contextPopulation (millions)Urban population (% of total)GNI per capita, World Bank Atlas method ($)GDP growth, 2005–10 and 2010–15 (avg. annual %)Adult literacy rate (% ages 15 and older) Gross primary, secondary, and tertiary school enrollment (%)
Sector structureSeparate telecommunications/ICT regulatorStatus of main fixed-line telephone operatorLevel of competition (competition, partial comp., monopoly) International gateway(s) Mobile telephone service Internet serviceForeign ownership (not allowed, restricted, allowed)Reg. treatment of VoIP (banned, closed, no framework, allowed)
Sector efficiency and capacityTelecommunications revenue (% of GDP)Telecommunications investment (% of revenue)
Sector performanceAccessFixed-telephone subscriptions (per 100 people)Mobile-cellular telephone subscriptions (per 100 people)Fixed-broadband subscriptions (per 100 people)Households with a computer (%)Households with Internet access at home (%)
Usage Int’l. voice traffic, total (minutes/subscription/month)Domestic mobile traffic (minutes/subscription/month)Individuals using the Internet (%)
Quality Population covered by at least a 3G mobile network (%)International Internet bandwidth (bit/s per Internet user)
AffordabilityMobile-cellular sub-basket ($ a month)Fixed-broadband sub-basket ($ a month)Mobile-b’band, prepaid handset-based, 500 MB ($ a month)Mobile-b’band, postpaid computer-based, 1 GB ($ a month)
TradeICT goods exports (% of total goods exports)ICT goods imports (% of total goods imports)ICT service exports (% of total service exports)
ApplicationsOnline service index (0-1, 1=highest presence)Secure Internet servers (per million people)
75The Little Data Book on Information and Communication Technology 2017
Latin America & Caribbean Upper middle income
Ecuador
2010 2015 2015
Uppermiddle-incomegroupCountry data
15 16 2,59463 64 64
4,410 6,010 8,1863.4 4.4 4.592 95 ..84 89 81
Yes YesPublic Public
C CC CC CA AA A
3.4 2.9 2.19.4 10.3 18.8
13.9 15.5 17.398.5 79.4 105.1
1.5 9.2 15.427.0 40.8 48.711.5 32.8 52.2
5.3 5.1 2.3134.4 78.2 173.1
29.0 48.9 52.1
66 92 697,950 56,561 26,098
17.1 17.2 8.522.6 20.2 15.521.3 20.0 7.724.0 22.4 11.1
0.1 0.1 15.76.3 6.6 14.4
.. .. 25.7
0.32 0.48 0.3714.1 41.9 34.7

Economic and social contextPopulation (millions)Urban population (% of total)GNI per capita, World Bank Atlas method ($)GDP growth, 2005–10 and 2010–15 (avg. annual %)Adult literacy rate (% ages 15 and older) Gross primary, secondary, and tertiary school enrollment (%)
Sector structureSeparate telecommunications/ICT regulatorStatus of main fixed-line telephone operatorLevel of competition (competition, partial comp., monopoly) International gateway(s) Mobile telephone service Internet serviceForeign ownership (not allowed, restricted, allowed)Reg. treatment of VoIP (banned, closed, no framework, allowed)
Sector efficiency and capacityTelecommunications revenue (% of GDP)Telecommunications investment (% of revenue)
Sector performanceAccessFixed-telephone subscriptions (per 100 people)Mobile-cellular telephone subscriptions (per 100 people)Fixed-broadband subscriptions (per 100 people)Households with a computer (%)Households with Internet access at home (%)
Usage Int’l. voice traffic, total (minutes/subscription/month)Domestic mobile traffic (minutes/subscription/month)Individuals using the Internet (%)
Quality Population covered by at least a 3G mobile network (%)International Internet bandwidth (bit/s per Internet user)
AffordabilityMobile-cellular sub-basket ($ a month)Fixed-broadband sub-basket ($ a month)Mobile-b’band, prepaid handset-based, 500 MB ($ a month)Mobile-b’band, postpaid computer-based, 1 GB ($ a month)
TradeICT goods exports (% of total goods exports)ICT goods imports (% of total goods imports)ICT service exports (% of total service exports)
ApplicationsOnline service index (0-1, 1=highest presence)Secure Internet servers (per million people)
76 2017 The Little Data Book on Information and Communication Technology
Middle East & North Africa Lower middle income
Egypt, Arab Rep.
2010 2015 2015
Lowermiddle-incomegroupCountry data
82 92 2,92743 43 39
2,390 3,340 2,0356.2 2.4 5.472 76 ..72 78 68
Yes YesMixed Mixed
P PC CC CR AA B
3.2 2.2 ..50.7 33.8 ..
12.3 7.4 3.590.5 111.0 90.5
1.9 4.5 1.931.3 50.8a 19.325.3 41.8a 24.3
5.6 6.3 7.5122.0 .. 152.0
21.6 35.9 28.6
87 98 ..5,370 11,318 10,372
7.0 4.8 6.98.0 6.5 14.38.3 3.0 5.84.8 3.3 10.0
0.1 2.8 5.73.7 4.2 7.68.8 10.5 48.0
0.53 0.59 0.262.3 5.4 7.4
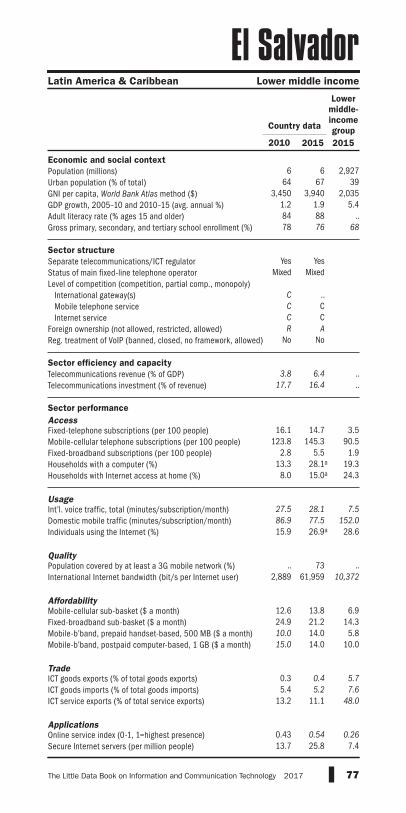
Economic and social contextPopulation (millions)Urban population (% of total)GNI per capita, World Bank Atlas method ($)GDP growth, 2005–10 and 2010–15 (avg. annual %)Adult literacy rate (% ages 15 and older) Gross primary, secondary, and tertiary school enrollment (%)
Sector structureSeparate telecommunications/ICT regulatorStatus of main fixed-line telephone operatorLevel of competition (competition, partial comp., monopoly) International gateway(s) Mobile telephone service Internet serviceForeign ownership (not allowed, restricted, allowed)Reg. treatment of VoIP (banned, closed, no framework, allowed)
Sector efficiency and capacityTelecommunications revenue (% of GDP)Telecommunications investment (% of revenue)
Sector performanceAccessFixed-telephone subscriptions (per 100 people)Mobile-cellular telephone subscriptions (per 100 people)Fixed-broadband subscriptions (per 100 people)Households with a computer (%)Households with Internet access at home (%)
Usage Int’l. voice traffic, total (minutes/subscription/month)Domestic mobile traffic (minutes/subscription/month)Individuals using the Internet (%)
Quality Population covered by at least a 3G mobile network (%)International Internet bandwidth (bit/s per Internet user)
AffordabilityMobile-cellular sub-basket ($ a month)Fixed-broadband sub-basket ($ a month)Mobile-b’band, prepaid handset-based, 500 MB ($ a month)Mobile-b’band, postpaid computer-based, 1 GB ($ a month)
TradeICT goods exports (% of total goods exports)ICT goods imports (% of total goods imports)ICT service exports (% of total service exports)
ApplicationsOnline service index (0-1, 1=highest presence)Secure Internet servers (per million people)
77The Little Data Book on Information and Communication Technology 2017
Latin America & Caribbean Lower middle income
El Salvador
2010 2015 2015
Lowermiddle-incomegroupCountry data
6 6 2,92764 67 39
3,450 3,940 2,0351.2 1.9 5.484 88 ..78 76 68
Yes YesMixed Mixed
C ..C CC CR A
No No
3.8 6.4 ..17.7 16.4 ..
16.1 14.7 3.5123.8 145.3 90.5
2.8 5.5 1.913.3 28.1a 19.3
8.0 15.0a 24.3
27.5 28.1 7.586.9 77.5 152.015.9 26.9a 28.6
.. 73 ..2,889 61,959 10,372
12.6 13.8 6.924.9 21.2 14.310.0 14.0 5.815.0 14.0 10.0
0.3 0.4 5.75.4 5.2 7.6
13.2 11.1 48.0
0.43 0.54 0.2613.7 25.8 7.4

Economic and social contextPopulation (millions)Urban population (% of total)GNI per capita, World Bank Atlas method ($)GDP growth, 2005–10 and 2010–15 (avg. annual %)Adult literacy rate (% ages 15 and older) Gross primary, secondary, and tertiary school enrollment (%)
Sector structureSeparate telecommunications/ICT regulatorStatus of main fixed-line telephone operatorLevel of competition (competition, partial comp., monopoly) International gateway(s) Mobile telephone service Internet serviceForeign ownership (not allowed, restricted, allowed)Reg. treatment of VoIP (banned, closed, no framework, allowed)
Sector efficiency and capacityTelecommunications revenue (% of GDP)Telecommunications investment (% of revenue)
Sector performanceAccessFixed-telephone subscriptions (per 100 people)Mobile-cellular telephone subscriptions (per 100 people)Fixed-broadband subscriptions (per 100 people)Households with a computer (%)Households with Internet access at home (%)
Usage Int’l. voice traffic, total (minutes/subscription/month)Domestic mobile traffic (minutes/subscription/month)Individuals using the Internet (%)
Quality Population covered by at least a 3G mobile network (%)International Internet bandwidth (bit/s per Internet user)
AffordabilityMobile-cellular sub-basket ($ a month)Fixed-broadband sub-basket ($ a month)Mobile-b’band, prepaid handset-based, 500 MB ($ a month)Mobile-b’band, postpaid computer-based, 1 GB ($ a month)
TradeICT goods exports (% of total goods exports)ICT goods imports (% of total goods imports)ICT service exports (% of total service exports)
ApplicationsOnline service index (0-1, 1=highest presence)Secure Internet servers (per million people)
78 2017 The Little Data Book on Information and Communication Technology
Sub-Saharan Africa Upper middle income
Equatorial Guinea
2010 2015 2015
Uppermiddle-incomegroupCountry data
0.73 0.85 2,59439 40 64
7,880 7,790 8,1864.6 –2.1 4.5
.. 95 ..
.. .. 81
Yes YesMixed Mixed
P ..C ..C CR R
No A
.. .. 2.1
.. .. 18.8
1.9 1.4 17.357.4 66.7 105.1
0.2 0.5 15.413.0a 19.3a 48.7
7.0a 8.9a 52.2
.. .. 2.3
.. .. 173.16.0 21.3a 52.1
.. .. 694,094 1,320 26,098
.. 20.7 8.5
.. 101.4 15.5
.. .. 7.7
.. .. 11.1
.. .. 15.7
.. .. 14.4
.. .. 25.7
0.03 0.03 0.372.7 3.6 34.7

Economic and social contextPopulation (millions)Urban population (% of total)GNI per capita, World Bank Atlas method ($)GDP growth, 2005–10 and 2010–15 (avg. annual %)Adult literacy rate (% ages 15 and older) Gross primary, secondary, and tertiary school enrollment (%)
Sector structureSeparate telecommunications/ICT regulatorStatus of main fixed-line telephone operatorLevel of competition (competition, partial comp., monopoly) International gateway(s) Mobile telephone service Internet serviceForeign ownership (not allowed, restricted, allowed)Reg. treatment of VoIP (banned, closed, no framework, allowed)
Sector efficiency and capacityTelecommunications revenue (% of GDP)Telecommunications investment (% of revenue)
Sector performanceAccessFixed-telephone subscriptions (per 100 people)Mobile-cellular telephone subscriptions (per 100 people)Fixed-broadband subscriptions (per 100 people)Households with a computer (%)Households with Internet access at home (%)
Usage Int’l. voice traffic, total (minutes/subscription/month)Domestic mobile traffic (minutes/subscription/month)Individuals using the Internet (%)
Quality Population covered by at least a 3G mobile network (%)International Internet bandwidth (bit/s per Internet user)
AffordabilityMobile-cellular sub-basket ($ a month)Fixed-broadband sub-basket ($ a month)Mobile-b’band, prepaid handset-based, 500 MB ($ a month)Mobile-b’band, postpaid computer-based, 1 GB ($ a month)
TradeICT goods exports (% of total goods exports)ICT goods imports (% of total goods imports)ICT service exports (% of total service exports)
ApplicationsOnline service index (0-1, 1=highest presence)Secure Internet servers (per million people)
79The Little Data Book on Information and Communication Technology 2017
Sub-Saharan Africa Low income
Eritrea
2010 2015 2015
Low-incomegroupCountry data
5 5 63821 23 31
380 .. 620–1.3 .. 5.4
.. 74 ..30 .. 60
Yes YesPublic Public
M MP PP P.. ..B B
3.2 .. ..10.4 42.9 ..
0.9 1.0 0.93.2 7.0 60.00.0 0.0 0.30.8a 2.8a 4.80.7a 1.7a 7.1
77.1 67.4 ..115.5 11.3 48.9
0.6a 1.1a 9.5
85 92 51857 1,391 4,245
12.1 13.0 9.4204.0 87.3 33.6
.. .. 8.0
.. .. 10.8
.. .. ..
.. .. 3.4
.. .. ..
0.02 0.00 0.11.. .. 1.5

Economic and social contextPopulation (millions)Urban population (% of total)GNI per capita, World Bank Atlas method ($)GDP growth, 2005–10 and 2010–15 (avg. annual %)Adult literacy rate (% ages 15 and older) Gross primary, secondary, and tertiary school enrollment (%)
Sector structureSeparate telecommunications/ICT regulatorStatus of main fixed-line telephone operatorLevel of competition (competition, partial comp., monopoly) International gateway(s) Mobile telephone service Internet serviceForeign ownership (not allowed, restricted, allowed)Reg. treatment of VoIP (banned, closed, no framework, allowed)
Sector efficiency and capacityTelecommunications revenue (% of GDP)Telecommunications investment (% of revenue)
Sector performanceAccessFixed-telephone subscriptions (per 100 people)Mobile-cellular telephone subscriptions (per 100 people)Fixed-broadband subscriptions (per 100 people)Households with a computer (%)Households with Internet access at home (%)
Usage Int’l. voice traffic, total (minutes/subscription/month)Domestic mobile traffic (minutes/subscription/month)Individuals using the Internet (%)
Quality Population covered by at least a 3G mobile network (%)International Internet bandwidth (bit/s per Internet user)
AffordabilityMobile-cellular sub-basket ($ a month)Fixed-broadband sub-basket ($ a month)Mobile-b’band, prepaid handset-based, 500 MB ($ a month)Mobile-b’band, postpaid computer-based, 1 GB ($ a month)
TradeICT goods exports (% of total goods exports)ICT goods imports (% of total goods imports)ICT service exports (% of total service exports)
ApplicationsOnline service index (0-1, 1=highest presence)Secure Internet servers (per million people)
80 2017 The Little Data Book on Information and Communication Technology
Europe & Central Asia High income
Estonia
2010 2015 2015
High-incomegroupCountry data
1 1 1,18768 68 81
14,580 18,480 41,366–1.6 3.5 1.5100 100 ..
94 97 95
Yes YesMixed Mixed
.. CC CC CA AA A
3.2 2.8 2.514.6 16.2 18.8
37.1 30.3 41.2127.3 148.7 124.5
26.8 28.7 31.069.2 87.9 83.267.8 87.7 85.0
9.6 8.3 ..122.7 125.9 195.9
74.1 88.4 81.0
95 100 9923,903 30,924 134,761
22.3 3.3 14.221.0 17.7 25.2
8.2 2.2 10.47.7 8.3 14.4
8.0 12.7 9.59.6 11.5 11.2
25.8 26.7 32.0
0.50 0.77 0.67437.1 1,145.6 1,194.6

Economic and social contextPopulation (millions)Urban population (% of total)GNI per capita, World Bank Atlas method ($)GDP growth, 2005–10 and 2010–15 (avg. annual %)Adult literacy rate (% ages 15 and older) Gross primary, secondary, and tertiary school enrollment (%)
Sector structureSeparate telecommunications/ICT regulatorStatus of main fixed-line telephone operatorLevel of competition (competition, partial comp., monopoly) International gateway(s) Mobile telephone service Internet serviceForeign ownership (not allowed, restricted, allowed)Reg. treatment of VoIP (banned, closed, no framework, allowed)
Sector efficiency and capacityTelecommunications revenue (% of GDP)Telecommunications investment (% of revenue)
Sector performanceAccessFixed-telephone subscriptions (per 100 people)Mobile-cellular telephone subscriptions (per 100 people)Fixed-broadband subscriptions (per 100 people)Households with a computer (%)Households with Internet access at home (%)
Usage Int’l. voice traffic, total (minutes/subscription/month)Domestic mobile traffic (minutes/subscription/month)Individuals using the Internet (%)
Quality Population covered by at least a 3G mobile network (%)International Internet bandwidth (bit/s per Internet user)
AffordabilityMobile-cellular sub-basket ($ a month)Fixed-broadband sub-basket ($ a month)Mobile-b’band, prepaid handset-based, 500 MB ($ a month)Mobile-b’band, postpaid computer-based, 1 GB ($ a month)
TradeICT goods exports (% of total goods exports)ICT goods imports (% of total goods imports)ICT service exports (% of total service exports)
ApplicationsOnline service index (0-1, 1=highest presence)Secure Internet servers (per million people)
81The Little Data Book on Information and Communication Technology 2017
Sub-Saharan Africa Low income
Ethiopia
2010 2015 2015
Low-incomegroupCountry data
88 99 63817 19 31
380 590 62010.7 10.0 5.4
39 49 ..53 .. 60
No NoPublic Public
M ..M MM MR NoB C
1.6 1.9 ..36.2 78.1 ..
1.0 0.9 0.97.9 42.8 60.00.0 0.7 0.31.4a 3.5a 4.81.1a 9.8a 7.1
5.4 7.5 ..111.5 46.5 48.9
0.8a 11.6a 9.5
4 71 515,102 1,959 4,245
4.1 3.1 9.4294.5 12.1 33.6
.. 9.6 8.016.9 9.6 10.8
0.2 0.2 ..8.4 4.6 3.48.9 .. ..
0.20 0.46 0.110.1 0.2 1.5

Economic and social contextPopulation (millions)Urban population (% of total)GNI per capita, World Bank Atlas method ($)GDP growth, 2005–10 and 2010–15 (avg. annual %)Adult literacy rate (% ages 15 and older) Gross primary, secondary, and tertiary school enrollment (%)
Sector structureSeparate telecommunications/ICT regulatorStatus of main fixed-line telephone operatorLevel of competition (competition, partial comp., monopoly) International gateway(s) Mobile telephone service Internet serviceForeign ownership (not allowed, restricted, allowed)Reg. treatment of VoIP (banned, closed, no framework, allowed)
Sector efficiency and capacityTelecommunications revenue (% of GDP)Telecommunications investment (% of revenue)
Sector performanceAccessFixed-telephone subscriptions (per 100 people)Mobile-cellular telephone subscriptions (per 100 people)Fixed-broadband subscriptions (per 100 people)Households with a computer (%)Households with Internet access at home (%)
Usage Int’l. voice traffic, total (minutes/subscription/month)Domestic mobile traffic (minutes/subscription/month)Individuals using the Internet (%)
Quality Population covered by at least a 3G mobile network (%)International Internet bandwidth (bit/s per Internet user)
AffordabilityMobile-cellular sub-basket ($ a month)Fixed-broadband sub-basket ($ a month)Mobile-b’band, prepaid handset-based, 500 MB ($ a month)Mobile-b’band, postpaid computer-based, 1 GB ($ a month)
TradeICT goods exports (% of total goods exports)ICT goods imports (% of total goods imports)ICT service exports (% of total service exports)
ApplicationsOnline service index (0-1, 1=highest presence)Secure Internet servers (per million people)
82 2017 The Little Data Book on Information and Communication Technology
Europe & Central Asia High income
Faroe Islands
2010 2015 2015
High-incomegroupCountry data
0.05 0.05 1,18741 42 81
.. .. 41,366
.. .. 1.5
.. .. ..
.. .. 95
.. ..
.. ..
.. ..
.. ..
.. ..
.. ..
.. ..
.. .. 2.5
.. .. 18.8
40.7 34.3 41.2119.9 127.3 124.5
32.6 36.4 31.0.. .. 83.2.. .. 85.0
.. .. ..82.1 .. 195.975.2 94.2a 81.0
.. .. 99
.. .. 134,761
.. .. 14.2
.. .. 25.2
.. .. 10.4
.. .. 14.4
0.0 .. 9.54.3 .. 11.2
23.0 .. 32.0
.. .. 0.67926.6 1,656.6 1,194.6

Economic and social contextPopulation (millions)Urban population (% of total)GNI per capita, World Bank Atlas method ($)GDP growth, 2005–10 and 2010–15 (avg. annual %)Adult literacy rate (% ages 15 and older) Gross primary, secondary, and tertiary school enrollment (%)
Sector structureSeparate telecommunications/ICT regulatorStatus of main fixed-line telephone operatorLevel of competition (competition, partial comp., monopoly) International gateway(s) Mobile telephone service Internet serviceForeign ownership (not allowed, restricted, allowed)Reg. treatment of VoIP (banned, closed, no framework, allowed)
Sector efficiency and capacityTelecommunications revenue (% of GDP)Telecommunications investment (% of revenue)
Sector performanceAccessFixed-telephone subscriptions (per 100 people)Mobile-cellular telephone subscriptions (per 100 people)Fixed-broadband subscriptions (per 100 people)Households with a computer (%)Households with Internet access at home (%)
Usage Int’l. voice traffic, total (minutes/subscription/month)Domestic mobile traffic (minutes/subscription/month)Individuals using the Internet (%)
Quality Population covered by at least a 3G mobile network (%)International Internet bandwidth (bit/s per Internet user)
AffordabilityMobile-cellular sub-basket ($ a month)Fixed-broadband sub-basket ($ a month)Mobile-b’band, prepaid handset-based, 500 MB ($ a month)Mobile-b’band, postpaid computer-based, 1 GB ($ a month)
TradeICT goods exports (% of total goods exports)ICT goods imports (% of total goods imports)ICT service exports (% of total service exports)
ApplicationsOnline service index (0-1, 1=highest presence)Secure Internet servers (per million people)
83The Little Data Book on Information and Communication Technology 2017
East Asia & Pacific Upper middle income
Fiji
2010 2015 2015
Uppermiddle-incomegroupCountry data
0.86 0.89 2,59452 54 64
3,650 4,800 8,1860.4 3.3 4.5
.. .. ..
.. .. 81
Yes YesMixed Mixed
C CC CC CA AA A
.. .. 2.1
.. .. 18.8
15.1 8.1 17.381.1 108.2 105.1
2.7 1.4 15.426.8a 39.2a 48.718.8a 31.3a 52.2
.. .. 2.3
.. .. 173.120.0a 46.3a 52.1
.. 68 697,553 27,399 26,098
18.8 17.0 8.518.3 16.8 15.514.0 8.6 7.722.8 12.0 11.1
0.2 4.3 15.73.9 5.7 14.42.9 4.4 25.7
0.18 0.39 0.3730.2 51.6 34.7

Economic and social contextPopulation (millions)Urban population (% of total)GNI per capita, World Bank Atlas method ($)GDP growth, 2005–10 and 2010–15 (avg. annual %)Adult literacy rate (% ages 15 and older) Gross primary, secondary, and tertiary school enrollment (%)
Sector structureSeparate telecommunications/ICT regulatorStatus of main fixed-line telephone operatorLevel of competition (competition, partial comp., monopoly) International gateway(s) Mobile telephone service Internet serviceForeign ownership (not allowed, restricted, allowed)Reg. treatment of VoIP (banned, closed, no framework, allowed)
Sector efficiency and capacityTelecommunications revenue (% of GDP)Telecommunications investment (% of revenue)
Sector performanceAccessFixed-telephone subscriptions (per 100 people)Mobile-cellular telephone subscriptions (per 100 people)Fixed-broadband subscriptions (per 100 people)Households with a computer (%)Households with Internet access at home (%)
Usage Int’l. voice traffic, total (minutes/subscription/month)Domestic mobile traffic (minutes/subscription/month)Individuals using the Internet (%)
Quality Population covered by at least a 3G mobile network (%)International Internet bandwidth (bit/s per Internet user)
AffordabilityMobile-cellular sub-basket ($ a month)Fixed-broadband sub-basket ($ a month)Mobile-b’band, prepaid handset-based, 500 MB ($ a month)Mobile-b’band, postpaid computer-based, 1 GB ($ a month)
TradeICT goods exports (% of total goods exports)ICT goods imports (% of total goods imports)ICT service exports (% of total service exports)
ApplicationsOnline service index (0-1, 1=highest presence)Secure Internet servers (per million people)
84 2017 The Little Data Book on Information and Communication Technology
Europe & Central Asia High income
Finland
2010 2015 2015
High-incomegroupCountry data
5 5 1,18784 84 81
49,330 46,360 41,3660.4 –0.2 1.5
.. .. ..101 115 95
Yes YesMixed Mixed
C CC CC CA AA A
2.0 1.7 2.516.7 15.5 18.8
23.3 9.8 41.2156.3 135.5 124.5
29.1 31.7 31.082.0 89.3 83.280.5 89.9 85.0
.. .. ..177.5 .. 195.9
86.9 92.7 81.0
95 100 99107,204 208,526 134,761
13.1 11.0 14.235.4 29.8 25.2
8.7 7.3 10.412.7 16.5 14.4
6.4 2.6 9.58.2 6.2 11.2
39.6 49.5 32.0
0.48 0.77 0.671,245.5 1,781.6 1,194.6

Economic and social contextPopulation (millions)Urban population (% of total)GNI per capita, World Bank Atlas method ($)GDP growth, 2005–10 and 2010–15 (avg. annual %)Adult literacy rate (% ages 15 and older) Gross primary, secondary, and tertiary school enrollment (%)
Sector structureSeparate telecommunications/ICT regulatorStatus of main fixed-line telephone operatorLevel of competition (competition, partial comp., monopoly) International gateway(s) Mobile telephone service Internet serviceForeign ownership (not allowed, restricted, allowed)Reg. treatment of VoIP (banned, closed, no framework, allowed)
Sector efficiency and capacityTelecommunications revenue (% of GDP)Telecommunications investment (% of revenue)
Sector performanceAccessFixed-telephone subscriptions (per 100 people)Mobile-cellular telephone subscriptions (per 100 people)Fixed-broadband subscriptions (per 100 people)Households with a computer (%)Households with Internet access at home (%)
Usage Int’l. voice traffic, total (minutes/subscription/month)Domestic mobile traffic (minutes/subscription/month)Individuals using the Internet (%)
Quality Population covered by at least a 3G mobile network (%)International Internet bandwidth (bit/s per Internet user)
AffordabilityMobile-cellular sub-basket ($ a month)Fixed-broadband sub-basket ($ a month)Mobile-b’band, prepaid handset-based, 500 MB ($ a month)Mobile-b’band, postpaid computer-based, 1 GB ($ a month)
TradeICT goods exports (% of total goods exports)ICT goods imports (% of total goods imports)ICT service exports (% of total service exports)
ApplicationsOnline service index (0-1, 1=highest presence)Secure Internet servers (per million people)
85The Little Data Book on Information and Communication Technology 2017
Europe & Central Asia High income
France
2010 2015 2015
High-incomegroupCountry data
65 67 1,18778 80 81
43,790 40,580 41,3660.5 0.7 1.5
.. .. ..94 96 95
Yes YesMixed Mixed
C CC CC CR AA A
2.2 1.6 2.514.5 20.5 18.8
64.2 59.9 41.291.4 102.6 124.533.7 41.3 31.076.4 81.5 83.273.6 82.6 85.0
19.5 .. ..148.5 188.4 195.9
77.3 84.7 81.0
91 99 9971,626 129,973 134,761
49.5 33.7 14.230.1 23.3 25.215.4 22.2 10.428.3 11.1 14.4
4.4 3.9 9.57.3 6.2 11.2
34.4 40.5 32.0
0.68 1.00 0.67296.4 809.3 1,194.6

Economic and social contextPopulation (millions)Urban population (% of total)GNI per capita, World Bank Atlas method ($)GDP growth, 2005–10 and 2010–15 (avg. annual %)Adult literacy rate (% ages 15 and older) Gross primary, secondary, and tertiary school enrollment (%)
Sector structureSeparate telecommunications/ICT regulatorStatus of main fixed-line telephone operatorLevel of competition (competition, partial comp., monopoly) International gateway(s) Mobile telephone service Internet serviceForeign ownership (not allowed, restricted, allowed)Reg. treatment of VoIP (banned, closed, no framework, allowed)
Sector efficiency and capacityTelecommunications revenue (% of GDP)Telecommunications investment (% of revenue)
Sector performanceAccessFixed-telephone subscriptions (per 100 people)Mobile-cellular telephone subscriptions (per 100 people)Fixed-broadband subscriptions (per 100 people)Households with a computer (%)Households with Internet access at home (%)
Usage Int’l. voice traffic, total (minutes/subscription/month)Domestic mobile traffic (minutes/subscription/month)Individuals using the Internet (%)
Quality Population covered by at least a 3G mobile network (%)International Internet bandwidth (bit/s per Internet user)
AffordabilityMobile-cellular sub-basket ($ a month)Fixed-broadband sub-basket ($ a month)Mobile-b’band, prepaid handset-based, 500 MB ($ a month)Mobile-b’band, postpaid computer-based, 1 GB ($ a month)
TradeICT goods exports (% of total goods exports)ICT goods imports (% of total goods imports)ICT service exports (% of total service exports)
ApplicationsOnline service index (0-1, 1=highest presence)Secure Internet servers (per million people)
86 2017 The Little Data Book on Information and Communication Technology
East Asia & Pacific High income
French Polynesia
2010 2015 2015
High-incomegroupCountry data
0.27 0.28 1,18756 56 81
.. .. 41,366
.. .. 1.5
.. .. ..
.. .. 95
.. ..
.. ..
.. ..
.. ..
.. ..
.. ..
.. ..
.. .. 2.5
.. .. 18.8
20.5 21.2 41.280.5 94.9 124.512.0 18.4 31.0
.. .. 83.2
.. .. 85.0
9.4 5.3 ..103.8 114.2 195.9
49.0 64.6a 81.0
45 85 9913,323 .. 134,761
.. .. 14.2
.. .. 25.2
.. .. 10.4
.. .. 14.4
0.8 0.9 9.56.0 5.0 11.29.9 4.9 32.0
.. .. 0.6785.8 180.4 1,194.6

Economic and social contextPopulation (millions)Urban population (% of total)GNI per capita, World Bank Atlas method ($)GDP growth, 2005–10 and 2010–15 (avg. annual %)Adult literacy rate (% ages 15 and older) Gross primary, secondary, and tertiary school enrollment (%)
Sector structureSeparate telecommunications/ICT regulatorStatus of main fixed-line telephone operatorLevel of competition (competition, partial comp., monopoly) International gateway(s) Mobile telephone service Internet serviceForeign ownership (not allowed, restricted, allowed)Reg. treatment of VoIP (banned, closed, no framework, allowed)
Sector efficiency and capacityTelecommunications revenue (% of GDP)Telecommunications investment (% of revenue)
Sector performanceAccessFixed-telephone subscriptions (per 100 people)Mobile-cellular telephone subscriptions (per 100 people)Fixed-broadband subscriptions (per 100 people)Households with a computer (%)Households with Internet access at home (%)
Usage Int’l. voice traffic, total (minutes/subscription/month)Domestic mobile traffic (minutes/subscription/month)Individuals using the Internet (%)
Quality Population covered by at least a 3G mobile network (%)International Internet bandwidth (bit/s per Internet user)
AffordabilityMobile-cellular sub-basket ($ a month)Fixed-broadband sub-basket ($ a month)Mobile-b’band, prepaid handset-based, 500 MB ($ a month)Mobile-b’band, postpaid computer-based, 1 GB ($ a month)
TradeICT goods exports (% of total goods exports)ICT goods imports (% of total goods imports)ICT service exports (% of total service exports)
ApplicationsOnline service index (0-1, 1=highest presence)Secure Internet servers (per million people)
87The Little Data Book on Information and Communication Technology 2017
Sub-Saharan Africa Upper middle income
Gabon
2010 2015 2015
Uppermiddle-incomegroupCountry data
2 2 2,59486 87 64
8,250 9,210 8,1860.9 5.2 4.582 83 ..
.. .. 81
Yes YesMixed Mixed
C CC CC C
No RA B
.. .. 2.1
.. .. 18.8
2.0 1.1 17.3103.5 168.9 105.1
0.3 0.6 15.47.6a 13.7a 48.76.0a 18.0a 52.2
1.6 .. 2.3.. .. 173.1
7.2a 23.5a 52.1
.. 95 696,888 8,505 26,098
23.3 16.7 8.531.8 23.7 15.5
.. 16.1 7.7
.. 23.7 11.1
0.0 .. 15.73.5 .. 14.4
.. .. 25.7
0.08 0.09 0.377.8 9.9 34.7

Economic and social contextPopulation (millions)Urban population (% of total)GNI per capita, World Bank Atlas method ($)GDP growth, 2005–10 and 2010–15 (avg. annual %)Adult literacy rate (% ages 15 and older) Gross primary, secondary, and tertiary school enrollment (%)
Sector structureSeparate telecommunications/ICT regulatorStatus of main fixed-line telephone operatorLevel of competition (competition, partial comp., monopoly) International gateway(s) Mobile telephone service Internet serviceForeign ownership (not allowed, restricted, allowed)Reg. treatment of VoIP (banned, closed, no framework, allowed)
Sector efficiency and capacityTelecommunications revenue (% of GDP)Telecommunications investment (% of revenue)
Sector performanceAccessFixed-telephone subscriptions (per 100 people)Mobile-cellular telephone subscriptions (per 100 people)Fixed-broadband subscriptions (per 100 people)Households with a computer (%)Households with Internet access at home (%)
Usage Int’l. voice traffic, total (minutes/subscription/month)Domestic mobile traffic (minutes/subscription/month)Individuals using the Internet (%)
Quality Population covered by at least a 3G mobile network (%)International Internet bandwidth (bit/s per Internet user)
AffordabilityMobile-cellular sub-basket ($ a month)Fixed-broadband sub-basket ($ a month)Mobile-b’band, prepaid handset-based, 500 MB ($ a month)Mobile-b’band, postpaid computer-based, 1 GB ($ a month)
TradeICT goods exports (% of total goods exports)ICT goods imports (% of total goods imports)ICT service exports (% of total service exports)
ApplicationsOnline service index (0-1, 1=highest presence)Secure Internet servers (per million people)
88 2017 The Little Data Book on Information and Communication Technology
Sub-Saharan Africa Low income
Gambia, The
2010 2015 2015
Low-incomegroupCountry data
2 2 63856 60 31
590 460 6204.9 2.4 5.4
.. 56 ..56 .. 60
Yes YesPublic Mixed
M MC CC CA AB B
.. 9.2 ..
.. 8.0 ..
2.9 2.3 0.988.0 131.3 60.0
0.0 0.2 0.35.7a 8.9a 4.83.8a 13.3a 7.1
.. 6.7 ..
.. 42.3 48.99.2 17.1a 9.5
50a 86a 511,093 13,342 4,245
6.0 5.1 9.4280.3 21.0 33.6
.. 4.1 8.0
.. .. 10.8
0.1 0.1 ..1.4 2.2 3.4
.. .. ..
0.08 0.20 0.113.0 5.5 1.5
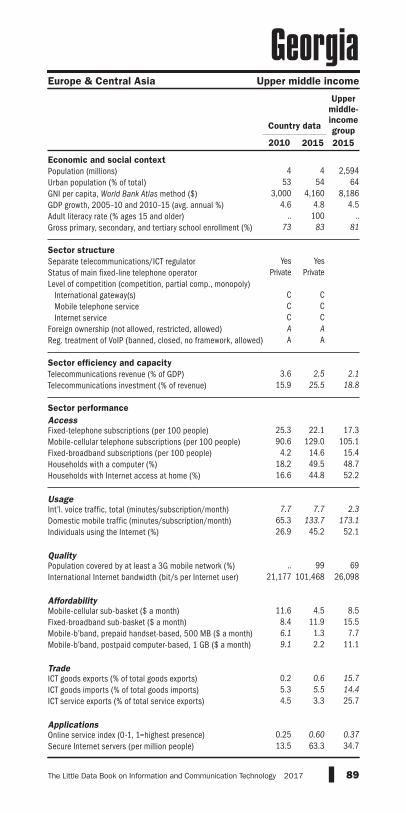
Economic and social contextPopulation (millions)Urban population (% of total)GNI per capita, World Bank Atlas method ($)GDP growth, 2005–10 and 2010–15 (avg. annual %)Adult literacy rate (% ages 15 and older) Gross primary, secondary, and tertiary school enrollment (%)
Sector structureSeparate telecommunications/ICT regulatorStatus of main fixed-line telephone operatorLevel of competition (competition, partial comp., monopoly) International gateway(s) Mobile telephone service Internet serviceForeign ownership (not allowed, restricted, allowed)Reg. treatment of VoIP (banned, closed, no framework, allowed)
Sector efficiency and capacityTelecommunications revenue (% of GDP)Telecommunications investment (% of revenue)
Sector performanceAccessFixed-telephone subscriptions (per 100 people)Mobile-cellular telephone subscriptions (per 100 people)Fixed-broadband subscriptions (per 100 people)Households with a computer (%)Households with Internet access at home (%)
Usage Int’l. voice traffic, total (minutes/subscription/month)Domestic mobile traffic (minutes/subscription/month)Individuals using the Internet (%)
Quality Population covered by at least a 3G mobile network (%)International Internet bandwidth (bit/s per Internet user)
AffordabilityMobile-cellular sub-basket ($ a month)Fixed-broadband sub-basket ($ a month)Mobile-b’band, prepaid handset-based, 500 MB ($ a month)Mobile-b’band, postpaid computer-based, 1 GB ($ a month)
TradeICT goods exports (% of total goods exports)ICT goods imports (% of total goods imports)ICT service exports (% of total service exports)
ApplicationsOnline service index (0-1, 1=highest presence)Secure Internet servers (per million people)
89The Little Data Book on Information and Communication Technology 2017
Europe & Central Asia Upper middle income
Georgia
2010 2015 2015
Uppermiddle-incomegroupCountry data
4 4 2,59453 54 64
3,000 4,160 8,1864.6 4.8 4.5
.. 100 ..73 83 81
Yes YesPrivate Private
C CC CC CA AA A
3.6 2.5 2.115.9 25.5 18.8
25.3 22.1 17.390.6 129.0 105.1
4.2 14.6 15.418.2 49.5 48.716.6 44.8 52.2
7.7 7.7 2.365.3 133.7 173.126.9 45.2 52.1
.. 99 6921,177 101,468 26,098
11.6 4.5 8.58.4 11.9 15.56.1 1.3 7.79.1 2.2 11.1
0.2 0.6 15.75.3 5.5 14.44.5 3.3 25.7
0.25 0.60 0.3713.5 63.3 34.7

Economic and social contextPopulation (millions)Urban population (% of total)GNI per capita, World Bank Atlas method ($)GDP growth, 2005–10 and 2010–15 (avg. annual %)Adult literacy rate (% ages 15 and older) Gross primary, secondary, and tertiary school enrollment (%)
Sector structureSeparate telecommunications/ICT regulatorStatus of main fixed-line telephone operatorLevel of competition (competition, partial comp., monopoly) International gateway(s) Mobile telephone service Internet serviceForeign ownership (not allowed, restricted, allowed)Reg. treatment of VoIP (banned, closed, no framework, allowed)
Sector efficiency and capacityTelecommunications revenue (% of GDP)Telecommunications investment (% of revenue)
Sector performanceAccessFixed-telephone subscriptions (per 100 people)Mobile-cellular telephone subscriptions (per 100 people)Fixed-broadband subscriptions (per 100 people)Households with a computer (%)Households with Internet access at home (%)
Usage Int’l. voice traffic, total (minutes/subscription/month)Domestic mobile traffic (minutes/subscription/month)Individuals using the Internet (%)
Quality Population covered by at least a 3G mobile network (%)International Internet bandwidth (bit/s per Internet user)
AffordabilityMobile-cellular sub-basket ($ a month)Fixed-broadband sub-basket ($ a month)Mobile-b’band, prepaid handset-based, 500 MB ($ a month)Mobile-b’band, postpaid computer-based, 1 GB ($ a month)
TradeICT goods exports (% of total goods exports)ICT goods imports (% of total goods imports)ICT service exports (% of total service exports)
ApplicationsOnline service index (0-1, 1=highest presence)Secure Internet servers (per million people)
90 2017 The Little Data Book on Information and Communication Technology
Europe & Central Asia High income
Germany
2010 2015 2015
High-incomegroupCountry data
82 81 1,18774 75 81
44,790 45,790 41,3660.8 1.3 1.5
.. .. ..
.. 96 95
Yes YesMixed Mixed
C CC CC CA AA A
1.5 1.4 2.515.3 17.6 18.8
63.7 54.9 41.2106.5 116.7 124.5
31.5 37.2 31.085.7 91.0 83.282.5 90.3 85.0
.. .. ..96.5 125.8 195.982.0 87.6 81.0
89 96 9973,449 117,540 134,761
22.3 11.1 14.239.4 38.8 25.212.8 11.0 10.425.7 16.0 14.4
5.1 4.5 9.59.2 7.7 11.2
36.6 39.5 32.0
0.55 0.67 0.67872.0 1,762.7 1,194.6

Economic and social contextPopulation (millions)Urban population (% of total)GNI per capita, World Bank Atlas method ($)GDP growth, 2005–10 and 2010–15 (avg. annual %)Adult literacy rate (% ages 15 and older) Gross primary, secondary, and tertiary school enrollment (%)
Sector structureSeparate telecommunications/ICT regulatorStatus of main fixed-line telephone operatorLevel of competition (competition, partial comp., monopoly) International gateway(s) Mobile telephone service Internet serviceForeign ownership (not allowed, restricted, allowed)Reg. treatment of VoIP (banned, closed, no framework, allowed)
Sector efficiency and capacityTelecommunications revenue (% of GDP)Telecommunications investment (% of revenue)
Sector performanceAccessFixed-telephone subscriptions (per 100 people)Mobile-cellular telephone subscriptions (per 100 people)Fixed-broadband subscriptions (per 100 people)Households with a computer (%)Households with Internet access at home (%)
Usage Int’l. voice traffic, total (minutes/subscription/month)Domestic mobile traffic (minutes/subscription/month)Individuals using the Internet (%)
Quality Population covered by at least a 3G mobile network (%)International Internet bandwidth (bit/s per Internet user)
AffordabilityMobile-cellular sub-basket ($ a month)Fixed-broadband sub-basket ($ a month)Mobile-b’band, prepaid handset-based, 500 MB ($ a month)Mobile-b’band, postpaid computer-based, 1 GB ($ a month)
TradeICT goods exports (% of total goods exports)ICT goods imports (% of total goods imports)ICT service exports (% of total service exports)
ApplicationsOnline service index (0-1, 1=highest presence)Secure Internet servers (per million people)
91The Little Data Book on Information and Communication Technology 2017
Sub-Saharan Africa Lower Middle income
Ghana
2010 2015 2015
Lowermiddle-incomegroupCountry data
24 27 2,92751 54 39
1,260 1,480 2,0356.5 7.4 5.471 77 ..65 69 68
Yes YesMixed Mixed
P PP ..C ..A AC A
3.6 .. ..65.5 .. ..
1.1 1.0 3.571.9 129.7 90.5
0.2 0.3 1.97.9 43.5a 19.35.0a 34.1a 24.3
8.0 4.2 7.589.5 .. 152.0
7.8 23.5a 28.6
36 75 ..90 2,841 10,372
7.7 2.9 6.931.5 18.3 14.3
8.9 5.2 5.811.1 5.2 10.0
0.0 0.2 5.77.1 3.8 7.6
.. .. 48.0
0.15 0.31 0.261.7 5.0 7.4

Economic and social contextPopulation (millions)Urban population (% of total)GNI per capita, World Bank Atlas method ($)GDP growth, 2005–10 and 2010–15 (avg. annual %)Adult literacy rate (% ages 15 and older) Gross primary, secondary, and tertiary school enrollment (%)
Sector structureSeparate telecommunications/ICT regulatorStatus of main fixed-line telephone operatorLevel of competition (competition, partial comp., monopoly) International gateway(s) Mobile telephone service Internet serviceForeign ownership (not allowed, restricted, allowed)Reg. treatment of VoIP (banned, closed, no framework, allowed)
Sector efficiency and capacityTelecommunications revenue (% of GDP)Telecommunications investment (% of revenue)
Sector performanceAccessFixed-telephone subscriptions (per 100 people)Mobile-cellular telephone subscriptions (per 100 people)Fixed-broadband subscriptions (per 100 people)Households with a computer (%)Households with Internet access at home (%)
Usage Int’l. voice traffic, total (minutes/subscription/month)Domestic mobile traffic (minutes/subscription/month)Individuals using the Internet (%)
Quality Population covered by at least a 3G mobile network (%)International Internet bandwidth (bit/s per Internet user)
AffordabilityMobile-cellular sub-basket ($ a month)Fixed-broadband sub-basket ($ a month)Mobile-b’band, prepaid handset-based, 500 MB ($ a month)Mobile-b’band, postpaid computer-based, 1 GB ($ a month)
TradeICT goods exports (% of total goods exports)ICT goods imports (% of total goods imports)ICT service exports (% of total service exports)
ApplicationsOnline service index (0-1, 1=highest presence)Secure Internet servers (per million people)
92 2017 The Little Data Book on Information and Communication Technology
Europe & Central Asia High income
Gibraltar
2010 2015 2015
High-incomegroupCountry data
0.03 0.03 1,187100 100 81
.. .. 41,366
.. .. 1.5
.. .. ..
.. .. 95
.. ..
.. ..
.. ..
.. ..
.. ..
.. ..
.. ..
.. .. 2.5
.. .. 18.8
82.0 79.8 41.2102.6 129.5 124.5
35.7 44.3 31.0.. .. 83.2.. .. 85.0
44.1 .. ..34.1 .. 195.965.0 .. 81.0
.. 100 99110,304 .. 134,761
.. .. 14.2
.. .. 25.2
.. .. 10.4
.. .. 14.4
.. .. 9.5
.. .. 11.2
.. .. 32.0
.. .. 0.6712,690.4 11,002.5 1,194.6

Economic and social contextPopulation (millions)Urban population (% of total)GNI per capita, World Bank Atlas method ($)GDP growth, 2005–10 and 2010–15 (avg. annual %)Adult literacy rate (% ages 15 and older) Gross primary, secondary, and tertiary school enrollment (%)
Sector structureSeparate telecommunications/ICT regulatorStatus of main fixed-line telephone operatorLevel of competition (competition, partial comp., monopoly) International gateway(s) Mobile telephone service Internet serviceForeign ownership (not allowed, restricted, allowed)Reg. treatment of VoIP (banned, closed, no framework, allowed)
Sector efficiency and capacityTelecommunications revenue (% of GDP)Telecommunications investment (% of revenue)
Sector performanceAccessFixed-telephone subscriptions (per 100 people)Mobile-cellular telephone subscriptions (per 100 people)Fixed-broadband subscriptions (per 100 people)Households with a computer (%)Households with Internet access at home (%)
Usage Int’l. voice traffic, total (minutes/subscription/month)Domestic mobile traffic (minutes/subscription/month)Individuals using the Internet (%)
Quality Population covered by at least a 3G mobile network (%)International Internet bandwidth (bit/s per Internet user)
AffordabilityMobile-cellular sub-basket ($ a month)Fixed-broadband sub-basket ($ a month)Mobile-b’band, prepaid handset-based, 500 MB ($ a month)Mobile-b’band, postpaid computer-based, 1 GB ($ a month)
TradeICT goods exports (% of total goods exports)ICT goods imports (% of total goods imports)ICT service exports (% of total service exports)
ApplicationsOnline service index (0-1, 1=highest presence)Secure Internet servers (per million people)
93The Little Data Book on Information and Communication Technology 2017
Europe & Central Asia High income
Greece
2010 2015 2015
High-incomegroupCountry data
11 11 1,18776 78 81
27,680 20,290 41,366–0.4 –3.7 1.5
.. 95 ..103 106 95
Yes YesMixed Mixed
C CP PC CA AA A
3.1 3.0 2.515.5 17.5 18.8
53.1 46.5 41.2110.6 114.0 124.5
20.3 30.7 31.053.4 68.6 83.246.4 68.1 85.0
12.8 13.8 ..45.0 176.3 195.944.4 66.8 81.0
96 99 9931,694 100,861 134,761
39.2 7.8 14.218.9 19.5 25.234.7 16.6 10.419.3 16.6 14.4
2.0 2.4 9.54.8 4.2 11.27.6 8.1 32.0
0.36 0.61 0.67126.4 192.0 1,194.6

Economic and social contextPopulation (millions)Urban population (% of total)GNI per capita, World Bank Atlas method ($)GDP growth, 2005–10 and 2010–15 (avg. annual %)Adult literacy rate (% ages 15 and older) Gross primary, secondary, and tertiary school enrollment (%)
Sector structureSeparate telecommunications/ICT regulatorStatus of main fixed-line telephone operatorLevel of competition (competition, partial comp., monopoly) International gateway(s) Mobile telephone service Internet serviceForeign ownership (not allowed, restricted, allowed)Reg. treatment of VoIP (banned, closed, no framework, allowed)
Sector efficiency and capacityTelecommunications revenue (% of GDP)Telecommunications investment (% of revenue)
Sector performanceAccessFixed-telephone subscriptions (per 100 people)Mobile-cellular telephone subscriptions (per 100 people)Fixed-broadband subscriptions (per 100 people)Households with a computer (%)Households with Internet access at home (%)
Usage Int’l. voice traffic, total (minutes/subscription/month)Domestic mobile traffic (minutes/subscription/month)Individuals using the Internet (%)
Quality Population covered by at least a 3G mobile network (%)International Internet bandwidth (bit/s per Internet user)
AffordabilityMobile-cellular sub-basket ($ a month)Fixed-broadband sub-basket ($ a month)Mobile-b’band, prepaid handset-based, 500 MB ($ a month)Mobile-b’band, postpaid computer-based, 1 GB ($ a month)
TradeICT goods exports (% of total goods exports)ICT goods imports (% of total goods imports)ICT service exports (% of total service exports)
ApplicationsOnline service index (0-1, 1=highest presence)Secure Internet servers (per million people)
94 2017 The Little Data Book on Information and Communication Technology
Europe & Central Asia High income
Greenland
2010 2015 2015
High-incomegroupCountry data
0.06 0.06 1,18784 86 81
19,290 .. 41,3661.5 .. 1.5
.. .. ..
.. .. 95
.. ..
.. ..
.. ..
.. ..
.. ..
.. ..
.. ..
.. .. 2.5
.. .. 18.8
38.6 27.9 41.2101.4 106.5 124.5
21.9 17.5 31.0.. .. 83.2
66.6a .. 85.0
.. .. ..95.0 .. 195.963.0 67.6a 81.0
25 .. 9912,632 .. 134,761
.. .. 14.2
.. .. 25.2
.. .. 10.4
.. .. 14.4
0.1 0.0 9.56.1 4.5 11.2
.. .. 32.0
.. .. 0.671,089.5 1,318.7 1,194.6

Economic and social contextPopulation (millions)Urban population (% of total)GNI per capita, World Bank Atlas method ($)GDP growth, 2005–10 and 2010–15 (avg. annual %)Adult literacy rate (% ages 15 and older) Gross primary, secondary, and tertiary school enrollment (%)
Sector structureSeparate telecommunications/ICT regulatorStatus of main fixed-line telephone operatorLevel of competition (competition, partial comp., monopoly) International gateway(s) Mobile telephone service Internet serviceForeign ownership (not allowed, restricted, allowed)Reg. treatment of VoIP (banned, closed, no framework, allowed)
Sector efficiency and capacityTelecommunications revenue (% of GDP)Telecommunications investment (% of revenue)
Sector performanceAccessFixed-telephone subscriptions (per 100 people)Mobile-cellular telephone subscriptions (per 100 people)Fixed-broadband subscriptions (per 100 people)Households with a computer (%)Households with Internet access at home (%)
Usage Int’l. voice traffic, total (minutes/subscription/month)Domestic mobile traffic (minutes/subscription/month)Individuals using the Internet (%)
Quality Population covered by at least a 3G mobile network (%)International Internet bandwidth (bit/s per Internet user)
AffordabilityMobile-cellular sub-basket ($ a month)Fixed-broadband sub-basket ($ a month)Mobile-b’band, prepaid handset-based, 500 MB ($ a month)Mobile-b’band, postpaid computer-based, 1 GB ($ a month)
TradeICT goods exports (% of total goods exports)ICT goods imports (% of total goods imports)ICT service exports (% of total service exports)
ApplicationsOnline service index (0-1, 1=highest presence)Secure Internet servers (per million people)
95The Little Data Book on Information and Communication Technology 2017
Latin America & Caribbean Upper middle income
Grenada
2010 2015 2015
Uppermiddle-incomegroupCountry data
0.10 0.11 2,59436 36 64
7,050 8,430 8,186–0.6 2.2 4.5
.. .. ..91 .. 81
Yes YesMixed Mixed
.. ..C CC CA A
No No
7.0 6.7 2.113.7 11.9 18.8
27.1 25.3 17.3116.5 112.3 105.1
13.8 18.5 15.435.0a 48.1a 48.728.0a 42.8a 52.2
46.6 42.3 2.3200.9 100.4 173.1
27.0a 53.8a 52.1
.. 100 69123,838 191,597 26,098
16.7 26.2 8.529.3 28.3 15.5
.. 22.2 7.7
.. 17.0 11.1
2.0 .. 15.74.4 .. 14.4
15.5 13.9 25.7
0.19 0.35 0.3786.0 46.8 34.7

Economic and social contextPopulation (millions)Urban population (% of total)GNI per capita, World Bank Atlas method ($)GDP growth, 2005–10 and 2010–15 (avg. annual %)Adult literacy rate (% ages 15 and older) Gross primary, secondary, and tertiary school enrollment (%)
Sector structureSeparate telecommunications/ICT regulatorStatus of main fixed-line telephone operatorLevel of competition (competition, partial comp., monopoly) International gateway(s) Mobile telephone service Internet serviceForeign ownership (not allowed, restricted, allowed)Reg. treatment of VoIP (banned, closed, no framework, allowed)
Sector efficiency and capacityTelecommunications revenue (% of GDP)Telecommunications investment (% of revenue)
Sector performanceAccessFixed-telephone subscriptions (per 100 people)Mobile-cellular telephone subscriptions (per 100 people)Fixed-broadband subscriptions (per 100 people)Households with a computer (%)Households with Internet access at home (%)
Usage Int’l. voice traffic, total (minutes/subscription/month)Domestic mobile traffic (minutes/subscription/month)Individuals using the Internet (%)
Quality Population covered by at least a 3G mobile network (%)International Internet bandwidth (bit/s per Internet user)
AffordabilityMobile-cellular sub-basket ($ a month)Fixed-broadband sub-basket ($ a month)Mobile-b’band, prepaid handset-based, 500 MB ($ a month)Mobile-b’band, postpaid computer-based, 1 GB ($ a month)
TradeICT goods exports (% of total goods exports)ICT goods imports (% of total goods imports)ICT service exports (% of total service exports)
ApplicationsOnline service index (0-1, 1=highest presence)Secure Internet servers (per million people)
96 2017 The Little Data Book on Information and Communication Technology
East Asia & Pacific High income
Guam
2010 2015 2015
High-incomegroupCountry data
0.16 0.17 1,18794 95 81
.. .. 41,366
.. .. 1.5
.. 100 ..
.. .. 95
.. ..
.. ..
.. ..
.. ..
.. ..
.. ..
.. ..
.. .. 2.5
.. .. 18.8
41.1 40.0 41.2.. .. 124.5
1.9 1.8 31.0.. .. 83.2.. .. 85.0
.. .. ..
.. .. 195.954.0a 73.1a 81.0
.. .. 99
.. .. 134,761
.. .. 14.2
.. .. 25.2
.. .. 10.4
.. .. 14.4
.. .. 9.5
.. .. 11.2
.. .. 32.0
.. .. 0.67244.6 206.0 1,194.6
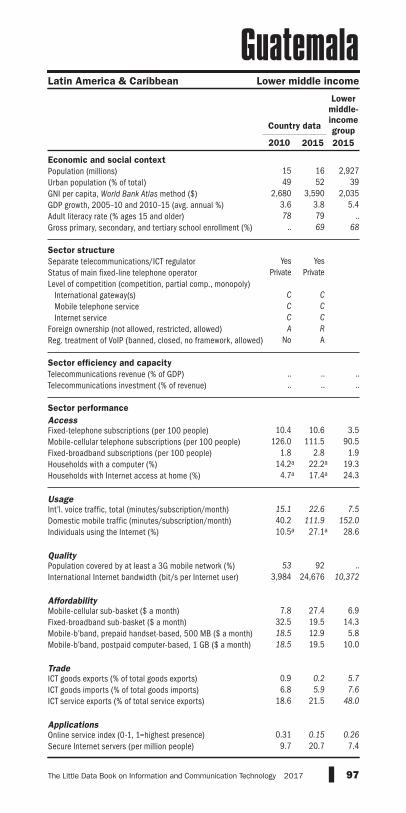
Economic and social contextPopulation (millions)Urban population (% of total)GNI per capita, World Bank Atlas method ($)GDP growth, 2005–10 and 2010–15 (avg. annual %)Adult literacy rate (% ages 15 and older) Gross primary, secondary, and tertiary school enrollment (%)
Sector structureSeparate telecommunications/ICT regulatorStatus of main fixed-line telephone operatorLevel of competition (competition, partial comp., monopoly) International gateway(s) Mobile telephone service Internet serviceForeign ownership (not allowed, restricted, allowed)Reg. treatment of VoIP (banned, closed, no framework, allowed)
Sector efficiency and capacityTelecommunications revenue (% of GDP)Telecommunications investment (% of revenue)
Sector performanceAccessFixed-telephone subscriptions (per 100 people)Mobile-cellular telephone subscriptions (per 100 people)Fixed-broadband subscriptions (per 100 people)Households with a computer (%)Households with Internet access at home (%)
Usage Int’l. voice traffic, total (minutes/subscription/month)Domestic mobile traffic (minutes/subscription/month)Individuals using the Internet (%)
Quality Population covered by at least a 3G mobile network (%)International Internet bandwidth (bit/s per Internet user)
AffordabilityMobile-cellular sub-basket ($ a month)Fixed-broadband sub-basket ($ a month)Mobile-b’band, prepaid handset-based, 500 MB ($ a month)Mobile-b’band, postpaid computer-based, 1 GB ($ a month)
TradeICT goods exports (% of total goods exports)ICT goods imports (% of total goods imports)ICT service exports (% of total service exports)
ApplicationsOnline service index (0-1, 1=highest presence)Secure Internet servers (per million people)
97The Little Data Book on Information and Communication Technology 2017
Latin America & Caribbean Lower middle income
Guatemala
2010 2015 2015
Lowermiddle-incomegroupCountry data
15 16 2,92749 52 39
2,680 3,590 2,0353.6 3.8 5.478 79 ..
.. 69 68
Yes YesPrivate Private
C CC CC CA R
No A
.. .. ..
.. .. ..
10.4 10.6 3.5126.0 111.5 90.5
1.8 2.8 1.914.2a 22.2a 19.3
4.7a 17.4a 24.3
15.1 22.6 7.540.2 111.9 152.010.5a 27.1a 28.6
53 92 ..3,984 24,676 10,372
7.8 27.4 6.932.5 19.5 14.318.5 12.9 5.818.5 19.5 10.0
0.9 0.2 5.76.8 5.9 7.6
18.6 21.5 48.0
0.31 0.15 0.269.7 20.7 7.4

Economic and social contextPopulation (millions)Urban population (% of total)GNI per capita, World Bank Atlas method ($)GDP growth, 2005–10 and 2010–15 (avg. annual %)Adult literacy rate (% ages 15 and older) Gross primary, secondary, and tertiary school enrollment (%)
Sector structureSeparate telecommunications/ICT regulatorStatus of main fixed-line telephone operatorLevel of competition (competition, partial comp., monopoly) International gateway(s) Mobile telephone service Internet serviceForeign ownership (not allowed, restricted, allowed)Reg. treatment of VoIP (banned, closed, no framework, allowed)
Sector efficiency and capacityTelecommunications revenue (% of GDP)Telecommunications investment (% of revenue)
Sector performanceAccessFixed-telephone subscriptions (per 100 people)Mobile-cellular telephone subscriptions (per 100 people)Fixed-broadband subscriptions (per 100 people)Households with a computer (%)Households with Internet access at home (%)
Usage Int’l. voice traffic, total (minutes/subscription/month)Domestic mobile traffic (minutes/subscription/month)Individuals using the Internet (%)
Quality Population covered by at least a 3G mobile network (%)International Internet bandwidth (bit/s per Internet user)
AffordabilityMobile-cellular sub-basket ($ a month)Fixed-broadband sub-basket ($ a month)Mobile-b’band, prepaid handset-based, 500 MB ($ a month)Mobile-b’band, postpaid computer-based, 1 GB ($ a month)
TradeICT goods exports (% of total goods exports)ICT goods imports (% of total goods imports)ICT service exports (% of total service exports)
ApplicationsOnline service index (0-1, 1=highest presence)Secure Internet servers (per million people)
98 2017 The Little Data Book on Information and Communication Technology
Sub-Saharan Africa Low income
Guinea
2010 2015 2015
Low-incomegroupCountry data
11 13 63835 37 31
390 470 6202.2 2.1 5.425 30 ..51 53 60
Yes YesMixed Public
C ..C CC CR ..
No C
.. .. ..
.. .. ..
0.2 0.0 0.936.8 87.2 60.0
0.0 0.0 0.31.5a 2.6a 4.81.0a 3.7a 7.1
.. .. ..
.. .. 48.91.0a 4.7a 9.5
.. 39 511,379 930 4,245
3.1 5.4 9.4502.5 51.1 33.6
.. 3.3 8.0
.. 9.4 10.8
0.0 0.0 ..5.2 3.2 3.4
53.7 69.3 ..
0.03 0.00 0.110.4 0.5 1.5
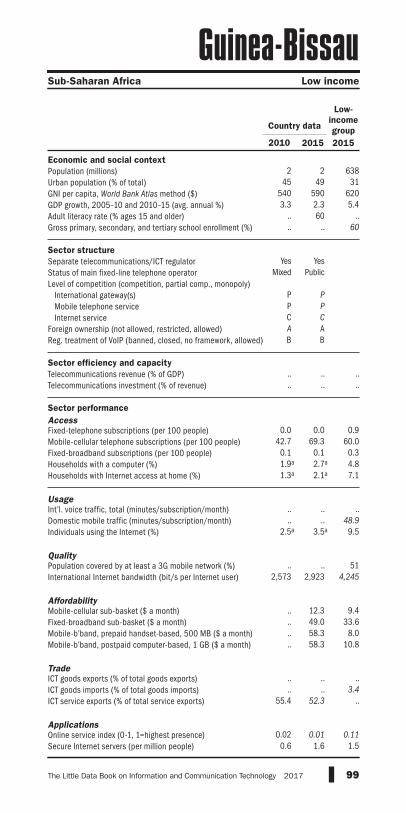
Economic and social contextPopulation (millions)Urban population (% of total)GNI per capita, World Bank Atlas method ($)GDP growth, 2005–10 and 2010–15 (avg. annual %)Adult literacy rate (% ages 15 and older) Gross primary, secondary, and tertiary school enrollment (%)
Sector structureSeparate telecommunications/ICT regulatorStatus of main fixed-line telephone operatorLevel of competition (competition, partial comp., monopoly) International gateway(s) Mobile telephone service Internet serviceForeign ownership (not allowed, restricted, allowed)Reg. treatment of VoIP (banned, closed, no framework, allowed)
Sector efficiency and capacityTelecommunications revenue (% of GDP)Telecommunications investment (% of revenue)
Sector performanceAccessFixed-telephone subscriptions (per 100 people)Mobile-cellular telephone subscriptions (per 100 people)Fixed-broadband subscriptions (per 100 people)Households with a computer (%)Households with Internet access at home (%)
Usage Int’l. voice traffic, total (minutes/subscription/month)Domestic mobile traffic (minutes/subscription/month)Individuals using the Internet (%)
Quality Population covered by at least a 3G mobile network (%)International Internet bandwidth (bit/s per Internet user)
AffordabilityMobile-cellular sub-basket ($ a month)Fixed-broadband sub-basket ($ a month)Mobile-b’band, prepaid handset-based, 500 MB ($ a month)Mobile-b’band, postpaid computer-based, 1 GB ($ a month)
TradeICT goods exports (% of total goods exports)ICT goods imports (% of total goods imports)ICT service exports (% of total service exports)
ApplicationsOnline service index (0-1, 1=highest presence)Secure Internet servers (per million people)
99The Little Data Book on Information and Communication Technology 2017
Sub-Saharan Africa Low income
Guinea-Bissau
2010 2015 2015
Low-incomegroupCountry data
2 2 63845 49 31
540 590 6203.3 2.3 5.4
.. 60 ..
.. .. 60
Yes YesMixed Public
P PP PC CA AB B
.. .. ..
.. .. ..
0.0 0.0 0.942.7 69.3 60.0
0.1 0.1 0.31.9a 2.7a 4.81.3a 2.1a 7.1
.. .. ..
.. .. 48.92.5a 3.5a 9.5
.. .. 512,573 2,923 4,245
.. 12.3 9.4
.. 49.0 33.6
.. 58.3 8.0
.. 58.3 10.8
.. .. ..
.. .. 3.455.4 52.3 ..
0.02 0.01 0.110.6 1.6 1.5

Economic and social contextPopulation (millions)Urban population (% of total)GNI per capita, World Bank Atlas method ($)GDP growth, 2005–10 and 2010–15 (avg. annual %)Adult literacy rate (% ages 15 and older) Gross primary, secondary, and tertiary school enrollment (%)
Sector structureSeparate telecommunications/ICT regulatorStatus of main fixed-line telephone operatorLevel of competition (competition, partial comp., monopoly) International gateway(s) Mobile telephone service Internet serviceForeign ownership (not allowed, restricted, allowed)Reg. treatment of VoIP (banned, closed, no framework, allowed)
Sector efficiency and capacityTelecommunications revenue (% of GDP)Telecommunications investment (% of revenue)
Sector performanceAccessFixed-telephone subscriptions (per 100 people)Mobile-cellular telephone subscriptions (per 100 people)Fixed-broadband subscriptions (per 100 people)Households with a computer (%)Households with Internet access at home (%)
Usage Int’l. voice traffic, total (minutes/subscription/month)Domestic mobile traffic (minutes/subscription/month)Individuals using the Internet (%)
Quality Population covered by at least a 3G mobile network (%)International Internet bandwidth (bit/s per Internet user)
AffordabilityMobile-cellular sub-basket ($ a month)Fixed-broadband sub-basket ($ a month)Mobile-b’band, prepaid handset-based, 500 MB ($ a month)Mobile-b’band, postpaid computer-based, 1 GB ($ a month)
TradeICT goods exports (% of total goods exports)ICT goods imports (% of total goods imports)ICT service exports (% of total service exports)
ApplicationsOnline service index (0-1, 1=highest presence)Secure Internet servers (per million people)
100 2017 The Little Data Book on Information and Communication Technology
Latin America & Caribbean Upper middle income
Guyana
2010 2015 2015
Uppermiddle-incomegroupCountry data
0.75 0.77 2,59428 29 64
2,900 4,090 8,1864.2 4.5 4.585 88 ..70 .. 81
Yes YesMixed Mixed
M MP PP P.. ..B C
5.3 4.6 2.119.1 10.7 18.8
19.1 19.1 17.371.3 67.2 105.1
1.4 6.6 15.417.5a 29.1a 48.715.7a 26.1a 52.2
14.0 15.1 2.336.3 30.2 173.129.9 38.2a 52.1
0 .. 696,126 25,607 26,098
9.4 13.1 8.546.8 24.2 15.5
.. 13.6 7.7
.. 15.5 11.1
0.1 0.1 15.72.9 2.3 14.4
32.1 23.3 25.7
0.18 0.24 0.376.6 16.9 34.7

Economic and social contextPopulation (millions)Urban population (% of total)GNI per capita, World Bank Atlas method ($)GDP growth, 2005–10 and 2010–15 (avg. annual %)Adult literacy rate (% ages 15 and older) Gross primary, secondary, and tertiary school enrollment (%)
Sector structureSeparate telecommunications/ICT regulatorStatus of main fixed-line telephone operatorLevel of competition (competition, partial comp., monopoly) International gateway(s) Mobile telephone service Internet serviceForeign ownership (not allowed, restricted, allowed)Reg. treatment of VoIP (banned, closed, no framework, allowed)
Sector efficiency and capacityTelecommunications revenue (% of GDP)Telecommunications investment (% of revenue)
Sector performanceAccessFixed-telephone subscriptions (per 100 people)Mobile-cellular telephone subscriptions (per 100 people)Fixed-broadband subscriptions (per 100 people)Households with a computer (%)Households with Internet access at home (%)
Usage Int’l. voice traffic, total (minutes/subscription/month)Domestic mobile traffic (minutes/subscription/month)Individuals using the Internet (%)
Quality Population covered by at least a 3G mobile network (%)International Internet bandwidth (bit/s per Internet user)
AffordabilityMobile-cellular sub-basket ($ a month)Fixed-broadband sub-basket ($ a month)Mobile-b’band, prepaid handset-based, 500 MB ($ a month)Mobile-b’band, postpaid computer-based, 1 GB ($ a month)
TradeICT goods exports (% of total goods exports)ICT goods imports (% of total goods imports)ICT service exports (% of total service exports)
ApplicationsOnline service index (0-1, 1=highest presence)Secure Internet servers (per million people)
101The Little Data Book on Information and Communication Technology 2017
Latin America & Caribbean Low income
Haiti
2010 2015 2015
Low-incomegroupCountry data
10 11 63852 59 31
650 820 6201.2 3.4 5.449 61 ..
.. .. 60
Yes YesMixed Mixed
C CC CC CR A
No A
3.7 .. .... .. ..
0.5 0.4 0.940.4 69.9 60.0
.. 0.0 0.35.9a 9.4a 4.82.7a 4.4a 7.1
.. 0.6 ..
.. 5.4 48.98.4a 12.2a 9.5
.. 40 51
.. .. 4,245
12.6 9.3 9.447.8 42.8 33.6
9.5 8.9 8.019.1 19.7 10.8
.. .. ..
.. .. 3.4
.. .. ..
0.02 0.11 0.111.0 2.1 1.5
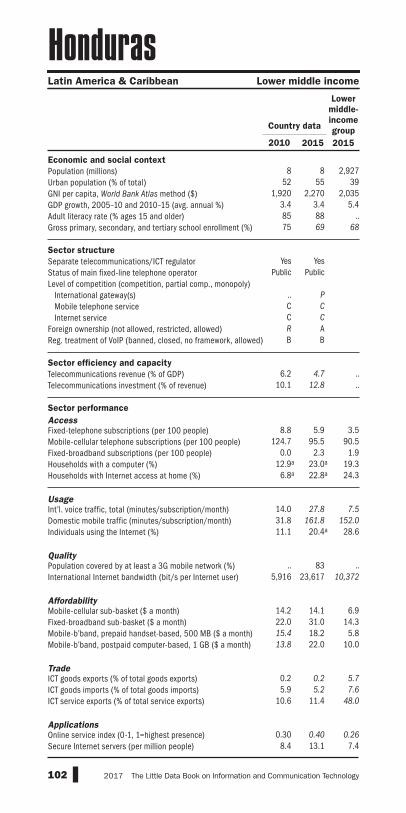
Economic and social contextPopulation (millions)Urban population (% of total)GNI per capita, World Bank Atlas method ($)GDP growth, 2005–10 and 2010–15 (avg. annual %)Adult literacy rate (% ages 15 and older) Gross primary, secondary, and tertiary school enrollment (%)
Sector structureSeparate telecommunications/ICT regulatorStatus of main fixed-line telephone operatorLevel of competition (competition, partial comp., monopoly) International gateway(s) Mobile telephone service Internet serviceForeign ownership (not allowed, restricted, allowed)Reg. treatment of VoIP (banned, closed, no framework, allowed)
Sector efficiency and capacityTelecommunications revenue (% of GDP)Telecommunications investment (% of revenue)
Sector performanceAccessFixed-telephone subscriptions (per 100 people)Mobile-cellular telephone subscriptions (per 100 people)Fixed-broadband subscriptions (per 100 people)Households with a computer (%)Households with Internet access at home (%)
Usage Int’l. voice traffic, total (minutes/subscription/month)Domestic mobile traffic (minutes/subscription/month)Individuals using the Internet (%)
Quality Population covered by at least a 3G mobile network (%)International Internet bandwidth (bit/s per Internet user)
AffordabilityMobile-cellular sub-basket ($ a month)Fixed-broadband sub-basket ($ a month)Mobile-b’band, prepaid handset-based, 500 MB ($ a month)Mobile-b’band, postpaid computer-based, 1 GB ($ a month)
TradeICT goods exports (% of total goods exports)ICT goods imports (% of total goods imports)ICT service exports (% of total service exports)
ApplicationsOnline service index (0-1, 1=highest presence)Secure Internet servers (per million people)
102 2017 The Little Data Book on Information and Communication Technology
Latin America & Caribbean Lower middle income
Honduras
2010 2015 2015
Lowermiddle-incomegroupCountry data
8 8 2,92752 55 39
1,920 2,270 2,0353.4 3.4 5.485 88 ..75 69 68
Yes YesPublic Public
.. PC CC CR AB B
6.2 4.7 ..10.1 12.8 ..
8.8 5.9 3.5124.7 95.5 90.5
0.0 2.3 1.912.9a 23.0a 19.3
6.8a 22.8a 24.3
14.0 27.8 7.531.8 161.8 152.011.1 20.4a 28.6
.. 83 ..5,916 23,617 10,372
14.2 14.1 6.922.0 31.0 14.315.4 18.2 5.813.8 22.0 10.0
0.2 0.2 5.75.9 5.2 7.6
10.6 11.4 48.0
0.30 0.40 0.268.4 13.1 7.4

Economic and social contextPopulation (millions)Urban population (% of total)GNI per capita, World Bank Atlas method ($)GDP growth, 2005–10 and 2010–15 (avg. annual %)Adult literacy rate (% ages 15 and older) Gross primary, secondary, and tertiary school enrollment (%)
Sector structureSeparate telecommunications/ICT regulatorStatus of main fixed-line telephone operatorLevel of competition (competition, partial comp., monopoly) International gateway(s) Mobile telephone service Internet serviceForeign ownership (not allowed, restricted, allowed)Reg. treatment of VoIP (banned, closed, no framework, allowed)
Sector efficiency and capacityTelecommunications revenue (% of GDP)Telecommunications investment (% of revenue)
Sector performanceAccessFixed-telephone subscriptions (per 100 people)Mobile-cellular telephone subscriptions (per 100 people)Fixed-broadband subscriptions (per 100 people)Households with a computer (%)Households with Internet access at home (%)
Usage Int’l. voice traffic, total (minutes/subscription/month)Domestic mobile traffic (minutes/subscription/month)Individuals using the Internet (%)
Quality Population covered by at least a 3G mobile network (%)International Internet bandwidth (bit/s per Internet user)
AffordabilityMobile-cellular sub-basket ($ a month)Fixed-broadband sub-basket ($ a month)Mobile-b’band, prepaid handset-based, 500 MB ($ a month)Mobile-b’band, postpaid computer-based, 1 GB ($ a month)
TradeICT goods exports (% of total goods exports)ICT goods imports (% of total goods imports)ICT service exports (% of total service exports)
ApplicationsOnline service index (0-1, 1=highest presence)Secure Internet servers (per million people)
103The Little Data Book on Information and Communication Technology 2017
East Asia & Pacific High income
Hong Kong SAR, China
2010 2015 2015
High-incomegroupCountry data
7 7 1,187100 100 81
33,620 41,000 41,3663.4 2.8 1.5
.. .. ..91 93 95
Yes .... Public
.. C
.. C
.. C
.. ..A C
3.2 .. 2.513.4 .. 18.8
61.9 59.2 41.2195.7 228.8 124.5
30.7 31.9 31.077.9 80.4 83.276.4 79.0 85.0
63.8 56.2 ..139.5 98.6 195.9
72.0 84.9 81.0
99 99 99777,030 4,155,651 134,761
9.8 6.0 14.219.1 51.3 25.242.3 9.8 10.427.9 27.9 14.4
44.2 45.5 9.542.8 43.5 11.216.4 15.1 32.0
.. .. 0.67456.3 904.5 1,194.6

Economic and social contextPopulation (millions)Urban population (% of total)GNI per capita, World Bank Atlas method ($)GDP growth, 2005–10 and 2010–15 (avg. annual %)Adult literacy rate (% ages 15 and older) Gross primary, secondary, and tertiary school enrollment (%)
Sector structureSeparate telecommunications/ICT regulatorStatus of main fixed-line telephone operatorLevel of competition (competition, partial comp., monopoly) International gateway(s) Mobile telephone service Internet serviceForeign ownership (not allowed, restricted, allowed)Reg. treatment of VoIP (banned, closed, no framework, allowed)
Sector efficiency and capacityTelecommunications revenue (% of GDP)Telecommunications investment (% of revenue)
Sector performanceAccessFixed-telephone subscriptions (per 100 people)Mobile-cellular telephone subscriptions (per 100 people)Fixed-broadband subscriptions (per 100 people)Households with a computer (%)Households with Internet access at home (%)
Usage Int’l. voice traffic, total (minutes/subscription/month)Domestic mobile traffic (minutes/subscription/month)Individuals using the Internet (%)
Quality Population covered by at least a 3G mobile network (%)International Internet bandwidth (bit/s per Internet user)
AffordabilityMobile-cellular sub-basket ($ a month)Fixed-broadband sub-basket ($ a month)Mobile-b’band, prepaid handset-based, 500 MB ($ a month)Mobile-b’band, postpaid computer-based, 1 GB ($ a month)
TradeICT goods exports (% of total goods exports)ICT goods imports (% of total goods imports)ICT service exports (% of total service exports)
ApplicationsOnline service index (0-1, 1=highest presence)Secure Internet servers (per million people)
104 2017 The Little Data Book on Information and Communication Technology
Europe & Central Asia High income
Hungary
2010 2015 2015
High-incomegroupCountry data
10 10 1,18769 71 81
13,090 12,990 41,366–0.6 1.6 1.5
.. 99 ..90 92 95
Yes YesPrivate Private
C CP PC CA AA A
2.8 2.9 2.523.4 17.7 18.8
29.7 31.2 41.2119.9 118.9 124.5
21.6 27.4 31.066.4 75.0 83.260.5 75.6 85.0
8.9 .. ..121.1 133.5 195.9
65.0 72.8 81.0
66 98 999,985 55,410 134,761
27.6 21.5 14.220.7 21.2 25.2
8.9 7.1 10.48.9 11.7 14.4
25.6 12.0 9.521.2 12.5 11.228.6 29.1 32.0
0.50 0.56 0.67166.2 366.3 1,194.6

Economic and social contextPopulation (millions)Urban population (% of total)GNI per capita, World Bank Atlas method ($)GDP growth, 2005–10 and 2010–15 (avg. annual %)Adult literacy rate (% ages 15 and older) Gross primary, secondary, and tertiary school enrollment (%)
Sector structureSeparate telecommunications/ICT regulatorStatus of main fixed-line telephone operatorLevel of competition (competition, partial comp., monopoly) International gateway(s) Mobile telephone service Internet serviceForeign ownership (not allowed, restricted, allowed)Reg. treatment of VoIP (banned, closed, no framework, allowed)
Sector efficiency and capacityTelecommunications revenue (% of GDP)Telecommunications investment (% of revenue)
Sector performanceAccessFixed-telephone subscriptions (per 100 people)Mobile-cellular telephone subscriptions (per 100 people)Fixed-broadband subscriptions (per 100 people)Households with a computer (%)Households with Internet access at home (%)
Usage Int’l. voice traffic, total (minutes/subscription/month)Domestic mobile traffic (minutes/subscription/month)Individuals using the Internet (%)
Quality Population covered by at least a 3G mobile network (%)International Internet bandwidth (bit/s per Internet user)
AffordabilityMobile-cellular sub-basket ($ a month)Fixed-broadband sub-basket ($ a month)Mobile-b’band, prepaid handset-based, 500 MB ($ a month)Mobile-b’band, postpaid computer-based, 1 GB ($ a month)
TradeICT goods exports (% of total goods exports)ICT goods imports (% of total goods imports)ICT service exports (% of total service exports)
ApplicationsOnline service index (0-1, 1=highest presence)Secure Internet servers (per million people)
105The Little Data Book on Information and Communication Technology 2017
Europe & Central Asia High income
Iceland
2010 2015 2015
High-incomegroupCountry data
0.32 0.33 1,18794 94 81
36,670 49,730 41,3661.4 2.5 1.5
.. .. ..98 .. 95
Yes YesMixed Mixed
C CC CC CA AA A
1.9 1.8 2.517.2 16.4 18.8
60.9 49.9 41.2107.2 114.0 124.5
34.3 37.0 31.093.0 98.5a 83.292.0 96.5a 85.0
19.0 14.7 ..176.3 173.1 195.9
93.4 98.2a 81.0
92 99 99297,960 725,806 134,761
16.6 21.6 14.224.9 28.4 25.2
.. 5.2 10.48.7 8.3 14.4
0.1 0.2 9.54.3 5.1 11.2
.. 12.1 32.0
0.40 0.61 0.672,524.8 3,406.7 1,194.6

Economic and social contextPopulation (millions)Urban population (% of total)GNI per capita, World Bank Atlas method ($)GDP growth, 2005–10 and 2010–15 (avg. annual %)Adult literacy rate (% ages 15 and older) Gross primary, secondary, and tertiary school enrollment (%)
Sector structureSeparate telecommunications/ICT regulatorStatus of main fixed-line telephone operatorLevel of competition (competition, partial comp., monopoly) International gateway(s) Mobile telephone service Internet serviceForeign ownership (not allowed, restricted, allowed)Reg. treatment of VoIP (banned, closed, no framework, allowed)
Sector efficiency and capacityTelecommunications revenue (% of GDP)Telecommunications investment (% of revenue)
Sector performanceAccessFixed-telephone subscriptions (per 100 people)Mobile-cellular telephone subscriptions (per 100 people)Fixed-broadband subscriptions (per 100 people)Households with a computer (%)Households with Internet access at home (%)
Usage Int’l. voice traffic, total (minutes/subscription/month)Domestic mobile traffic (minutes/subscription/month)Individuals using the Internet (%)
Quality Population covered by at least a 3G mobile network (%)International Internet bandwidth (bit/s per Internet user)
AffordabilityMobile-cellular sub-basket ($ a month)Fixed-broadband sub-basket ($ a month)Mobile-b’band, prepaid handset-based, 500 MB ($ a month)Mobile-b’band, postpaid computer-based, 1 GB ($ a month)
TradeICT goods exports (% of total goods exports)ICT goods imports (% of total goods imports)ICT service exports (% of total service exports)
ApplicationsOnline service index (0-1, 1=highest presence)Secure Internet servers (per million people)
106 2017 The Little Data Book on Information and Communication Technology
South Asia Lower middle income
India
2010 2015 2015
Lowermiddle-incomegroupCountry data
1,231 1,311 2,92731 33 39
1,260 1,590 2,0357.7 6.7 5.469 72 ..65 69 68
Yes YesMixed Mixed
C CP CC CR RA C
2.1 1.8 ..29.5 16.2 ..
2.9 2.0 3.562.4 78.8 90.5
0.9 1.3 1.96.7a 14.1a 19.34.5 20.0a 24.3
5.7 7.7 7.5129.1 168.8 152.0
7.5a 26.0a 28.6
0 .. ..5,917 5,725 10,372
3.9 2.8 6.96.1 6.7 14.33.7 4.0 5.84.7 3.9 10.0
2.0 1.0 5.76.3 6.3 7.6
68.0 67.5 48.0
0.37 0.54 0.262.1 6.8 7.4
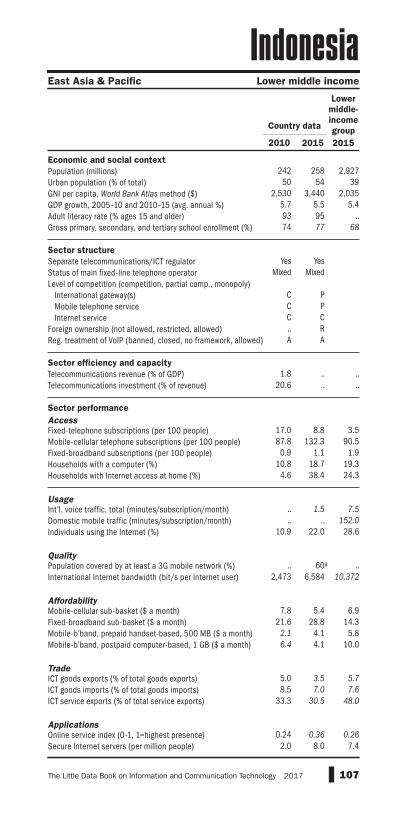
Economic and social contextPopulation (millions)Urban population (% of total)GNI per capita, World Bank Atlas method ($)GDP growth, 2005–10 and 2010–15 (avg. annual %)Adult literacy rate (% ages 15 and older) Gross primary, secondary, and tertiary school enrollment (%)
Sector structureSeparate telecommunications/ICT regulatorStatus of main fixed-line telephone operatorLevel of competition (competition, partial comp., monopoly) International gateway(s) Mobile telephone service Internet serviceForeign ownership (not allowed, restricted, allowed)Reg. treatment of VoIP (banned, closed, no framework, allowed)
Sector efficiency and capacityTelecommunications revenue (% of GDP)Telecommunications investment (% of revenue)
Sector performanceAccessFixed-telephone subscriptions (per 100 people)Mobile-cellular telephone subscriptions (per 100 people)Fixed-broadband subscriptions (per 100 people)Households with a computer (%)Households with Internet access at home (%)
Usage Int’l. voice traffic, total (minutes/subscription/month)Domestic mobile traffic (minutes/subscription/month)Individuals using the Internet (%)
Quality Population covered by at least a 3G mobile network (%)International Internet bandwidth (bit/s per Internet user)
AffordabilityMobile-cellular sub-basket ($ a month)Fixed-broadband sub-basket ($ a month)Mobile-b’band, prepaid handset-based, 500 MB ($ a month)Mobile-b’band, postpaid computer-based, 1 GB ($ a month)
TradeICT goods exports (% of total goods exports)ICT goods imports (% of total goods imports)ICT service exports (% of total service exports)
ApplicationsOnline service index (0-1, 1=highest presence)Secure Internet servers (per million people)
107The Little Data Book on Information and Communication Technology 2017
East Asia & Pacific Lower middle income
Indonesia
2010 2015 2015
Lowermiddle-incomegroupCountry data
242 258 2,92750 54 39
2,530 3,440 2,0355.7 5.5 5.493 95 ..74 77 68
Yes YesMixed Mixed
C PC PC C.. RA A
1.8 .. ..20.6 .. ..
17.0 8.8 3.587.8 132.3 90.5
0.9 1.1 1.910.8 18.7 19.3
4.6 38.4 24.3
.. 1.5 7.5
.. .. 152.010.9 22.0 28.6
.. 60a ..2,473 6,584 10,372
7.8 5.4 6.921.6 28.8 14.3
2.1 4.1 5.86.4 4.1 10.0
5.0 3.5 5.78.5 7.0 7.6
33.3 30.5 48.0
0.24 0.36 0.262.0 8.0 7.4

Economic and social contextPopulation (millions)Urban population (% of total)GNI per capita, World Bank Atlas method ($)GDP growth, 2005–10 and 2010–15 (avg. annual %)Adult literacy rate (% ages 15 and older) Gross primary, secondary, and tertiary school enrollment (%)
Sector structureSeparate telecommunications/ICT regulatorStatus of main fixed-line telephone operatorLevel of competition (competition, partial comp., monopoly) International gateway(s) Mobile telephone service Internet serviceForeign ownership (not allowed, restricted, allowed)Reg. treatment of VoIP (banned, closed, no framework, allowed)
Sector efficiency and capacityTelecommunications revenue (% of GDP)Telecommunications investment (% of revenue)
Sector performanceAccessFixed-telephone subscriptions (per 100 people)Mobile-cellular telephone subscriptions (per 100 people)Fixed-broadband subscriptions (per 100 people)Households with a computer (%)Households with Internet access at home (%)
Usage Int’l. voice traffic, total (minutes/subscription/month)Domestic mobile traffic (minutes/subscription/month)Individuals using the Internet (%)
Quality Population covered by at least a 3G mobile network (%)International Internet bandwidth (bit/s per Internet user)
AffordabilityMobile-cellular sub-basket ($ a month)Fixed-broadband sub-basket ($ a month)Mobile-b’band, prepaid handset-based, 500 MB ($ a month)Mobile-b’band, postpaid computer-based, 1 GB ($ a month)
TradeICT goods exports (% of total goods exports)ICT goods imports (% of total goods imports)ICT service exports (% of total service exports)
ApplicationsOnline service index (0-1, 1=highest presence)Secure Internet servers (per million people)
108 2017 The Little Data Book on Information and Communication Technology
Middle East & North Africa Upper middle income
Iran, Islamic Rep.
2010 2015 2015
Uppermiddle-incomegroupCountry data
74 79 2,59471 73 64
6,020 6,550 8,1864.6 –1.0 4.584 87 ..72 88 81
Yes YesPublic Mixed
M MC CC PR RC A
2.1 1.8 2.191.4 .. 18.8
34.7 38.3 17.372.6 93.4 105.1
1.3 10.9 15.435.2 53.4a 48.721.4 52.2a 52.2
2.8 1.8 2.3210.4 147.6 173.1
15.9 44.1a 52.1
0 60 692,264 8,502 26,098
3.6 1.9 8.516.6 3.8 15.5
.. 3.8 7.7
.. 3.8 11.1
0.0 .. 15.73.6 .. 14.4
.. .. 25.7
0.27 0.37 0.370.7 5.5 34.7

Economic and social contextPopulation (millions)Urban population (% of total)GNI per capita, World Bank Atlas method ($)GDP growth, 2005–10 and 2010–15 (avg. annual %)Adult literacy rate (% ages 15 and older) Gross primary, secondary, and tertiary school enrollment (%)
Sector structureSeparate telecommunications/ICT regulatorStatus of main fixed-line telephone operatorLevel of competition (competition, partial comp., monopoly) International gateway(s) Mobile telephone service Internet serviceForeign ownership (not allowed, restricted, allowed)Reg. treatment of VoIP (banned, closed, no framework, allowed)
Sector efficiency and capacityTelecommunications revenue (% of GDP)Telecommunications investment (% of revenue)
Sector performanceAccessFixed-telephone subscriptions (per 100 people)Mobile-cellular telephone subscriptions (per 100 people)Fixed-broadband subscriptions (per 100 people)Households with a computer (%)Households with Internet access at home (%)
Usage Int’l. voice traffic, total (minutes/subscription/month)Domestic mobile traffic (minutes/subscription/month)Individuals using the Internet (%)
Quality Population covered by at least a 3G mobile network (%)International Internet bandwidth (bit/s per Internet user)
AffordabilityMobile-cellular sub-basket ($ a month)Fixed-broadband sub-basket ($ a month)Mobile-b’band, prepaid handset-based, 500 MB ($ a month)Mobile-b’band, postpaid computer-based, 1 GB ($ a month)
TradeICT goods exports (% of total goods exports)ICT goods imports (% of total goods imports)ICT service exports (% of total service exports)
ApplicationsOnline service index (0-1, 1=highest presence)Secure Internet servers (per million people)
109The Little Data Book on Information and Communication Technology 2017
Middle East & North Africa Upper middle income
Iraq
2010 2015 2015
Uppermiddle-incomegroupCountry data
31 36 2,59469 69 64
4,410 5,550 8,1865.5 5.6 4.5
.. 80 ..
.. .. 81
Yes YesPublic Public
M MP PP PR ..B A
.. .. 2.1
.. .. 18.8
5.6 5.6 17.375.1 93.8 105.1
0.0 .. 15.420.6a 27.2a 48.711.6a 18.7a 52.2
.. .. 2.3
.. .. 173.12.5 17.2a 52.1
.. 55a 69103 .. 26,098
12.5 10.1 8.5211.3 28.3 15.5
.. 10.3 7.7
.. 12.8 11.1
.. .. 15.7
.. .. 14.44.5 .. 25.7
0.15 0.20 0.370.1 1.3 34.7
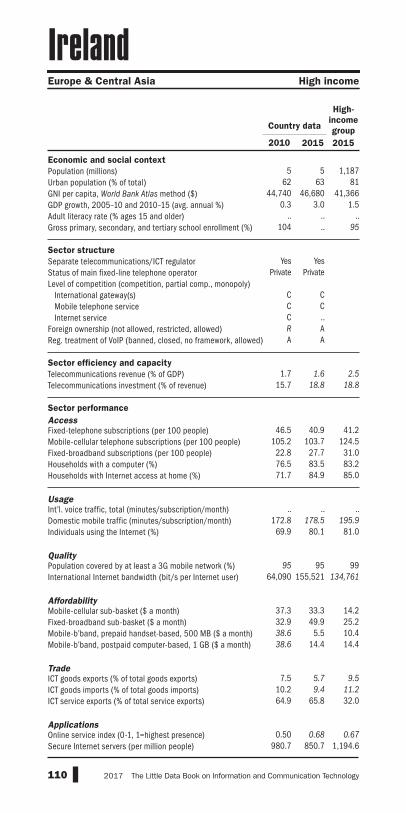
Economic and social contextPopulation (millions)Urban population (% of total)GNI per capita, World Bank Atlas method ($)GDP growth, 2005–10 and 2010–15 (avg. annual %)Adult literacy rate (% ages 15 and older) Gross primary, secondary, and tertiary school enrollment (%)
Sector structureSeparate telecommunications/ICT regulatorStatus of main fixed-line telephone operatorLevel of competition (competition, partial comp., monopoly) International gateway(s) Mobile telephone service Internet serviceForeign ownership (not allowed, restricted, allowed)Reg. treatment of VoIP (banned, closed, no framework, allowed)
Sector efficiency and capacityTelecommunications revenue (% of GDP)Telecommunications investment (% of revenue)
Sector performanceAccessFixed-telephone subscriptions (per 100 people)Mobile-cellular telephone subscriptions (per 100 people)Fixed-broadband subscriptions (per 100 people)Households with a computer (%)Households with Internet access at home (%)
Usage Int’l. voice traffic, total (minutes/subscription/month)Domestic mobile traffic (minutes/subscription/month)Individuals using the Internet (%)
Quality Population covered by at least a 3G mobile network (%)International Internet bandwidth (bit/s per Internet user)
AffordabilityMobile-cellular sub-basket ($ a month)Fixed-broadband sub-basket ($ a month)Mobile-b’band, prepaid handset-based, 500 MB ($ a month)Mobile-b’band, postpaid computer-based, 1 GB ($ a month)
TradeICT goods exports (% of total goods exports)ICT goods imports (% of total goods imports)ICT service exports (% of total service exports)
ApplicationsOnline service index (0-1, 1=highest presence)Secure Internet servers (per million people)
110 2017 The Little Data Book on Information and Communication Technology
Europe & Central Asia High income
Ireland
2010 2015 2015
High-incomegroupCountry data
5 5 1,18762 63 81
44,740 46,680 41,3660.3 3.0 1.5
.. .. ..104 .. 95
Yes YesPrivate Private
C CC CC ..R AA A
1.7 1.6 2.515.7 18.8 18.8
46.5 40.9 41.2105.2 103.7 124.5
22.8 27.7 31.076.5 83.5 83.271.7 84.9 85.0
.. .. ..172.8 178.5 195.9
69.9 80.1 81.0
95 95 9964,090 155,521 134,761
37.3 33.3 14.232.9 49.9 25.238.6 5.5 10.438.6 14.4 14.4
7.5 5.7 9.510.2 9.4 11.264.9 65.8 32.0
0.50 0.68 0.67980.7 850.7 1,194.6

Economic and social contextPopulation (millions)Urban population (% of total)GNI per capita, World Bank Atlas method ($)GDP growth, 2005–10 and 2010–15 (avg. annual %)Adult literacy rate (% ages 15 and older) Gross primary, secondary, and tertiary school enrollment (%)
Sector structureSeparate telecommunications/ICT regulatorStatus of main fixed-line telephone operatorLevel of competition (competition, partial comp., monopoly) International gateway(s) Mobile telephone service Internet serviceForeign ownership (not allowed, restricted, allowed)Reg. treatment of VoIP (banned, closed, no framework, allowed)
Sector efficiency and capacityTelecommunications revenue (% of GDP)Telecommunications investment (% of revenue)
Sector performanceAccessFixed-telephone subscriptions (per 100 people)Mobile-cellular telephone subscriptions (per 100 people)Fixed-broadband subscriptions (per 100 people)Households with a computer (%)Households with Internet access at home (%)
Usage Int’l. voice traffic, total (minutes/subscription/month)Domestic mobile traffic (minutes/subscription/month)Individuals using the Internet (%)
Quality Population covered by at least a 3G mobile network (%)International Internet bandwidth (bit/s per Internet user)
AffordabilityMobile-cellular sub-basket ($ a month)Fixed-broadband sub-basket ($ a month)Mobile-b’band, prepaid handset-based, 500 MB ($ a month)Mobile-b’band, postpaid computer-based, 1 GB ($ a month)
TradeICT goods exports (% of total goods exports)ICT goods imports (% of total goods imports)ICT service exports (% of total service exports)
ApplicationsOnline service index (0-1, 1=highest presence)Secure Internet servers (per million people)
111The Little Data Book on Information and Communication Technology 2017
Europe & Central Asia High income
Isle of Man
2010 2015 2015
High-incomegroupCountry data
0.08 0.09 1,18752 52 81
72,040 83,920 41,3667.1 5.3 1.5
.. .. ..
.. .. 95
.. ..
.. ..
.. ..
.. ..
.. ..
.. ..
.. ..
.. .. 2.5
.. .. 18.8
.. .. 41.2
.. .. 124.5
.. .. 31.0
.. .. 83.2
.. .. 85.0
.. .. ..
.. .. 195.9
.. .. 81.0
.. .. 99
.. .. 134,761
.. .. 14.2
.. .. 25.2
.. .. 10.4
.. .. 14.4
.. .. 9.5
.. .. 11.2
.. .. 32.0
.. .. 0.67818.2 3,201.2 1,194.6

Economic and social contextPopulation (millions)Urban population (% of total)GNI per capita, World Bank Atlas method ($)GDP growth, 2005–10 and 2010–15 (avg. annual %)Adult literacy rate (% ages 15 and older) Gross primary, secondary, and tertiary school enrollment (%)
Sector structureSeparate telecommunications/ICT regulatorStatus of main fixed-line telephone operatorLevel of competition (competition, partial comp., monopoly) International gateway(s) Mobile telephone service Internet serviceForeign ownership (not allowed, restricted, allowed)Reg. treatment of VoIP (banned, closed, no framework, allowed)
Sector efficiency and capacityTelecommunications revenue (% of GDP)Telecommunications investment (% of revenue)
Sector performanceAccessFixed-telephone subscriptions (per 100 people)Mobile-cellular telephone subscriptions (per 100 people)Fixed-broadband subscriptions (per 100 people)Households with a computer (%)Households with Internet access at home (%)
Usage Int’l. voice traffic, total (minutes/subscription/month)Domestic mobile traffic (minutes/subscription/month)Individuals using the Internet (%)
Quality Population covered by at least a 3G mobile network (%)International Internet bandwidth (bit/s per Internet user)
AffordabilityMobile-cellular sub-basket ($ a month)Fixed-broadband sub-basket ($ a month)Mobile-b’band, prepaid handset-based, 500 MB ($ a month)Mobile-b’band, postpaid computer-based, 1 GB ($ a month)
TradeICT goods exports (% of total goods exports)ICT goods imports (% of total goods imports)ICT service exports (% of total service exports)
ApplicationsOnline service index (0-1, 1=highest presence)Secure Internet servers (per million people)
112 2017 The Little Data Book on Information and Communication Technology
Middle East & North Africa High income
Israel
2010 2015 2015
High-incomegroupCountry data
8 8 1,18792 92 81
29,640 35,440 41,3664.1 3.2 1.5
.. .. ..94 94 95
No NoMixed Private
C CC CC CR RA A
3.4 2.2 2.512.0 12.1 18.8
45.9 43.1 41.2122.8 133.5 124.5
23.7 27.4 31.076.6 83.5a 83.268.1 76.0a 85.0
.. .. ..
.. .. 195.967.5 78.9a 81.0
99 99 997,986 89,638 134,761
34.8 32.5 14.28.8 33.2 25.2
.. 15.4 10.4
.. 32.1 14.4
12.3 11.2 9.59.2 9.0 11.2
56.1 65.1 32.0
0.58 0.87 0.67396.7 288.8 1,194.6
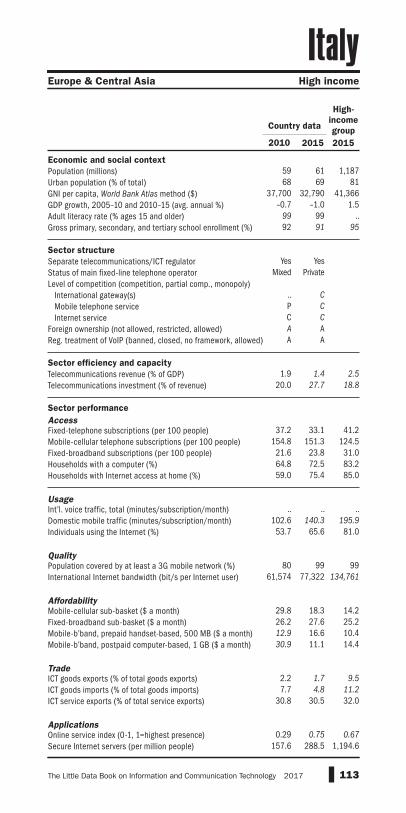
Economic and social contextPopulation (millions)Urban population (% of total)GNI per capita, World Bank Atlas method ($)GDP growth, 2005–10 and 2010–15 (avg. annual %)Adult literacy rate (% ages 15 and older) Gross primary, secondary, and tertiary school enrollment (%)
Sector structureSeparate telecommunications/ICT regulatorStatus of main fixed-line telephone operatorLevel of competition (competition, partial comp., monopoly) International gateway(s) Mobile telephone service Internet serviceForeign ownership (not allowed, restricted, allowed)Reg. treatment of VoIP (banned, closed, no framework, allowed)
Sector efficiency and capacityTelecommunications revenue (% of GDP)Telecommunications investment (% of revenue)
Sector performanceAccessFixed-telephone subscriptions (per 100 people)Mobile-cellular telephone subscriptions (per 100 people)Fixed-broadband subscriptions (per 100 people)Households with a computer (%)Households with Internet access at home (%)
Usage Int’l. voice traffic, total (minutes/subscription/month)Domestic mobile traffic (minutes/subscription/month)Individuals using the Internet (%)
Quality Population covered by at least a 3G mobile network (%)International Internet bandwidth (bit/s per Internet user)
AffordabilityMobile-cellular sub-basket ($ a month)Fixed-broadband sub-basket ($ a month)Mobile-b’band, prepaid handset-based, 500 MB ($ a month)Mobile-b’band, postpaid computer-based, 1 GB ($ a month)
TradeICT goods exports (% of total goods exports)ICT goods imports (% of total goods imports)ICT service exports (% of total service exports)
ApplicationsOnline service index (0-1, 1=highest presence)Secure Internet servers (per million people)
113The Little Data Book on Information and Communication Technology 2017
Europe & Central Asia High income
Italy
2010 2015 2015
High-incomegroupCountry data
59 61 1,18768 69 81
37,700 32,790 41,366–0.7 –1.0 1.5
99 99 ..92 91 95
Yes YesMixed Private
.. CP CC CA AA A
1.9 1.4 2.520.0 27.7 18.8
37.2 33.1 41.2154.8 151.3 124.5
21.6 23.8 31.064.8 72.5 83.259.0 75.4 85.0
.. .. ..102.6 140.3 195.9
53.7 65.6 81.0
80 99 9961,574 77,322 134,761
29.8 18.3 14.226.2 27.6 25.212.9 16.6 10.430.9 11.1 14.4
2.2 1.7 9.57.7 4.8 11.2
30.8 30.5 32.0
0.29 0.75 0.67157.6 288.5 1,194.6

Economic and social contextPopulation (millions)Urban population (% of total)GNI per capita, World Bank Atlas method ($)GDP growth, 2005–10 and 2010–15 (avg. annual %)Adult literacy rate (% ages 15 and older) Gross primary, secondary, and tertiary school enrollment (%)
Sector structureSeparate telecommunications/ICT regulatorStatus of main fixed-line telephone operatorLevel of competition (competition, partial comp., monopoly) International gateway(s) Mobile telephone service Internet serviceForeign ownership (not allowed, restricted, allowed)Reg. treatment of VoIP (banned, closed, no framework, allowed)
Sector efficiency and capacityTelecommunications revenue (% of GDP)Telecommunications investment (% of revenue)
Sector performanceAccessFixed-telephone subscriptions (per 100 people)Mobile-cellular telephone subscriptions (per 100 people)Fixed-broadband subscriptions (per 100 people)Households with a computer (%)Households with Internet access at home (%)
Usage Int’l. voice traffic, total (minutes/subscription/month)Domestic mobile traffic (minutes/subscription/month)Individuals using the Internet (%)
Quality Population covered by at least a 3G mobile network (%)International Internet bandwidth (bit/s per Internet user)
AffordabilityMobile-cellular sub-basket ($ a month)Fixed-broadband sub-basket ($ a month)Mobile-b’band, prepaid handset-based, 500 MB ($ a month)Mobile-b’band, postpaid computer-based, 1 GB ($ a month)
TradeICT goods exports (% of total goods exports)ICT goods imports (% of total goods imports)ICT service exports (% of total service exports)
ApplicationsOnline service index (0-1, 1=highest presence)Secure Internet servers (per million people)
114 2017 The Little Data Book on Information and Communication Technology
Latin America & Caribbean Upper middle income
Jamaica
2010 2015 2015
Uppermiddle-incomegroupCountry data
3 3 2,59454 55 64
4,570 5,010 8,186–0.7 0.5 4.5
.. 88 ..
.. .. 81
Yes YesMixed Private
C CC CC CA A
No A
4.3 4.2 2.126.7 26.1 18.8
9.6 9.0 17.3116.1 111.5 105.1
4.3 5.8 15.422.7 34.3a 48.714.0 30.3a 52.2
71.7 72.1 2.3191.9 188.1 173.1
27.7 43.2a 52.1
.. 90 6910,546 13,261 26,098
12.0 8.5 8.529.0 23.4 15.519.7 15.0 7.716.9 12.8 11.1
0.4 0.3 15.73.9 3.7 14.48.4 7.7 25.7
0.23 0.31 0.3739.4 65.7 34.7

Economic and social contextPopulation (millions)Urban population (% of total)GNI per capita, World Bank Atlas method ($)GDP growth, 2005–10 and 2010–15 (avg. annual %)Adult literacy rate (% ages 15 and older) Gross primary, secondary, and tertiary school enrollment (%)
Sector structureSeparate telecommunications/ICT regulatorStatus of main fixed-line telephone operatorLevel of competition (competition, partial comp., monopoly) International gateway(s) Mobile telephone service Internet serviceForeign ownership (not allowed, restricted, allowed)Reg. treatment of VoIP (banned, closed, no framework, allowed)
Sector efficiency and capacityTelecommunications revenue (% of GDP)Telecommunications investment (% of revenue)
Sector performanceAccessFixed-telephone subscriptions (per 100 people)Mobile-cellular telephone subscriptions (per 100 people)Fixed-broadband subscriptions (per 100 people)Households with a computer (%)Households with Internet access at home (%)
Usage Int’l. voice traffic, total (minutes/subscription/month)Domestic mobile traffic (minutes/subscription/month)Individuals using the Internet (%)
Quality Population covered by at least a 3G mobile network (%)International Internet bandwidth (bit/s per Internet user)
AffordabilityMobile-cellular sub-basket ($ a month)Fixed-broadband sub-basket ($ a month)Mobile-b’band, prepaid handset-based, 500 MB ($ a month)Mobile-b’band, postpaid computer-based, 1 GB ($ a month)
TradeICT goods exports (% of total goods exports)ICT goods imports (% of total goods imports)ICT service exports (% of total service exports)
ApplicationsOnline service index (0-1, 1=highest presence)Secure Internet servers (per million people)
115The Little Data Book on Information and Communication Technology 2017
East Asia & Pacific High income
Japan
2010 2015 2015
High-incomegroupCountry data
128 127 1,18791 93 81
41,980 36,680 41,366–0.2 0.7 1.5
.. .. ..88 90 95
No NoPrivate Private
C CC CC CA AA A
2.8 .. 2.511.1 .. 18.8
51.5 50.2 41.296.8 125.1 124.526.8 30.5 31.083.4 80.0a 83.281.3 96.5a 85.0
2.3 .. ..98.1 .. 195.978.2 93.3a 81.0
100 100 9915,730 62,618 134,761
52.8 29.4 14.223.1 18.0 25.2
.. 83.0 10.461.9 43.7 14.4
10.7 8.4 9.512.0 11.3 11.224.9 22.8 32.0
0.67 0.94 0.67646.7 971.0 1,194.6

Economic and social contextPopulation (millions)Urban population (% of total)GNI per capita, World Bank Atlas method ($)GDP growth, 2005–10 and 2010–15 (avg. annual %)Adult literacy rate (% ages 15 and older) Gross primary, secondary, and tertiary school enrollment (%)
Sector structureSeparate telecommunications/ICT regulatorStatus of main fixed-line telephone operatorLevel of competition (competition, partial comp., monopoly) International gateway(s) Mobile telephone service Internet serviceForeign ownership (not allowed, restricted, allowed)Reg. treatment of VoIP (banned, closed, no framework, allowed)
Sector efficiency and capacityTelecommunications revenue (% of GDP)Telecommunications investment (% of revenue)
Sector performanceAccessFixed-telephone subscriptions (per 100 people)Mobile-cellular telephone subscriptions (per 100 people)Fixed-broadband subscriptions (per 100 people)Households with a computer (%)Households with Internet access at home (%)
Usage Int’l. voice traffic, total (minutes/subscription/month)Domestic mobile traffic (minutes/subscription/month)Individuals using the Internet (%)
Quality Population covered by at least a 3G mobile network (%)International Internet bandwidth (bit/s per Internet user)
AffordabilityMobile-cellular sub-basket ($ a month)Fixed-broadband sub-basket ($ a month)Mobile-b’band, prepaid handset-based, 500 MB ($ a month)Mobile-b’band, postpaid computer-based, 1 GB ($ a month)
TradeICT goods exports (% of total goods exports)ICT goods imports (% of total goods imports)ICT service exports (% of total service exports)
ApplicationsOnline service index (0-1, 1=highest presence)Secure Internet servers (per million people)
116 2017 The Little Data Book on Information and Communication Technology
Middle East & North Africa Upper middle income
Jordan
2010 2015 2015
Uppermiddle-incomegroupCountry data
7 8 2,59482 84 64
3,820 4,680 8,1866.5 2.7 4.593 98 ..77 .. 81
Yes YesMixed Private
C CP PC CA AA A
6.1 4.1 2.119.2 15.4 18.8
7.5 4.8 17.3102.6 179.4 105.1
4.5 4.2 15.446.7 47.0a 48.721.6 75.9a 52.2
17.0 11.2 2.3230.2 256.6 173.1
27.2 53.4a 52.1
50 99 697,405 27,524 26,098
10.5 5.0 8.530.1 30.3 15.5
8.5 4.9 7.714.1 9.1 11.1
1.3 1.9 15.74.3 3.2 14.4
.. 5.6 25.7
0.53 0.52 0.3718.4 27.7 34.7

Economic and social contextPopulation (millions)Urban population (% of total)GNI per capita, World Bank Atlas method ($)GDP growth, 2005–10 and 2010–15 (avg. annual %)Adult literacy rate (% ages 15 and older) Gross primary, secondary, and tertiary school enrollment (%)
Sector structureSeparate telecommunications/ICT regulatorStatus of main fixed-line telephone operatorLevel of competition (competition, partial comp., monopoly) International gateway(s) Mobile telephone service Internet serviceForeign ownership (not allowed, restricted, allowed)Reg. treatment of VoIP (banned, closed, no framework, allowed)
Sector efficiency and capacityTelecommunications revenue (% of GDP)Telecommunications investment (% of revenue)
Sector performanceAccessFixed-telephone subscriptions (per 100 people)Mobile-cellular telephone subscriptions (per 100 people)Fixed-broadband subscriptions (per 100 people)Households with a computer (%)Households with Internet access at home (%)
Usage Int’l. voice traffic, total (minutes/subscription/month)Domestic mobile traffic (minutes/subscription/month)Individuals using the Internet (%)
Quality Population covered by at least a 3G mobile network (%)International Internet bandwidth (bit/s per Internet user)
AffordabilityMobile-cellular sub-basket ($ a month)Fixed-broadband sub-basket ($ a month)Mobile-b’band, prepaid handset-based, 500 MB ($ a month)Mobile-b’band, postpaid computer-based, 1 GB ($ a month)
TradeICT goods exports (% of total goods exports)ICT goods imports (% of total goods imports)ICT service exports (% of total service exports)
ApplicationsOnline service index (0-1, 1=highest presence)Secure Internet servers (per million people)
117The Little Data Book on Information and Communication Technology 2017
Europe & Central Asia Upper middle income
Kazakhstan
2010 2015 2015
Uppermiddle-incomegroupCountry data
16 18 2,59454 53 64
7,440 11,580 8,1865.7 4.7 4.5
100 100 ..86 92 81
No NoMixed Mixed
C CP PC CR AA No
2.2 1.7 2.115.1 17.1 18.8
25.5 24.7 17.3121.9 187.2 105.1
5.5 13.0 15.446.0a 73.8 48.744.0a 82.2 52.2
2.9 3.8 2.368.4 131.8 173.131.6 72.9 52.1
.. 73 699,306 69,615 26,098
12.2 6.0 8.523.9 8.7 15.5
6.6 4.5 7.76.6 4.5 11.1
0.0 0.8 15.75.0 6.0 14.4
11.6 11.1 25.7
0.53 0.75 0.375.2 17.6 34.7

Economic and social contextPopulation (millions)Urban population (% of total)GNI per capita, World Bank Atlas method ($)GDP growth, 2005–10 and 2010–15 (avg. annual %)Adult literacy rate (% ages 15 and older) Gross primary, secondary, and tertiary school enrollment (%)
Sector structureSeparate telecommunications/ICT regulatorStatus of main fixed-line telephone operatorLevel of competition (competition, partial comp., monopoly) International gateway(s) Mobile telephone service Internet serviceForeign ownership (not allowed, restricted, allowed)Reg. treatment of VoIP (banned, closed, no framework, allowed)
Sector efficiency and capacityTelecommunications revenue (% of GDP)Telecommunications investment (% of revenue)
Sector performanceAccessFixed-telephone subscriptions (per 100 people)Mobile-cellular telephone subscriptions (per 100 people)Fixed-broadband subscriptions (per 100 people)Households with a computer (%)Households with Internet access at home (%)
Usage Int’l. voice traffic, total (minutes/subscription/month)Domestic mobile traffic (minutes/subscription/month)Individuals using the Internet (%)
Quality Population covered by at least a 3G mobile network (%)International Internet bandwidth (bit/s per Internet user)
AffordabilityMobile-cellular sub-basket ($ a month)Fixed-broadband sub-basket ($ a month)Mobile-b’band, prepaid handset-based, 500 MB ($ a month)Mobile-b’band, postpaid computer-based, 1 GB ($ a month)
TradeICT goods exports (% of total goods exports)ICT goods imports (% of total goods imports)ICT service exports (% of total service exports)
ApplicationsOnline service index (0-1, 1=highest presence)Secure Internet servers (per million people)
118 2017 The Little Data Book on Information and Communication Technology
Sub-Saharan Africa Lower middle income
Kenya
2010 2015 2015
Lowermiddle-incomegroupCountry data
40 46 2,92724 26 39
1,000 1,340 2,0354.5 5.4 5.472 78 ..67 .. 68
Yes YesMixed Mixed
C CC CC CR RA A
3.4 3.7 ..52.2 30.2 ..
0.9 0.2 3.561.0 80.7 90.5
0.0 0.3 1.96.5a 13.1a 19.36.3a 19.6a 24.3
3.3 2.6 7.584.4 75.6 152.014.0 45.6a 28.6
.. 69 ..3,529 40,067 10,372
11.7 3.6 6.937.9 43.7 14.3
5.9 5.5 5.811.8 5.5 10.0
1.4 0.8 5.77.2 5.3 7.6
.. .. 48.0
0.24 0.43 0.262.6 9.1 7.4

Economic and social contextPopulation (millions)Urban population (% of total)GNI per capita, World Bank Atlas method ($)GDP growth, 2005–10 and 2010–15 (avg. annual %)Adult literacy rate (% ages 15 and older) Gross primary, secondary, and tertiary school enrollment (%)
Sector structureSeparate telecommunications/ICT regulatorStatus of main fixed-line telephone operatorLevel of competition (competition, partial comp., monopoly) International gateway(s) Mobile telephone service Internet serviceForeign ownership (not allowed, restricted, allowed)Reg. treatment of VoIP (banned, closed, no framework, allowed)
Sector efficiency and capacityTelecommunications revenue (% of GDP)Telecommunications investment (% of revenue)
Sector performanceAccessFixed-telephone subscriptions (per 100 people)Mobile-cellular telephone subscriptions (per 100 people)Fixed-broadband subscriptions (per 100 people)Households with a computer (%)Households with Internet access at home (%)
Usage Int’l. voice traffic, total (minutes/subscription/month)Domestic mobile traffic (minutes/subscription/month)Individuals using the Internet (%)
Quality Population covered by at least a 3G mobile network (%)International Internet bandwidth (bit/s per Internet user)
AffordabilityMobile-cellular sub-basket ($ a month)Fixed-broadband sub-basket ($ a month)Mobile-b’band, prepaid handset-based, 500 MB ($ a month)Mobile-b’band, postpaid computer-based, 1 GB ($ a month)
TradeICT goods exports (% of total goods exports)ICT goods imports (% of total goods imports)ICT service exports (% of total service exports)
ApplicationsOnline service index (0-1, 1=highest presence)Secure Internet servers (per million people)
119The Little Data Book on Information and Communication Technology 2017
East Asia & Pacific Lower middle income
Kiribati
2010 2015 2015
Lowermiddle-incomegroupCountry data
0.10 0.11 2,92744 44 39
1,990 3,230 2,0351.5 3.1 5.4
.. .. ..72 .. 68
Yes YesPublic Public
.. ..P PC C.. ..
No A
.. .. ..
.. .. ..
8.6 1.4 3.510.8 38.8 90.5
0.9 0.1 1.9.. 6.7a 19.3.. 6.3a 24.3
.. .. 7.5
.. .. 152.09.1 13.0a 28.6
.. 63 ..2,256 2,916 10,372
18.7 20.8 6.9383.1 187.8 14.3
.. 22.5 5.8
.. 56.3 10.0
7.3 0.0 5.71.8 5.0 7.6
.. .. 48.0
0.03 0.21 0.269.7 8.9 7.4

Economic and social contextPopulation (millions)Urban population (% of total)GNI per capita, World Bank Atlas method ($)GDP growth, 2005–10 and 2010–15 (avg. annual %)Adult literacy rate (% ages 15 and older) Gross primary, secondary, and tertiary school enrollment (%)
Sector structureSeparate telecommunications/ICT regulatorStatus of main fixed-line telephone operatorLevel of competition (competition, partial comp., monopoly) International gateway(s) Mobile telephone service Internet serviceForeign ownership (not allowed, restricted, allowed)Reg. treatment of VoIP (banned, closed, no framework, allowed)
Sector efficiency and capacityTelecommunications revenue (% of GDP)Telecommunications investment (% of revenue)
Sector performanceAccessFixed-telephone subscriptions (per 100 people)Mobile-cellular telephone subscriptions (per 100 people)Fixed-broadband subscriptions (per 100 people)Households with a computer (%)Households with Internet access at home (%)
Usage Int’l. voice traffic, total (minutes/subscription/month)Domestic mobile traffic (minutes/subscription/month)Individuals using the Internet (%)
Quality Population covered by at least a 3G mobile network (%)International Internet bandwidth (bit/s per Internet user)
AffordabilityMobile-cellular sub-basket ($ a month)Fixed-broadband sub-basket ($ a month)Mobile-b’band, prepaid handset-based, 500 MB ($ a month)Mobile-b’band, postpaid computer-based, 1 GB ($ a month)
TradeICT goods exports (% of total goods exports)ICT goods imports (% of total goods imports)ICT service exports (% of total service exports)
ApplicationsOnline service index (0-1, 1=highest presence)Secure Internet servers (per million people)
120 2017 The Little Data Book on Information and Communication Technology
East Asia & Pacific Low income
Korea, Dem. People’s Rep.
2010 2015 2015
Low-incomegroupCountry data
25 25 63860 61 31
.. .. 620
.. .. 5.4100 100 ..
81 .. 60
No NoPublic Public
.. ..
.. ..
.. ..No ..B A
.. .. ..
.. .. ..
4.8 4.7 0.91.8 12.9 60.0
.. .. 0.3
.. .. 4.8
.. .. 7.1
.. .. ..
.. .. 48.90.0a .. 9.5
.. .. 51
.. .. 4,245
.. .. 9.4
.. .. 33.6
.. .. 8.0
.. .. 10.8
.. .. ..
.. .. 3.4
.. .. ..
0.02 0.01 0.110.0 0.0 1.5

Economic and social contextPopulation (millions)Urban population (% of total)GNI per capita, World Bank Atlas method ($)GDP growth, 2005–10 and 2010–15 (avg. annual %)Adult literacy rate (% ages 15 and older) Gross primary, secondary, and tertiary school enrollment (%)
Sector structureSeparate telecommunications/ICT regulatorStatus of main fixed-line telephone operatorLevel of competition (competition, partial comp., monopoly) International gateway(s) Mobile telephone service Internet serviceForeign ownership (not allowed, restricted, allowed)Reg. treatment of VoIP (banned, closed, no framework, allowed)
Sector efficiency and capacityTelecommunications revenue (% of GDP)Telecommunications investment (% of revenue)
Sector performanceAccessFixed-telephone subscriptions (per 100 people)Mobile-cellular telephone subscriptions (per 100 people)Fixed-broadband subscriptions (per 100 people)Households with a computer (%)Households with Internet access at home (%)
Usage Int’l. voice traffic, total (minutes/subscription/month)Domestic mobile traffic (minutes/subscription/month)Individuals using the Internet (%)
Quality Population covered by at least a 3G mobile network (%)International Internet bandwidth (bit/s per Internet user)
AffordabilityMobile-cellular sub-basket ($ a month)Fixed-broadband sub-basket ($ a month)Mobile-b’band, prepaid handset-based, 500 MB ($ a month)Mobile-b’band, postpaid computer-based, 1 GB ($ a month)
TradeICT goods exports (% of total goods exports)ICT goods imports (% of total goods imports)ICT service exports (% of total service exports)
ApplicationsOnline service index (0-1, 1=highest presence)Secure Internet servers (per million people)
121The Little Data Book on Information and Communication Technology 2017
East Asia & Pacific High income
Korea, Rep.
2010 2015 2015
High-incomegroupCountry data
49 51 1,18782 82 81
21,320 27,440 41,3663.8 2.9 1.598 .. ..99 97 95
Yes YesPrivate Private
C CP PC CR RA A
4.1 3.8 2.512.2 12.1 18.8
58.9 58.1 41.2104.8 118.5 124.5
35.5 40.2 31.081.8 77.1 83.296.8 98.8 85.0
3.5 2.5 ..175.6 182.1 195.9
83.7 89.9 81.0
99 99 9911,812 46,764 134,761
22.5 18.0 14.225.7 29.2 25.2
.. 4.9 10.423.4 9.7 14.4
21.4 19.8 9.511.9 11.4 11.215.2 23.3 32.0
1.00 0.98 0.671,128.1 2,319.6 1,194.6

Economic and social contextPopulation (millions)Urban population (% of total)GNI per capita, World Bank Atlas method ($)GDP growth, 2005–10 and 2010–15 (avg. annual %)Adult literacy rate (% ages 15 and older) Gross primary, secondary, and tertiary school enrollment (%)
Sector structureSeparate telecommunications/ICT regulatorStatus of main fixed-line telephone operatorLevel of competition (competition, partial comp., monopoly) International gateway(s) Mobile telephone service Internet serviceForeign ownership (not allowed, restricted, allowed)Reg. treatment of VoIP (banned, closed, no framework, allowed)
Sector efficiency and capacityTelecommunications revenue (% of GDP)Telecommunications investment (% of revenue)
Sector performanceAccessFixed-telephone subscriptions (per 100 people)Mobile-cellular telephone subscriptions (per 100 people)Fixed-broadband subscriptions (per 100 people)Households with a computer (%)Households with Internet access at home (%)
Usage Int’l. voice traffic, total (minutes/subscription/month)Domestic mobile traffic (minutes/subscription/month)Individuals using the Internet (%)
Quality Population covered by at least a 3G mobile network (%)International Internet bandwidth (bit/s per Internet user)
AffordabilityMobile-cellular sub-basket ($ a month)Fixed-broadband sub-basket ($ a month)Mobile-b’band, prepaid handset-based, 500 MB ($ a month)Mobile-b’band, postpaid computer-based, 1 GB ($ a month)
TradeICT goods exports (% of total goods exports)ICT goods imports (% of total goods imports)ICT service exports (% of total service exports)
ApplicationsOnline service index (0-1, 1=highest presence)Secure Internet servers (per million people)
122 2017 The Little Data Book on Information and Communication Technology
Europe & Central Asia Lower middle income
Kosovo
2010 2015 2015
Lowermiddle-incomegroupCountry data
2 2 2,927.. .. 39
3,420 3,950 2,0354.2 3.0 5.4
.. .. ..
.. .. 68
.. ..
.. ..
.. ..
.. ..
.. ..
.. ..
.. ..
.. .. ..
.. .. ..
6.1 .. 3.532.4 .. 90.5
.. .. 1.9
.. .. 19.3
.. .. 24.3
.. .. 7.5
.. .. 152.0
.. .. 28.6
.. .. ..
.. .. 10,372
.. .. 6.9
.. .. 14.3
.. .. 5.8
.. .. 10.0
.. .. 5.7
.. .. 7.622.9 14.5 48.0
.. .. 0.26
.. .. 7.4
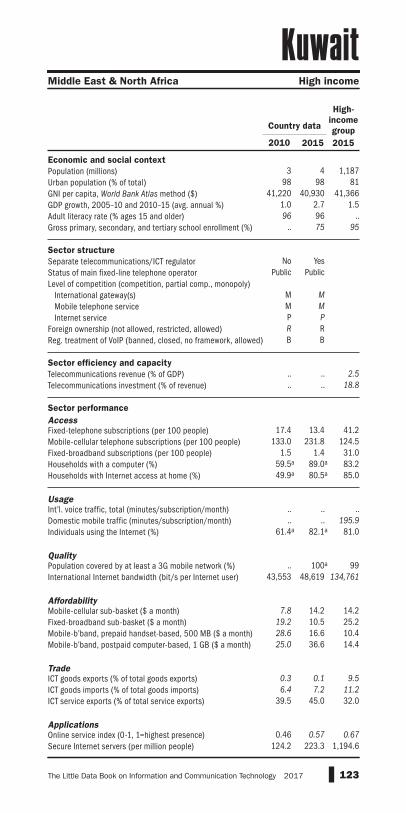
Economic and social contextPopulation (millions)Urban population (% of total)GNI per capita, World Bank Atlas method ($)GDP growth, 2005–10 and 2010–15 (avg. annual %)Adult literacy rate (% ages 15 and older) Gross primary, secondary, and tertiary school enrollment (%)
Sector structureSeparate telecommunications/ICT regulatorStatus of main fixed-line telephone operatorLevel of competition (competition, partial comp., monopoly) International gateway(s) Mobile telephone service Internet serviceForeign ownership (not allowed, restricted, allowed)Reg. treatment of VoIP (banned, closed, no framework, allowed)
Sector efficiency and capacityTelecommunications revenue (% of GDP)Telecommunications investment (% of revenue)
Sector performanceAccessFixed-telephone subscriptions (per 100 people)Mobile-cellular telephone subscriptions (per 100 people)Fixed-broadband subscriptions (per 100 people)Households with a computer (%)Households with Internet access at home (%)
Usage Int’l. voice traffic, total (minutes/subscription/month)Domestic mobile traffic (minutes/subscription/month)Individuals using the Internet (%)
Quality Population covered by at least a 3G mobile network (%)International Internet bandwidth (bit/s per Internet user)
AffordabilityMobile-cellular sub-basket ($ a month)Fixed-broadband sub-basket ($ a month)Mobile-b’band, prepaid handset-based, 500 MB ($ a month)Mobile-b’band, postpaid computer-based, 1 GB ($ a month)
TradeICT goods exports (% of total goods exports)ICT goods imports (% of total goods imports)ICT service exports (% of total service exports)
ApplicationsOnline service index (0-1, 1=highest presence)Secure Internet servers (per million people)
123The Little Data Book on Information and Communication Technology 2017
Middle East & North Africa High income
Kuwait
2010 2015 2015
High-incomegroupCountry data
3 4 1,18798 98 81
41,220 40,930 41,3661.0 2.7 1.596 96 ..
.. 75 95
No YesPublic Public
M MM MP PR RB B
.. .. 2.5
.. .. 18.8
17.4 13.4 41.2133.0 231.8 124.5
1.5 1.4 31.059.5a 89.0a 83.249.9a 80.5a 85.0
.. .. ..
.. .. 195.961.4a 82.1a 81.0
.. 100a 9943,553 48,619 134,761
7.8 14.2 14.219.2 10.5 25.228.6 16.6 10.425.0 36.6 14.4
0.3 0.1 9.56.4 7.2 11.2
39.5 45.0 32.0
0.46 0.57 0.67124.2 223.3 1,194.6

Economic and social contextPopulation (millions)Urban population (% of total)GNI per capita, World Bank Atlas method ($)GDP growth, 2005–10 and 2010–15 (avg. annual %)Adult literacy rate (% ages 15 and older) Gross primary, secondary, and tertiary school enrollment (%)
Sector structureSeparate telecommunications/ICT regulatorStatus of main fixed-line telephone operatorLevel of competition (competition, partial comp., monopoly) International gateway(s) Mobile telephone service Internet serviceForeign ownership (not allowed, restricted, allowed)Reg. treatment of VoIP (banned, closed, no framework, allowed)
Sector efficiency and capacityTelecommunications revenue (% of GDP)Telecommunications investment (% of revenue)
Sector performanceAccessFixed-telephone subscriptions (per 100 people)Mobile-cellular telephone subscriptions (per 100 people)Fixed-broadband subscriptions (per 100 people)Households with a computer (%)Households with Internet access at home (%)
Usage Int’l. voice traffic, total (minutes/subscription/month)Domestic mobile traffic (minutes/subscription/month)Individuals using the Internet (%)
Quality Population covered by at least a 3G mobile network (%)International Internet bandwidth (bit/s per Internet user)
AffordabilityMobile-cellular sub-basket ($ a month)Fixed-broadband sub-basket ($ a month)Mobile-b’band, prepaid handset-based, 500 MB ($ a month)Mobile-b’band, postpaid computer-based, 1 GB ($ a month)
TradeICT goods exports (% of total goods exports)ICT goods imports (% of total goods imports)ICT service exports (% of total service exports)
ApplicationsOnline service index (0-1, 1=highest presence)Secure Internet servers (per million people)
124 2017 The Little Data Book on Information and Communication Technology
Europe & Central Asia Lower middle income
Kyrgyz Republic
2010 2015 2015
Lowermiddle-incomegroupCountry data
5 6 2,92735 36 39
850 1,170 2,0355.1 5.0 5.499 100 ..73 79 68
Yes YesMixed Mixed
C CC CC CR A
No A
7.6 7.0 ..18.6 3.5 ..
9.2 7.1 3.598.9 132.8 90.5
0.4 3.7 1.96.1a 19.5a 19.32.2a 16.5a 24.3
6.9 16.0 7.578.7 252.4 152.016.3a 30.2a 28.6
32 59 ..1,426 7,357 10,372
2.9 3.2 6.948.1 8.9 14.312.1 4.7 5.816.3 3.1 10.0
0.6 0.1 5.72.7 2.2 7.6
27.7 14.4 48.0
0.32 0.28 0.261.1 11.4 7.4

Economic and social contextPopulation (millions)Urban population (% of total)GNI per capita, World Bank Atlas method ($)GDP growth, 2005–10 and 2010–15 (avg. annual %)Adult literacy rate (% ages 15 and older) Gross primary, secondary, and tertiary school enrollment (%)
Sector structureSeparate telecommunications/ICT regulatorStatus of main fixed-line telephone operatorLevel of competition (competition, partial comp., monopoly) International gateway(s) Mobile telephone service Internet serviceForeign ownership (not allowed, restricted, allowed)Reg. treatment of VoIP (banned, closed, no framework, allowed)
Sector efficiency and capacityTelecommunications revenue (% of GDP)Telecommunications investment (% of revenue)
Sector performanceAccessFixed-telephone subscriptions (per 100 people)Mobile-cellular telephone subscriptions (per 100 people)Fixed-broadband subscriptions (per 100 people)Households with a computer (%)Households with Internet access at home (%)
Usage Int’l. voice traffic, total (minutes/subscription/month)Domestic mobile traffic (minutes/subscription/month)Individuals using the Internet (%)
Quality Population covered by at least a 3G mobile network (%)International Internet bandwidth (bit/s per Internet user)
AffordabilityMobile-cellular sub-basket ($ a month)Fixed-broadband sub-basket ($ a month)Mobile-b’band, prepaid handset-based, 500 MB ($ a month)Mobile-b’band, postpaid computer-based, 1 GB ($ a month)
TradeICT goods exports (% of total goods exports)ICT goods imports (% of total goods imports)ICT service exports (% of total service exports)
ApplicationsOnline service index (0-1, 1=highest presence)Secure Internet servers (per million people)
125The Little Data Book on Information and Communication Technology 2017
East Asia & Pacific Lower middle income
Lao PDR
2010 2015 2015
Lowermiddle-incomegroupCountry data
6 7 2,92733 39 39
1,000 1,730 2,0357.9 7.9 5.473 80 ..62 63 68
Yes NoMixed Mixed
M MP ..P MR R
No C
1.9 3.2 ..20.9 0.7 ..
1.6 13.7 3.562.6 53.1 90.5
0.1 0.5 1.96.9a 11.4a 19.33.4a 11.4a 24.3
5.9 10.7 7.58.0 18.2 152.07.0 18.2a 28.6
17 65 ..1,117 16,795 10,372
6.3 6.8 6.9139.2 18.4 14.3
.. 6.1 5.86.2 6.8 10.0
.. .. 5.7
.. .. 7.6
.. .. 48.0
0.08 0.14 0.260.8 2.5 7.4

Economic and social contextPopulation (millions)Urban population (% of total)GNI per capita, World Bank Atlas method ($)GDP growth, 2005–10 and 2010–15 (avg. annual %)Adult literacy rate (% ages 15 and older) Gross primary, secondary, and tertiary school enrollment (%)
Sector structureSeparate telecommunications/ICT regulatorStatus of main fixed-line telephone operatorLevel of competition (competition, partial comp., monopoly) International gateway(s) Mobile telephone service Internet serviceForeign ownership (not allowed, restricted, allowed)Reg. treatment of VoIP (banned, closed, no framework, allowed)
Sector efficiency and capacityTelecommunications revenue (% of GDP)Telecommunications investment (% of revenue)
Sector performanceAccessFixed-telephone subscriptions (per 100 people)Mobile-cellular telephone subscriptions (per 100 people)Fixed-broadband subscriptions (per 100 people)Households with a computer (%)Households with Internet access at home (%)
Usage Int’l. voice traffic, total (minutes/subscription/month)Domestic mobile traffic (minutes/subscription/month)Individuals using the Internet (%)
Quality Population covered by at least a 3G mobile network (%)International Internet bandwidth (bit/s per Internet user)
AffordabilityMobile-cellular sub-basket ($ a month)Fixed-broadband sub-basket ($ a month)Mobile-b’band, prepaid handset-based, 500 MB ($ a month)Mobile-b’band, postpaid computer-based, 1 GB ($ a month)
TradeICT goods exports (% of total goods exports)ICT goods imports (% of total goods imports)ICT service exports (% of total service exports)
ApplicationsOnline service index (0-1, 1=highest presence)Secure Internet servers (per million people)
126 2017 The Little Data Book on Information and Communication Technology
Europe & Central Asia High income
Latvia
2010 2015 2015
High-incomegroupCountry data
2 2 1,18768 67 81
12,600 14,900 41,366–1.2 3.4 1.5100 100 ..
90 93 95
Yes YesMixed Mixed
.. ..P PC CA AA A
3.6 2.2 2.525.9 26.4 18.8
25.5a 19.5 41.2110.3a 127.0 124.5
20.8 25.1 31.062.8 76.1 83.259.8 76.0 85.0
.. .. ..
.. 222.2 195.968.4 79.2 81.0
.. .. 9933,559 111,881 134,761
12.4 4.4 14.212.8 12.1 25.2
.. 6.6 10.49.1 7.8 14.4
5.8 9.8 9.56.4 9.0 11.2
20.3 24.3 32.0
0.42 0.70 0.67185.0 456.4 1,194.6

Economic and social contextPopulation (millions)Urban population (% of total)GNI per capita, World Bank Atlas method ($)GDP growth, 2005–10 and 2010–15 (avg. annual %)Adult literacy rate (% ages 15 and older) Gross primary, secondary, and tertiary school enrollment (%)
Sector structureSeparate telecommunications/ICT regulatorStatus of main fixed-line telephone operatorLevel of competition (competition, partial comp., monopoly) International gateway(s) Mobile telephone service Internet serviceForeign ownership (not allowed, restricted, allowed)Reg. treatment of VoIP (banned, closed, no framework, allowed)
Sector efficiency and capacityTelecommunications revenue (% of GDP)Telecommunications investment (% of revenue)
Sector performanceAccessFixed-telephone subscriptions (per 100 people)Mobile-cellular telephone subscriptions (per 100 people)Fixed-broadband subscriptions (per 100 people)Households with a computer (%)Households with Internet access at home (%)
Usage Int’l. voice traffic, total (minutes/subscription/month)Domestic mobile traffic (minutes/subscription/month)Individuals using the Internet (%)
Quality Population covered by at least a 3G mobile network (%)International Internet bandwidth (bit/s per Internet user)
AffordabilityMobile-cellular sub-basket ($ a month)Fixed-broadband sub-basket ($ a month)Mobile-b’band, prepaid handset-based, 500 MB ($ a month)Mobile-b’band, postpaid computer-based, 1 GB ($ a month)
TradeICT goods exports (% of total goods exports)ICT goods imports (% of total goods imports)ICT service exports (% of total service exports)
ApplicationsOnline service index (0-1, 1=highest presence)Secure Internet servers (per million people)
127The Little Data Book on Information and Communication Technology 2017
Middle East & North Africa Upper middle income
Lebanon
2010 2015 2015
Uppermiddle-incomegroupCountry data
4 6 2,59487 88 64
8,450 7,930 8,1868.2 1.6 4.590 94 ..77 70 81
Yes YesPublic Public
M MM MC CR ..
No B
.. .. 2.1
.. .. 18.8
19.3 19.2 17.366.0 87.1 105.1
7.6 22.8 15.461.5a 81.0a 48.750.7a 69.0a 52.2
44.4 .. 2.3189.4 .. 173.1
43.7a 74.0a 52.1
0 96a 691,318 27,275 26,098
30.0 15.7 8.525.3 17.5 15.5
.. 11.0 7.7
.. 20.9 11.1
7.1 1.0 15.72.8 2.5 14.4
26.7 23.2 25.7
0.27 0.35 0.3727.9 48.2 34.7

Economic and social contextPopulation (millions)Urban population (% of total)GNI per capita, World Bank Atlas method ($)GDP growth, 2005–10 and 2010–15 (avg. annual %)Adult literacy rate (% ages 15 and older) Gross primary, secondary, and tertiary school enrollment (%)
Sector structureSeparate telecommunications/ICT regulatorStatus of main fixed-line telephone operatorLevel of competition (competition, partial comp., monopoly) International gateway(s) Mobile telephone service Internet serviceForeign ownership (not allowed, restricted, allowed)Reg. treatment of VoIP (banned, closed, no framework, allowed)
Sector efficiency and capacityTelecommunications revenue (% of GDP)Telecommunications investment (% of revenue)
Sector performanceAccessFixed-telephone subscriptions (per 100 people)Mobile-cellular telephone subscriptions (per 100 people)Fixed-broadband subscriptions (per 100 people)Households with a computer (%)Households with Internet access at home (%)
Usage Int’l. voice traffic, total (minutes/subscription/month)Domestic mobile traffic (minutes/subscription/month)Individuals using the Internet (%)
Quality Population covered by at least a 3G mobile network (%)International Internet bandwidth (bit/s per Internet user)
AffordabilityMobile-cellular sub-basket ($ a month)Fixed-broadband sub-basket ($ a month)Mobile-b’band, prepaid handset-based, 500 MB ($ a month)Mobile-b’band, postpaid computer-based, 1 GB ($ a month)
TradeICT goods exports (% of total goods exports)ICT goods imports (% of total goods imports)ICT service exports (% of total service exports)
ApplicationsOnline service index (0-1, 1=highest presence)Secure Internet servers (per million people)
128 2017 The Little Data Book on Information and Communication Technology
Sub-Saharan Africa Lower middle income
Lesotho
2010 2015 2015
Lowermiddle-incomegroupCountry data
2 2 2,92725 27 39
1,160 1,330 2,0355.1 4.4 5.476 79 ..65 63 68
Yes YesMixed Mixed
C PC CC CA A
No No
3.0 3.8 ..16.9 35.0 ..
1.9 2.1 3.549.2 105.5 90.5
0.0 0.1 1.95.0a 7.5a 19.32.5a 11.5a 24.3
1.9 5.4 7.515.4 26.8 152.0
3.9a 16.1a 28.6
32 95 ..335 3,862 10,372
24.1 8.7 6.951.0 7.8 14.326.8 7.8 5.831.7 17.2 10.0
1.2 .. 5.75.6 .. 7.6
31.6 33.8 48.0
0.26 0.16 0.260.5 4.2 7.4

Economic and social contextPopulation (millions)Urban population (% of total)GNI per capita, World Bank Atlas method ($)GDP growth, 2005–10 and 2010–15 (avg. annual %)Adult literacy rate (% ages 15 and older) Gross primary, secondary, and tertiary school enrollment (%)
Sector structureSeparate telecommunications/ICT regulatorStatus of main fixed-line telephone operatorLevel of competition (competition, partial comp., monopoly) International gateway(s) Mobile telephone service Internet serviceForeign ownership (not allowed, restricted, allowed)Reg. treatment of VoIP (banned, closed, no framework, allowed)
Sector efficiency and capacityTelecommunications revenue (% of GDP)Telecommunications investment (% of revenue)
Sector performanceAccessFixed-telephone subscriptions (per 100 people)Mobile-cellular telephone subscriptions (per 100 people)Fixed-broadband subscriptions (per 100 people)Households with a computer (%)Households with Internet access at home (%)
Usage Int’l. voice traffic, total (minutes/subscription/month)Domestic mobile traffic (minutes/subscription/month)Individuals using the Internet (%)
Quality Population covered by at least a 3G mobile network (%)International Internet bandwidth (bit/s per Internet user)
AffordabilityMobile-cellular sub-basket ($ a month)Fixed-broadband sub-basket ($ a month)Mobile-b’band, prepaid handset-based, 500 MB ($ a month)Mobile-b’band, postpaid computer-based, 1 GB ($ a month)
TradeICT goods exports (% of total goods exports)ICT goods imports (% of total goods imports)ICT service exports (% of total service exports)
ApplicationsOnline service index (0-1, 1=highest presence)Secure Internet servers (per million people)
129The Little Data Book on Information and Communication Technology 2017
Sub-Saharan Africa Low income
Liberia
2010 2015 2015
Low-incomegroupCountry data
4 5 63848 50 31
250 380 6207.2 5.4 5.443 48 ..
.. .. 60
Yes YesPublic Public
C CP PC C
No ..C C
0.1 .. ..23.1 .. ..
0.1 0.2 0.939.7 81.1 60.0
0.0 0.2 0.31.1a 2.4a 4.80.9a 2.7a 7.1
11.1 8.5 ..51.6 52.4 48.9
2.3 5.9a 9.5
25 50 51604 7,522 4,245
.. 14.1 9.4
.. .. 33.6
.. 4.0 8.0
.. 24.0 10.8
.. .. ..
.. .. 3.4
.. .. ..
0.06 0.08 0.110.8 3.6 1.5

Economic and social contextPopulation (millions)Urban population (% of total)GNI per capita, World Bank Atlas method ($)GDP growth, 2005–10 and 2010–15 (avg. annual %)Adult literacy rate (% ages 15 and older) Gross primary, secondary, and tertiary school enrollment (%)
Sector structureSeparate telecommunications/ICT regulatorStatus of main fixed-line telephone operatorLevel of competition (competition, partial comp., monopoly) International gateway(s) Mobile telephone service Internet serviceForeign ownership (not allowed, restricted, allowed)Reg. treatment of VoIP (banned, closed, no framework, allowed)
Sector efficiency and capacityTelecommunications revenue (% of GDP)Telecommunications investment (% of revenue)
Sector performanceAccessFixed-telephone subscriptions (per 100 people)Mobile-cellular telephone subscriptions (per 100 people)Fixed-broadband subscriptions (per 100 people)Households with a computer (%)Households with Internet access at home (%)
Usage Int’l. voice traffic, total (minutes/subscription/month)Domestic mobile traffic (minutes/subscription/month)Individuals using the Internet (%)
Quality Population covered by at least a 3G mobile network (%)International Internet bandwidth (bit/s per Internet user)
AffordabilityMobile-cellular sub-basket ($ a month)Fixed-broadband sub-basket ($ a month)Mobile-b’band, prepaid handset-based, 500 MB ($ a month)Mobile-b’band, postpaid computer-based, 1 GB ($ a month)
TradeICT goods exports (% of total goods exports)ICT goods imports (% of total goods imports)ICT service exports (% of total service exports)
ApplicationsOnline service index (0-1, 1=highest presence)Secure Internet servers (per million people)
130 2017 The Little Data Book on Information and Communication Technology
Middle East & North Africa Upper middle income
Libya
2010 2015 2015
Uppermiddle-incomegroupCountry data
6 6 2,59478 79 64
12,250 6,030 8,1863.6 –8.7 4.5
.. 91 ..
.. .. 81
Yes YesPublic Public
.. ..M M.. .... ..B B
.. .. 2.1
.. .. 18.8
20.3a 10.0 17.3180.4a 157.0 105.1
1.2 1.0 15.414.6a 22.0a 48.7
9.2a 20.4a 52.2
.. .. 2.3
.. .. 173.114.0a 19.0a 52.1
.. .. 6911,825 11,238 26,098
.. 6.4 8.5
.. 21.7 15.541.2 36.2 7.711.9 10.9 11.1
.. .. 15.73.6 .. 14.4
.. .. 25.7
0.14 0.02 0.371.4 3.8 34.7

Economic and social contextPopulation (millions)Urban population (% of total)GNI per capita, World Bank Atlas method ($)GDP growth, 2005–10 and 2010–15 (avg. annual %)Adult literacy rate (% ages 15 and older) Gross primary, secondary, and tertiary school enrollment (%)
Sector structureSeparate telecommunications/ICT regulatorStatus of main fixed-line telephone operatorLevel of competition (competition, partial comp., monopoly) International gateway(s) Mobile telephone service Internet serviceForeign ownership (not allowed, restricted, allowed)Reg. treatment of VoIP (banned, closed, no framework, allowed)
Sector efficiency and capacityTelecommunications revenue (% of GDP)Telecommunications investment (% of revenue)
Sector performanceAccessFixed-telephone subscriptions (per 100 people)Mobile-cellular telephone subscriptions (per 100 people)Fixed-broadband subscriptions (per 100 people)Households with a computer (%)Households with Internet access at home (%)
Usage Int’l. voice traffic, total (minutes/subscription/month)Domestic mobile traffic (minutes/subscription/month)Individuals using the Internet (%)
Quality Population covered by at least a 3G mobile network (%)International Internet bandwidth (bit/s per Internet user)
AffordabilityMobile-cellular sub-basket ($ a month)Fixed-broadband sub-basket ($ a month)Mobile-b’band, prepaid handset-based, 500 MB ($ a month)Mobile-b’band, postpaid computer-based, 1 GB ($ a month)
TradeICT goods exports (% of total goods exports)ICT goods imports (% of total goods imports)ICT service exports (% of total service exports)
ApplicationsOnline service index (0-1, 1=highest presence)Secure Internet servers (per million people)
131The Little Data Book on Information and Communication Technology 2017
Europe & Central Asia High income
Liechtenstein
2010 2015 2015
High-incomegroupCountry data
0.04 0.04 1,18714 14 81
115,530 .. 41,3663.0 .. 1.5
.. .. ..86 88 95
Yes YesPublic Mixed
M CP CC CA A.. ..
.. .. 2.5
.. 45.2 18.8
54.3 45.9 41.298.3 108.8 124.542.2 42.7 31.0
.. .. 83.2
.. .. 85.0
.. .. ..11.6 13.1 195.980.0a 96.6a 81.0
98 99 996,022 .. 134,761
.. 30.1 14.2
.. 35.3 25.2
.. .. 10.435.9 30.1 14.4
.. .. 9.5
.. .. 11.2
.. .. 32.0
0.52 0.51 0.675,733.8 10,231.5 1,194.6

Economic and social contextPopulation (millions)Urban population (% of total)GNI per capita, World Bank Atlas method ($)GDP growth, 2005–10 and 2010–15 (avg. annual %)Adult literacy rate (% ages 15 and older) Gross primary, secondary, and tertiary school enrollment (%)
Sector structureSeparate telecommunications/ICT regulatorStatus of main fixed-line telephone operatorLevel of competition (competition, partial comp., monopoly) International gateway(s) Mobile telephone service Internet serviceForeign ownership (not allowed, restricted, allowed)Reg. treatment of VoIP (banned, closed, no framework, allowed)
Sector efficiency and capacityTelecommunications revenue (% of GDP)Telecommunications investment (% of revenue)
Sector performanceAccessFixed-telephone subscriptions (per 100 people)Mobile-cellular telephone subscriptions (per 100 people)Fixed-broadband subscriptions (per 100 people)Households with a computer (%)Households with Internet access at home (%)
Usage Int’l. voice traffic, total (minutes/subscription/month)Domestic mobile traffic (minutes/subscription/month)Individuals using the Internet (%)
Quality Population covered by at least a 3G mobile network (%)International Internet bandwidth (bit/s per Internet user)
AffordabilityMobile-cellular sub-basket ($ a month)Fixed-broadband sub-basket ($ a month)Mobile-b’band, prepaid handset-based, 500 MB ($ a month)Mobile-b’band, postpaid computer-based, 1 GB ($ a month)
TradeICT goods exports (% of total goods exports)ICT goods imports (% of total goods imports)ICT service exports (% of total service exports)
ApplicationsOnline service index (0-1, 1=highest presence)Secure Internet servers (per million people)
132 2017 The Little Data Book on Information and Communication Technology
Europe & Central Asia High income
Lithuania
2010 2015 2015
High-incomegroupCountry data
3 3 1,18767 67 81
12,430 15,000 41,3660.7 3.6 1.5
100 100 ..97 95 95
Yes YesMixed Mixed
.. CC CC CA AA No
2.1 1.3 2.515.8 17.1 18.8
24.6 18.7 41.2159.4 139.5 124.5
22.1 27.8 31.059.2 67.6 83.260.6 68.3 85.0
5.4 7.0 ..115.4 158.6 195.9
62.1 71.4 81.0
46 100 9949,203 158,030 134,761
9.6 3.2 14.210.3 12.8 25.2
.. 2.5 10.422.3 4.4 14.4
2.7 2.9 9.54.1 4.1 11.29.7 12.4 32.0
0.48 0.76 0.67188.6 243.6 1,194.6

Economic and social contextPopulation (millions)Urban population (% of total)GNI per capita, World Bank Atlas method ($)GDP growth, 2005–10 and 2010–15 (avg. annual %)Adult literacy rate (% ages 15 and older) Gross primary, secondary, and tertiary school enrollment (%)
Sector structureSeparate telecommunications/ICT regulatorStatus of main fixed-line telephone operatorLevel of competition (competition, partial comp., monopoly) International gateway(s) Mobile telephone service Internet serviceForeign ownership (not allowed, restricted, allowed)Reg. treatment of VoIP (banned, closed, no framework, allowed)
Sector efficiency and capacityTelecommunications revenue (% of GDP)Telecommunications investment (% of revenue)
Sector performanceAccessFixed-telephone subscriptions (per 100 people)Mobile-cellular telephone subscriptions (per 100 people)Fixed-broadband subscriptions (per 100 people)Households with a computer (%)Households with Internet access at home (%)
Usage Int’l. voice traffic, total (minutes/subscription/month)Domestic mobile traffic (minutes/subscription/month)Individuals using the Internet (%)
Quality Population covered by at least a 3G mobile network (%)International Internet bandwidth (bit/s per Internet user)
AffordabilityMobile-cellular sub-basket ($ a month)Fixed-broadband sub-basket ($ a month)Mobile-b’band, prepaid handset-based, 500 MB ($ a month)Mobile-b’band, postpaid computer-based, 1 GB ($ a month)
TradeICT goods exports (% of total goods exports)ICT goods imports (% of total goods imports)ICT service exports (% of total service exports)
ApplicationsOnline service index (0-1, 1=highest presence)Secure Internet servers (per million people)
133The Little Data Book on Information and Communication Technology 2017
Europe & Central Asia High income
Luxembourg
2010 2015 2015
High-incomegroupCountry data
0.51 0.57 1,18789 90 81
79,520 77,000 41,3661.9 2.9 1.5
.. .. ..78 .. 95
Yes YesPublic Public
C CC CC CA AA A
1.3 1.0 2.518.6 43.2 18.8
53.6 51.0 41.2143.1 148.5 124.5
33.2 36.5 31.090.2 95.3 83.290.3 96.8 85.0
69.1 59.2 ..78.9 82.6 195.990.6 97.3 81.0
90 99 992,521,959 7,186,378 134,761
25.8 22.8 14.238.1 32.7 25.2
.. 39.9 10.4
.. 11.1 14.4
2.9 2.0 9.54.9 4.0 11.2
17.3 21.0 32.0
0.38 0.62 0.671,412.4 2,913.9 1,194.6

Economic and social contextPopulation (millions)Urban population (% of total)GNI per capita, World Bank Atlas method ($)GDP growth, 2005–10 and 2010–15 (avg. annual %)Adult literacy rate (% ages 15 and older) Gross primary, secondary, and tertiary school enrollment (%)
Sector structureSeparate telecommunications/ICT regulatorStatus of main fixed-line telephone operatorLevel of competition (competition, partial comp., monopoly) International gateway(s) Mobile telephone service Internet serviceForeign ownership (not allowed, restricted, allowed)Reg. treatment of VoIP (banned, closed, no framework, allowed)
Sector efficiency and capacityTelecommunications revenue (% of GDP)Telecommunications investment (% of revenue)
Sector performanceAccessFixed-telephone subscriptions (per 100 people)Mobile-cellular telephone subscriptions (per 100 people)Fixed-broadband subscriptions (per 100 people)Households with a computer (%)Households with Internet access at home (%)
Usage Int’l. voice traffic, total (minutes/subscription/month)Domestic mobile traffic (minutes/subscription/month)Individuals using the Internet (%)
Quality Population covered by at least a 3G mobile network (%)International Internet bandwidth (bit/s per Internet user)
AffordabilityMobile-cellular sub-basket ($ a month)Fixed-broadband sub-basket ($ a month)Mobile-b’band, prepaid handset-based, 500 MB ($ a month)Mobile-b’band, postpaid computer-based, 1 GB ($ a month)
TradeICT goods exports (% of total goods exports)ICT goods imports (% of total goods imports)ICT service exports (% of total service exports)
ApplicationsOnline service index (0-1, 1=highest presence)Secure Internet servers (per million people)
134 2017 The Little Data Book on Information and Communication Technology
East Asia & Pacific High income
Macao SAR, China
2010 2015 2015
High-incomegroupCountry data
0.53 0.59 1,187100 100 81
45,890 76,300 41,3669.7 4.2 1.596 96 ..
.. .. 95
.. ..
.. Public
.. ..
.. ..
.. ..
.. ..No A
1.8 1.4 2.510.2 11.5 18.8
31.5 25.0 41.2209.9 324.4 124.5
24.7 29.1 31.083.0 79.0 83.275.5 86.3 85.0
35.0 27.8 .... .. 195.9
55.2 77.6 81.0
100 100 9932,196 111,931 134,761
5.7 5.7 14.217.2 17.3 25.237.6 22.3 10.437.3 43.6 14.4
4.6 12.2 9.512.6 12.4 11.2
0.9 0.5 32.0
.. .. 0.67213.2 466.3 1,194.6

Economic and social contextPopulation (millions)Urban population (% of total)GNI per capita, World Bank Atlas method ($)GDP growth, 2005–10 and 2010–15 (avg. annual %)Adult literacy rate (% ages 15 and older) Gross primary, secondary, and tertiary school enrollment (%)
Sector structureSeparate telecommunications/ICT regulatorStatus of main fixed-line telephone operatorLevel of competition (competition, partial comp., monopoly) International gateway(s) Mobile telephone service Internet serviceForeign ownership (not allowed, restricted, allowed)Reg. treatment of VoIP (banned, closed, no framework, allowed)
Sector efficiency and capacityTelecommunications revenue (% of GDP)Telecommunications investment (% of revenue)
Sector performanceAccessFixed-telephone subscriptions (per 100 people)Mobile-cellular telephone subscriptions (per 100 people)Fixed-broadband subscriptions (per 100 people)Households with a computer (%)Households with Internet access at home (%)
Usage Int’l. voice traffic, total (minutes/subscription/month)Domestic mobile traffic (minutes/subscription/month)Individuals using the Internet (%)
Quality Population covered by at least a 3G mobile network (%)International Internet bandwidth (bit/s per Internet user)
AffordabilityMobile-cellular sub-basket ($ a month)Fixed-broadband sub-basket ($ a month)Mobile-b’band, prepaid handset-based, 500 MB ($ a month)Mobile-b’band, postpaid computer-based, 1 GB ($ a month)
TradeICT goods exports (% of total goods exports)ICT goods imports (% of total goods imports)ICT service exports (% of total service exports)
ApplicationsOnline service index (0-1, 1=highest presence)Secure Internet servers (per million people)
135The Little Data Book on Information and Communication Technology 2017
Europe & Central Asia Upper middle income
Macedonia, FYR
2010 2015 2015
Uppermiddle-incomegroupCountry data
2 2 2,59457 57 64
4,720 5,140 8,1864.0 2.3 4.5
.. 98 ..71 .. 81
Yes YesMixed Mixed
.. ..C CC C.. ..A A
4.7 3.8 2.114.0 22.2 18.8
19.7 17.7 17.3102.4 105.4 105.1
12.3 17.2 15.453.6 68.4 48.746.1 69.4 52.2
9.0 7.8 2.3102.6 186.3 173.1
51.9 70.4 52.1
67 98 6916,498 53,890 26,098
23.4 10.6 8.512.8 10.8 15.5
6.2 5.4 7.76.2 5.4 11.1
0.3 0.4 15.74.8 3.9 14.4
29.8 22.3 25.7
0.32 0.24 0.3724.2 91.4 34.7

Economic and social contextPopulation (millions)Urban population (% of total)GNI per capita, World Bank Atlas method ($)GDP growth, 2005–10 and 2010–15 (avg. annual %)Adult literacy rate (% ages 15 and older) Gross primary, secondary, and tertiary school enrollment (%)
Sector structureSeparate telecommunications/ICT regulatorStatus of main fixed-line telephone operatorLevel of competition (competition, partial comp., monopoly) International gateway(s) Mobile telephone service Internet serviceForeign ownership (not allowed, restricted, allowed)Reg. treatment of VoIP (banned, closed, no framework, allowed)
Sector efficiency and capacityTelecommunications revenue (% of GDP)Telecommunications investment (% of revenue)
Sector performanceAccessFixed-telephone subscriptions (per 100 people)Mobile-cellular telephone subscriptions (per 100 people)Fixed-broadband subscriptions (per 100 people)Households with a computer (%)Households with Internet access at home (%)
Usage Int’l. voice traffic, total (minutes/subscription/month)Domestic mobile traffic (minutes/subscription/month)Individuals using the Internet (%)
Quality Population covered by at least a 3G mobile network (%)International Internet bandwidth (bit/s per Internet user)
AffordabilityMobile-cellular sub-basket ($ a month)Fixed-broadband sub-basket ($ a month)Mobile-b’band, prepaid handset-based, 500 MB ($ a month)Mobile-b’band, postpaid computer-based, 1 GB ($ a month)
TradeICT goods exports (% of total goods exports)ICT goods imports (% of total goods imports)ICT service exports (% of total service exports)
ApplicationsOnline service index (0-1, 1=highest presence)Secure Internet servers (per million people)
136 2017 The Little Data Book on Information and Communication Technology
Sub-Saharan Africa Low income
Madagascar
2010 2015 2015
Low-incomegroupCountry data
21 24 63832 35 31
420 420 6203.0 2.6 5.464 65 ..66 .. 60
Yes YesMixed Mixed
.. ..C CC CR RA C
3.5 3.2 ..29.0 19.4 ..
0.7 1.0 0.936.6 46.0 60.0
0.0 0.1 0.31.4 5.3a 4.81.3a 5.8a 7.1
1.7 1.0 ..3.3 2.4 48.91.7a 4.2a 9.5
.. .. 51728 12,420 4,245
15.4 15.2 9.490.6 50.8 33.611.6 10.2 8.021.0 15.2 10.8
0.2 0.1 ..3.1 2.5 3.4
22.1 15.2 ..
0.17 0.24 0.110.5 1.7 1.5

Economic and social contextPopulation (millions)Urban population (% of total)GNI per capita, World Bank Atlas method ($)GDP growth, 2005–10 and 2010–15 (avg. annual %)Adult literacy rate (% ages 15 and older) Gross primary, secondary, and tertiary school enrollment (%)
Sector structureSeparate telecommunications/ICT regulatorStatus of main fixed-line telephone operatorLevel of competition (competition, partial comp., monopoly) International gateway(s) Mobile telephone service Internet serviceForeign ownership (not allowed, restricted, allowed)Reg. treatment of VoIP (banned, closed, no framework, allowed)
Sector efficiency and capacityTelecommunications revenue (% of GDP)Telecommunications investment (% of revenue)
Sector performanceAccessFixed-telephone subscriptions (per 100 people)Mobile-cellular telephone subscriptions (per 100 people)Fixed-broadband subscriptions (per 100 people)Households with a computer (%)Households with Internet access at home (%)
Usage Int’l. voice traffic, total (minutes/subscription/month)Domestic mobile traffic (minutes/subscription/month)Individuals using the Internet (%)
Quality Population covered by at least a 3G mobile network (%)International Internet bandwidth (bit/s per Internet user)
AffordabilityMobile-cellular sub-basket ($ a month)Fixed-broadband sub-basket ($ a month)Mobile-b’band, prepaid handset-based, 500 MB ($ a month)Mobile-b’band, postpaid computer-based, 1 GB ($ a month)
TradeICT goods exports (% of total goods exports)ICT goods imports (% of total goods imports)ICT service exports (% of total service exports)
ApplicationsOnline service index (0-1, 1=highest presence)Secure Internet servers (per million people)
137The Little Data Book on Information and Communication Technology 2017
Sub-Saharan Africa Low income
Malawi
2010 2015 2015
Low-incomegroupCountry data
15 17 63816 16 31
440 350 6207.7 4.2 5.461 66 ..68 .. 60
Yes YesMixed Mixed
C CP CP CR RC B
3.0 2.9 .... .. ..
1.0 0.3 0.920.8 35.3 60.0
0.0 0.0 0.32.8a 5.8a 4.85.0a 9.1a 7.1
.. 3.9 ..5.2 35.7 48.92.3 9.3a 9.5
2 32 512,034 2,429 4,245
10.8 10.9 9.4492.6 10.3 33.6
9.4 5.2 8.0.. 7.9 10.8
0.4 0.6 ..5.2 3.4 3.4
12.6 30.6 ..
0.02 0.17 0.110.3 1.3 1.5

Economic and social contextPopulation (millions)Urban population (% of total)GNI per capita, World Bank Atlas method ($)GDP growth, 2005–10 and 2010–15 (avg. annual %)Adult literacy rate (% ages 15 and older) Gross primary, secondary, and tertiary school enrollment (%)
Sector structureSeparate telecommunications/ICT regulatorStatus of main fixed-line telephone operatorLevel of competition (competition, partial comp., monopoly) International gateway(s) Mobile telephone service Internet serviceForeign ownership (not allowed, restricted, allowed)Reg. treatment of VoIP (banned, closed, no framework, allowed)
Sector efficiency and capacityTelecommunications revenue (% of GDP)Telecommunications investment (% of revenue)
Sector performanceAccessFixed-telephone subscriptions (per 100 people)Mobile-cellular telephone subscriptions (per 100 people)Fixed-broadband subscriptions (per 100 people)Households with a computer (%)Households with Internet access at home (%)
Usage Int’l. voice traffic, total (minutes/subscription/month)Domestic mobile traffic (minutes/subscription/month)Individuals using the Internet (%)
Quality Population covered by at least a 3G mobile network (%)International Internet bandwidth (bit/s per Internet user)
AffordabilityMobile-cellular sub-basket ($ a month)Fixed-broadband sub-basket ($ a month)Mobile-b’band, prepaid handset-based, 500 MB ($ a month)Mobile-b’band, postpaid computer-based, 1 GB ($ a month)
TradeICT goods exports (% of total goods exports)ICT goods imports (% of total goods imports)ICT service exports (% of total service exports)
ApplicationsOnline service index (0-1, 1=highest presence)Secure Internet servers (per million people)
138 2017 The Little Data Book on Information and Communication Technology
East Asia & Pacific Upper middle income
Malaysia
2010 2015 2015
Uppermiddle-incomegroupCountry data
28 30 2,59471 75 64
8,280 10,570 8,1864.1 5.3 4.593 95 ..71 73 81
Yes YesMixed Mixed
C CC CC CR RA A
4.7 3.8 2.114.4 18.6 18.8
16.3 14.3 17.3119.7 143.9 105.1
7.4 9.0 15.461.8 67.6 48.755.6 70.1 52.2
.. .. 2.3
.. .. 173.156.3 71.1 52.1
81 92 6911,495 34,119 26,098
8.8 5.2 8.520.5 10.3 15.5
.. 8.1 7.715.5 12.2 11.1
34.0 28.7 15.729.8 23.1 14.420.2 23.7 25.7
0.63 0.68 0.3741.9 103.8 34.7

Economic and social contextPopulation (millions)Urban population (% of total)GNI per capita, World Bank Atlas method ($)GDP growth, 2005–10 and 2010–15 (avg. annual %)Adult literacy rate (% ages 15 and older) Gross primary, secondary, and tertiary school enrollment (%)
Sector structureSeparate telecommunications/ICT regulatorStatus of main fixed-line telephone operatorLevel of competition (competition, partial comp., monopoly) International gateway(s) Mobile telephone service Internet serviceForeign ownership (not allowed, restricted, allowed)Reg. treatment of VoIP (banned, closed, no framework, allowed)
Sector efficiency and capacityTelecommunications revenue (% of GDP)Telecommunications investment (% of revenue)
Sector performanceAccessFixed-telephone subscriptions (per 100 people)Mobile-cellular telephone subscriptions (per 100 people)Fixed-broadband subscriptions (per 100 people)Households with a computer (%)Households with Internet access at home (%)
Usage Int’l. voice traffic, total (minutes/subscription/month)Domestic mobile traffic (minutes/subscription/month)Individuals using the Internet (%)
Quality Population covered by at least a 3G mobile network (%)International Internet bandwidth (bit/s per Internet user)
AffordabilityMobile-cellular sub-basket ($ a month)Fixed-broadband sub-basket ($ a month)Mobile-b’band, prepaid handset-based, 500 MB ($ a month)Mobile-b’band, postpaid computer-based, 1 GB ($ a month)
TradeICT goods exports (% of total goods exports)ICT goods imports (% of total goods imports)ICT service exports (% of total service exports)
ApplicationsOnline service index (0-1, 1=highest presence)Secure Internet servers (per million people)
139The Little Data Book on Information and Communication Technology 2017
South Asia Upper middle income
Maldives
2010 2015 2015
Uppermiddle-incomegroupCountry data
0.37 0.41 2,59440 46 64
5,360 6,670 8,1867.9 4.7 4.598 99 ..
.. .. 81
Yes YesMixed Mixed
.. ..P P.. ..A AB A
.. .. 2.1
.. .. 18.8
8.7 6.1 17.3151.8 206.7 105.1
4.8 6.5 15.455.5 68.5a 48.723.5 49.6a 52.2
32.7 33.9 2.3209.3 209.5 173.1
26.5 54.5a 52.1
57 100a 6933,447 88,008 26,098
6.8 6.1 8.59.3 20.7 15.5
10.4 6.4 7.710.4 19.5 11.1
.. .. 15.76.5 4.4 14.4
.. .. 25.7
0.16 0.36 0.3746.3 102.6 34.7

Economic and social contextPopulation (millions)Urban population (% of total)GNI per capita, World Bank Atlas method ($)GDP growth, 2005–10 and 2010–15 (avg. annual %)Adult literacy rate (% ages 15 and older) Gross primary, secondary, and tertiary school enrollment (%)
Sector structureSeparate telecommunications/ICT regulatorStatus of main fixed-line telephone operatorLevel of competition (competition, partial comp., monopoly) International gateway(s) Mobile telephone service Internet serviceForeign ownership (not allowed, restricted, allowed)Reg. treatment of VoIP (banned, closed, no framework, allowed)
Sector efficiency and capacityTelecommunications revenue (% of GDP)Telecommunications investment (% of revenue)
Sector performanceAccessFixed-telephone subscriptions (per 100 people)Mobile-cellular telephone subscriptions (per 100 people)Fixed-broadband subscriptions (per 100 people)Households with a computer (%)Households with Internet access at home (%)
Usage Int’l. voice traffic, total (minutes/subscription/month)Domestic mobile traffic (minutes/subscription/month)Individuals using the Internet (%)
Quality Population covered by at least a 3G mobile network (%)International Internet bandwidth (bit/s per Internet user)
AffordabilityMobile-cellular sub-basket ($ a month)Fixed-broadband sub-basket ($ a month)Mobile-b’band, prepaid handset-based, 500 MB ($ a month)Mobile-b’band, postpaid computer-based, 1 GB ($ a month)
TradeICT goods exports (% of total goods exports)ICT goods imports (% of total goods imports)ICT service exports (% of total service exports)
ApplicationsOnline service index (0-1, 1=highest presence)Secure Internet servers (per million people)
140 2017 The Little Data Book on Information and Communication Technology
Sub-Saharan Africa Low income
Mali
2010 2015 2015
Low-incomegroupCountry data
15 18 63836 40 31
730 790 62010.4 8.3 5.4
31 33 ..50 .. 60
Yes YesMixed Mixed
P PP PC CA AB B
5.3 6.2 ..34.3 15.8 ..
0.8 1.0 0.953.2 139.6 60.0
0.1 0.0 0.31.8a 3.3 4.81.2a 8.2 7.1
3.9 3.9 ..2.6 15.6 48.92.0a 10.3a 9.5
.. .. 512,771 1,279 4,245
16.9 12.4 9.450.1 33.6 33.6
9.2 7.9 8.014.7 12.7 10.8
0.1 .. ..2.6 .. 3.4
33.9 42.5 ..
0.18 0.13 0.110.7 1.3 1.5

Economic and social contextPopulation (millions)Urban population (% of total)GNI per capita, World Bank Atlas method ($)GDP growth, 2005–10 and 2010–15 (avg. annual %)Adult literacy rate (% ages 15 and older) Gross primary, secondary, and tertiary school enrollment (%)
Sector structureSeparate telecommunications/ICT regulatorStatus of main fixed-line telephone operatorLevel of competition (competition, partial comp., monopoly) International gateway(s) Mobile telephone service Internet serviceForeign ownership (not allowed, restricted, allowed)Reg. treatment of VoIP (banned, closed, no framework, allowed)
Sector efficiency and capacityTelecommunications revenue (% of GDP)Telecommunications investment (% of revenue)
Sector performanceAccessFixed-telephone subscriptions (per 100 people)Mobile-cellular telephone subscriptions (per 100 people)Fixed-broadband subscriptions (per 100 people)Households with a computer (%)Households with Internet access at home (%)
Usage Int’l. voice traffic, total (minutes/subscription/month)Domestic mobile traffic (minutes/subscription/month)Individuals using the Internet (%)
Quality Population covered by at least a 3G mobile network (%)International Internet bandwidth (bit/s per Internet user)
AffordabilityMobile-cellular sub-basket ($ a month)Fixed-broadband sub-basket ($ a month)Mobile-b’band, prepaid handset-based, 500 MB ($ a month)Mobile-b’band, postpaid computer-based, 1 GB ($ a month)
TradeICT goods exports (% of total goods exports)ICT goods imports (% of total goods imports)ICT service exports (% of total service exports)
ApplicationsOnline service index (0-1, 1=highest presence)Secure Internet servers (per million people)
141The Little Data Book on Information and Communication Technology 2017
Middle East & North Africa High income
Malta
2010 2015 2015
High-incomegroupCountry data
0.41 0.43 1,18795 95 81
20,090 21,000 41,3662.2 1.7 1.593 94 ..83 79 95
Yes YesMixed Private
C CC CC CA AA A
3.2 2.8 2.515.8 .. 18.8
58.3 53.4 41.2107.3 129.3 124.5
29.6 37.8 31.073.1 81.1 83.270.4 81.9 85.0
11.7 9.3 ..68.4 106.6 195.963.0 76.2 81.0
.. 100 99464,099 1,220,570 134,761
20.6 19.7 14.218.2 26.1 25.225.7 13.3 10.419.3 11.1 14.4
30.9 15.2 9.515.4 6.9 11.219.1 25.8 32.0
0.47 0.40 0.671,375.1 1,866.3 1,194.6

Economic and social contextPopulation (millions)Urban population (% of total)GNI per capita, World Bank Atlas method ($)GDP growth, 2005–10 and 2010–15 (avg. annual %)Adult literacy rate (% ages 15 and older) Gross primary, secondary, and tertiary school enrollment (%)
Sector structureSeparate telecommunications/ICT regulatorStatus of main fixed-line telephone operatorLevel of competition (competition, partial comp., monopoly) International gateway(s) Mobile telephone service Internet serviceForeign ownership (not allowed, restricted, allowed)Reg. treatment of VoIP (banned, closed, no framework, allowed)
Sector efficiency and capacityTelecommunications revenue (% of GDP)Telecommunications investment (% of revenue)
Sector performanceAccessFixed-telephone subscriptions (per 100 people)Mobile-cellular telephone subscriptions (per 100 people)Fixed-broadband subscriptions (per 100 people)Households with a computer (%)Households with Internet access at home (%)
Usage Int’l. voice traffic, total (minutes/subscription/month)Domestic mobile traffic (minutes/subscription/month)Individuals using the Internet (%)
Quality Population covered by at least a 3G mobile network (%)International Internet bandwidth (bit/s per Internet user)
AffordabilityMobile-cellular sub-basket ($ a month)Fixed-broadband sub-basket ($ a month)Mobile-b’band, prepaid handset-based, 500 MB ($ a month)Mobile-b’band, postpaid computer-based, 1 GB ($ a month)
TradeICT goods exports (% of total goods exports)ICT goods imports (% of total goods imports)ICT service exports (% of total service exports)
ApplicationsOnline service index (0-1, 1=highest presence)Secure Internet servers (per million people)
142 2017 The Little Data Book on Information and Communication Technology
East Asia & Pacific Upper middle income
Marshall Islands
2010 2015 2015
Uppermiddle-incomegroupCountry data
0.05 0.05 2,59471 73 64
3,720 4,390 8,1860.7 1.4 4.598 98 ..
.. .. 81
No NoMixed Mixed
M MM MM MA AB A
.. .. 2.1
.. .. 18.8
.. 4.5 17.3
.. 29.2 105.1
.. 1.9 15.4
.. .. 48.7
.. .. 52.2
.. .. 2.3
.. .. 173.17.0a 19.3a 52.1
.. .. 6912,262 75,844 26,098
22.2 22.2 8.550.0 50.0 15.5
.. .. 7.7
.. .. 11.1
.. .. 15.7
.. .. 14.4
.. .. 25.7
0.03 0.11 0.37114.4 113.2 34.7

Economic and social contextPopulation (millions)Urban population (% of total)GNI per capita, World Bank Atlas method ($)GDP growth, 2005–10 and 2010–15 (avg. annual %)Adult literacy rate (% ages 15 and older) Gross primary, secondary, and tertiary school enrollment (%)
Sector structureSeparate telecommunications/ICT regulatorStatus of main fixed-line telephone operatorLevel of competition (competition, partial comp., monopoly) International gateway(s) Mobile telephone service Internet serviceForeign ownership (not allowed, restricted, allowed)Reg. treatment of VoIP (banned, closed, no framework, allowed)
Sector efficiency and capacityTelecommunications revenue (% of GDP)Telecommunications investment (% of revenue)
Sector performanceAccessFixed-telephone subscriptions (per 100 people)Mobile-cellular telephone subscriptions (per 100 people)Fixed-broadband subscriptions (per 100 people)Households with a computer (%)Households with Internet access at home (%)
Usage Int’l. voice traffic, total (minutes/subscription/month)Domestic mobile traffic (minutes/subscription/month)Individuals using the Internet (%)
Quality Population covered by at least a 3G mobile network (%)International Internet bandwidth (bit/s per Internet user)
AffordabilityMobile-cellular sub-basket ($ a month)Fixed-broadband sub-basket ($ a month)Mobile-b’band, prepaid handset-based, 500 MB ($ a month)Mobile-b’band, postpaid computer-based, 1 GB ($ a month)
TradeICT goods exports (% of total goods exports)ICT goods imports (% of total goods imports)ICT service exports (% of total service exports)
ApplicationsOnline service index (0-1, 1=highest presence)Secure Internet servers (per million people)
143The Little Data Book on Information and Communication Technology 2017
Sub-Saharan Africa Lower middle income
Mauritania
2010 2015 2015
Lowermiddle-incomegroupCountry data
4 4 2,92757 60 39
1,140 1,370 2,0353.9 5.3 5.446 52 ..46 50 68
Yes YesMixed Mixed
C CC CC CA A
No C
5.1 .. ..19.4 .. ..
2.0 1.3 3.576.9 89.3 90.5
0.2 0.2 1.93.0a 4.7a 19.31.6a 15.6a 24.3
5.2 .. 7.558.7 .. 152.0
4.0a 15.2a 28.6
.. .. ..1,939 1,451 10,372
16.4 15.0 6.923.5 10.8 14.3
.. 31.5 5.850.6 31.5 10.0
.. .. 5.70.9 0.8 7.6
46.8 56.9 48.0
0.09 0.05 0.261.9 2.7 7.4
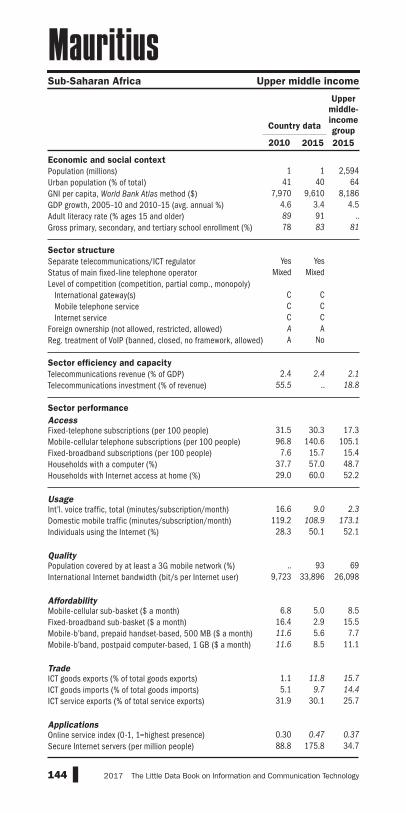
Economic and social contextPopulation (millions)Urban population (% of total)GNI per capita, World Bank Atlas method ($)GDP growth, 2005–10 and 2010–15 (avg. annual %)Adult literacy rate (% ages 15 and older) Gross primary, secondary, and tertiary school enrollment (%)
Sector structureSeparate telecommunications/ICT regulatorStatus of main fixed-line telephone operatorLevel of competition (competition, partial comp., monopoly) International gateway(s) Mobile telephone service Internet serviceForeign ownership (not allowed, restricted, allowed)Reg. treatment of VoIP (banned, closed, no framework, allowed)
Sector efficiency and capacityTelecommunications revenue (% of GDP)Telecommunications investment (% of revenue)
Sector performanceAccessFixed-telephone subscriptions (per 100 people)Mobile-cellular telephone subscriptions (per 100 people)Fixed-broadband subscriptions (per 100 people)Households with a computer (%)Households with Internet access at home (%)
Usage Int’l. voice traffic, total (minutes/subscription/month)Domestic mobile traffic (minutes/subscription/month)Individuals using the Internet (%)
Quality Population covered by at least a 3G mobile network (%)International Internet bandwidth (bit/s per Internet user)
AffordabilityMobile-cellular sub-basket ($ a month)Fixed-broadband sub-basket ($ a month)Mobile-b’band, prepaid handset-based, 500 MB ($ a month)Mobile-b’band, postpaid computer-based, 1 GB ($ a month)
TradeICT goods exports (% of total goods exports)ICT goods imports (% of total goods imports)ICT service exports (% of total service exports)
ApplicationsOnline service index (0-1, 1=highest presence)Secure Internet servers (per million people)
144 2017 The Little Data Book on Information and Communication Technology
Sub-Saharan Africa Upper middle income
Mauritius
2010 2015 2015
Uppermiddle-incomegroupCountry data
1 1 2,59441 40 64
7,970 9,610 8,1864.6 3.4 4.589 91 ..78 83 81
Yes YesMixed Mixed
C CC CC CA AA No
2.4 2.4 2.155.5 .. 18.8
31.5 30.3 17.396.8 140.6 105.1
7.6 15.7 15.437.7 57.0 48.729.0 60.0 52.2
16.6 9.0 2.3119.2 108.9 173.1
28.3 50.1 52.1
.. 93 699,723 33,896 26,098
6.8 5.0 8.516.4 2.9 15.511.6 5.6 7.711.6 8.5 11.1
1.1 11.8 15.75.1 9.7 14.4
31.9 30.1 25.7
0.30 0.47 0.3788.8 175.8 34.7

Economic and social contextPopulation (millions)Urban population (% of total)GNI per capita, World Bank Atlas method ($)GDP growth, 2005–10 and 2010–15 (avg. annual %)Adult literacy rate (% ages 15 and older) Gross primary, secondary, and tertiary school enrollment (%)
Sector structureSeparate telecommunications/ICT regulatorStatus of main fixed-line telephone operatorLevel of competition (competition, partial comp., monopoly) International gateway(s) Mobile telephone service Internet serviceForeign ownership (not allowed, restricted, allowed)Reg. treatment of VoIP (banned, closed, no framework, allowed)
Sector efficiency and capacityTelecommunications revenue (% of GDP)Telecommunications investment (% of revenue)
Sector performanceAccessFixed-telephone subscriptions (per 100 people)Mobile-cellular telephone subscriptions (per 100 people)Fixed-broadband subscriptions (per 100 people)Households with a computer (%)Households with Internet access at home (%)
Usage Int’l. voice traffic, total (minutes/subscription/month)Domestic mobile traffic (minutes/subscription/month)Individuals using the Internet (%)
Quality Population covered by at least a 3G mobile network (%)International Internet bandwidth (bit/s per Internet user)
AffordabilityMobile-cellular sub-basket ($ a month)Fixed-broadband sub-basket ($ a month)Mobile-b’band, prepaid handset-based, 500 MB ($ a month)Mobile-b’band, postpaid computer-based, 1 GB ($ a month)
TradeICT goods exports (% of total goods exports)ICT goods imports (% of total goods imports)ICT service exports (% of total service exports)
ApplicationsOnline service index (0-1, 1=highest presence)Secure Internet servers (per million people)
145The Little Data Book on Information and Communication Technology 2017
Latin America & Caribbean Upper middle income
Mexico
2010 2015 2015
Uppermiddle-incomegroupCountry data
119 127 2,59478 79 64
8,840 9,710 8,1861.4 2.7 4.593 95 ..75 78 81
Yes YesPrivate Private
.. CC CC CR A
No No
2.9 2.5 2.119.7 15.0 18.8
16.9 15.9 17.377.5 85.3 105.1
9.0 11.6 15.429.8 44.9 48.722.2 39.2 52.2
.. .. 2.391.6 114.8 173.131.1 57.4 52.1
.. 89a 697,039 20,855 26,098
17.4 8.1 8.517.3 22.0 15.517.9 14.9 7.718.9 15.7 11.1
20.2 16.0 15.719.2 16.3 14.4
.. .. 25.7
0.44 0.66 0.3719.7 39.2 34.7

Economic and social contextPopulation (millions)Urban population (% of total)GNI per capita, World Bank Atlas method ($)GDP growth, 2005–10 and 2010–15 (avg. annual %)Adult literacy rate (% ages 15 and older) Gross primary, secondary, and tertiary school enrollment (%)
Sector structureSeparate telecommunications/ICT regulatorStatus of main fixed-line telephone operatorLevel of competition (competition, partial comp., monopoly) International gateway(s) Mobile telephone service Internet serviceForeign ownership (not allowed, restricted, allowed)Reg. treatment of VoIP (banned, closed, no framework, allowed)
Sector efficiency and capacityTelecommunications revenue (% of GDP)Telecommunications investment (% of revenue)
Sector performanceAccessFixed-telephone subscriptions (per 100 people)Mobile-cellular telephone subscriptions (per 100 people)Fixed-broadband subscriptions (per 100 people)Households with a computer (%)Households with Internet access at home (%)
Usage Int’l. voice traffic, total (minutes/subscription/month)Domestic mobile traffic (minutes/subscription/month)Individuals using the Internet (%)
Quality Population covered by at least a 3G mobile network (%)International Internet bandwidth (bit/s per Internet user)
AffordabilityMobile-cellular sub-basket ($ a month)Fixed-broadband sub-basket ($ a month)Mobile-b’band, prepaid handset-based, 500 MB ($ a month)Mobile-b’band, postpaid computer-based, 1 GB ($ a month)
TradeICT goods exports (% of total goods exports)ICT goods imports (% of total goods imports)ICT service exports (% of total service exports)
ApplicationsOnline service index (0-1, 1=highest presence)Secure Internet servers (per million people)
146 2017 The Little Data Book on Information and Communication Technology
East Asia & Pacific Lower middle income
Micronesia, Fed. Sts.
2010 2015 2015
Lowermiddle-incomegroupCountry data
0.10 0.10 2,92722 22 39
2,870 3,200 2,035–0.6 –1.2 5.4
.. .. ..
.. .. 68
No NoPublic Public
M MM MM MR ..
No A
.. .. ..
.. .. ..
8.2 6.5 3.526.6 30.3 90.5
1.0 3.1 1.9.. .. 19.3.. .. 24.3
.. .. 7.5
.. .. 152.020.0a 31.5a 28.6
.. 15 ..1,930 9,117 10,372
9.1 25.8 6.940.0 33.0 14.3
.. 31.5 5.8
.. .. 10.0
.. .. 5.71.3 1.9 7.6
11.8 9.6 48.0
0.13 0.19 0.2638.6 19.3 7.4
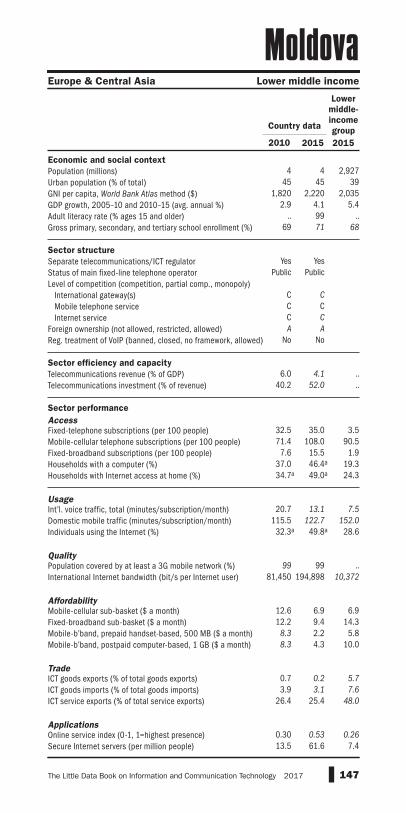
Economic and social contextPopulation (millions)Urban population (% of total)GNI per capita, World Bank Atlas method ($)GDP growth, 2005–10 and 2010–15 (avg. annual %)Adult literacy rate (% ages 15 and older) Gross primary, secondary, and tertiary school enrollment (%)
Sector structureSeparate telecommunications/ICT regulatorStatus of main fixed-line telephone operatorLevel of competition (competition, partial comp., monopoly) International gateway(s) Mobile telephone service Internet serviceForeign ownership (not allowed, restricted, allowed)Reg. treatment of VoIP (banned, closed, no framework, allowed)
Sector efficiency and capacityTelecommunications revenue (% of GDP)Telecommunications investment (% of revenue)
Sector performanceAccessFixed-telephone subscriptions (per 100 people)Mobile-cellular telephone subscriptions (per 100 people)Fixed-broadband subscriptions (per 100 people)Households with a computer (%)Households with Internet access at home (%)
Usage Int’l. voice traffic, total (minutes/subscription/month)Domestic mobile traffic (minutes/subscription/month)Individuals using the Internet (%)
Quality Population covered by at least a 3G mobile network (%)International Internet bandwidth (bit/s per Internet user)
AffordabilityMobile-cellular sub-basket ($ a month)Fixed-broadband sub-basket ($ a month)Mobile-b’band, prepaid handset-based, 500 MB ($ a month)Mobile-b’band, postpaid computer-based, 1 GB ($ a month)
TradeICT goods exports (% of total goods exports)ICT goods imports (% of total goods imports)ICT service exports (% of total service exports)
ApplicationsOnline service index (0-1, 1=highest presence)Secure Internet servers (per million people)
147The Little Data Book on Information and Communication Technology 2017
Europe & Central Asia Lower middle income
Moldova
2010 2015 2015
Lowermiddle-incomegroupCountry data
4 4 2,92745 45 39
1,820 2,220 2,0352.9 4.1 5.4
.. 99 ..69 71 68
Yes YesPublic Public
C CC CC CA A
No No
6.0 4.1 ..40.2 52.0 ..
32.5 35.0 3.571.4 108.0 90.5
7.6 15.5 1.937.0 46.4a 19.334.7a 49.0a 24.3
20.7 13.1 7.5115.5 122.7 152.0
32.3a 49.8a 28.6
99 99 ..81,450 194,898 10,372
12.6 6.9 6.912.2 9.4 14.3
8.3 2.2 5.88.3 4.3 10.0
0.7 0.2 5.73.9 3.1 7.6
26.4 25.4 48.0
0.30 0.53 0.2613.5 61.6 7.4
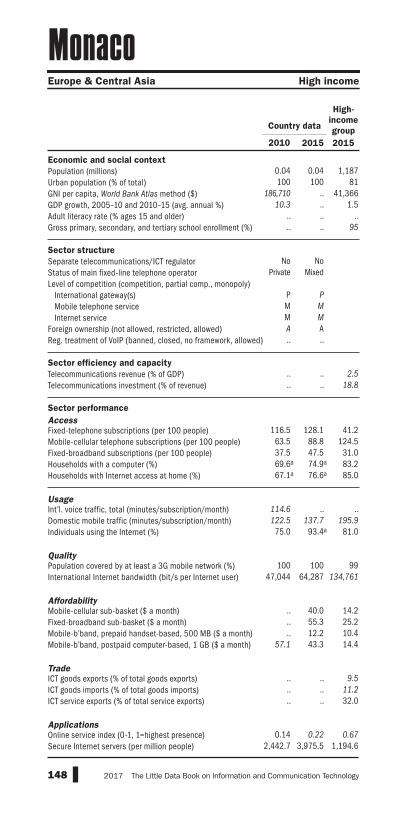
Economic and social contextPopulation (millions)Urban population (% of total)GNI per capita, World Bank Atlas method ($)GDP growth, 2005–10 and 2010–15 (avg. annual %)Adult literacy rate (% ages 15 and older) Gross primary, secondary, and tertiary school enrollment (%)
Sector structureSeparate telecommunications/ICT regulatorStatus of main fixed-line telephone operatorLevel of competition (competition, partial comp., monopoly) International gateway(s) Mobile telephone service Internet serviceForeign ownership (not allowed, restricted, allowed)Reg. treatment of VoIP (banned, closed, no framework, allowed)
Sector efficiency and capacityTelecommunications revenue (% of GDP)Telecommunications investment (% of revenue)
Sector performanceAccessFixed-telephone subscriptions (per 100 people)Mobile-cellular telephone subscriptions (per 100 people)Fixed-broadband subscriptions (per 100 people)Households with a computer (%)Households with Internet access at home (%)
Usage Int’l. voice traffic, total (minutes/subscription/month)Domestic mobile traffic (minutes/subscription/month)Individuals using the Internet (%)
Quality Population covered by at least a 3G mobile network (%)International Internet bandwidth (bit/s per Internet user)
AffordabilityMobile-cellular sub-basket ($ a month)Fixed-broadband sub-basket ($ a month)Mobile-b’band, prepaid handset-based, 500 MB ($ a month)Mobile-b’band, postpaid computer-based, 1 GB ($ a month)
TradeICT goods exports (% of total goods exports)ICT goods imports (% of total goods imports)ICT service exports (% of total service exports)
ApplicationsOnline service index (0-1, 1=highest presence)Secure Internet servers (per million people)
148 2017 The Little Data Book on Information and Communication Technology
Europe & Central Asia High income
Monaco
2010 2015 2015
High-incomegroupCountry data
0.04 0.04 1,187100 100 81
186,710 .. 41,36610.3 .. 1.5
.. .. ..
.. .. 95
No NoPrivate Mixed
P PM MM MA A.. ..
.. .. 2.5
.. .. 18.8
116.5 128.1 41.263.5 88.8 124.537.5 47.5 31.069.6a 74.9a 83.267.1a 76.6a 85.0
114.6 .. ..122.5 137.7 195.9
75.0 93.4a 81.0
100 100 9947,044 64,287 134,761
.. 40.0 14.2
.. 55.3 25.2
.. 12.2 10.457.1 43.3 14.4
.. .. 9.5
.. .. 11.2
.. .. 32.0
0.14 0.22 0.672,442.7 3,975.5 1,194.6

Economic and social contextPopulation (millions)Urban population (% of total)GNI per capita, World Bank Atlas method ($)GDP growth, 2005–10 and 2010–15 (avg. annual %)Adult literacy rate (% ages 15 and older) Gross primary, secondary, and tertiary school enrollment (%)
Sector structureSeparate telecommunications/ICT regulatorStatus of main fixed-line telephone operatorLevel of competition (competition, partial comp., monopoly) International gateway(s) Mobile telephone service Internet serviceForeign ownership (not allowed, restricted, allowed)Reg. treatment of VoIP (banned, closed, no framework, allowed)
Sector efficiency and capacityTelecommunications revenue (% of GDP)Telecommunications investment (% of revenue)
Sector performanceAccessFixed-telephone subscriptions (per 100 people)Mobile-cellular telephone subscriptions (per 100 people)Fixed-broadband subscriptions (per 100 people)Households with a computer (%)Households with Internet access at home (%)
Usage Int’l. voice traffic, total (minutes/subscription/month)Domestic mobile traffic (minutes/subscription/month)Individuals using the Internet (%)
Quality Population covered by at least a 3G mobile network (%)International Internet bandwidth (bit/s per Internet user)
AffordabilityMobile-cellular sub-basket ($ a month)Fixed-broadband sub-basket ($ a month)Mobile-b’band, prepaid handset-based, 500 MB ($ a month)Mobile-b’band, postpaid computer-based, 1 GB ($ a month)
TradeICT goods exports (% of total goods exports)ICT goods imports (% of total goods imports)ICT service exports (% of total service exports)
ApplicationsOnline service index (0-1, 1=highest presence)Secure Internet servers (per million people)
149The Little Data Book on Information and Communication Technology 2017
East Asia & Pacific Lower middle income
Mongolia
2010 2015 2015
Lowermiddle-incomegroupCountry data
3 3 2,92768 72 39
2,000 3,830 2,0356.4 10.3 5.498 98 ..89 86 68
Yes YesMixed Mixed
P ..P ..C ..R RA A
4.8 .. ..19.1 .. ..
7.1 8.7 3.592.5 105.0 90.5
2.8 7.1 1.922.3 42.6 19.3
7.7 24.5 24.3
4.5 .. 7.5121.6 .. 152.0
10.2 21.4 28.6
50 95 ..62,121 159,595 10,372
3.6 2.9 6.98.5 6.6 14.3
10.3 5.6 5.88.8 5.1 10.0
.. 0.1 5.7
.. 3.9 7.610.2 22.5 48.0
0.56 0.61 0.2610.7 30.1 7.4

Economic and social contextPopulation (millions)Urban population (% of total)GNI per capita, World Bank Atlas method ($)GDP growth, 2005–10 and 2010–15 (avg. annual %)Adult literacy rate (% ages 15 and older) Gross primary, secondary, and tertiary school enrollment (%)
Sector structureSeparate telecommunications/ICT regulatorStatus of main fixed-line telephone operatorLevel of competition (competition, partial comp., monopoly) International gateway(s) Mobile telephone service Internet serviceForeign ownership (not allowed, restricted, allowed)Reg. treatment of VoIP (banned, closed, no framework, allowed)
Sector efficiency and capacityTelecommunications revenue (% of GDP)Telecommunications investment (% of revenue)
Sector performanceAccessFixed-telephone subscriptions (per 100 people)Mobile-cellular telephone subscriptions (per 100 people)Fixed-broadband subscriptions (per 100 people)Households with a computer (%)Households with Internet access at home (%)
Usage Int’l. voice traffic, total (minutes/subscription/month)Domestic mobile traffic (minutes/subscription/month)Individuals using the Internet (%)
Quality Population covered by at least a 3G mobile network (%)International Internet bandwidth (bit/s per Internet user)
AffordabilityMobile-cellular sub-basket ($ a month)Fixed-broadband sub-basket ($ a month)Mobile-b’band, prepaid handset-based, 500 MB ($ a month)Mobile-b’band, postpaid computer-based, 1 GB ($ a month)
TradeICT goods exports (% of total goods exports)ICT goods imports (% of total goods imports)ICT service exports (% of total service exports)
ApplicationsOnline service index (0-1, 1=highest presence)Secure Internet servers (per million people)
150 2017 The Little Data Book on Information and Communication Technology
Europe & Central Asia Upper middle income
Montenegro
2010 2015 2015
Uppermiddle-incomegroupCountry data
0.62 0.62 2,59463 64 64
6,890 7,240 8,1864.3 1.6 4.598 99 ..89 .. 81
Yes YesMixed Private
C ..C CC CA AA A
.. 5.5 2.1
.. .. 18.8
27.5a 24.8 17.3188.7 162.2 105.1
10.4 18.1 15.438.0a 56.4a 48.735.9a 61.1a 52.2
.. .. 2.3
.. 141.9 173.137.5a 64.6a 52.1
72 97 6930,104 102,166 26,098
16.5 9.7 8.518.4 15.3 15.5
.. 13.2 7.7
.. 7.2 11.1
0.3 0.6 15.73.6 4.1 14.48.0 9.1 25.7
0.31 0.53 0.3725.8 72.3 34.7

Economic and social contextPopulation (millions)Urban population (% of total)GNI per capita, World Bank Atlas method ($)GDP growth, 2005–10 and 2010–15 (avg. annual %)Adult literacy rate (% ages 15 and older) Gross primary, secondary, and tertiary school enrollment (%)
Sector structureSeparate telecommunications/ICT regulatorStatus of main fixed-line telephone operatorLevel of competition (competition, partial comp., monopoly) International gateway(s) Mobile telephone service Internet serviceForeign ownership (not allowed, restricted, allowed)Reg. treatment of VoIP (banned, closed, no framework, allowed)
Sector efficiency and capacityTelecommunications revenue (% of GDP)Telecommunications investment (% of revenue)
Sector performanceAccessFixed-telephone subscriptions (per 100 people)Mobile-cellular telephone subscriptions (per 100 people)Fixed-broadband subscriptions (per 100 people)Households with a computer (%)Households with Internet access at home (%)
Usage Int’l. voice traffic, total (minutes/subscription/month)Domestic mobile traffic (minutes/subscription/month)Individuals using the Internet (%)
Quality Population covered by at least a 3G mobile network (%)International Internet bandwidth (bit/s per Internet user)
AffordabilityMobile-cellular sub-basket ($ a month)Fixed-broadband sub-basket ($ a month)Mobile-b’band, prepaid handset-based, 500 MB ($ a month)Mobile-b’band, postpaid computer-based, 1 GB ($ a month)
TradeICT goods exports (% of total goods exports)ICT goods imports (% of total goods imports)ICT service exports (% of total service exports)
ApplicationsOnline service index (0-1, 1=highest presence)Secure Internet servers (per million people)
151The Little Data Book on Information and Communication Technology 2017
Middle East & North Africa Lower middle income
Morocco
2010 2015 2015
Lowermiddle-incomegroupCountry data
32 34 2,92758 60 39
2,950 3,040 2,0354.9 3.8 5.467 72 ..65 72 68
Yes YesMixed Mixed
C CC CC CA AC B
4.6 3.5 ..17.0 19.9 ..
11.8 6.5 3.5101.1 126.9 90.5
1.6 3.4 1.934.2 54.8 19.325.5 66.5 24.3
9.7 9.4 7.535.9 89.6 152.052.0 57.1 28.6
69 80 ..4,558 18,316 10,372
33.1 10.2 6.911.7 10.1 14.346.4 5.1 5.811.5 10.1 10.0
3.8 2.7 5.75.9 3.8 7.6
20.1 19.2 48.0
0.24 0.69 0.263.0 6.2 7.4
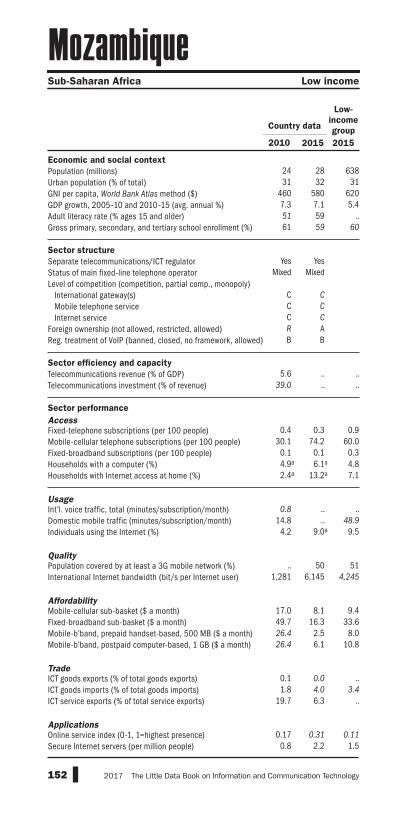
Economic and social contextPopulation (millions)Urban population (% of total)GNI per capita, World Bank Atlas method ($)GDP growth, 2005–10 and 2010–15 (avg. annual %)Adult literacy rate (% ages 15 and older) Gross primary, secondary, and tertiary school enrollment (%)
Sector structureSeparate telecommunications/ICT regulatorStatus of main fixed-line telephone operatorLevel of competition (competition, partial comp., monopoly) International gateway(s) Mobile telephone service Internet serviceForeign ownership (not allowed, restricted, allowed)Reg. treatment of VoIP (banned, closed, no framework, allowed)
Sector efficiency and capacityTelecommunications revenue (% of GDP)Telecommunications investment (% of revenue)
Sector performanceAccessFixed-telephone subscriptions (per 100 people)Mobile-cellular telephone subscriptions (per 100 people)Fixed-broadband subscriptions (per 100 people)Households with a computer (%)Households with Internet access at home (%)
Usage Int’l. voice traffic, total (minutes/subscription/month)Domestic mobile traffic (minutes/subscription/month)Individuals using the Internet (%)
Quality Population covered by at least a 3G mobile network (%)International Internet bandwidth (bit/s per Internet user)
AffordabilityMobile-cellular sub-basket ($ a month)Fixed-broadband sub-basket ($ a month)Mobile-b’band, prepaid handset-based, 500 MB ($ a month)Mobile-b’band, postpaid computer-based, 1 GB ($ a month)
TradeICT goods exports (% of total goods exports)ICT goods imports (% of total goods imports)ICT service exports (% of total service exports)
ApplicationsOnline service index (0-1, 1=highest presence)Secure Internet servers (per million people)
152 2017 The Little Data Book on Information and Communication Technology
Sub-Saharan Africa Low income
Mozambique
2010 2015 2015
Low-incomegroupCountry data
24 28 63831 32 31
460 580 6207.3 7.1 5.451 59 ..61 59 60
Yes YesMixed Mixed
C CC CC CR AB B
5.6 .. ..39.0 .. ..
0.4 0.3 0.930.1 74.2 60.0
0.1 0.1 0.34.9a 6.1a 4.82.4a 13.2a 7.1
0.8 .. ..14.8 .. 48.9
4.2 9.0a 9.5
.. 50 511,281 6,145 4,245
17.0 8.1 9.449.7 16.3 33.626.4 2.5 8.026.4 6.1 10.8
0.1 0.0 ..1.8 4.0 3.4
19.7 6.3 ..
0.17 0.31 0.110.8 2.2 1.5

Economic and social contextPopulation (millions)Urban population (% of total)GNI per capita, World Bank Atlas method ($)GDP growth, 2005–10 and 2010–15 (avg. annual %)Adult literacy rate (% ages 15 and older) Gross primary, secondary, and tertiary school enrollment (%)
Sector structureSeparate telecommunications/ICT regulatorStatus of main fixed-line telephone operatorLevel of competition (competition, partial comp., monopoly) International gateway(s) Mobile telephone service Internet serviceForeign ownership (not allowed, restricted, allowed)Reg. treatment of VoIP (banned, closed, no framework, allowed)
Sector efficiency and capacityTelecommunications revenue (% of GDP)Telecommunications investment (% of revenue)
Sector performanceAccessFixed-telephone subscriptions (per 100 people)Mobile-cellular telephone subscriptions (per 100 people)Fixed-broadband subscriptions (per 100 people)Households with a computer (%)Households with Internet access at home (%)
Usage Int’l. voice traffic, total (minutes/subscription/month)Domestic mobile traffic (minutes/subscription/month)Individuals using the Internet (%)
Quality Population covered by at least a 3G mobile network (%)International Internet bandwidth (bit/s per Internet user)
AffordabilityMobile-cellular sub-basket ($ a month)Fixed-broadband sub-basket ($ a month)Mobile-b’band, prepaid handset-based, 500 MB ($ a month)Mobile-b’band, postpaid computer-based, 1 GB ($ a month)
TradeICT goods exports (% of total goods exports)ICT goods imports (% of total goods imports)ICT service exports (% of total service exports)
ApplicationsOnline service index (0-1, 1=highest presence)Secure Internet servers (per million people)
153The Little Data Book on Information and Communication Technology 2017
East Asia & Pacific Lower middle income
Myanmar
2010 2015 2015
Lowermiddle-incomegroupCountry data
52 54 2,92731 34 39
.. 1,280 2,035
.. 8.0 5.4
.. 93 ..
.. .. 68
No NoPublic Public
M MM CM CA AC No
.. .. ..
.. .. ..
0.9 1.0 3.51.1 76.7 90.50.0 0.3 1.91.4a 14.0a 19.31.0a 15.0a 24.3
.. .. 7.5
.. .. 152.00.3 21.8a 28.6
.. 79 ..7,702 3,676 10,372
12.8 1.9 6.928.5 18.2 14.3
.. 2.4 5.8
.. 7.3 10.0
0.0 .. 5.71.7 .. 7.6
19.8 11.1 48.0
0.08 0.02 0.260.1 0.7 7.4
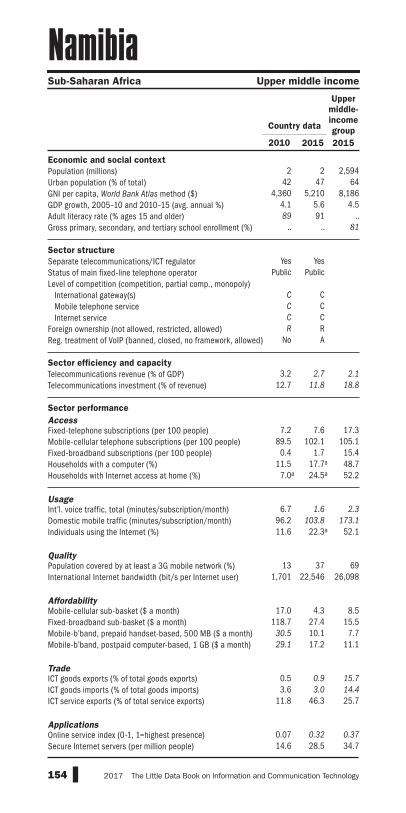
Economic and social contextPopulation (millions)Urban population (% of total)GNI per capita, World Bank Atlas method ($)GDP growth, 2005–10 and 2010–15 (avg. annual %)Adult literacy rate (% ages 15 and older) Gross primary, secondary, and tertiary school enrollment (%)
Sector structureSeparate telecommunications/ICT regulatorStatus of main fixed-line telephone operatorLevel of competition (competition, partial comp., monopoly) International gateway(s) Mobile telephone service Internet serviceForeign ownership (not allowed, restricted, allowed)Reg. treatment of VoIP (banned, closed, no framework, allowed)
Sector efficiency and capacityTelecommunications revenue (% of GDP)Telecommunications investment (% of revenue)
Sector performanceAccessFixed-telephone subscriptions (per 100 people)Mobile-cellular telephone subscriptions (per 100 people)Fixed-broadband subscriptions (per 100 people)Households with a computer (%)Households with Internet access at home (%)
Usage Int’l. voice traffic, total (minutes/subscription/month)Domestic mobile traffic (minutes/subscription/month)Individuals using the Internet (%)
Quality Population covered by at least a 3G mobile network (%)International Internet bandwidth (bit/s per Internet user)
AffordabilityMobile-cellular sub-basket ($ a month)Fixed-broadband sub-basket ($ a month)Mobile-b’band, prepaid handset-based, 500 MB ($ a month)Mobile-b’band, postpaid computer-based, 1 GB ($ a month)
TradeICT goods exports (% of total goods exports)ICT goods imports (% of total goods imports)ICT service exports (% of total service exports)
ApplicationsOnline service index (0-1, 1=highest presence)Secure Internet servers (per million people)
154 2017 The Little Data Book on Information and Communication Technology
Sub-Saharan Africa Upper middle income
Namibia
2010 2015 2015
Uppermiddle-incomegroupCountry data
2 2 2,59442 47 64
4,360 5,210 8,1864.1 5.6 4.589 91 ..
.. .. 81
Yes YesPublic Public
C CC CC CR R
No A
3.2 2.7 2.112.7 11.8 18.8
7.2 7.6 17.389.5 102.1 105.1
0.4 1.7 15.411.5 17.7a 48.7
7.0a 24.5a 52.2
6.7 1.6 2.396.2 103.8 173.111.6 22.3a 52.1
13 37 691,701 22,546 26,098
17.0 4.3 8.5118.7 27.4 15.5
30.5 10.1 7.729.1 17.2 11.1
0.5 0.9 15.73.6 3.0 14.4
11.8 46.3 25.7
0.07 0.32 0.3714.6 28.5 34.7

Economic and social contextPopulation (millions)Urban population (% of total)GNI per capita, World Bank Atlas method ($)GDP growth, 2005–10 and 2010–15 (avg. annual %)Adult literacy rate (% ages 15 and older) Gross primary, secondary, and tertiary school enrollment (%)
Sector structureSeparate telecommunications/ICT regulatorStatus of main fixed-line telephone operatorLevel of competition (competition, partial comp., monopoly) International gateway(s) Mobile telephone service Internet serviceForeign ownership (not allowed, restricted, allowed)Reg. treatment of VoIP (banned, closed, no framework, allowed)
Sector efficiency and capacityTelecommunications revenue (% of GDP)Telecommunications investment (% of revenue)
Sector performanceAccessFixed-telephone subscriptions (per 100 people)Mobile-cellular telephone subscriptions (per 100 people)Fixed-broadband subscriptions (per 100 people)Households with a computer (%)Households with Internet access at home (%)
Usage Int’l. voice traffic, total (minutes/subscription/month)Domestic mobile traffic (minutes/subscription/month)Individuals using the Internet (%)
Quality Population covered by at least a 3G mobile network (%)International Internet bandwidth (bit/s per Internet user)
AffordabilityMobile-cellular sub-basket ($ a month)Fixed-broadband sub-basket ($ a month)Mobile-b’band, prepaid handset-based, 500 MB ($ a month)Mobile-b’band, postpaid computer-based, 1 GB ($ a month)
TradeICT goods exports (% of total goods exports)ICT goods imports (% of total goods imports)ICT service exports (% of total service exports)
ApplicationsOnline service index (0-1, 1=highest presence)Secure Internet servers (per million people)
155The Little Data Book on Information and Communication Technology 2017
East Asia & Pacific High income
Nauru
2010 2015 2015
High-incomegroupCountry data
0.01 0.01 1,187100 100 81
.. .. 41,366
.. .. 1.5
.. .. ..56 .. 95
No NoPublic ..
.. C
.. C
.. C
.. RNo No
.. .. 2.5
.. .. 18.8
0.0 0.0 41.261.8 .. 124.5
9.5 .. 31.0.. .. 83.2
28.0 .. 85.0
.. .. ..
.. .. 195.954.0 .. 81.0
98 98a 992,402 .. 134,761
.. 19.3 14.2
.. 60.1 25.2
.. .. 10.4
.. .. 14.4
.. .. 9.5
.. .. 11.2
.. .. 32.0
0.01 .. 0.67.. .. 1,194.6

Economic and social contextPopulation (millions)Urban population (% of total)GNI per capita, World Bank Atlas method ($)GDP growth, 2005–10 and 2010–15 (avg. annual %)Adult literacy rate (% ages 15 and older) Gross primary, secondary, and tertiary school enrollment (%)
Sector structureSeparate telecommunications/ICT regulatorStatus of main fixed-line telephone operatorLevel of competition (competition, partial comp., monopoly) International gateway(s) Mobile telephone service Internet serviceForeign ownership (not allowed, restricted, allowed)Reg. treatment of VoIP (banned, closed, no framework, allowed)
Sector efficiency and capacityTelecommunications revenue (% of GDP)Telecommunications investment (% of revenue)
Sector performanceAccessFixed-telephone subscriptions (per 100 people)Mobile-cellular telephone subscriptions (per 100 people)Fixed-broadband subscriptions (per 100 people)Households with a computer (%)Households with Internet access at home (%)
Usage Int’l. voice traffic, total (minutes/subscription/month)Domestic mobile traffic (minutes/subscription/month)Individuals using the Internet (%)
Quality Population covered by at least a 3G mobile network (%)International Internet bandwidth (bit/s per Internet user)
AffordabilityMobile-cellular sub-basket ($ a month)Fixed-broadband sub-basket ($ a month)Mobile-b’band, prepaid handset-based, 500 MB ($ a month)Mobile-b’band, postpaid computer-based, 1 GB ($ a month)
TradeICT goods exports (% of total goods exports)ICT goods imports (% of total goods imports)ICT service exports (% of total service exports)
ApplicationsOnline service index (0-1, 1=highest presence)Secure Internet servers (per million people)
156 2017 The Little Data Book on Information and Communication Technology
South Asia Low income
Nepal
2010 2015 2015
Low-incomegroupCountry data
27 29 63817 19 31
540 730 6204.5 4.4 5.460 65 ..75 74 60
Yes YesMixed Mixed
C PC PC CR RC No
.. 4.5 ..
.. .. ..
3.1 3.0 0.934.3 96.7 60.0
0.2 1.1 0.34.2a 8.9a 4.82.1a 6.3a 7.1
.. .. ..
.. .. 48.97.9 17.6a 9.5
20 .. 511,879 2,700 4,245
2.8 2.4 9.423.3 6.5 33.611.4 6.1 8.0
.. 7.7 10.8
0.4 0.0 ..6.7 4.7 3.4
29.7 36.9 ..
0.17 0.16 0.111.7 3.8 1.5

Economic and social contextPopulation (millions)Urban population (% of total)GNI per capita, World Bank Atlas method ($)GDP growth, 2005–10 and 2010–15 (avg. annual %)Adult literacy rate (% ages 15 and older) Gross primary, secondary, and tertiary school enrollment (%)
Sector structureSeparate telecommunications/ICT regulatorStatus of main fixed-line telephone operatorLevel of competition (competition, partial comp., monopoly) International gateway(s) Mobile telephone service Internet serviceForeign ownership (not allowed, restricted, allowed)Reg. treatment of VoIP (banned, closed, no framework, allowed)
Sector efficiency and capacityTelecommunications revenue (% of GDP)Telecommunications investment (% of revenue)
Sector performanceAccessFixed-telephone subscriptions (per 100 people)Mobile-cellular telephone subscriptions (per 100 people)Fixed-broadband subscriptions (per 100 people)Households with a computer (%)Households with Internet access at home (%)
Usage Int’l. voice traffic, total (minutes/subscription/month)Domestic mobile traffic (minutes/subscription/month)Individuals using the Internet (%)
Quality Population covered by at least a 3G mobile network (%)International Internet bandwidth (bit/s per Internet user)
AffordabilityMobile-cellular sub-basket ($ a month)Fixed-broadband sub-basket ($ a month)Mobile-b’band, prepaid handset-based, 500 MB ($ a month)Mobile-b’band, postpaid computer-based, 1 GB ($ a month)
TradeICT goods exports (% of total goods exports)ICT goods imports (% of total goods imports)ICT service exports (% of total service exports)
ApplicationsOnline service index (0-1, 1=highest presence)Secure Internet servers (per million people)
157The Little Data Book on Information and Communication Technology 2017
Europe & Central Asia High income
Netherlands
2010 2015 2015
High-incomegroupCountry data
17 17 1,18787 90 81
53,530 48,940 41,3661.1 0.4 1.5
.. .. ..101 .. 95
Yes YesMixed Private
C CC CC CA AA A
2.0 1.9 2.514.8 22.3 18.8
43.5 41.3 41.2115.4 123.5 124.5
38.1 41.7 31.092.0 96.2 83.290.9 96.0 85.0
.. .. ..97.9 45.8 195.990.7 93.1 81.0
99 99 99154,312 242,326 134,761
33.2 28.0 14.232.9 36.0 25.238.6 13.3 10.438.6 12.8 14.4
12.5 10.8 9.514.5 12.9 11.234.3 34.5 32.0
0.68 0.93 0.672,276.7 2,828.1 1,194.6

Economic and social contextPopulation (millions)Urban population (% of total)GNI per capita, World Bank Atlas method ($)GDP growth, 2005–10 and 2010–15 (avg. annual %)Adult literacy rate (% ages 15 and older) Gross primary, secondary, and tertiary school enrollment (%)
Sector structureSeparate telecommunications/ICT regulatorStatus of main fixed-line telephone operatorLevel of competition (competition, partial comp., monopoly) International gateway(s) Mobile telephone service Internet serviceForeign ownership (not allowed, restricted, allowed)Reg. treatment of VoIP (banned, closed, no framework, allowed)
Sector efficiency and capacityTelecommunications revenue (% of GDP)Telecommunications investment (% of revenue)
Sector performanceAccessFixed-telephone subscriptions (per 100 people)Mobile-cellular telephone subscriptions (per 100 people)Fixed-broadband subscriptions (per 100 people)Households with a computer (%)Households with Internet access at home (%)
Usage Int’l. voice traffic, total (minutes/subscription/month)Domestic mobile traffic (minutes/subscription/month)Individuals using the Internet (%)
Quality Population covered by at least a 3G mobile network (%)International Internet bandwidth (bit/s per Internet user)
AffordabilityMobile-cellular sub-basket ($ a month)Fixed-broadband sub-basket ($ a month)Mobile-b’band, prepaid handset-based, 500 MB ($ a month)Mobile-b’band, postpaid computer-based, 1 GB ($ a month)
TradeICT goods exports (% of total goods exports)ICT goods imports (% of total goods imports)ICT service exports (% of total service exports)
ApplicationsOnline service index (0-1, 1=highest presence)Secure Internet servers (per million people)
158 2017 The Little Data Book on Information and Communication Technology
East Asia & Pacific High income
New Caledonia
2010 2015 2015
High-incomegroupCountry data
0.25 0.27 1,18767 70 81
.. .. 41,366
.. .. 1.5
.. 97 ..
.. .. 95
.. ..
.. ..
.. ..
.. ..
.. ..
.. ..A B
.. .. 2.5
.. .. 18.8
29.3 35.0 41.289.6 93.5 124.515.5 23.9 31.056.3a .. 83.237.7 .. 85.0
.. .. ..
.. .. 195.942.0a 74.0a 81.0
0 .. 9917,395 .. 134,761
.. .. 14.2
.. .. 25.2
.. .. 10.4
.. .. 14.4
0.1 0.2 9.53.3 3.4 11.2
19.2 11.5 32.0
.. .. 0.67100.0 476.2 1,194.6

Economic and social contextPopulation (millions)Urban population (% of total)GNI per capita, World Bank Atlas method ($)GDP growth, 2005–10 and 2010–15 (avg. annual %)Adult literacy rate (% ages 15 and older) Gross primary, secondary, and tertiary school enrollment (%)
Sector structureSeparate telecommunications/ICT regulatorStatus of main fixed-line telephone operatorLevel of competition (competition, partial comp., monopoly) International gateway(s) Mobile telephone service Internet serviceForeign ownership (not allowed, restricted, allowed)Reg. treatment of VoIP (banned, closed, no framework, allowed)
Sector efficiency and capacityTelecommunications revenue (% of GDP)Telecommunications investment (% of revenue)
Sector performanceAccessFixed-telephone subscriptions (per 100 people)Mobile-cellular telephone subscriptions (per 100 people)Fixed-broadband subscriptions (per 100 people)Households with a computer (%)Households with Internet access at home (%)
Usage Int’l. voice traffic, total (minutes/subscription/month)Domestic mobile traffic (minutes/subscription/month)Individuals using the Internet (%)
Quality Population covered by at least a 3G mobile network (%)International Internet bandwidth (bit/s per Internet user)
AffordabilityMobile-cellular sub-basket ($ a month)Fixed-broadband sub-basket ($ a month)Mobile-b’band, prepaid handset-based, 500 MB ($ a month)Mobile-b’band, postpaid computer-based, 1 GB ($ a month)
TradeICT goods exports (% of total goods exports)ICT goods imports (% of total goods imports)ICT service exports (% of total service exports)
ApplicationsOnline service index (0-1, 1=highest presence)Secure Internet servers (per million people)
159The Little Data Book on Information and Communication Technology 2017
East Asia & Pacific High income
New Zealand
2010 2015 2015
High-incomegroupCountry data
4 5 1,18786 86 81
29,340 40,080 41,3660.8 2.6 1.5
.. .. ..108 105 95
Yes YesPrivate Private
C CC CC CA AA No
2.4 2.1 2.531.3 32.7 18.8
43.0 40.2 41.2107.8 121.8 124.5
25.0 31.5 31.079.5a 82.3a 83.276.8a 82.8a 85.0
.. .. ..78.6 86.6 195.980.5a 88.2a 81.0
97 98 9934,143 108,506 134,761
47.2 13.2 14.236.1 45.3 25.224.3 13.2 10.440.5 21.6 14.4
1.2 0.9 9.58.3 6.9 11.2
15.3 13.0 32.0
0.64 0.84 0.671,495.4 1,298.6 1,194.6

Economic and social contextPopulation (millions)Urban population (% of total)GNI per capita, World Bank Atlas method ($)GDP growth, 2005–10 and 2010–15 (avg. annual %)Adult literacy rate (% ages 15 and older) Gross primary, secondary, and tertiary school enrollment (%)
Sector structureSeparate telecommunications/ICT regulatorStatus of main fixed-line telephone operatorLevel of competition (competition, partial comp., monopoly) International gateway(s) Mobile telephone service Internet serviceForeign ownership (not allowed, restricted, allowed)Reg. treatment of VoIP (banned, closed, no framework, allowed)
Sector efficiency and capacityTelecommunications revenue (% of GDP)Telecommunications investment (% of revenue)
Sector performanceAccessFixed-telephone subscriptions (per 100 people)Mobile-cellular telephone subscriptions (per 100 people)Fixed-broadband subscriptions (per 100 people)Households with a computer (%)Households with Internet access at home (%)
Usage Int’l. voice traffic, total (minutes/subscription/month)Domestic mobile traffic (minutes/subscription/month)Individuals using the Internet (%)
Quality Population covered by at least a 3G mobile network (%)International Internet bandwidth (bit/s per Internet user)
AffordabilityMobile-cellular sub-basket ($ a month)Fixed-broadband sub-basket ($ a month)Mobile-b’band, prepaid handset-based, 500 MB ($ a month)Mobile-b’band, postpaid computer-based, 1 GB ($ a month)
TradeICT goods exports (% of total goods exports)ICT goods imports (% of total goods imports)ICT service exports (% of total service exports)
ApplicationsOnline service index (0-1, 1=highest presence)Secure Internet servers (per million people)
160 2017 The Little Data Book on Information and Communication Technology
Latin America & Caribbean Lower middle income
Nicaragua
2010 2015 2015
Lowermiddle-incomegroupCountry data
6 6 2,92757 59 39
1,480 1,940 2,0352.3 5.1 5.478 82 ..
.. .. 68
Yes YesPrivate Private
M MC CC CR A
No A
.. .. ..
.. .. ..
4.4 5.7 3.568.1 116.1 90.5
1.3 1.9 1.98.2a 11.8a 19.33.8a 14.0a 24.3
.. .. 7.5
.. .. 152.010.0a 19.7a 28.6
.. 75a ..8,588 21,090 10,372
16.9 27.0 6.934.4 24.0 14.317.0 11.0 5.813.8 12.0 10.0
0.1 0.1 5.74.8 5.2 7.6
13.3 11.7 48.0
0.25 0.09 0.267.8 14.3 7.4

Economic and social contextPopulation (millions)Urban population (% of total)GNI per capita, World Bank Atlas method ($)GDP growth, 2005–10 and 2010–15 (avg. annual %)Adult literacy rate (% ages 15 and older) Gross primary, secondary, and tertiary school enrollment (%)
Sector structureSeparate telecommunications/ICT regulatorStatus of main fixed-line telephone operatorLevel of competition (competition, partial comp., monopoly) International gateway(s) Mobile telephone service Internet serviceForeign ownership (not allowed, restricted, allowed)Reg. treatment of VoIP (banned, closed, no framework, allowed)
Sector efficiency and capacityTelecommunications revenue (% of GDP)Telecommunications investment (% of revenue)
Sector performanceAccessFixed-telephone subscriptions (per 100 people)Mobile-cellular telephone subscriptions (per 100 people)Fixed-broadband subscriptions (per 100 people)Households with a computer (%)Households with Internet access at home (%)
Usage Int’l. voice traffic, total (minutes/subscription/month)Domestic mobile traffic (minutes/subscription/month)Individuals using the Internet (%)
Quality Population covered by at least a 3G mobile network (%)International Internet bandwidth (bit/s per Internet user)
AffordabilityMobile-cellular sub-basket ($ a month)Fixed-broadband sub-basket ($ a month)Mobile-b’band, prepaid handset-based, 500 MB ($ a month)Mobile-b’band, postpaid computer-based, 1 GB ($ a month)
TradeICT goods exports (% of total goods exports)ICT goods imports (% of total goods imports)ICT service exports (% of total service exports)
ApplicationsOnline service index (0-1, 1=highest presence)Secure Internet servers (per million people)
161The Little Data Book on Information and Communication Technology 2017
Sub-Saharan Africa Low income
Niger
2010 2015 2015
Low-incomegroupCountry data
16 20 63818 19 31
360 390 6205.0 6.5 5.415 19 ..33 .. 60
Yes YesMixed Public
.. ..C CM MR RB B
4.6 .. .... .. ..
0.5 0.6 0.923.1 46.5 60.0
0.0 0.1 0.31.2a 2.7a 4.80.6a 2.6a 7.1
.. .. ..18,471.9 .. 48.9
0.8a 2.2a 9.5
.. .. 511,440 2,688 4,245
16.6 9.5 9.459.6 50.3 33.629.4 8.0 8.0
.. 8.5 10.8
0.3 0.4 ..1.9 2.9 3.45.4 49.2 ..
0.04 0.13 0.110.2 0.3 1.5
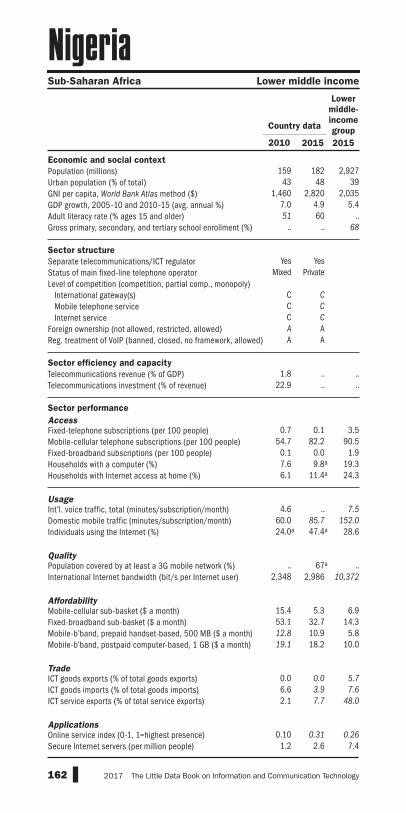
Economic and social contextPopulation (millions)Urban population (% of total)GNI per capita, World Bank Atlas method ($)GDP growth, 2005–10 and 2010–15 (avg. annual %)Adult literacy rate (% ages 15 and older) Gross primary, secondary, and tertiary school enrollment (%)
Sector structureSeparate telecommunications/ICT regulatorStatus of main fixed-line telephone operatorLevel of competition (competition, partial comp., monopoly) International gateway(s) Mobile telephone service Internet serviceForeign ownership (not allowed, restricted, allowed)Reg. treatment of VoIP (banned, closed, no framework, allowed)
Sector efficiency and capacityTelecommunications revenue (% of GDP)Telecommunications investment (% of revenue)
Sector performanceAccessFixed-telephone subscriptions (per 100 people)Mobile-cellular telephone subscriptions (per 100 people)Fixed-broadband subscriptions (per 100 people)Households with a computer (%)Households with Internet access at home (%)
Usage Int’l. voice traffic, total (minutes/subscription/month)Domestic mobile traffic (minutes/subscription/month)Individuals using the Internet (%)
Quality Population covered by at least a 3G mobile network (%)International Internet bandwidth (bit/s per Internet user)
AffordabilityMobile-cellular sub-basket ($ a month)Fixed-broadband sub-basket ($ a month)Mobile-b’band, prepaid handset-based, 500 MB ($ a month)Mobile-b’band, postpaid computer-based, 1 GB ($ a month)
TradeICT goods exports (% of total goods exports)ICT goods imports (% of total goods imports)ICT service exports (% of total service exports)
ApplicationsOnline service index (0-1, 1=highest presence)Secure Internet servers (per million people)
162 2017 The Little Data Book on Information and Communication Technology
Sub-Saharan Africa Lower middle income
Nigeria
2010 2015 2015
Lowermiddle-incomegroupCountry data
159 182 2,92743 48 39
1,460 2,820 2,0357.0 4.9 5.451 60 ..
.. .. 68
Yes YesMixed Private
C CC CC CA AA A
1.8 .. ..22.9 .. ..
0.7 0.1 3.554.7 82.2 90.5
0.1 0.0 1.97.6 9.8a 19.36.1 11.4a 24.3
4.6 .. 7.560.0 85.7 152.024.0a 47.4a 28.6
.. 67a ..2,348 2,986 10,372
15.4 5.3 6.953.1 32.7 14.312.8 10.9 5.819.1 18.2 10.0
0.0 0.0 5.76.6 3.9 7.62.1 7.7 48.0
0.10 0.31 0.261.2 2.6 7.4

Economic and social contextPopulation (millions)Urban population (% of total)GNI per capita, World Bank Atlas method ($)GDP growth, 2005–10 and 2010–15 (avg. annual %)Adult literacy rate (% ages 15 and older) Gross primary, secondary, and tertiary school enrollment (%)
Sector structureSeparate telecommunications/ICT regulatorStatus of main fixed-line telephone operatorLevel of competition (competition, partial comp., monopoly) International gateway(s) Mobile telephone service Internet serviceForeign ownership (not allowed, restricted, allowed)Reg. treatment of VoIP (banned, closed, no framework, allowed)
Sector efficiency and capacityTelecommunications revenue (% of GDP)Telecommunications investment (% of revenue)
Sector performanceAccessFixed-telephone subscriptions (per 100 people)Mobile-cellular telephone subscriptions (per 100 people)Fixed-broadband subscriptions (per 100 people)Households with a computer (%)Households with Internet access at home (%)
Usage Int’l. voice traffic, total (minutes/subscription/month)Domestic mobile traffic (minutes/subscription/month)Individuals using the Internet (%)
Quality Population covered by at least a 3G mobile network (%)International Internet bandwidth (bit/s per Internet user)
AffordabilityMobile-cellular sub-basket ($ a month)Fixed-broadband sub-basket ($ a month)Mobile-b’band, prepaid handset-based, 500 MB ($ a month)Mobile-b’band, postpaid computer-based, 1 GB ($ a month)
TradeICT goods exports (% of total goods exports)ICT goods imports (% of total goods imports)ICT service exports (% of total service exports)
ApplicationsOnline service index (0-1, 1=highest presence)Secure Internet servers (per million people)
163The Little Data Book on Information and Communication Technology 2017
East Asia & Pacific High income
Northern Mariana Islands
2010 2015 2015
High-incomegroupCountry data
0.05 0.06 1,18789 89 81
.. .. 41,366
.. .. 1.5
.. .. ..
.. .. 95
.. ..
.. ..
.. ..
.. ..
.. ..
.. ..
.. ..
.. .. 2.5
.. .. 18.8
47.3 39.9 41.2.. .. 124.5.. .. 31.0.. .. 83.2.. .. 85.0
.. .. ..
.. .. 195.9
.. .. 81.0
.. .. 99
.. .. 134,761
.. .. 14.2
.. .. 25.2
.. .. 10.4
.. .. 14.4
.. .. 9.5
.. .. 11.2
.. .. 32.0
.. .. 0.6792.8 54.5 1,194.6

Economic and social contextPopulation (millions)Urban population (% of total)GNI per capita, World Bank Atlas method ($)GDP growth, 2005–10 and 2010–15 (avg. annual %)Adult literacy rate (% ages 15 and older) Gross primary, secondary, and tertiary school enrollment (%)
Sector structureSeparate telecommunications/ICT regulatorStatus of main fixed-line telephone operatorLevel of competition (competition, partial comp., monopoly) International gateway(s) Mobile telephone service Internet serviceForeign ownership (not allowed, restricted, allowed)Reg. treatment of VoIP (banned, closed, no framework, allowed)
Sector efficiency and capacityTelecommunications revenue (% of GDP)Telecommunications investment (% of revenue)
Sector performanceAccessFixed-telephone subscriptions (per 100 people)Mobile-cellular telephone subscriptions (per 100 people)Fixed-broadband subscriptions (per 100 people)Households with a computer (%)Households with Internet access at home (%)
Usage Int’l. voice traffic, total (minutes/subscription/month)Domestic mobile traffic (minutes/subscription/month)Individuals using the Internet (%)
Quality Population covered by at least a 3G mobile network (%)International Internet bandwidth (bit/s per Internet user)
AffordabilityMobile-cellular sub-basket ($ a month)Fixed-broadband sub-basket ($ a month)Mobile-b’band, prepaid handset-based, 500 MB ($ a month)Mobile-b’band, postpaid computer-based, 1 GB ($ a month)
TradeICT goods exports (% of total goods exports)ICT goods imports (% of total goods imports)ICT service exports (% of total service exports)
ApplicationsOnline service index (0-1, 1=highest presence)Secure Internet servers (per million people)
164 2017 The Little Data Book on Information and Communication Technology
Europe & Central Asia High income
Norway
2010 2015 2015
High-incomegroupCountry data
5 5 1,18779 80 81
88,430 93,820 41,3660.8 1.8 1.5
.. .. ..98 98 95
Yes YesMixed Mixed
C CC CC CA AA No
1.3 1.0 2.524.3 29.2 18.8
33.7 20.0 41.2114.5 113.6 124.5
35.2 38.9 31.090.9 96.5 83.289.8 96.6 85.0
.. .. ..170.4 179.3 195.9
93.4 96.8 81.0
90 99 99109,459 220,937 134,761
17.1 18.1 14.249.1 40.8 25.268.6 6.1 10.434.2 16.0 14.4
1.4 0.9 9.57.5 6.9 11.2
36.4 31.9 32.0
0.74 0.76 0.671,651.2 2,030.4 1,194.6
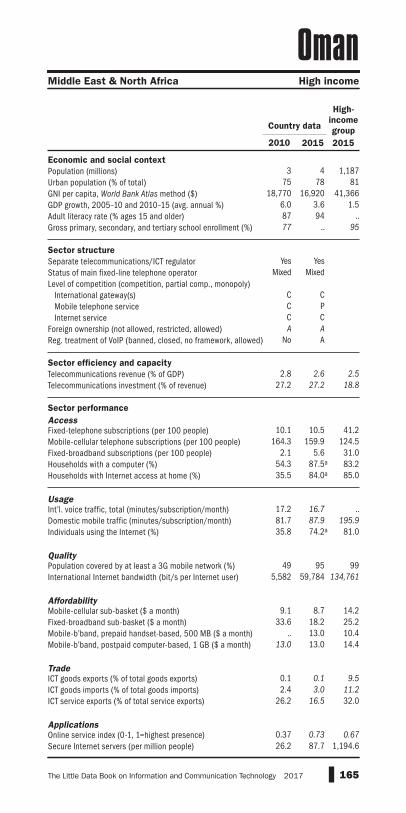
Economic and social contextPopulation (millions)Urban population (% of total)GNI per capita, World Bank Atlas method ($)GDP growth, 2005–10 and 2010–15 (avg. annual %)Adult literacy rate (% ages 15 and older) Gross primary, secondary, and tertiary school enrollment (%)
Sector structureSeparate telecommunications/ICT regulatorStatus of main fixed-line telephone operatorLevel of competition (competition, partial comp., monopoly) International gateway(s) Mobile telephone service Internet serviceForeign ownership (not allowed, restricted, allowed)Reg. treatment of VoIP (banned, closed, no framework, allowed)
Sector efficiency and capacityTelecommunications revenue (% of GDP)Telecommunications investment (% of revenue)
Sector performanceAccessFixed-telephone subscriptions (per 100 people)Mobile-cellular telephone subscriptions (per 100 people)Fixed-broadband subscriptions (per 100 people)Households with a computer (%)Households with Internet access at home (%)
Usage Int’l. voice traffic, total (minutes/subscription/month)Domestic mobile traffic (minutes/subscription/month)Individuals using the Internet (%)
Quality Population covered by at least a 3G mobile network (%)International Internet bandwidth (bit/s per Internet user)
AffordabilityMobile-cellular sub-basket ($ a month)Fixed-broadband sub-basket ($ a month)Mobile-b’band, prepaid handset-based, 500 MB ($ a month)Mobile-b’band, postpaid computer-based, 1 GB ($ a month)
TradeICT goods exports (% of total goods exports)ICT goods imports (% of total goods imports)ICT service exports (% of total service exports)
ApplicationsOnline service index (0-1, 1=highest presence)Secure Internet servers (per million people)
165The Little Data Book on Information and Communication Technology 2017
Middle East & North Africa High income
Oman
2010 2015 2015
High-incomegroupCountry data
3 4 1,18775 78 81
18,770 16,920 41,3666.0 3.6 1.587 94 ..77 .. 95
Yes YesMixed Mixed
C CC PC CA A
No A
2.8 2.6 2.527.2 27.2 18.8
10.1 10.5 41.2164.3 159.9 124.5
2.1 5.6 31.054.3 87.5a 83.235.5 84.0a 85.0
17.2 16.7 ..81.7 87.9 195.935.8 74.2a 81.0
49 95 995,582 59,784 134,761
9.1 8.7 14.233.6 18.2 25.2
.. 13.0 10.413.0 13.0 14.4
0.1 0.1 9.52.4 3.0 11.2
26.2 16.5 32.0
0.37 0.73 0.6726.2 87.7 1,194.6

Economic and social contextPopulation (millions)Urban population (% of total)GNI per capita, World Bank Atlas method ($)GDP growth, 2005–10 and 2010–15 (avg. annual %)Adult literacy rate (% ages 15 and older) Gross primary, secondary, and tertiary school enrollment (%)
Sector structureSeparate telecommunications/ICT regulatorStatus of main fixed-line telephone operatorLevel of competition (competition, partial comp., monopoly) International gateway(s) Mobile telephone service Internet serviceForeign ownership (not allowed, restricted, allowed)Reg. treatment of VoIP (banned, closed, no framework, allowed)
Sector efficiency and capacityTelecommunications revenue (% of GDP)Telecommunications investment (% of revenue)
Sector performanceAccessFixed-telephone subscriptions (per 100 people)Mobile-cellular telephone subscriptions (per 100 people)Fixed-broadband subscriptions (per 100 people)Households with a computer (%)Households with Internet access at home (%)
Usage Int’l. voice traffic, total (minutes/subscription/month)Domestic mobile traffic (minutes/subscription/month)Individuals using the Internet (%)
Quality Population covered by at least a 3G mobile network (%)International Internet bandwidth (bit/s per Internet user)
AffordabilityMobile-cellular sub-basket ($ a month)Fixed-broadband sub-basket ($ a month)Mobile-b’band, prepaid handset-based, 500 MB ($ a month)Mobile-b’band, postpaid computer-based, 1 GB ($ a month)
TradeICT goods exports (% of total goods exports)ICT goods imports (% of total goods imports)ICT service exports (% of total service exports)
ApplicationsOnline service index (0-1, 1=highest presence)Secure Internet servers (per million people)
166 2017 The Little Data Book on Information and Communication Technology
South Asia Lower middle income
Pakistan
2010 2015 2015
Lowermiddle-incomegroupCountry data
170 189 2,92737 39 39
1,080 1,440 2,0353.3 4.2 5.455 56 ..46 49 68
Yes YesMixed Mixed
C CC CC CA R
No A
2.3 1.9 ..0.1 40.4 ..
3.5 1.6 3.557.3 66.9 90.5
0.5 1.0 1.99.7a 19.0 19.35.7a 24.0 24.3
7.6 4.5 7.566.2 227.6 152.0
8.0a 18.0 28.6
0 46 ..4,332 11,907 10,372
3.0 2.1 6.914.2 6.6 14.3
2.7 1.9 5.822.5 5.7 10.0
0.2 0.2 5.73.3 4.6 7.6
16.4 29.3 48.0
0.25 0.32 0.261.0 2.4 7.4

Economic and social contextPopulation (millions)Urban population (% of total)GNI per capita, World Bank Atlas method ($)GDP growth, 2005–10 and 2010–15 (avg. annual %)Adult literacy rate (% ages 15 and older) Gross primary, secondary, and tertiary school enrollment (%)
Sector structureSeparate telecommunications/ICT regulatorStatus of main fixed-line telephone operatorLevel of competition (competition, partial comp., monopoly) International gateway(s) Mobile telephone service Internet serviceForeign ownership (not allowed, restricted, allowed)Reg. treatment of VoIP (banned, closed, no framework, allowed)
Sector efficiency and capacityTelecommunications revenue (% of GDP)Telecommunications investment (% of revenue)
Sector performanceAccessFixed-telephone subscriptions (per 100 people)Mobile-cellular telephone subscriptions (per 100 people)Fixed-broadband subscriptions (per 100 people)Households with a computer (%)Households with Internet access at home (%)
Usage Int’l. voice traffic, total (minutes/subscription/month)Domestic mobile traffic (minutes/subscription/month)Individuals using the Internet (%)
Quality Population covered by at least a 3G mobile network (%)International Internet bandwidth (bit/s per Internet user)
AffordabilityMobile-cellular sub-basket ($ a month)Fixed-broadband sub-basket ($ a month)Mobile-b’band, prepaid handset-based, 500 MB ($ a month)Mobile-b’band, postpaid computer-based, 1 GB ($ a month)
TradeICT goods exports (% of total goods exports)ICT goods imports (% of total goods imports)ICT service exports (% of total service exports)
ApplicationsOnline service index (0-1, 1=highest presence)Secure Internet servers (per million people)
167The Little Data Book on Information and Communication Technology 2017
East Asia & Pacific Upper middle income
Palau
2010 2015 2015
Uppermiddle-incomegroupCountry data
0.02 0.02 2,59483 87 64
8,910 12,180 8,186–3.5 3.1 4.5
.. 100 ..
.. 98 81
.. NoPublic ..
.. ..
.. ..
.. ..
.. ..
.. ..
.. 4.5 2.1
.. 44.8 18.8
34.1 33.8 17.370.9 111.5 105.1
1.2 5.7 15.4.. .. 48.7
19.0 .. 52.2
30.6 20.0 2.3.. .. 173.1.. .. 52.1
.. 88 69
.. .. 26,098
.. .. 8.5
.. .. 15.5
.. .. 7.7
.. .. 11.1
1.0 4.4 15.73.3 4.4 14.44.2 2.9 25.7
0.05 0.17 0.3748.9 140.9 34.7

Economic and social contextPopulation (millions)Urban population (% of total)GNI per capita, World Bank Atlas method ($)GDP growth, 2005–10 and 2010–15 (avg. annual %)Adult literacy rate (% ages 15 and older) Gross primary, secondary, and tertiary school enrollment (%)
Sector structureSeparate telecommunications/ICT regulatorStatus of main fixed-line telephone operatorLevel of competition (competition, partial comp., monopoly) International gateway(s) Mobile telephone service Internet serviceForeign ownership (not allowed, restricted, allowed)Reg. treatment of VoIP (banned, closed, no framework, allowed)
Sector efficiency and capacityTelecommunications revenue (% of GDP)Telecommunications investment (% of revenue)
Sector performanceAccessFixed-telephone subscriptions (per 100 people)Mobile-cellular telephone subscriptions (per 100 people)Fixed-broadband subscriptions (per 100 people)Households with a computer (%)Households with Internet access at home (%)
Usage Int’l. voice traffic, total (minutes/subscription/month)Domestic mobile traffic (minutes/subscription/month)Individuals using the Internet (%)
Quality Population covered by at least a 3G mobile network (%)International Internet bandwidth (bit/s per Internet user)
AffordabilityMobile-cellular sub-basket ($ a month)Fixed-broadband sub-basket ($ a month)Mobile-b’band, prepaid handset-based, 500 MB ($ a month)Mobile-b’band, postpaid computer-based, 1 GB ($ a month)
TradeICT goods exports (% of total goods exports)ICT goods imports (% of total goods imports)ICT service exports (% of total service exports)
ApplicationsOnline service index (0-1, 1=highest presence)Secure Internet servers (per million people)
168 2017 The Little Data Book on Information and Communication Technology
Latin America & Caribbean Upper middle income
Panama
2010 2015 2015
Uppermiddle-incomegroupCountry data
4 4 2,59465 67 64
7,010 12,050 8,1868.0 7.7 4.594 95 ..77 76 81
Yes YesMixed Mixed
C CP CC CA A
No A
2.9 1.6 2.132.0 32.2 18.8
14.7 15.6 17.3180.7 174.2 105.1
7.0 7.9 15.427.9 39.6 48.720.3 52.7 52.2
5.3 7.6 2.348.0 69.9 173.140.1 51.2 52.1
.. 79a 6916,950 75,906 26,098
10.1 12.6 8.516.6 16.0 15.515.0 15.0 7.720.0 20.0 11.1
9.6 .. 15.79.6 4.9 14.48.7 6.7 25.7
0.28 0.37 0.37123.2 121.9 34.7

Economic and social contextPopulation (millions)Urban population (% of total)GNI per capita, World Bank Atlas method ($)GDP growth, 2005–10 and 2010–15 (avg. annual %)Adult literacy rate (% ages 15 and older) Gross primary, secondary, and tertiary school enrollment (%)
Sector structureSeparate telecommunications/ICT regulatorStatus of main fixed-line telephone operatorLevel of competition (competition, partial comp., monopoly) International gateway(s) Mobile telephone service Internet serviceForeign ownership (not allowed, restricted, allowed)Reg. treatment of VoIP (banned, closed, no framework, allowed)
Sector efficiency and capacityTelecommunications revenue (% of GDP)Telecommunications investment (% of revenue)
Sector performanceAccessFixed-telephone subscriptions (per 100 people)Mobile-cellular telephone subscriptions (per 100 people)Fixed-broadband subscriptions (per 100 people)Households with a computer (%)Households with Internet access at home (%)
Usage Int’l. voice traffic, total (minutes/subscription/month)Domestic mobile traffic (minutes/subscription/month)Individuals using the Internet (%)
Quality Population covered by at least a 3G mobile network (%)International Internet bandwidth (bit/s per Internet user)
AffordabilityMobile-cellular sub-basket ($ a month)Fixed-broadband sub-basket ($ a month)Mobile-b’band, prepaid handset-based, 500 MB ($ a month)Mobile-b’band, postpaid computer-based, 1 GB ($ a month)
TradeICT goods exports (% of total goods exports)ICT goods imports (% of total goods imports)ICT service exports (% of total service exports)
ApplicationsOnline service index (0-1, 1=highest presence)Secure Internet servers (per million people)
169The Little Data Book on Information and Communication Technology 2017
East Asia & Pacific Lower middle income
Papua New Guinea
2010 2015 2015
Lowermiddle-incomegroupCountry data
7 8 2,92713 13 39
1,270 2,240 2,0356.1 7.9 5.4
.. 63 ..
.. .. 68
Yes YesPublic Public
.. ..M MP P.. ..A B
.. .. ..
.. .. ..
1.8 2.0 3.527.8 46.6 90.5
0.1 0.2 1.92.8a 3.8a 19.32.2a 5.3a 24.3
.. .. 7.5
.. .. 152.01.3 7.9a 28.6
.. .. ..3,166 9,122 10,372
30.5 22.5 6.9136.1 21.7 14.3
60.0 23.8 5.8.. 39.3 10.0
0.0 .. 5.72.9 .. 7.6
49.3 63.5 48.0
0.07 0.01 0.263.2 11.0 7.4

Economic and social contextPopulation (millions)Urban population (% of total)GNI per capita, World Bank Atlas method ($)GDP growth, 2005–10 and 2010–15 (avg. annual %)Adult literacy rate (% ages 15 and older) Gross primary, secondary, and tertiary school enrollment (%)
Sector structureSeparate telecommunications/ICT regulatorStatus of main fixed-line telephone operatorLevel of competition (competition, partial comp., monopoly) International gateway(s) Mobile telephone service Internet serviceForeign ownership (not allowed, restricted, allowed)Reg. treatment of VoIP (banned, closed, no framework, allowed)
Sector efficiency and capacityTelecommunications revenue (% of GDP)Telecommunications investment (% of revenue)
Sector performanceAccessFixed-telephone subscriptions (per 100 people)Mobile-cellular telephone subscriptions (per 100 people)Fixed-broadband subscriptions (per 100 people)Households with a computer (%)Households with Internet access at home (%)
Usage Int’l. voice traffic, total (minutes/subscription/month)Domestic mobile traffic (minutes/subscription/month)Individuals using the Internet (%)
Quality Population covered by at least a 3G mobile network (%)International Internet bandwidth (bit/s per Internet user)
AffordabilityMobile-cellular sub-basket ($ a month)Fixed-broadband sub-basket ($ a month)Mobile-b’band, prepaid handset-based, 500 MB ($ a month)Mobile-b’band, postpaid computer-based, 1 GB ($ a month)
TradeICT goods exports (% of total goods exports)ICT goods imports (% of total goods imports)ICT service exports (% of total service exports)
ApplicationsOnline service index (0-1, 1=highest presence)Secure Internet servers (per million people)
170 2017 The Little Data Book on Information and Communication Technology
Latin America & Caribbean Upper middle income
Paraguay
2010 2015 2015
Uppermiddle-incomegroupCountry data
6 7 2,59458 60 64
2,930 4,220 8,1864.4 5.3 4.594 96 ..72 .. 81
Yes YesPublic Public
C CC CC CA AA A
3.7 .. 2.1.. .. 18.8
5.6 5.5 17.391.7 105.4 105.1
1.4 3.1 15.419.3 34.1a 48.713.8 27.4a 52.2
7.2 3.9 2.381.6 93.5 173.119.8 44.4a 52.1
.. 66a 698,295 17,922 26,098
8.6 4.9 8.519.0 28.6 15.518.1 7.7 7.713.6 14.4 11.1
0.1 0.1 15.727.0 14.6 14.4
3.1 1.9 25.7
0.26 0.23 0.376.9 27.9 34.7

Economic and social contextPopulation (millions)Urban population (% of total)GNI per capita, World Bank Atlas method ($)GDP growth, 2005–10 and 2010–15 (avg. annual %)Adult literacy rate (% ages 15 and older) Gross primary, secondary, and tertiary school enrollment (%)
Sector structureSeparate telecommunications/ICT regulatorStatus of main fixed-line telephone operatorLevel of competition (competition, partial comp., monopoly) International gateway(s) Mobile telephone service Internet serviceForeign ownership (not allowed, restricted, allowed)Reg. treatment of VoIP (banned, closed, no framework, allowed)
Sector efficiency and capacityTelecommunications revenue (% of GDP)Telecommunications investment (% of revenue)
Sector performanceAccessFixed-telephone subscriptions (per 100 people)Mobile-cellular telephone subscriptions (per 100 people)Fixed-broadband subscriptions (per 100 people)Households with a computer (%)Households with Internet access at home (%)
Usage Int’l. voice traffic, total (minutes/subscription/month)Domestic mobile traffic (minutes/subscription/month)Individuals using the Internet (%)
Quality Population covered by at least a 3G mobile network (%)International Internet bandwidth (bit/s per Internet user)
AffordabilityMobile-cellular sub-basket ($ a month)Fixed-broadband sub-basket ($ a month)Mobile-b’band, prepaid handset-based, 500 MB ($ a month)Mobile-b’band, postpaid computer-based, 1 GB ($ a month)
TradeICT goods exports (% of total goods exports)ICT goods imports (% of total goods imports)ICT service exports (% of total service exports)
ApplicationsOnline service index (0-1, 1=highest presence)Secure Internet servers (per million people)
171The Little Data Book on Information and Communication Technology 2017
Latin America & Caribbean Upper middle income
Peru
2010 2015 2015
Uppermiddle-incomegroupCountry data
29 31 2,59477 79 64
4,380 6,200 8,1866.8 4.8 4.594 94 ..84 .. 81
Yes YesMixed Private
.. ..C CC CA RA No
3.0 3.0 2.119.3 20.7 18.8
10.8 9.3 17.399.5 109.9 105.1
3.2 6.4 15.422.6 32.4 48.713.0 23.2 52.2
9.5 .. 2.358.6 .. 173.134.8 40.9 52.1
55 91 698,319 43,154 26,098
43.2 11.0 8.542.2 11.0 15.515.2 9.4 7.7
7.6 14.1 11.1
0.1 0.1 15.77.5 9.0 14.4
14.0 10.6 25.7
0.41 0.63 0.3714.1 32.4 34.7

Economic and social contextPopulation (millions)Urban population (% of total)GNI per capita, World Bank Atlas method ($)GDP growth, 2005–10 and 2010–15 (avg. annual %)Adult literacy rate (% ages 15 and older) Gross primary, secondary, and tertiary school enrollment (%)
Sector structureSeparate telecommunications/ICT regulatorStatus of main fixed-line telephone operatorLevel of competition (competition, partial comp., monopoly) International gateway(s) Mobile telephone service Internet serviceForeign ownership (not allowed, restricted, allowed)Reg. treatment of VoIP (banned, closed, no framework, allowed)
Sector efficiency and capacityTelecommunications revenue (% of GDP)Telecommunications investment (% of revenue)
Sector performanceAccessFixed-telephone subscriptions (per 100 people)Mobile-cellular telephone subscriptions (per 100 people)Fixed-broadband subscriptions (per 100 people)Households with a computer (%)Households with Internet access at home (%)
Usage Int’l. voice traffic, total (minutes/subscription/month)Domestic mobile traffic (minutes/subscription/month)Individuals using the Internet (%)
Quality Population covered by at least a 3G mobile network (%)International Internet bandwidth (bit/s per Internet user)
AffordabilityMobile-cellular sub-basket ($ a month)Fixed-broadband sub-basket ($ a month)Mobile-b’band, prepaid handset-based, 500 MB ($ a month)Mobile-b’band, postpaid computer-based, 1 GB ($ a month)
TradeICT goods exports (% of total goods exports)ICT goods imports (% of total goods imports)ICT service exports (% of total service exports)
ApplicationsOnline service index (0-1, 1=highest presence)Secure Internet servers (per million people)
172 2017 The Little Data Book on Information and Communication Technology
East Asia & Pacific Lower middle income
Philippines
2010 2015 2015
Lowermiddle-incomegroupCountry data
93 101 2,92745 44 39
2,750 3,540 2,0354.7 6.1 5.495 97 ..78 85 68
Yes YesPrivate Private
.. ..C CC CR RA No
2.6 1.9 ..24.4 30.6 ..
3.6 3.0 3.589.0 118.1 90.5
1.9 3.4 1.913.6 27.0a 19.3
9.5 28.3a 24.3
.. .. 7.5
.. .. 152.025.0 40.7a 28.6
69 78 ..10,702 37,409 10,372
10.1 10.0 6.922.1 22.0 14.311.8 4.4 5.823.7 19.7 10.0
26.8 34.6 5.731.6 20.9 7.674.9 71.4 48.0
0.39 0.48 0.266.7 13.7 7.4

Economic and social contextPopulation (millions)Urban population (% of total)GNI per capita, World Bank Atlas method ($)GDP growth, 2005–10 and 2010–15 (avg. annual %)Adult literacy rate (% ages 15 and older) Gross primary, secondary, and tertiary school enrollment (%)
Sector structureSeparate telecommunications/ICT regulatorStatus of main fixed-line telephone operatorLevel of competition (competition, partial comp., monopoly) International gateway(s) Mobile telephone service Internet serviceForeign ownership (not allowed, restricted, allowed)Reg. treatment of VoIP (banned, closed, no framework, allowed)
Sector efficiency and capacityTelecommunications revenue (% of GDP)Telecommunications investment (% of revenue)
Sector performanceAccessFixed-telephone subscriptions (per 100 people)Mobile-cellular telephone subscriptions (per 100 people)Fixed-broadband subscriptions (per 100 people)Households with a computer (%)Households with Internet access at home (%)
Usage Int’l. voice traffic, total (minutes/subscription/month)Domestic mobile traffic (minutes/subscription/month)Individuals using the Internet (%)
Quality Population covered by at least a 3G mobile network (%)International Internet bandwidth (bit/s per Internet user)
AffordabilityMobile-cellular sub-basket ($ a month)Fixed-broadband sub-basket ($ a month)Mobile-b’band, prepaid handset-based, 500 MB ($ a month)Mobile-b’band, postpaid computer-based, 1 GB ($ a month)
TradeICT goods exports (% of total goods exports)ICT goods imports (% of total goods imports)ICT service exports (% of total service exports)
ApplicationsOnline service index (0-1, 1=highest presence)Secure Internet servers (per million people)
173The Little Data Book on Information and Communication Technology 2017
Europe & Central Asia High income
Poland
2010 2015 2015
High-incomegroupCountry data
38 38 1,18761 61 81
12,710 13,370 41,3664.7 2.7 1.5
.. 100 ..89 97 95
Yes YesMixed Private
C CP CC CA AA No
3.0 2.3 2.516.5 17.0 18.8
20.1 11.1 41.2122.9 148.7 124.5
15.3 19.5 31.069.0 77.9 83.263.4 75.8 85.0
.. .. ..101.4 119.9 195.9
62.3 68.0 81.0
61 100 9937,806 86,573 134,761
15.8 7.6 14.218.0 10.3 25.2
7.7 2.7 10.430.7 8.0 14.4
9.6 7.7 9.59.8 8.9 11.2
33.0 33.0 32.0
0.39 0.54 0.67211.6 547.1 1,194.6

Economic and social contextPopulation (millions)Urban population (% of total)GNI per capita, World Bank Atlas method ($)GDP growth, 2005–10 and 2010–15 (avg. annual %)Adult literacy rate (% ages 15 and older) Gross primary, secondary, and tertiary school enrollment (%)
Sector structureSeparate telecommunications/ICT regulatorStatus of main fixed-line telephone operatorLevel of competition (competition, partial comp., monopoly) International gateway(s) Mobile telephone service Internet serviceForeign ownership (not allowed, restricted, allowed)Reg. treatment of VoIP (banned, closed, no framework, allowed)
Sector efficiency and capacityTelecommunications revenue (% of GDP)Telecommunications investment (% of revenue)
Sector performanceAccessFixed-telephone subscriptions (per 100 people)Mobile-cellular telephone subscriptions (per 100 people)Fixed-broadband subscriptions (per 100 people)Households with a computer (%)Households with Internet access at home (%)
Usage Int’l. voice traffic, total (minutes/subscription/month)Domestic mobile traffic (minutes/subscription/month)Individuals using the Internet (%)
Quality Population covered by at least a 3G mobile network (%)International Internet bandwidth (bit/s per Internet user)
AffordabilityMobile-cellular sub-basket ($ a month)Fixed-broadband sub-basket ($ a month)Mobile-b’band, prepaid handset-based, 500 MB ($ a month)Mobile-b’band, postpaid computer-based, 1 GB ($ a month)
TradeICT goods exports (% of total goods exports)ICT goods imports (% of total goods imports)ICT service exports (% of total service exports)
ApplicationsOnline service index (0-1, 1=highest presence)Secure Internet servers (per million people)
174 2017 The Little Data Book on Information and Communication Technology
Europe & Central Asia High income
Portugal
2010 2015 2015
High-incomegroupCountry data
11 10 1,18761 63 81
22,960 20,530 41,3660.4 –1.1 1.594 95 ..96 99 95
Yes YesMixed Mixed
C CC CC CA AA No
4.2 2.7 2.514.2 13.4 18.8
42.4 44.1 41.2115.3 110.4 124.5
20.1 29.6 31.059.5a 71.1 83.253.7 70.2 85.0
.. .. ..130.3 162.6 195.9
53.3 68.6 81.0
84 99 99141,734 232,080 134,761
22.9 14.2 14.226.3 24.4 25.213.8 8.3 10.419.3 14.4 14.4
4.0 2.3 9.55.7 4.7 11.2
18.4 22.5 32.0
0.39 0.64 0.67174.7 315.9 1,194.6

Economic and social contextPopulation (millions)Urban population (% of total)GNI per capita, World Bank Atlas method ($)GDP growth, 2005–10 and 2010–15 (avg. annual %)Adult literacy rate (% ages 15 and older) Gross primary, secondary, and tertiary school enrollment (%)
Sector structureSeparate telecommunications/ICT regulatorStatus of main fixed-line telephone operatorLevel of competition (competition, partial comp., monopoly) International gateway(s) Mobile telephone service Internet serviceForeign ownership (not allowed, restricted, allowed)Reg. treatment of VoIP (banned, closed, no framework, allowed)
Sector efficiency and capacityTelecommunications revenue (% of GDP)Telecommunications investment (% of revenue)
Sector performanceAccessFixed-telephone subscriptions (per 100 people)Mobile-cellular telephone subscriptions (per 100 people)Fixed-broadband subscriptions (per 100 people)Households with a computer (%)Households with Internet access at home (%)
Usage Int’l. voice traffic, total (minutes/subscription/month)Domestic mobile traffic (minutes/subscription/month)Individuals using the Internet (%)
Quality Population covered by at least a 3G mobile network (%)International Internet bandwidth (bit/s per Internet user)
AffordabilityMobile-cellular sub-basket ($ a month)Fixed-broadband sub-basket ($ a month)Mobile-b’band, prepaid handset-based, 500 MB ($ a month)Mobile-b’band, postpaid computer-based, 1 GB ($ a month)
TradeICT goods exports (% of total goods exports)ICT goods imports (% of total goods imports)ICT service exports (% of total service exports)
ApplicationsOnline service index (0-1, 1=highest presence)Secure Internet servers (per million people)
175The Little Data Book on Information and Communication Technology 2017
Latin America & Caribbean High income
Puerto Rico
2010 2015 2015
High-incomegroupCountry data
4 3 1,18794 94 81
16,640 19,320 41,366–2.3 –1.9 1.5
92 93 ..95 85 95
.. ..
.. ..
.. ..
.. ..
.. ..
.. ..
.. ..
2.1 2.0 2.5.. .. 18.8
24.0 22.1 41.279.1 87.1 124.514.9 18.0 31.055.0 57.3a 83.250.0 51.8a 85.0
.. .. ..
.. .. 195.945.3 79.5a 81.0
.. 99 99136,866 .. 134,761
.. .. 14.2
.. .. 25.2
.. .. 10.4
.. .. 14.4
.. .. 9.5
.. .. 11.2
.. .. 32.0
.. .. 0.6789.5 139.0 1,194.6

Economic and social contextPopulation (millions)Urban population (% of total)GNI per capita, World Bank Atlas method ($)GDP growth, 2005–10 and 2010–15 (avg. annual %)Adult literacy rate (% ages 15 and older) Gross primary, secondary, and tertiary school enrollment (%)
Sector structureSeparate telecommunications/ICT regulatorStatus of main fixed-line telephone operatorLevel of competition (competition, partial comp., monopoly) International gateway(s) Mobile telephone service Internet serviceForeign ownership (not allowed, restricted, allowed)Reg. treatment of VoIP (banned, closed, no framework, allowed)
Sector efficiency and capacityTelecommunications revenue (% of GDP)Telecommunications investment (% of revenue)
Sector performanceAccessFixed-telephone subscriptions (per 100 people)Mobile-cellular telephone subscriptions (per 100 people)Fixed-broadband subscriptions (per 100 people)Households with a computer (%)Households with Internet access at home (%)
Usage Int’l. voice traffic, total (minutes/subscription/month)Domestic mobile traffic (minutes/subscription/month)Individuals using the Internet (%)
Quality Population covered by at least a 3G mobile network (%)International Internet bandwidth (bit/s per Internet user)
AffordabilityMobile-cellular sub-basket ($ a month)Fixed-broadband sub-basket ($ a month)Mobile-b’band, prepaid handset-based, 500 MB ($ a month)Mobile-b’band, postpaid computer-based, 1 GB ($ a month)
TradeICT goods exports (% of total goods exports)ICT goods imports (% of total goods imports)ICT service exports (% of total service exports)
ApplicationsOnline service index (0-1, 1=highest presence)Secure Internet servers (per million people)
176 2017 The Little Data Book on Information and Communication Technology
Middle East & North Africa High income
Qatar
2010 2015 2015
High-incomegroupCountry data
2 2 1,18799 99 81
66,890 85,430 41,36617.8 5.6 1.5
96 98 ..57 .. 95
Yes YesMixed Mixed
P PP PP PR R
No A
1.4 1.2 2.520.4 18.8 18.8
15.4 18.2 41.2125.0 153.6 124.5
8.3 10.1 31.087.0 88.3 83.281.8 95.8 85.0
.. .. ..
.. .. 195.969.0 92.9 81.0
98 98 9920,295 71,566 134,761
18.4 18.7 14.254.9 64.0 25.227.5 22.0 10.427.5 16.5 14.4
0.0 0.0 9.54.3 5.6 11.2
.. .. 32.0
0.28 0.65 0.6785.0 296.6 1,194.6

Economic and social contextPopulation (millions)Urban population (% of total)GNI per capita, World Bank Atlas method ($)GDP growth, 2005–10 and 2010–15 (avg. annual %)Adult literacy rate (% ages 15 and older) Gross primary, secondary, and tertiary school enrollment (%)
Sector structureSeparate telecommunications/ICT regulatorStatus of main fixed-line telephone operatorLevel of competition (competition, partial comp., monopoly) International gateway(s) Mobile telephone service Internet serviceForeign ownership (not allowed, restricted, allowed)Reg. treatment of VoIP (banned, closed, no framework, allowed)
Sector efficiency and capacityTelecommunications revenue (% of GDP)Telecommunications investment (% of revenue)
Sector performanceAccessFixed-telephone subscriptions (per 100 people)Mobile-cellular telephone subscriptions (per 100 people)Fixed-broadband subscriptions (per 100 people)Households with a computer (%)Households with Internet access at home (%)
Usage Int’l. voice traffic, total (minutes/subscription/month)Domestic mobile traffic (minutes/subscription/month)Individuals using the Internet (%)
Quality Population covered by at least a 3G mobile network (%)International Internet bandwidth (bit/s per Internet user)
AffordabilityMobile-cellular sub-basket ($ a month)Fixed-broadband sub-basket ($ a month)Mobile-b’band, prepaid handset-based, 500 MB ($ a month)Mobile-b’band, postpaid computer-based, 1 GB ($ a month)
TradeICT goods exports (% of total goods exports)ICT goods imports (% of total goods imports)ICT service exports (% of total service exports)
ApplicationsOnline service index (0-1, 1=highest presence)Secure Internet servers (per million people)
177The Little Data Book on Information and Communication Technology 2017
Europe & Central Asia Upper middle income
Romania
2010 2015 2015
Uppermiddle-incomegroupCountry data
20 20 2,59454 55 64
8,590 9,500 8,1863.0 2.4 4.599 99 ..90 .. 81
Yes YesMixed Mixed
C CC CC CA AA A
2.2 1.7 2.123.8 19.1 18.8
20.6 19.8 17.3111.4 107.1 105.1
13.7 19.8 15.447.9 68.7 48.742.2 67.7 52.2
8.9 17.5 2.3177.9 243.4 173.1
39.9 55.8 52.1
91 100 6950,405 146,012 26,098
21.8 6.7 8.59.1 7.2 15.5
12.8 5.5 7.74.3 3.7 11.1
8.4 3.8 15.79.3 7.1 14.4
35.0 36.7 25.7
0.42 0.44 0.3742.2 229.3 34.7

Economic and social contextPopulation (millions)Urban population (% of total)GNI per capita, World Bank Atlas method ($)GDP growth, 2005–10 and 2010–15 (avg. annual %)Adult literacy rate (% ages 15 and older) Gross primary, secondary, and tertiary school enrollment (%)
Sector structureSeparate telecommunications/ICT regulatorStatus of main fixed-line telephone operatorLevel of competition (competition, partial comp., monopoly) International gateway(s) Mobile telephone service Internet serviceForeign ownership (not allowed, restricted, allowed)Reg. treatment of VoIP (banned, closed, no framework, allowed)
Sector efficiency and capacityTelecommunications revenue (% of GDP)Telecommunications investment (% of revenue)
Sector performanceAccessFixed-telephone subscriptions (per 100 people)Mobile-cellular telephone subscriptions (per 100 people)Fixed-broadband subscriptions (per 100 people)Households with a computer (%)Households with Internet access at home (%)
Usage Int’l. voice traffic, total (minutes/subscription/month)Domestic mobile traffic (minutes/subscription/month)Individuals using the Internet (%)
Quality Population covered by at least a 3G mobile network (%)International Internet bandwidth (bit/s per Internet user)
AffordabilityMobile-cellular sub-basket ($ a month)Fixed-broadband sub-basket ($ a month)Mobile-b’band, prepaid handset-based, 500 MB ($ a month)Mobile-b’band, postpaid computer-based, 1 GB ($ a month)
TradeICT goods exports (% of total goods exports)ICT goods imports (% of total goods imports)ICT service exports (% of total service exports)
ApplicationsOnline service index (0-1, 1=highest presence)Secure Internet servers (per million people)
178 2017 The Little Data Book on Information and Communication Technology
Europe & Central Asia Upper middle income
Russian Federation
2010 2015 2015
Uppermiddle-incomegroupCountry data
143 144 2,59474 74 64
9,980 11,400 8,1863.1 1.3 4.5
100 100 ..88 92 81
No NoMixed Mixed
.. ..C C.. .... R
No A
2.7 1.9 2.115.3 19.6 18.8
31.3 25.7 17.3165.5 160.0 105.1
10.9 18.8 15.455.0 72.5 48.741.3 72.1 52.2
.. .. 2.3112.2 151.1 173.1
43.0 73.4 52.1
.. 73 6917,812 26,845 26,098
9.2 3.7 8.59.9 6.6 15.5
16.2 3.3 7.716.2 5.7 11.1
0.2 0.8 15.78.5 7.9 14.4
30.4 32.0 25.7
0.33 0.71 0.3720.2 126.4 34.7

Economic and social contextPopulation (millions)Urban population (% of total)GNI per capita, World Bank Atlas method ($)GDP growth, 2005–10 and 2010–15 (avg. annual %)Adult literacy rate (% ages 15 and older) Gross primary, secondary, and tertiary school enrollment (%)
Sector structureSeparate telecommunications/ICT regulatorStatus of main fixed-line telephone operatorLevel of competition (competition, partial comp., monopoly) International gateway(s) Mobile telephone service Internet serviceForeign ownership (not allowed, restricted, allowed)Reg. treatment of VoIP (banned, closed, no framework, allowed)
Sector efficiency and capacityTelecommunications revenue (% of GDP)Telecommunications investment (% of revenue)
Sector performanceAccessFixed-telephone subscriptions (per 100 people)Mobile-cellular telephone subscriptions (per 100 people)Fixed-broadband subscriptions (per 100 people)Households with a computer (%)Households with Internet access at home (%)
Usage Int’l. voice traffic, total (minutes/subscription/month)Domestic mobile traffic (minutes/subscription/month)Individuals using the Internet (%)
Quality Population covered by at least a 3G mobile network (%)International Internet bandwidth (bit/s per Internet user)
AffordabilityMobile-cellular sub-basket ($ a month)Fixed-broadband sub-basket ($ a month)Mobile-b’band, prepaid handset-based, 500 MB ($ a month)Mobile-b’band, postpaid computer-based, 1 GB ($ a month)
TradeICT goods exports (% of total goods exports)ICT goods imports (% of total goods imports)ICT service exports (% of total service exports)
ApplicationsOnline service index (0-1, 1=highest presence)Secure Internet servers (per million people)
179The Little Data Book on Information and Communication Technology 2017
Sub-Saharan Africa Low income
Rwanda
2010 2015 2015
Low-incomegroupCountry data
10 12 63824 29 31
550 700 6208.4 6.9 5.466 71 ..69 73 60
Yes YesMixed ..
P PC CC CA A
No No
2.9 2.8 ..108.6 28.9 ..
0.4 0.1 0.932.7 70.5 60.0
0.0 0.2 0.31.3 4.0a 4.81.3a 6.7a 7.1
3.7 1.7 ..50.5 79.5 48.9
8.0 18.0a 9.5
.. 88 511,895 5,661 4,245
14.7 5.9 9.4163.5 97.1 33.6
8.1 1.4 8.0.. 8.2 10.8
0.6 1.1 ..7.1 9.2 3.42.1 3.2 ..
0.17 0.51 0.110.7 4.1 1.5

Economic and social contextPopulation (millions)Urban population (% of total)GNI per capita, World Bank Atlas method ($)GDP growth, 2005–10 and 2010–15 (avg. annual %)Adult literacy rate (% ages 15 and older) Gross primary, secondary, and tertiary school enrollment (%)
Sector structureSeparate telecommunications/ICT regulatorStatus of main fixed-line telephone operatorLevel of competition (competition, partial comp., monopoly) International gateway(s) Mobile telephone service Internet serviceForeign ownership (not allowed, restricted, allowed)Reg. treatment of VoIP (banned, closed, no framework, allowed)
Sector efficiency and capacityTelecommunications revenue (% of GDP)Telecommunications investment (% of revenue)
Sector performanceAccessFixed-telephone subscriptions (per 100 people)Mobile-cellular telephone subscriptions (per 100 people)Fixed-broadband subscriptions (per 100 people)Households with a computer (%)Households with Internet access at home (%)
Usage Int’l. voice traffic, total (minutes/subscription/month)Domestic mobile traffic (minutes/subscription/month)Individuals using the Internet (%)
Quality Population covered by at least a 3G mobile network (%)International Internet bandwidth (bit/s per Internet user)
AffordabilityMobile-cellular sub-basket ($ a month)Fixed-broadband sub-basket ($ a month)Mobile-b’band, prepaid handset-based, 500 MB ($ a month)Mobile-b’band, postpaid computer-based, 1 GB ($ a month)
TradeICT goods exports (% of total goods exports)ICT goods imports (% of total goods imports)ICT service exports (% of total service exports)
ApplicationsOnline service index (0-1, 1=highest presence)Secure Internet servers (per million people)
180 2017 The Little Data Book on Information and Communication Technology
East Asia & Pacific Lower middle income
Samoa
2010 2015 2015
Lowermiddle-incomegroupCountry data
0.19 0.19 2,92720 19 39
3,230 3,930 2,0350.9 0.9 5.499 99 ..
.. .. 68
Yes YesPublic Mixed
C CC CC CA A
No No
.. .. ..
.. .. ..
4.3 5.6 3.548.4 58.5 90.5
0.1 1.1 1.913.0a 22.6a 19.310.0a 25.5a 24.3
20.8 21.1 7.5.. .. 152.0
7.0a 25.4a 28.6
.. 1 ..3,840 7,842 10,372
17.6 16.5 6.960.0 38.7 14.339.3 19.5 5.832.7 20.2 10.0
0.1 0.4 5.72.4 3.8 7.6
10.1 9.5 48.0
0.14 0.24 0.2621.5 41.4 7.4

Economic and social contextPopulation (millions)Urban population (% of total)GNI per capita, World Bank Atlas method ($)GDP growth, 2005–10 and 2010–15 (avg. annual %)Adult literacy rate (% ages 15 and older) Gross primary, secondary, and tertiary school enrollment (%)
Sector structureSeparate telecommunications/ICT regulatorStatus of main fixed-line telephone operatorLevel of competition (competition, partial comp., monopoly) International gateway(s) Mobile telephone service Internet serviceForeign ownership (not allowed, restricted, allowed)Reg. treatment of VoIP (banned, closed, no framework, allowed)
Sector efficiency and capacityTelecommunications revenue (% of GDP)Telecommunications investment (% of revenue)
Sector performanceAccessFixed-telephone subscriptions (per 100 people)Mobile-cellular telephone subscriptions (per 100 people)Fixed-broadband subscriptions (per 100 people)Households with a computer (%)Households with Internet access at home (%)
Usage Int’l. voice traffic, total (minutes/subscription/month)Domestic mobile traffic (minutes/subscription/month)Individuals using the Internet (%)
Quality Population covered by at least a 3G mobile network (%)International Internet bandwidth (bit/s per Internet user)
AffordabilityMobile-cellular sub-basket ($ a month)Fixed-broadband sub-basket ($ a month)Mobile-b’band, prepaid handset-based, 500 MB ($ a month)Mobile-b’band, postpaid computer-based, 1 GB ($ a month)
TradeICT goods exports (% of total goods exports)ICT goods imports (% of total goods imports)ICT service exports (% of total service exports)
ApplicationsOnline service index (0-1, 1=highest presence)Secure Internet servers (per million people)
181The Little Data Book on Information and Communication Technology 2017
Europe & Central Asia High income
San Marino
2010 2015 2015
High-incomegroupCountry data
0.03 0.03 1,18794 94 81
52,140 .. 41,3663.1 .. 1.5
.. .. ..88 .. 95
No NoMixed Private
.. ..C C.. .... .... ..
.. .. 2.5
.. .. 18.8
63.4 52.0 41.299.1 115.2 124.519.4 36.6 31.0
.. .. 83.2
.. .. 85.0
.. .. ..
.. .. 195.949.6 .. 81.0
.. 86 99649,359 .. 134,761
.. 24.1 14.2
.. 18.5 25.225.7 27.7 10.437.3 11.1 14.4
.. .. 9.5
.. .. 11.2
.. .. 32.0
0.18 0.28 0.671,270.8 1,636.2 1,194.6

Economic and social contextPopulation (millions)Urban population (% of total)GNI per capita, World Bank Atlas method ($)GDP growth, 2005–10 and 2010–15 (avg. annual %)Adult literacy rate (% ages 15 and older) Gross primary, secondary, and tertiary school enrollment (%)
Sector structureSeparate telecommunications/ICT regulatorStatus of main fixed-line telephone operatorLevel of competition (competition, partial comp., monopoly) International gateway(s) Mobile telephone service Internet serviceForeign ownership (not allowed, restricted, allowed)Reg. treatment of VoIP (banned, closed, no framework, allowed)
Sector efficiency and capacityTelecommunications revenue (% of GDP)Telecommunications investment (% of revenue)
Sector performanceAccessFixed-telephone subscriptions (per 100 people)Mobile-cellular telephone subscriptions (per 100 people)Fixed-broadband subscriptions (per 100 people)Households with a computer (%)Households with Internet access at home (%)
Usage Int’l. voice traffic, total (minutes/subscription/month)Domestic mobile traffic (minutes/subscription/month)Individuals using the Internet (%)
Quality Population covered by at least a 3G mobile network (%)International Internet bandwidth (bit/s per Internet user)
AffordabilityMobile-cellular sub-basket ($ a month)Fixed-broadband sub-basket ($ a month)Mobile-b’band, prepaid handset-based, 500 MB ($ a month)Mobile-b’band, postpaid computer-based, 1 GB ($ a month)
TradeICT goods exports (% of total goods exports)ICT goods imports (% of total goods imports)ICT service exports (% of total service exports)
ApplicationsOnline service index (0-1, 1=highest presence)Secure Internet servers (per million people)
182 2017 The Little Data Book on Information and Communication Technology
Sub-Saharan Africa Lower middle income
São Tomé and Príncipe
2010 2015 2015
Lowermiddle-incomegroupCountry data
0.17 0.19 2,92762 65 39
1,190 1,670 2,0355.7 4.5 5.490 92 ..69 80 68
Yes YesMixed Mixed
.. ..M MM M.. ..
No No
8.6 .. ..60.0 .. ..
4.4 3.5 3.557.6 65.1 90.5
0.3 0.5 1.9.. .. 19.3.. .. 24.3
9.1 .. 7.526.2 .. 152.018.8 25.8a 28.6
2 .. ..1,197 8,594 10,372
12.7 11.7 6.9285.4 27.7 14.3163.9 4.5 5.8115.5 29.1 10.0
0.7 0.1 5.75.8 4.3 7.69.9 19.3 48.0
0.09 0.01 0.2617.6 10.5 7.4

Economic and social contextPopulation (millions)Urban population (% of total)GNI per capita, World Bank Atlas method ($)GDP growth, 2005–10 and 2010–15 (avg. annual %)Adult literacy rate (% ages 15 and older) Gross primary, secondary, and tertiary school enrollment (%)
Sector structureSeparate telecommunications/ICT regulatorStatus of main fixed-line telephone operatorLevel of competition (competition, partial comp., monopoly) International gateway(s) Mobile telephone service Internet serviceForeign ownership (not allowed, restricted, allowed)Reg. treatment of VoIP (banned, closed, no framework, allowed)
Sector efficiency and capacityTelecommunications revenue (% of GDP)Telecommunications investment (% of revenue)
Sector performanceAccessFixed-telephone subscriptions (per 100 people)Mobile-cellular telephone subscriptions (per 100 people)Fixed-broadband subscriptions (per 100 people)Households with a computer (%)Households with Internet access at home (%)
Usage Int’l. voice traffic, total (minutes/subscription/month)Domestic mobile traffic (minutes/subscription/month)Individuals using the Internet (%)
Quality Population covered by at least a 3G mobile network (%)International Internet bandwidth (bit/s per Internet user)
AffordabilityMobile-cellular sub-basket ($ a month)Fixed-broadband sub-basket ($ a month)Mobile-b’band, prepaid handset-based, 500 MB ($ a month)Mobile-b’band, postpaid computer-based, 1 GB ($ a month)
TradeICT goods exports (% of total goods exports)ICT goods imports (% of total goods imports)ICT service exports (% of total service exports)
ApplicationsOnline service index (0-1, 1=highest presence)Secure Internet servers (per million people)
183The Little Data Book on Information and Communication Technology 2017
Middle East & North Africa High income
Saudi Arabia
2010 2015 2015
High-incomegroupCountry data
28 32 1,18782 83 81
18,470 23,550 41,3665.4 4.6 1.5
.. 95 ..79 96 95
Yes YesMixed Mixed
.. ..P CC C
No RB C
3.1 2.1 2.519.1 13.5 18.8
15.3 12.5 41.2189.2 176.6 124.5
6.3 12.0 31.057.3a 67.0 83.254.4a 94.0 85.0
29.2 35.9 ..101.5 106.5 195.9
41.0 69.6 81.0
90 97 9911,095 88,669 134,761
15.4 14.1 14.226.6 39.7 25.218.7 18.7 10.426.4 11.7 14.4
0.1 0.2 9.57.2 7.4 11.23.4 1.9 32.0
0.31 0.77 0.6717.1 53.7 1,194.6

Economic and social contextPopulation (millions)Urban population (% of total)GNI per capita, World Bank Atlas method ($)GDP growth, 2005–10 and 2010–15 (avg. annual %)Adult literacy rate (% ages 15 and older) Gross primary, secondary, and tertiary school enrollment (%)
Sector structureSeparate telecommunications/ICT regulatorStatus of main fixed-line telephone operatorLevel of competition (competition, partial comp., monopoly) International gateway(s) Mobile telephone service Internet serviceForeign ownership (not allowed, restricted, allowed)Reg. treatment of VoIP (banned, closed, no framework, allowed)
Sector efficiency and capacityTelecommunications revenue (% of GDP)Telecommunications investment (% of revenue)
Sector performanceAccessFixed-telephone subscriptions (per 100 people)Mobile-cellular telephone subscriptions (per 100 people)Fixed-broadband subscriptions (per 100 people)Households with a computer (%)Households with Internet access at home (%)
Usage Int’l. voice traffic, total (minutes/subscription/month)Domestic mobile traffic (minutes/subscription/month)Individuals using the Internet (%)
Quality Population covered by at least a 3G mobile network (%)International Internet bandwidth (bit/s per Internet user)
AffordabilityMobile-cellular sub-basket ($ a month)Fixed-broadband sub-basket ($ a month)Mobile-b’band, prepaid handset-based, 500 MB ($ a month)Mobile-b’band, postpaid computer-based, 1 GB ($ a month)
TradeICT goods exports (% of total goods exports)ICT goods imports (% of total goods imports)ICT service exports (% of total service exports)
ApplicationsOnline service index (0-1, 1=highest presence)Secure Internet servers (per million people)
184 2017 The Little Data Book on Information and Communication Technology
Sub-Saharan Africa Low income
Senegal
2010 2015 2015
Low-incomegroupCountry data
13 15 63842 44 31
1,040 1,000 6203.6 4.1 5.452 56 ..47 .. 60
Yes YesMixed Mixed
P CP CP CA ..
No No
9.9 9.7 ..25.5 12.3 ..
2.6 2.0 0.964.4 99.9 60.0
0.6 0.7 0.35.7a 12.9a 4.84.2a 15.7a 7.1
13.5 7.6 ..69.9 96.3 48.9
8.0a 21.7a 9.5
.. .. 515,212 6,931 4,245
13.7 13.8 9.436.1 30.4 33.629.4 8.0 8.0
.. 8.5 10.8
0.4 0.4 ..3.3 2.8 3.4
33.6 .. ..
0.18 0.31 0.111.1 5.2 1.5

Economic and social contextPopulation (millions)Urban population (% of total)GNI per capita, World Bank Atlas method ($)GDP growth, 2005–10 and 2010–15 (avg. annual %)Adult literacy rate (% ages 15 and older) Gross primary, secondary, and tertiary school enrollment (%)
Sector structureSeparate telecommunications/ICT regulatorStatus of main fixed-line telephone operatorLevel of competition (competition, partial comp., monopoly) International gateway(s) Mobile telephone service Internet serviceForeign ownership (not allowed, restricted, allowed)Reg. treatment of VoIP (banned, closed, no framework, allowed)
Sector efficiency and capacityTelecommunications revenue (% of GDP)Telecommunications investment (% of revenue)
Sector performanceAccessFixed-telephone subscriptions (per 100 people)Mobile-cellular telephone subscriptions (per 100 people)Fixed-broadband subscriptions (per 100 people)Households with a computer (%)Households with Internet access at home (%)
Usage Int’l. voice traffic, total (minutes/subscription/month)Domestic mobile traffic (minutes/subscription/month)Individuals using the Internet (%)
Quality Population covered by at least a 3G mobile network (%)International Internet bandwidth (bit/s per Internet user)
AffordabilityMobile-cellular sub-basket ($ a month)Fixed-broadband sub-basket ($ a month)Mobile-b’band, prepaid handset-based, 500 MB ($ a month)Mobile-b’band, postpaid computer-based, 1 GB ($ a month)
TradeICT goods exports (% of total goods exports)ICT goods imports (% of total goods imports)ICT service exports (% of total service exports)
ApplicationsOnline service index (0-1, 1=highest presence)Secure Internet servers (per million people)
185The Little Data Book on Information and Communication Technology 2017
Europe & Central Asia Upper middle income
Serbia
2010 2015 2015
Uppermiddle-incomegroupCountry data
7 7 2,59455 56 64
5,850 5,500 8,1862.7 0.3 4.598 98 ..79 84 81
Yes YesMixed Mixed
.. ..C CC CA RA A
4.9 4.6 2.118.4 12.4 18.8
39.3 36.5 17.3125.3 120.5 105.1
10.9 16.8 15.450.9a 64.4 48.740.2a 63.8 52.2
8.6 7.0 2.373.3 131.3 173.140.9 65.3 52.1
69 97 6945,597 20,478 26,098
8.6 14.3 8.515.3 14.2 15.5
6.9 4.6 7.74.6 6.4 11.1
1.6 1.4 15.74.2 3.2 14.4
34.0 36.7 25.7
0.22 0.39 0.3719.9 63.5 34.7

Economic and social contextPopulation (millions)Urban population (% of total)GNI per capita, World Bank Atlas method ($)GDP growth, 2005–10 and 2010–15 (avg. annual %)Adult literacy rate (% ages 15 and older) Gross primary, secondary, and tertiary school enrollment (%)
Sector structureSeparate telecommunications/ICT regulatorStatus of main fixed-line telephone operatorLevel of competition (competition, partial comp., monopoly) International gateway(s) Mobile telephone service Internet serviceForeign ownership (not allowed, restricted, allowed)Reg. treatment of VoIP (banned, closed, no framework, allowed)
Sector efficiency and capacityTelecommunications revenue (% of GDP)Telecommunications investment (% of revenue)
Sector performanceAccessFixed-telephone subscriptions (per 100 people)Mobile-cellular telephone subscriptions (per 100 people)Fixed-broadband subscriptions (per 100 people)Households with a computer (%)Households with Internet access at home (%)
Usage Int’l. voice traffic, total (minutes/subscription/month)Domestic mobile traffic (minutes/subscription/month)Individuals using the Internet (%)
Quality Population covered by at least a 3G mobile network (%)International Internet bandwidth (bit/s per Internet user)
AffordabilityMobile-cellular sub-basket ($ a month)Fixed-broadband sub-basket ($ a month)Mobile-b’band, prepaid handset-based, 500 MB ($ a month)Mobile-b’band, postpaid computer-based, 1 GB ($ a month)
TradeICT goods exports (% of total goods exports)ICT goods imports (% of total goods imports)ICT service exports (% of total service exports)
ApplicationsOnline service index (0-1, 1=highest presence)Secure Internet servers (per million people)
186 2017 The Little Data Book on Information and Communication Technology
Sub-Saharan Africa High income
Seychelles
2010 2015 2015
High-incomegroupCountry data
0.09 0.09 1,18752 54 81
10,190 14,760 41,3663.6 5.4 1.594 95 ..71 77 95
No NoPrivate Private
C CP CC CA AA A
3.8 .. 2.5.. .. 18.8
24.2 22.8 41.2128.9 158.1 124.5
7.4 14.3 31.037.8 66.8a 83.226.1 59.4a 85.0
9.1 4.1 ..42.3 59.9 195.941.0a 58.1a 81.0
90 90 994,961 38,395 134,761
15.9 13.2 14.248.1 15.1 25.229.9 16.9 10.421.8 18.7 14.4
0.0 .. 9.52.1 .. 11.27.5 28.1 32.0
0.06 0.33 0.671,114.0 484.4 1,194.6
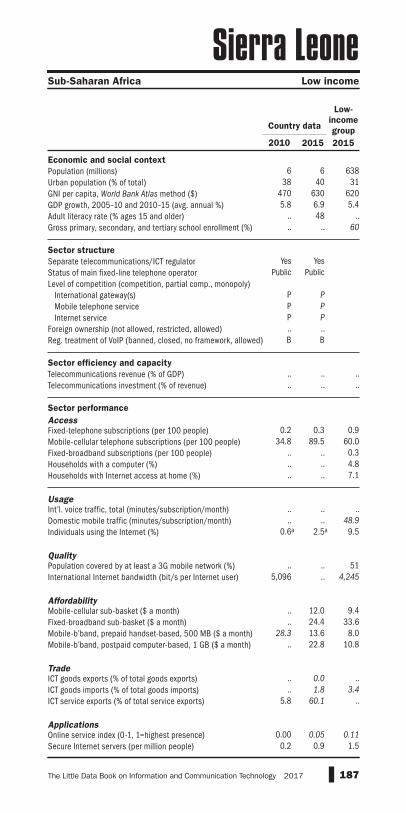
Economic and social contextPopulation (millions)Urban population (% of total)GNI per capita, World Bank Atlas method ($)GDP growth, 2005–10 and 2010–15 (avg. annual %)Adult literacy rate (% ages 15 and older) Gross primary, secondary, and tertiary school enrollment (%)
Sector structureSeparate telecommunications/ICT regulatorStatus of main fixed-line telephone operatorLevel of competition (competition, partial comp., monopoly) International gateway(s) Mobile telephone service Internet serviceForeign ownership (not allowed, restricted, allowed)Reg. treatment of VoIP (banned, closed, no framework, allowed)
Sector efficiency and capacityTelecommunications revenue (% of GDP)Telecommunications investment (% of revenue)
Sector performanceAccessFixed-telephone subscriptions (per 100 people)Mobile-cellular telephone subscriptions (per 100 people)Fixed-broadband subscriptions (per 100 people)Households with a computer (%)Households with Internet access at home (%)
Usage Int’l. voice traffic, total (minutes/subscription/month)Domestic mobile traffic (minutes/subscription/month)Individuals using the Internet (%)
Quality Population covered by at least a 3G mobile network (%)International Internet bandwidth (bit/s per Internet user)
AffordabilityMobile-cellular sub-basket ($ a month)Fixed-broadband sub-basket ($ a month)Mobile-b’band, prepaid handset-based, 500 MB ($ a month)Mobile-b’band, postpaid computer-based, 1 GB ($ a month)
TradeICT goods exports (% of total goods exports)ICT goods imports (% of total goods imports)ICT service exports (% of total service exports)
ApplicationsOnline service index (0-1, 1=highest presence)Secure Internet servers (per million people)
187The Little Data Book on Information and Communication Technology 2017
Sub-Saharan Africa Low income
Sierra Leone
2010 2015 2015
Low-incomegroupCountry data
6 6 63838 40 31
470 630 6205.8 6.9 5.4
.. 48 ..
.. .. 60
Yes YesPublic Public
P PP PP P.. ..B B
.. .. ..
.. .. ..
0.2 0.3 0.934.8 89.5 60.0
.. .. 0.3
.. .. 4.8
.. .. 7.1
.. .. ..
.. .. 48.90.6a 2.5a 9.5
.. .. 515,096 .. 4,245
.. 12.0 9.4
.. 24.4 33.628.3 13.6 8.0
.. 22.8 10.8
.. 0.0 ..
.. 1.8 3.45.8 60.1 ..
0.00 0.05 0.110.2 0.9 1.5

Economic and social contextPopulation (millions)Urban population (% of total)GNI per capita, World Bank Atlas method ($)GDP growth, 2005–10 and 2010–15 (avg. annual %)Adult literacy rate (% ages 15 and older) Gross primary, secondary, and tertiary school enrollment (%)
Sector structureSeparate telecommunications/ICT regulatorStatus of main fixed-line telephone operatorLevel of competition (competition, partial comp., monopoly) International gateway(s) Mobile telephone service Internet serviceForeign ownership (not allowed, restricted, allowed)Reg. treatment of VoIP (banned, closed, no framework, allowed)
Sector efficiency and capacityTelecommunications revenue (% of GDP)Telecommunications investment (% of revenue)
Sector performanceAccessFixed-telephone subscriptions (per 100 people)Mobile-cellular telephone subscriptions (per 100 people)Fixed-broadband subscriptions (per 100 people)Households with a computer (%)Households with Internet access at home (%)
Usage Int’l. voice traffic, total (minutes/subscription/month)Domestic mobile traffic (minutes/subscription/month)Individuals using the Internet (%)
Quality Population covered by at least a 3G mobile network (%)International Internet bandwidth (bit/s per Internet user)
AffordabilityMobile-cellular sub-basket ($ a month)Fixed-broadband sub-basket ($ a month)Mobile-b’band, prepaid handset-based, 500 MB ($ a month)Mobile-b’band, postpaid computer-based, 1 GB ($ a month)
TradeICT goods exports (% of total goods exports)ICT goods imports (% of total goods imports)ICT service exports (% of total service exports)
ApplicationsOnline service index (0-1, 1=highest presence)Secure Internet servers (per million people)
188 2017 The Little Data Book on Information and Communication Technology
East Asia & Pacific High income
Singapore
2010 2015 2015
High-incomegroupCountry data
5 6 1,187100 100 81
44,790 52,090 41,3665.7 4.0 1.596 97 ..
.. .. 95
Yes YesMixed Mixed
C CC CC CA AA A
3.5 3.6 2.5.. .. 18.8
39.3 36.0 41.2145.4 146.1 124.5
26.4 26.5 31.084.0 87.5a 83.282.0 89.5a 85.0
89.1 79.2 .... .. 195.9
71.0 82.1a 81.0
100 100 99172,404 737,006 134,761
8.1 8.0 14.226.7 29.0 25.2
.. 7.3 10.4
.. 14.5 14.4
34.3 30.0 9.527.9 24.5 11.222.9 27.7 32.0
0.69 0.99 0.67529.7 932.1 1,194.6

Economic and social contextPopulation (millions)Urban population (% of total)GNI per capita, World Bank Atlas method ($)GDP growth, 2005–10 and 2010–15 (avg. annual %)Adult literacy rate (% ages 15 and older) Gross primary, secondary, and tertiary school enrollment (%)
Sector structureSeparate telecommunications/ICT regulatorStatus of main fixed-line telephone operatorLevel of competition (competition, partial comp., monopoly) International gateway(s) Mobile telephone service Internet serviceForeign ownership (not allowed, restricted, allowed)Reg. treatment of VoIP (banned, closed, no framework, allowed)
Sector efficiency and capacityTelecommunications revenue (% of GDP)Telecommunications investment (% of revenue)
Sector performanceAccessFixed-telephone subscriptions (per 100 people)Mobile-cellular telephone subscriptions (per 100 people)Fixed-broadband subscriptions (per 100 people)Households with a computer (%)Households with Internet access at home (%)
Usage Int’l. voice traffic, total (minutes/subscription/month)Domestic mobile traffic (minutes/subscription/month)Individuals using the Internet (%)
Quality Population covered by at least a 3G mobile network (%)International Internet bandwidth (bit/s per Internet user)
AffordabilityMobile-cellular sub-basket ($ a month)Fixed-broadband sub-basket ($ a month)Mobile-b’band, prepaid handset-based, 500 MB ($ a month)Mobile-b’band, postpaid computer-based, 1 GB ($ a month)
TradeICT goods exports (% of total goods exports)ICT goods imports (% of total goods imports)ICT service exports (% of total service exports)
ApplicationsOnline service index (0-1, 1=highest presence)Secure Internet servers (per million people)
189The Little Data Book on Information and Communication Technology 2017
Latin America & Caribbean High income
Sint Maarten (Dutch part)
2010 2015 2015
High-incomegroupCountry data
0.04 0.04 1,187100 100 81
.. .. 41,366
.. .. 1.5
.. .. ..
.. .. 95
.. ..
.. ..
.. ..
.. ..
.. ..
.. ..
.. ..
.. .. 2.5
.. .. 18.8
.. .. 41.2155.2 .. 124.5
.. .. 31.0
.. .. 83.2
.. .. 85.0
.. .. ..
.. .. 195.9
.. .. 81.0
.. .. 99
.. .. 134,761
.. .. 14.2
.. .. 25.2
.. .. 10.4
.. .. 14.4
.. .. 9.5
.. .. 11.214.3 13.1 32.0
.. .. 0.67
.. 180.3 1,194.6

Economic and social contextPopulation (millions)Urban population (% of total)GNI per capita, World Bank Atlas method ($)GDP growth, 2005–10 and 2010–15 (avg. annual %)Adult literacy rate (% ages 15 and older) Gross primary, secondary, and tertiary school enrollment (%)
Sector structureSeparate telecommunications/ICT regulatorStatus of main fixed-line telephone operatorLevel of competition (competition, partial comp., monopoly) International gateway(s) Mobile telephone service Internet serviceForeign ownership (not allowed, restricted, allowed)Reg. treatment of VoIP (banned, closed, no framework, allowed)
Sector efficiency and capacityTelecommunications revenue (% of GDP)Telecommunications investment (% of revenue)
Sector performanceAccessFixed-telephone subscriptions (per 100 people)Mobile-cellular telephone subscriptions (per 100 people)Fixed-broadband subscriptions (per 100 people)Households with a computer (%)Households with Internet access at home (%)
Usage Int’l. voice traffic, total (minutes/subscription/month)Domestic mobile traffic (minutes/subscription/month)Individuals using the Internet (%)
Quality Population covered by at least a 3G mobile network (%)International Internet bandwidth (bit/s per Internet user)
AffordabilityMobile-cellular sub-basket ($ a month)Fixed-broadband sub-basket ($ a month)Mobile-b’band, prepaid handset-based, 500 MB ($ a month)Mobile-b’band, postpaid computer-based, 1 GB ($ a month)
TradeICT goods exports (% of total goods exports)ICT goods imports (% of total goods imports)ICT service exports (% of total service exports)
ApplicationsOnline service index (0-1, 1=highest presence)Secure Internet servers (per million people)
190 2017 The Little Data Book on Information and Communication Technology
Europe & Central Asia High income
Slovak Republic
2010 2015 2015
High-incomegroupCountry data
5 5 1,18755 54 81
17,590 17,310 41,3664.4 2.2 1.5
.. .. ..82 82 95
Yes YesMixed Mixed
P CP CC CA AA No
2.9 2.2 2.518.1 18.7 18.8
20.2 15.9 41.2109.0 122.3 124.5
16.1 23.3 31.072.2 85.2a 83.267.5 78.8a 85.0
11.2 13.6 ..113.0 129.6 195.9
75.7 85.0a 81.0
69 93 9912,155 17,240 134,761
38.2 13.4 14.225.9 16.6 25.210.3 7.8 10.421.2 11.1 14.4
19.1 17.6 9.515.6 14.5 11.219.9 29.8 32.0
0.35 0.49 0.67128.5 392.5 1,194.6

Economic and social contextPopulation (millions)Urban population (% of total)GNI per capita, World Bank Atlas method ($)GDP growth, 2005–10 and 2010–15 (avg. annual %)Adult literacy rate (% ages 15 and older) Gross primary, secondary, and tertiary school enrollment (%)
Sector structureSeparate telecommunications/ICT regulatorStatus of main fixed-line telephone operatorLevel of competition (competition, partial comp., monopoly) International gateway(s) Mobile telephone service Internet serviceForeign ownership (not allowed, restricted, allowed)Reg. treatment of VoIP (banned, closed, no framework, allowed)
Sector efficiency and capacityTelecommunications revenue (% of GDP)Telecommunications investment (% of revenue)
Sector performanceAccessFixed-telephone subscriptions (per 100 people)Mobile-cellular telephone subscriptions (per 100 people)Fixed-broadband subscriptions (per 100 people)Households with a computer (%)Households with Internet access at home (%)
Usage Int’l. voice traffic, total (minutes/subscription/month)Domestic mobile traffic (minutes/subscription/month)Individuals using the Internet (%)
Quality Population covered by at least a 3G mobile network (%)International Internet bandwidth (bit/s per Internet user)
AffordabilityMobile-cellular sub-basket ($ a month)Fixed-broadband sub-basket ($ a month)Mobile-b’band, prepaid handset-based, 500 MB ($ a month)Mobile-b’band, postpaid computer-based, 1 GB ($ a month)
TradeICT goods exports (% of total goods exports)ICT goods imports (% of total goods imports)ICT service exports (% of total service exports)
ApplicationsOnline service index (0-1, 1=highest presence)Secure Internet servers (per million people)
191The Little Data Book on Information and Communication Technology 2017
Europe & Central Asia High income
Slovenia
2010 2015 2015
High-incomegroupCountry data
2 2 1,18750 50 81
24,540 22,610 41,3661.5 0.3 1.5
.. 100 ..95 98 95
Yes YesMixed Mixed
C CC CC CA AA A
2.2 2.1 2.518.7 22.9 18.8
44.3 36.2 41.2103.3 113.2 124.5
22.9 27.6 31.070.5 77.8 83.268.1 77.6 85.0
11.2 10.1 ..140.2 142.3 195.9
70.0 73.1 81.0
85 100 9955,634 154,627 134,761
20.8 7.7 14.234.2 21.1 25.215.4 8.9 10.414.1 7.7 14.4
2.2 1.9 9.54.7 3.7 11.2
21.0 22.3 32.0
0.40 0.43 0.67303.6 806.8 1,194.6
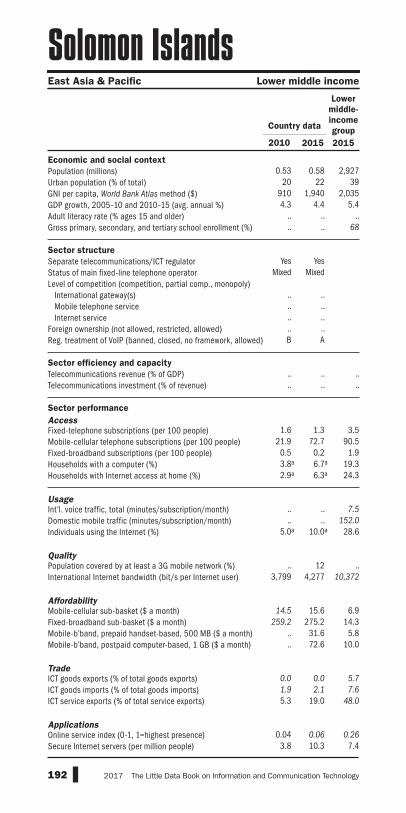
Economic and social contextPopulation (millions)Urban population (% of total)GNI per capita, World Bank Atlas method ($)GDP growth, 2005–10 and 2010–15 (avg. annual %)Adult literacy rate (% ages 15 and older) Gross primary, secondary, and tertiary school enrollment (%)
Sector structureSeparate telecommunications/ICT regulatorStatus of main fixed-line telephone operatorLevel of competition (competition, partial comp., monopoly) International gateway(s) Mobile telephone service Internet serviceForeign ownership (not allowed, restricted, allowed)Reg. treatment of VoIP (banned, closed, no framework, allowed)
Sector efficiency and capacityTelecommunications revenue (% of GDP)Telecommunications investment (% of revenue)
Sector performanceAccessFixed-telephone subscriptions (per 100 people)Mobile-cellular telephone subscriptions (per 100 people)Fixed-broadband subscriptions (per 100 people)Households with a computer (%)Households with Internet access at home (%)
Usage Int’l. voice traffic, total (minutes/subscription/month)Domestic mobile traffic (minutes/subscription/month)Individuals using the Internet (%)
Quality Population covered by at least a 3G mobile network (%)International Internet bandwidth (bit/s per Internet user)
AffordabilityMobile-cellular sub-basket ($ a month)Fixed-broadband sub-basket ($ a month)Mobile-b’band, prepaid handset-based, 500 MB ($ a month)Mobile-b’band, postpaid computer-based, 1 GB ($ a month)
TradeICT goods exports (% of total goods exports)ICT goods imports (% of total goods imports)ICT service exports (% of total service exports)
ApplicationsOnline service index (0-1, 1=highest presence)Secure Internet servers (per million people)
192 2017 The Little Data Book on Information and Communication Technology
East Asia & Pacific Lower middle income
Solomon Islands
2010 2015 2015
Lowermiddle-incomegroupCountry data
0.53 0.58 2,92720 22 39
910 1,940 2,0354.3 4.4 5.4
.. .. ..
.. .. 68
Yes YesMixed Mixed
.. ..
.. ..
.. ..
.. ..B A
.. .. ..
.. .. ..
1.6 1.3 3.521.9 72.7 90.5
0.5 0.2 1.93.8a 6.7a 19.32.9a 6.3a 24.3
.. .. 7.5
.. .. 152.05.0a 10.0a 28.6
.. 12 ..3,799 4,277 10,372
14.5 15.6 6.9259.2 275.2 14.3
.. 31.6 5.8
.. 72.6 10.0
0.0 0.0 5.71.9 2.1 7.65.3 19.0 48.0
0.04 0.06 0.263.8 10.3 7.4
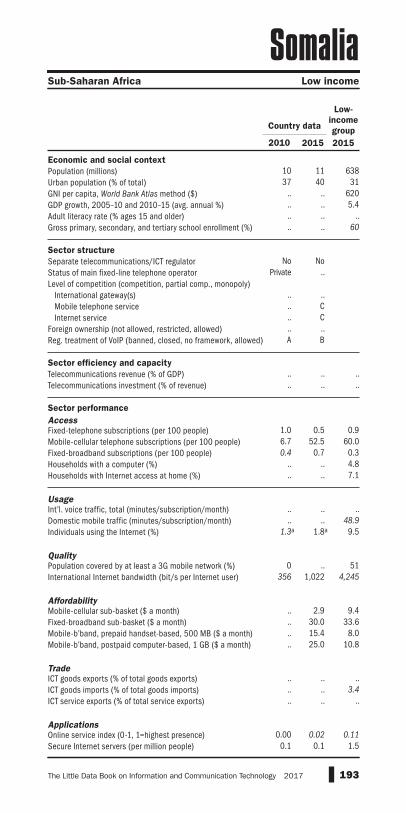
Economic and social contextPopulation (millions)Urban population (% of total)GNI per capita, World Bank Atlas method ($)GDP growth, 2005–10 and 2010–15 (avg. annual %)Adult literacy rate (% ages 15 and older) Gross primary, secondary, and tertiary school enrollment (%)
Sector structureSeparate telecommunications/ICT regulatorStatus of main fixed-line telephone operatorLevel of competition (competition, partial comp., monopoly) International gateway(s) Mobile telephone service Internet serviceForeign ownership (not allowed, restricted, allowed)Reg. treatment of VoIP (banned, closed, no framework, allowed)
Sector efficiency and capacityTelecommunications revenue (% of GDP)Telecommunications investment (% of revenue)
Sector performanceAccessFixed-telephone subscriptions (per 100 people)Mobile-cellular telephone subscriptions (per 100 people)Fixed-broadband subscriptions (per 100 people)Households with a computer (%)Households with Internet access at home (%)
Usage Int’l. voice traffic, total (minutes/subscription/month)Domestic mobile traffic (minutes/subscription/month)Individuals using the Internet (%)
Quality Population covered by at least a 3G mobile network (%)International Internet bandwidth (bit/s per Internet user)
AffordabilityMobile-cellular sub-basket ($ a month)Fixed-broadband sub-basket ($ a month)Mobile-b’band, prepaid handset-based, 500 MB ($ a month)Mobile-b’band, postpaid computer-based, 1 GB ($ a month)
TradeICT goods exports (% of total goods exports)ICT goods imports (% of total goods imports)ICT service exports (% of total service exports)
ApplicationsOnline service index (0-1, 1=highest presence)Secure Internet servers (per million people)
193The Little Data Book on Information and Communication Technology 2017
Sub-Saharan Africa Low income
Somalia
2010 2015 2015
Low-incomegroupCountry data
10 11 63837 40 31
.. .. 620
.. .. 5.4
.. .. ..
.. .. 60
No NoPrivate ..
.. ..
.. C
.. C
.. ..A B
.. .. ..
.. .. ..
1.0 0.5 0.96.7 52.5 60.00.4 0.7 0.3
.. .. 4.8
.. .. 7.1
.. .. ..
.. .. 48.91.3a 1.8a 9.5
0 .. 51356 1,022 4,245
.. 2.9 9.4
.. 30.0 33.6
.. 15.4 8.0
.. 25.0 10.8
.. .. ..
.. .. 3.4
.. .. ..
0.00 0.02 0.110.1 0.1 1.5
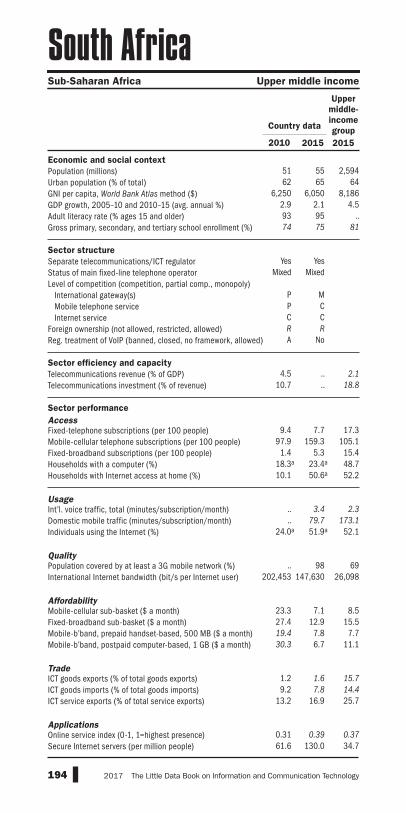
Economic and social contextPopulation (millions)Urban population (% of total)GNI per capita, World Bank Atlas method ($)GDP growth, 2005–10 and 2010–15 (avg. annual %)Adult literacy rate (% ages 15 and older) Gross primary, secondary, and tertiary school enrollment (%)
Sector structureSeparate telecommunications/ICT regulatorStatus of main fixed-line telephone operatorLevel of competition (competition, partial comp., monopoly) International gateway(s) Mobile telephone service Internet serviceForeign ownership (not allowed, restricted, allowed)Reg. treatment of VoIP (banned, closed, no framework, allowed)
Sector efficiency and capacityTelecommunications revenue (% of GDP)Telecommunications investment (% of revenue)
Sector performanceAccessFixed-telephone subscriptions (per 100 people)Mobile-cellular telephone subscriptions (per 100 people)Fixed-broadband subscriptions (per 100 people)Households with a computer (%)Households with Internet access at home (%)
Usage Int’l. voice traffic, total (minutes/subscription/month)Domestic mobile traffic (minutes/subscription/month)Individuals using the Internet (%)
Quality Population covered by at least a 3G mobile network (%)International Internet bandwidth (bit/s per Internet user)
AffordabilityMobile-cellular sub-basket ($ a month)Fixed-broadband sub-basket ($ a month)Mobile-b’band, prepaid handset-based, 500 MB ($ a month)Mobile-b’band, postpaid computer-based, 1 GB ($ a month)
TradeICT goods exports (% of total goods exports)ICT goods imports (% of total goods imports)ICT service exports (% of total service exports)
ApplicationsOnline service index (0-1, 1=highest presence)Secure Internet servers (per million people)
194 2017 The Little Data Book on Information and Communication Technology
Sub-Saharan Africa Upper middle income
South Africa
2010 2015 2015
Uppermiddle-incomegroupCountry data
51 55 2,59462 65 64
6,250 6,050 8,1862.9 2.1 4.593 95 ..74 75 81
Yes YesMixed Mixed
P MP CC CR RA No
4.5 .. 2.110.7 .. 18.8
9.4 7.7 17.397.9 159.3 105.1
1.4 5.3 15.418.3a 23.4a 48.710.1 50.6a 52.2
.. 3.4 2.3
.. 79.7 173.124.0a 51.9a 52.1
.. 98 69202,453 147,630 26,098
23.3 7.1 8.527.4 12.9 15.519.4 7.8 7.730.3 6.7 11.1
1.2 1.6 15.79.2 7.8 14.4
13.2 16.9 25.7
0.31 0.39 0.3761.6 130.0 34.7

Economic and social contextPopulation (millions)Urban population (% of total)GNI per capita, World Bank Atlas method ($)GDP growth, 2005–10 and 2010–15 (avg. annual %)Adult literacy rate (% ages 15 and older) Gross primary, secondary, and tertiary school enrollment (%)
Sector structureSeparate telecommunications/ICT regulatorStatus of main fixed-line telephone operatorLevel of competition (competition, partial comp., monopoly) International gateway(s) Mobile telephone service Internet serviceForeign ownership (not allowed, restricted, allowed)Reg. treatment of VoIP (banned, closed, no framework, allowed)
Sector efficiency and capacityTelecommunications revenue (% of GDP)Telecommunications investment (% of revenue)
Sector performanceAccessFixed-telephone subscriptions (per 100 people)Mobile-cellular telephone subscriptions (per 100 people)Fixed-broadband subscriptions (per 100 people)Households with a computer (%)Households with Internet access at home (%)
Usage Int’l. voice traffic, total (minutes/subscription/month)Domestic mobile traffic (minutes/subscription/month)Individuals using the Internet (%)
Quality Population covered by at least a 3G mobile network (%)International Internet bandwidth (bit/s per Internet user)
AffordabilityMobile-cellular sub-basket ($ a month)Fixed-broadband sub-basket ($ a month)Mobile-b’band, prepaid handset-based, 500 MB ($ a month)Mobile-b’band, postpaid computer-based, 1 GB ($ a month)
TradeICT goods exports (% of total goods exports)ICT goods imports (% of total goods imports)ICT service exports (% of total service exports)
ApplicationsOnline service index (0-1, 1=highest presence)Secure Internet servers (per million people)
195The Little Data Book on Information and Communication Technology 2017
Sub-Saharan Africa Low income
South Sudan
2010 2015 2015
Low-incomegroupCountry data
10 12 63818 19 31
1,060 790 620.. –11.1 5.4
27 32 .... .. 60
No NoMixed ..
.. ..
.. ..
.. ..
.. ..C C
.. 2.9 ..
.. 21.1 ..
0.0 0.0 0.914.4 23.9 60.0
0.0 0.0 0.34.0a 11.7a 4.83.0a 11.2a 7.1
4.3 .. ..6.7 42.1 48.97.0a 17.9a 9.5
.. 20a 514 28 4,245
.. 7.0 9.4
.. 7.7 33.6
.. 20.3 8.0
.. 42.9 10.8
.. .. ..
.. .. 3.4
.. 20.4 ..
0.14 0.01 0.11.. 0.2 1.5

Economic and social contextPopulation (millions)Urban population (% of total)GNI per capita, World Bank Atlas method ($)GDP growth, 2005–10 and 2010–15 (avg. annual %)Adult literacy rate (% ages 15 and older) Gross primary, secondary, and tertiary school enrollment (%)
Sector structureSeparate telecommunications/ICT regulatorStatus of main fixed-line telephone operatorLevel of competition (competition, partial comp., monopoly) International gateway(s) Mobile telephone service Internet serviceForeign ownership (not allowed, restricted, allowed)Reg. treatment of VoIP (banned, closed, no framework, allowed)
Sector efficiency and capacityTelecommunications revenue (% of GDP)Telecommunications investment (% of revenue)
Sector performanceAccessFixed-telephone subscriptions (per 100 people)Mobile-cellular telephone subscriptions (per 100 people)Fixed-broadband subscriptions (per 100 people)Households with a computer (%)Households with Internet access at home (%)
Usage Int’l. voice traffic, total (minutes/subscription/month)Domestic mobile traffic (minutes/subscription/month)Individuals using the Internet (%)
Quality Population covered by at least a 3G mobile network (%)International Internet bandwidth (bit/s per Internet user)
AffordabilityMobile-cellular sub-basket ($ a month)Fixed-broadband sub-basket ($ a month)Mobile-b’band, prepaid handset-based, 500 MB ($ a month)Mobile-b’band, postpaid computer-based, 1 GB ($ a month)
TradeICT goods exports (% of total goods exports)ICT goods imports (% of total goods imports)ICT service exports (% of total service exports)
ApplicationsOnline service index (0-1, 1=highest presence)Secure Internet servers (per million people)
196 2017 The Little Data Book on Information and Communication Technology
Europe & Central Asia High income
Spain
2010 2015 2015
High-incomegroupCountry data
47 46 1,18778 80 81
32,130 28,520 41,3660.9 –0.4 1.598 98 ..
104 109 95
Yes YesPrivate Private
C CC CC CA AA A
2.5 1.8 2.514.7 24.8 18.8
43.7 40.6 41.2111.3 107.9 124.5
23.1 28.3 31.068.7 75.9 83.259.1 78.7 85.0
.. .. ..115.8 130.8 195.9
65.8 78.7 81.0
95 99 9955,944 105,006 134,761
47.0 31.6 14.230.9 26.7 25.237.3 7.8 10.431.1 14.4 14.4
2.2 1.1 9.56.7 4.6 11.2
.. 27.1 32.0
0.77 0.94 0.67230.9 362.5 1,194.6
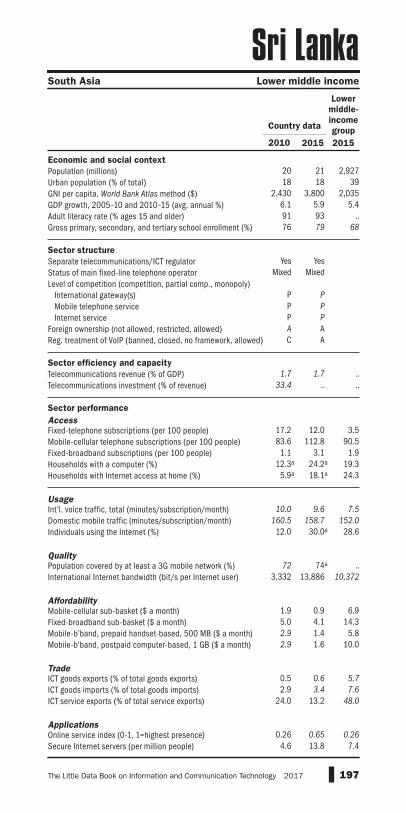
Economic and social contextPopulation (millions)Urban population (% of total)GNI per capita, World Bank Atlas method ($)GDP growth, 2005–10 and 2010–15 (avg. annual %)Adult literacy rate (% ages 15 and older) Gross primary, secondary, and tertiary school enrollment (%)
Sector structureSeparate telecommunications/ICT regulatorStatus of main fixed-line telephone operatorLevel of competition (competition, partial comp., monopoly) International gateway(s) Mobile telephone service Internet serviceForeign ownership (not allowed, restricted, allowed)Reg. treatment of VoIP (banned, closed, no framework, allowed)
Sector efficiency and capacityTelecommunications revenue (% of GDP)Telecommunications investment (% of revenue)
Sector performanceAccessFixed-telephone subscriptions (per 100 people)Mobile-cellular telephone subscriptions (per 100 people)Fixed-broadband subscriptions (per 100 people)Households with a computer (%)Households with Internet access at home (%)
Usage Int’l. voice traffic, total (minutes/subscription/month)Domestic mobile traffic (minutes/subscription/month)Individuals using the Internet (%)
Quality Population covered by at least a 3G mobile network (%)International Internet bandwidth (bit/s per Internet user)
AffordabilityMobile-cellular sub-basket ($ a month)Fixed-broadband sub-basket ($ a month)Mobile-b’band, prepaid handset-based, 500 MB ($ a month)Mobile-b’band, postpaid computer-based, 1 GB ($ a month)
TradeICT goods exports (% of total goods exports)ICT goods imports (% of total goods imports)ICT service exports (% of total service exports)
ApplicationsOnline service index (0-1, 1=highest presence)Secure Internet servers (per million people)
197The Little Data Book on Information and Communication Technology 2017
South Asia Lower middle income
Sri Lanka
2010 2015 2015
Lowermiddle-incomegroupCountry data
20 21 2,92718 18 39
2,430 3,800 2,0356.1 5.9 5.491 93 ..76 79 68
Yes YesMixed Mixed
P PP PP PA AC A
1.7 1.7 ..33.4 .. ..
17.2 12.0 3.583.6 112.8 90.5
1.1 3.1 1.912.3a 24.2a 19.3
5.9a 18.1a 24.3
10.0 9.6 7.5160.5 158.7 152.0
12.0 30.0a 28.6
72 74a ..3,332 13,886 10,372
1.9 0.9 6.95.0 4.1 14.32.9 1.4 5.82.9 1.6 10.0
0.5 0.6 5.72.9 3.4 7.6
24.0 13.2 48.0
0.26 0.65 0.264.6 13.8 7.4

Economic and social contextPopulation (millions)Urban population (% of total)GNI per capita, World Bank Atlas method ($)GDP growth, 2005–10 and 2010–15 (avg. annual %)Adult literacy rate (% ages 15 and older) Gross primary, secondary, and tertiary school enrollment (%)
Sector structureSeparate telecommunications/ICT regulatorStatus of main fixed-line telephone operatorLevel of competition (competition, partial comp., monopoly) International gateway(s) Mobile telephone service Internet serviceForeign ownership (not allowed, restricted, allowed)Reg. treatment of VoIP (banned, closed, no framework, allowed)
Sector efficiency and capacityTelecommunications revenue (% of GDP)Telecommunications investment (% of revenue)
Sector performanceAccessFixed-telephone subscriptions (per 100 people)Mobile-cellular telephone subscriptions (per 100 people)Fixed-broadband subscriptions (per 100 people)Households with a computer (%)Households with Internet access at home (%)
Usage Int’l. voice traffic, total (minutes/subscription/month)Domestic mobile traffic (minutes/subscription/month)Individuals using the Internet (%)
Quality Population covered by at least a 3G mobile network (%)International Internet bandwidth (bit/s per Internet user)
AffordabilityMobile-cellular sub-basket ($ a month)Fixed-broadband sub-basket ($ a month)Mobile-b’band, prepaid handset-based, 500 MB ($ a month)Mobile-b’band, postpaid computer-based, 1 GB ($ a month)
TradeICT goods exports (% of total goods exports)ICT goods imports (% of total goods imports)ICT service exports (% of total service exports)
ApplicationsOnline service index (0-1, 1=highest presence)Secure Internet servers (per million people)
198 2017 The Little Data Book on Information and Communication Technology
Latin America & Caribbean High income
St. Kitts and Nevis
2010 2015 2015
High-incomegroupCountry data
0.05 0.06 1,18732 32 81
12,650 15,560 41,3660.7 3.6 1.5
.. .. ..75 85 95
No YesPrivate Private
.. ..
.. ..
.. ..
.. ..No No
6.2 4.8 2.512.1 6.3 18.8
37.8 35.7 41.2152.8 131.8 124.5
27.9 29.6 31.064.0 70.8a 83.256.5 70.5a 85.0
63.5 .. ..32.3 56.4 195.963.0 75.7a 81.0
.. 100 9981,863 131,203 134,761
15.1 19.0 14.236.7 35.2 25.2
.. 13.7 10.4
.. 14.4 14.4
19.3 .. 9.54.5 .. 11.2
14.7 10.7 32.0
0.10 0.13 0.671,260.7 449.9 1,194.6

Economic and social contextPopulation (millions)Urban population (% of total)GNI per capita, World Bank Atlas method ($)GDP growth, 2005–10 and 2010–15 (avg. annual %)Adult literacy rate (% ages 15 and older) Gross primary, secondary, and tertiary school enrollment (%)
Sector structureSeparate telecommunications/ICT regulatorStatus of main fixed-line telephone operatorLevel of competition (competition, partial comp., monopoly) International gateway(s) Mobile telephone service Internet serviceForeign ownership (not allowed, restricted, allowed)Reg. treatment of VoIP (banned, closed, no framework, allowed)
Sector efficiency and capacityTelecommunications revenue (% of GDP)Telecommunications investment (% of revenue)
Sector performanceAccessFixed-telephone subscriptions (per 100 people)Mobile-cellular telephone subscriptions (per 100 people)Fixed-broadband subscriptions (per 100 people)Households with a computer (%)Households with Internet access at home (%)
Usage Int’l. voice traffic, total (minutes/subscription/month)Domestic mobile traffic (minutes/subscription/month)Individuals using the Internet (%)
Quality Population covered by at least a 3G mobile network (%)International Internet bandwidth (bit/s per Internet user)
AffordabilityMobile-cellular sub-basket ($ a month)Fixed-broadband sub-basket ($ a month)Mobile-b’band, prepaid handset-based, 500 MB ($ a month)Mobile-b’band, postpaid computer-based, 1 GB ($ a month)
TradeICT goods exports (% of total goods exports)ICT goods imports (% of total goods imports)ICT service exports (% of total service exports)
ApplicationsOnline service index (0-1, 1=highest presence)Secure Internet servers (per million people)
199The Little Data Book on Information and Communication Technology 2017
Latin America & Caribbean Upper middle income
St. Lucia
2010 2015 2015
Uppermiddle-incomegroupCountry data
0.18 0.18 2,59418 19 64
6,600 7,390 8,1861.6 0.2 4.5
.. .. ..
.. .. 81
Yes YesPrivate Private
C CC CC CA A
No No
7.3 6.3 2.17.8 20.4 18.8
21.1 18.9 17.3111.7 101.5 105.1
11.6 15.4 15.438.6 41.1a 48.726.5 39.7a 52.2
30.1 .. 2.3102.2 75.1 173.1
43.3 52.4a 52.1
0 65a 6952,075 134,277 26,098
22.2 27.5 8.529.3 36.2 15.5
.. 14.8 7.7
.. 17.0 11.1
4.2 11.7 15.73.9 4.5 14.48.6 7.6 25.7
0.11 0.24 0.37124.0 86.5 34.7

Economic and social contextPopulation (millions)Urban population (% of total)GNI per capita, World Bank Atlas method ($)GDP growth, 2005–10 and 2010–15 (avg. annual %)Adult literacy rate (% ages 15 and older) Gross primary, secondary, and tertiary school enrollment (%)
Sector structureSeparate telecommunications/ICT regulatorStatus of main fixed-line telephone operatorLevel of competition (competition, partial comp., monopoly) International gateway(s) Mobile telephone service Internet serviceForeign ownership (not allowed, restricted, allowed)Reg. treatment of VoIP (banned, closed, no framework, allowed)
Sector efficiency and capacityTelecommunications revenue (% of GDP)Telecommunications investment (% of revenue)
Sector performanceAccessFixed-telephone subscriptions (per 100 people)Mobile-cellular telephone subscriptions (per 100 people)Fixed-broadband subscriptions (per 100 people)Households with a computer (%)Households with Internet access at home (%)
Usage Int’l. voice traffic, total (minutes/subscription/month)Domestic mobile traffic (minutes/subscription/month)Individuals using the Internet (%)
Quality Population covered by at least a 3G mobile network (%)International Internet bandwidth (bit/s per Internet user)
AffordabilityMobile-cellular sub-basket ($ a month)Fixed-broadband sub-basket ($ a month)Mobile-b’band, prepaid handset-based, 500 MB ($ a month)Mobile-b’band, postpaid computer-based, 1 GB ($ a month)
TradeICT goods exports (% of total goods exports)ICT goods imports (% of total goods imports)ICT service exports (% of total service exports)
ApplicationsOnline service index (0-1, 1=highest presence)Secure Internet servers (per million people)
200 2017 The Little Data Book on Information and Communication Technology
Latin America & Caribbean High income
St. Martin (French part)
2010 2015 2015
High-incomegroupCountry data
0.03 0.03 1,187.. .. 81.. .. 41,366.. .. 1.5.. .. .... .. 95
.. ..
.. ..
.. ..
.. ..
.. ..
.. ..
.. ..
.. .. 2.5
.. .. 18.8
.. .. 41.2
.. .. 124.5
.. .. 31.0
.. .. 83.2
.. .. 85.0
.. .. ..
.. .. 195.9
.. .. 81.0
.. .. 99
.. .. 134,761
.. .. 14.2
.. .. 25.2
.. .. 10.4
.. .. 14.4
.. .. 9.5
.. .. 11.2
.. .. 32.0
.. .. 0.6798.0 31.5 1,194.6

Economic and social contextPopulation (millions)Urban population (% of total)GNI per capita, World Bank Atlas method ($)GDP growth, 2005–10 and 2010–15 (avg. annual %)Adult literacy rate (% ages 15 and older) Gross primary, secondary, and tertiary school enrollment (%)
Sector structureSeparate telecommunications/ICT regulatorStatus of main fixed-line telephone operatorLevel of competition (competition, partial comp., monopoly) International gateway(s) Mobile telephone service Internet serviceForeign ownership (not allowed, restricted, allowed)Reg. treatment of VoIP (banned, closed, no framework, allowed)
Sector efficiency and capacityTelecommunications revenue (% of GDP)Telecommunications investment (% of revenue)
Sector performanceAccessFixed-telephone subscriptions (per 100 people)Mobile-cellular telephone subscriptions (per 100 people)Fixed-broadband subscriptions (per 100 people)Households with a computer (%)Households with Internet access at home (%)
Usage Int’l. voice traffic, total (minutes/subscription/month)Domestic mobile traffic (minutes/subscription/month)Individuals using the Internet (%)
Quality Population covered by at least a 3G mobile network (%)International Internet bandwidth (bit/s per Internet user)
AffordabilityMobile-cellular sub-basket ($ a month)Fixed-broadband sub-basket ($ a month)Mobile-b’band, prepaid handset-based, 500 MB ($ a month)Mobile-b’band, postpaid computer-based, 1 GB ($ a month)
TradeICT goods exports (% of total goods exports)ICT goods imports (% of total goods imports)ICT service exports (% of total service exports)
ApplicationsOnline service index (0-1, 1=highest presence)Secure Internet servers (per million people)
201The Little Data Book on Information and Communication Technology 2017
Latin America & Caribbean Upper middle income
St. Vincent and the Grenadines
2010 2015 2015
Uppermiddle-incomegroupCountry data
0.11 0.11 2,59449 51 64
6,030 6,670 8,1861.4 1.0 4.5
.. .. ..
.. .. 81
Yes YesPrivate Private
C CC CC CA A
No No
7.3 6.1 2.18.2 23.1 18.8
19.9 22.7 17.3120.6 103.7 105.1
11.4 15.5 15.450.5a 61.8a 48.737.1a 49.4a 52.2
34.7 31.8 2.382.2 92.0 173.133.7a 51.8a 52.1
0 100 6981,434 194,268 26,098
16.8 25.8 8.533.6 40.4 15.5
.. 14.8 7.7
.. 18.5 11.1
1.4 .. 15.73.7 .. 14.4
26.6 25.1 25.7
0.13 0.16 0.37109.8 210.1 34.7

Economic and social contextPopulation (millions)Urban population (% of total)GNI per capita, World Bank Atlas method ($)GDP growth, 2005–10 and 2010–15 (avg. annual %)Adult literacy rate (% ages 15 and older) Gross primary, secondary, and tertiary school enrollment (%)
Sector structureSeparate telecommunications/ICT regulatorStatus of main fixed-line telephone operatorLevel of competition (competition, partial comp., monopoly) International gateway(s) Mobile telephone service Internet serviceForeign ownership (not allowed, restricted, allowed)Reg. treatment of VoIP (banned, closed, no framework, allowed)
Sector efficiency and capacityTelecommunications revenue (% of GDP)Telecommunications investment (% of revenue)
Sector performanceAccessFixed-telephone subscriptions (per 100 people)Mobile-cellular telephone subscriptions (per 100 people)Fixed-broadband subscriptions (per 100 people)Households with a computer (%)Households with Internet access at home (%)
Usage Int’l. voice traffic, total (minutes/subscription/month)Domestic mobile traffic (minutes/subscription/month)Individuals using the Internet (%)
Quality Population covered by at least a 3G mobile network (%)International Internet bandwidth (bit/s per Internet user)
AffordabilityMobile-cellular sub-basket ($ a month)Fixed-broadband sub-basket ($ a month)Mobile-b’band, prepaid handset-based, 500 MB ($ a month)Mobile-b’band, postpaid computer-based, 1 GB ($ a month)
TradeICT goods exports (% of total goods exports)ICT goods imports (% of total goods imports)ICT service exports (% of total service exports)
ApplicationsOnline service index (0-1, 1=highest presence)Secure Internet servers (per million people)
202 2017 The Little Data Book on Information and Communication Technology
Sub-Saharan Africa Lower middle income
Sudan
2010 2015 2015
Lowermiddle-incomegroupCountry data
36 40 2,92733 34 39
1,200 1,840 2,0357.3 1.2 5.4
.. 59 ..47 48 68
Yes YesMixed Mixed
P PP PC CR A
No C
3.3 1.6 ..291.8 39.7 ..
1.3 0.3 3.541.5 70.5 90.5
0.0 0.1 1.99.0a 17.9a 19.3
15.0a 33.5a 24.3
6.2 6.7 7.555.3 76.9 152.016.7a 26.6a 28.6
42 46 ..1,829 2,189 10,372
7.1 3.2 6.928.6 4.1 14.3
5.6 3.3 5.818.2 9.1 10.0
0.0 .. 5.74.0 .. 7.6
31.0 5.7 48.0
0.16 0.29 0.260.0 0.1 7.4
b
b
b
b
c
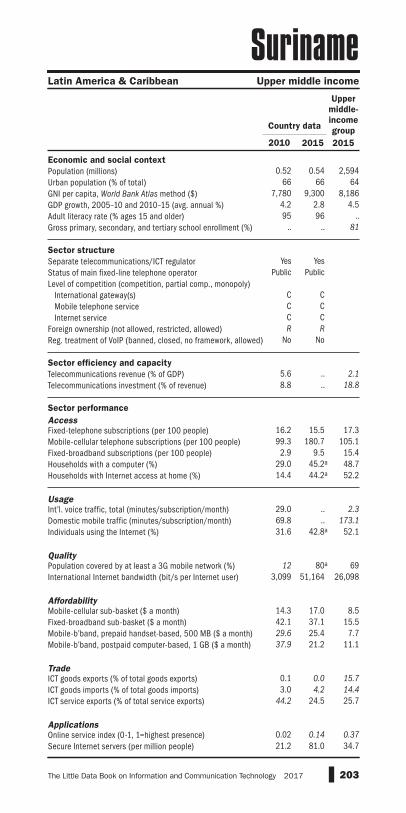
Economic and social contextPopulation (millions)Urban population (% of total)GNI per capita, World Bank Atlas method ($)GDP growth, 2005–10 and 2010–15 (avg. annual %)Adult literacy rate (% ages 15 and older) Gross primary, secondary, and tertiary school enrollment (%)
Sector structureSeparate telecommunications/ICT regulatorStatus of main fixed-line telephone operatorLevel of competition (competition, partial comp., monopoly) International gateway(s) Mobile telephone service Internet serviceForeign ownership (not allowed, restricted, allowed)Reg. treatment of VoIP (banned, closed, no framework, allowed)
Sector efficiency and capacityTelecommunications revenue (% of GDP)Telecommunications investment (% of revenue)
Sector performanceAccessFixed-telephone subscriptions (per 100 people)Mobile-cellular telephone subscriptions (per 100 people)Fixed-broadband subscriptions (per 100 people)Households with a computer (%)Households with Internet access at home (%)
Usage Int’l. voice traffic, total (minutes/subscription/month)Domestic mobile traffic (minutes/subscription/month)Individuals using the Internet (%)
Quality Population covered by at least a 3G mobile network (%)International Internet bandwidth (bit/s per Internet user)
AffordabilityMobile-cellular sub-basket ($ a month)Fixed-broadband sub-basket ($ a month)Mobile-b’band, prepaid handset-based, 500 MB ($ a month)Mobile-b’band, postpaid computer-based, 1 GB ($ a month)
TradeICT goods exports (% of total goods exports)ICT goods imports (% of total goods imports)ICT service exports (% of total service exports)
ApplicationsOnline service index (0-1, 1=highest presence)Secure Internet servers (per million people)
203The Little Data Book on Information and Communication Technology 2017
Latin America & Caribbean Upper middle income
Suriname
2010 2015 2015
Uppermiddle-incomegroupCountry data
0.52 0.54 2,59466 66 64
7,780 9,300 8,1864.2 2.8 4.595 96 ..
.. .. 81
Yes YesPublic Public
C CC CC CR R
No No
5.6 .. 2.18.8 .. 18.8
16.2 15.5 17.399.3 180.7 105.1
2.9 9.5 15.429.0 45.2a 48.714.4 44.2a 52.2
29.0 .. 2.369.8 .. 173.131.6 42.8a 52.1
12 80a 693,099 51,164 26,098
14.3 17.0 8.542.1 37.1 15.529.6 25.4 7.737.9 21.2 11.1
0.1 0.0 15.73.0 4.2 14.4
44.2 24.5 25.7
0.02 0.14 0.3721.2 81.0 34.7

Economic and social contextPopulation (millions)Urban population (% of total)GNI per capita, World Bank Atlas method ($)GDP growth, 2005–10 and 2010–15 (avg. annual %)Adult literacy rate (% ages 15 and older) Gross primary, secondary, and tertiary school enrollment (%)
Sector structureSeparate telecommunications/ICT regulatorStatus of main fixed-line telephone operatorLevel of competition (competition, partial comp., monopoly) International gateway(s) Mobile telephone service Internet serviceForeign ownership (not allowed, restricted, allowed)Reg. treatment of VoIP (banned, closed, no framework, allowed)
Sector efficiency and capacityTelecommunications revenue (% of GDP)Telecommunications investment (% of revenue)
Sector performanceAccessFixed-telephone subscriptions (per 100 people)Mobile-cellular telephone subscriptions (per 100 people)Fixed-broadband subscriptions (per 100 people)Households with a computer (%)Households with Internet access at home (%)
Usage Int’l. voice traffic, total (minutes/subscription/month)Domestic mobile traffic (minutes/subscription/month)Individuals using the Internet (%)
Quality Population covered by at least a 3G mobile network (%)International Internet bandwidth (bit/s per Internet user)
AffordabilityMobile-cellular sub-basket ($ a month)Fixed-broadband sub-basket ($ a month)Mobile-b’band, prepaid handset-based, 500 MB ($ a month)Mobile-b’band, postpaid computer-based, 1 GB ($ a month)
TradeICT goods exports (% of total goods exports)ICT goods imports (% of total goods imports)ICT service exports (% of total service exports)
ApplicationsOnline service index (0-1, 1=highest presence)Secure Internet servers (per million people)
204 2017 The Little Data Book on Information and Communication Technology
Sub-Saharan Africa Lower middle income
Swaziland
2010 2015 2015
Lowermiddle-incomegroupCountry data
1 1 2,92721 21 39
2,600 3,230 2,0352.4 2.4 5.483 87 ..67 67 68
No YesPublic Public
M MM MP P
No NoB B
5.0 .. ..17.5 .. ..
4.4 3.3 3.560.8 73.2 90.5
0.3 0.5 1.98.3a 19.8a 19.36.2a 22.3a 24.3
38.0 .. 7.536.5 .. 152.011.0 30.4a 28.6
0 .. ..1,215 2,053 10,372
25.5 12.1 6.9874.6 49.1 14.3
.. 17.9 5.8
.. 31.3 10.0
.. .. 5.7
.. .. 7.629.0 54.5 48.0
0.00 0.13 0.2610.1 15.5 7.4
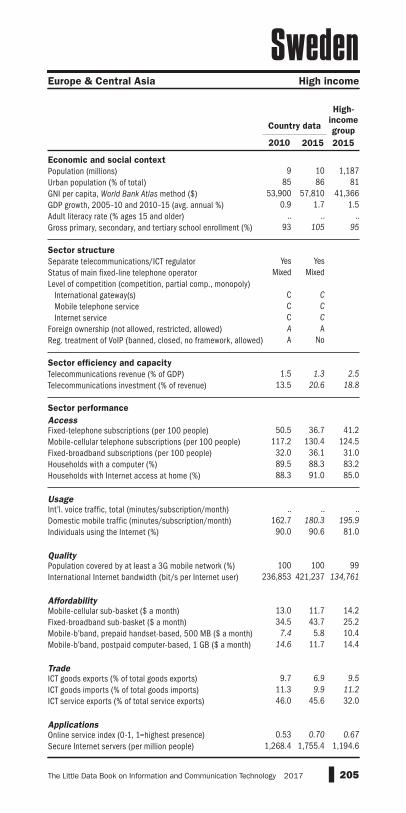
Economic and social contextPopulation (millions)Urban population (% of total)GNI per capita, World Bank Atlas method ($)GDP growth, 2005–10 and 2010–15 (avg. annual %)Adult literacy rate (% ages 15 and older) Gross primary, secondary, and tertiary school enrollment (%)
Sector structureSeparate telecommunications/ICT regulatorStatus of main fixed-line telephone operatorLevel of competition (competition, partial comp., monopoly) International gateway(s) Mobile telephone service Internet serviceForeign ownership (not allowed, restricted, allowed)Reg. treatment of VoIP (banned, closed, no framework, allowed)
Sector efficiency and capacityTelecommunications revenue (% of GDP)Telecommunications investment (% of revenue)
Sector performanceAccessFixed-telephone subscriptions (per 100 people)Mobile-cellular telephone subscriptions (per 100 people)Fixed-broadband subscriptions (per 100 people)Households with a computer (%)Households with Internet access at home (%)
Usage Int’l. voice traffic, total (minutes/subscription/month)Domestic mobile traffic (minutes/subscription/month)Individuals using the Internet (%)
Quality Population covered by at least a 3G mobile network (%)International Internet bandwidth (bit/s per Internet user)
AffordabilityMobile-cellular sub-basket ($ a month)Fixed-broadband sub-basket ($ a month)Mobile-b’band, prepaid handset-based, 500 MB ($ a month)Mobile-b’band, postpaid computer-based, 1 GB ($ a month)
TradeICT goods exports (% of total goods exports)ICT goods imports (% of total goods imports)ICT service exports (% of total service exports)
ApplicationsOnline service index (0-1, 1=highest presence)Secure Internet servers (per million people)
205The Little Data Book on Information and Communication Technology 2017
Europe & Central Asia High income
Sweden
2010 2015 2015
High-incomegroupCountry data
9 10 1,18785 86 81
53,900 57,810 41,3660.9 1.7 1.5
.. .. ..93 105 95
Yes YesMixed Mixed
C CC CC CA AA No
1.5 1.3 2.513.5 20.6 18.8
50.5 36.7 41.2117.2 130.4 124.5
32.0 36.1 31.089.5 88.3 83.288.3 91.0 85.0
.. .. ..162.7 180.3 195.9
90.0 90.6 81.0
100 100 99236,853 421,237 134,761
13.0 11.7 14.234.5 43.7 25.2
7.4 5.8 10.414.6 11.7 14.4
9.7 6.9 9.511.3 9.9 11.246.0 45.6 32.0
0.53 0.70 0.671,268.4 1,755.4 1,194.6

Economic and social contextPopulation (millions)Urban population (% of total)GNI per capita, World Bank Atlas method ($)GDP growth, 2005–10 and 2010–15 (avg. annual %)Adult literacy rate (% ages 15 and older) Gross primary, secondary, and tertiary school enrollment (%)
Sector structureSeparate telecommunications/ICT regulatorStatus of main fixed-line telephone operatorLevel of competition (competition, partial comp., monopoly) International gateway(s) Mobile telephone service Internet serviceForeign ownership (not allowed, restricted, allowed)Reg. treatment of VoIP (banned, closed, no framework, allowed)
Sector efficiency and capacityTelecommunications revenue (% of GDP)Telecommunications investment (% of revenue)
Sector performanceAccessFixed-telephone subscriptions (per 100 people)Mobile-cellular telephone subscriptions (per 100 people)Fixed-broadband subscriptions (per 100 people)Households with a computer (%)Households with Internet access at home (%)
Usage Int’l. voice traffic, total (minutes/subscription/month)Domestic mobile traffic (minutes/subscription/month)Individuals using the Internet (%)
Quality Population covered by at least a 3G mobile network (%)International Internet bandwidth (bit/s per Internet user)
AffordabilityMobile-cellular sub-basket ($ a month)Fixed-broadband sub-basket ($ a month)Mobile-b’band, prepaid handset-based, 500 MB ($ a month)Mobile-b’band, postpaid computer-based, 1 GB ($ a month)
TradeICT goods exports (% of total goods exports)ICT goods imports (% of total goods imports)ICT service exports (% of total service exports)
ApplicationsOnline service index (0-1, 1=highest presence)Secure Internet servers (per million people)
206 2017 The Little Data Book on Information and Communication Technology
Europe & Central Asia High income
Switzerland
2010 2015 2015
High-incomegroupCountry data
8 8 1,18774 74 81
77,360 84,180 41,3662.0 1.5 1.5
.. .. ..86 88 95
Yes YesMixed Mixed
C CC CC CA AA A
2.3 2.3 2.515.2 20.2 18.8
62.7 50.3 41.2123.2 142.0 124.5
37.2 44.8 31.083.7 88.4a 83.280.7 84.7a 85.0
.. .. ..82.3 80.9 195.983.9 88.0 81.0
96 100 99152,211 275,957 134,761
45.2 34.3 14.232.7 35.3 25.222.4 19.7 10.440.5 40.5 14.4
1.6 1.0 9.55.9 4.1 11.2
21.5 29.5 32.0
0.44 0.50 0.671,867.6 3,100.0 1,194.6

Economic and social contextPopulation (millions)Urban population (% of total)GNI per capita, World Bank Atlas method ($)GDP growth, 2005–10 and 2010–15 (avg. annual %)Adult literacy rate (% ages 15 and older) Gross primary, secondary, and tertiary school enrollment (%)
Sector structureSeparate telecommunications/ICT regulatorStatus of main fixed-line telephone operatorLevel of competition (competition, partial comp., monopoly) International gateway(s) Mobile telephone service Internet serviceForeign ownership (not allowed, restricted, allowed)Reg. treatment of VoIP (banned, closed, no framework, allowed)
Sector efficiency and capacityTelecommunications revenue (% of GDP)Telecommunications investment (% of revenue)
Sector performanceAccessFixed-telephone subscriptions (per 100 people)Mobile-cellular telephone subscriptions (per 100 people)Fixed-broadband subscriptions (per 100 people)Households with a computer (%)Households with Internet access at home (%)
Usage Int’l. voice traffic, total (minutes/subscription/month)Domestic mobile traffic (minutes/subscription/month)Individuals using the Internet (%)
Quality Population covered by at least a 3G mobile network (%)International Internet bandwidth (bit/s per Internet user)
AffordabilityMobile-cellular sub-basket ($ a month)Fixed-broadband sub-basket ($ a month)Mobile-b’band, prepaid handset-based, 500 MB ($ a month)Mobile-b’band, postpaid computer-based, 1 GB ($ a month)
TradeICT goods exports (% of total goods exports)ICT goods imports (% of total goods imports)ICT service exports (% of total service exports)
ApplicationsOnline service index (0-1, 1=highest presence)Secure Internet servers (per million people)
207The Little Data Book on Information and Communication Technology 2017
Middle East & North Africa Lower middle income
Syrian Arab Republic
2010 2015 2015
Lowermiddle-incomegroupCountry data
21 19 2,92756 58 39
.. .. 2,035
.. .. 5.4
.. 86 ..73 54 68
No YesPublic Public
.. MP PP ..
No RB B
.. .. ..17.1 5.1 ..
18.9 18.3 3.554.3 62.4 90.5
0.3 3.1 1.940.4a 49.9a 19.335.2a 42.3a 24.3
11.7 13.8 7.583.3 64.6 152.020.7 30.0a 28.6
1 70 ..1,287 3,146 10,372
21.3 95.3 6.921.6 80.2 14.3
.. 267.3 5.889.1 133.6 10.0
0.0 .. 5.72.2 .. 7.62.5 .. 48.0
0.04 0.16 0.260.1 0.9 7.4

Economic and social contextPopulation (millions)Urban population (% of total)GNI per capita, World Bank Atlas method ($)GDP growth, 2005–10 and 2010–15 (avg. annual %)Adult literacy rate (% ages 15 and older) Gross primary, secondary, and tertiary school enrollment (%)
Sector structureSeparate telecommunications/ICT regulatorStatus of main fixed-line telephone operatorLevel of competition (competition, partial comp., monopoly) International gateway(s) Mobile telephone service Internet serviceForeign ownership (not allowed, restricted, allowed)Reg. treatment of VoIP (banned, closed, no framework, allowed)
Sector efficiency and capacityTelecommunications revenue (% of GDP)Telecommunications investment (% of revenue)
Sector performanceAccessFixed-telephone subscriptions (per 100 people)Mobile-cellular telephone subscriptions (per 100 people)Fixed-broadband subscriptions (per 100 people)Households with a computer (%)Households with Internet access at home (%)
Usage Int’l. voice traffic, total (minutes/subscription/month)Domestic mobile traffic (minutes/subscription/month)Individuals using the Internet (%)
Quality Population covered by at least a 3G mobile network (%)International Internet bandwidth (bit/s per Internet user)
AffordabilityMobile-cellular sub-basket ($ a month)Fixed-broadband sub-basket ($ a month)Mobile-b’band, prepaid handset-based, 500 MB ($ a month)Mobile-b’band, postpaid computer-based, 1 GB ($ a month)
TradeICT goods exports (% of total goods exports)ICT goods imports (% of total goods imports)ICT service exports (% of total service exports)
ApplicationsOnline service index (0-1, 1=highest presence)Secure Internet servers (per million people)
208 2017 The Little Data Book on Information and Communication Technology
Europe & Central Asia Lower middle income
Tajikistan
2010 2015 2015
Lowermiddle-incomegroupCountry data
8 8 2,92727 27 39
730 1,240 2,0356.6 6.8 5.4
.. 100 ..69 70 68
No NoMixed Public
.. ..
.. ..
.. ..
.. ..A A
.. .. ..
.. .. ..
4.8 5.3 3.577.9 98.6 90.5
0.1 0.1 1.92.9a 11.5a 19.32.3a 8.8a 24.3
.. .. 7.5
.. .. 152.011.6a 19.0a 28.6
.. .. ..1,249 4,283 10,372
8.5 4.3 6.9362.5 11.2 14.3
15.4 11.1 5.815.4 11.1 10.0
.. .. 5.7
.. .. 7.675.1 6.0 48.0
0.09 0.06 0.260.4 2.8 7.4

Economic and social contextPopulation (millions)Urban population (% of total)GNI per capita, World Bank Atlas method ($)GDP growth, 2005–10 and 2010–15 (avg. annual %)Adult literacy rate (% ages 15 and older) Gross primary, secondary, and tertiary school enrollment (%)
Sector structureSeparate telecommunications/ICT regulatorStatus of main fixed-line telephone operatorLevel of competition (competition, partial comp., monopoly) International gateway(s) Mobile telephone service Internet serviceForeign ownership (not allowed, restricted, allowed)Reg. treatment of VoIP (banned, closed, no framework, allowed)
Sector efficiency and capacityTelecommunications revenue (% of GDP)Telecommunications investment (% of revenue)
Sector performanceAccessFixed-telephone subscriptions (per 100 people)Mobile-cellular telephone subscriptions (per 100 people)Fixed-broadband subscriptions (per 100 people)Households with a computer (%)Households with Internet access at home (%)
Usage Int’l. voice traffic, total (minutes/subscription/month)Domestic mobile traffic (minutes/subscription/month)Individuals using the Internet (%)
Quality Population covered by at least a 3G mobile network (%)International Internet bandwidth (bit/s per Internet user)
AffordabilityMobile-cellular sub-basket ($ a month)Fixed-broadband sub-basket ($ a month)Mobile-b’band, prepaid handset-based, 500 MB ($ a month)Mobile-b’band, postpaid computer-based, 1 GB ($ a month)
TradeICT goods exports (% of total goods exports)ICT goods imports (% of total goods imports)ICT service exports (% of total service exports)
ApplicationsOnline service index (0-1, 1=highest presence)Secure Internet servers (per million people)
209The Little Data Book on Information and Communication Technology 2017
Sub-Saharan Africa Low income
Tanzania
2010 2015 2015
Low-incomegroupCountry data
46 53 63828 32 31
700 910 6206.2 6.8 5.468 80 ..56 52 60
Yes YesMixed Mixed
M CC CC CR AA No
.. .. ..
.. .. ..
0.4 0.3 0.946.7 75.9 60.0
0.0 0.2 0.32.6a 4.0a 4.82.1a 4.5a 7.1
0.7 1.9 ..56.7 108.9 48.9
2.9a 5.4a 9.5
70 85 512,652 4,107 4,245
16.4 6.7 9.431.3 22.6 33.6
5.1 7.5 8.0.. 4.5 10.8
0.4 0.4 ..3.8 3.1 3.4
12.5 10.3 ..
0.17 0.30 0.110.4 2.0 1.5

Economic and social contextPopulation (millions)Urban population (% of total)GNI per capita, World Bank Atlas method ($)GDP growth, 2005–10 and 2010–15 (avg. annual %)Adult literacy rate (% ages 15 and older) Gross primary, secondary, and tertiary school enrollment (%)
Sector structureSeparate telecommunications/ICT regulatorStatus of main fixed-line telephone operatorLevel of competition (competition, partial comp., monopoly) International gateway(s) Mobile telephone service Internet serviceForeign ownership (not allowed, restricted, allowed)Reg. treatment of VoIP (banned, closed, no framework, allowed)
Sector efficiency and capacityTelecommunications revenue (% of GDP)Telecommunications investment (% of revenue)
Sector performanceAccessFixed-telephone subscriptions (per 100 people)Mobile-cellular telephone subscriptions (per 100 people)Fixed-broadband subscriptions (per 100 people)Households with a computer (%)Households with Internet access at home (%)
Usage Int’l. voice traffic, total (minutes/subscription/month)Domestic mobile traffic (minutes/subscription/month)Individuals using the Internet (%)
Quality Population covered by at least a 3G mobile network (%)International Internet bandwidth (bit/s per Internet user)
AffordabilityMobile-cellular sub-basket ($ a month)Fixed-broadband sub-basket ($ a month)Mobile-b’band, prepaid handset-based, 500 MB ($ a month)Mobile-b’band, postpaid computer-based, 1 GB ($ a month)
TradeICT goods exports (% of total goods exports)ICT goods imports (% of total goods imports)ICT service exports (% of total service exports)
ApplicationsOnline service index (0-1, 1=highest presence)Secure Internet servers (per million people)
210 2017 The Little Data Book on Information and Communication Technology
East Asia & Pacific Upper middle income
Thailand
2010 2015 2015
Uppermiddle-incomegroupCountry data
67 68 2,59444 50 64
4,610 5,620 8,1863.3 3.0 4.596 94 ..78 79 81
Yes YesPublic Public
C CC PC CR RA A
2.1 2.3 2.117.3 22.3 18.8
10.3 7.9 17.3108.0 125.8 105.1
4.9 9.2 15.422.8 29.5 48.711.4 52.2 52.2
1.4 1.5 2.343.1 81.2 173.122.4 39.3 52.1
.. 97 6912,791 64,907 26,098
8.7 4.5 8.518.9 18.7 15.5
.. 5.8 7.7
.. 5.8 11.1
18.9 16.0 15.714.2 12.6 14.420.5 15.4 25.7
0.33 0.44 0.3713.7 30.4 34.7

Economic and social contextPopulation (millions)Urban population (% of total)GNI per capita, World Bank Atlas method ($)GDP growth, 2005–10 and 2010–15 (avg. annual %)Adult literacy rate (% ages 15 and older) Gross primary, secondary, and tertiary school enrollment (%)
Sector structureSeparate telecommunications/ICT regulatorStatus of main fixed-line telephone operatorLevel of competition (competition, partial comp., monopoly) International gateway(s) Mobile telephone service Internet serviceForeign ownership (not allowed, restricted, allowed)Reg. treatment of VoIP (banned, closed, no framework, allowed)
Sector efficiency and capacityTelecommunications revenue (% of GDP)Telecommunications investment (% of revenue)
Sector performanceAccessFixed-telephone subscriptions (per 100 people)Mobile-cellular telephone subscriptions (per 100 people)Fixed-broadband subscriptions (per 100 people)Households with a computer (%)Households with Internet access at home (%)
Usage Int’l. voice traffic, total (minutes/subscription/month)Domestic mobile traffic (minutes/subscription/month)Individuals using the Internet (%)
Quality Population covered by at least a 3G mobile network (%)International Internet bandwidth (bit/s per Internet user)
AffordabilityMobile-cellular sub-basket ($ a month)Fixed-broadband sub-basket ($ a month)Mobile-b’band, prepaid handset-based, 500 MB ($ a month)Mobile-b’band, postpaid computer-based, 1 GB ($ a month)
TradeICT goods exports (% of total goods exports)ICT goods imports (% of total goods imports)ICT service exports (% of total service exports)
ApplicationsOnline service index (0-1, 1=highest presence)Secure Internet servers (per million people)
211The Little Data Book on Information and Communication Technology 2017
East Asia & Pacific Lower middle income
Timor-Leste
2010 2015 2015
Lowermiddle-incomegroupCountry data
1 1 2,92730 33 39
2,770 1,920 2,0359.5 5.4 5.458 64 ..82 .. 68
No Yes.. Mixed
.. ..
.. ..
.. ..
.. ..B C
6.1 6.8 ..28.6 .. ..
0.3 0.2 3.543.8 117.4 90.5
0.0 0.1 1.92.0 18.9 19.30.7 21.7 24.3
.. .. 7.536.8 94.5 152.0
0.2a 13.4a 28.6
.. 96 ..25,145 2,546 10,372
16.6 14.0 6.999.0 49.0 14.3
.. 10.0 5.899.0 12.5 10.0
.. 11.0 5.7
.. 6.4 7.6
.. .. 48.0
0.13 0.20 0.260.9 3.2 7.4

Economic and social contextPopulation (millions)Urban population (% of total)GNI per capita, World Bank Atlas method ($)GDP growth, 2005–10 and 2010–15 (avg. annual %)Adult literacy rate (% ages 15 and older) Gross primary, secondary, and tertiary school enrollment (%)
Sector structureSeparate telecommunications/ICT regulatorStatus of main fixed-line telephone operatorLevel of competition (competition, partial comp., monopoly) International gateway(s) Mobile telephone service Internet serviceForeign ownership (not allowed, restricted, allowed)Reg. treatment of VoIP (banned, closed, no framework, allowed)
Sector efficiency and capacityTelecommunications revenue (% of GDP)Telecommunications investment (% of revenue)
Sector performanceAccessFixed-telephone subscriptions (per 100 people)Mobile-cellular telephone subscriptions (per 100 people)Fixed-broadband subscriptions (per 100 people)Households with a computer (%)Households with Internet access at home (%)
Usage Int’l. voice traffic, total (minutes/subscription/month)Domestic mobile traffic (minutes/subscription/month)Individuals using the Internet (%)
Quality Population covered by at least a 3G mobile network (%)International Internet bandwidth (bit/s per Internet user)
AffordabilityMobile-cellular sub-basket ($ a month)Fixed-broadband sub-basket ($ a month)Mobile-b’band, prepaid handset-based, 500 MB ($ a month)Mobile-b’band, postpaid computer-based, 1 GB ($ a month)
TradeICT goods exports (% of total goods exports)ICT goods imports (% of total goods imports)ICT service exports (% of total service exports)
ApplicationsOnline service index (0-1, 1=highest presence)Secure Internet servers (per million people)
212 2017 The Little Data Book on Information and Communication Technology
Sub-Saharan Africa Low income
Togo
2010 2015 2015
Low-incomegroupCountry data
6 7 63838 40 31
450 540 6203.0 5.0 5.460 67 ..72 .. 60
Yes YesPublic Public
P PC CC CR RA No
9.9 8.5 ..30.6 10.1 ..
1.0 0.7 0.941.3 64.9 60.0
0.4 0.9 0.32.1a 3.4a 4.81.0 6.2a 7.1
8.8 6.3 ..21.0 30.8 48.9
3.0a 7.1a 9.5
0 50 517,337 7,310 4,245
20.9 13.3 9.4165.6 37.7 33.6
.. 8.5 8.030.9 8.5 10.8
0.2 0.0 ..5.1 1.3 3.4
23.2 16.0 ..
0.07 0.11 0.111.9 6.3 1.5

Economic and social contextPopulation (millions)Urban population (% of total)GNI per capita, World Bank Atlas method ($)GDP growth, 2005–10 and 2010–15 (avg. annual %)Adult literacy rate (% ages 15 and older) Gross primary, secondary, and tertiary school enrollment (%)
Sector structureSeparate telecommunications/ICT regulatorStatus of main fixed-line telephone operatorLevel of competition (competition, partial comp., monopoly) International gateway(s) Mobile telephone service Internet serviceForeign ownership (not allowed, restricted, allowed)Reg. treatment of VoIP (banned, closed, no framework, allowed)
Sector efficiency and capacityTelecommunications revenue (% of GDP)Telecommunications investment (% of revenue)
Sector performanceAccessFixed-telephone subscriptions (per 100 people)Mobile-cellular telephone subscriptions (per 100 people)Fixed-broadband subscriptions (per 100 people)Households with a computer (%)Households with Internet access at home (%)
Usage Int’l. voice traffic, total (minutes/subscription/month)Domestic mobile traffic (minutes/subscription/month)Individuals using the Internet (%)
Quality Population covered by at least a 3G mobile network (%)International Internet bandwidth (bit/s per Internet user)
AffordabilityMobile-cellular sub-basket ($ a month)Fixed-broadband sub-basket ($ a month)Mobile-b’band, prepaid handset-based, 500 MB ($ a month)Mobile-b’band, postpaid computer-based, 1 GB ($ a month)
TradeICT goods exports (% of total goods exports)ICT goods imports (% of total goods imports)ICT service exports (% of total service exports)
ApplicationsOnline service index (0-1, 1=highest presence)Secure Internet servers (per million people)
213The Little Data Book on Information and Communication Technology 2017
East Asia & Pacific Lower middle income
Tonga
2010 2015 2015
Lowermiddle-incomegroupCountry data
0.10 0.11 2,92723 24 39
3,550 4,260 2,0350.2 0.2 5.499 99 ..
.. .. 68
No NoPublic Public
C CC CC CA AC C
.. .. ..
.. .. ..
29.8 12.4 3.552.2 65.6 90.5
1.1 1.9 1.923.3a 37.1a 19.310.0a 39.5a 24.3
.. .. 7.5
.. .. 152.016.0a 45.0a 28.6
.. 70 ..3,002 14,623 10,372
11.0 11.7 6.962.3 32.2 14.3
.. 8.2 5.8
.. .. 10.0
0.0 0.8 5.76.4 10.2 7.69.4 13.0 48.0
0.07 0.35 0.2619.2 9.4 7.4
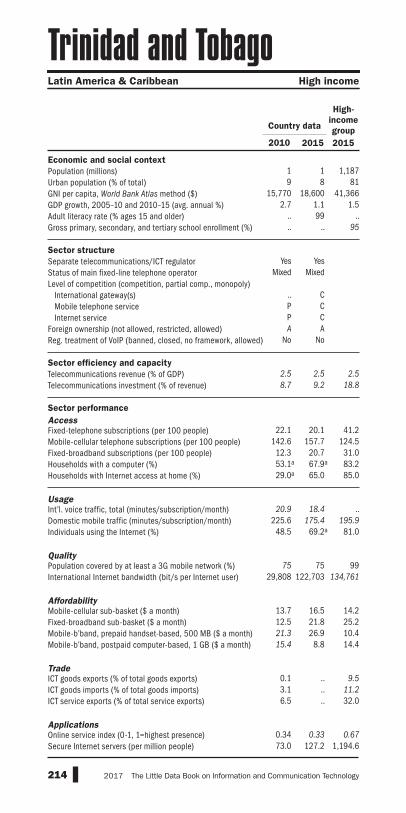
Economic and social contextPopulation (millions)Urban population (% of total)GNI per capita, World Bank Atlas method ($)GDP growth, 2005–10 and 2010–15 (avg. annual %)Adult literacy rate (% ages 15 and older) Gross primary, secondary, and tertiary school enrollment (%)
Sector structureSeparate telecommunications/ICT regulatorStatus of main fixed-line telephone operatorLevel of competition (competition, partial comp., monopoly) International gateway(s) Mobile telephone service Internet serviceForeign ownership (not allowed, restricted, allowed)Reg. treatment of VoIP (banned, closed, no framework, allowed)
Sector efficiency and capacityTelecommunications revenue (% of GDP)Telecommunications investment (% of revenue)
Sector performanceAccessFixed-telephone subscriptions (per 100 people)Mobile-cellular telephone subscriptions (per 100 people)Fixed-broadband subscriptions (per 100 people)Households with a computer (%)Households with Internet access at home (%)
Usage Int’l. voice traffic, total (minutes/subscription/month)Domestic mobile traffic (minutes/subscription/month)Individuals using the Internet (%)
Quality Population covered by at least a 3G mobile network (%)International Internet bandwidth (bit/s per Internet user)
AffordabilityMobile-cellular sub-basket ($ a month)Fixed-broadband sub-basket ($ a month)Mobile-b’band, prepaid handset-based, 500 MB ($ a month)Mobile-b’band, postpaid computer-based, 1 GB ($ a month)
TradeICT goods exports (% of total goods exports)ICT goods imports (% of total goods imports)ICT service exports (% of total service exports)
ApplicationsOnline service index (0-1, 1=highest presence)Secure Internet servers (per million people)
214 2017 The Little Data Book on Information and Communication Technology
Latin America & Caribbean High income
Trinidad and Tobago
2010 2015 2015
High-incomegroupCountry data
1 1 1,1879 8 81
15,770 18,600 41,3662.7 1.1 1.5
.. 99 ..
.. .. 95
Yes YesMixed Mixed
.. CP CP CA A
No No
2.5 2.5 2.58.7 9.2 18.8
22.1 20.1 41.2142.6 157.7 124.5
12.3 20.7 31.053.1a 67.9a 83.229.0a 65.0 85.0
20.9 18.4 ..225.6 175.4 195.9
48.5 69.2a 81.0
75 75 9929,808 122,703 134,761
13.7 16.5 14.212.5 21.8 25.221.3 26.9 10.415.4 8.8 14.4
0.1 .. 9.53.1 .. 11.26.5 .. 32.0
0.34 0.33 0.6773.0 127.2 1,194.6

Economic and social contextPopulation (millions)Urban population (% of total)GNI per capita, World Bank Atlas method ($)GDP growth, 2005–10 and 2010–15 (avg. annual %)Adult literacy rate (% ages 15 and older) Gross primary, secondary, and tertiary school enrollment (%)
Sector structureSeparate telecommunications/ICT regulatorStatus of main fixed-line telephone operatorLevel of competition (competition, partial comp., monopoly) International gateway(s) Mobile telephone service Internet serviceForeign ownership (not allowed, restricted, allowed)Reg. treatment of VoIP (banned, closed, no framework, allowed)
Sector efficiency and capacityTelecommunications revenue (% of GDP)Telecommunications investment (% of revenue)
Sector performanceAccessFixed-telephone subscriptions (per 100 people)Mobile-cellular telephone subscriptions (per 100 people)Fixed-broadband subscriptions (per 100 people)Households with a computer (%)Households with Internet access at home (%)
Usage Int’l. voice traffic, total (minutes/subscription/month)Domestic mobile traffic (minutes/subscription/month)Individuals using the Internet (%)
Quality Population covered by at least a 3G mobile network (%)International Internet bandwidth (bit/s per Internet user)
AffordabilityMobile-cellular sub-basket ($ a month)Fixed-broadband sub-basket ($ a month)Mobile-b’band, prepaid handset-based, 500 MB ($ a month)Mobile-b’band, postpaid computer-based, 1 GB ($ a month)
TradeICT goods exports (% of total goods exports)ICT goods imports (% of total goods imports)ICT service exports (% of total service exports)
ApplicationsOnline service index (0-1, 1=highest presence)Secure Internet servers (per million people)
215The Little Data Book on Information and Communication Technology 2017
Middle East & North Africa Lower middle income
Tunisia
2010 2015 2015
Lowermiddle-incomegroupCountry data
11 11 2,92766 67 39
4,170 3,970 2,0354.6 1.7 5.479 81 ..78 80 68
Yes YesMixed Mixed
P PC CC CR RC A
4.4 3.4 ..21.2 16.5 ..
12.1 8.4 3.5104.5 129.9 90.5
4.5 4.3 1.919.1 38.7a 19.311.4 36.1a 24.3
5.8 5.2 7.561.7 151.8 152.036.8 48.5a 28.6
65 94 ..13,086 33,812 10,372
10.0 3.4 6.910.5 4.2 14.3
3.2 4.6 5.86.4 6.4 10.0
6.5 5.8 5.76.3 5.0 7.68.2 10.1 48.0
0.48 0.64 0.2614.1 13.2 7.4

Economic and social contextPopulation (millions)Urban population (% of total)GNI per capita, World Bank Atlas method ($)GDP growth, 2005–10 and 2010–15 (avg. annual %)Adult literacy rate (% ages 15 and older) Gross primary, secondary, and tertiary school enrollment (%)
Sector structureSeparate telecommunications/ICT regulatorStatus of main fixed-line telephone operatorLevel of competition (competition, partial comp., monopoly) International gateway(s) Mobile telephone service Internet serviceForeign ownership (not allowed, restricted, allowed)Reg. treatment of VoIP (banned, closed, no framework, allowed)
Sector efficiency and capacityTelecommunications revenue (% of GDP)Telecommunications investment (% of revenue)
Sector performanceAccessFixed-telephone subscriptions (per 100 people)Mobile-cellular telephone subscriptions (per 100 people)Fixed-broadband subscriptions (per 100 people)Households with a computer (%)Households with Internet access at home (%)
Usage Int’l. voice traffic, total (minutes/subscription/month)Domestic mobile traffic (minutes/subscription/month)Individuals using the Internet (%)
Quality Population covered by at least a 3G mobile network (%)International Internet bandwidth (bit/s per Internet user)
AffordabilityMobile-cellular sub-basket ($ a month)Fixed-broadband sub-basket ($ a month)Mobile-b’band, prepaid handset-based, 500 MB ($ a month)Mobile-b’band, postpaid computer-based, 1 GB ($ a month)
TradeICT goods exports (% of total goods exports)ICT goods imports (% of total goods imports)ICT service exports (% of total service exports)
ApplicationsOnline service index (0-1, 1=highest presence)Secure Internet servers (per million people)
216 2017 The Little Data Book on Information and Communication Technology
Europe & Central Asia Upper middle income
Turkey
2010 2015 2015
Uppermiddle-incomegroupCountry data
72 79 2,59471 73 64
9,960 9,950 8,1862.3 4.1 4.593 96 ..81 96 81
Yes YesMixed Mixed
.. ..
.. PC C
No ANo No
2.0 1.9 2.117.3 16.8 18.8
22.5 15.0 17.385.6 96.0 105.1
9.8 12.4 15.444.2 55.6 48.741.6 69.5 52.2
5.6 5.8 2.3169.7 237.8 173.1
39.8 53.7 52.1
0 95a 6913,577 59,034 26,098
43.9 18.2 8.519.2 8.8 15.516.2 5.1 7.711.1 7.3 11.1
1.8 1.5 15.74.5 5.1 14.42.0 1.0 25.7
0.35 0.56 0.3799.6 67.1 34.7

Economic and social contextPopulation (millions)Urban population (% of total)GNI per capita, World Bank Atlas method ($)GDP growth, 2005–10 and 2010–15 (avg. annual %)Adult literacy rate (% ages 15 and older) Gross primary, secondary, and tertiary school enrollment (%)
Sector structureSeparate telecommunications/ICT regulatorStatus of main fixed-line telephone operatorLevel of competition (competition, partial comp., monopoly) International gateway(s) Mobile telephone service Internet serviceForeign ownership (not allowed, restricted, allowed)Reg. treatment of VoIP (banned, closed, no framework, allowed)
Sector efficiency and capacityTelecommunications revenue (% of GDP)Telecommunications investment (% of revenue)
Sector performanceAccessFixed-telephone subscriptions (per 100 people)Mobile-cellular telephone subscriptions (per 100 people)Fixed-broadband subscriptions (per 100 people)Households with a computer (%)Households with Internet access at home (%)
Usage Int’l. voice traffic, total (minutes/subscription/month)Domestic mobile traffic (minutes/subscription/month)Individuals using the Internet (%)
Quality Population covered by at least a 3G mobile network (%)International Internet bandwidth (bit/s per Internet user)
AffordabilityMobile-cellular sub-basket ($ a month)Fixed-broadband sub-basket ($ a month)Mobile-b’band, prepaid handset-based, 500 MB ($ a month)Mobile-b’band, postpaid computer-based, 1 GB ($ a month)
TradeICT goods exports (% of total goods exports)ICT goods imports (% of total goods imports)ICT service exports (% of total service exports)
ApplicationsOnline service index (0-1, 1=highest presence)Secure Internet servers (per million people)
217The Little Data Book on Information and Communication Technology 2017
Europe & Central Asia Upper middle income
Turkmenistan
2010 2015 2015
Uppermiddle-incomegroupCountry data
5 5 2,59448 50 64
4,110 7,510 8,18610.5 10.5 4.5
.. 100 ..
.. 61 81
No NoPublic Public
.. ..C C.. .... ..B B
.. .. 2.1
.. .. 18.8
10.3 12.1 17.363.4 145.9 105.1
0.0 0.1 15.47.0a .. 48.74.0a .. 52.2
.. .. 2.3
.. .. 173.13.0a 15.0a 52.1
.. .. 692,578 .. 26,098
.. 4.9 8.5
.. 14.6 15.5
.. 8.6 7.7
.. 15.7 11.1
.. .. 15.7
.. .. 14.4
.. .. 25.7
0.03 0.09 0.370.2 0.7 34.7

Economic and social contextPopulation (millions)Urban population (% of total)GNI per capita, World Bank Atlas method ($)GDP growth, 2005–10 and 2010–15 (avg. annual %)Adult literacy rate (% ages 15 and older) Gross primary, secondary, and tertiary school enrollment (%)
Sector structureSeparate telecommunications/ICT regulatorStatus of main fixed-line telephone operatorLevel of competition (competition, partial comp., monopoly) International gateway(s) Mobile telephone service Internet serviceForeign ownership (not allowed, restricted, allowed)Reg. treatment of VoIP (banned, closed, no framework, allowed)
Sector efficiency and capacityTelecommunications revenue (% of GDP)Telecommunications investment (% of revenue)
Sector performanceAccessFixed-telephone subscriptions (per 100 people)Mobile-cellular telephone subscriptions (per 100 people)Fixed-broadband subscriptions (per 100 people)Households with a computer (%)Households with Internet access at home (%)
Usage Int’l. voice traffic, total (minutes/subscription/month)Domestic mobile traffic (minutes/subscription/month)Individuals using the Internet (%)
Quality Population covered by at least a 3G mobile network (%)International Internet bandwidth (bit/s per Internet user)
AffordabilityMobile-cellular sub-basket ($ a month)Fixed-broadband sub-basket ($ a month)Mobile-b’band, prepaid handset-based, 500 MB ($ a month)Mobile-b’band, postpaid computer-based, 1 GB ($ a month)
TradeICT goods exports (% of total goods exports)ICT goods imports (% of total goods imports)ICT service exports (% of total service exports)
ApplicationsOnline service index (0-1, 1=highest presence)Secure Internet servers (per million people)
218 2017 The Little Data Book on Information and Communication Technology
Latin America & Caribbean High income
Turks and Caicos Islands
2010 2015 2015
High-incomegroupCountry data
0.03 0.03 1,18790 92 81
.. .. 41,366
.. .. 1.5
.. .. ..
.. .. 95
.. ..
.. ..
.. ..
.. ..
.. ..
.. ..
.. ..
.. .. 2.5
.. .. 18.8
11.9 11.6 41.2.. .. 124.5.. .. 31.0.. .. 83.2.. .. 85.0
.. .. ..
.. .. 195.9
.. .. 81.0
.. .. 99
.. .. 134,761
.. .. 14.2
.. .. 25.2
.. .. 10.4
.. .. 14.4
1.7 .. 9.52.6 .. 11.2
.. .. 32.0
.. .. 0.67419.4 291.2 1,194.6

Economic and social contextPopulation (millions)Urban population (% of total)GNI per capita, World Bank Atlas method ($)GDP growth, 2005–10 and 2010–15 (avg. annual %)Adult literacy rate (% ages 15 and older) Gross primary, secondary, and tertiary school enrollment (%)
Sector structureSeparate telecommunications/ICT regulatorStatus of main fixed-line telephone operatorLevel of competition (competition, partial comp., monopoly) International gateway(s) Mobile telephone service Internet serviceForeign ownership (not allowed, restricted, allowed)Reg. treatment of VoIP (banned, closed, no framework, allowed)
Sector efficiency and capacityTelecommunications revenue (% of GDP)Telecommunications investment (% of revenue)
Sector performanceAccessFixed-telephone subscriptions (per 100 people)Mobile-cellular telephone subscriptions (per 100 people)Fixed-broadband subscriptions (per 100 people)Households with a computer (%)Households with Internet access at home (%)
Usage Int’l. voice traffic, total (minutes/subscription/month)Domestic mobile traffic (minutes/subscription/month)Individuals using the Internet (%)
Quality Population covered by at least a 3G mobile network (%)International Internet bandwidth (bit/s per Internet user)
AffordabilityMobile-cellular sub-basket ($ a month)Fixed-broadband sub-basket ($ a month)Mobile-b’band, prepaid handset-based, 500 MB ($ a month)Mobile-b’band, postpaid computer-based, 1 GB ($ a month)
TradeICT goods exports (% of total goods exports)ICT goods imports (% of total goods imports)ICT service exports (% of total service exports)
ApplicationsOnline service index (0-1, 1=highest presence)Secure Internet servers (per million people)
219The Little Data Book on Information and Communication Technology 2017
East Asia & Pacific Upper middle income
Tuvalu
2010 2015 2015
Uppermiddle-incomegroupCountry data
0.01 0.01 2,59455 60 64
4,720 5,720 8,1862.3 2.5 4.5
.. .. ..
.. .. 81
No NoPublic Public
.. ..
.. ..M MR R.. ..
.. .. 2.1
.. .. 18.8
12.2 20.2 17.316.3 40.3 105.1
2.4 10.1 15.418.3a .. 48.714.0a .. 52.2
.. .. 2.3
.. .. 173.125.0a 42.7a 52.1
.. .. 691,628 .. 26,098
.. 38.1 8.5
.. 40.2 15.5
.. .. 7.7
.. .. 11.1
.. .. 15.7
.. .. 14.410.3 10.7 25.7
0.01 0.04 0.37102.2 .. 34.7

Economic and social contextPopulation (millions)Urban population (% of total)GNI per capita, World Bank Atlas method ($)GDP growth, 2005–10 and 2010–15 (avg. annual %)Adult literacy rate (% ages 15 and older) Gross primary, secondary, and tertiary school enrollment (%)
Sector structureSeparate telecommunications/ICT regulatorStatus of main fixed-line telephone operatorLevel of competition (competition, partial comp., monopoly) International gateway(s) Mobile telephone service Internet serviceForeign ownership (not allowed, restricted, allowed)Reg. treatment of VoIP (banned, closed, no framework, allowed)
Sector efficiency and capacityTelecommunications revenue (% of GDP)Telecommunications investment (% of revenue)
Sector performanceAccessFixed-telephone subscriptions (per 100 people)Mobile-cellular telephone subscriptions (per 100 people)Fixed-broadband subscriptions (per 100 people)Households with a computer (%)Households with Internet access at home (%)
Usage Int’l. voice traffic, total (minutes/subscription/month)Domestic mobile traffic (minutes/subscription/month)Individuals using the Internet (%)
Quality Population covered by at least a 3G mobile network (%)International Internet bandwidth (bit/s per Internet user)
AffordabilityMobile-cellular sub-basket ($ a month)Fixed-broadband sub-basket ($ a month)Mobile-b’band, prepaid handset-based, 500 MB ($ a month)Mobile-b’band, postpaid computer-based, 1 GB ($ a month)
TradeICT goods exports (% of total goods exports)ICT goods imports (% of total goods imports)ICT service exports (% of total service exports)
ApplicationsOnline service index (0-1, 1=highest presence)Secure Internet servers (per million people)
220 2017 The Little Data Book on Information and Communication Technology
Sub-Saharan Africa Low income
Uganda
2010 2015 2015
Low-incomegroupCountry data
33 39 63814 16 31
550 670 6208.1 5.0 5.473 74 ..67 .. 60
Yes YesMixed Mixed
C CC CC CA AA No
3.1 .. ..15.9 .. ..
1.0 0.8 0.937.7 50.4 60.0
0.0 0.3 0.32.2a 6.7a 4.81.9a 7.2a 7.1
.. .. ..65.2 60.9 48.912.5 19.2a 9.5
42 45 51849 4,633 4,245
13.4 6.1 9.416.3 300.0 33.610.0 6.2 8.0
.. 10.8 10.8
5.7 0.7 ..7.4 4.3 3.4
13.0 18.2 ..
0.10 0.15 0.110.9 1.9 1.5

Economic and social contextPopulation (millions)Urban population (% of total)GNI per capita, World Bank Atlas method ($)GDP growth, 2005–10 and 2010–15 (avg. annual %)Adult literacy rate (% ages 15 and older) Gross primary, secondary, and tertiary school enrollment (%)
Sector structureSeparate telecommunications/ICT regulatorStatus of main fixed-line telephone operatorLevel of competition (competition, partial comp., monopoly) International gateway(s) Mobile telephone service Internet serviceForeign ownership (not allowed, restricted, allowed)Reg. treatment of VoIP (banned, closed, no framework, allowed)
Sector efficiency and capacityTelecommunications revenue (% of GDP)Telecommunications investment (% of revenue)
Sector performanceAccessFixed-telephone subscriptions (per 100 people)Mobile-cellular telephone subscriptions (per 100 people)Fixed-broadband subscriptions (per 100 people)Households with a computer (%)Households with Internet access at home (%)
Usage Int’l. voice traffic, total (minutes/subscription/month)Domestic mobile traffic (minutes/subscription/month)Individuals using the Internet (%)
Quality Population covered by at least a 3G mobile network (%)International Internet bandwidth (bit/s per Internet user)
AffordabilityMobile-cellular sub-basket ($ a month)Fixed-broadband sub-basket ($ a month)Mobile-b’band, prepaid handset-based, 500 MB ($ a month)Mobile-b’band, postpaid computer-based, 1 GB ($ a month)
TradeICT goods exports (% of total goods exports)ICT goods imports (% of total goods imports)ICT service exports (% of total service exports)
ApplicationsOnline service index (0-1, 1=highest presence)Secure Internet servers (per million people)
221The Little Data Book on Information and Communication Technology 2017
Europe & Central Asia Lower middle income
Ukraine
2010 2015 2015
Lowermiddle-incomegroupCountry data
46 45 2,92769 70 39
2,990 2,620 2,0350.3 –2.3 5.4
.. 100 ..94 96 68
Yes YesPublic Mixed
C CC CC CA AA No
4.0 2.6 ..13.6 13.7 ..
28.1 21.6 3.5117.1 144.0 90.5
6.4 11.8 1.925.2 59.2a 19.322.2 51.1a 24.3
.. .. 7.5
.. .. 152.023.3 49.3a 28.6
1 35a ..14,912 45,743 10,372
6.5 3.0 6.97.6 2.7 14.3
.. 2.5 5.8
.. 2.7 10.0
1.1 1.0 5.73.2 3.6 7.6
17.3 31.6 48.0
0.35 0.27 0.2613.2 65.5 7.4

Economic and social contextPopulation (millions)Urban population (% of total)GNI per capita, World Bank Atlas method ($)GDP growth, 2005–10 and 2010–15 (avg. annual %)Adult literacy rate (% ages 15 and older) Gross primary, secondary, and tertiary school enrollment (%)
Sector structureSeparate telecommunications/ICT regulatorStatus of main fixed-line telephone operatorLevel of competition (competition, partial comp., monopoly) International gateway(s) Mobile telephone service Internet serviceForeign ownership (not allowed, restricted, allowed)Reg. treatment of VoIP (banned, closed, no framework, allowed)
Sector efficiency and capacityTelecommunications revenue (% of GDP)Telecommunications investment (% of revenue)
Sector performanceAccessFixed-telephone subscriptions (per 100 people)Mobile-cellular telephone subscriptions (per 100 people)Fixed-broadband subscriptions (per 100 people)Households with a computer (%)Households with Internet access at home (%)
Usage Int’l. voice traffic, total (minutes/subscription/month)Domestic mobile traffic (minutes/subscription/month)Individuals using the Internet (%)
Quality Population covered by at least a 3G mobile network (%)International Internet bandwidth (bit/s per Internet user)
AffordabilityMobile-cellular sub-basket ($ a month)Fixed-broadband sub-basket ($ a month)Mobile-b’band, prepaid handset-based, 500 MB ($ a month)Mobile-b’band, postpaid computer-based, 1 GB ($ a month)
TradeICT goods exports (% of total goods exports)ICT goods imports (% of total goods imports)ICT service exports (% of total service exports)
ApplicationsOnline service index (0-1, 1=highest presence)Secure Internet servers (per million people)
222 2017 The Little Data Book on Information and Communication Technology
Middle East & North Africa High income
United Arab Emirates
2010 2015 2015
High-incomegroupCountry data
8 9 1,18784 86 81
34,140 43,170 41,3661.9 4.9 1.590 93 ..
.. .. 95
Yes YesMixed Mixed
P PP PP PR AB C
2.4 2.3 2.530.8 15.7 18.8
17.5 23.1 41.2129.4 187.3 124.5
9.3 12.8 31.076.0 89.3a 83.265.0 95.4a 85.0
53.1 52.9 ..128.0 95.7 195.9
68.0 91.2a 81.0
100 100 9918,309 107,904 134,761
8.6 6.7 14.240.6 40.6 25.227.0 16.3 10.439.5 27.0 14.4
2.0 .. 9.54.5 .. 11.2
.. .. 32.0
0.25 0.88 0.67137.5 354.7 1,194.6

Economic and social contextPopulation (millions)Urban population (% of total)GNI per capita, World Bank Atlas method ($)GDP growth, 2005–10 and 2010–15 (avg. annual %)Adult literacy rate (% ages 15 and older) Gross primary, secondary, and tertiary school enrollment (%)
Sector structureSeparate telecommunications/ICT regulatorStatus of main fixed-line telephone operatorLevel of competition (competition, partial comp., monopoly) International gateway(s) Mobile telephone service Internet serviceForeign ownership (not allowed, restricted, allowed)Reg. treatment of VoIP (banned, closed, no framework, allowed)
Sector efficiency and capacityTelecommunications revenue (% of GDP)Telecommunications investment (% of revenue)
Sector performanceAccessFixed-telephone subscriptions (per 100 people)Mobile-cellular telephone subscriptions (per 100 people)Fixed-broadband subscriptions (per 100 people)Households with a computer (%)Households with Internet access at home (%)
Usage Int’l. voice traffic, total (minutes/subscription/month)Domestic mobile traffic (minutes/subscription/month)Individuals using the Internet (%)
Quality Population covered by at least a 3G mobile network (%)International Internet bandwidth (bit/s per Internet user)
AffordabilityMobile-cellular sub-basket ($ a month)Fixed-broadband sub-basket ($ a month)Mobile-b’band, prepaid handset-based, 500 MB ($ a month)Mobile-b’band, postpaid computer-based, 1 GB ($ a month)
TradeICT goods exports (% of total goods exports)ICT goods imports (% of total goods imports)ICT service exports (% of total service exports)
ApplicationsOnline service index (0-1, 1=highest presence)Secure Internet servers (per million people)
223The Little Data Book on Information and Communication Technology 2017
Europe & Central Asia High income
United Kingdom
2010 2015 2015
High-incomegroupCountry data
63 65 1,18781 83 81
40,480 43,340 41,3660.1 2.1 1.5
.. .. ..90 100 95
Yes YesPrivate Private
.. ..C C.. CA AA A
2.0 1.7 2.511.5 .. 18.8
53.8 52.6 41.2123.6 125.8 124.5
30.9 37.7 31.082.6 89.9 83.279.6 91.3 85.0
.. .. ..135.4 145.9 195.9
85.0 92.0 81.0
95 99 99132,685 374,554 134,761
34.9 15.3 14.224.6 15.3 25.2
9.5 9.2 10.416.1 15.3 14.4
5.8 4.2 9.59.5 7.8 11.2
34.5 38.3 32.0
0.77 0.90 0.671,384.1 1,382.6 1,194.6
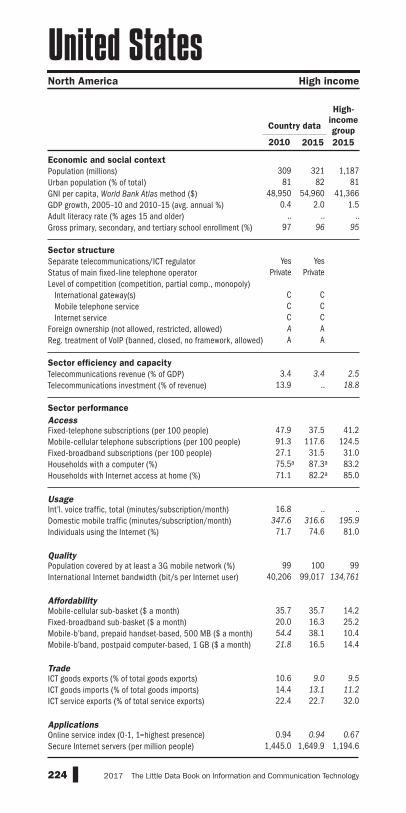
Economic and social contextPopulation (millions)Urban population (% of total)GNI per capita, World Bank Atlas method ($)GDP growth, 2005–10 and 2010–15 (avg. annual %)Adult literacy rate (% ages 15 and older) Gross primary, secondary, and tertiary school enrollment (%)
Sector structureSeparate telecommunications/ICT regulatorStatus of main fixed-line telephone operatorLevel of competition (competition, partial comp., monopoly) International gateway(s) Mobile telephone service Internet serviceForeign ownership (not allowed, restricted, allowed)Reg. treatment of VoIP (banned, closed, no framework, allowed)
Sector efficiency and capacityTelecommunications revenue (% of GDP)Telecommunications investment (% of revenue)
Sector performanceAccessFixed-telephone subscriptions (per 100 people)Mobile-cellular telephone subscriptions (per 100 people)Fixed-broadband subscriptions (per 100 people)Households with a computer (%)Households with Internet access at home (%)
Usage Int’l. voice traffic, total (minutes/subscription/month)Domestic mobile traffic (minutes/subscription/month)Individuals using the Internet (%)
Quality Population covered by at least a 3G mobile network (%)International Internet bandwidth (bit/s per Internet user)
AffordabilityMobile-cellular sub-basket ($ a month)Fixed-broadband sub-basket ($ a month)Mobile-b’band, prepaid handset-based, 500 MB ($ a month)Mobile-b’band, postpaid computer-based, 1 GB ($ a month)
TradeICT goods exports (% of total goods exports)ICT goods imports (% of total goods imports)ICT service exports (% of total service exports)
ApplicationsOnline service index (0-1, 1=highest presence)Secure Internet servers (per million people)
224 2017 The Little Data Book on Information and Communication Technology
North America High income
United States
2010 2015 2015
High-incomegroupCountry data
309 321 1,18781 82 81
48,950 54,960 41,3660.4 2.0 1.5
.. .. ..97 96 95
Yes YesPrivate Private
C CC CC CA AA A
3.4 3.4 2.513.9 .. 18.8
47.9 37.5 41.291.3 117.6 124.527.1 31.5 31.075.5a 87.3a 83.271.1 82.2a 85.0
16.8 .. ..347.6 316.6 195.9
71.7 74.6 81.0
99 100 9940,206 99,017 134,761
35.7 35.7 14.220.0 16.3 25.254.4 38.1 10.421.8 16.5 14.4
10.6 9.0 9.514.4 13.1 11.222.4 22.7 32.0
0.94 0.94 0.671,445.0 1,649.9 1,194.6

Economic and social contextPopulation (millions)Urban population (% of total)GNI per capita, World Bank Atlas method ($)GDP growth, 2005–10 and 2010–15 (avg. annual %)Adult literacy rate (% ages 15 and older) Gross primary, secondary, and tertiary school enrollment (%)
Sector structureSeparate telecommunications/ICT regulatorStatus of main fixed-line telephone operatorLevel of competition (competition, partial comp., monopoly) International gateway(s) Mobile telephone service Internet serviceForeign ownership (not allowed, restricted, allowed)Reg. treatment of VoIP (banned, closed, no framework, allowed)
Sector efficiency and capacityTelecommunications revenue (% of GDP)Telecommunications investment (% of revenue)
Sector performanceAccessFixed-telephone subscriptions (per 100 people)Mobile-cellular telephone subscriptions (per 100 people)Fixed-broadband subscriptions (per 100 people)Households with a computer (%)Households with Internet access at home (%)
Usage Int’l. voice traffic, total (minutes/subscription/month)Domestic mobile traffic (minutes/subscription/month)Individuals using the Internet (%)
Quality Population covered by at least a 3G mobile network (%)International Internet bandwidth (bit/s per Internet user)
AffordabilityMobile-cellular sub-basket ($ a month)Fixed-broadband sub-basket ($ a month)Mobile-b’band, prepaid handset-based, 500 MB ($ a month)Mobile-b’band, postpaid computer-based, 1 GB ($ a month)
TradeICT goods exports (% of total goods exports)ICT goods imports (% of total goods imports)ICT service exports (% of total service exports)
ApplicationsOnline service index (0-1, 1=highest presence)Secure Internet servers (per million people)
225The Little Data Book on Information and Communication Technology 2017
Latin America & Caribbean High income
Uruguay
2010 2015 2015
High-incomegroupCountry data
3 3 1,18794 95 81
10,390 15,720 41,3666.0 3.6 1.598 98 ..90 .. 95
Yes YesPublic Public
.. ..C CP C.. ..
No No
2.9 2.4 2.550.1 47.9 18.8
28.5 32.3 41.2131.6 160.2 124.5
11.4 26.3 31.053.4 68.0 83.233.5 59.7 85.0
6.4 4.5 ..89.5 92.7 195.946.4 64.6 81.0
.. 90a 9924,115 73,151 134,761
21.4 17.0 14.219.3 17.9 25.2
9.9 3.7 10.49.8 8.0 14.4
0.0 0.1 9.55.6 6.9 11.2
19.1 24.3 32.0
0.48 0.85 0.6744.7 106.7 1,194.6

Economic and social contextPopulation (millions)Urban population (% of total)GNI per capita, World Bank Atlas method ($)GDP growth, 2005–10 and 2010–15 (avg. annual %)Adult literacy rate (% ages 15 and older) Gross primary, secondary, and tertiary school enrollment (%)
Sector structureSeparate telecommunications/ICT regulatorStatus of main fixed-line telephone operatorLevel of competition (competition, partial comp., monopoly) International gateway(s) Mobile telephone service Internet serviceForeign ownership (not allowed, restricted, allowed)Reg. treatment of VoIP (banned, closed, no framework, allowed)
Sector efficiency and capacityTelecommunications revenue (% of GDP)Telecommunications investment (% of revenue)
Sector performanceAccessFixed-telephone subscriptions (per 100 people)Mobile-cellular telephone subscriptions (per 100 people)Fixed-broadband subscriptions (per 100 people)Households with a computer (%)Households with Internet access at home (%)
Usage Int’l. voice traffic, total (minutes/subscription/month)Domestic mobile traffic (minutes/subscription/month)Individuals using the Internet (%)
Quality Population covered by at least a 3G mobile network (%)International Internet bandwidth (bit/s per Internet user)
AffordabilityMobile-cellular sub-basket ($ a month)Fixed-broadband sub-basket ($ a month)Mobile-b’band, prepaid handset-based, 500 MB ($ a month)Mobile-b’band, postpaid computer-based, 1 GB ($ a month)
TradeICT goods exports (% of total goods exports)ICT goods imports (% of total goods imports)ICT service exports (% of total service exports)
ApplicationsOnline service index (0-1, 1=highest presence)Secure Internet servers (per million people)
226 2017 The Little Data Book on Information and Communication Technology
Europe & Central Asia Lower middle income
Uzbekistan
2010 2015 2015
Lowermiddle-incomegroupCountry data
29 31 2,92736 36 39
1,300 2,150 2,0358.7 8.1 5.4
.. 100 ..68 .. 68
No NoPublic Public
.. ..C C.. .... ..
No No
2.9 2.2 ..17.3 24.3 ..
6.8 8.4 3.575.5 73.3 90.5
0.4 3.6 1.917.0a 43.2 19.321.0a 52.6a 24.3
22.1 9.4 7.5154.3 48.2 152.0
15.9a 42.8a 28.6
40 44 ..580 2,075 10,372
3.4 4.5 6.9200.0 6.6 14.3
6.0 10.0 5.86.3 10.0 10.0
.. .. 5.7
.. .. 7.6
.. .. 48.0
0.38 0.45 0.260.2 2.7 7.4

Economic and social contextPopulation (millions)Urban population (% of total)GNI per capita, World Bank Atlas method ($)GDP growth, 2005–10 and 2010–15 (avg. annual %)Adult literacy rate (% ages 15 and older) Gross primary, secondary, and tertiary school enrollment (%)
Sector structureSeparate telecommunications/ICT regulatorStatus of main fixed-line telephone operatorLevel of competition (competition, partial comp., monopoly) International gateway(s) Mobile telephone service Internet serviceForeign ownership (not allowed, restricted, allowed)Reg. treatment of VoIP (banned, closed, no framework, allowed)
Sector efficiency and capacityTelecommunications revenue (% of GDP)Telecommunications investment (% of revenue)
Sector performanceAccessFixed-telephone subscriptions (per 100 people)Mobile-cellular telephone subscriptions (per 100 people)Fixed-broadband subscriptions (per 100 people)Households with a computer (%)Households with Internet access at home (%)
Usage Int’l. voice traffic, total (minutes/subscription/month)Domestic mobile traffic (minutes/subscription/month)Individuals using the Internet (%)
Quality Population covered by at least a 3G mobile network (%)International Internet bandwidth (bit/s per Internet user)
AffordabilityMobile-cellular sub-basket ($ a month)Fixed-broadband sub-basket ($ a month)Mobile-b’band, prepaid handset-based, 500 MB ($ a month)Mobile-b’band, postpaid computer-based, 1 GB ($ a month)
TradeICT goods exports (% of total goods exports)ICT goods imports (% of total goods imports)ICT service exports (% of total service exports)
ApplicationsOnline service index (0-1, 1=highest presence)Secure Internet servers (per million people)
227The Little Data Book on Information and Communication Technology 2017
East Asia & Pacific Lower middle income
Vanuatu
2010 2015 2015
Lowermiddle-incomegroupCountry data
0.24 0.26 2,92725 26 39
2,690 3,160 2,0355.0 1.8 5.4
.. 85 ..
.. .. 68
Yes YesMixed Private
C CC CC CR A
No No
5.1 4.8 ..36.5 .. ..
3.0 1.8 3.571.9 66.2 90.5
0.2 1.6 1.98.7a 24.8a 19.35.4a 34.5a 24.3
.. .. 7.573.6 .. 152.0
8.0 22.4a 28.6
23 51a ..2,804 8,477 10,372
23.3 21.9 6.9171.0 54.9 14.3
.. 7.8 5.8
.. 36.9 10.0
0.4 .. 5.75.4 .. 7.64.1 2.8 48.0
0.01 0.08 0.26215.8 71.8 7.4

Economic and social contextPopulation (millions)Urban population (% of total)GNI per capita, World Bank Atlas method ($)GDP growth, 2005–10 and 2010–15 (avg. annual %)Adult literacy rate (% ages 15 and older) Gross primary, secondary, and tertiary school enrollment (%)
Sector structureSeparate telecommunications/ICT regulatorStatus of main fixed-line telephone operatorLevel of competition (competition, partial comp., monopoly) International gateway(s) Mobile telephone service Internet serviceForeign ownership (not allowed, restricted, allowed)Reg. treatment of VoIP (banned, closed, no framework, allowed)
Sector efficiency and capacityTelecommunications revenue (% of GDP)Telecommunications investment (% of revenue)
Sector performanceAccessFixed-telephone subscriptions (per 100 people)Mobile-cellular telephone subscriptions (per 100 people)Fixed-broadband subscriptions (per 100 people)Households with a computer (%)Households with Internet access at home (%)
Usage Int’l. voice traffic, total (minutes/subscription/month)Domestic mobile traffic (minutes/subscription/month)Individuals using the Internet (%)
Quality Population covered by at least a 3G mobile network (%)International Internet bandwidth (bit/s per Internet user)
AffordabilityMobile-cellular sub-basket ($ a month)Fixed-broadband sub-basket ($ a month)Mobile-b’band, prepaid handset-based, 500 MB ($ a month)Mobile-b’band, postpaid computer-based, 1 GB ($ a month)
TradeICT goods exports (% of total goods exports)ICT goods imports (% of total goods imports)ICT service exports (% of total service exports)
ApplicationsOnline service index (0-1, 1=highest presence)Secure Internet servers (per million people)
228 2017 The Little Data Book on Information and Communication Technology
Latin America & Caribbean Upper middle income
Venezuela, RB
2010 2015 2015
Uppermiddle-incomegroupCountry data
29 31 2,59489 89 64
11,530 11,780 8,1863.7 0.4 4.595 95 ..88 .. 81
Yes YesPublic Public
.. CC CC CR AC C
3.3 3.0 2.111.2 17.5 18.8
24.4 24.9 17.396.0 93.0 105.1
5.8 8.2 15.419.4a 46.9a 48.714.3a 34.7a 52.2
3.8 4.4 2.399.5 118.0 173.137.4 61.9a 52.1
.. .. 696,450 16,310 26,098
22.3 12.7 8.514.2 23.1 15.513.8 36.7 7.718.4 58.4 11.1
0.0 0.0 15.77.6 4.2 14.4
10.6 13.0 25.7
0.30 0.55 0.377.4 12.7 34.7

Economic and social contextPopulation (millions)Urban population (% of total)GNI per capita, World Bank Atlas method ($)GDP growth, 2005–10 and 2010–15 (avg. annual %)Adult literacy rate (% ages 15 and older) Gross primary, secondary, and tertiary school enrollment (%)
Sector structureSeparate telecommunications/ICT regulatorStatus of main fixed-line telephone operatorLevel of competition (competition, partial comp., monopoly) International gateway(s) Mobile telephone service Internet serviceForeign ownership (not allowed, restricted, allowed)Reg. treatment of VoIP (banned, closed, no framework, allowed)
Sector efficiency and capacityTelecommunications revenue (% of GDP)Telecommunications investment (% of revenue)
Sector performanceAccessFixed-telephone subscriptions (per 100 people)Mobile-cellular telephone subscriptions (per 100 people)Fixed-broadband subscriptions (per 100 people)Households with a computer (%)Households with Internet access at home (%)
Usage Int’l. voice traffic, total (minutes/subscription/month)Domestic mobile traffic (minutes/subscription/month)Individuals using the Internet (%)
Quality Population covered by at least a 3G mobile network (%)International Internet bandwidth (bit/s per Internet user)
AffordabilityMobile-cellular sub-basket ($ a month)Fixed-broadband sub-basket ($ a month)Mobile-b’band, prepaid handset-based, 500 MB ($ a month)Mobile-b’band, postpaid computer-based, 1 GB ($ a month)
TradeICT goods exports (% of total goods exports)ICT goods imports (% of total goods imports)ICT service exports (% of total service exports)
ApplicationsOnline service index (0-1, 1=highest presence)Secure Internet servers (per million people)
229The Little Data Book on Information and Communication Technology 2017
East Asia & Pacific Lower middle income
Vietnam
2010 2015 2015
Lowermiddle-incomegroupCountry data
87 92 2,92730 34 39
1,270 1,980 2,0356.2 5.8 5.494 95 ..
.. .. 68
No YesPublic Public
C CC CC CR AA C
6.5 .. .... .. ..
16.1 6.3 3.5125.3 130.6 90.5
4.1 8.1 1.914.2a 22.0a 19.312.5a 24.1a 24.3
.. .. 7.5
.. .. 152.030.7 52.7a 28.6
.. .. ..4,925 24,374 10,372
5.6 4.4 6.910.5 2.8 14.3
1.9 3.5 5.838.4 5.5 10.0
7.9 24.0 5.78.4 19.1 7.6
.. .. 48.0
0.30 0.42 0.263.1 14.8 7.4

Economic and social contextPopulation (millions)Urban population (% of total)GNI per capita, World Bank Atlas method ($)GDP growth, 2005–10 and 2010–15 (avg. annual %)Adult literacy rate (% ages 15 and older) Gross primary, secondary, and tertiary school enrollment (%)
Sector structureSeparate telecommunications/ICT regulatorStatus of main fixed-line telephone operatorLevel of competition (competition, partial comp., monopoly) International gateway(s) Mobile telephone service Internet serviceForeign ownership (not allowed, restricted, allowed)Reg. treatment of VoIP (banned, closed, no framework, allowed)
Sector efficiency and capacityTelecommunications revenue (% of GDP)Telecommunications investment (% of revenue)
Sector performanceAccessFixed-telephone subscriptions (per 100 people)Mobile-cellular telephone subscriptions (per 100 people)Fixed-broadband subscriptions (per 100 people)Households with a computer (%)Households with Internet access at home (%)
Usage Int’l. voice traffic, total (minutes/subscription/month)Domestic mobile traffic (minutes/subscription/month)Individuals using the Internet (%)
Quality Population covered by at least a 3G mobile network (%)International Internet bandwidth (bit/s per Internet user)
AffordabilityMobile-cellular sub-basket ($ a month)Fixed-broadband sub-basket ($ a month)Mobile-b’band, prepaid handset-based, 500 MB ($ a month)Mobile-b’band, postpaid computer-based, 1 GB ($ a month)
TradeICT goods exports (% of total goods exports)ICT goods imports (% of total goods imports)ICT service exports (% of total service exports)
ApplicationsOnline service index (0-1, 1=highest presence)Secure Internet servers (per million people)
230 2017 The Little Data Book on Information and Communication Technology
Latin America & Caribbean High income
Virgin Islands (U.S.)
2010 2015 2015
High-incomegroupCountry data
0.11 0.10 1,18795 95 81
.. .. 41,366
.. .. 1.5
.. .. ..
.. .. 95
.. ..
.. ..
.. ..
.. ..
.. ..
.. ..
.. ..
.. .. 2.5
.. .. 18.8
71.3 71.1 41.2.. .. 124.5
8.6 8.4 31.0.. .. 83.2.. .. 85.0
.. .. ..
.. .. 195.931.2a 54.8a 81.0
.. .. 99
.. .. 134,761
.. .. 14.2
.. .. 25.2
.. .. 10.4
.. .. 14.4
.. .. 9.5
.. .. 11.2
.. .. 32.0
.. .. 0.67385.8 453.8 1,194.6
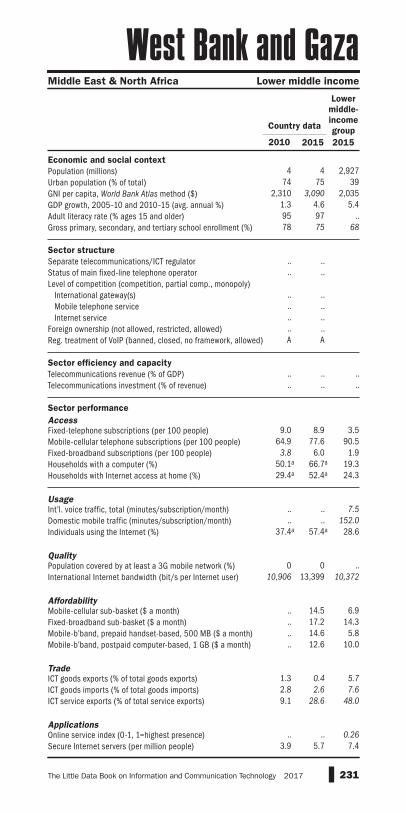
Economic and social contextPopulation (millions)Urban population (% of total)GNI per capita, World Bank Atlas method ($)GDP growth, 2005–10 and 2010–15 (avg. annual %)Adult literacy rate (% ages 15 and older) Gross primary, secondary, and tertiary school enrollment (%)
Sector structureSeparate telecommunications/ICT regulatorStatus of main fixed-line telephone operatorLevel of competition (competition, partial comp., monopoly) International gateway(s) Mobile telephone service Internet serviceForeign ownership (not allowed, restricted, allowed)Reg. treatment of VoIP (banned, closed, no framework, allowed)
Sector efficiency and capacityTelecommunications revenue (% of GDP)Telecommunications investment (% of revenue)
Sector performanceAccessFixed-telephone subscriptions (per 100 people)Mobile-cellular telephone subscriptions (per 100 people)Fixed-broadband subscriptions (per 100 people)Households with a computer (%)Households with Internet access at home (%)
Usage Int’l. voice traffic, total (minutes/subscription/month)Domestic mobile traffic (minutes/subscription/month)Individuals using the Internet (%)
Quality Population covered by at least a 3G mobile network (%)International Internet bandwidth (bit/s per Internet user)
AffordabilityMobile-cellular sub-basket ($ a month)Fixed-broadband sub-basket ($ a month)Mobile-b’band, prepaid handset-based, 500 MB ($ a month)Mobile-b’band, postpaid computer-based, 1 GB ($ a month)
TradeICT goods exports (% of total goods exports)ICT goods imports (% of total goods imports)ICT service exports (% of total service exports)
ApplicationsOnline service index (0-1, 1=highest presence)Secure Internet servers (per million people)
231The Little Data Book on Information and Communication Technology 2017
Middle East & North Africa Lower middle income
West Bank and Gaza
2010 2015 2015
Lowermiddle-incomegroupCountry data
4 4 2,92774 75 39
2,310 3,090 2,0351.3 4.6 5.495 97 ..78 75 68
.. ..
.. ..
.. ..
.. ..
.. ..
.. ..A A
.. .. ..
.. .. ..
9.0 8.9 3.564.9 77.6 90.5
3.8 6.0 1.950.1a 66.7a 19.329.4a 52.4a 24.3
.. .. 7.5
.. .. 152.037.4a 57.4a 28.6
0 0 ..10,906 13,399 10,372
.. 14.5 6.9
.. 17.2 14.3
.. 14.6 5.8
.. 12.6 10.0
1.3 0.4 5.72.8 2.6 7.69.1 28.6 48.0
.. .. 0.263.9 5.7 7.4

Economic and social contextPopulation (millions)Urban population (% of total)GNI per capita, World Bank Atlas method ($)GDP growth, 2005–10 and 2010–15 (avg. annual %)Adult literacy rate (% ages 15 and older) Gross primary, secondary, and tertiary school enrollment (%)
Sector structureSeparate telecommunications/ICT regulatorStatus of main fixed-line telephone operatorLevel of competition (competition, partial comp., monopoly) International gateway(s) Mobile telephone service Internet serviceForeign ownership (not allowed, restricted, allowed)Reg. treatment of VoIP (banned, closed, no framework, allowed)
Sector efficiency and capacityTelecommunications revenue (% of GDP)Telecommunications investment (% of revenue)
Sector performanceAccessFixed-telephone subscriptions (per 100 people)Mobile-cellular telephone subscriptions (per 100 people)Fixed-broadband subscriptions (per 100 people)Households with a computer (%)Households with Internet access at home (%)
Usage Int’l. voice traffic, total (minutes/subscription/month)Domestic mobile traffic (minutes/subscription/month)Individuals using the Internet (%)
Quality Population covered by at least a 3G mobile network (%)International Internet bandwidth (bit/s per Internet user)
AffordabilityMobile-cellular sub-basket ($ a month)Fixed-broadband sub-basket ($ a month)Mobile-b’band, prepaid handset-based, 500 MB ($ a month)Mobile-b’band, postpaid computer-based, 1 GB ($ a month)
TradeICT goods exports (% of total goods exports)ICT goods imports (% of total goods imports)ICT service exports (% of total service exports)
ApplicationsOnline service index (0-1, 1=highest presence)Secure Internet servers (per million people)
232 2017 The Little Data Book on Information and Communication Technology
Middle East & North Africa Lower middle income
Yemen, Rep.
2010 2015 2015
Lowermiddle-incomegroupCountry data
24 27 2,92732 35 39
1,250 1,300 2,0353.7 –2.7 5.4
.. 70 ..53 .. 68
No NoPublic Public
M MC CC C
No NoB B
2.9 .. ..29.4 .. ..
4.6 4.7 3.548.7 68.0 90.5
0.4 1.5 1.94.0a 6.5a 19.32.9a 5.5a 24.3
13.4 .. 7.5.. .. 152.0
12.4 25.1a 28.6
.. .. ..1,138 2,496 10,372
9.8 8.4 6.916.7 7.3 14.323.3 13.5 5.8
.. 13.5 10.0
0.0 0.1 5.71.3 1.3 7.67.3 13.1 48.0
0.05 0.31 0.260.3 0.6 7.4

Economic and social contextPopulation (millions)Urban population (% of total)GNI per capita, World Bank Atlas method ($)GDP growth, 2005–10 and 2010–15 (avg. annual %)Adult literacy rate (% ages 15 and older) Gross primary, secondary, and tertiary school enrollment (%)
Sector structureSeparate telecommunications/ICT regulatorStatus of main fixed-line telephone operatorLevel of competition (competition, partial comp., monopoly) International gateway(s) Mobile telephone service Internet serviceForeign ownership (not allowed, restricted, allowed)Reg. treatment of VoIP (banned, closed, no framework, allowed)
Sector efficiency and capacityTelecommunications revenue (% of GDP)Telecommunications investment (% of revenue)
Sector performanceAccessFixed-telephone subscriptions (per 100 people)Mobile-cellular telephone subscriptions (per 100 people)Fixed-broadband subscriptions (per 100 people)Households with a computer (%)Households with Internet access at home (%)
Usage Int’l. voice traffic, total (minutes/subscription/month)Domestic mobile traffic (minutes/subscription/month)Individuals using the Internet (%)
Quality Population covered by at least a 3G mobile network (%)International Internet bandwidth (bit/s per Internet user)
AffordabilityMobile-cellular sub-basket ($ a month)Fixed-broadband sub-basket ($ a month)Mobile-b’band, prepaid handset-based, 500 MB ($ a month)Mobile-b’band, postpaid computer-based, 1 GB ($ a month)
TradeICT goods exports (% of total goods exports)ICT goods imports (% of total goods imports)ICT service exports (% of total service exports)
ApplicationsOnline service index (0-1, 1=highest presence)Secure Internet servers (per million people)
233The Little Data Book on Information and Communication Technology 2017
Sub-Saharan Africa Lower middle income
Zambia
2010 2015 2015
Lowermiddle-incomegroupCountry data
14 16 2,92739 41 39
1,310 1,500 2,0358.6 5.5 5.483 85 ..
.. .. 68
Yes YesPublic Public
C CC PC CR AB B
0.1 2.0 .... 4.2 ..
0.9 0.7 3.541.2 74.5 90.5
0.1 0.1 1.93.7 7.4a 19.33.1a 12.7a 24.3
1.9 2.1 7.547.3 83.8 152.010.0 21.0a 28.6
15 53 ..378 3,187 10,372
16.9 8.0 6.958.0 29.0 14.320.4 9.3 5.8
.. 14.0 10.0
0.0 0.1 5.72.3 2.5 7.64.7 4.2 48.0
0.10 0.14 0.261.1 4.3 7.4

Economic and social contextPopulation (millions)Urban population (% of total)GNI per capita, World Bank Atlas method ($)GDP growth, 2005–10 and 2010–15 (avg. annual %)Adult literacy rate (% ages 15 and older) Gross primary, secondary, and tertiary school enrollment (%)
Sector structureSeparate telecommunications/ICT regulatorStatus of main fixed-line telephone operatorLevel of competition (competition, partial comp., monopoly) International gateway(s) Mobile telephone service Internet serviceForeign ownership (not allowed, restricted, allowed)Reg. treatment of VoIP (banned, closed, no framework, allowed)
Sector efficiency and capacityTelecommunications revenue (% of GDP)Telecommunications investment (% of revenue)
Sector performanceAccessFixed-telephone subscriptions (per 100 people)Mobile-cellular telephone subscriptions (per 100 people)Fixed-broadband subscriptions (per 100 people)Households with a computer (%)Households with Internet access at home (%)
Usage Int’l. voice traffic, total (minutes/subscription/month)Domestic mobile traffic (minutes/subscription/month)Individuals using the Internet (%)
Quality Population covered by at least a 3G mobile network (%)International Internet bandwidth (bit/s per Internet user)
AffordabilityMobile-cellular sub-basket ($ a month)Fixed-broadband sub-basket ($ a month)Mobile-b’band, prepaid handset-based, 500 MB ($ a month)Mobile-b’band, postpaid computer-based, 1 GB ($ a month)
TradeICT goods exports (% of total goods exports)ICT goods imports (% of total goods imports)ICT service exports (% of total service exports)
ApplicationsOnline service index (0-1, 1=highest presence)Secure Internet servers (per million people)
234 2017 The Little Data Book on Information and Communication Technology
Sub-Saharan Africa Low income
Zimbabwe
2010 2015 2015
Low-incomegroupCountry data
14 16 63833 32 31
500 850 620–3.4 6.2 5.4
84 87 ..60 59 60
Yes YesPublic Public
P PP PC CR R
No A
.. 8.8 ..
.. 15.8 ..
2.9 2.2 0.958.9 84.8 60.0
0.3 1.1 0.35.3 11.8a 4.84.0 18.1a 7.1
4.9 3.7 ..36.0 29.0 48.9
6.4a 16.4a 9.5
5 55 51519 6,380 4,245
20.6 12.9 9.430.0 15.0 33.654.0 10.0 8.090.0 80.0 10.8
0.0 0.1 ..5.5 3.9 3.4
.. .. ..
0.13 0.31 0.110.9 6.6 1.5
235The Little Data Book on Information and Communication Technology 2017
a . ITU estimate .
b . Excludes South Sudan .
c . Excludes South Sudan after July 9, 2011 .
Notes

236 2017 The Little Data Book on Information and Communication Technology
Adult literacy rate is the percentage of people ages 15 and older who can, with understanding, read and write a short, simple statement about their everyday life . (United Nations Educational, Scientific, and Cultural Organization Institute for Statistics) (w)
Domestic mobile traffic refers to the total number of minutes of calls made by mobile subscribers within a country (including minutes to fixed-telephone and minutes to mobile-phone subscribers) . Data listed for 2015 are for 2014 . (International Telecommunication Union) (w)
Fixed-broadband sub-basket refers to the price of the monthly subscription to an entry-level fixed broadband plan . For comparability reasons, the fixed broadband sub-basket is based on a monthly usage of (a minimum of) 1 gigabyte (GB) . For plans that limit the monthly amount of data transferred by including caps below 1 GB, the cost for additional bytes is added to the sub-basket . The minimum speed of a broadband connection is 256 kbit/s . (International Telecommunication Union) (m)
Fixed-broadband subscriptions refers to fixed subscriptions to high-speed access to the public Internet (a TCP/IP connection), at downstream speeds equal to, or greater than, 256 kbit/s . This includes cable modem, DSL, fiber-to-the-home/building, other fixed (wired)-broadband subscriptions, satellite broadband, and terrestrial fixed wireless broadband . This total is measured irrespective of the method of payment . It excludes subscrip-tions that have access to data communications (including the Internet) via mobile-cellular networks . It should include fixed WiMAX and any other fixed wireless technologies . It includes both residential subscriptions and subscriptions for organization (International Telecommunication Union) (w)
Fixed-telephone subscriptions refers to the sum of active number of analog fixed-telephone lines, Voice over Internet Protocol (VoIP) subscriptions, fixed wireless local loop (WLL) subscriptions, ISDN voice-channel equivalents, and fixed public payphones . (International Telecommunication Union) (w)
Foreign ownership refers to the allowance of foreign participation or owner- ship in facility-based and spectrum-based operators as well as in Internet Service Providers (ISPs) . (No = not allowed, R = allowed with restrictions, A = allowed without restrictions) . Data are based on self-reported informa-tion submitted by country administrations . (International Telecommunication Union)
GDP growth is the annual percentage growth rate of gross domestic prod-uct (GDP) at market prices based on constant local currency . Aggregates are based on constant 2010 U .S . dollars . GDP is the sum of gross value added by all resident producers in the economy plus any product taxes and minus any subsidies not included in the value of the products . It is calculated without making deductions for depreciation of fabricated assets or for depletion and degradation of natural resources . (World Bank and Organisation for Economic Co-operation and Development) (w)
Glossary

237The Little Data Book on Information and Communication Technology 2017
GNI per capita, World Bank Atlas method, is gross national income (GNI) converted to U .S . dollars using the World Bank Atlas method divided by the midyear population . GNI is the sum of value added by all resident producers plus any product taxes (less subsidies) not included in the valuation of output plus net receipts of primary income (compensation of employees and property income) from abroad . GNI, calculated in national currency, is usually converted to U .S . dollars at official exchange rates for comparisons across economies . The World Bank Atlas method is used to smooth fluctuations in prices and exchange rates . It averages the exchange rate for a given year and the two preceding years, adjusted for differences in rates of inflation between the country and the Euro area, Japan, the United Kingdom, and the United States . (World Bank) (w)
Gross primary, secondary, and tertiary school enrollment is the combined number of students enrolled in primary, secondary, and tertiary levels of education, regardless of age, as a percentage of the population of official school age for the three levels . (United Nations Educational, Scientific and Cultural Organization Institute for Statistics) (w)
Households with a computer refers to the percentage of households with a computer at home . A computer includes a desktop computer, a laptop (portable) computer, or a tablet (or similar handheld computer) . It does not include equipment with some embedded computing abilities such as smart TV sets, and devices with telephony as their primary function, such as smartphones . (International Telecommunication Union) (w)
Households with Internet access at home refers to the percentage of households with Internet access at home . Access is not assumed to be only via a computer—it may also be by mobile phone, tablet, PDA, games machine, digital TV, etc . (International Telecommunication Union) (w)
ICT goods exports and imports are goods that are intended to fulfill the function of information processing and communication by electronic means, including transmission and display, or that use electronic processing to detect, measure, or record physical phenomena or to control a physical process . They include computers and peripheral equipment, communication equipment, consumer electronic equipment, electronic components, and other information and technology goods . Software is generally excluded . Re-exports (exports of foreign goods in the same state as previously imported) are included . Data listed for 2015 are for 2014 . (United Nations Conference on Trade and Development) (w)
ICT service exports comprise communications services (telecommunica-tions, business network services, teleconferencing, support services, and postal services) and computer and information services (database, data processing, software design and development, maintenance and repair, and news-related service transactions) . (International Monetary Fund) (w)
Individuals using the Internet refers to the percentage of individuals who have used the Internet (from any location) in the last three months . Internet
Glossary
238 2017 The Little Data Book on Information and Communication Technology
can be used via a computer, mobile phone, personal digital assistant, games machine, digital TV, etc . (International Telecommunication Union) (w)
International Internet bandwidth refers to the total used capacity of inter-national Internet bandwidth, in bits per second per Internet user . Used international Internet bandwidth refers to the average traffic load (expressed in Mbit/s) of international fiber-optic cables and radio links for carrying Internet traffic . The average should be calculated over the 12-month period of the reference year, and should take into consideration the traffic of all international Internet links . If the traffic is asymmetric (i .e ., more incoming [downlink] than outgoing [uplink] traffic), then the average incoming (down- link) traffic load should be provided . The combined average traffic load of different international Internet links can be reported as the addition of the average traffic load of each link . (International Telecommunication Union) (w)
International voice traffic, total is the sum of international incoming and outgoing telephone fixed and mobile telephone traffic (in minutes) . Data listed for 2015 are for 2014 . (International Telecommunication Union) (w)
Level of competition, international gateway, is the level of competition for international gateway(s) . International gateway is any facility that pro-vides an interface to send and receive electronic communications traffic (i .e ., voice, data, and multimedia images/video) between one country’s domestic network facilities and those in another country . (C = full com- petition, M = monopoly, P = partial competition) . Data are based on self- reported information submitted by country administrations . (International Telecommunication Union)
Level of competition, Internet service, is the level of competition for retail Internet access service . (C = full competition, M = monopoly, P = partial competition) . Data are based on self-reported information submitted by country administrations . (International Telecommunication Union)
Level of competition, mobile telephone service, is the level of competition for digital cellular mobile services . (C = full competition, M = monopoly, P = partial competition) . Data are based on self-reported information sub-mitted by country administrations . (International Telecommunication Union)
Mobile-broadband, prepaid handset-based 500MB: This basket refers to the price of a plan for a mobile-broadband handset-based prepaid usage of 500 MB of data per month . Data listed for 2010 refer to 2012 . (International Telecommunication Union)
Mobile-broadband, postpaid computer-based (USB/dongle) 1GB: This bas-ket refers to the price of a plan for a mobile-broadband computer-based postpaid usage of 1GB of data per month . Data listed for 2010 refer to 2012 . (International Telecommunication Union)
Mobile-cellular sub-basket refers to the price of a standard basket of mobile monthly usage for 30 outgoing calls per month (on-net, off-net,
Glossary

239The Little Data Book on Information and Communication Technology 2017
to a fixed line, and for peak and off-peak times) in predetermined ratios, plus 100 short message service (SMS) messages . The mobile-cellular sub-basket is based on prepaid tariffs although postpaid tariffs may be used for countries where prepaid subscriptions make up less than 3 percent of all mobile-cellular subscriptions . The mobile-cellular prepaid sub-basket is largely based, but does not entirely follow, the 2009 methodology of the OECD low-user basket . (International Telecommunication Union) (m)
Mobile-cellular telephone subscriptions refers to the number of subscrip-tions to a public mobile-telephone service that provide access to the PSTN (public switched telephone network) using cellular technology . The indicator includes (and is split into) the number of postpaid subscriptions and the number of active prepaid accounts (i .e ., that have been used during the last three months) . The indicator applies to all mobile-cellular subscriptions that offer voice communications . It excludes subscriptions via data cards or USB modems, subscriptions to public mobile data services, private trunked mobile radio, telepoint, radio paging, and telemetry services . (International Telecommunication Union) (w)
Online service index is one of the three component indicators for the United Nation’s e-Government Development Index (EGDI) . Online service index measures the level of sophistication and usability of each country’s national website, including the national portal, e-service portal, e-participation portal, and government ministries’ websites . Given the global trends of citizen-centric approach, the score takes account of the demand side of e-service (user uptake) . A value of 0 indicates the lowest presence, a value of 1 the highest . Data listed for 2015 are for 2016 . (United Nations Department of Economic and Social Affairs and United Nations Division for Public Administration and Development Management) (m)
Population is based on the de facto definition of population, which counts all residents regardless of legal status or citizenship . Data are midyear estimates . (World Bank) (s)
Population covered by at least a 3G mobile network refers to the percent-age of inhabitants that are within range of at least a 3G mobile-cellular signal, irrespective of whether or not they are subscribers . This is calcu-lated by dividing the number of inhabitants that are covered by at least a 3G mobile-cellular signal by the total population and multiplying by 100 . (International Telecommunication Union) (w)
Regulatory treatment of VoIP indicates whether the country has any regulatory treatment on Voice over Internet Protocol (VoIP) . The status is categorized as banned, closed, no framework, or allowed . “Closed” means that wholesale IP voice is permitted, but retail VoIP is banned, as well as cases where only the incumbent is licensed to provide VoIP . (A = allowed, B = banned, C = closed, No = no framework) . Data are based on self- reported information submitted by country administrations . (International Telecommunication Union)
Glossary

240 2017 The Little Data Book on Information and Communication Technology
Secure Internet servers are the number of servers using encryption tech-nology for Internet transactions . (Netcraft) (w)
Separate telecommunications/ICT regulator indicates whether the country has a separate telecommunications/ICT regulatory authority independent in terms of finance, structure, and decision making from the operators and the sector ministry . Data are based on self-reported information submit-ted by country administrations . (International Telecommunication Union)
Status of main fixed-line telephone operator indicates whether the incum-bent fixed-line operator is a public or private entity . Public refers to a fully state-owned operator that has remained 100 percent government-owned since its creation or has been re/nationalized; private refers to an operator that is 100 percent private, either as a result of a privatization or created as such; and mixed refers to a partially private operator that has a por-tion of its shares sold to either a private operator or to the public (e .g ., through initial public offerings or employee stock ownership plan), with the government remaining one of its shareholders . Data are based on self-reported information submitted by country administrations . (International Telecommunication Union)
Telecommunications investment refers to the investment during the financial year in telecommunication services (including fixed, mobile, and Internet services) for acquiring or upgrading property and networks . Property includes tangible assets such as plant, intellectual, and nontangible assets such as computer software . The indicator is a measure of investment in tele- communication infrastructure in the country, and includes expenditure on initial installations and additions to existing installations where the usage is expected to be over an extended period . It excludes expenditure on research and development (R&D), annual fees for operating licenses, and the use of radio spectrum . Data listed for 2015 are for 2014 . (International Telecommunication Union) (m)
Telecommunications revenue refers to revenue earned from retail fixed telephone, mobile-cellular, Internet, and data services offered by telecom-munication operators (both network and virtual) offering services within the country . Revenue (turnover) consists of retail telecommunication service earnings (therefore excluding revenue from wholesaling activities) during the financial year under review . It is calculated as percentage of GDP . Data listed for 2015 are for 2014 . (International Telecommunication Union) (w)
Urban population refers to people living in urban areas as defined by national statistical offices . It is calculated using World Bank population estimates and urban ratios from the United Nations World Urbanization Prospects . Aggregation of urban and rural population may not add up to total population because of different country coverages . (United Nations) (s)
VoIP is Voice over Internet Protocol, a generic term to describe the tech-niques used to carry voice traffic over IP .
Glossary
