2011 the little data book on information and communication
TRANSCRIPT

2011 THE LITTLE DATA BOOK ON INFORMATION ANDCOMMUNICATIONTECHNOLOGY

Copyright ©2011 by the International Bank for
Reconstruction and Development/THE WORLD BANK
1818 H Street, N.W., Washington, D.C. 20433
U.S.A.
All rights reserved
Manufactured in the United States of America
First printing June 2011
ISBN: 978-0-8213-8248-6
eISBN: 978-0-8213-8447-3
DOI: 10.1596/978-0-8213-8248-6
SKU: 18860
The Little Data Book on Information and Communication Technology 2011
is a product of the Development Data Group of the Development
Economics Vice Presidency and the Global Information and
Communication Technologies Department of the World Bank.
Design by Communications Development Incorporated, Washington, D.C.

iiiThe Little Data Book on Information and Communication Technology 2011
Acknowledgments . . . . . . . . . . . . . . . . . . . . . . . . . . . . . . . . . . . . . . . . . . . iv
Preface . . . . . . . . . . . . . . . . . . . . . . . . . . . . . . . . . . . . . . . . . . . . . . . . . . v
Data notes . . . . . . . . . . . . . . . . . . . . . . . . . . . . . . . . . . . . . . . . . . . . . . . . vi
Regional tables. . . . . . . . . . . . . . . . . . . . . . . . . . . . . . . . . . . . . . . . . . . . . 1
World . . . . . . . . . . . . . . . . . . . . . . . . . . . . . . . . . . . . . . . . . . . . . . . . . 2
East Asia and Pacific. . . . . . . . . . . . . . . . . . . . . . . . . . . . . . . . . . . . . . 3
Europe and Central Asia . . . . . . . . . . . . . . . . . . . . . . . . . . . . . . . . . . . 4
Latin America and the Caribbean . . . . . . . . . . . . . . . . . . . . . . . . . . . . . 5
Middle East and North Africa . . . . . . . . . . . . . . . . . . . . . . . . . . . . . . . . 6
South Asia . . . . . . . . . . . . . . . . . . . . . . . . . . . . . . . . . . . . . . . . . . . . . 7
Sub-Saharan Africa . . . . . . . . . . . . . . . . . . . . . . . . . . . . . . . . . . . . . . . 8
Income group tables . . . . . . . . . . . . . . . . . . . . . . . . . . . . . . . . . . . . . . . . . 9
Low income . . . . . . . . . . . . . . . . . . . . . . . . . . . . . . . . . . . . . . . . . . . 10
Middle income . . . . . . . . . . . . . . . . . . . . . . . . . . . . . . . . . . . . . . . . . 11
Lower middle income . . . . . . . . . . . . . . . . . . . . . . . . . . . . . . . . . . . . 12
Upper middle income . . . . . . . . . . . . . . . . . . . . . . . . . . . . . . . . . . . . 13
Low and middle income. . . . . . . . . . . . . . . . . . . . . . . . . . . . . . . . . . . 14
Euro area . . . . . . . . . . . . . . . . . . . . . . . . . . . . . . . . . . . . . . . . . . . . . 15
High income . . . . . . . . . . . . . . . . . . . . . . . . . . . . . . . . . . . . . . . . . . . 16
Country tables (in alphabetical order) . . . . . . . . . . . . . . . . . . . . . . . . . . . . 17
Glossary. . . . . . . . . . . . . . . . . . . . . . . . . . . . . . . . . . . . . . . . . . . . . . . . 231
Contents

iv 2011 The Little Data Book on Information and Communication Technology
The Little Data Book on Information and Communication Technology 2011 is
the result of close collaboration between the staff of the Development Data
Group of the Development Economics Vice Presidency and the Transport,
Water, and Information Communication Technologies Department of the
World Bank. The Development Data Group team included Azita Amjadi,
David Cieslikowski, Federico Escaler, Buyant Erdene Khaltarkhuu, Alison
Kwong, Jomo Tariku, and William Prince. The Global Information and
Communication Technologies team included Kaoru Kimura, Marta Priftis,
Christine Zhenwei Qiang and Helen Yang. We would also like to acknowledge
the cooperation of the International Telecommunication Union on the use
of its data. The work was carried out under the management of Shaida
Badiee and Philippe Dongier. The book was typeset by Alison Kwong. Staff
from External Affairs oversaw publication and dissemination of the book.
Acknowledgments
vThe Little Data Book on Information and Communication Technology 2011
PrefaceSince the late 1990s access to information and communication technologies
has seen tremendous growth—driven primarily by the wireless technologies
and liberalization of telecommunications markets. Mobile communications
have evolved from simple voice and text services to diversified innovative
applications and mobile broadband internet. The number of mobile cellular
subscriptions reached approximately 4.7 billion globally, including people in
remote and rural areas. The number of Internet users has risen constantly
and now tops 1.8 billion people, with the number of broadband connections
more than 470 million in 2009.
The impacts of information and communication technologies cross all
sectors. Research shows that investment in information and communication
technologies is associated with such economic benefits as higher productivity,
lower costs, new economic opportunities, job creation, innovation, and
increased trade and exports. Information and communication technologies
also help provide better services in health and education and strengthen
social cohesion.
The Little Data Book on Information and Communication Technology 2011
charts the progress of this revolution for 213 countries around the world. It
provides comparable statistics on the sector for 2000 and 2009 across a
range of indicators, enabling readers to readily compare countries.
This book includes indicators covering the economic and social context, the
structure of the information and communication technology sector, sector
efficiency and capacity, and sector performance related to access, usage,
quality, affordability, trade, and applications. The Glossary contains definitions
of the terms used in the tables.
For more information about these data or other World Bank data publications,
visit our data Web site at data.worldbank.org or the Web site of the Information
and Communication Technologies Department at www.worldbank.org/ict.

vi 2011 The Little Data Book on Information and Communication Technology
The data in this book are for 2000 and 2009 or the most recent year unless
otherwise noted in the table or the Glossary.
• Growthratesareproportionalchangesfromthepreviousyearunless
otherwise noted.
• Regional aggregates include data for low- and middle-income
economies only.
• Italics indicate data for years or periods other than those
specified.
Symbols used:
.. indicates that data are not available or that aggregates cannot
be calculated because of missing data.
0 or 0.0 indicates zero or small enough that the number would round
to zero at the displayed number of decimal places.
$ indicates current U.S. dollars.
Data are shown for economies with populations greater than 30,000 or for
smaller economies if they are members of the World Bank. The term country
(used interchangeably with economy) does not imply political independence
or official recognition by the World Bank but refers to any economy for which
the authorities report separate social or economic statistics.
Data notes

1The Little Data Book on Information and Communication Technology 2011
The country composition of regions is based on the World Bank’s analytical
regions and may differ from common geographic usage.
East Asia and Pacific
American Samoa, Cambodia, China, Fiji, Indonesia, Kiribati, Democratic
Republic of Korea, Lao People’s Democratic Republic, Malaysia, Marshall
Islands, Federated States of Micronesia, Mongolia, Myanmar, Palau,
Papua New Guinea, Philippines, Samoa, Solomon Islands, Thailand,
Timor-Leste, Tonga, Tuvalu, Vanuatu, Vietnam
Europe and Central Asia
Albania, Armenia, Azerbaijan, Belarus, Bosnia and Herzegovina, Bulgaria,
Georgia, Kazakhstan, Kosovo, Kyrgyz Republic, Lithuania, Former
Yugoslav Republic of Macedonia, Moldova, Montenegro, Romania,
Russian Federation, Serbia, Tajikistan, Turkey, Turkmenistan, Ukraine,
Uzbekistan
Latin America and the Caribbean
Antigua and Barbuda, Argentina, Belize, Bolivia, Brazil, Chile, Colombia,
Costa Rica, Cuba, Dominica, Dominican Republic, Ecuador, El Salvador,
Grenada, Guatemala, Guyana, Haiti, Honduras, Jamaica, Mexico,
Nicaragua, Panama, Paraguay, Peru, St. Kitts and Nevis, St. Lucia, St.
Vincent and the Grenadines, Suriname, Uruguay, Bolivarian Republic
of Venezuela
Middle East and North Africa
Algeria, Djibouti, Arab Republic of Egypt, Islamic Republic of Iran, Iraq,
Jordan, Lebanon, Libya, Morocco, Syrian Arab Republic, Tunisia, West
Bank and Gaza, Republic of Yemen
South Asia
Afghanistan, Bangladesh, Bhutan, India, Maldives, Nepal, Pakistan,
Sri Lanka
Sub-Saharan Africa
Angola, Benin, Botswana, Burkina Faso, Burundi, Cameroon, Cape
Verde, Central African Republic, Chad, Comoros, Democratic Republic
of the Congo, Republic of Congo, Côte d’Ivoire, Eritrea, Ethiopia, Gabon,
The Gambia, Ghana, Guinea, Guinea-Bissau, Kenya, Lesotho, Liberia,
Madagascar, Malawi, Mali, Mauritania, Mauritius, Mayotte, Mozambique,
Namibia, Niger, Nigeria, Rwanda, São Tomé and Príncipe, Senegal,
Seychelles, Sierra Leone, Somalia, South Africa, Sudan, Swaziland,
Tanzania, Togo, Uganda, Zambia, Zimbabwe
Regional tables

Economic and social contextPopulation (millions)Urban population (% of total)GNI per capita, World Bank Atlas method ($)GDP growth, 1995–2000 and 2000–09 (avg. annual %)Adult literacy rate (% ages 15 and older) Gross primary, secondary, and tertiary enrollment (%) StructureSeparate telecommunications regulatorStatus of main fixed-line telephone operatorLevel of competition (competition, partial comp., monopoly)
International long distance serviceMobile telephone serviceInternet service
Efficiency and capacityTelecommunications revenue (% of GDP)Mobile cellular and fixed-line subscribers per employeeTelecommunications investment (% of revenue) PerformanceAccessTelephone lines (per 100 people)Mobile cellular subscriptions (per 100 people)Fixed broadband Internet subscribers (per 100 people)Personal computers (per 100 people)Households with a television (%)UsageInternational voice traffic total (minutes per person per month)Mobile telephone usage (minutes per user per month)Internet users (per 100 people)QualityPopulation covered by mobile cellular network (%)Fixed broadband Internet subscribers (% of total subscribers)International Internet bandwidth (bits per second per person)AffordabilityResidential fixed line tariff ($ a month)Mobile cellular prepaid tariff ($ a month)Fixed broadband Internet access tariff ($ a month)TradeICT goods exports (% of total goods exports)ICT goods imports (% of total goods imports)ICT service exports (% of total service exports)ApplicationsE-gov’t Web measure index (0–1, 1=highest presence)Secure Internet servers (per million people)
2 2011 The Little Data Book on Information and Communication Technology
World
2000 2009
6,085 6,77547 50
5,293 8,7323.3 2.982 8462 68
2.9 3.1155 75526.7 18.5
16.0 18.012.2 69.0
2.3 9.18.0 15.3
.. ..
.. ..195 2986.7 27.1
.. 8015.7 59.7102 3,526
.. 10.1
.. 8.7
.. 29.7
18.0 13.017.7 13.95.5 9.1
.. 0.2621.8 155.7

Economic and social contextPopulation (millions)Urban population (% of total)GNI per capita, World Bank Atlas method ($)GDP growth, 1995–2000 and 2000–09 (avg. annual %)Adult literacy rate (% ages 15 and older) Gross primary, secondary, and tertiary enrollment (%) StructureSeparate telecommunications regulatorStatus of main fixed-line telephone operatorLevel of competition (competition, partial comp., monopoly)
International long distance serviceMobile telephone serviceInternet service
Efficiency and capacityTelecommunications revenue (% of GDP)Mobile cellular and fixed-line subscribers per employeeTelecommunications investment (% of revenue) PerformanceAccessTelephone lines (per 100 people)Mobile cellular subscriptions (per 100 people)Fixed broadband Internet subscribers (per 100 people)Personal computers (per 100 people)Households with a television (%)UsageInternational voice traffic, total (minutes per person per month)Mobile telephone usage (minutes per user per month)Internet users (per 100 people)QualityPopulation covered by mobile cellular network (%)Fixed broadband Internet subscribers (% of total subscribers)International Internet bandwidth (bits per second per person)AffordabilityResidential fixed line tariff ($ a month)Mobile cellular prepaid tariff ($ a month)Fixed broadband Internet access tariff ($ a month)TradeICT goods exports (% of total goods exports)ICT goods imports (% of total goods imports)ICT service exports (% of total service exports)ApplicationsE-gov’t Web measure index (0–1, 1=highest presence)Secure Internet servers (per million people)
3The Little Data Book on Information and Communication Technology 2011
East Asia & Pacific
2000 2009
1,807 1,94437 45
902 3,1636.0 9.491 9465 67
3.0 2.5151 546
30.7 ..
9.3 20.45.8 61.60.7 9.01.6 5.6
.. ..
.. ..247 3631.9 24.1
.. 930.2 42.6
2 742
.. 4.0
.. 3.7
.. 20.8
29.8 28.926.7 24.4
4.7 6.8
.. 0.130.3 3.2

Economic and social contextPopulation (millions)Urban population (% of total)GNI per capita, World Bank Atlas method ($)GDP growth, 1995–2000 and 2000–09 (avg. annual %)Adult literacy rate (% ages 15 and older) Gross primary, secondary, and tertiary enrollment (%) StructureSeparate telecommunications regulatorStatus of main fixed-line telephone operatorLevel of competition (competition, partial comp., monopoly)
International long distance serviceMobile telephone serviceInternet service
Efficiency and capacityTelecommunications revenue (% of GDP)Mobile cellular and fixed-line subscribers per employeeTelecommunications investment (% of revenue) PerformanceAccessTelephone lines (per 100 people)Mobile cellular subscriptions (per 100 people)Fixed broadband Internet subscribers (per 100 people)Personal computers (per 100 people)Households with a television (%)UsageInternational voice traffic total (minutes per person per month)Mobile telephone usage (minutes per user per month)Internet users (per 100 people)QualityPopulation covered by mobile cellular network (%)Fixed broadband Internet subscribers (% of total subscribers)International Internet bandwidth (bits per second per person)AffordabilityResidential fixed line tariff ($ a month)Mobile cellular prepaid tariff ($ a month)Fixed broadband Internet access tariff ($ a month)TradeICT goods exports (% of total goods exports)ICT goods imports (% of total goods imports)ICT service exports (% of total service exports)ApplicationsE-gov’t Web measure index (0–1, 1=highest presence)Secure Internet servers (per million people)
4 2011 The Little Data Book on Information and Communication Technology
Europe & Central Asia
2000 2009
400 40463 64
1,756 6,7932.1 5.997 9876 81
2.5 2.888 462
26.0 22.5
20.5 25.56.5 118.70.8 29.14.5 9.8
.. ..
.. ..
.. 2142.0 36.4
.. 911.8 26.311 1,087
.. 3.9
.. 7.6
.. 17.2
1.7 1.57.9 6.62.5 6.1
.. 0.322.0 33.1

Economic and social contextPopulation (millions)Urban population (% of total)GNI per capita, World Bank Atlas method ($)GDP growth, 1995–2000 and 2000–09 (avg. annual %)Adult literacy rate (% ages 15 and older) Gross primary, secondary, and tertiary enrollment (%) StructureSeparate telecommunications regulatorStatus of main fixed-line telephone operatorLevel of competition (competition, partial comp., monopoly)
International long distance serviceMobile telephone serviceInternet service
Efficiency and capacityTelecommunications revenue (% of GDP)Mobile cellular and fixed-line subscribers per employeeTelecommunications investment (% of revenue) PerformanceAccessTelephone lines (per 100 people)Mobile cellular subscriptions (per 100 people)Fixed broadband Internet subscribers (per 100 people)Personal computers (per 100 people)Households with a television (%)UsageInternational voice traffic, total (minutes per person per month)Mobile telephone usage (minutes per user per month)Internet users (per 100 people)QualityPopulation covered by mobile cellular network (%)Fixed broadband Internet subscribers (% of total subscribers)International Internet bandwidth (bits per second per person)AffordabilityResidential fixed line tariff ($ a month)Mobile cellular prepaid tariff ($ a month)Fixed broadband Internet access tariff ($ a month)TradeICT goods exports (% of total goods exports)ICT goods imports (% of total goods imports)ICT service exports (% of total service exports)ApplicationsE-gov’t Web measure index (0–1, 1=highest presence)Secure Internet servers (per million people)
5The Little Data Book on Information and Communication Technology 2011
Latin America & Caribbean
2000 2009
512 57275 79
3,831 7,0073.0 3.890 9178 83
3.0 3.8244 586
26.3 ..
14.5 18.212.1 89.51.3 7.74.9 11.5
.. 85
.. ..127 1153.8 31.5
.. 923.0 92.0
8 1,408
.. 10.6
.. 8.8
.. 29.6
12.5 11.616.3 15.26.5 5.5
.. 0.294.1 27.5

Economic and social contextPopulation (millions)Urban population (% of total)GNI per capita, World Bank Atlas method ($)GDP growth, 1995–2000 and 2000–09 (avg. annual %)Adult literacy rate (% ages 15 and older) Gross primary, secondary, and tertiary enrollment (%) StructureSeparate telecommunications regulatorStatus of main fixed-line telephone operatorLevel of competition (competition, partial comp., monopoly)
International long distance serviceMobile telephone serviceInternet service
Efficiency and capacityTelecommunications revenue (% of GDP)Mobile cellular and fixed-line subscribers per employeeTelecommunications investment (% of revenue) PerformanceAccessTelephone lines (per 100 people)Mobile cellular subscriptions (per 100 people)Fixed broadband Internet subscribers (per 100 people)Personal computers (per 100 people)Households with a television (%)UsageInternational voice traffic total (minutes per person per month)Mobile telephone usage (minutes per user per month)Internet users (per 100 people)QualityPopulation covered by mobile cellular network (%)Fixed broadband Internet subscribers (% of total subscribers)International Internet bandwidth (bits per second per person)AffordabilityResidential fixed line tariff ($ a month)Mobile cellular prepaid tariff ($ a month)Fixed broadband Internet access tariff ($ a month)TradeICT goods exports (% of total goods exports)ICT goods imports (% of total goods imports)ICT service exports (% of total service exports)ApplicationsE-gov’t Web measure index (0–1, 1=highest presence)Secure Internet servers (per million people)
6 2011 The Little Data Book on Information and Communication Technology
Middle East & North Africa
2000 2009
280 33155 58
1,617 3,5974.5 4.768 7466 69
1.9 3.1139 88039.8 23.6
8.5 15.82.2 67.40.1 2.02.5 5.7
.. ..
.. ..
.. ..0.9 21.5
.. 93
.. 22.61 323
.. 3.0
.. 6.3
.. 22.7
.. ..
.. ..
.. ..
.. 0.200.2 2.4

Economic and social contextPopulation (millions)Urban population (% of total)GNI per capita, World Bank Atlas method ($)GDP growth, 1995–2000 and 2000–09 (avg. annual %)Adult literacy rate (% ages 15 and older) Gross primary, secondary, and tertiary enrollment (%) StructureSeparate telecommunications regulatorStatus of main fixed-line telephone operatorLevel of competition (competition, partial comp., monopoly)
International long distance serviceMobile telephone serviceInternet service
Efficiency and capacityTelecommunications revenue (% of GDP)Mobile cellular and fixed-line subscribers per employeeTelecommunications investment (% of revenue) PerformanceAccessTelephone lines (per 100 people)Mobile cellular subscriptions (per 100 people)Fixed broadband Internet subscribers (per 100 people)Personal computers (per 100 people)Households with a television (%)UsageInternational voice traffic, total (minutes per person per month)Mobile telephone usage (minutes per user per month)Internet users (per 100 people)QualityPopulation covered by mobile cellular network (%)Fixed broadband Internet subscribers (% of total subscribers)International Internet bandwidth (bits per second per person)AffordabilityResidential fixed line tariff ($ a month)Mobile cellular prepaid tariff ($ a month)Fixed broadband Internet access tariff ($ a month)TradeICT goods exports (% of total goods exports)ICT goods imports (% of total goods imports)ICT service exports (% of total service exports)ApplicationsE-gov’t Web measure index (0–1, 1=highest presence)Secure Internet servers (per million people)
7The Little Data Book on Information and Communication Technology 2011
South Asia
2000 2009
1,362 1,56827 30
442 1,1075.4 7.358 6149 58
1.5 2.060 565
25.9 ..
2.7 3.00.3 45.50.2 1.30.4 3.331 55
.. ..198 3410.5 5.5
24 610.0 51.3
1 31
.. 3.0
.. 1.2
.. 14.6
1.4 3.06.4 7.4
29.5 49.9
.. 0.240.1 1.9

Economic and social contextPopulation (millions)Urban population (% of total)GNI per capita, World Bank Atlas method ($)GDP growth, 1995–2000 and 2000–09 (avg. annual %)Adult literacy rate (% ages 15 and older) Gross primary, secondary, and tertiary enrollment (%) StructureSeparate telecommunications regulatorStatus of main fixed-line telephone operatorLevel of competition (competition, partial comp., monopoly)
International long distance serviceMobile telephone serviceInternet service
Efficiency and capacityTelecommunications revenue (% of GDP)Mobile cellular and fixed-line subscribers per employeeTelecommunications investment (% of revenue) PerformanceAccessTelephone lines (per 100 people)Mobile cellular subscriptions (per 100 people)Fixed broadband Internet subscribers (per 100 people)Personal computers (per 100 people)Households with a television (%)UsageInternational voice traffic total (minutes per person per month)Mobile telephone usage (minutes per user per month)Internet users (per 100 people)QualityPopulation covered by mobile cellular network (%)Fixed broadband Internet subscribers (% of total subscribers)International Internet bandwidth (bits per second per person)AffordabilityResidential fixed line tariff ($ a month)Mobile cellular prepaid tariff ($ a month)Fixed broadband Internet access tariff ($ a month)TradeICT goods exports (% of total goods exports)ICT goods imports (% of total goods imports)ICT service exports (% of total service exports)ApplicationsE-gov’t Web measure index (0–1, 1=highest presence)Secure Internet servers (per million people)
8 2011 The Little Data Book on Information and Communication Technology
Sub-Saharan Africa
2000 2009
672 84033 37
488 1,1253.2 5.157 6243 54
3.2 4.773 499
32.5 ..
1.4 1.51.7 37.30.2 0.20.9 1.8
.. ..
.. ..
.. ..0.5 8.8
.. 560.2 31.8
1 31
.. 11.5
.. 10.4
.. 88.0
0.9 1.08.9 7.8
.. 4.5
.. 0.10
.. 4.8

9The Little Data Book on Information and Communication Technology 2011
For operational and analytical purposes the World Bank’s main criterion
for classifying economies is gross national income (GNI) per capita. Every
economy in The Little Data Book on Information and Communication Technology
is classified as low income, middle income, or high income. Low- and middle-
income economies are sometimes referred to as developing economies. The
use of the term is convenient; it is not intended to imply that all economies
in the group are experiencing similar development or that other economies
have reached a preferred or final stage of development. Classification by
income does not necessarily reflect development status.
Low-income economies are those with a GNI per capita of $995 or less
in 2009.
Middle-income economies are those with a GNI per capita of more than
$995 but less than $12,196. Lower-middle-income and upper-middle-income
economies are separated at a GNI per capita of $3,945.
High-income economies are those with a GNI per capita of $12,196 or more.
Euro area includes the member states of the Economic and Monetary Union
of the European Union that have adopted the euro as their currency: Austria,
Belgium, Cyprus, Estonia, Finland, France, Germany, Greece, Ireland, Italy,
Luxembourg, Malta, Netherlands, Portugal, Slovak Republic, Slovenia, and
Spain.
Income group tables

Economic and social contextPopulation (millions)Urban population (% of total)GNI per capita, World Bank Atlas method ($)GDP growth, 1995–2000 and 2000–09 (avg. annual %)Adult literacy rate (% ages 15 and older) Gross primary, secondary, and tertiary enrollment (%) StructureSeparate telecommunications regulatorStatus of main fixed-line telephone operatorLevel of competition (competition, partial comp., monopoly)
International long distance serviceMobile telephone serviceInternet service
Efficiency and capacityTelecommunications revenue (% of GDP)Mobile cellular and fixed-line subscribers per employeeTelecommunications investment (% of revenue) PerformanceAccessTelephone lines (per 100 people)Mobile cellular subscriptions (per 100 people)Fixed broadband Internet subscribers (per 100 people)Personal computers (per 100 people)Households with a television (%)UsageInternational voice traffic total (minutes per person per month)Mobile telephone usage (minutes per user per month)Internet users (per 100 people)QualityPopulation covered by mobile cellular network (%)Fixed broadband Internet subscribers (% of total subscribers)International Internet bandwidth (bits per second per person)AffordabilityResidential fixed line tariff ($ a month)Mobile cellular prepaid tariff ($ a month)Fixed broadband Internet access tariff ($ a month)TradeICT goods exports (% of total goods exports)ICT goods imports (% of total goods imports)ICT service exports (% of total service exports)ApplicationsE-gov’t Web measure index (0–1, 1=highest presence)Secure Internet servers (per million people)
10 2011 The Little Data Book on Information and Communication Technology
Low income
2000 2009
695 84625 29
264 5094.1 5.458 6246 56
1.7 2.948 301
26.7 ..
0.6 1.20.3 26.60.0 0.10.3 0.9
.. ..
.. ..
.. ..0.1 2.7
.. 530.3 5.4
0 7
.. 8.8
.. 8.0
.. 89.9
0.2 0.6.. 5.9
3.9 6.5
.. 0.09
.. 0.6

Economic and social contextPopulation (millions)Urban population (% of total)GNI per capita, World Bank Atlas method ($)GDP growth, 1995–2000 and 2000–09 (avg. annual %)Adult literacy rate (% ages 15 and older) Gross primary, secondary, and tertiary enrollment (%) StructureSeparate telecommunications regulatorStatus of main fixed-line telephone operatorLevel of competition (competition, partial comp., monopoly)
International long distance serviceMobile telephone serviceInternet service
Efficiency and capacityTelecommunications revenue (% of GDP)Mobile cellular and fixed-line subscribers per employeeTelecommunications investment (% of revenue) PerformanceAccessTelephone lines (per 100 people)Mobile cellular subscriptions (per 100 people)Fixed broadband Internet subscribers (per 100 people)Personal computers (per 100 people)Households with a television (%)UsageInternational voice traffic, total (minutes per person per month)Mobile telephone usage (minutes per user per month)Internet users (per 100 people)QualityPopulation covered by mobile cellular network (%)Fixed broadband Internet subscribers (% of total subscribers)International Internet bandwidth (bits per second per person)AffordabilityResidential fixed line tariff ($ a month)Mobile cellular prepaid tariff ($ a month)Fixed broadband Internet access tariff ($ a month)TradeICT goods exports (% of total goods exports)ICT goods imports (% of total goods imports)ICT service exports (% of total service exports)ApplicationsE-gov’t Web measure index (0–1, 1=highest presence)Secure Internet servers (per million people)
11The Little Data Book on Information and Communication Technology 2011
Middle income
2000 2009
4,339 4,81343 48
1,267 3,3974.1 6.480 8362 67
2.8 3.2148 66527.7 22.5
9.0 14.74.9 66.70.6 6.92.0 5.5
.. ..
.. ..164 2841.7 20.9
.. 800.7 38.0
3 348
.. 5.7
.. 7.6
.. 22.0
16.9 16.318.2 16.6
7.1 13.3
.. 0.261.0 8.8

Economic and social contextPopulation (millions)Urban population (% of total)GNI per capita, World Bank Atlas method ($)GDP growth, 1995–2000 and 2000–09 (avg. annual %)Adult literacy rate (% ages 15 and older) Gross primary, secondary, and tertiary enrollment (%) StructureSeparate telecommunications regulatorStatus of main fixed-line telephone operatorLevel of competition (competition, partial comp., monopoly)
International long distance serviceMobile telephone serviceInternet service
Efficiency and capacityTelecommunications revenue (% of GDP)Mobile cellular and fixed-line subscribers per employeeTelecommunications investment (% of revenue) PerformanceAccessTelephone lines (per 100 people)Mobile cellular subscriptions (per 100 people)Fixed broadband Internet subscribers (per 100 people)Personal computers (per 100 people)Households with a television (%)UsageInternational voice traffic total (minutes per person per month)Mobile telephone usage (minutes per user per month)Internet users (per 100 people)QualityPopulation covered by mobile cellular network (%)Fixed broadband Internet subscribers (% of total subscribers)International Internet bandwidth (bits per second per person)AffordabilityResidential fixed line tariff ($ a month)Mobile cellular prepaid tariff ($ a month)Fixed broadband Internet access tariff ($ a month)TradeICT goods exports (% of total goods exports)ICT goods imports (% of total goods imports)ICT service exports (% of total service exports)ApplicationsE-gov’t Web measure index (0–1, 1=highest presence)Secure Internet servers (per million people)
12 2011 The Little Data Book on Information and Communication Technology
Lower middle income
2000 2009
3,416 3,81136 41
741 2,3215.6 8.577 8058 64
2.6 3.0111 60531.1 22.4
6.7 12.73.3 57.80.4 5.51.1 4.5
.. ..
.. ..192 3421.1 17.2
.. 770.2 40.1
1 151
.. 4.7
.. 7.1
.. 30.4
19.7 21.318.8 18.413.6 19.9
.. 0.240.2 2.7

Economic and social contextPopulation (millions)Urban population (% of total)GNI per capita, World Bank Atlas method ($)GDP growth, 1995–2000 and 2000–09 (avg. annual %)Adult literacy rate (% ages 15 and older) Gross primary, secondary, and tertiary enrollment (%) StructureSeparate telecommunications regulatorStatus of main fixed-line telephone operatorLevel of competition (competition, partial comp., monopoly)
International long distance serviceMobile telephone serviceInternet service
Efficiency and capacityTelecommunications revenue (% of GDP)Mobile cellular and fixed-line subscribers per employeeTelecommunications investment (% of revenue) PerformanceAccessTelephone lines (per 100 people)Mobile cellular subscriptions (per 100 people)Fixed broadband Internet subscribers (per 100 people)Personal computers (per 100 people)Households with a television (%)UsageInternational voice traffic, total (minutes per person per month)Mobile telephone usage (minutes per user per month)Internet users (per 100 people)QualityPopulation covered by mobile cellular network (%)Fixed broadband Internet subscribers (% of total subscribers)International Internet bandwidth (bits per second per person)AffordabilityResidential fixed line tariff ($ a month)Mobile cellular prepaid tariff ($ a month)Fixed broadband Internet access tariff ($ a month)TradeICT goods exports (% of total goods exports)ICT goods imports (% of total goods imports)ICT service exports (% of total service exports)ApplicationsE-gov’t Web measure index (0–1, 1=highest presence)Secure Internet servers (per million people)
13The Little Data Book on Information and Communication Technology 2011
Upper middle income
2000 2009
923 1,00272 75
3,214 7,5022.9 4.490 9278 82
2.9 3.3212 57627.7 18.0
17.3 22.110.8 100.6
1.3 19.45.4 11.2
.. 93
.. ..
.. 1573.8 34.6
.. 941.6 41.610 1,120
.. 10.0
.. 8.8
.. 18.8
14.7 12.217.7 15.1
4.0 5.4
.. 0.303.9 32.2

Economic and social contextPopulation (millions)Urban population (% of total)GNI per capita, World Bank Atlas method ($)GDP growth, 1995–2000 and 2000–09 (avg. annual %)Adult literacy rate (% ages 15 and older) Gross primary, secondary, and tertiary enrollment (%) StructureSeparate telecommunications regulatorStatus of main fixed-line telephone operatorLevel of competition (competition, partial comp., monopoly)
International long distance serviceMobile telephone serviceInternet service
Efficiency and capacityTelecommunications revenue (% of GDP)Mobile cellular and fixed-line subscribers per employeeTelecommunications investment (% of revenue) PerformanceAccessTelephone lines (per 100 people)Mobile cellular subscriptions (per 100 people)Fixed broadband Internet subscribers (per 100 people)Personal computers (per 100 people)Households with a television (%)UsageInternational voice traffic total (minutes per person per month)Mobile telephone usage (minutes per user per month)Internet users (per 100 people)QualityPopulation covered by mobile cellular network (%)Fixed broadband Internet subscribers (% of total subscribers)International Internet bandwidth (bits per second per person)AffordabilityResidential fixed line tariff ($ a month)Mobile cellular prepaid tariff ($ a month)Fixed broadband Internet access tariff ($ a month)TradeICT goods exports (% of total goods exports)ICT goods imports (% of total goods imports)ICT service exports (% of total service exports)ApplicationsE-gov’t Web measure index (0–1, 1=highest presence)Secure Internet servers (per million people)
14 2011 The Little Data Book on Information and Communication Technology
Low and middle income
2000 2009
5,034 5,65941 45
1,128 2,9684.1 6.478 8059 65
2.7 3.297 624
27.3 ..
7.8 12.64.3 60.70.5 6.21.8 5.1
.. ..
.. ..
.. 2801.5 18.1
.. 761.9 37.9
3 299
.. 6.6
.. 7.9
.. 31.5
16.7 16.218.0 16.4
7.0 13.1
.. 0.180.9 7.6

Economic and social contextPopulation (millions)Urban population (% of total)GNI per capita, World Bank Atlas method ($)GDP growth, 1995–2000 and 2000–09 (avg. annual %)Adult literacy rate (% ages 15 and older) Gross primary, secondary, and tertiary enrollment (%) StructureSeparate telecommunications regulatorStatus of main fixed-line telephone operatorLevel of competition (competition, partial comp., monopoly)
International long distance serviceMobile telephone serviceInternet service
Efficiency and capacityTelecommunications revenue (% of GDP)Mobile cellular and fixed-line subscribers per employeeTelecommunications investment (% of revenue) PerformanceAccessTelephone lines (per 100 people)Mobile cellular subscriptions (per 100 people)Fixed broadband Internet subscribers (per 100 people)Personal computers (per 100 people)Households with a television (%)UsageInternational voice traffic, total (minutes per person per month)Mobile telephone usage (minutes per user per month)Internet users (per 100 people)QualityPopulation covered by mobile cellular network (%)Fixed broadband Internet subscribers (% of total subscribers)International Internet bandwidth (bits per second per person)AffordabilityResidential fixed line tariff ($ a month)Mobile cellular prepaid tariff ($ a month)Fixed broadband Internet access tariff ($ a month)TradeICT goods exports (% of total goods exports)ICT goods imports (% of total goods imports)ICT service exports (% of total service exports)ApplicationsE-gov’t Web measure index (0–1, 1=highest presence)Secure Internet servers (per million people)
15The Little Data Book on Information and Communication Technology 2011
Euro area
2000 2009
312 32772 73
21,980 38,8722.8 1.5
.. ..90 94
2.6 2.6408 76523.0 14.5
53.0 47.960.3 123.212.4 26.926.0 56.0
95 98
.. ..106 14622.8 67.3
99 993.5 80.7
827 32,455
.. 27.6
.. 19.6
.. 29.0
11.6 6.613.1 8.6
6.0 9.8
.. 0.4838.4 544.6

Economic and social contextPopulation (millions)Urban population (% of total)GNI per capita, World Bank Atlas method ($)GDP growth, 1995–2000 and 2000–09 (avg. annual %)Adult literacy rate (% ages 15 and older) Gross primary, secondary, and tertiary enrollment (%) StructureSeparate telecommunications regulatorStatus of main fixed-line telephone operatorLevel of competition (competition, partial comp., monopoly)
International long distance serviceMobile telephone serviceInternet service
Efficiency and capacityTelecommunications revenue (% of GDP)Mobile cellular and fixed-line subscribers per employeeTelecommunications investment (% of revenue) PerformanceAccessTelephone lines (per 100 people)Mobile cellular subscriptions (per 100 people)Fixed broadband Internet subscribers (per 100 people)Personal computers (per 100 people)Households with a television (%)UsageInternational voice traffic total (minutes per person per month)Mobile telephone usage (minutes per user per month)Internet users (per 100 people)QualityPopulation covered by mobile cellular network (%)Fixed broadband Internet subscribers (% of total subscribers)International Internet bandwidth (bits per second per person)AffordabilityResidential fixed line tariff ($ a month)Mobile cellular prepaid tariff ($ a month)Fixed broadband Internet access tariff ($ a month)TradeICT goods exports (% of total goods exports)ICT goods imports (% of total goods imports)ICT service exports (% of total service exports)ApplicationsE-gov’t Web measure index (0–1, 1=highest presence)Secure Internet servers (per million people)
16 2011 The Little Data Book on Information and Communication Technology
High income
2000 2009
1,051 1,11775 77
25,241 37,9903.1 2.098 9887 91
2.9 3.0354 76525.9 15.5
55.4 45.149.9 111.212.8 24.336.4 65.4
.. 98
.. ..206 34330.5 72.3
98 9919.9 89.2564 19,521
.. 22.8
.. 14.8
.. 28.8
18.3 12.217.7 13.3
5.2 8.1
.. 0.46110.7 905.1

17The Little Data Book on Information and Communication Technology 2011
China
Data for China do not include data for Hong Kong SAR, China; Macao SAR,
China; or Taiwan, China.
Cyprus
GNI and GDP data and data calculated using GNI and GDP refer to the area
controlled by the government of the Republic of Cyprus. For more information,
see World Development Indicators 2011 or data.worldbank.org.
Georgia
GNI and GDP data and data calculated using GNI and GDP exclude Abkhazia
and South Ossetia. For more information, see World Development Indicators
2011 or data.worldbank.org
Kosovo, Montenegro, and Serbia
Montenegro declared independence from Serbia and Montenegro on June 3,
2006. Where available, data for each country are shown separately. However,
some indicators for Serbia prior to 2006 include data for Montenegro.
Moreover, data for most indicators for Serbia from 1999 onward exclude
data for Kosovo, which in 1999 became a territory under international
administration pursuant to UN Security Council Resolution 1244 (1999).
Kosovo became a member of the World Bank on June 29, 2009, and its
data are shown where available.
Moldova
GNI and GDP data and data calculated using GNI and GDP exclude Transnistria.
For more information, see World Development Indicators 2011 or data.world-
bank.org.
Morocco
GNI and GDP data and data calculated using GNI and GDP include Former
Spanish Sahara. For more information, see World Development Indicators
2011 or data.worldbank.org.
Netherlands Antilles
Netherlands Antilles ceased to exist on October 10, 2010. Curacao and St.
Maarten became countries within the Kingdom of Netherlands. Bonaire, St.
Eustatius, and Saba became special municipalities of the Netherlands.
Tanzania
GNI and GDP data and data calculated using GNI and GDP refer to mainland
Tanzania only. For more information, see World Development Indicators 2011
or data.worldbank.org.
Country tables

Economic and social contextPopulation (millions)Urban population (% of total)GNI per capita, World Bank Atlas method ($)GDP growth, 1995–2000 and 2000–09 (avg. annual %)Adult literacy rate (% ages 15 and older) Gross primary, secondary, and tertiary enrollment (%) StructureSeparate telecommunications regulatorStatus of main fixed-line telephone operatorLevel of competition (competition, partial comp., monopoly)
International long distance serviceMobile telephone serviceInternet service
Efficiency and capacityTelecommunications revenue (% of GDP)Mobile cellular and fixed-line subscribers per employeeTelecommunications investment (% of revenue) PerformanceAccessTelephone lines (per 100 people)Mobile cellular subscriptions (per 100 people)Fixed broadband Internet subscribers (per 100 people)Personal computers (per 100 people)Households with a television (%)UsageInternational voice traffic total (minutes per person per month)Mobile telephone usage (minutes per user per month)Internet users (per 100 people)QualityPopulation covered by mobile cellular network (%)Fixed broadband Internet subscribers (% of total subscribers)International Internet bandwidth (bits per second per person)AffordabilityResidential fixed line tariff ($ a month)Mobile cellular prepaid tariff ($ a month)Fixed broadband Internet access tariff ($ a month)TradeICT goods exports (% of total goods exports)ICT goods imports (% of total goods imports)ICT service exports (% of total service exports)ApplicationsE-gov’t Web measure index (0–1, 1=highest presence)Secure Internet servers (per million people)
18 2011 The Little Data Book on Information and Communication Technology
Country dataLow-
income group
2000 2009 2009
AfghanistanSouth Asia Low income
24 30 84621 24 29
.. 310 509
.. 10.5 5.4
.. .. 6214 55 56
No YesPublic Public
C P.. P.. P
3.8 0.0 2.9.. 58 301.. 37.8 ..
0.1 0.4 1.20.0 40.3 26.60.0 0.0 0.1
.. 0.4 0.9
.. .. ..
.. 0.6 ..
.. .. ..0.0 3.4 2.7
.. 75 53
.. 50.0 5.4
.. 550 7
.. .. 8.8
.. .. 8.0
.. .. 89.9
.. .. 0.6
.. 0.4 5.9
.. .. 6.5
.. 0.23 0.09
.. 0.7 0.6

Economic and social contextPopulation (millions)Urban population (% of total)GNI per capita, World Bank Atlas method ($)GDP growth, 1995–2000 and 2000–09 (avg. annual %)Adult literacy rate (% ages 15 and older) Gross primary, secondary, and tertiary enrollment (%) StructureSeparate telecommunications regulatorStatus of main fixed-line telephone operatorLevel of competition (competition, partial comp., monopoly)
International long distance serviceMobile telephone serviceInternet service
Efficiency and capacityTelecommunications revenue (% of GDP)Mobile cellular and fixed-line subscribers per employeeTelecommunications investment (% of revenue) PerformanceAccessTelephone lines (per 100 people)Mobile cellular subscriptions (per 100 people)Fixed broadband Internet subscribers (per 100 people)Personal computers (per 100 people)Households with a television (%)UsageInternational voice traffic, total (minutes per person per month)Mobile telephone usage (minutes per user per month)Internet users (per 100 people)QualityPopulation covered by mobile cellular network (%)Fixed broadband Internet subscribers (% of total subscribers)International Internet bandwidth (bits per second per person)AffordabilityResidential fixed line tariff ($ a month)Mobile cellular prepaid tariff ($ a month)Fixed broadband Internet access tariff ($ a month)TradeICT goods exports (% of total goods exports)ICT goods imports (% of total goods imports)ICT service exports (% of total service exports)ApplicationsE-gov’t Web measure index (0–1, 1=highest presence)Secure Internet servers (per million people)
19The Little Data Book on Information and Communication Technology 2011
Country data
Upper middle-income group
2000 2009 2009
AlbaniaEurope & Central Asia Upper middle income
3 3 1,00242 47 75
1,170 4,000 7,5025.2 5.4 4.499 96 9268 68 82
Yes YesPublic Public
M PC PC C
1.8 6.0 3.340 871 576
28.4 10.4 18.0
5.0 11.5 22.11.0 131.9 100.60.2 3.3 19.40.8 4.6 11.290 .. 93
.. 21.9 ..
.. 56 1570.1 41.2 34.6
84 99 940.0 85.7 41.6
4 1,902 1,120
.. 6.0 10.0
.. 13.4 8.8
.. 22.0 18.8
0.7 1.1 12.24.3 5.4 15.14.8 5.7 5.4
.. 0.31 0.300.3 8.5 32.2

Economic and social contextPopulation (millions)Urban population (% of total)GNI per capita, World Bank Atlas method ($)GDP growth, 1995–2000 and 2000–09 (avg. annual %)Adult literacy rate (% ages 15 and older) Gross primary, secondary, and tertiary enrollment (%) StructureSeparate telecommunications regulatorStatus of main fixed-line telephone operatorLevel of competition (competition, partial comp., monopoly)
International long distance serviceMobile telephone serviceInternet service
Efficiency and capacityTelecommunications revenue (% of GDP)Mobile cellular and fixed-line subscribers per employeeTelecommunications investment (% of revenue) PerformanceAccessTelephone lines (per 100 people)Mobile cellular subscriptions (per 100 people)Fixed broadband Internet subscribers (per 100 people)Personal computers (per 100 people)Households with a television (%)UsageInternational voice traffic total (minutes per person per month)Mobile telephone usage (minutes per user per month)Internet users (per 100 people)QualityPopulation covered by mobile cellular network (%)Fixed broadband Internet subscribers (% of total subscribers)International Internet bandwidth (bits per second per person)AffordabilityResidential fixed line tariff ($ a month)Mobile cellular prepaid tariff ($ a month)Fixed broadband Internet access tariff ($ a month)TradeICT goods exports (% of total goods exports)ICT goods imports (% of total goods imports)ICT service exports (% of total service exports)ApplicationsE-gov’t Web measure index (0–1, 1=highest presence)Secure Internet servers (per million people)
20 2011 The Little Data Book on Information and Communication Technology
Country data
Upper middle-income group
2000 2009 2009
Middle East & North Africa Upper middle income
Algeria
31 35 1,00260 66 75
1,610 4,420 7,5023.2 4.0 4.470 73 9268 74 82
No YesPublic Public
M PM P.. C
0.6 2.5 3.3103 285 57623.9 23.7 18.0
5.8 7.4 22.10.3 93.8 100.60.2 0.6 19.40.7 1.1 11.2
.. .. 93
.. 2.8 ..
.. 222 1570.5 13.5 34.6
40 82 940.0 71.1 41.6
0 5 1,120
.. 4.2 10.0
.. 6.3 8.8
.. 15.4 18.8
0.0 0.0 12.25.9 4.9 15.1
.. .. 5.4
.. 0.10 0.30
.. 0.9 32.2

Economic and social contextPopulation (millions)Urban population (% of total)GNI per capita, World Bank Atlas method ($)GDP growth, 1995–2000 and 2000–09 (avg. annual %)Adult literacy rate (% ages 15 and older) Gross primary, secondary, and tertiary enrollment (%) StructureSeparate telecommunications regulatorStatus of main fixed-line telephone operatorLevel of competition (competition, partial comp., monopoly)
International long distance serviceMobile telephone serviceInternet service
Efficiency and capacityTelecommunications revenue (% of GDP)Mobile cellular and fixed-line subscribers per employeeTelecommunications investment (% of revenue) PerformanceAccessTelephone lines (per 100 people)Mobile cellular subscriptions (per 100 people)Fixed broadband Internet subscribers (per 100 people)Personal computers (per 100 people)Households with a television (%)UsageInternational voice traffic, total (minutes per person per month)Mobile telephone usage (minutes per user per month)Internet users (per 100 people)QualityPopulation covered by mobile cellular network (%)Fixed broadband Internet subscribers (% of total subscribers)International Internet bandwidth (bits per second per person)AffordabilityResidential fixed line tariff ($ a month)Mobile cellular prepaid tariff ($ a month)Fixed broadband Internet access tariff ($ a month)TradeICT goods exports (% of total goods exports)ICT goods imports (% of total goods imports)ICT service exports (% of total service exports)ApplicationsE-gov’t Web measure index (0–1, 1=highest presence)Secure Internet servers (per million people)
21The Little Data Book on Information and Communication Technology 2011
East Asia & Pacific Upper middle income
Country data
Upper middle-income group
2000 2009 2009
American Samoa
0.06 0.07 1,00289 93 75
.. .. 7,502
.. .. 4.4
.. .. 92
.. .. 82
.. Yes
.. ..
.. ..
.. ..
.. ..
.. .. 3.382 .. 576
.. .. 18.0
17.8 15.5 22.13.5 3.6 100.6
.. .. 19.4
.. .. 11.2
.. .. 93
.. .. ..
.. .. 157
.. .. 34.6
.. .. 94
.. .. 41.6
.. .. 1,120
.. .. 10.0
.. .. 8.8
.. .. 18.8
.. .. 12.2
.. .. 15.1
.. .. 5.4
.. .. 0.30
.. 29.3 32.2

Economic and social contextPopulation (millions)Urban population (% of total)GNI per capita, World Bank Atlas method ($)GDP growth, 1995–2000 and 2000–09 (avg. annual %)Adult literacy rate (% ages 15 and older) Gross primary, secondary, and tertiary enrollment (%) StructureSeparate telecommunications regulatorStatus of main fixed-line telephone operatorLevel of competition (competition, partial comp., monopoly)
International long distance serviceMobile telephone serviceInternet service
Efficiency and capacityTelecommunications revenue (% of GDP)Mobile cellular and fixed-line subscribers per employeeTelecommunications investment (% of revenue) PerformanceAccessTelephone lines (per 100 people)Mobile cellular subscriptions (per 100 people)Fixed broadband Internet subscribers (per 100 people)Personal computers (per 100 people)Households with a television (%)UsageInternational voice traffic total (minutes per person per month)Mobile telephone usage (minutes per user per month)Internet users (per 100 people)QualityPopulation covered by mobile cellular network (%)Fixed broadband Internet subscribers (% of total subscribers)International Internet bandwidth (bits per second per person)AffordabilityResidential fixed line tariff ($ a month)Mobile cellular prepaid tariff ($ a month)Fixed broadband Internet access tariff ($ a month)TradeICT goods exports (% of total goods exports)ICT goods imports (% of total goods imports)ICT service exports (% of total service exports)ApplicationsE-gov’t Web measure index (0–1, 1=highest presence)Secure Internet servers (per million people)
22 2011 The Little Data Book on Information and Communication Technology
Country dataHigh-
income group
2000 2009 2009
High income
Andorra
.. 0.09 1,11792 88 77
.. 41,130 37,9904.6 5.9 2.0
.. .. 9865 66 91
.. NoPublic Public
M MM M.. M
.. 3.6 3.0
.. 415 765
.. .. 15.5
.. 44.6 45.1
.. 76.6 111.2
.. 33.1 24.3
.. .. 65.4
.. .. 98
.. .. ..
.. .. 343
.. 70.5 72.3
91 99 9919.1 72.4 89.2
.. 16,466 19,521
.. .. 22.8
.. .. 14.8
.. .. 28.8
4.5 11.4 12.28.8 14.0 13.3
.. .. 8.1
.. 0.23 0.46
.. 901.2 905.1

Economic and social contextPopulation (millions)Urban population (% of total)GNI per capita, World Bank Atlas method ($)GDP growth, 1995–2000 and 2000–09 (avg. annual %)Adult literacy rate (% ages 15 and older) Gross primary, secondary, and tertiary enrollment (%) StructureSeparate telecommunications regulatorStatus of main fixed-line telephone operatorLevel of competition (competition, partial comp., monopoly)
International long distance serviceMobile telephone serviceInternet service
Efficiency and capacityTelecommunications revenue (% of GDP)Mobile cellular and fixed-line subscribers per employeeTelecommunications investment (% of revenue) PerformanceAccessTelephone lines (per 100 people)Mobile cellular subscriptions (per 100 people)Fixed broadband Internet subscribers (per 100 people)Personal computers (per 100 people)Households with a television (%)UsageInternational voice traffic, total (minutes per person per month)Mobile telephone usage (minutes per user per month)Internet users (per 100 people)QualityPopulation covered by mobile cellular network (%)Fixed broadband Internet subscribers (% of total subscribers)International Internet bandwidth (bits per second per person)AffordabilityResidential fixed line tariff ($ a month)Mobile cellular prepaid tariff ($ a month)Fixed broadband Internet access tariff ($ a month)TradeICT goods exports (% of total goods exports)ICT goods imports (% of total goods imports)ICT service exports (% of total service exports)ApplicationsE-gov’t Web measure index (0–1, 1=highest presence)Secure Internet servers (per million people)
23The Little Data Book on Information and Communication Technology 2011
Country data
Lower middle-income group
2000 2009 2009
Sub-Saharan Africa Lower middle income
Angola
14 18 3,81149 58 41
410 3,750 2,3216.3 13.1 8.567 70 80
.. .. 64
Yes YesPublic Public
M CP CP C
1.2 2.0 3.043 586 605
.. 25.3 22.4
0.5 1.6 12.70.2 43.8 57.80.0 0.6 5.50.1 0.6 4.5
.. 36 ..
.. .. ..
.. 103 3420.1 3.3 17.2
.. 40 770.0 14.9 40.1
0 17 151
.. 16.6 4.7
.. 11.0 7.1
.. 157.4 30.4
.. .. 21.3
.. .. 18.40.0 5.4 19.9
.. 0.34 0.24
.. 2.7 2.7

Economic and social contextPopulation (millions)Urban population (% of total)GNI per capita, World Bank Atlas method ($)GDP growth, 1995–2000 and 2000–09 (avg. annual %)Adult literacy rate (% ages 15 and older) Gross primary, secondary, and tertiary enrollment (%) StructureSeparate telecommunications regulatorStatus of main fixed-line telephone operatorLevel of competition (competition, partial comp., monopoly)
International long distance serviceMobile telephone serviceInternet service
Efficiency and capacityTelecommunications revenue (% of GDP)Mobile cellular and fixed-line subscribers per employeeTelecommunications investment (% of revenue) PerformanceAccessTelephone lines (per 100 people)Mobile cellular subscriptions (per 100 people)Fixed broadband Internet subscribers (per 100 people)Personal computers (per 100 people)Households with a television (%)UsageInternational voice traffic total (minutes per person per month)Mobile telephone usage (minutes per user per month)Internet users (per 100 people)QualityPopulation covered by mobile cellular network (%)Fixed broadband Internet subscribers (% of total subscribers)International Internet bandwidth (bits per second per person)AffordabilityResidential fixed line tariff ($ a month)Mobile cellular prepaid tariff ($ a month)Fixed broadband Internet access tariff ($ a month)TradeICT goods exports (% of total goods exports)ICT goods imports (% of total goods imports)ICT service exports (% of total service exports)ApplicationsE-gov’t Web measure index (0–1, 1=highest presence)Secure Internet servers (per million people)
24 2011 The Little Data Book on Information and Communication Technology
Country data
Upper middle-income group
2000 2009 2009
Latin American & Caribbean Upper middle income
Antigua and Barbuda
0.08 0.09 1,00232 30 75
7,960 12,130 7,5024.4 5.2 4.499 99 92
.. .. 82
.. NoPublic Public
M MC PM P
.. .. 3.3128 .. 576
.. .. 18.0
49.7 42.6 22.128.5 154.0 100.6
.. 17.8 19.410.2 20.7 11.2
89 .. 93
.. .. ..
.. .. 1576.5 74.2 34.6
85 100 94.. 95.5 41.6
356 13,699 1,120
.. 14.7 10.0
.. 12.2 8.8
.. 47.8 18.8
40.6 9.7 12.210.1 8.2 15.1
4.4 3.4 5.4
.. 0.12 0.30241.6 1,084.1 32.2

Economic and social contextPopulation (millions)Urban population (% of total)GNI per capita, World Bank Atlas method ($)GDP growth, 1995–2000 and 2000–09 (avg. annual %)Adult literacy rate (% ages 15 and older) Gross primary, secondary, and tertiary enrollment (%) StructureSeparate telecommunications regulatorStatus of main fixed-line telephone operatorLevel of competition (competition, partial comp., monopoly)
International long distance serviceMobile telephone serviceInternet service
Efficiency and capacityTelecommunications revenue (% of GDP)Mobile cellular and fixed-line subscribers per employeeTelecommunications investment (% of revenue) PerformanceAccessTelephone lines (per 100 people)Mobile cellular subscriptions (per 100 people)Fixed broadband Internet subscribers (per 100 people)Personal computers (per 100 people)Households with a television (%)UsageInternational voice traffic, total (minutes per person per month)Mobile telephone usage (minutes per user per month)Internet users (per 100 people)QualityPopulation covered by mobile cellular network (%)Fixed broadband Internet subscribers (% of total subscribers)International Internet bandwidth (bits per second per person)AffordabilityResidential fixed line tariff ($ a month)Mobile cellular prepaid tariff ($ a month)Fixed broadband Internet access tariff ($ a month)TradeICT goods exports (% of total goods exports)ICT goods imports (% of total goods imports)ICT service exports (% of total service exports)ApplicationsE-gov’t Web measure index (0–1, 1=highest presence)Secure Internet servers (per million people)
25The Little Data Book on Information and Communication Technology 2011
Country data
Upper middle-income group
2000 2009 2009
Latin America & Caribbean Upper middle income
Argentina
37 40 1,00290 92 75
7,460 7,550 7,5022.7 5.4 4.497 98 9288 91 82
Yes YesPrivate Private
P CP CC C
3.3 3.1 3.3700 1,929 57620.1 .. 18.0
21.4 24.2 22.117.6 128.8 100.6
3.3 9.4 19.46.9 9.0 11.2
.. .. 93
.. .. ..89 91 1577.0 30.4 34.6
30 94 945.7 85.2 41.612 2,320 1,120
.. 3.9 10.0
.. 13.7 8.8
.. 31.2 18.8
0.7 0.4 12.215.3 11.2 15.1
6.5 12.2 5.4
.. 0.41 0.306.4 25.9 32.2

Economic and social contextPopulation (millions)Urban population (% of total)GNI per capita, World Bank Atlas method ($)GDP growth, 1995–2000 and 2000–09 (avg. annual %)Adult literacy rate (% ages 15 and older) Gross primary, secondary, and tertiary enrollment (%) StructureSeparate telecommunications regulatorStatus of main fixed-line telephone operatorLevel of competition (competition, partial comp., monopoly)
International long distance serviceMobile telephone serviceInternet service
Efficiency and capacityTelecommunications revenue (% of GDP)Mobile cellular and fixed-line subscribers per employeeTelecommunications investment (% of revenue) PerformanceAccessTelephone lines (per 100 people)Mobile cellular subscriptions (per 100 people)Fixed broadband Internet subscribers (per 100 people)Personal computers (per 100 people)Households with a television (%)UsageInternational voice traffic total (minutes per person per month)Mobile telephone usage (minutes per user per month)Internet users (per 100 people)QualityPopulation covered by mobile cellular network (%)Fixed broadband Internet subscribers (% of total subscribers)International Internet bandwidth (bits per second per person)AffordabilityResidential fixed line tariff ($ a month)Mobile cellular prepaid tariff ($ a month)Fixed broadband Internet access tariff ($ a month)TradeICT goods exports (% of total goods exports)ICT goods imports (% of total goods imports)ICT service exports (% of total service exports)ApplicationsE-gov’t Web measure index (0–1, 1=highest presence)Secure Internet servers (per million people)
26 2011 The Little Data Book on Information and Communication Technology
Europe & Central Asia Lower middle income
Country data
Lower middle-income group
2000 2009 2009
Armenia
3 3 3,81165 64 41
660 3,100 2,3215.1 10.5 8.599 100 8076 75 64
.. YesMixed Mixed
M MM PC C
3.0 4.5 3.071 173 605
46.3 23.6 22.4
17.3 20.4 12.70.6 85.0 57.80.4 2.9 5.50.8 9.7 4.589 97 ..
.. .. ..
.. 209 3421.3 6.8 17.2
38 88 770.0 1.1 40.1
3 22 151
.. 4.1 4.7
.. 5.8 7.1
.. 31.5 30.4
2.1 1.5 21.37.0 5.0 18.4
13.0 16.1 19.9
.. 0.17 0.240.3 17.5 2.7

Economic and social contextPopulation (millions)Urban population (% of total)GNI per capita, World Bank Atlas method ($)GDP growth, 1995–2000 and 2000–09 (avg. annual %)Adult literacy rate (% ages 15 and older) Gross primary, secondary, and tertiary enrollment (%) StructureSeparate telecommunications regulatorStatus of main fixed-line telephone operatorLevel of competition (competition, partial comp., monopoly)
International long distance serviceMobile telephone serviceInternet service
Efficiency and capacityTelecommunications revenue (% of GDP)Mobile cellular and fixed-line subscribers per employeeTelecommunications investment (% of revenue) PerformanceAccessTelephone lines (per 100 people)Mobile cellular subscriptions (per 100 people)Fixed broadband Internet subscribers (per 100 people)Personal computers (per 100 people)Households with a television (%)UsageInternational voice traffic, total (minutes per person per month)Mobile telephone usage (minutes per user per month)Internet users (per 100 people)QualityPopulation covered by mobile cellular network (%)Fixed broadband Internet subscribers (% of total subscribers)International Internet bandwidth (bits per second per person)AffordabilityResidential fixed line tariff ($ a month)Mobile cellular prepaid tariff ($ a month)Fixed broadband Internet access tariff ($ a month)TradeICT goods exports (% of total goods exports)ICT goods imports (% of total goods imports)ICT service exports (% of total service exports)ApplicationsE-gov’t Web measure index (0–1, 1=highest presence)Secure Internet servers (per million people)
27The Little Data Book on Information and Communication Technology 2011
High income
Country dataHigh-
income group
2000 2009 2009
Aruba
0.09 0.11 1,11747 47 77
.. .. 37,9904.4 .. 2.097 98 9887 84 91
.. No
.. ..
.. ..
.. ..
.. ..
4.8 .. 3.0130 422 765
.. 15.8 15.5
42.0 36.0 45.116.5 120.2 111.2
8.6 17.4 24.3.. 9.7 65.4.. 97 98
.. .. ..
.. .. 34315.4 22.5 72.3
.. 99 990.0 100.0 89.2
970 11,778 19,521
.. .. 22.8
.. .. 14.8
.. .. 28.8
.. 0.6 12.2
.. 5.6 13.31.1 1.1 8.1
.. .. 0.4632.3 344.6 905.1

Economic and social contextPopulation (millions)Urban population (% of total)GNI per capita, World Bank Atlas method ($)GDP growth, 1995–2000 and 2000–09 (avg. annual %)Adult literacy rate (% ages 15 and older) Gross primary, secondary, and tertiary enrollment (%) StructureSeparate telecommunications regulatorStatus of main fixed-line telephone operatorLevel of competition (competition, partial comp., monopoly)
International long distance serviceMobile telephone serviceInternet service
Efficiency and capacityTelecommunications revenue (% of GDP)Mobile cellular and fixed-line subscribers per employeeTelecommunications investment (% of revenue) PerformanceAccessTelephone lines (per 100 people)Mobile cellular subscriptions (per 100 people)Fixed broadband Internet subscribers (per 100 people)Personal computers (per 100 people)Households with a television (%)UsageInternational voice traffic total (minutes per person per month)Mobile telephone usage (minutes per user per month)Internet users (per 100 people)QualityPopulation covered by mobile cellular network (%)Fixed broadband Internet subscribers (% of total subscribers)International Internet bandwidth (bits per second per person)AffordabilityResidential fixed line tariff ($ a month)Mobile cellular prepaid tariff ($ a month)Fixed broadband Internet access tariff ($ a month)TradeICT goods exports (% of total goods exports)ICT goods imports (% of total goods imports)ICT service exports (% of total service exports)ApplicationsE-gov’t Web measure index (0–1, 1=highest presence)Secure Internet servers (per million people)
28 2011 The Little Data Book on Information and Communication Technology
High income
Country dataHigh-
income group
2000 2009 2009
Australia
19 22 1,11787 89 77
21,260 43,770 37,9904.4 3.3 2.0
.. .. 98115 114 91
Yes YesMixed Mixed
C CC CC C
3.1 3.4 3.0181 346 76530.9 18.8 15.5
52.5 41.2 45.144.7 110.7 111.220.5 28.8 24.347.0 60.3 65.4
.. .. 98
.. .. ..98 111 343
46.8 72.0 72.3
96 99 992.9 85.7 89.2
128 5,457 19,521
.. 26.0 22.8
.. 34.9 14.8
.. 26.0 28.8
3.2 1.4 12.216.3 11.4 13.3
7.0 4.9 8.1
.. 0.77 0.46176.3 1,760.9 905.1

Economic and social contextPopulation (millions)Urban population (% of total)GNI per capita, World Bank Atlas method ($)GDP growth, 1995–2000 and 2000–09 (avg. annual %)Adult literacy rate (% ages 15 and older) Gross primary, secondary, and tertiary enrollment (%) StructureSeparate telecommunications regulatorStatus of main fixed-line telephone operatorLevel of competition (competition, partial comp., monopoly)
International long distance serviceMobile telephone serviceInternet service
Efficiency and capacityTelecommunications revenue (% of GDP)Mobile cellular and fixed-line subscribers per employeeTelecommunications investment (% of revenue) PerformanceAccessTelephone lines (per 100 people)Mobile cellular subscriptions (per 100 people)Fixed broadband Internet subscribers (per 100 people)Personal computers (per 100 people)Households with a television (%)UsageInternational voice traffic, total (minutes per person per month)Mobile telephone usage (minutes per user per month)Internet users (per 100 people)QualityPopulation covered by mobile cellular network (%)Fixed broadband Internet subscribers (% of total subscribers)International Internet bandwidth (bits per second per person)AffordabilityResidential fixed line tariff ($ a month)Mobile cellular prepaid tariff ($ a month)Fixed broadband Internet access tariff ($ a month)TradeICT goods exports (% of total goods exports)ICT goods imports (% of total goods imports)ICT service exports (% of total service exports)ApplicationsE-gov’t Web measure index (0–1, 1=highest presence)Secure Internet servers (per million people)
29The Little Data Book on Information and Communication Technology 2011
High income
Country dataHigh-
income group
2000 2009 2009
Austria
8 8 1,11766 67 77
25,840 46,450 37,9903.0 2.0 2.0
.. .. 9890 89 91
Yes YesMixed Mixed
C CP CC C
2.4 1.7 3.0545 843 76518.8 14.4 15.5
49.9 38.9 45.176.4 140.8 111.213.1 25.6 24.336.2 60.7 65.4
93 97 98
.. .. ..123 194 34333.7 73.5 72.3
98 99 9918.1 87.7 89.2
1,034 20,323 19,521
.. 27.3 22.8
.. 6.8 14.8
.. 36.1 28.8
7.9 5.5 12.210.9 7.0 13.3
3.4 6.5 8.1
.. 0.48 0.4683.2 856.9 905.1

Economic and social contextPopulation (millions)Urban population (% of total)GNI per capita, World Bank Atlas method ($)GDP growth, 1995–2000 and 2000–09 (avg. annual %)Adult literacy rate (% ages 15 and older) Gross primary, secondary, and tertiary enrollment (%) StructureSeparate telecommunications regulatorStatus of main fixed-line telephone operatorLevel of competition (competition, partial comp., monopoly)
International long distance serviceMobile telephone serviceInternet service
Efficiency and capacityTelecommunications revenue (% of GDP)Mobile cellular and fixed-line subscribers per employeeTelecommunications investment (% of revenue) PerformanceAccessTelephone lines (per 100 people)Mobile cellular subscriptions (per 100 people)Fixed broadband Internet subscribers (per 100 people)Personal computers (per 100 people)Households with a television (%)UsageInternational voice traffic total (minutes per person per month)Mobile telephone usage (minutes per user per month)Internet users (per 100 people)QualityPopulation covered by mobile cellular network (%)Fixed broadband Internet subscribers (% of total subscribers)International Internet bandwidth (bits per second per person)AffordabilityResidential fixed line tariff ($ a month)Mobile cellular prepaid tariff ($ a month)Fixed broadband Internet access tariff ($ a month)TradeICT goods exports (% of total goods exports)ICT goods imports (% of total goods imports)ICT service exports (% of total service exports)ApplicationsE-gov’t Web measure index (0–1, 1=highest presence)Secure Internet servers (per million people)
30 2011 The Little Data Book on Information and Communication Technology
Country data
Upper middle-income group
2000 2009 2009
Europe & Central Asia Upper middle income
Azerbaijan
8 9 1,00251 52 75
610 4,840 7,5027.3 17.9 4.499 100 9272 77 82
.. NoPublic Mixed
M PC P.. C
1.6 2.4 3.3123 484 57627.9 17.6 18.0
10.0 15.9 22.15.2 88.3 100.60.0 5.9 19.40.7 8.0 11.2
.. 99 93
.. 6.4 ..
.. 97 1570.1 42.0 34.6
94 99 940.0 19.2 41.6
0 1,399 1,120
.. 2.5 10.0
.. 4.4 8.8
.. 48.8 18.8
0.3 0.0 12.210.6 8.5 15.1
.. 4.7 5.4
.. 0.32 0.300.1 5.2 32.2

Economic and social contextPopulation (millions)Urban population (% of total)GNI per capita, World Bank Atlas method ($)GDP growth, 1995–2000 and 2000–09 (avg. annual %)Adult literacy rate (% ages 15 and older) Gross primary, secondary, and tertiary enrollment (%) StructureSeparate telecommunications regulatorStatus of main fixed-line telephone operatorLevel of competition (competition, partial comp., monopoly)
International long distance serviceMobile telephone serviceInternet service
Efficiency and capacityTelecommunications revenue (% of GDP)Mobile cellular and fixed-line subscribers per employeeTelecommunications investment (% of revenue) PerformanceAccessTelephone lines (per 100 people)Mobile cellular subscriptions (per 100 people)Fixed broadband Internet subscribers (per 100 people)Personal computers (per 100 people)Households with a television (%)UsageInternational voice traffic, total (minutes per person per month)Mobile telephone usage (minutes per user per month)Internet users (per 100 people)QualityPopulation covered by mobile cellular network (%)Fixed broadband Internet subscribers (% of total subscribers)International Internet bandwidth (bits per second per person)AffordabilityResidential fixed line tariff ($ a month)Mobile cellular prepaid tariff ($ a month)Fixed broadband Internet access tariff ($ a month)TradeICT goods exports (% of total goods exports)ICT goods imports (% of total goods imports)ICT service exports (% of total service exports)ApplicationsE-gov’t Web measure index (0–1, 1=highest presence)Secure Internet servers (per million people)
31The Little Data Book on Information and Communication Technology 2011
High income
Country dataHigh-
income group
2000 2009 2009
Bahamas, The
0.30 0.34 1,11782 84 77
17,040 21,390 37,9905.5 1.3 2.0
.. .. 9867 74 91
Yes YesPublic Mixed
M CM MM C
.. .. 3.0132 396 765
.. .. 15.5
37.5 37.7 45.110.3 105.0 111.2
2.7 11.3 24.38.9 12.3 65.4
.. .. 98
.. .. ..
.. .. 3434.3 33.9 72.3
95 100 9934.0 81.9 89.2146 1,814 19,521
.. .. 22.8
.. .. 14.8
.. .. 28.8
0.6 0.6 12.23.9 3.0 13.3
.. 0.0 8.1
.. 0.23 0.4671.2 367.3 905.1

Economic and social contextPopulation (millions)Urban population (% of total)GNI per capita, World Bank Atlas method ($)GDP growth, 1995–2000 and 2000–09 (avg. annual %)Adult literacy rate (% ages 15 and older) Gross primary, secondary, and tertiary enrollment (%) StructureSeparate telecommunications regulatorStatus of main fixed-line telephone operatorLevel of competition (competition, partial comp., monopoly)
International long distance serviceMobile telephone serviceInternet service
Efficiency and capacityTelecommunications revenue (% of GDP)Mobile cellular and fixed-line subscribers per employeeTelecommunications investment (% of revenue) PerformanceAccessTelephone lines (per 100 people)Mobile cellular subscriptions (per 100 people)Fixed broadband Internet subscribers (per 100 people)Personal computers (per 100 people)Households with a television (%)UsageInternational voice traffic total (minutes per person per month)Mobile telephone usage (minutes per user per month)Internet users (per 100 people)QualityPopulation covered by mobile cellular network (%)Fixed broadband Internet subscribers (% of total subscribers)International Internet bandwidth (bits per second per person)AffordabilityResidential fixed line tariff ($ a month)Mobile cellular prepaid tariff ($ a month)Fixed broadband Internet access tariff ($ a month)TradeICT goods exports (% of total goods exports)ICT goods imports (% of total goods imports)ICT service exports (% of total service exports)ApplicationsE-gov’t Web measure index (0–1, 1=highest presence)Secure Internet servers (per million people)
32 2011 The Little Data Book on Information and Communication Technology
High income
Country dataHigh-
income group
2000 2009 2009
Bahrain
0.65 0.79 1,11788 89 77
10,740 25,420 37,9904.3 6.6 2.087 91 9883 85 91
No YesMixed Mixed
M CM PM C
4.9 4.1 3.0180 554 76521.4 14.9 15.5
26.3 30.1 45.131.6 199.4 111.2
3.4 14.8 24.314.6 74.6 65.4
97 98 98
.. .. ..
.. .. 3436.2 82.0 72.3
100 100 990.0 96.1 89.2
293 2,521 19,521
.. 4.7 22.8
.. 6.7 14.8
.. 26.3 28.8
0.1 0.1 12.23.6 2.3 13.3
.. .. 8.1
.. 0.73 0.4616.5 152.4 905.1

Economic and social contextPopulation (millions)Urban population (% of total)GNI per capita, World Bank Atlas method ($)GDP growth, 1995–2000 and 2000–09 (avg. annual %)Adult literacy rate (% ages 15 and older) Gross primary, secondary, and tertiary enrollment (%) StructureSeparate telecommunications regulatorStatus of main fixed-line telephone operatorLevel of competition (competition, partial comp., monopoly)
International long distance serviceMobile telephone serviceInternet service
Efficiency and capacityTelecommunications revenue (% of GDP)Mobile cellular and fixed-line subscribers per employeeTelecommunications investment (% of revenue) PerformanceAccessTelephone lines (per 100 people)Mobile cellular subscriptions (per 100 people)Fixed broadband Internet subscribers (per 100 people)Personal computers (per 100 people)Households with a television (%)UsageInternational voice traffic, total (minutes per person per month)Mobile telephone usage (minutes per user per month)Internet users (per 100 people)QualityPopulation covered by mobile cellular network (%)Fixed broadband Internet subscribers (% of total subscribers)International Internet bandwidth (bits per second per person)AffordabilityResidential fixed line tariff ($ a month)Mobile cellular prepaid tariff ($ a month)Fixed broadband Internet access tariff ($ a month)TradeICT goods exports (% of total goods exports)ICT goods imports (% of total goods imports)ICT service exports (% of total service exports)ApplicationsE-gov’t Web measure index (0–1, 1=highest presence)Secure Internet servers (per million people)
33The Little Data Book on Information and Communication Technology 2011
South Asia Low income
Country dataLow-
income group
2000 2009 2009
Bangladesh
141 162 84624 28 29
350 580 5095.2 5.9 5.447 56 62
.. 49 56
No YesPublic Public
M MC C.. C
0.8 1.5 2.948 .. 301
25.1 .. ..
0.3 0.9 1.20.2 31.1 26.60.0 0.1 0.10.1 2.3 0.918 30 ..
.. .. ..313 260 ..0.1 0.4 2.7
40 90 530.0 0.0 5.4
0 4 7
.. 1.6 8.8
.. 1.3 8.0
.. 50.4 89.9
0.0 0.6 0.62.9 5.7 5.93.0 11.5 6.5
.. 0.36 0.090.0 0.3 0.6
Economic and social contextPopulation (millions)Urban population (% of total)GNI per capita, World Bank Atlas method ($)GDP growth, 1995–2000 and 2000–09 (avg. annual %)Adult literacy rate (% ages 15 and older) Gross primary, secondary, and tertiary enrollment (%) StructureSeparate telecommunications regulatorStatus of main fixed-line telephone operatorLevel of competition (competition, partial comp., monopoly)
International long distance serviceMobile telephone serviceInternet service
Efficiency and capacityTelecommunications revenue (% of GDP)Mobile cellular and fixed-line subscribers per employeeTelecommunications investment (% of revenue) PerformanceAccessTelephone lines (per 100 people)Mobile cellular subscriptions (per 100 people)Fixed broadband Internet subscribers (per 100 people)Personal computers (per 100 people)Households with a television (%)UsageInternational voice traffic total (minutes per person per month)Mobile telephone usage (minutes per user per month)Internet users (per 100 people)QualityPopulation covered by mobile cellular network (%)Fixed broadband Internet subscribers (% of total subscribers)International Internet bandwidth (bits per second per person)AffordabilityResidential fixed line tariff ($ a month)Mobile cellular prepaid tariff ($ a month)Fixed broadband Internet access tariff ($ a month)TradeICT goods exports (% of total goods exports)ICT goods imports (% of total goods imports)ICT service exports (% of total service exports)ApplicationsE-gov’t Web measure index (0–1, 1=highest presence)Secure Internet servers (per million people)
34 2011 The Little Data Book on Information and Communication Technology
High income
Country dataHigh-
income group
2000 2009 2009
Barbados
0.25 0.26 1,11736 40 77
9,670 .. 37,9903.7 .. 2.0
.. .. 98
.. .. 91
No YesPrivate Mixed
M PC P.. P
6.6 5.8 3.0172 365 76515.8 12.8 15.5
49.2 53.0 45.111.3 131.7 111.2
.. 23.8 24.38.7 15.8 65.4
.. .. 98
.. .. ..
.. .. 3434.0 56.1 72.3
95 100 99.. 94.0 89.2.. 13,991 19,521
.. 19.7 22.8
.. 10.8 14.8
.. 34.5 28.8
9.1 6.1 12.28.7 7.4 13.34.4 2.7 8.1
.. 0.20 0.4655.7 350.8 905.1

Economic and social contextPopulation (millions)Urban population (% of total)GNI per capita, World Bank Atlas method ($)GDP growth, 1995–2000 and 2000–09 (avg. annual %)Adult literacy rate (% ages 15 and older) Gross primary, secondary, and tertiary enrollment (%) StructureSeparate telecommunications regulatorStatus of main fixed-line telephone operatorLevel of competition (competition, partial comp., monopoly)
International long distance serviceMobile telephone serviceInternet service
Efficiency and capacityTelecommunications revenue (% of GDP)Mobile cellular and fixed-line subscribers per employeeTelecommunications investment (% of revenue) PerformanceAccessTelephone lines (per 100 people)Mobile cellular subscriptions (per 100 people)Fixed broadband Internet subscribers (per 100 people)Personal computers (per 100 people)Households with a television (%)UsageInternational voice traffic, total (minutes per person per month)Mobile telephone usage (minutes per user per month)Internet users (per 100 people)QualityPopulation covered by mobile cellular network (%)Fixed broadband Internet subscribers (% of total subscribers)International Internet bandwidth (bits per second per person)AffordabilityResidential fixed line tariff ($ a month)Mobile cellular prepaid tariff ($ a month)Fixed broadband Internet access tariff ($ a month)TradeICT goods exports (% of total goods exports)ICT goods imports (% of total goods imports)ICT service exports (% of total service exports)ApplicationsE-gov’t Web measure index (0–1, 1=highest presence)Secure Internet servers (per million people)
35The Little Data Book on Information and Communication Technology 2011
Europe & Central Asia Upper middle income
Country data
Upper middle-income group
2000 2009 2009
Belarus
10 10 1,00270 74 75
1,380 5,560 7,5026.7 8.4 4.4
100 100 9287 90 82
.. NoPublic Public
M MC C.. C
1.5 2.1 3.3105 280 57628.8 41.3 18.0
27.5 41.1 22.10.5 100.2 100.60.0 16.9 19.4
.. 0.8 11.285 95 93
.. .. ..
.. 320 1571.9 45.9 34.6
62 99 940.0 67.0 41.6
2 2,277 1,120
.. 1.0 10.0
.. 3.4 8.8
.. 7.2 18.8
1.9 0.7 12.22.9 2.4 15.15.4 9.0 5.4
.. 0.30 0.300.4 9.3 32.2

Economic and social contextPopulation (millions)Urban population (% of total)GNI per capita, World Bank Atlas method ($)GDP growth, 1995–2000 and 2000–09 (avg. annual %)Adult literacy rate (% ages 15 and older) Gross primary, secondary, and tertiary enrollment (%) StructureSeparate telecommunications regulatorStatus of main fixed-line telephone operatorLevel of competition (competition, partial comp., monopoly)
International long distance serviceMobile telephone serviceInternet service
Efficiency and capacityTelecommunications revenue (% of GDP)Mobile cellular and fixed-line subscribers per employeeTelecommunications investment (% of revenue) PerformanceAccessTelephone lines (per 100 people)Mobile cellular subscriptions (per 100 people)Fixed broadband Internet subscribers (per 100 people)Personal computers (per 100 people)Households with a television (%)UsageInternational voice traffic total (minutes per person per month)Mobile telephone usage (minutes per user per month)Internet users (per 100 people)QualityPopulation covered by mobile cellular network (%)Fixed broadband Internet subscribers (% of total subscribers)International Internet bandwidth (bits per second per person)AffordabilityResidential fixed line tariff ($ a month)Mobile cellular prepaid tariff ($ a month)Fixed broadband Internet access tariff ($ a month)TradeICT goods exports (% of total goods exports)ICT goods imports (% of total goods imports)ICT service exports (% of total service exports)ApplicationsE-gov’t Web measure index (0–1, 1=highest presence)Secure Internet servers (per million people)
36 2011 The Little Data Book on Information and Communication Technology
High income
Country dataHigh-
income group
2000 2009 2009
Belgium
10 11 1,11797 97 77
25,400 45,270 37,9902.9 1.7 2.0
.. .. 98108 94 91
Yes YesMixed Mixed
C CP PC C
1.9 2.8 3.0374 732 76533.7 13.3 15.5
49.1 39.4 45.154.9 115.1 111.211.2 29.7 24.322.4 37.7 65.4
.. 99 98
.. .. ..105 148 34329.3 75.2 72.3
99 100 9912.5 97.8 89.2
1,829 24,945 19,521
.. 33.6 22.8
.. 20.8 14.8
.. 29.0 28.8
6.2 2.8 12.27.6 4.3 13.39.2 9.8 8.1
.. 0.63 0.4633.2 490.4 905.1

Economic and social contextPopulation (millions)Urban population (% of total)GNI per capita, World Bank Atlas method ($)GDP growth, 1995–2000 and 2000–09 (avg. annual %)Adult literacy rate (% ages 15 and older) Gross primary, secondary, and tertiary enrollment (%) StructureSeparate telecommunications regulatorStatus of main fixed-line telephone operatorLevel of competition (competition, partial comp., monopoly)
International long distance serviceMobile telephone serviceInternet service
Efficiency and capacityTelecommunications revenue (% of GDP)Mobile cellular and fixed-line subscribers per employeeTelecommunications investment (% of revenue) PerformanceAccessTelephone lines (per 100 people)Mobile cellular subscriptions (per 100 people)Fixed broadband Internet subscribers (per 100 people)Personal computers (per 100 people)Households with a television (%)UsageInternational voice traffic, total (minutes per person per month)Mobile telephone usage (minutes per user per month)Internet users (per 100 people)QualityPopulation covered by mobile cellular network (%)Fixed broadband Internet subscribers (% of total subscribers)International Internet bandwidth (bits per second per person)AffordabilityResidential fixed line tariff ($ a month)Mobile cellular prepaid tariff ($ a month)Fixed broadband Internet access tariff ($ a month)TradeICT goods exports (% of total goods exports)ICT goods imports (% of total goods imports)ICT service exports (% of total service exports)ApplicationsE-gov’t Web measure index (0–1, 1=highest presence)Secure Internet servers (per million people)
37The Little Data Book on Information and Communication Technology 2011
Country data
Lower middle-income group
2000 2009 2009
Latin America & Caribbean Lower middle income
Belize
0.25 0.33 3,81148 52 41
3,110 3,740 2,3215.8 4.2 8.5
.. .. 8069 75 64
Yes YesMixed Mixed
M M.. C
M C
6.0 5.2 3.0132 272 60515.1 24.4 22.4
14.3 9.4 12.76.7 48.6 57.81.7 2.4 5.5
12.0 14.4 4.570 .. ..
.. .. ..
.. .. 3426.0 10.8 17.2
.. .. 770.0 98.3 40.112 2,401 151
.. 17.5 4.7
.. 14.9 7.1
.. 55.0 30.4
0.1 0.1 21.34.5 4.9 18.44.7 4.6 19.9
.. 0.16 0.2431.1 301.7 2.7
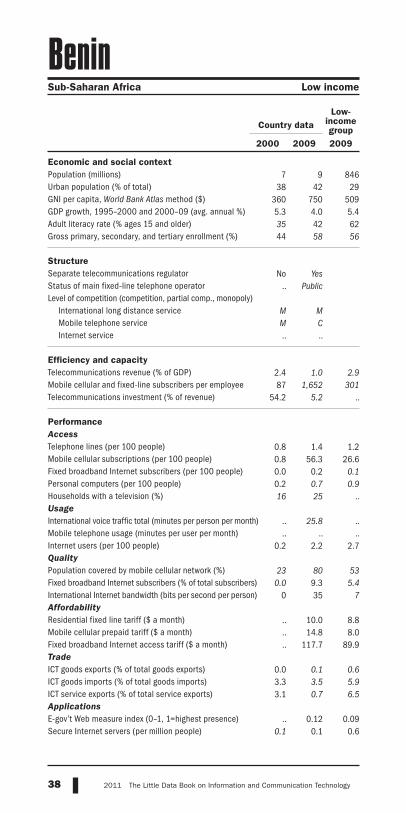
Economic and social contextPopulation (millions)Urban population (% of total)GNI per capita, World Bank Atlas method ($)GDP growth, 1995–2000 and 2000–09 (avg. annual %)Adult literacy rate (% ages 15 and older) Gross primary, secondary, and tertiary enrollment (%) StructureSeparate telecommunications regulatorStatus of main fixed-line telephone operatorLevel of competition (competition, partial comp., monopoly)
International long distance serviceMobile telephone serviceInternet service
Efficiency and capacityTelecommunications revenue (% of GDP)Mobile cellular and fixed-line subscribers per employeeTelecommunications investment (% of revenue) PerformanceAccessTelephone lines (per 100 people)Mobile cellular subscriptions (per 100 people)Fixed broadband Internet subscribers (per 100 people)Personal computers (per 100 people)Households with a television (%)UsageInternational voice traffic total (minutes per person per month)Mobile telephone usage (minutes per user per month)Internet users (per 100 people)QualityPopulation covered by mobile cellular network (%)Fixed broadband Internet subscribers (% of total subscribers)International Internet bandwidth (bits per second per person)AffordabilityResidential fixed line tariff ($ a month)Mobile cellular prepaid tariff ($ a month)Fixed broadband Internet access tariff ($ a month)TradeICT goods exports (% of total goods exports)ICT goods imports (% of total goods imports)ICT service exports (% of total service exports)ApplicationsE-gov’t Web measure index (0–1, 1=highest presence)Secure Internet servers (per million people)
38 2011 The Little Data Book on Information and Communication Technology
Country dataLow-
income group
2000 2009 2009
Sub-Saharan Africa Low income
Benin
7 9 84638 42 29
360 750 5095.3 4.0 5.435 42 6244 58 56
No Yes.. Public
M MM C.. ..
2.4 1.0 2.987 1,652 301
54.2 5.2 ..
0.8 1.4 1.20.8 56.3 26.60.0 0.2 0.10.2 0.7 0.916 25 ..
.. 25.8 ..
.. .. ..0.2 2.2 2.7
23 80 530.0 9.3 5.4
0 35 7
.. 10.0 8.8
.. 14.8 8.0
.. 117.7 89.9
0.0 0.1 0.63.3 3.5 5.93.1 0.7 6.5
.. 0.12 0.090.1 0.1 0.6
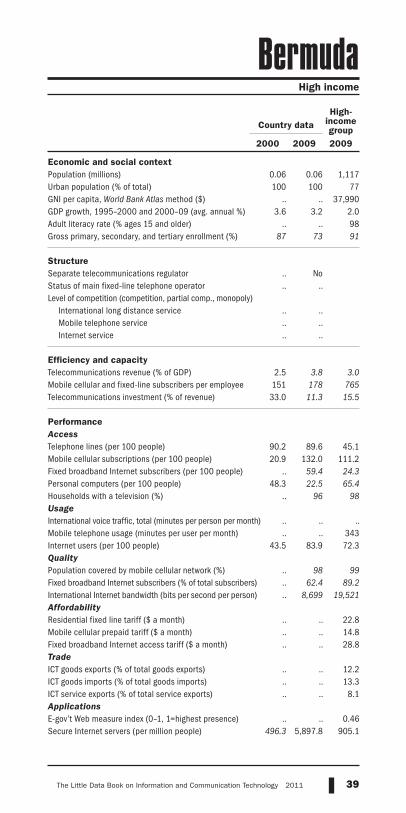
Economic and social contextPopulation (millions)Urban population (% of total)GNI per capita, World Bank Atlas method ($)GDP growth, 1995–2000 and 2000–09 (avg. annual %)Adult literacy rate (% ages 15 and older) Gross primary, secondary, and tertiary enrollment (%) StructureSeparate telecommunications regulatorStatus of main fixed-line telephone operatorLevel of competition (competition, partial comp., monopoly)
International long distance serviceMobile telephone serviceInternet service
Efficiency and capacityTelecommunications revenue (% of GDP)Mobile cellular and fixed-line subscribers per employeeTelecommunications investment (% of revenue) PerformanceAccessTelephone lines (per 100 people)Mobile cellular subscriptions (per 100 people)Fixed broadband Internet subscribers (per 100 people)Personal computers (per 100 people)Households with a television (%)UsageInternational voice traffic, total (minutes per person per month)Mobile telephone usage (minutes per user per month)Internet users (per 100 people)QualityPopulation covered by mobile cellular network (%)Fixed broadband Internet subscribers (% of total subscribers)International Internet bandwidth (bits per second per person)AffordabilityResidential fixed line tariff ($ a month)Mobile cellular prepaid tariff ($ a month)Fixed broadband Internet access tariff ($ a month)TradeICT goods exports (% of total goods exports)ICT goods imports (% of total goods imports)ICT service exports (% of total service exports)ApplicationsE-gov’t Web measure index (0–1, 1=highest presence)Secure Internet servers (per million people)
39The Little Data Book on Information and Communication Technology 2011
High income
Country dataHigh-
income group
2000 2009 2009
Bermuda
0.06 0.06 1,117100 100 77
.. .. 37,9903.6 3.2 2.0
.. .. 9887 73 91
.. No
.. ..
.. ..
.. ..
.. ..
2.5 3.8 3.0151 178 76533.0 11.3 15.5
90.2 89.6 45.120.9 132.0 111.2
.. 59.4 24.348.3 22.5 65.4
.. 96 98
.. .. ..
.. .. 34343.5 83.9 72.3
.. 98 99
.. 62.4 89.2
.. 8,699 19,521
.. .. 22.8
.. .. 14.8
.. .. 28.8
.. .. 12.2
.. .. 13.3
.. .. 8.1
.. .. 0.46496.3 5,897.8 905.1

Economic and social contextPopulation (millions)Urban population (% of total)GNI per capita, World Bank Atlas method ($)GDP growth, 1995–2000 and 2000–09 (avg. annual %)Adult literacy rate (% ages 15 and older) Gross primary, secondary, and tertiary enrollment (%) StructureSeparate telecommunications regulatorStatus of main fixed-line telephone operatorLevel of competition (competition, partial comp., monopoly)
International long distance serviceMobile telephone serviceInternet service
Efficiency and capacityTelecommunications revenue (% of GDP)Mobile cellular and fixed-line subscribers per employeeTelecommunications investment (% of revenue) PerformanceAccessTelephone lines (per 100 people)Mobile cellular subscriptions (per 100 people)Fixed broadband Internet subscribers (per 100 people)Personal computers (per 100 people)Households with a television (%)UsageInternational voice traffic total (minutes per person per month)Mobile telephone usage (minutes per user per month)Internet users (per 100 people)QualityPopulation covered by mobile cellular network (%)Fixed broadband Internet subscribers (% of total subscribers)International Internet bandwidth (bits per second per person)AffordabilityResidential fixed line tariff ($ a month)Mobile cellular prepaid tariff ($ a month)Fixed broadband Internet access tariff ($ a month)TradeICT goods exports (% of total goods exports)ICT goods imports (% of total goods imports)ICT service exports (% of total service exports)ApplicationsE-gov’t Web measure index (0–1, 1=highest presence)Secure Internet servers (per million people)
40 2011 The Little Data Book on Information and Communication Technology
South Asia Lower middle income
Country data
Lower middle-income group
2000 2009 2009
Bhutan
0.56 0.70 3,81125 36 41
730 2,020 2,3216.2 8.8 8.5
.. 53 8050 62 64
Yes YesPublic Public
M M.. C.. C
2.3 2.2 3.041 449 605
26.2 81.1 22.4
2.5 3.8 12.70.0 46.9 57.80.1 1.0 5.50.9 2.0 4.5
.. 38 ..
.. .. ..
.. .. 3420.4 7.2 17.2
.. 21 770.0 46.6 40.1
2 222 151
.. 3.0 4.7
.. 2.0 7.1
.. 10.0 30.4
.. 2.6 21.312.3 6.0 18.4
.. .. 19.9
.. 0.19 0.24
.. 4.2 2.7

Economic and social contextPopulation (millions)Urban population (% of total)GNI per capita, World Bank Atlas method ($)GDP growth, 1995–2000 and 2000–09 (avg. annual %)Adult literacy rate (% ages 15 and older) Gross primary, secondary, and tertiary enrollment (%) StructureSeparate telecommunications regulatorStatus of main fixed-line telephone operatorLevel of competition (competition, partial comp., monopoly)
International long distance serviceMobile telephone serviceInternet service
Efficiency and capacityTelecommunications revenue (% of GDP)Mobile cellular and fixed-line subscribers per employeeTelecommunications investment (% of revenue) PerformanceAccessTelephone lines (per 100 people)Mobile cellular subscriptions (per 100 people)Fixed broadband Internet subscribers (per 100 people)Personal computers (per 100 people)Households with a television (%)UsageInternational voice traffic, total (minutes per person per month)Mobile telephone usage (minutes per user per month)Internet users (per 100 people)QualityPopulation covered by mobile cellular network (%)Fixed broadband Internet subscribers (% of total subscribers)International Internet bandwidth (bits per second per person)AffordabilityResidential fixed line tariff ($ a month)Mobile cellular prepaid tariff ($ a month)Fixed broadband Internet access tariff ($ a month)TradeICT goods exports (% of total goods exports)ICT goods imports (% of total goods imports)ICT service exports (% of total service exports)ApplicationsE-gov’t Web measure index (0–1, 1=highest presence)Secure Internet servers (per million people)
41The Little Data Book on Information and Communication Technology 2011
Country data
Lower middle-income group
2000 2009 2009
Latin America & Caribbean Lower middle income
Bolivia
8 10 3,81162 66 41
1,000 1,630 2,3213.5 4.1 8.587 91 8084 82 64
Yes YesMixed Private
M MP CC C
4.7 6.8 3.0451 376 60543.4 3.8 22.4
6.1 8.2 12.77.0 72.5 57.80.5 3.6 5.51.7 2.4 4.561 69 ..
.. .. ..
.. .. 3421.4 11.2 17.2
43 46 770.0 80.4 40.1
2 225 151
.. 23.5 4.7
.. 7.3 7.1
.. 35.2 30.4
0.7 0.0 21.37.6 4.6 18.4
15.9 12.6 19.9
.. 0.30 0.240.6 7.9 2.7

Economic and social contextPopulation (millions)Urban population (% of total)GNI per capita, World Bank Atlas method ($)GDP growth, 1995–2000 and 2000–09 (avg. annual %)Adult literacy rate (% ages 15 and older) Gross primary, secondary, and tertiary enrollment (%) StructureSeparate telecommunications regulatorStatus of main fixed-line telephone operatorLevel of competition (competition, partial comp., monopoly)
International long distance serviceMobile telephone serviceInternet service
Efficiency and capacityTelecommunications revenue (% of GDP)Mobile cellular and fixed-line subscribers per employeeTelecommunications investment (% of revenue) PerformanceAccessTelephone lines (per 100 people)Mobile cellular subscriptions (per 100 people)Fixed broadband Internet subscribers (per 100 people)Personal computers (per 100 people)Households with a television (%)UsageInternational voice traffic total (minutes per person per month)Mobile telephone usage (minutes per user per month)Internet users (per 100 people)QualityPopulation covered by mobile cellular network (%)Fixed broadband Internet subscribers (% of total subscribers)International Internet bandwidth (bits per second per person)AffordabilityResidential fixed line tariff ($ a month)Mobile cellular prepaid tariff ($ a month)Fixed broadband Internet access tariff ($ a month)TradeICT goods exports (% of total goods exports)ICT goods imports (% of total goods imports)ICT service exports (% of total service exports)ApplicationsE-gov’t Web measure index (0–1, 1=highest presence)Secure Internet servers (per million people)
42 2011 The Little Data Book on Information and Communication Technology
Europe & Central Asia Upper middle income
Country data
Upper middle-income group
2000 2009 2009
Bosnia and Herzegovina
4 4 1,00243 48 75
1,510 4,700 7,50225.2 5.0 4.4
97 98 92.. 74 82
Yes YesPublic Mixed
M CP CC C
4.2 5.5 3.3480 567 57622.8 20.2 18.0
21.1 26.5 22.12.5 86.5 100.60.4 10.6 19.43.8 6.4 11.2
.. 97 93
.. .. ..
.. .. 1571.1 37.7 34.6
60 99 940.0 73.2 41.6
7 1,195 1,120
.. 8.8 10.0
.. 9.4 8.8
.. 18.5 18.8
.. 0.6 12.2
.. 3.7 15.1
.. 9.2 5.4
.. 0.28 0.30
.. 16.0 32.2

Economic and social contextPopulation (millions)Urban population (% of total)GNI per capita, World Bank Atlas method ($)GDP growth, 1995–2000 and 2000–09 (avg. annual %)Adult literacy rate (% ages 15 and older) Gross primary, secondary, and tertiary enrollment (%) StructureSeparate telecommunications regulatorStatus of main fixed-line telephone operatorLevel of competition (competition, partial comp., monopoly)
International long distance serviceMobile telephone serviceInternet service
Efficiency and capacityTelecommunications revenue (% of GDP)Mobile cellular and fixed-line subscribers per employeeTelecommunications investment (% of revenue) PerformanceAccessTelephone lines (per 100 people)Mobile cellular subscriptions (per 100 people)Fixed broadband Internet subscribers (per 100 people)Personal computers (per 100 people)Households with a television (%)UsageInternational voice traffic, total (minutes per person per month)Mobile telephone usage (minutes per user per month)Internet users (per 100 people)QualityPopulation covered by mobile cellular network (%)Fixed broadband Internet subscribers (% of total subscribers)International Internet bandwidth (bits per second per person)AffordabilityResidential fixed line tariff ($ a month)Mobile cellular prepaid tariff ($ a month)Fixed broadband Internet access tariff ($ a month)TradeICT goods exports (% of total goods exports)ICT goods imports (% of total goods imports)ICT service exports (% of total service exports)ApplicationsE-gov’t Web measure index (0–1, 1=highest presence)Secure Internet servers (per million people)
43The Little Data Book on Information and Communication Technology 2011
Sub-Saharan Africa Upper middle income
Country data
Upper middle-income group
2000 2009 2009
Botswana
2 2 1,00253 60 75
3,180 6,260 7,5027.8 4.4 4.4
.. 84 9272 72 82
Yes YesPublic Public
M CC CC C
3.3 2.9 3.3202 1,018 57613.9 122.2 18.0
7.9 7.4 22.112.9 96.1 100.6
0.9 0.5 19.43.5 6.2 11.210 .. 93
.. .. ..
.. .. 1572.9 6.2 34.6
90 99 940.0 89.0 41.6
3 220 1,120
.. 18.0 10.0
.. 8.1 8.8
.. 62.2 18.8
0.7 0.4 12.26.0 5.5 15.10.1 3.3 5.4
.. 0.20 0.30
.. 8.6 32.2

Economic and social contextPopulation (millions)Urban population (% of total)GNI per capita, World Bank Atlas method ($)GDP growth, 1995–2000 and 2000–09 (avg. annual %)Adult literacy rate (% ages 15 and older) Gross primary, secondary, and tertiary enrollment (%) StructureSeparate telecommunications regulatorStatus of main fixed-line telephone operatorLevel of competition (competition, partial comp., monopoly)
International long distance serviceMobile telephone serviceInternet service
Efficiency and capacityTelecommunications revenue (% of GDP)Mobile cellular and fixed-line subscribers per employeeTelecommunications investment (% of revenue) PerformanceAccessTelephone lines (per 100 people)Mobile cellular subscriptions (per 100 people)Fixed broadband Internet subscribers (per 100 people)Personal computers (per 100 people)Households with a television (%)UsageInternational voice traffic total (minutes per person per month)Mobile telephone usage (minutes per user per month)Internet users (per 100 people)QualityPopulation covered by mobile cellular network (%)Fixed broadband Internet subscribers (% of total subscribers)International Internet bandwidth (bits per second per person)AffordabilityResidential fixed line tariff ($ a month)Mobile cellular prepaid tariff ($ a month)Fixed broadband Internet access tariff ($ a month)TradeICT goods exports (% of total goods exports)ICT goods imports (% of total goods imports)ICT service exports (% of total service exports)ApplicationsE-gov’t Web measure index (0–1, 1=highest presence)Secure Internet servers (per million people)
44 2011 The Little Data Book on Information and Communication Technology
Latin America & Caribbean Upper middle income
Country data
Upper middle-income group
2000 2009 2009
Brazil
174 194 1,00281 86 75
3,870 8,070 7,5021.7 3.6 4.486 90 9290 85 82
Yes YesPrivate Mixed
P CP CC C
3.4 4.5 3.3516 358 57639.8 12.6 18.0
17.8 21.4 22.113.3 89.8 100.6
1.3 8.3 19.44.9 16.1 11.289 97 93
.. .. ..249 86 1572.9 39.2 34.6
.. 91 944.4 90.0 41.6
5 2,108 1,120
.. 13.4 10.0
.. 34.6 8.8
.. 28.0 18.8
4.6 1.8 12.216.4 11.4 15.1
0.7 2.0 5.4
.. 0.37 0.305.8 40.6 32.2

Economic and social contextPopulation (millions)Urban population (% of total)GNI per capita, World Bank Atlas method ($)GDP growth, 1995–2000 and 2000–09 (avg. annual %)Adult literacy rate (% ages 15 and older) Gross primary, secondary, and tertiary enrollment (%) StructureSeparate telecommunications regulatorStatus of main fixed-line telephone operatorLevel of competition (competition, partial comp., monopoly)
International long distance serviceMobile telephone serviceInternet service
Efficiency and capacityTelecommunications revenue (% of GDP)Mobile cellular and fixed-line subscribers per employeeTelecommunications investment (% of revenue) PerformanceAccessTelephone lines (per 100 people)Mobile cellular subscriptions (per 100 people)Fixed broadband Internet subscribers (per 100 people)Personal computers (per 100 people)Households with a television (%)UsageInternational voice traffic, total (minutes per person per month)Mobile telephone usage (minutes per user per month)Internet users (per 100 people)QualityPopulation covered by mobile cellular network (%)Fixed broadband Internet subscribers (% of total subscribers)International Internet bandwidth (bits per second per person)AffordabilityResidential fixed line tariff ($ a month)Mobile cellular prepaid tariff ($ a month)Fixed broadband Internet access tariff ($ a month)TradeICT goods exports (% of total goods exports)ICT goods imports (% of total goods imports)ICT service exports (% of total service exports)ApplicationsE-gov’t Web measure index (0–1, 1=highest presence)Secure Internet servers (per million people)
45The Little Data Book on Information and Communication Technology 2011
High income
Country dataHigh-
income group
2000 2009 2009
Brunei Darussalam
0.33 0.40 1,11771 75 77
14,670 27,050 37,9901.0 2.1 2.093 95 9875 78 91
No YesPublic Public
P PM M.. P
.. .. 3.0
.. .. 765
.. .. 15.5
24.1 20.2 45.128.5 106.7 111.2
6.7 25.1 24.36.9 8.9 65.4
.. .. 98
.. .. ..
.. .. 3439.0 79.8 72.3
.. .. 998.2 20.0 89.2
180 1,581 19,521
.. .. 22.8
.. .. 14.8
.. .. 28.8
0.2 0.2 12.26.4 6.6 13.3
.. .. 8.1
.. 0.28 0.468.8 63.9 905.1

Economic and social contextPopulation (millions)Urban population (% of total)GNI per capita, World Bank Atlas method ($)GDP growth, 1995–2000 and 2000–09 (avg. annual %)Adult literacy rate (% ages 15 and older) Gross primary, secondary, and tertiary enrollment (%) StructureSeparate telecommunications regulatorStatus of main fixed-line telephone operatorLevel of competition (competition, partial comp., monopoly)
International long distance serviceMobile telephone serviceInternet service
Efficiency and capacityTelecommunications revenue (% of GDP)Mobile cellular and fixed-line subscribers per employeeTelecommunications investment (% of revenue) PerformanceAccessTelephone lines (per 100 people)Mobile cellular subscriptions (per 100 people)Fixed broadband Internet subscribers (per 100 people)Personal computers (per 100 people)Households with a television (%)UsageInternational voice traffic total (minutes per person per month)Mobile telephone usage (minutes per user per month)Internet users (per 100 people)QualityPopulation covered by mobile cellular network (%)Fixed broadband Internet subscribers (% of total subscribers)International Internet bandwidth (bits per second per person)AffordabilityResidential fixed line tariff ($ a month)Mobile cellular prepaid tariff ($ a month)Fixed broadband Internet access tariff ($ a month)TradeICT goods exports (% of total goods exports)ICT goods imports (% of total goods imports)ICT service exports (% of total service exports)ApplicationsE-gov’t Web measure index (0–1, 1=highest presence)Secure Internet servers (per million people)
46 2011 The Little Data Book on Information and Communication Technology
Europe & Central Asia Upper middle income
Country data
Upper middle-income group
2000 2009 2009
Bulgaria
8 8 1,00269 71 75
1,640 6,060 7,5020.7 5.4 4.498 98 9279 84 82
Yes YesPublic Private
M PC PC C
3.0 5.1 3.3140 565 57614.0 22.5 18.0
35.8 28.5 22.19.2 140.0 100.60.1 11.2 19.44.5 11.0 11.2
.. 98 93
.. 8.7 ..
.. 103 1575.3 44.8 34.6
95 100 940.0 98.9 41.6
5 37,657 1,120
.. 13.8 10.0
.. 17.6 8.8
.. 14.8 18.8
1.0 3.6 12.25.2 6.4 15.12.3 5.6 5.4
.. 0.41 0.302.3 73.3 32.2

Economic and social contextPopulation (millions)Urban population (% of total)GNI per capita, World Bank Atlas method ($)GDP growth, 1995–2000 and 2000–09 (avg. annual %)Adult literacy rate (% ages 15 and older) Gross primary, secondary, and tertiary enrollment (%) StructureSeparate telecommunications regulatorStatus of main fixed-line telephone operatorLevel of competition (competition, partial comp., monopoly)
International long distance serviceMobile telephone serviceInternet service
Efficiency and capacityTelecommunications revenue (% of GDP)Mobile cellular and fixed-line subscribers per employeeTelecommunications investment (% of revenue) PerformanceAccessTelephone lines (per 100 people)Mobile cellular subscriptions (per 100 people)Fixed broadband Internet subscribers (per 100 people)Personal computers (per 100 people)Households with a television (%)UsageInternational voice traffic, total (minutes per person per month)Mobile telephone usage (minutes per user per month)Internet users (per 100 people)QualityPopulation covered by mobile cellular network (%)Fixed broadband Internet subscribers (% of total subscribers)International Internet bandwidth (bits per second per person)AffordabilityResidential fixed line tariff ($ a month)Mobile cellular prepaid tariff ($ a month)Fixed broadband Internet access tariff ($ a month)TradeICT goods exports (% of total goods exports)ICT goods imports (% of total goods imports)ICT service exports (% of total service exports)ApplicationsE-gov’t Web measure index (0–1, 1=highest presence)Secure Internet servers (per million people)
47The Little Data Book on Information and Communication Technology 2011
Sub-Saharan Africa Low income
Country dataLow-
income group
2000 2009 2009
Burkina Faso
12 16 84617 20 29
250 510 5096.8 5.4 5.4
.. 29 6222 33 56
Yes YesPublic Public
M MC PC P
2.0 4.0 2.962 440 301
38.0 88.6 ..
0.5 1.1 1.20.2 20.9 26.60.0 0.1 0.10.1 0.6 0.9
6 18 ..
.. .. ..
.. .. ..0.1 1.1 2.7
22 61 530.0 26.5 5.4
0 15 7
.. 11.5 8.8
.. 14.4 8.0
.. 91.3 89.9
0.9 0.0 0.64.2 2.0 5.97.2 11.6 6.5
.. 0.16 0.09
.. 0.2 0.6

Economic and social contextPopulation (millions)Urban population (% of total)GNI per capita, World Bank Atlas method ($)GDP growth, 1995–2000 and 2000–09 (avg. annual %)Adult literacy rate (% ages 15 and older) Gross primary, secondary, and tertiary enrollment (%) StructureSeparate telecommunications regulatorStatus of main fixed-line telephone operatorLevel of competition (competition, partial comp., monopoly)
International long distance serviceMobile telephone serviceInternet service
Efficiency and capacityTelecommunications revenue (% of GDP)Mobile cellular and fixed-line subscribers per employeeTelecommunications investment (% of revenue) PerformanceAccessTelephone lines (per 100 people)Mobile cellular subscriptions (per 100 people)Fixed broadband Internet subscribers (per 100 people)Personal computers (per 100 people)Households with a television (%)UsageInternational voice traffic total (minutes per person per month)Mobile telephone usage (minutes per user per month)Internet users (per 100 people)QualityPopulation covered by mobile cellular network (%)Fixed broadband Internet subscribers (% of total subscribers)International Internet bandwidth (bits per second per person)AffordabilityResidential fixed line tariff ($ a month)Mobile cellular prepaid tariff ($ a month)Fixed broadband Internet access tariff ($ a month)TradeICT goods exports (% of total goods exports)ICT goods imports (% of total goods imports)ICT service exports (% of total service exports)ApplicationsE-gov’t Web measure index (0–1, 1=highest presence)Secure Internet servers (per million people)
48 2011 The Little Data Book on Information and Communication Technology
Sub-Saharan Africa Low income
Country dataLow-
income group
2000 2009 2009
Burundi
6 8 8468 11 29
120 150 509-0.7 3.0 5.4
59 67 6230 55 56
Yes YesPublic Public
M CC CC C
1.9 3.1 2.965 492 301
.. .. ..
0.3 0.4 1.20.3 10.1 26.60.0 0.1 0.10.1 0.9 0.9
.. .. ..
.. .. ..
.. .. ..0.1 0.8 2.7
.. 80 53
.. 3.2 5.40 2 7
.. .. 8.8
.. .. 8.0
.. .. 89.9
.. 1.9 0.6
.. 10.9 5.90.0 0.0 6.5
.. 0.04 0.09
.. 0.2 0.6

Economic and social contextPopulation (millions)Urban population (% of total)GNI per capita, World Bank Atlas method ($)GDP growth, 1995–2000 and 2000–09 (avg. annual %)Adult literacy rate (% ages 15 and older) Gross primary, secondary, and tertiary enrollment (%) StructureSeparate telecommunications regulatorStatus of main fixed-line telephone operatorLevel of competition (competition, partial comp., monopoly)
International long distance serviceMobile telephone serviceInternet service
Efficiency and capacityTelecommunications revenue (% of GDP)Mobile cellular and fixed-line subscribers per employeeTelecommunications investment (% of revenue) PerformanceAccessTelephone lines (per 100 people)Mobile cellular subscriptions (per 100 people)Fixed broadband Internet subscribers (per 100 people)Personal computers (per 100 people)Households with a television (%)UsageInternational voice traffic, total (minutes per person per month)Mobile telephone usage (minutes per user per month)Internet users (per 100 people)QualityPopulation covered by mobile cellular network (%)Fixed broadband Internet subscribers (% of total subscribers)International Internet bandwidth (bits per second per person)AffordabilityResidential fixed line tariff ($ a month)Mobile cellular prepaid tariff ($ a month)Fixed broadband Internet access tariff ($ a month)TradeICT goods exports (% of total goods exports)ICT goods imports (% of total goods imports)ICT service exports (% of total service exports)ApplicationsE-gov’t Web measure index (0–1, 1=highest presence)Secure Internet servers (per million people)
49The Little Data Book on Information and Communication Technology 2011
East Asia & Pacific Low income
Country dataLow-
income group
2000 2009 2009
Cambodia
13 15 84617 22 29
280 650 5097.3 9.0 5.467 78 6250 57 56
.. YesPublic Mixed
P PP CP C
0.6 0.4 2.9241 1,712 301
.. .. ..
0.2 0.4 1.21.0 37.8 26.60.0 0.1 0.10.1 0.4 0.933 55 ..
.. .. ..
.. 34 ..0.0 0.5 2.7
80 87 530.0 92.2 5.4
0 19 7
.. 7.8 8.8
.. 5.0 8.0
.. 88.5 89.9
0.0 0.1 0.62.4 4.0 5.98.8 6.5 6.5
.. 0.14 0.090.2 1.6 0.6

Economic and social contextPopulation (millions)Urban population (% of total)GNI per capita, World Bank Atlas method ($)GDP growth, 1995–2000 and 2000–09 (avg. annual %)Adult literacy rate (% ages 15 and older) Gross primary, secondary, and tertiary enrollment (%) StructureSeparate telecommunications regulatorStatus of main fixed-line telephone operatorLevel of competition (competition, partial comp., monopoly)
International long distance serviceMobile telephone serviceInternet service
Efficiency and capacityTelecommunications revenue (% of GDP)Mobile cellular and fixed-line subscribers per employeeTelecommunications investment (% of revenue) PerformanceAccessTelephone lines (per 100 people)Mobile cellular subscriptions (per 100 people)Fixed broadband Internet subscribers (per 100 people)Personal computers (per 100 people)Households with a television (%)UsageInternational voice traffic total (minutes per person per month)Mobile telephone usage (minutes per user per month)Internet users (per 100 people)QualityPopulation covered by mobile cellular network (%)Fixed broadband Internet subscribers (% of total subscribers)International Internet bandwidth (bits per second per person)AffordabilityResidential fixed line tariff ($ a month)Mobile cellular prepaid tariff ($ a month)Fixed broadband Internet access tariff ($ a month)TradeICT goods exports (% of total goods exports)ICT goods imports (% of total goods imports)ICT service exports (% of total service exports)ApplicationsE-gov’t Web measure index (0–1, 1=highest presence)Secure Internet servers (per million people)
50 2011 The Little Data Book on Information and Communication Technology
Sub-Saharan Africa Lower middle income
Country data
Lower middle-income group
2000 2009 2009
Cameroon
16 20 3,81150 58 41
620 1,190 2,3214.8 3.3 8.568 71 8045 57 64
Yes YesPublic Public
M MP CC C
1.4 3.1 3.090 1,050 605
62.8 37.4 22.4
0.6 1.7 12.70.7 37.9 57.80.0 0.1 5.50.3 1.1 4.518 32 ..
.. .. ..
.. .. 3420.3 3.8 17.2
37 58 770.0 3.6 40.1
0 23 151
.. 14.1 4.7
.. 14.0 7.1
.. 88.6 30.4
0.0 0.0 21.33.0 3.2 18.41.4 6.6 19.9
.. 0.15 0.24
.. 0.6 2.7

Economic and social contextPopulation (millions)Urban population (% of total)GNI per capita, World Bank Atlas method ($)GDP growth, 1995–2000 and 2000–09 (avg. annual %)Adult literacy rate (% ages 15 and older) Gross primary, secondary, and tertiary enrollment (%) StructureSeparate telecommunications regulatorStatus of main fixed-line telephone operatorLevel of competition (competition, partial comp., monopoly)
International long distance serviceMobile telephone serviceInternet service
Efficiency and capacityTelecommunications revenue (% of GDP)Mobile cellular and fixed-line subscribers per employeeTelecommunications investment (% of revenue) PerformanceAccessTelephone lines (per 100 people)Mobile cellular subscriptions (per 100 people)Fixed broadband Internet subscribers (per 100 people)Personal computers (per 100 people)Households with a television (%)UsageInternational voice traffic, total (minutes per person per month)Mobile telephone usage (minutes per user per month)Internet users (per 100 people)QualityPopulation covered by mobile cellular network (%)Fixed broadband Internet subscribers (% of total subscribers)International Internet bandwidth (bits per second per person)AffordabilityResidential fixed line tariff ($ a month)Mobile cellular prepaid tariff ($ a month)Fixed broadband Internet access tariff ($ a month)TradeICT goods exports (% of total goods exports)ICT goods imports (% of total goods imports)ICT service exports (% of total service exports)ApplicationsE-gov’t Web measure index (0–1, 1=highest presence)Secure Internet servers (per million people)
51The Little Data Book on Information and Communication Technology 2011
High income
Country dataHigh-
income group
2000 2009 2009
Canada
31 34 1,11780 81 77
22,130 41,980 37,9904.3 2.1 2.0
.. .. 9895 93 91
Yes YesPrivate Private
C CP CC C
2.8 2.5 3.0331 424 76524.0 29.8 15.5
67.7 54.1 45.128.4 68.4 111.214.1 32.2 24.341.9 94.3 65.4
99 99 98
.. .. ..215 401 34342.2 77.7 72.3
90 98 9932.6 91.9 89.2
1,133 16,193 19,521
.. 18.3 22.8
.. 17.7 14.8
.. 24.8 28.8
8.2 4.4 12.215.0 9.6 13.3
9.5 11.2 8.1
.. 0.88 0.46162.6 1,236.6 905.1

Economic and social contextPopulation (millions)Urban population (% of total)GNI per capita, World Bank Atlas method ($)GDP growth, 1995–2000 and 2000–09 (avg. annual %)Adult literacy rate (% ages 15 and older) Gross primary, secondary, and tertiary enrollment (%) StructureSeparate telecommunications regulatorStatus of main fixed-line telephone operatorLevel of competition (competition, partial comp., monopoly)
International long distance serviceMobile telephone serviceInternet service
Efficiency and capacityTelecommunications revenue (% of GDP)Mobile cellular and fixed-line subscribers per employeeTelecommunications investment (% of revenue) PerformanceAccessTelephone lines (per 100 people)Mobile cellular subscriptions (per 100 people)Fixed broadband Internet subscribers (per 100 people)Personal computers (per 100 people)Households with a television (%)UsageInternational voice traffic total (minutes per person per month)Mobile telephone usage (minutes per user per month)Internet users (per 100 people)QualityPopulation covered by mobile cellular network (%)Fixed broadband Internet subscribers (% of total subscribers)International Internet bandwidth (bits per second per person)AffordabilityResidential fixed line tariff ($ a month)Mobile cellular prepaid tariff ($ a month)Fixed broadband Internet access tariff ($ a month)TradeICT goods exports (% of total goods exports)ICT goods imports (% of total goods imports)ICT service exports (% of total service exports)ApplicationsE-gov’t Web measure index (0–1, 1=highest presence)Secure Internet servers (per million people)
52 2011 The Little Data Book on Information and Communication Technology
Sub-Saharan Africa Lower middle income
Country data
Lower middle-income group
2000 2009 2009
Cape Verde
0.44 0.51 3,81153 60 41
1,310 3,010 2,3216.6 6.4 8.5
.. 85 8073 69 64
Yes YesMixed Mixed
M MC PC P
7.0 4.0 3.0154 665 60535.3 19.1 22.4
12.4 14.3 12.74.5 77.5 57.80.6 1.8 5.55.7 14.0 4.540 67 ..
.. 16.2 ..
.. 45 3421.8 29.7 17.2
90 96 770.0 80.1 40.1
2 311 151
.. 5.0 4.7
.. 15.6 7.1
.. 34.9 30.4
2.4 1.2 21.37.1 4.2 18.49.8 5.7 19.9
.. 0.27 0.24
.. 13.7 2.7

Economic and social contextPopulation (millions)Urban population (% of total)GNI per capita, World Bank Atlas method ($)GDP growth, 1995–2000 and 2000–09 (avg. annual %)Adult literacy rate (% ages 15 and older) Gross primary, secondary, and tertiary enrollment (%) StructureSeparate telecommunications regulatorStatus of main fixed-line telephone operatorLevel of competition (competition, partial comp., monopoly)
International long distance serviceMobile telephone serviceInternet service
Efficiency and capacityTelecommunications revenue (% of GDP)Mobile cellular and fixed-line subscribers per employeeTelecommunications investment (% of revenue) PerformanceAccessTelephone lines (per 100 people)Mobile cellular subscriptions (per 100 people)Fixed broadband Internet subscribers (per 100 people)Personal computers (per 100 people)Households with a television (%)UsageInternational voice traffic, total (minutes per person per month)Mobile telephone usage (minutes per user per month)Internet users (per 100 people)QualityPopulation covered by mobile cellular network (%)Fixed broadband Internet subscribers (% of total subscribers)International Internet bandwidth (bits per second per person)AffordabilityResidential fixed line tariff ($ a month)Mobile cellular prepaid tariff ($ a month)Fixed broadband Internet access tariff ($ a month)TradeICT goods exports (% of total goods exports)ICT goods imports (% of total goods imports)ICT service exports (% of total service exports)ApplicationsE-gov’t Web measure index (0–1, 1=highest presence)Secure Internet servers (per million people)
53The Little Data Book on Information and Communication Technology 2011
High income
Country dataHigh-
income group
2000 2009 2009
Cayman Islands
0.04 0.05 1,117100 100 77
.. .. 37,990
.. .. 2.0
.. 99 9881 78 91
.. No
.. ..
.. ..
.. ..
.. ..
.. .. 3.0170 .. 765
.. .. 15.5
87.1 69.1 45.126.6 84.0 111.2
.. .. 24.3
.. .. 65.4
.. 73 98
.. .. ..
.. .. 343
.. 43.7 72.3
.. 100 99
.. .. 89.2
.. .. 19,521
.. .. 22.8
.. .. 14.8
.. .. 28.8
.. .. 12.2
.. .. 13.3
.. .. 8.1
.. .. 0.46266.0 1,920.4 905.1

Economic and social contextPopulation (millions)Urban population (% of total)GNI per capita, World Bank Atlas method ($)GDP growth, 1995–2000 and 2000–09 (avg. annual %)Adult literacy rate (% ages 15 and older) Gross primary, secondary, and tertiary enrollment (%) StructureSeparate telecommunications regulatorStatus of main fixed-line telephone operatorLevel of competition (competition, partial comp., monopoly)
International long distance serviceMobile telephone serviceInternet service
Efficiency and capacityTelecommunications revenue (% of GDP)Mobile cellular and fixed-line subscribers per employeeTelecommunications investment (% of revenue) PerformanceAccessTelephone lines (per 100 people)Mobile cellular subscriptions (per 100 people)Fixed broadband Internet subscribers (per 100 people)Personal computers (per 100 people)Households with a television (%)UsageInternational voice traffic total (minutes per person per month)Mobile telephone usage (minutes per user per month)Internet users (per 100 people)QualityPopulation covered by mobile cellular network (%)Fixed broadband Internet subscribers (% of total subscribers)International Internet bandwidth (bits per second per person)AffordabilityResidential fixed line tariff ($ a month)Mobile cellular prepaid tariff ($ a month)Fixed broadband Internet access tariff ($ a month)TradeICT goods exports (% of total goods exports)ICT goods imports (% of total goods imports)ICT service exports (% of total service exports)ApplicationsE-gov’t Web measure index (0–1, 1=highest presence)Secure Internet servers (per million people)
54 2011 The Little Data Book on Information and Communication Technology
Country dataLow-
income group
2000 2009 2009
Sub-Saharan Africa Low income
Central African Republic
4 4 84638 39 29
270 450 5093.0 0.8 5.449 55 6235 30 56
Yes YesMixed Mixed
M MC C.. ..
1.1 1.1 2.935 293 3011.0 .. ..
0.3 0.3 1.20.1 3.8 26.60.0 0.1 0.10.2 0.3 0.9
.. .. ..
.. .. ..
.. .. ..0.1 0.5 2.7
18 19 530.0 0.0 5.4
0 0 7
.. 10.1 8.8
.. 12.9 8.0
.. 1,329.5 89.9
0.1 0.1 0.62.1 2.7 5.9
.. .. 6.5
.. 0.00 0.09
.. 0.2 0.6
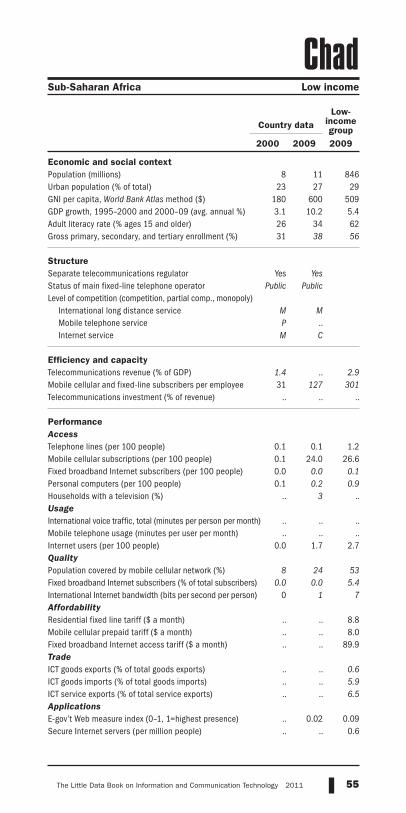
Economic and social contextPopulation (millions)Urban population (% of total)GNI per capita, World Bank Atlas method ($)GDP growth, 1995–2000 and 2000–09 (avg. annual %)Adult literacy rate (% ages 15 and older) Gross primary, secondary, and tertiary enrollment (%) StructureSeparate telecommunications regulatorStatus of main fixed-line telephone operatorLevel of competition (competition, partial comp., monopoly)
International long distance serviceMobile telephone serviceInternet service
Efficiency and capacityTelecommunications revenue (% of GDP)Mobile cellular and fixed-line subscribers per employeeTelecommunications investment (% of revenue) PerformanceAccessTelephone lines (per 100 people)Mobile cellular subscriptions (per 100 people)Fixed broadband Internet subscribers (per 100 people)Personal computers (per 100 people)Households with a television (%)UsageInternational voice traffic, total (minutes per person per month)Mobile telephone usage (minutes per user per month)Internet users (per 100 people)QualityPopulation covered by mobile cellular network (%)Fixed broadband Internet subscribers (% of total subscribers)International Internet bandwidth (bits per second per person)AffordabilityResidential fixed line tariff ($ a month)Mobile cellular prepaid tariff ($ a month)Fixed broadband Internet access tariff ($ a month)TradeICT goods exports (% of total goods exports)ICT goods imports (% of total goods imports)ICT service exports (% of total service exports)ApplicationsE-gov’t Web measure index (0–1, 1=highest presence)Secure Internet servers (per million people)
55The Little Data Book on Information and Communication Technology 2011
Sub-Saharan Africa Low income
Country dataLow-
income group
2000 2009 2009
Chad
8 11 84623 27 29
180 600 5093.1 10.2 5.426 34 6231 38 56
Yes YesPublic Public
M MP ..M C
1.4 .. 2.931 127 301
.. .. ..
0.1 0.1 1.20.1 24.0 26.60.0 0.0 0.10.1 0.2 0.9
.. 3 ..
.. .. ..
.. .. ..0.0 1.7 2.7
8 24 530.0 0.0 5.4
0 1 7
.. .. 8.8
.. .. 8.0
.. .. 89.9
.. .. 0.6
.. .. 5.9
.. .. 6.5
.. 0.02 0.09
.. .. 0.6

Economic and social contextPopulation (millions)Urban population (% of total)GNI per capita, World Bank Atlas method ($)GDP growth, 1995–2000 and 2000–09 (avg. annual %)Adult literacy rate (% ages 15 and older) Gross primary, secondary, and tertiary enrollment (%) StructureSeparate telecommunications regulatorStatus of main fixed-line telephone operatorLevel of competition (competition, partial comp., monopoly)
International long distance serviceMobile telephone serviceInternet service
Efficiency and capacityTelecommunications revenue (% of GDP)Mobile cellular and fixed-line subscribers per employeeTelecommunications investment (% of revenue) PerformanceAccessTelephone lines (per 100 people)Mobile cellular subscriptions (per 100 people)Fixed broadband Internet subscribers (per 100 people)Personal computers (per 100 people)Households with a television (%)UsageInternational voice traffic total (minutes per person per month)Mobile telephone usage (minutes per user per month)Internet users (per 100 people)QualityPopulation covered by mobile cellular network (%)Fixed broadband Internet subscribers (% of total subscribers)International Internet bandwidth (bits per second per person)AffordabilityResidential fixed line tariff ($ a month)Mobile cellular prepaid tariff ($ a month)Fixed broadband Internet access tariff ($ a month)TradeICT goods exports (% of total goods exports)ICT goods imports (% of total goods imports)ICT service exports (% of total service exports)ApplicationsE-gov’t Web measure index (0–1, 1=highest presence)Secure Internet servers (per million people)
56 2011 The Little Data Book on Information and Communication Technology
High income
Country dataHigh-
income group
2000 2009 2009
Channel Islands
0.15 0.15 1,11731 31 77
43,020 68,610 37,990.. 0.5 2.0.. .. 98.. .. 91
.. No
.. ..
.. ..
.. ..
.. ..
.. .. 3.0
.. .. 765
.. .. 15.5
.. .. 45.1
.. .. 111.2
.. .. 24.3
.. .. 65.4
.. .. 98
.. .. ..
.. .. 343
.. .. 72.3
.. .. 99
.. .. 89.2
.. .. 19,521
.. .. 22.8
.. .. 14.8
.. .. 28.8
.. .. 12.2
.. .. 13.3
.. .. 8.1
.. .. 0.46
.. .. 905.1

Economic and social contextPopulation (millions)Urban population (% of total)GNI per capita, World Bank Atlas method ($)GDP growth, 1995–2000 and 2000–09 (avg. annual %)Adult literacy rate (% ages 15 and older) Gross primary, secondary, and tertiary enrollment (%) StructureSeparate telecommunications regulatorStatus of main fixed-line telephone operatorLevel of competition (competition, partial comp., monopoly)
International long distance serviceMobile telephone serviceInternet service
Efficiency and capacityTelecommunications revenue (% of GDP)Mobile cellular and fixed-line subscribers per employeeTelecommunications investment (% of revenue) PerformanceAccessTelephone lines (per 100 people)Mobile cellular subscriptions (per 100 people)Fixed broadband Internet subscribers (per 100 people)Personal computers (per 100 people)Households with a television (%)UsageInternational voice traffic, total (minutes per person per month)Mobile telephone usage (minutes per user per month)Internet users (per 100 people)QualityPopulation covered by mobile cellular network (%)Fixed broadband Internet subscribers (% of total subscribers)International Internet bandwidth (bits per second per person)AffordabilityResidential fixed line tariff ($ a month)Mobile cellular prepaid tariff ($ a month)Fixed broadband Internet access tariff ($ a month)TradeICT goods exports (% of total goods exports)ICT goods imports (% of total goods imports)ICT service exports (% of total service exports)ApplicationsE-gov’t Web measure index (0–1, 1=highest presence)Secure Internet servers (per million people)
57The Little Data Book on Information and Communication Technology 2011
Country data
Upper middle-income group
2000 2009 2009
Latin America & Caribbean Upper middle income
Chile
15 17 1,00286 89 75
4,840 9,470 7,5023.8 4.1 4.496 99 9278 84 82
.. YesPrivate Private
C CC C.. C
3.4 .. 3.3315 592 57644.0 .. 18.0
21.4 21.1 22.122.1 96.9 100.6
3.8 9.8 19.49.2 14.1 11.287 100 93
.. 3.6 ..220 148 15716.6 34.0 34.6
100 100 941.3 99.7 41.612 4,076 1,120
.. 23.6 10.0
.. 10.2 8.8
.. 48.1 18.8
0.2 0.2 12.211.0 6.8 15.1
5.9 2.8 5.4
.. 0.61 0.309.0 52.8 32.2

Economic and social contextPopulation (millions)Urban population (% of total)GNI per capita, World Bank Atlas method ($)GDP growth, 1995–2000 and 2000–09 (avg. annual %)Adult literacy rate (% ages 15 and older) Gross primary, secondary, and tertiary enrollment (%) StructureSeparate telecommunications regulatorStatus of main fixed-line telephone operatorLevel of competition (competition, partial comp., monopoly)
International long distance serviceMobile telephone serviceInternet service
Efficiency and capacityTelecommunications revenue (% of GDP)Mobile cellular and fixed-line subscribers per employeeTelecommunications investment (% of revenue) PerformanceAccessTelephone lines (per 100 people)Mobile cellular subscriptions (per 100 people)Fixed broadband Internet subscribers (per 100 people)Personal computers (per 100 people)Households with a television (%)UsageInternational voice traffic total (minutes per person per month)Mobile telephone usage (minutes per user per month)Internet users (per 100 people)QualityPopulation covered by mobile cellular network (%)Fixed broadband Internet subscribers (% of total subscribers)International Internet bandwidth (bits per second per person)AffordabilityResidential fixed line tariff ($ a month)Mobile cellular prepaid tariff ($ a month)Fixed broadband Internet access tariff ($ a month)TradeICT goods exports (% of total goods exports)ICT goods imports (% of total goods imports)ICT service exports (% of total service exports)ApplicationsE-gov’t Web measure index (0–1, 1=highest presence)Secure Internet servers (per million people)
58 2011 The Little Data Book on Information and Communication Technology
East Asia & Pacific Lower middle income
Country data
Lower middle-income group
2000 2009 2009
China
1,263 1,331 3,81136 44 41
930 3,650 2,3218.5 10.9 8.591 94 8065 67 64
.. NoPublic Mixed
P PP PC C
3.2 2.5 3.0222 1,310 60569.8 32.0 22.4
11.5 23.6 12.76.8 56.1 57.80.7 11.4 5.51.6 5.7 4.5
.. .. ..
.. .. ..247 425 3421.8 28.8 17.2
.. 97 770.3 44.2 40.1
2 651 151
.. 2.3 4.7
.. 3.7 7.1
.. 17.6 30.4
18.9 29.5 21.322.5 24.0 18.4
5.6 6.0 19.9
.. 0.37 0.240.1 1.9 2.7

Economic and social contextPopulation (millions)Urban population (% of total)GNI per capita, World Bank Atlas method ($)GDP growth, 1995–2000 and 2000–09 (avg. annual %)Adult literacy rate (% ages 15 and older) Gross primary, secondary, and tertiary enrollment (%) StructureSeparate telecommunications regulatorStatus of main fixed-line telephone operatorLevel of competition (competition, partial comp., monopoly)
International long distance serviceMobile telephone serviceInternet service
Efficiency and capacityTelecommunications revenue (% of GDP)Mobile cellular and fixed-line subscribers per employeeTelecommunications investment (% of revenue) PerformanceAccessTelephone lines (per 100 people)Mobile cellular subscriptions (per 100 people)Fixed broadband Internet subscribers (per 100 people)Personal computers (per 100 people)Households with a television (%)UsageInternational voice traffic, total (minutes per person per month)Mobile telephone usage (minutes per user per month)Internet users (per 100 people)QualityPopulation covered by mobile cellular network (%)Fixed broadband Internet subscribers (% of total subscribers)International Internet bandwidth (bits per second per person)AffordabilityResidential fixed line tariff ($ a month)Mobile cellular prepaid tariff ($ a month)Fixed broadband Internet access tariff ($ a month)TradeICT goods exports (% of total goods exports)ICT goods imports (% of total goods imports)ICT service exports (% of total service exports)ApplicationsE-gov’t Web measure index (0–1, 1=highest presence)Secure Internet servers (per million people)
59The Little Data Book on Information and Communication Technology 2011
Country data
Upper middle-income group
2000 2009 2009
Latin America & Caribbean Upper middle income
Colombia
40 46 1,00272 75 75
2,350 4,990 7,5020.8 4.5 4.4
.. 93 9273 83 82
Yes YesPublic Mixed
C CP PC C
2.7 3.7 3.3242 .. 57654.6 .. 18.0
18.1 16.4 22.15.7 92.3 100.60.6 5.0 19.43.8 11.2 11.283 88 93
.. .. ..115 148 1572.2 45.5 34.6
.. 83 943.7 93.5 41.616 2,940 1,120
.. 5.7 10.0
.. 9.5 8.8
.. 34.8 18.8
0.2 0.3 12.210.3 9.9 15.1
9.1 7.4 5.4
.. 0.71 0.301.8 14.3 32.2

Economic and social contextPopulation (millions)Urban population (% of total)GNI per capita, World Bank Atlas method ($)GDP growth, 1995–2000 and 2000–09 (avg. annual %)Adult literacy rate (% ages 15 and older) Gross primary, secondary, and tertiary enrollment (%) StructureSeparate telecommunications regulatorStatus of main fixed-line telephone operatorLevel of competition (competition, partial comp., monopoly)
International long distance serviceMobile telephone serviceInternet service
Efficiency and capacityTelecommunications revenue (% of GDP)Mobile cellular and fixed-line subscribers per employeeTelecommunications investment (% of revenue) PerformanceAccessTelephone lines (per 100 people)Mobile cellular subscriptions (per 100 people)Fixed broadband Internet subscribers (per 100 people)Personal computers (per 100 people)Households with a television (%)UsageInternational voice traffic total (minutes per person per month)Mobile telephone usage (minutes per user per month)Internet users (per 100 people)QualityPopulation covered by mobile cellular network (%)Fixed broadband Internet subscribers (% of total subscribers)International Internet bandwidth (bits per second per person)AffordabilityResidential fixed line tariff ($ a month)Mobile cellular prepaid tariff ($ a month)Fixed broadband Internet access tariff ($ a month)TradeICT goods exports (% of total goods exports)ICT goods imports (% of total goods imports)ICT service exports (% of total service exports)ApplicationsE-gov’t Web measure index (0–1, 1=highest presence)Secure Internet servers (per million people)
60 2011 The Little Data Book on Information and Communication Technology
Sub-Saharan Africa Low income
Country dataLow-
income group
2000 2009 2009
Comoros
0.54 0.66 84628 28 29
400 810 5091.7 1.9 5.468 74 6252 61 56
.. YesPublic Mixed
M M.. M
M M
3.2 9.0 2.955 161 301
69.5 .. ..
1.3 3.9 1.20.0 15.2 26.60.1 0.2 0.10.6 0.9 0.9
.. .. ..
.. .. ..
.. .. ..0.3 3.7 2.7
.. 40 530.0 0.0 5.4
0 11 7
.. 11.1 8.8
.. 13.9 8.0
.. 428.4 89.9
.. .. 0.6
.. .. 5.9
.. .. 6.5
.. 0.03 0.09
.. 1.5 0.6

Economic and social contextPopulation (millions)Urban population (% of total)GNI per capita, World Bank Atlas method ($)GDP growth, 1995–2000 and 2000–09 (avg. annual %)Adult literacy rate (% ages 15 and older) Gross primary, secondary, and tertiary enrollment (%) StructureSeparate telecommunications regulatorStatus of main fixed-line telephone operatorLevel of competition (competition, partial comp., monopoly)
International long distance serviceMobile telephone serviceInternet service
Efficiency and capacityTelecommunications revenue (% of GDP)Mobile cellular and fixed-line subscribers per employeeTelecommunications investment (% of revenue) PerformanceAccessTelephone lines (per 100 people)Mobile cellular subscriptions (per 100 people)Fixed broadband Internet subscribers (per 100 people)Personal computers (per 100 people)Households with a television (%)UsageInternational voice traffic, total (minutes per person per month)Mobile telephone usage (minutes per user per month)Internet users (per 100 people)QualityPopulation covered by mobile cellular network (%)Fixed broadband Internet subscribers (% of total subscribers)International Internet bandwidth (bits per second per person)AffordabilityResidential fixed line tariff ($ a month)Mobile cellular prepaid tariff ($ a month)Fixed broadband Internet access tariff ($ a month)TradeICT goods exports (% of total goods exports)ICT goods imports (% of total goods imports)ICT service exports (% of total service exports)ApplicationsE-gov’t Web measure index (0–1, 1=highest presence)Secure Internet servers (per million people)
61The Little Data Book on Information and Communication Technology 2011
Sub-Saharan Africa Low income
Country dataLow-
income group
2000 2009 2009
Congo, Dem. Rep.
51 66 84630 35 2980 160 509
-3.8 5.2 5.467 67 6227 51 56
No YesPublic Mixed
C CC CC C
.. 7.4 2.9
.. 3,628 301
.. 82.5 ..
0.0 0.1 1.20.0 15.4 26.60.0 0.1 0.10.0 0.0 0.9
.. 14 ..
.. 0.5 ..
.. .. ..0.0 0.6 2.7
.. 50 530.0 2.2 5.4
0 1 7
.. .. 8.8
.. .. 8.0
.. .. 89.9
.. .. 0.6
.. .. 5.9
.. .. 6.5
.. 0.09 0.09
.. 0.1 0.6

Economic and social contextPopulation (millions)Urban population (% of total)GNI per capita, World Bank Atlas method ($)GDP growth, 1995–2000 and 2000–09 (avg. annual %)Adult literacy rate (% ages 15 and older) Gross primary, secondary, and tertiary enrollment (%) StructureSeparate telecommunications regulatorStatus of main fixed-line telephone operatorLevel of competition (competition, partial comp., monopoly)
International long distance serviceMobile telephone serviceInternet service
Efficiency and capacityTelecommunications revenue (% of GDP)Mobile cellular and fixed-line subscribers per employeeTelecommunications investment (% of revenue) PerformanceAccessTelephone lines (per 100 people)Mobile cellular subscriptions (per 100 people)Fixed broadband Internet subscribers (per 100 people)Personal computers (per 100 people)Households with a television (%)UsageInternational voice traffic total (minutes per person per month)Mobile telephone usage (minutes per user per month)Internet users (per 100 people)QualityPopulation covered by mobile cellular network (%)Fixed broadband Internet subscribers (% of total subscribers)International Internet bandwidth (bits per second per person)AffordabilityResidential fixed line tariff ($ a month)Mobile cellular prepaid tariff ($ a month)Fixed broadband Internet access tariff ($ a month)TradeICT goods exports (% of total goods exports)ICT goods imports (% of total goods imports)ICT service exports (% of total service exports)ApplicationsE-gov’t Web measure index (0–1, 1=highest presence)Secure Internet servers (per million people)
62 2011 The Little Data Book on Information and Communication Technology
Sub-Saharan Africa Lower middle income
Country data
Lower middle-income group
2000 2009 2009
Congo, Rep.
3 4 3,81158 62 41
580 2,080 2,3211.9 4.0 8.5
.. .. 8048 66 64
.. YesPublic Public
C CC C.. ..
.. 2.7 3.0
.. .. 605
.. .. 22.4
0.7 0.7 12.72.3 58.9 57.80.0 0.0 5.50.4 0.6 4.5
.. 25 ..
.. .. ..
.. 160 3420.0 6.7 17.2
17 53 770.0 0.0 40.1
0 0 151
.. .. 4.7
.. .. 7.1
.. .. 30.4
.. .. 21.3
.. .. 18.4
.. .. 19.9
.. 0.08 0.24
.. 1.3 2.7

Economic and social contextPopulation (millions)Urban population (% of total)GNI per capita, World Bank Atlas method ($)GDP growth, 1995–2000 and 2000–09 (avg. annual %)Adult literacy rate (% ages 15 and older) Gross primary, secondary, and tertiary enrollment (%) StructureSeparate telecommunications regulatorStatus of main fixed-line telephone operatorLevel of competition (competition, partial comp., monopoly)
International long distance serviceMobile telephone serviceInternet service
Efficiency and capacityTelecommunications revenue (% of GDP)Mobile cellular and fixed-line subscribers per employeeTelecommunications investment (% of revenue) PerformanceAccessTelephone lines (per 100 people)Mobile cellular subscriptions (per 100 people)Fixed broadband Internet subscribers (per 100 people)Personal computers (per 100 people)Households with a television (%)UsageInternational voice traffic, total (minutes per person per month)Mobile telephone usage (minutes per user per month)Internet users (per 100 people)QualityPopulation covered by mobile cellular network (%)Fixed broadband Internet subscribers (% of total subscribers)International Internet bandwidth (bits per second per person)AffordabilityResidential fixed line tariff ($ a month)Mobile cellular prepaid tariff ($ a month)Fixed broadband Internet access tariff ($ a month)TradeICT goods exports (% of total goods exports)ICT goods imports (% of total goods imports)ICT service exports (% of total service exports)ApplicationsE-gov’t Web measure index (0–1, 1=highest presence)Secure Internet servers (per million people)
63The Little Data Book on Information and Communication Technology 2011
Latin America & Caribbean Upper middle income
Country data
Upper middle-income group
2000 2009 2009
Costa Rica
4 5 1,00259 64 75
3,700 6,260 7,5025.7 5.1 4.495 96 9266 73 82
Yes YesPublic Public
M PM MM P
1.7 1.8 3.3231 497 57644.4 56.1 18.0
22.9 32.6 22.15.4 42.6 100.60.9 6.0 19.4
15.3 23.1 11.283 96 93
.. 11.0 ..
.. .. 1575.8 34.5 34.6
.. 69 940.0 100.0 41.610 4,333 1,120
.. 4.1 10.0
.. 2.3 8.8
.. 6.3 18.8
31.7 18.7 12.218.4 17.9 15.1
7.9 21.9 5.4
.. 0.30 0.3013.9 108.2 32.2

Economic and social contextPopulation (millions)Urban population (% of total)GNI per capita, World Bank Atlas method ($)GDP growth, 1995–2000 and 2000–09 (avg. annual %)Adult literacy rate (% ages 15 and older) Gross primary, secondary, and tertiary enrollment (%) StructureSeparate telecommunications regulatorStatus of main fixed-line telephone operatorLevel of competition (competition, partial comp., monopoly)
International long distance serviceMobile telephone serviceInternet service
Efficiency and capacityTelecommunications revenue (% of GDP)Mobile cellular and fixed-line subscribers per employeeTelecommunications investment (% of revenue) PerformanceAccessTelephone lines (per 100 people)Mobile cellular subscriptions (per 100 people)Fixed broadband Internet subscribers (per 100 people)Personal computers (per 100 people)Households with a television (%)UsageInternational voice traffic total (minutes per person per month)Mobile telephone usage (minutes per user per month)Internet users (per 100 people)QualityPopulation covered by mobile cellular network (%)Fixed broadband Internet subscribers (% of total subscribers)International Internet bandwidth (bits per second per person)AffordabilityResidential fixed line tariff ($ a month)Mobile cellular prepaid tariff ($ a month)Fixed broadband Internet access tariff ($ a month)TradeICT goods exports (% of total goods exports)ICT goods imports (% of total goods imports)ICT service exports (% of total service exports)ApplicationsE-gov’t Web measure index (0–1, 1=highest presence)Secure Internet servers (per million people)
64 2011 The Little Data Book on Information and Communication Technology
Sub-Saharan Africa Lower middle income
Country data
Lower middle-income group
2000 2009 2009
Côte d’Ivoire
17 21 3,81144 49 41
620 1,070 2,3213.4 0.8 8.549 55 8038 40 64
Yes YesMixed Mixed
M PP PC C
3.5 5.5 3.0189 3,274 60523.7 40.0 22.4
1.5 1.3 12.72.7 63.3 57.80.1 0.1 5.50.5 1.7 4.529 38 ..
.. .. ..
.. .. 3420.2 4.6 17.2
23 59 770.0 6.9 40.1
0 40 151
.. 21.7 4.7
.. 11.5 7.1
.. 44.3 30.4
0.1 0.4 21.33.3 4.5 18.48.2 0.0 19.9
.. 0.32 0.24
.. 1.0 2.7
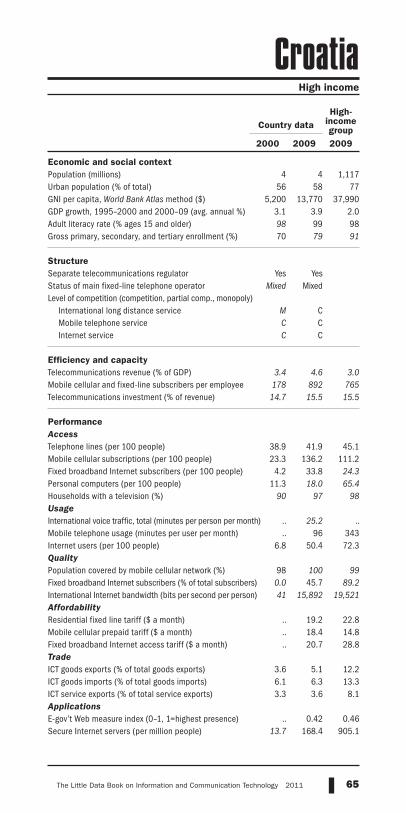
Economic and social contextPopulation (millions)Urban population (% of total)GNI per capita, World Bank Atlas method ($)GDP growth, 1995–2000 and 2000–09 (avg. annual %)Adult literacy rate (% ages 15 and older) Gross primary, secondary, and tertiary enrollment (%) StructureSeparate telecommunications regulatorStatus of main fixed-line telephone operatorLevel of competition (competition, partial comp., monopoly)
International long distance serviceMobile telephone serviceInternet service
Efficiency and capacityTelecommunications revenue (% of GDP)Mobile cellular and fixed-line subscribers per employeeTelecommunications investment (% of revenue) PerformanceAccessTelephone lines (per 100 people)Mobile cellular subscriptions (per 100 people)Fixed broadband Internet subscribers (per 100 people)Personal computers (per 100 people)Households with a television (%)UsageInternational voice traffic, total (minutes per person per month)Mobile telephone usage (minutes per user per month)Internet users (per 100 people)QualityPopulation covered by mobile cellular network (%)Fixed broadband Internet subscribers (% of total subscribers)International Internet bandwidth (bits per second per person)AffordabilityResidential fixed line tariff ($ a month)Mobile cellular prepaid tariff ($ a month)Fixed broadband Internet access tariff ($ a month)TradeICT goods exports (% of total goods exports)ICT goods imports (% of total goods imports)ICT service exports (% of total service exports)ApplicationsE-gov’t Web measure index (0–1, 1=highest presence)Secure Internet servers (per million people)
65The Little Data Book on Information and Communication Technology 2011
High income
Country dataHigh-
income group
2000 2009 2009
Croatia
4 4 1,11756 58 77
5,200 13,770 37,9903.1 3.9 2.098 99 9870 79 91
Yes YesMixed Mixed
M CC CC C
3.4 4.6 3.0178 892 76514.7 15.5 15.5
38.9 41.9 45.123.3 136.2 111.2
4.2 33.8 24.311.3 18.0 65.4
90 97 98
.. 25.2 ..
.. 96 3436.8 50.4 72.3
98 100 990.0 45.7 89.241 15,892 19,521
.. 19.2 22.8
.. 18.4 14.8
.. 20.7 28.8
3.6 5.1 12.26.1 6.3 13.33.3 3.6 8.1
.. 0.42 0.4613.7 168.4 905.1

Economic and social contextPopulation (millions)Urban population (% of total)GNI per capita, World Bank Atlas method ($)GDP growth, 1995–2000 and 2000–09 (avg. annual %)Adult literacy rate (% ages 15 and older) Gross primary, secondary, and tertiary enrollment (%) StructureSeparate telecommunications regulatorStatus of main fixed-line telephone operatorLevel of competition (competition, partial comp., monopoly)
International long distance serviceMobile telephone serviceInternet service
Efficiency and capacityTelecommunications revenue (% of GDP)Mobile cellular and fixed-line subscribers per employeeTelecommunications investment (% of revenue) PerformanceAccessTelephone lines (per 100 people)Mobile cellular subscriptions (per 100 people)Fixed broadband Internet subscribers (per 100 people)Personal computers (per 100 people)Households with a television (%)UsageInternational voice traffic total (minutes per person per month)Mobile telephone usage (minutes per user per month)Internet users (per 100 people)QualityPopulation covered by mobile cellular network (%)Fixed broadband Internet subscribers (% of total subscribers)International Internet bandwidth (bits per second per person)AffordabilityResidential fixed line tariff ($ a month)Mobile cellular prepaid tariff ($ a month)Fixed broadband Internet access tariff ($ a month)TradeICT goods exports (% of total goods exports)ICT goods imports (% of total goods imports)ICT service exports (% of total service exports)ApplicationsE-gov’t Web measure index (0–1, 1=highest presence)Secure Internet servers (per million people)
66 2011 The Little Data Book on Information and Communication Technology
Latin America & Caribbean Upper middle income
Country data
Upper middle-income group
2000 2009 2009
Cuba
11 11 1,00276 76 75
2,630 5,550 7,5024.0 6.7 4.4
100 100 9276 104 82
.. NoMixed Mixed
M MP MC P
2.4 2.9 3.330 58 576
16.0 7.5 18.0
4.4 10.4 22.10.1 4.0 100.6
.. 0.3 19.41.2 5.6 11.2
.. 88 93
.. .. ..
.. .. 1570.5 14.3 34.6
41 77 94.. 5.8 41.62 27 1,120
.. 13.2 10.0
.. 22.7 8.8
.. 1,630.0 18.8
0.2 1.9 12.25.3 2.9 15.1
.. .. 5.4
.. 0.24 0.300.2 0.1 32.2

Economic and social contextPopulation (millions)Urban population (% of total)GNI per capita, World Bank Atlas method ($)GDP growth, 1995–2000 and 2000–09 (avg. annual %)Adult literacy rate (% ages 15 and older) Gross primary, secondary, and tertiary enrollment (%) StructureSeparate telecommunications regulatorStatus of main fixed-line telephone operatorLevel of competition (competition, partial comp., monopoly)
International long distance serviceMobile telephone serviceInternet service
Efficiency and capacityTelecommunications revenue (% of GDP)Mobile cellular and fixed-line subscribers per employeeTelecommunications investment (% of revenue) PerformanceAccessTelephone lines (per 100 people)Mobile cellular subscriptions (per 100 people)Fixed broadband Internet subscribers (per 100 people)Personal computers (per 100 people)Households with a television (%)UsageInternational voice traffic, total (minutes per person per month)Mobile telephone usage (minutes per user per month)Internet users (per 100 people)QualityPopulation covered by mobile cellular network (%)Fixed broadband Internet subscribers (% of total subscribers)International Internet bandwidth (bits per second per person)AffordabilityResidential fixed line tariff ($ a month)Mobile cellular prepaid tariff ($ a month)Fixed broadband Internet access tariff ($ a month)TradeICT goods exports (% of total goods exports)ICT goods imports (% of total goods imports)ICT service exports (% of total service exports)ApplicationsE-gov’t Web measure index (0–1, 1=highest presence)Secure Internet servers (per million people)
67The Little Data Book on Information and Communication Technology 2011
High income
Country dataHigh-
income group
2000 2009 2009
Cyprus
0.79 0.87 1,11769 70 77
13,440 30,480 37,9903.9 3.3 2.097 98 9873 79 91
No YesPublic Public
M CM PC C
3.2 3.4 3.0274 473 76536.6 18.9 15.5
55.9 47.6 45.127.8 112.2 111.2
6.6 21.9 24.319.1 38.3 65.4
.. 100 98
.. 99.9 ..
.. .. 34315.3 49.8 72.3
99 100 993.8 92.2 89.251 1,605 19,521
.. 25.2 22.8
.. 5.2 14.8
.. 22.7 28.8
1.7 9.2 12.27.2 5.6 13.32.1 2.9 8.1
.. 0.37 0.4637.6 1,051.5 905.1

Economic and social contextPopulation (millions)Urban population (% of total)GNI per capita, World Bank Atlas method ($)GDP growth, 1995–2000 and 2000–09 (avg. annual %)Adult literacy rate (% ages 15 and older) Gross primary, secondary, and tertiary enrollment (%) StructureSeparate telecommunications regulatorStatus of main fixed-line telephone operatorLevel of competition (competition, partial comp., monopoly)
International long distance serviceMobile telephone serviceInternet service
Efficiency and capacityTelecommunications revenue (% of GDP)Mobile cellular and fixed-line subscribers per employeeTelecommunications investment (% of revenue) PerformanceAccessTelephone lines (per 100 people)Mobile cellular subscriptions (per 100 people)Fixed broadband Internet subscribers (per 100 people)Personal computers (per 100 people)Households with a television (%)UsageInternational voice traffic total (minutes per person per month)Mobile telephone usage (minutes per user per month)Internet users (per 100 people)QualityPopulation covered by mobile cellular network (%)Fixed broadband Internet subscribers (% of total subscribers)International Internet bandwidth (bits per second per person)AffordabilityResidential fixed line tariff ($ a month)Mobile cellular prepaid tariff ($ a month)Fixed broadband Internet access tariff ($ a month)TradeICT goods exports (% of total goods exports)ICT goods imports (% of total goods imports)ICT service exports (% of total service exports)ApplicationsE-gov’t Web measure index (0–1, 1=highest presence)Secure Internet servers (per million people)
68 2011 The Little Data Book on Information and Communication Technology
High income
Country dataHigh-
income group
2000 2009 2009
Czech Republic
10 10 1,11774 74 77
5,800 17,310 37,9901.0 4.1 2.0
.. .. 9874 85 91
Yes YesMixed Private
M CP PC C
4.5 3.8 3.0349 812 76547.1 10.5 15.5
37.7 19.9 45.142.3 135.9 111.2
4.1 19.3 24.312.2 27.4 65.4
.. .. 98
.. 16.4 ..145 126 3439.7 63.7 72.3
99 100 990.6 100.0 89.2
602 7,075 19,521
.. 29.3 22.8
.. 17.7 14.8
.. 43.3 28.8
7.3 15.6 12.212.1 16.7 13.3
3.2 8.9 8.1
.. 0.45 0.4626.7 317.9 905.1

Economic and social contextPopulation (millions)Urban population (% of total)GNI per capita, World Bank Atlas method ($)GDP growth, 1995–2000 and 2000–09 (avg. annual %)Adult literacy rate (% ages 15 and older) Gross primary, secondary, and tertiary enrollment (%) StructureSeparate telecommunications regulatorStatus of main fixed-line telephone operatorLevel of competition (competition, partial comp., monopoly)
International long distance serviceMobile telephone serviceInternet service
Efficiency and capacityTelecommunications revenue (% of GDP)Mobile cellular and fixed-line subscribers per employeeTelecommunications investment (% of revenue) PerformanceAccessTelephone lines (per 100 people)Mobile cellular subscriptions (per 100 people)Fixed broadband Internet subscribers (per 100 people)Personal computers (per 100 people)Households with a television (%)UsageInternational voice traffic, total (minutes per person per month)Mobile telephone usage (minutes per user per month)Internet users (per 100 people)QualityPopulation covered by mobile cellular network (%)Fixed broadband Internet subscribers (% of total subscribers)International Internet bandwidth (bits per second per person)AffordabilityResidential fixed line tariff ($ a month)Mobile cellular prepaid tariff ($ a month)Fixed broadband Internet access tariff ($ a month)TradeICT goods exports (% of total goods exports)ICT goods imports (% of total goods imports)ICT service exports (% of total service exports)ApplicationsE-gov’t Web measure index (0–1, 1=highest presence)Secure Internet servers (per million people)
69The Little Data Book on Information and Communication Technology 2011
High income
Country dataHigh-
income group
2000 2009 2009
Denmark
5 6 1,11785 87 77
31,850 59,060 37,9902.8 1.2 2.0
.. .. 9896 102 91
Yes YesPrivate Private
C CP PC C
2.6 2.4 3.0337 543 76527.0 23.4 15.5
71.9 37.3 45.163.0 133.9 111.231.6 39.1 24.350.6 54.9 65.4
96 98 98
.. 29.8 ..122 185 34339.2 85.9 72.3
.. .. 994.0 95.8 89.2
1,409 34,506 19,521
.. 24.5 22.8
.. 6.5 14.8
.. 29.1 28.8
8.5 4.8 12.213.3 8.9 13.3
.. .. 8.1
.. 0.67 0.4673.9 1,866.3 905.1

Economic and social contextPopulation (millions)Urban population (% of total)GNI per capita, World Bank Atlas method ($)GDP growth, 1995–2000 and 2000–09 (avg. annual %)Adult literacy rate (% ages 15 and older) Gross primary, secondary, and tertiary enrollment (%) StructureSeparate telecommunications regulatorStatus of main fixed-line telephone operatorLevel of competition (competition, partial comp., monopoly)
International long distance serviceMobile telephone serviceInternet service
Efficiency and capacityTelecommunications revenue (% of GDP)Mobile cellular and fixed-line subscribers per employeeTelecommunications investment (% of revenue) PerformanceAccessTelephone lines (per 100 people)Mobile cellular subscriptions (per 100 people)Fixed broadband Internet subscribers (per 100 people)Personal computers (per 100 people)Households with a television (%)UsageInternational voice traffic total (minutes per person per month)Mobile telephone usage (minutes per user per month)Internet users (per 100 people)QualityPopulation covered by mobile cellular network (%)Fixed broadband Internet subscribers (% of total subscribers)International Internet bandwidth (bits per second per person)AffordabilityResidential fixed line tariff ($ a month)Mobile cellular prepaid tariff ($ a month)Fixed broadband Internet access tariff ($ a month)TradeICT goods exports (% of total goods exports)ICT goods imports (% of total goods imports)ICT service exports (% of total service exports)ApplicationsE-gov’t Web measure index (0–1, 1=highest presence)Secure Internet servers (per million people)
70 2011 The Little Data Book on Information and Communication Technology
Middle East & North Africa Lower middle income
Country data
Lower middle-income group
2000 2009 2009
Djibouti
0.73 0.86 3,81183 88 41
760 1,280 2,321-0.2 4.0 8.5
.. .. 8018 27 64
.. NoPublic Public
M M.. ..
M M
3.7 5.3 3.019 169 605
10.1 13.8 22.4
1.3 1.9 12.70.0 14.9 57.80.2 1.1 5.50.9 4.3 4.5
.. 46 ..
.. .. ..
.. .. 3420.2 3.0 17.2
30 85 770.0 58.1 40.1
0 897 151
.. 8.1 4.7
.. 6.6 7.1
.. 55.9 30.4
.. 0.3 21.3
.. 10.9 18.42.1 2.3 19.9
.. 0.05 0.24
.. 5.7 2.7

Economic and social contextPopulation (millions)Urban population (% of total)GNI per capita, World Bank Atlas method ($)GDP growth, 1995–2000 and 2000–09 (avg. annual %)Adult literacy rate (% ages 15 and older) Gross primary, secondary, and tertiary enrollment (%) StructureSeparate telecommunications regulatorStatus of main fixed-line telephone operatorLevel of competition (competition, partial comp., monopoly)
International long distance serviceMobile telephone serviceInternet service
Efficiency and capacityTelecommunications revenue (% of GDP)Mobile cellular and fixed-line subscribers per employeeTelecommunications investment (% of revenue) PerformanceAccessTelephone lines (per 100 people)Mobile cellular subscriptions (per 100 people)Fixed broadband Internet subscribers (per 100 people)Personal computers (per 100 people)Households with a television (%)UsageInternational voice traffic, total (minutes per person per month)Mobile telephone usage (minutes per user per month)Internet users (per 100 people)QualityPopulation covered by mobile cellular network (%)Fixed broadband Internet subscribers (% of total subscribers)International Internet bandwidth (bits per second per person)AffordabilityResidential fixed line tariff ($ a month)Mobile cellular prepaid tariff ($ a month)Fixed broadband Internet access tariff ($ a month)TradeICT goods exports (% of total goods exports)ICT goods imports (% of total goods imports)ICT service exports (% of total service exports)ApplicationsE-gov’t Web measure index (0–1, 1=highest presence)Secure Internet servers (per million people)
71The Little Data Book on Information and Communication Technology 2011
Country data
Upper middle-income group
2000 2009 2009
Latin America & Caribbean Upper middle income
Dominica
0.07 0.07 1,00271 74 75
3,200 4,900 7,5022.2 2.9 4.4
.. .. 9275 77 82
.. YesMixed Mixed
M CM C.. C
5.0 10.4 3.3132 .. 576
.. .. 18.0
31.8 23.8 22.11.7 144.0 100.63.9 8.4 19.47.7 18.2 11.265 .. 93
.. .. ..
.. .. 1578.4 38.0 34.6
.. .. 942.9 54.0 41.670 420 1,120
.. 10.9 10.0
.. 12.8 8.8
.. 47.8 18.8
0.6 0.7 12.27.4 4.4 15.1
21.0 10.8 5.4
.. 0.05 0.3084.4 297.3 32.2

Economic and social contextPopulation (millions)Urban population (% of total)GNI per capita, World Bank Atlas method ($)GDP growth, 1995–2000 and 2000–09 (avg. annual %)Adult literacy rate (% ages 15 and older) Gross primary, secondary, and tertiary enrollment (%) StructureSeparate telecommunications regulatorStatus of main fixed-line telephone operatorLevel of competition (competition, partial comp., monopoly)
International long distance serviceMobile telephone serviceInternet service
Efficiency and capacityTelecommunications revenue (% of GDP)Mobile cellular and fixed-line subscribers per employeeTelecommunications investment (% of revenue) PerformanceAccessTelephone lines (per 100 people)Mobile cellular subscriptions (per 100 people)Fixed broadband Internet subscribers (per 100 people)Personal computers (per 100 people)Households with a television (%)UsageInternational voice traffic total (minutes per person per month)Mobile telephone usage (minutes per user per month)Internet users (per 100 people)QualityPopulation covered by mobile cellular network (%)Fixed broadband Internet subscribers (% of total subscribers)International Internet bandwidth (bits per second per person)AffordabilityResidential fixed line tariff ($ a month)Mobile cellular prepaid tariff ($ a month)Fixed broadband Internet access tariff ($ a month)TradeICT goods exports (% of total goods exports)ICT goods imports (% of total goods imports)ICT service exports (% of total service exports)ApplicationsE-gov’t Web measure index (0–1, 1=highest presence)Secure Internet servers (per million people)
72 2011 The Little Data Book on Information and Communication Technology
Country data
Upper middle-income group
2000 2009 2009
Latin America & Caribbean Upper middle income
Dominican Republic
9 10 1,00262 70 75
2,550 4,550 7,5027.0 5.5 4.487 88 9269 71 82
Yes YesPrivate Private
C CC CC C
.. 0.4 3.399 .. 576
.. 192.0 18.0
10.1 9.6 22.18.0 85.5 100.60.6 4.3 19.41.9 2.1 11.277 77 93
.. .. ..
.. 116 1573.7 26.8 34.6
.. 90 940.0 92.4 41.6
6 1,387 1,120
.. 12.3 10.0
.. 8.5 8.8
.. 26.3 18.8
0.4 3.6 12.26.6 5.4 15.13.2 4.1 5.4
.. 0.37 0.300.9 14.8 32.2

Economic and social contextPopulation (millions)Urban population (% of total)GNI per capita, World Bank Atlas method ($)GDP growth, 1995–2000 and 2000–09 (avg. annual %)Adult literacy rate (% ages 15 and older) Gross primary, secondary, and tertiary enrollment (%) StructureSeparate telecommunications regulatorStatus of main fixed-line telephone operatorLevel of competition (competition, partial comp., monopoly)
International long distance serviceMobile telephone serviceInternet service
Efficiency and capacityTelecommunications revenue (% of GDP)Mobile cellular and fixed-line subscribers per employeeTelecommunications investment (% of revenue) PerformanceAccessTelephone lines (per 100 people)Mobile cellular subscriptions (per 100 people)Fixed broadband Internet subscribers (per 100 people)Personal computers (per 100 people)Households with a television (%)UsageInternational voice traffic, total (minutes per person per month)Mobile telephone usage (minutes per user per month)Internet users (per 100 people)QualityPopulation covered by mobile cellular network (%)Fixed broadband Internet subscribers (% of total subscribers)International Internet bandwidth (bits per second per person)AffordabilityResidential fixed line tariff ($ a month)Mobile cellular prepaid tariff ($ a month)Fixed broadband Internet access tariff ($ a month)TradeICT goods exports (% of total goods exports)ICT goods imports (% of total goods imports)ICT service exports (% of total service exports)ApplicationsE-gov’t Web measure index (0–1, 1=highest presence)Secure Internet servers (per million people)
73The Little Data Book on Information and Communication Technology 2011
Latin America & Caribbean Lower middle income
Country data
Lower middle-income group
2000 2009 2009
Ecuador
12 14 3,81160 66 41
1,340 3,970 2,3210.7 5.0 8.591 84 80
.. 79 64
Yes YesPublic Public
M CP CP C
2.8 4.1 3.0244 513 6059.8 .. 22.4
9.9 14.7 12.73.9 100.1 57.80.5 4.1 5.52.2 13.0 4.5
.. 83 ..
.. .. ..65 89 3421.5 15.1 17.2
80 84 773.1 42.9 40.1
2 484 151
.. 1.3 4.7
.. 9.4 7.1
.. 39.9 30.4
0.0 0.2 21.36.4 7.5 18.47.2 4.9 19.9
.. 0.32 0.240.9 15.3 2.7

Economic and social contextPopulation (millions)Urban population (% of total)GNI per capita, World Bank Atlas method ($)GDP growth, 1995–2000 and 2000–09 (avg. annual %)Adult literacy rate (% ages 15 and older) Gross primary, secondary, and tertiary enrollment (%) StructureSeparate telecommunications regulatorStatus of main fixed-line telephone operatorLevel of competition (competition, partial comp., monopoly)
International long distance serviceMobile telephone serviceInternet service
Efficiency and capacityTelecommunications revenue (% of GDP)Mobile cellular and fixed-line subscribers per employeeTelecommunications investment (% of revenue) PerformanceAccessTelephone lines (per 100 people)Mobile cellular subscriptions (per 100 people)Fixed broadband Internet subscribers (per 100 people)Personal computers (per 100 people)Households with a television (%)UsageInternational voice traffic total (minutes per person per month)Mobile telephone usage (minutes per user per month)Internet users (per 100 people)QualityPopulation covered by mobile cellular network (%)Fixed broadband Internet subscribers (% of total subscribers)International Internet bandwidth (bits per second per person)AffordabilityResidential fixed line tariff ($ a month)Mobile cellular prepaid tariff ($ a month)Fixed broadband Internet access tariff ($ a month)TradeICT goods exports (% of total goods exports)ICT goods imports (% of total goods imports)ICT service exports (% of total service exports)ApplicationsE-gov’t Web measure index (0–1, 1=highest presence)Secure Internet servers (per million people)
74 2011 The Little Data Book on Information and Communication Technology
Country data
Lower middle-income group
2000 2009 2009
Middle East & North Africa Lower middle income
Egypt, Arab Rep.
70 83 3,81143 43 41
1,390 2,070 2,3215.2 4.9 8.5
.. 66 8074 70 64
Yes YesPublic Mixed
M MC CC C
2.8 3.7 3.0125 855 60518.8 48.1 22.4
7.8 12.4 12.71.9 66.7 57.80.1 3.4 5.51.1 3.9 4.5
.. 97 ..
.. 3.6 ..
.. 159 3420.6 20.0 17.2
.. 95 77
.. 38.4 40.10 1,172 151
.. 3.0 4.7
.. 4.1 7.1
.. 8.2 30.4
.. 1.8 21.3
.. 4.4 18.43.4 4.7 19.9
.. 0.53 0.240.2 2.2 2.7

Economic and social contextPopulation (millions)Urban population (% of total)GNI per capita, World Bank Atlas method ($)GDP growth, 1995–2000 and 2000–09 (avg. annual %)Adult literacy rate (% ages 15 and older) Gross primary, secondary, and tertiary enrollment (%) StructureSeparate telecommunications regulatorStatus of main fixed-line telephone operatorLevel of competition (competition, partial comp., monopoly)
International long distance serviceMobile telephone serviceInternet service
Efficiency and capacityTelecommunications revenue (% of GDP)Mobile cellular and fixed-line subscribers per employeeTelecommunications investment (% of revenue) PerformanceAccessTelephone lines (per 100 people)Mobile cellular subscriptions (per 100 people)Fixed broadband Internet subscribers (per 100 people)Personal computers (per 100 people)Households with a television (%)UsageInternational voice traffic, total (minutes per person per month)Mobile telephone usage (minutes per user per month)Internet users (per 100 people)QualityPopulation covered by mobile cellular network (%)Fixed broadband Internet subscribers (% of total subscribers)International Internet bandwidth (bits per second per person)AffordabilityResidential fixed line tariff ($ a month)Mobile cellular prepaid tariff ($ a month)Fixed broadband Internet access tariff ($ a month)TradeICT goods exports (% of total goods exports)ICT goods imports (% of total goods imports)ICT service exports (% of total service exports)ApplicationsE-gov’t Web measure index (0–1, 1=highest presence)Secure Internet servers (per million people)
75The Little Data Book on Information and Communication Technology 2011
Country data
Lower middle-income group
2000 2009 2009
Latin America & Caribbean Lower middle income
El Salvador
6 6 3,81158 61 41
2,110 3,370 2,3213.3 2.6 8.5
.. 84 8069 73 64
Yes YesMixed Mixed
C CC CC C
4.3 4.8 3.0323 2,275 605
155.8 18.8 22.4
10.5 17.8 12.712.5 122.8 57.8
0.9 2.4 5.52.0 5.8 4.574 83 ..
.. 42.5 ..
.. .. 3421.2 14.4 17.2
85 95 770.0 99.3 40.1
7 243 151
.. 11.5 4.7
.. 7.1 7.1
.. 20.3 30.4
0.1 2.9 21.33.4 5.5 18.4
12.9 16.9 19.9
.. 0.43 0.241.2 13.4 2.7

Economic and social contextPopulation (millions)Urban population (% of total)GNI per capita, World Bank Atlas method ($)GDP growth, 1995–2000 and 2000–09 (avg. annual %)Adult literacy rate (% ages 15 and older) Gross primary, secondary, and tertiary enrollment (%) StructureSeparate telecommunications regulatorStatus of main fixed-line telephone operatorLevel of competition (competition, partial comp., monopoly)
International long distance serviceMobile telephone serviceInternet service
Efficiency and capacityTelecommunications revenue (% of GDP)Mobile cellular and fixed-line subscribers per employeeTelecommunications investment (% of revenue) PerformanceAccessTelephone lines (per 100 people)Mobile cellular subscriptions (per 100 people)Fixed broadband Internet subscribers (per 100 people)Personal computers (per 100 people)Households with a television (%)UsageInternational voice traffic total (minutes per person per month)Mobile telephone usage (minutes per user per month)Internet users (per 100 people)QualityPopulation covered by mobile cellular network (%)Fixed broadband Internet subscribers (% of total subscribers)International Internet bandwidth (bits per second per person)AffordabilityResidential fixed line tariff ($ a month)Mobile cellular prepaid tariff ($ a month)Fixed broadband Internet access tariff ($ a month)TradeICT goods exports (% of total goods exports)ICT goods imports (% of total goods imports)ICT service exports (% of total service exports)ApplicationsE-gov’t Web measure index (0–1, 1=highest presence)Secure Internet servers (per million people)
76 2011 The Little Data Book on Information and Communication Technology
Country dataHigh-
income group
2000 2009 2009
High income
Equatorial Guinea
0.53 0.68 1,11739 40 77
1,250 12,420 37,99036.0 16.8 2.0
87 93 9855 .. 91
.. YesMixed Mixed
M C.. C
M C
1.2 .. 3.065 .. 765
.. .. 15.5
1.2 1.5 45.10.9 65.8 111.20.1 0.2 24.30.4 1.5 65.4
.. .. 98
.. .. ..
.. .. 3430.1 2.1 72.3
.. .. 990.0 15.0 89.2
0 28 19,521
.. .. 22.8
.. .. 14.8
.. .. 28.8
.. .. 12.2
.. .. 13.3
.. .. 8.1
.. 0.03 0.46
.. 2.9 905.1

Economic and social contextPopulation (millions)Urban population (% of total)GNI per capita, World Bank Atlas method ($)GDP growth, 1995–2000 and 2000–09 (avg. annual %)Adult literacy rate (% ages 15 and older) Gross primary, secondary, and tertiary enrollment (%) StructureSeparate telecommunications regulatorStatus of main fixed-line telephone operatorLevel of competition (competition, partial comp., monopoly)
International long distance serviceMobile telephone serviceInternet service
Efficiency and capacityTelecommunications revenue (% of GDP)Mobile cellular and fixed-line subscribers per employeeTelecommunications investment (% of revenue) PerformanceAccessTelephone lines (per 100 people)Mobile cellular subscriptions (per 100 people)Fixed broadband Internet subscribers (per 100 people)Personal computers (per 100 people)Households with a television (%)UsageInternational voice traffic, total (minutes per person per month)Mobile telephone usage (minutes per user per month)Internet users (per 100 people)QualityPopulation covered by mobile cellular network (%)Fixed broadband Internet subscribers (% of total subscribers)International Internet bandwidth (bits per second per person)AffordabilityResidential fixed line tariff ($ a month)Mobile cellular prepaid tariff ($ a month)Fixed broadband Internet access tariff ($ a month)TradeICT goods exports (% of total goods exports)ICT goods imports (% of total goods imports)ICT service exports (% of total service exports)ApplicationsE-gov’t Web measure index (0–1, 1=highest presence)Secure Internet servers (per million people)
77The Little Data Book on Information and Communication Technology 2011
Sub-Saharan Africa Low income
Country dataLow-
income group
2000 2009 2009
Eritrea
4 5 84618 21 29
170 320 5091.5 0.2 5.453 67 6229 31 56
Yes YesPublic Public
M MC PC P
2.8 3.0 2.967 117 301
127.5 70.0 ..
0.8 1.0 1.20.0 2.8 26.60.0 0.1 0.10.2 1.0 0.913 .. ..
.. 2.4 ..
.. .. ..0.1 4.9 2.7
0 80 530.0 0.0 5.4
0 6 7
.. .. 8.8
.. .. 8.0
.. .. 89.9
.. 0.2 0.6
.. 5.2 5.913.5 .. 6.5
.. 0.02 0.09
.. .. 0.6

Economic and social contextPopulation (millions)Urban population (% of total)GNI per capita, World Bank Atlas method ($)GDP growth, 1995–2000 and 2000–09 (avg. annual %)Adult literacy rate (% ages 15 and older) Gross primary, secondary, and tertiary enrollment (%) StructureSeparate telecommunications regulatorStatus of main fixed-line telephone operatorLevel of competition (competition, partial comp., monopoly)
International long distance serviceMobile telephone serviceInternet service
Efficiency and capacityTelecommunications revenue (% of GDP)Mobile cellular and fixed-line subscribers per employeeTelecommunications investment (% of revenue) PerformanceAccessTelephone lines (per 100 people)Mobile cellular subscriptions (per 100 people)Fixed broadband Internet subscribers (per 100 people)Personal computers (per 100 people)Households with a television (%)UsageInternational voice traffic total (minutes per person per month)Mobile telephone usage (minutes per user per month)Internet users (per 100 people)QualityPopulation covered by mobile cellular network (%)Fixed broadband Internet subscribers (% of total subscribers)International Internet bandwidth (bits per second per person)AffordabilityResidential fixed line tariff ($ a month)Mobile cellular prepaid tariff ($ a month)Fixed broadband Internet access tariff ($ a month)TradeICT goods exports (% of total goods exports)ICT goods imports (% of total goods imports)ICT service exports (% of total service exports)ApplicationsE-gov’t Web measure index (0–1, 1=highest presence)Secure Internet servers (per million people)
78 2011 The Little Data Book on Information and Communication Technology
High income
Country dataHigh-
income group
2000 2009 2009
Estonia
1 1 1,11769 69 77
4,220 14,060 37,9905.8 5.9 2.0
100 100 9888 90 91
Yes YesMixed Mixed
M CC CC C
5.1 4.5 3.0354 742 76517.6 13.3 15.5
38.2 36.8 45.140.7 203.0 111.2
6.0 25.6 24.316.1 25.5 65.4
94 98 98
.. .. ..
.. .. 34328.6 72.3 72.3
99 100 9918.0 98.7 89.2137 12,680 19,521
.. 13.2 22.8
.. 12.3 14.8
.. 27.8 28.8
26.1 5.8 12.220.4 6.5 13.3
2.8 8.6 8.1
.. 0.50 0.4658.6 434.3 905.1

Economic and social contextPopulation (millions)Urban population (% of total)GNI per capita, World Bank Atlas method ($)GDP growth, 1995–2000 and 2000–09 (avg. annual %)Adult literacy rate (% ages 15 and older) Gross primary, secondary, and tertiary enrollment (%) StructureSeparate telecommunications regulatorStatus of main fixed-line telephone operatorLevel of competition (competition, partial comp., monopoly)
International long distance serviceMobile telephone serviceInternet service
Efficiency and capacityTelecommunications revenue (% of GDP)Mobile cellular and fixed-line subscribers per employeeTelecommunications investment (% of revenue) PerformanceAccessTelephone lines (per 100 people)Mobile cellular subscriptions (per 100 people)Fixed broadband Internet subscribers (per 100 people)Personal computers (per 100 people)Households with a television (%)UsageInternational voice traffic, total (minutes per person per month)Mobile telephone usage (minutes per user per month)Internet users (per 100 people)QualityPopulation covered by mobile cellular network (%)Fixed broadband Internet subscribers (% of total subscribers)International Internet bandwidth (bits per second per person)AffordabilityResidential fixed line tariff ($ a month)Mobile cellular prepaid tariff ($ a month)Fixed broadband Internet access tariff ($ a month)TradeICT goods exports (% of total goods exports)ICT goods imports (% of total goods imports)ICT service exports (% of total service exports)ApplicationsE-gov’t Web measure index (0–1, 1=highest presence)Secure Internet servers (per million people)
79The Little Data Book on Information and Communication Technology 2011
Country dataLow-
income group
2000 2009 2009
Sub-Saharan Africa Low income
Ethiopia
66 83 84615 17 29
130 330 5093.5 8.5 5.4
.. 30 6229 53 56
Yes YesPublic Public
M MM MM M
1.1 1.3 2.935 233 301
42.6 21.4 ..
0.4 1.1 1.20.0 4.9 26.60.0 0.1 0.10.1 0.7 0.9
.. 5 ..
.. 0.4 ..
.. .. ..0.0 0.5 2.7
.. 10 530.0 4.9 5.4
0 3 7
.. 0.9 8.8
.. 2.4 8.0
.. 486.5 89.9
0.0 0.7 0.65.0 9.5 5.93.6 5.3 6.5
.. 0.20 0.090.0 0.1 0.6

Economic and social contextPopulation (millions)Urban population (% of total)GNI per capita, World Bank Atlas method ($)GDP growth, 1995–2000 and 2000–09 (avg. annual %)Adult literacy rate (% ages 15 and older) Gross primary, secondary, and tertiary enrollment (%) StructureSeparate telecommunications regulatorStatus of main fixed-line telephone operatorLevel of competition (competition, partial comp., monopoly)
International long distance serviceMobile telephone serviceInternet service
Efficiency and capacityTelecommunications revenue (% of GDP)Mobile cellular and fixed-line subscribers per employeeTelecommunications investment (% of revenue) PerformanceAccessTelephone lines (per 100 people)Mobile cellular subscriptions (per 100 people)Fixed broadband Internet subscribers (per 100 people)Personal computers (per 100 people)Households with a television (%)UsageInternational voice traffic total (minutes per person per month)Mobile telephone usage (minutes per user per month)Internet users (per 100 people)QualityPopulation covered by mobile cellular network (%)Fixed broadband Internet subscribers (% of total subscribers)International Internet bandwidth (bits per second per person)AffordabilityResidential fixed line tariff ($ a month)Mobile cellular prepaid tariff ($ a month)Fixed broadband Internet access tariff ($ a month)TradeICT goods exports (% of total goods exports)ICT goods imports (% of total goods imports)ICT service exports (% of total service exports)ApplicationsE-gov’t Web measure index (0–1, 1=highest presence)Secure Internet servers (per million people)
80 2011 The Little Data Book on Information and Communication Technology
High income
Country dataHigh-
income group
2000 2009 2009
Faeroe Islands
0.05 0.05 1,11736 42 77
.. .. 37,990
.. .. 2.0
.. .. 98
.. .. 91
.. No
.. ..
.. ..
.. ..
.. ..
2.8 3.6 3.0178 264 76516.9 3.7 15.5
54.5 43.0 45.137.1 117.2 111.214.0 33.0 24.3
.. .. 65.4
.. .. 98
.. .. ..
.. .. 34332.8 77.1 72.3
98 100 990.7 105.9 89.2
.. 3,316 19,521
.. .. 22.8
.. .. 14.8
.. .. 28.8
.. 0.0 12.25.2 5.0 13.31.8 2.8 8.1
.. .. 0.4621.5 922.6 905.1

Economic and social contextPopulation (millions)Urban population (% of total)GNI per capita, World Bank Atlas method ($)GDP growth, 1995–2000 and 2000–09 (avg. annual %)Adult literacy rate (% ages 15 and older) Gross primary, secondary, and tertiary enrollment (%) StructureSeparate telecommunications regulatorStatus of main fixed-line telephone operatorLevel of competition (competition, partial comp., monopoly)
International long distance serviceMobile telephone serviceInternet service
Efficiency and capacityTelecommunications revenue (% of GDP)Mobile cellular and fixed-line subscribers per employeeTelecommunications investment (% of revenue) PerformanceAccessTelephone lines (per 100 people)Mobile cellular subscriptions (per 100 people)Fixed broadband Internet subscribers (per 100 people)Personal computers (per 100 people)Households with a television (%)UsageInternational voice traffic, total (minutes per person per month)Mobile telephone usage (minutes per user per month)Internet users (per 100 people)QualityPopulation covered by mobile cellular network (%)Fixed broadband Internet subscribers (% of total subscribers)International Internet bandwidth (bits per second per person)AffordabilityResidential fixed line tariff ($ a month)Mobile cellular prepaid tariff ($ a month)Fixed broadband Internet access tariff ($ a month)TradeICT goods exports (% of total goods exports)ICT goods imports (% of total goods imports)ICT service exports (% of total service exports)ApplicationsE-gov’t Web measure index (0–1, 1=highest presence)Secure Internet servers (per million people)
81The Little Data Book on Information and Communication Technology 2011
East Asia & Pacific Upper middle income
Country data
Upper middle-income group
2000 2009 2009
Fiji
0.80 0.85 1,00248 53 75
2,260 3,840 7,5022.2 1.4 4.4
.. .. 9273 69 82
.. NoPublic Mixed
M MM M.. ..
5.2 4.8 3.3104 .. 57617.5 13.6 18.0
10.8 16.1 22.16.9 75.4 100.60.4 1.6 19.44.5 6.0 11.2
.. .. 93
.. .. ..
.. .. 1571.5 13.4 34.6
40 65 940.0 83.3 41.6
5 150 1,120
.. 7.7 10.0
.. 10.8 8.8
.. 20.3 18.8
0.1 0.9 12.26.2 5.2 15.15.7 2.0 5.4
.. 0.18 0.305.0 30.4 32.2

Economic and social contextPopulation (millions)Urban population (% of total)GNI per capita, World Bank Atlas method ($)GDP growth, 1995–2000 and 2000–09 (avg. annual %)Adult literacy rate (% ages 15 and older) Gross primary, secondary, and tertiary enrollment (%) StructureSeparate telecommunications regulatorStatus of main fixed-line telephone operatorLevel of competition (competition, partial comp., monopoly)
International long distance serviceMobile telephone serviceInternet service
Efficiency and capacityTelecommunications revenue (% of GDP)Mobile cellular and fixed-line subscribers per employeeTelecommunications investment (% of revenue) PerformanceAccessTelephone lines (per 100 people)Mobile cellular subscriptions (per 100 people)Fixed broadband Internet subscribers (per 100 people)Personal computers (per 100 people)Households with a television (%)UsageInternational voice traffic total (minutes per person per month)Mobile telephone usage (minutes per user per month)Internet users (per 100 people)QualityPopulation covered by mobile cellular network (%)Fixed broadband Internet subscribers (% of total subscribers)International Internet bandwidth (bits per second per person)AffordabilityResidential fixed line tariff ($ a month)Mobile cellular prepaid tariff ($ a month)Fixed broadband Internet access tariff ($ a month)TradeICT goods exports (% of total goods exports)ICT goods imports (% of total goods imports)ICT service exports (% of total service exports)ApplicationsE-gov’t Web measure index (0–1, 1=highest presence)Secure Internet servers (per million people)
82 2011 The Little Data Book on Information and Communication Technology
High income
Country dataHigh-
income group
2000 2009 2009
Finland
5 5 1,11761 64 77
25,430 45,940 37,9904.9 2.5 2.0
.. .. 98104 101 91
Yes YesMixed Private
C CC CC C
3.3 2.3 3.0272 708 76520.3 10.2 15.5
55.0 26.8 45.172.0 144.2 111.211.9 26.8 24.339.6 50.0 65.4
95 93 98
.. .. ..127 220 34337.2 83.9 72.3
99 100 995.7 57.1 89.2
347 17,221 19,521
.. 18.5 22.8
.. 13.4 14.8
.. 39.0 28.8
25.4 12.6 12.218.6 11.3 13.3
5.4 25.4 8.1
.. 0.48 0.4696.0 1,245.7 905.1

Economic and social contextPopulation (millions)a
Urban population (% of total)GNI per capita, World Bank Atlas method ($)GDP growth, 1995–2000 and 2000–08 (avg. annual %)Adult literacy rate (% ages 15 and older) Gross primary, secondary, and tertiary enrollment (%) StructureSeparate telecommunications regulatorStatus of main fixed-line telephone operatorLevel of competition (competition, partial comp., monopoly)
International long distance serviceMobile telephone serviceInternet service
Efficiency and capacityTelecommunications revenue (% of GDP)Mobile and fixed-line subscribers per employeeTelecommunications investment (% of revenue) PerformanceAccessTelephone lines (per 100 people)Mobile cellular subscriptions (per 100 people)Fixed broadband Internet subscribers (per 100 people)Personal computers (per 100 people)Households with a television (%)UsageInternational voice traffic (minutes per person per month)Mobile telephone usage (minutes per user per month)Internet users (per 100 people)QualityPopulation covered by mobile cellular network (%)Fixed broadband Internet subscribers (% of total subscribers)International Internet bandwidth (bits per second per person)AffordabilityResidential fixed line tariff ($ a month)Mobile cellular prepaid tariff ($ a month)Fixed broadband Internet access tariff ($ a month)TradeICT goods exports (% of total goods exports)ICT goods imports (% of total goods imports)ICT service exports (% of total service exports)ApplicationsE-gov’t Web measure index (0–1, 1=highest presence)Secure Internet servers (per million people)
59 63 1,11776 78 77
24,450 42,620 37,9902.9 1.5 2.0
.. .. 9892 95 91
Yes YesMixed Mixed
C CP CC C
2.1 2.0 3.0408 695 76526.5 14.0 15.5
57.7 56.7 45.149.3 95.1 111.2
9.2 32.5 24.330.4 65.2 65.4
.. 97 98
.. 25.0 ..140 218 34314.4 71.3 72.3
99 99 993.6 95.4 89.2
1,148 29,356 19,521
.. 29.3 22.8
.. 35.2 14.8
.. 36.1 28.8
12.1 5.6 12.213.0 7.8 13.3
2.6 4.3 8.1
.. 0.68 0.4627.7 306.2 905.1
a. Excludes the French overseas deparments of French Guiana, Guadeloupe, Martinique, and Réunion.
83The Little Data Book on Information and Communication Technology 2011
High income
Country dataHigh-
income group
2000 2009 2009
France

Economic and social contextPopulation (millions)Urban population (% of total)GNI per capita, World Bank Atlas method ($)GDP growth, 1995–2000 and 2000–09 (avg. annual %)Adult literacy rate (% ages 15 and older) Gross primary, secondary, and tertiary enrollment (%) StructureSeparate telecommunications regulatorStatus of main fixed-line telephone operatorLevel of competition (competition, partial comp., monopoly)
International long distance serviceMobile telephone serviceInternet service
Efficiency and capacityTelecommunications revenue (% of GDP)Mobile cellular and fixed-line subscribers per employeeTelecommunications investment (% of revenue) PerformanceAccessTelephone lines (per 100 people)Mobile cellular subscriptions (per 100 people)Fixed broadband Internet subscribers (per 100 people)Personal computers (per 100 people)Households with a television (%)UsageInternational voice traffic total (minutes per person per month)Mobile telephone usage (minutes per user per month)Internet users (per 100 people)QualityPopulation covered by mobile cellular network (%)Fixed broadband Internet subscribers (% of total subscribers)International Internet bandwidth (bits per second per person)AffordabilityResidential fixed line tariff ($ a month)Mobile cellular prepaid tariff ($ a month)Fixed broadband Internet access tariff ($ a month)TradeICT goods exports (% of total goods exports)ICT goods imports (% of total goods imports)ICT service exports (% of total service exports)ApplicationsE-gov’t Web measure index (0–1, 1=highest presence)Secure Internet servers (per million people)
84 2011 The Little Data Book on Information and Communication Technology
Country dataHigh-
income group
2000 2009 2009
High income
French Polynesia
0.24 0.27 1,11752 52 77
16,080 .. 37,9903.5 .. 2.0
.. .. 98
.. .. 91
.. No
.. ..
.. ..
.. ..
.. ..
3.6 .. 3.0105 .. 765
.. .. 15.5
22.8 20.2 45.116.9 77.4 111.2
3.0 11.3 24.36.4 11.0 65.4
.. .. 98
.. .. ..
.. .. 3436.4 44.6 72.3
70 97 990.0 98.5 89.232 2,877 19,521
.. .. 22.8
.. .. 14.8
.. .. 28.8
1.1 1.6 12.27.3 6.8 13.30.3 6.2 8.1
.. .. 0.4616.7 84.4 905.1

Economic and social contextPopulation (millions)Urban population (% of total)GNI per capita, World Bank Atlas method ($)GDP growth, 1995–2000 and 2000–09 (avg. annual %)Adult literacy rate (% ages 15 and older) Gross primary, secondary, and tertiary enrollment (%) StructureSeparate telecommunications regulatorStatus of main fixed-line telephone operatorLevel of competition (competition, partial comp., monopoly)
International long distance serviceMobile telephone serviceInternet service
Efficiency and capacityTelecommunications revenue (% of GDP)Mobile cellular and fixed-line subscribers per employeeTelecommunications investment (% of revenue) PerformanceAccessTelephone lines (per 100 people)Mobile cellular subscriptions (per 100 people)Fixed broadband Internet subscribers (per 100 people)Personal computers (per 100 people)Households with a television (%)UsageInternational voice traffic, total (minutes per person per month)Mobile telephone usage (minutes per user per month)Internet users (per 100 people)QualityPopulation covered by mobile cellular network (%)Fixed broadband Internet subscribers (% of total subscribers)International Internet bandwidth (bits per second per person)AffordabilityResidential fixed line tariff ($ a month)Mobile cellular prepaid tariff ($ a month)Fixed broadband Internet access tariff ($ a month)TradeICT goods exports (% of total goods exports)ICT goods imports (% of total goods imports)ICT service exports (% of total service exports)ApplicationsE-gov’t Web measure index (0–1, 1=highest presence)Secure Internet servers (per million people)
85The Little Data Book on Information and Communication Technology 2011
Country data
Upper middle-income group
2000 2009 2009
Sub-Saharan Africa Upper middle income
Gabon
1 1 1,00280 86 75
3,080 7,370 7,5020.3 2.1 4.4
.. 88 9274 .. 82
No YesPublic Public
M CP CC C
2.1 2.0 3.3150 244 57641.8 12.4 18.0
3.2 1.8 22.19.7 93.1 100.60.4 0.8 19.41.0 3.4 11.250 .. 93
.. .. ..
.. .. 1571.2 6.7 34.6
13 79 940.0 18.3 41.6
0 141 1,120
.. .. 10.0
.. .. 8.8
.. .. 18.8
0.1 0.1 12.27.9 6.6 15.10.6 .. 5.4
.. 0.08 0.300.8 8.0 32.2
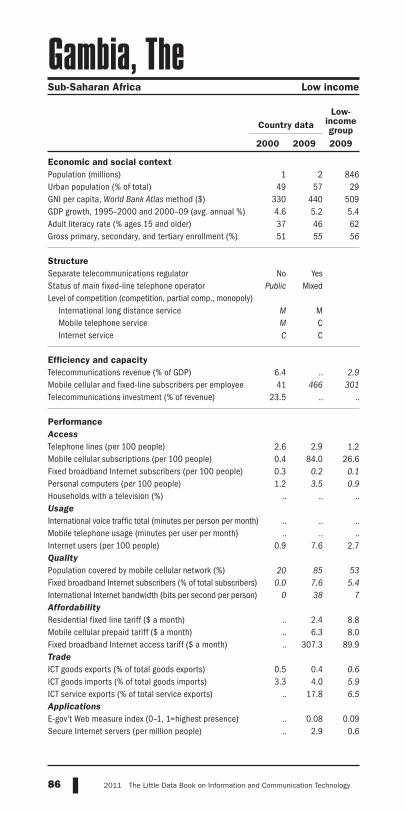
Economic and social contextPopulation (millions)Urban population (% of total)GNI per capita, World Bank Atlas method ($)GDP growth, 1995–2000 and 2000–09 (avg. annual %)Adult literacy rate (% ages 15 and older) Gross primary, secondary, and tertiary enrollment (%) StructureSeparate telecommunications regulatorStatus of main fixed-line telephone operatorLevel of competition (competition, partial comp., monopoly)
International long distance serviceMobile telephone serviceInternet service
Efficiency and capacityTelecommunications revenue (% of GDP)Mobile cellular and fixed-line subscribers per employeeTelecommunications investment (% of revenue) PerformanceAccessTelephone lines (per 100 people)Mobile cellular subscriptions (per 100 people)Fixed broadband Internet subscribers (per 100 people)Personal computers (per 100 people)Households with a television (%)UsageInternational voice traffic total (minutes per person per month)Mobile telephone usage (minutes per user per month)Internet users (per 100 people)QualityPopulation covered by mobile cellular network (%)Fixed broadband Internet subscribers (% of total subscribers)International Internet bandwidth (bits per second per person)AffordabilityResidential fixed line tariff ($ a month)Mobile cellular prepaid tariff ($ a month)Fixed broadband Internet access tariff ($ a month)TradeICT goods exports (% of total goods exports)ICT goods imports (% of total goods imports)ICT service exports (% of total service exports)ApplicationsE-gov’t Web measure index (0–1, 1=highest presence)Secure Internet servers (per million people)
86 2011 The Little Data Book on Information and Communication Technology
Country dataLow-
income group
2000 2009 2009
Sub-Saharan Africa Low income
Gambia, The
1 2 84649 57 29
330 440 5094.6 5.2 5.437 46 6251 55 56
No YesPublic Mixed
M MM CC C
6.4 .. 2.941 466 301
23.5 .. ..
2.6 2.9 1.20.4 84.0 26.60.3 0.2 0.11.2 3.5 0.9
.. .. ..
.. .. ..
.. .. ..0.9 7.6 2.7
20 85 530.0 7.6 5.4
0 38 7
.. 2.4 8.8
.. 6.3 8.0
.. 307.3 89.9
0.5 0.4 0.63.3 4.0 5.9
.. 17.8 6.5
.. 0.08 0.09
.. 2.9 0.6

Economic and social contextPopulation (millions)Urban population (% of total)GNI per capita, World Bank Atlas method ($)GDP growth, 1995–2000 and 2000–09 (avg. annual %)Adult literacy rate (% ages 15 and older) Gross primary, secondary, and tertiary enrollment (%) StructureSeparate telecommunications regulatorStatus of main fixed-line telephone operatorLevel of competition (competition, partial comp., monopoly)
International long distance serviceMobile telephone serviceInternet service
Efficiency and capacityTelecommunications revenue (% of GDP)Mobile cellular and fixed-line subscribers per employeeTelecommunications investment (% of revenue) PerformanceAccessTelephone lines (per 100 people)Mobile cellular subscriptions (per 100 people)Fixed broadband Internet subscribers (per 100 people)Personal computers (per 100 people)Households with a television (%)UsageInternational voice traffic, total (minutes per person per month)Mobile telephone usage (minutes per user per month)Internet users (per 100 people)QualityPopulation covered by mobile cellular network (%)Fixed broadband Internet subscribers (% of total subscribers)International Internet bandwidth (bits per second per person)AffordabilityResidential fixed line tariff ($ a month)Mobile cellular prepaid tariff ($ a month)Fixed broadband Internet access tariff ($ a month)TradeICT goods exports (% of total goods exports)ICT goods imports (% of total goods imports)ICT service exports (% of total service exports)ApplicationsE-gov’t Web measure index (0–1, 1=highest presence)Secure Internet servers (per million people)
87The Little Data Book on Information and Communication Technology 2011
Europe & Central Asia Lower middle income
Country data
Lower middle-income group
2000 2009 2009
Georgia
5 4 3,81153 53 41
730 2,530 2,3215.6 7.4 8.5
100 100 8074 75 64
Yes Yes.. Private
P CC CC C
3.5 6.9 3.069 355 605
65.4 30.9 22.4
10.7 14.6 12.74.1 66.6 57.80.1 21.0 5.52.4 5.5 4.591 89 ..
.. 22.3 ..
.. 91 3420.5 30.5 17.2
79 98 7725.2 10.6 40.1
2 752 151
.. 3.5 4.7
.. 7.6 7.1
.. 42.2 30.4
0.2 0.4 21.37.3 7.8 18.44.3 2.6 19.9
.. 0.25 0.242.1 12.6 2.7

Economic and social contextPopulation (millions)Urban population (% of total)GNI per capita, World Bank Atlas method ($)GDP growth, 1995–2000 and 2000–09 (avg. annual %)Adult literacy rate (% ages 15 and older) Gross primary, secondary, and tertiary enrollment (%) StructureSeparate telecommunications regulatorStatus of main fixed-line telephone operatorLevel of competition (competition, partial comp., monopoly)
International long distance serviceMobile telephone serviceInternet service
Efficiency and capacityTelecommunications revenue (% of GDP)Mobile cellular and fixed-line subscribers per employeeTelecommunications investment (% of revenue) PerformanceAccessTelephone lines (per 100 people)Mobile cellular subscriptions (per 100 people)Fixed broadband Internet subscribers (per 100 people)Personal computers (per 100 people)Households with a television (%)UsageInternational voice traffic total (minutes per person per month)Mobile telephone usage (minutes per user per month)Internet users (per 100 people)QualityPopulation covered by mobile cellular network (%)Fixed broadband Internet subscribers (% of total subscribers)International Internet bandwidth (bits per second per person)AffordabilityResidential fixed line tariff ($ a month)Mobile cellular prepaid tariff ($ a month)Fixed broadband Internet access tariff ($ a month)TradeICT goods exports (% of total goods exports)ICT goods imports (% of total goods imports)ICT service exports (% of total service exports)ApplicationsE-gov’t Web measure index (0–1, 1=highest presence)Secure Internet servers (per million people)
88 2011 The Little Data Book on Information and Communication Technology
Country dataHigh-
income group
2000 2009 2009
High income
Germany
82 82 1,11773 74 77
25,510 42,450 37,9902.0 1.0 2.0
.. .. 98
.. .. 91
Yes YesMixed Mixed
C CP CC C
2.7 2.5 3.0409 787 76517.4 10.6 15.5
61.1 59.5 45.158.6 128.2 111.215.8 24.3 24.333.6 65.6 65.4
95 95 98
.. .. ..70 104 343
30.2 79.5 72.3
99 99 992.0 54.0 89.2
848 25,654 19,521
.. 32.7 22.8
.. 9.5 14.8
.. 43.4 28.8
10.5 6.8 12.213.0 9.3 13.3
6.3 8.4 8.1
.. 0.55 0.4662.6 873.5 905.1

Economic and social contextPopulation (millions)Urban population (% of total)GNI per capita, World Bank Atlas method ($)GDP growth, 1995–2000 and 2000–09 (avg. annual %)Adult literacy rate (% ages 15 and older) Gross primary, secondary, and tertiary enrollment (%) StructureSeparate telecommunications regulatorStatus of main fixed-line telephone operatorLevel of competition (competition, partial comp., monopoly)
International long distance serviceMobile telephone serviceInternet service
Efficiency and capacityTelecommunications revenue (% of GDP)Mobile cellular and fixed-line subscribers per employeeTelecommunications investment (% of revenue) PerformanceAccessTelephone lines (per 100 people)Mobile cellular subscriptions (per 100 people)Fixed broadband Internet subscribers (per 100 people)Personal computers (per 100 people)Households with a television (%)UsageInternational voice traffic, total (minutes per person per month)Mobile telephone usage (minutes per user per month)Internet users (per 100 people)QualityPopulation covered by mobile cellular network (%)Fixed broadband Internet subscribers (% of total subscribers)International Internet bandwidth (bits per second per person)AffordabilityResidential fixed line tariff ($ a month)Mobile cellular prepaid tariff ($ a month)Fixed broadband Internet access tariff ($ a month)TradeICT goods exports (% of total goods exports)ICT goods imports (% of total goods imports)ICT service exports (% of total service exports)ApplicationsE-gov’t Web measure index (0–1, 1=highest presence)Secure Internet servers (per million people)
89The Little Data Book on Information and Communication Technology 2011
Sub-Saharan Africa Low income
Country dataLow-
income group
2000 2009 2009
Ghana
20 24 84644 51 29
330 1,190 5094.4 5.8 5.458 67 6247 59 56
Yes YesMixed Mixed
P PC CC C
1.8 .. 2.991 1,780 301
29.5 .. ..
1.1 1.1 1.20.7 63.4 26.60.1 0.4 0.10.3 1.1 0.9
.. 43 ..
.. 5.1 ..50 103 ..0.2 5.4 2.7
.. 73 530.0 29.5 5.4
0 97 7
.. 3.8 8.8
.. 4.3 8.0
.. 44.4 89.9
.. 0.1 0.6
.. 7.3 5.90.0 0.0 6.5
.. 0.15 0.090.1 1.7 0.6

Economic and social contextPopulation (millions)Urban population (% of total)GNI per capita, World Bank Atlas method ($)GDP growth, 1995–2000 and 2000–09 (avg. annual %)Adult literacy rate (% ages 15 and older) Gross primary, secondary, and tertiary enrollment (%) StructureSeparate telecommunications regulatorStatus of main fixed-line telephone operatorLevel of competition (competition, partial comp., monopoly)
International long distance serviceMobile telephone serviceInternet service
Efficiency and capacityTelecommunications revenue (% of GDP)Mobile cellular and fixed-line subscribers per employeeTelecommunications investment (% of revenue) PerformanceAccessTelephone lines (per 100 people)Mobile cellular subscriptions (per 100 people)Fixed broadband Internet subscribers (per 100 people)Personal computers (per 100 people)Households with a television (%)UsageInternational voice traffic total (minutes per person per month)Mobile telephone usage (minutes per user per month)Internet users (per 100 people)QualityPopulation covered by mobile cellular network (%)Fixed broadband Internet subscribers (% of total subscribers)International Internet bandwidth (bits per second per person)AffordabilityResidential fixed line tariff ($ a month)Mobile cellular prepaid tariff ($ a month)Fixed broadband Internet access tariff ($ a month)TradeICT goods exports (% of total goods exports)ICT goods imports (% of total goods imports)ICT service exports (% of total service exports)ApplicationsE-gov’t Web measure index (0–1, 1=highest presence)Secure Internet servers (per million people)
90 2011 The Little Data Book on Information and Communication Technology
GibralterCountry data
High-income group
2000 2009 2009
High income
0.03 0.03 1,117100 100 77
.. .. 37,990
.. .. 2.0
.. .. 98
.. .. 91
.. ..
.. ..
.. ..
.. ..
.. ..
.. .. 3.0272 .. 765
.. .. 15.5
81.4 77.3 45.119.2 92.1 111.214.7 33.9 24.351.9 .. 65.4
.. .. 98
.. .. ..
.. 80 34319.1 65.1 72.3
100 100 990.0 88.5 89.2
.. .. 19,521
.. .. 22.8
.. .. 14.8
.. .. 28.8
.. .. 12.2
.. .. 13.3
.. .. 8.1
.. .. 0.46
.. 12,551.1 905.1

Economic and social contextPopulation (millions)Urban population (% of total)GNI per capita, World Bank Atlas method ($)GDP growth, 1995–2000 and 2000–09 (avg. annual %)Adult literacy rate (% ages 15 and older) Gross primary, secondary, and tertiary enrollment (%) StructureSeparate telecommunications regulatorStatus of main fixed-line telephone operatorLevel of competition (competition, partial comp., monopoly)
International long distance serviceMobile telephone serviceInternet service
Efficiency and capacityTelecommunications revenue (% of GDP)Mobile cellular and fixed-line subscribers per employeeTelecommunications investment (% of revenue) PerformanceAccessTelephone lines (per 100 people)Mobile cellular subscriptions (per 100 people)Fixed broadband Internet subscribers (per 100 people)Personal computers (per 100 people)Households with a television (%)UsageInternational voice traffic, total (minutes per person per month)Mobile telephone usage (minutes per user per month)Internet users (per 100 people)QualityPopulation covered by mobile cellular network (%)Fixed broadband Internet subscribers (% of total subscribers)International Internet bandwidth (bits per second per person)AffordabilityResidential fixed line tariff ($ a month)Mobile cellular prepaid tariff ($ a month)Fixed broadband Internet access tariff ($ a month)TradeICT goods exports (% of total goods exports)ICT goods imports (% of total goods imports)ICT service exports (% of total service exports)ApplicationsE-gov’t Web measure index (0–1, 1=highest presence)Secure Internet servers (per million people)
91The Little Data Book on Information and Communication Technology 2011
Country dataHigh-
income group
2000 2009 2009
High income
Greece
11 11 1,11760 61 77
12,560 29,040 37,9903.5 3.6 2.096 97 9881 100 91
Yes YesMixed Mixed
M CP PC C
3.7 3.7 3.0451 813 76542.3 15.3 15.5
51.8 52.6 45.154.3 117.8 111.2
2.5 17.5 24.36.9 9.4 65.498 100 98
.. .. ..89 153 3439.2 44.1 72.3
99 100 990.0 96.8 89.251 4,537 19,521
.. 25.4 22.8
.. 23.6 14.8
.. 23.9 28.8
4.4 3.0 12.28.3 5.9 13.31.8 2.2 8.1
.. 0.36 0.4610.6 124.1 905.1

Economic and social contextPopulation (millions)Urban population (% of total)GNI per capita, World Bank Atlas method ($)GDP growth, 1995–2000 and 2000–09 (avg. annual %)Adult literacy rate (% ages 15 and older) Gross primary, secondary, and tertiary enrollment (%) StructureSeparate telecommunications regulatorStatus of main fixed-line telephone operatorLevel of competition (competition, partial comp., monopoly)
International long distance serviceMobile telephone serviceInternet service
Efficiency and capacityTelecommunications revenue (% of GDP)Mobile cellular and fixed-line subscribers per employeeTelecommunications investment (% of revenue) PerformanceAccessTelephone lines (per 100 people)Mobile cellular subscriptions (per 100 people)Fixed broadband Internet subscribers (per 100 people)Personal computers (per 100 people)Households with a television (%)UsageInternational voice traffic total (minutes per person per month)Mobile telephone usage (minutes per user per month)Internet users (per 100 people)QualityPopulation covered by mobile cellular network (%)Fixed broadband Internet subscribers (% of total subscribers)International Internet bandwidth (bits per second per person)AffordabilityResidential fixed line tariff ($ a month)Mobile cellular prepaid tariff ($ a month)Fixed broadband Internet access tariff ($ a month)TradeICT goods exports (% of total goods exports)ICT goods imports (% of total goods imports)ICT service exports (% of total service exports)ApplicationsE-gov’t Web measure index (0–1, 1=highest presence)Secure Internet servers (per million people)
92 2011 The Little Data Book on Information and Communication Technology
High income
Country dataHigh-
income group
2000 2009 2009
Greenland
0.06 0.06 1,11782 84 77
20,290 26,160 37,9903.8 1.7 2.0
.. .. 98
.. .. 91
.. No
.. ..
.. ..
.. ..
.. ..
7.6 .. 3.064 .. 765
.. .. 15.5
46.6 39.3 45.126.9 95.4 111.210.6 21.8 24.3
.. .. 65.4
.. .. 98
.. .. ..
.. .. 34331.7 64.2 72.3
.. 90 990.0 100.0 89.2
107 2,676 19,521
.. .. 22.8
.. .. 14.8
.. .. 28.8
0.1 0.3 12.25.3 7.6 13.3
.. .. 8.1
.. .. 0.4635.5 1,111.2 905.1

Economic and social contextPopulation (millions)Urban population (% of total)GNI per capita, World Bank Atlas method ($)GDP growth, 1995–2000 and 2000–09 (avg. annual %)Adult literacy rate (% ages 15 and older) Gross primary, secondary, and tertiary enrollment (%) StructureSeparate telecommunications regulatorStatus of main fixed-line telephone operatorLevel of competition (competition, partial comp., monopoly)
International long distance serviceMobile telephone serviceInternet service
Efficiency and capacityTelecommunications revenue (% of GDP)Mobile cellular and fixed-line subscribers per employeeTelecommunications investment (% of revenue) PerformanceAccessTelephone lines (per 100 people)Mobile cellular subscriptions (per 100 people)Fixed broadband Internet subscribers (per 100 people)Personal computers (per 100 people)Households with a television (%)UsageInternational voice traffic, total (minutes per person per month)Mobile telephone usage (minutes per user per month)Internet users (per 100 people)QualityPopulation covered by mobile cellular network (%)Fixed broadband Internet subscribers (% of total subscribers)International Internet bandwidth (bits per second per person)AffordabilityResidential fixed line tariff ($ a month)Mobile cellular prepaid tariff ($ a month)Fixed broadband Internet access tariff ($ a month)TradeICT goods exports (% of total goods exports)ICT goods imports (% of total goods imports)ICT service exports (% of total service exports)ApplicationsE-gov’t Web measure index (0–1, 1=highest presence)Secure Internet servers (per million people)
93The Little Data Book on Information and Communication Technology 2011
Latin America & Caribbean Upper middle income
Country data
Upper middle-income group
2000 2009 2009
Grenada
0.10 0.10 1,00231 31 75
3,870 5,580 7,5027.4 1.8 4.4
.. 96 9280 72 82
.. YesMixed Private
M CM C.. C
.. 7.4 3.3134 .. 576
.. .. 18.0
31.0 27.5 22.14.2 61.6 100.62.7 10.5 19.4
11.9 15.7 11.273 .. 93
.. .. ..
.. .. 1574.1 24.1 34.6
65 .. 940.0 93.2 41.640 4,182 1,120
.. 11.6 10.0
.. 8.0 8.8
.. 29.3 18.8
18.4 3.9 12.26.8 5.0 15.1
19.4 8.7 5.4
.. 0.19 0.3049.3 86.3 32.2

Economic and social contextPopulation (millions)Urban population (% of total)GNI per capita, World Bank Atlas method ($)GDP growth, 1995–2000 and 2000–09 (avg. annual %)Adult literacy rate (% ages 15 and older) Gross primary, secondary, and tertiary enrollment (%) StructureSeparate telecommunications regulatorStatus of main fixed-line telephone operatorLevel of competition (competition, partial comp., monopoly)
International long distance serviceMobile telephone serviceInternet service
Efficiency and capacityTelecommunications revenue (% of GDP)Mobile cellular and fixed-line subscribers per employeeTelecommunications investment (% of revenue) PerformanceAccessTelephone lines (per 100 people)Mobile cellular subscriptions (per 100 people)Fixed broadband Internet subscribers (per 100 people)Personal computers (per 100 people)Households with a television (%)UsageInternational voice traffic total (minutes per person per month)Mobile telephone usage (minutes per user per month)Internet users (per 100 people)QualityPopulation covered by mobile cellular network (%)Fixed broadband Internet subscribers (% of total subscribers)International Internet bandwidth (bits per second per person)AffordabilityResidential fixed line tariff ($ a month)Mobile cellular prepaid tariff ($ a month)Fixed broadband Internet access tariff ($ a month)TradeICT goods exports (% of total goods exports)ICT goods imports (% of total goods imports)ICT service exports (% of total service exports)ApplicationsE-gov’t Web measure index (0–1, 1=highest presence)Secure Internet servers (per million people)
94 2011 The Little Data Book on Information and Communication Technology
High income
Country dataHigh-
income group
2000 2009 2009
Guam
0.16 0.18 1,11793 93 77
.. .. 37,990
.. .. 2.0
.. .. 98
.. .. 91
.. No
.. ..
.. ..
.. ..
.. ..
.. .. 3.0280 .. 765
.. .. 15.5
47.9 36.9 45.117.5 59.1 111.2
.. .. 24.3
.. .. 65.4
.. .. 98
.. .. ..
.. .. 34316.1 50.6 72.3
.. .. 99
.. .. 89.2
.. .. 19,521
.. .. 22.8
.. .. 14.8
.. .. 28.8
.. .. 12.2
.. .. 13.3
.. .. 8.1
.. .. 0.4638.1 216.8 905.1

Economic and social contextPopulation (millions)Urban population (% of total)GNI per capita, World Bank Atlas method ($)GDP growth, 1995–2000 and 2000–09 (avg. annual %)Adult literacy rate (% ages 15 and older) Gross primary, secondary, and tertiary enrollment (%) StructureSeparate telecommunications regulatorStatus of main fixed-line telephone operatorLevel of competition (competition, partial comp., monopoly)
International long distance serviceMobile telephone serviceInternet service
Efficiency and capacityTelecommunications revenue (% of GDP)Mobile cellular and fixed-line subscribers per employeeTelecommunications investment (% of revenue) PerformanceAccessTelephone lines (per 100 people)Mobile cellular subscriptions (per 100 people)Fixed broadband Internet subscribers (per 100 people)Personal computers (per 100 people)Households with a television (%)UsageInternational voice traffic, total (minutes per person per month)Mobile telephone usage (minutes per user per month)Internet users (per 100 people)QualityPopulation covered by mobile cellular network (%)Fixed broadband Internet subscribers (% of total subscribers)International Internet bandwidth (bits per second per person)AffordabilityResidential fixed line tariff ($ a month)Mobile cellular prepaid tariff ($ a month)Fixed broadband Internet access tariff ($ a month)TradeICT goods exports (% of total goods exports)ICT goods imports (% of total goods imports)ICT service exports (% of total service exports)ApplicationsE-gov’t Web measure index (0–1, 1=highest presence)Secure Internet servers (per million people)
95The Little Data Book on Information and Communication Technology 2011
Latin America & Caribbean Lower middle income
Country data
Lower middle-income group
2000 2009 2009
Guatemala
11 14 3,81145 49 41
1,730 2,650 2,3214.1 3.7 8.569 74 8058 70 64
Yes YesPrivate Private
C CC CC C
2.2 .. 3.0434 .. 605
.. .. 22.4
6.0 10.1 12.77.6 123.4 57.8
.. .. 5.51.2 2.1 4.554 69 ..
3.1 17.2 .... .. 342
0.7 16.3 17.2
54 76 77.. .. 40.11 186 151
.. 7.8 4.7
.. 7.3 7.1
.. 34.4 30.4
0.1 0.7 21.39.2 6.3 18.40.5 14.1 19.9
.. 0.31 0.241.0 9.9 2.7

Economic and social contextPopulation (millions)Urban population (% of total)GNI per capita, World Bank Atlas method ($)GDP growth, 1995–2000 and 2000–09 (avg. annual %)Adult literacy rate (% ages 15 and older) Gross primary, secondary, and tertiary enrollment (%) StructureSeparate telecommunications regulatorStatus of main fixed-line telephone operatorLevel of competition (competition, partial comp., monopoly)
International long distance serviceMobile telephone serviceInternet service
Efficiency and capacityTelecommunications revenue (% of GDP)Mobile cellular and fixed-line subscribers per employeeTelecommunications investment (% of revenue) PerformanceAccessTelephone lines (per 100 people)Mobile cellular subscriptions (per 100 people)Fixed broadband Internet subscribers (per 100 people)Personal computers (per 100 people)Households with a television (%)UsageInternational voice traffic total (minutes per person per month)Mobile telephone usage (minutes per user per month)Internet users (per 100 people)QualityPopulation covered by mobile cellular network (%)Fixed broadband Internet subscribers (% of total subscribers)International Internet bandwidth (bits per second per person)AffordabilityResidential fixed line tariff ($ a month)Mobile cellular prepaid tariff ($ a month)Fixed broadband Internet access tariff ($ a month)TradeICT goods exports (% of total goods exports)ICT goods imports (% of total goods imports)ICT service exports (% of total service exports)ApplicationsE-gov’t Web measure index (0–1, 1=highest presence)Secure Internet servers (per million people)
96 2011 The Little Data Book on Information and Communication Technology
Sub-Saharan Africa Low income
Country dataLow-
income group
2000 2009 2009
Sub-Saharan Africa Low income
Country dataLow-
income group
2000 2009 2009
Guinea
8 10 84631 35 29
400 370 5094.4 3.0 5.4
.. 39 6230 51 56
Yes YesMixed Mixed
M PC CC C
0.9 .. 2.982 .. 301
17.8 .. ..
0.3 0.2 1.20.5 55.7 26.60.0 0.1 0.10.3 0.5 0.9
9 11 ..
.. .. ..
.. .. ..0.1 0.9 2.7
.. 80 530.0 0.0 5.4
0 0 7
.. 3.0 8.8
.. 3.1 8.0
.. 502.5 89.9
0.1 0.0 0.61.6 5.8 5.91.7 21.6 6.5
.. 0.03 0.09
.. 0.4 0.6

Economic and social contextPopulation (millions)Urban population (% of total)GNI per capita, World Bank Atlas method ($)GDP growth, 1995–2000 and 2000–09 (avg. annual %)Adult literacy rate (% ages 15 and older) Gross primary, secondary, and tertiary enrollment (%) StructureSeparate telecommunications regulatorStatus of main fixed-line telephone operatorLevel of competition (competition, partial comp., monopoly)
International long distance serviceMobile telephone serviceInternet service
Efficiency and capacityTelecommunications revenue (% of GDP)Mobile cellular and fixed-line subscribers per employeeTelecommunications investment (% of revenue) PerformanceAccessTelephone lines (per 100 people)Mobile cellular subscriptions (per 100 people)Fixed broadband Internet subscribers (per 100 people)Personal computers (per 100 people)Households with a television (%)UsageInternational voice traffic, total (minutes per person per month)Mobile telephone usage (minutes per user per month)Internet users (per 100 people)QualityPopulation covered by mobile cellular network (%)Fixed broadband Internet subscribers (% of total subscribers)International Internet bandwidth (bits per second per person)AffordabilityResidential fixed line tariff ($ a month)Mobile cellular prepaid tariff ($ a month)Fixed broadband Internet access tariff ($ a month)TradeICT goods exports (% of total goods exports)ICT goods imports (% of total goods imports)ICT service exports (% of total service exports)ApplicationsE-gov’t Web measure index (0–1, 1=highest presence)Secure Internet servers (per million people)
97The Little Data Book on Information and Communication Technology 2011
Sub-Saharan Africa Low income
Country dataLow-
income group
2000 2009 2009
Sub-Saharan Africa Low income
Country dataLow-
income group
2000 2009 2009
Guinea-Bissau
1 2 84630 30 29
170 510 509-2.7 1.0 5.4
41 52 6240 .. 56
Yes YesMixed Mixed
M MC PC C
.. .. 2.946 .. 301
.. .. ..
0.9 0.3 1.20.0 34.8 26.60.0 0.0 0.10.2 0.2 0.9
.. .. ..
.. .. ..
.. .. ..0.2 2.3 2.7
.. 65 530.0 0.0 5.4
0 1 7
.. .. 8.8
.. .. 8.0
.. .. 89.9
.. 0.0 0.6
.. 2.0 5.90.0 0.2 6.5
.. 0.02 0.09
.. 0.6 0.6

Economic and social contextPopulation (millions)Urban population (% of total)GNI per capita, World Bank Atlas method ($)GDP growth, 1995–2000 and 2000–09 (avg. annual %)Adult literacy rate (% ages 15 and older) Gross primary, secondary, and tertiary enrollment (%) StructureSeparate telecommunications regulatorStatus of main fixed-line telephone operatorLevel of competition (competition, partial comp., monopoly)
International long distance serviceMobile telephone serviceInternet service
Efficiency and capacityTelecommunications revenue (% of GDP)Mobile cellular and fixed-line subscribers per employeeTelecommunications investment (% of revenue) PerformanceAccessTelephone lines (per 100 people)Mobile cellular subscriptions (per 100 people)Fixed broadband Internet subscribers (per 100 people)Personal computers (per 100 people)Households with a television (%)UsageInternational voice traffic total (minutes per person per month)Mobile telephone usage (minutes per user per month)Internet users (per 100 people)QualityPopulation covered by mobile cellular network (%)Fixed broadband Internet subscribers (% of total subscribers)International Internet bandwidth (bits per second per person)AffordabilityResidential fixed line tariff ($ a month)Mobile cellular prepaid tariff ($ a month)Fixed broadband Internet access tariff ($ a month)TradeICT goods exports (% of total goods exports)ICT goods imports (% of total goods imports)ICT service exports (% of total service exports)ApplicationsE-gov’t Web measure index (0–1, 1=highest presence)Secure Internet servers (per million people)
98 2011 The Little Data Book on Information and Communication Technology
Latin America & Caribbean Lower middle income
Country data
Lower middle-income group
2000 2009 2009
Guyana
0.76 0.76 3,81129 28 41
870 2,660 2,3212.5 2.2 8.5
.. .. 8075 81 64
.. YesMixed Mixed
M MC P.. P
10.0 .. 3.0164 439 60520.2 .. 22.4
9.0 17.0 12.75.3 36.8 57.81.7 6.3 5.52.9 3.5 4.565 71 ..
.. .. ..
.. .. 3426.6 28.9 17.2
.. 95 770.0 4.2 40.111 47 151
.. 2.6 4.7
.. 7.4 7.1
.. 49.4 30.4
0.0 0.1 21.33.7 3.5 18.4
22.6 18.5 19.9
.. 0.18 0.24
.. 6.6 2.7

Economic and social contextPopulation (millions)Urban population (% of total)GNI per capita, World Bank Atlas method ($)GDP growth, 1995–2000 and 2000–08 (avg. annual %)Adult literacy rate (% ages 15 and older) Gross primary, secondary, and tertiary enrollment (%) StructureSeparate telecommunications regulatorStatus of main fixed-line telephone operatorLevel of competition (competition, partial comp., monopoly)
International long distance serviceMobile telephone serviceInternet service
Efficiency and capacityTelecommunications revenue (% of GDP)Mobile and fixed-line subscribers per employeeTelecommunications investment (% of revenue) PerformanceAccessTelephone lines (per 100 people)Mobile cellular subscriptions (per 100 people)Fixed broadband Internet subscribers (per 100 people)Personal computers (per 100 people)Households with a television (%)UsageInternational voice traffic (minutes per person per month)Mobile telephone usage (minutes per user per month)Internet users (per 100 people)QualityPopulation covered by mobile cellular network (%)Fixed broadband Internet subscribers (% of total subscribers)International Internet bandwidth (bits per second per person)AffordabilityResidential fixed line tariff ($ a month)Mobile cellular prepaid tariff ($ a month)Fixed broadband Internet access tariff ($ a month)TradeICT goods exports (% of total goods exports)ICT goods imports (% of total goods imports)ICT service exports (% of total service exports)ApplicationsE-gov’t Web measure index (0–1, 1=highest presence)Secure Internet servers (per million people, December 2010)
99The Little Data Book on Information and Communication Technology 2011
Latin America & Caribbean Low income
Country dataLow-
income group
2000 2009 2009
Haiti
9 10 84636 48 29
.. .. 5092.5 0.7 5.4
.. 49 62
.. .. 56
Yes YesMixed Public
M CP CC C
.. .. 2.932 92 301
.. .. ..
0.8 1.1 1.20.6 36.4 26.60.1 1.0 0.10.1 5.1 0.923 25 ..
.. .. ..
.. .. ..0.2 10.0 2.7
.. .. 530.0 0.0 5.4
5 16 7
.. .. 8.8
.. .. 8.0
.. .. 89.9
.. .. 0.6
.. .. 5.917.4 2.5 6.5
.. 0.02 0.090.1 1.0 0.6

Economic and social contextPopulation (millions)Urban population (% of total)GNI per capita, World Bank Atlas method ($)GDP growth, 1995–2000 and 2000–09 (avg. annual %)Adult literacy rate (% ages 15 and older) Gross primary, secondary, and tertiary enrollment (%) StructureSeparate telecommunications regulatorStatus of main fixed-line telephone operatorLevel of competition (competition, partial comp., monopoly)
International long distance serviceMobile telephone serviceInternet service
Efficiency and capacityTelecommunications revenue (% of GDP)Mobile cellular and fixed-line subscribers per employeeTelecommunications investment (% of revenue) PerformanceAccessTelephone lines (per 100 people)Mobile cellular subscriptions (per 100 people)Fixed broadband Internet subscribers (per 100 people)Personal computers (per 100 people)Households with a television (%)UsageInternational voice traffic total (minutes per person per month)Mobile telephone usage (minutes per user per month)Internet users (per 100 people)QualityPopulation covered by mobile cellular network (%)Fixed broadband Internet subscribers (% of total subscribers)International Internet bandwidth (bits per second per person)AffordabilityResidential fixed line tariff ($ a month)Mobile cellular prepaid tariff ($ a month)Fixed broadband Internet access tariff ($ a month)TradeICT goods exports (% of total goods exports)ICT goods imports (% of total goods imports)ICT service exports (% of total service exports)ApplicationsE-gov’t Web measure index (0–1, 1=highest presence)Secure Internet servers (per million people)
100 2011 The Little Data Book on Information and Communication Technology
Latin America & Caribbean Lower middle income
Country data
Lower middle-income group
2000 2009 2009
Honduras
6 7 3,81144 48 41
930 1,800 2,3212.8 4.9 8.580 84 8063 72 64
Yes YesPublic Mixed
C MP CC C
4.3 7.2 3.0107 391 60516.2 67.1 22.4
4.8 11.1 12.72.5 103.3 57.80.3 0.8 5.51.1 2.5 4.548 68 ..
.. 18.6 ..
.. .. 3421.2 9.8 17.2
83 90 770.0 0.0 40.1
2 241 151
.. .. 4.7
.. .. 7.1
.. .. 30.4
0.0 0.2 21.30.5 6.6 18.4
24.2 26.8 19.9
.. 0.30 0.240.6 8.3 2.7

Economic and social contextPopulation (millions)Urban population (% of total)GNI per capita, World Bank Atlas method ($)GDP growth, 1995–2000 and 2000–09 (avg. annual %)Adult literacy rate (% ages 15 and older) Gross primary, secondary, and tertiary enrollment (%) StructureSeparate telecommunications regulatorStatus of main fixed-line telephone operatorLevel of competition (competition, partial comp., monopoly)
International long distance serviceMobile telephone serviceInternet service
Efficiency and capacityTelecommunications revenue (% of GDP)Mobile cellular and fixed-line subscribers per employeeTelecommunications investment (% of revenue) PerformanceAccessTelephone lines (per 100 people)Mobile cellular subscriptions (per 100 people)Fixed broadband Internet subscribers (per 100 people)Personal computers (per 100 people)Households with a television (%)UsageInternational voice traffic, total (minutes per person per month)Mobile telephone usage (minutes per user per month)Internet users (per 100 people)QualityPopulation covered by mobile cellular network (%)Fixed broadband Internet subscribers (% of total subscribers)International Internet bandwidth (bits per second per person)AffordabilityResidential fixed line tariff ($ a month)Mobile cellular prepaid tariff ($ a month)Fixed broadband Internet access tariff ($ a month)TradeICT goods exports (% of total goods exports)ICT goods imports (% of total goods imports)ICT service exports (% of total service exports)ApplicationsE-gov’t Web measure index (0–1, 1=highest presence)Secure Internet servers (per million people)
101The Little Data Book on Information and Communication Technology 2011
High income
Country dataHigh-
income group
2000 2009 2009
Hong Kong SAR, China
7 7 1,117100 100 77
26,570 31,570 37,9901.8 4.7 2.0
.. .. 98
.. 75 91
.. No
.. ..
.. ..
.. ..
.. ..
4.4 3.6 3.0243 980 76512.0 12.2 15.5
58.9 59.8 45.181.7 174.3 111.240.0 43.4 24.340.2 69.3 65.4
99 99 98
.. 119.6 ..353 459 34327.8 61.4 72.3
100 100 9916.7 67.7 89.2627 560,989 19,521
.. 7.1 22.8
.. 0.8 14.8
.. 12.8 28.8
27.3 44.6 12.230.1 43.6 13.3
1.0 1.7 8.1
.. .. 0.4680.1 455.2 905.1

Economic and social contextPopulation (millions)Urban population (% of total)GNI per capita, World Bank Atlas method ($)GDP growth, 1995–2000 and 2000–09 (avg. annual %)Adult literacy rate (% ages 15 and older) Gross primary, secondary, and tertiary enrollment (%) StructureSeparate telecommunications regulatorStatus of main fixed-line telephone operatorLevel of competition (competition, partial comp., monopoly)
International long distance serviceMobile telephone serviceInternet service
Efficiency and capacityTelecommunications revenue (% of GDP)Mobile cellular and fixed-line subscribers per employeeTelecommunications investment (% of revenue) PerformanceAccessTelephone lines (per 100 people)Mobile cellular subscriptions (per 100 people)Fixed broadband Internet subscribers (per 100 people)Personal computers (per 100 people)Households with a television (%)UsageInternational voice traffic total (minutes per person per month)Mobile telephone usage (minutes per user per month)Internet users (per 100 people)QualityPopulation covered by mobile cellular network (%)Fixed broadband Internet subscribers (% of total subscribers)International Internet bandwidth (bits per second per person)AffordabilityResidential fixed line tariff ($ a month)Mobile cellular prepaid tariff ($ a month)Fixed broadband Internet access tariff ($ a month)TradeICT goods exports (% of total goods exports)ICT goods imports (% of total goods imports)ICT service exports (% of total service exports)ApplicationsE-gov’t Web measure index (0–1, 1=highest presence)Secure Internet servers (per million people)
102 2011 The Little Data Book on Information and Communication Technology
High income
Country dataHigh-
income group
2000 2009 2009
Hungary
10 10 1,11765 68 77
4,700 12,980 37,9904.3 2.9 2.0
.. 99 9880 90 91
Yes YesPrivate Private
M CP PC C
6.7 3.8 3.0330 1,127 76516.9 9.8 15.5
37.2 30.6 45.130.1 117.7 111.2
2.2 19.0 24.38.5 25.6 65.495 99 98
.. 13.2 ..181 160 3437.0 61.6 72.3
95 99 991.5 98.8 89.2
100 5,987 19,521
.. 24.0 22.8
.. 15.4 14.8
.. 30.3 28.8
27.7 24.6 12.223.7 18.8 13.3
3.2 8.8 8.1
.. 0.50 0.4612.5 166.1 905.1

Economic and social contextPopulation (millions)Urban population (% of total)GNI per capita, World Bank Atlas method ($)GDP growth, 1995–2000 and 2000–09 (avg. annual %)Adult literacy rate (% ages 15 and older) Gross primary, secondary, and tertiary enrollment (%) StructureSeparate telecommunications regulatorStatus of main fixed-line telephone operatorLevel of competition (competition, partial comp., monopoly)
International long distance serviceMobile telephone serviceInternet service
Efficiency and capacityTelecommunications revenue (% of GDP)Mobile cellular and fixed-line subscribers per employeeTelecommunications investment (% of revenue) PerformanceAccessTelephone lines (per 100 people)Mobile cellular subscriptions (per 100 people)Fixed broadband Internet subscribers (per 100 people)Personal computers (per 100 people)Households with a television (%)UsageInternational voice traffic, total (minutes per person per month)Mobile telephone usage (minutes per user per month)Internet users (per 100 people)QualityPopulation covered by mobile cellular network (%)Fixed broadband Internet subscribers (% of total subscribers)International Internet bandwidth (bits per second per person)AffordabilityResidential fixed line tariff ($ a month)Mobile cellular prepaid tariff ($ a month)Fixed broadband Internet access tariff ($ a month)TradeICT goods exports (% of total goods exports)ICT goods imports (% of total goods imports)ICT service exports (% of total service exports)ApplicationsE-gov’t Web measure index (0–1, 1=highest presence)Secure Internet servers (per million people)
103The Little Data Book on Information and Communication Technology 2011
High income
Country dataHigh-
income group
2000 2009 2009
Iceland
0.28 0.32 1,11792 92 77
30,830 43,430 37,9905.0 3.9 2.0
.. .. 9890 96 91
Yes YesPublic Private
C CC CC C
2.4 2.9 3.0298 397 76533.6 19.5 15.5
69.9 58.0 45.176.5 109.4 111.216.7 35.3 24.339.1 52.7 65.4
97 93 98
.. .. ..
.. 167 34344.5 94.5 72.3
99 99 995.0 95.0 89.2
157 62,684 19,521
.. 16.0 22.8
.. 8.3 14.8
.. 33.5 28.8
0.6 0.4 12.210.6 4.8 13.3
3.8 4.4 8.1
.. 0.40 0.46301.8 2,521.6 905.1

Economic and social contextPopulation (millions)Urban population (% of total)GNI per capita, World Bank Atlas method ($)GDP growth, 1995–2000 and 2000–08 (avg. annual %)Adult literacy rate (% ages 15 and older) Gross primary, secondary, and tertiary enrollment (%) StructureSeparate telecommunications regulatorStatus of main fixed-line telephone operatorLevel of competition (competition, partial comp., monopoly)
International long distance serviceMobile telephone serviceInternet service
Efficiency and capacityTelecommunications revenue (% of GDP)Mobile and fixed-line subscribers per employeeTelecommunications investment (% of revenue) PerformanceAccessTelephone lines (per 100 people)Mobile cellular subscriptions (per 100 people)Fixed broadband Internet subscribers (per 100 people)Personal computers (per 100 people)Households with a television (%)UsageInternational voice traffic (minutes per person per month)Mobile telephone usage (minutes per user per month)Internet users (per 100 people)QualityPopulation covered by mobile cellular network (%)Fixed broadband Internet subscribers (% of total subscribers)International Internet bandwidth (bits per second per person)AffordabilityResidential fixed line tariff ($ a month)Mobile cellular prepaid tariff ($ a month)Fixed broadband Internet access tariff ($ a month)TradeICT goods exports (% of total goods exports)ICT goods imports (% of total goods imports)ICT service exports (% of total service exports)ApplicationsE-gov’t Web measure index (0–1, 1=highest presence)Secure Internet servers (per million people, December 2010)
104 2011 The Little Data Book on Information and Communication Technology
Country data
Lower middle-income group
2000 2009 2009
South Asia Lower middle income
India
1,016 1,155 3,81128 30 41
450 1,220 2,3215.9 7.9 8.561 63 8052 63 64
Yes YesPublic Mixed
M CP PC C
1.5 1.9 3.085 .. 605
49.3 .. 22.4
3.2 3.2 12.70.4 45.4 57.80.3 1.3 5.50.5 3.3 4.531 55 ..
.. .. ..191 385 3420.5 5.3 17.2
21 61 770.0 50.8 40.1
1 32 151
.. 3.1 4.7
.. 1.4 7.1
.. 5.2 30.4
1.4 3.8 21.36.0 8.8 18.4
31.9 53.1 19.9
.. 0.37 0.240.1 2.2 2.7

Economic and social contextPopulation (millions)Urban population (% of total)GNI per capita, World Bank Atlas method ($)GDP growth, 1995–2000 and 2000–09 (avg. annual %)Adult literacy rate (% ages 15 and older) Gross primary, secondary, and tertiary enrollment (%) StructureSeparate telecommunications regulatorStatus of main fixed-line telephone operatorLevel of competition (competition, partial comp., monopoly)
International long distance serviceMobile telephone serviceInternet service
Efficiency and capacityTelecommunications revenue (% of GDP)Mobile cellular and fixed-line subscribers per employeeTelecommunications investment (% of revenue) PerformanceAccessTelephone lines (per 100 people)Mobile cellular subscriptions (per 100 people)Fixed broadband Internet subscribers (per 100 people)Personal computers (per 100 people)Households with a television (%)UsageInternational voice traffic, total (minutes per person per month)Mobile telephone usage (minutes per user per month)Internet users (per 100 people)QualityPopulation covered by mobile cellular network (%)Fixed broadband Internet subscribers (% of total subscribers)International Internet bandwidth (bits per second per person)AffordabilityResidential fixed line tariff ($ a month)Mobile cellular prepaid tariff ($ a month)Fixed broadband Internet access tariff ($ a month)TradeICT goods exports (% of total goods exports)ICT goods imports (% of total goods imports)ICT service exports (% of total service exports)ApplicationsE-gov’t Web measure index (0–1, 1=highest presence)Secure Internet servers (per million people)
105The Little Data Book on Information and Communication Technology 2011
East Asia & Pacific Lower middle income
Country data
Lower middle-income group
2000 2009 2009
Indonesia
205 230 3,81142 53 41
580 2,050 2,321-0.6 5.3 8.5
.. 92 8064 74 64
No YesMixed Mixed
P PC CC C
1.4 2.2 3.0259 1,095 60511.4 28.3 22.4
3.2 14.8 12.71.8 69.2 57.80.2 0.8 5.51.0 2.0 4.562 69 ..
.. .. ..
.. 201 3420.9 8.7 17.2
89 90 771.0 57.5 40.1
1 110 151
.. 5.6 4.7
.. 2.8 7.1
.. 20.8 30.4
12.6 5.7 21.33.0 9.7 18.4
.. 8.4 19.9
.. 0.24 0.240.3 2.1 2.7

Economic and social contextPopulation (millions)Urban population (% of total)GNI per capita, World Bank Atlas method ($)GDP growth, 1995–2000 and 2000–09 (avg. annual %)Adult literacy rate (% ages 15 and older) Gross primary, secondary, and tertiary enrollment (%) StructureSeparate telecommunications regulatorStatus of main fixed-line telephone operatorLevel of competition (competition, partial comp., monopoly)
International long distance serviceMobile telephone serviceInternet service
Efficiency and capacityTelecommunications revenue (% of GDP)Mobile cellular and fixed-line subscribers per employeeTelecommunications investment (% of revenue) PerformanceAccessTelephone lines (per 100 people)Mobile cellular subscriptions (per 100 people)Fixed broadband Internet subscribers (per 100 people)Personal computers (per 100 people)Households with a television (%)UsageInternational voice traffic total (minutes per person per month)Mobile telephone usage (minutes per user per month)Internet users (per 100 people)QualityPopulation covered by mobile cellular network (%)Fixed broadband Internet subscribers (% of total subscribers)International Internet bandwidth (bits per second per person)AffordabilityResidential fixed line tariff ($ a month)Mobile cellular prepaid tariff ($ a month)Fixed broadband Internet access tariff ($ a month)TradeICT goods exports (% of total goods exports)ICT goods imports (% of total goods imports)ICT service exports (% of total service exports)ApplicationsE-gov’t Web measure index (0–1, 1=highest presence)Secure Internet servers (per million people)
106 2011 The Little Data Book on Information and Communication Technology
Middle East & North Africa Upper middle income
Country data
Upper middle-income group
2000 2009 2009
Iran, Islamic Rep.
64 73 1,00264 69 75
1,670 4,530 7,5023.7 5.4 4.477 85 9272 77 82
.. YesPublic Mixed
M MM CM C
1.1 1.4 3.3221 913 5766.0 74.5 18.0
14.8 35.4 22.11.5 72.1 100.60.4 .. 19.46.3 10.6 11.2
.. .. 93
.. .. ..
.. .. 1571.0 38.3 34.6
32 95 940.1 .. 41.6
1 151 1,120
.. 0.2 10.0
.. 3.6 8.8
.. 30.5 18.8
0.0 0.1 12.25.5 1.9 15.10.0 .. 5.4
.. 0.27 0.300.0 0.7 32.2

Economic and social contextPopulation (millions)Urban population (% of total)GNI per capita, World Bank Atlas method ($)GDP growth, 1995–2000 and 2000–09 (avg. annual %)Adult literacy rate (% ages 15 and older) Gross primary, secondary, and tertiary enrollment (%) StructureSeparate telecommunications regulatorStatus of main fixed-line telephone operatorLevel of competition (competition, partial comp., monopoly)
International long distance serviceMobile telephone serviceInternet service
Efficiency and capacityTelecommunications revenue (% of GDP)Mobile cellular and fixed-line subscribers per employeeTelecommunications investment (% of revenue) PerformanceAccessTelephone lines (per 100 people)Mobile cellular subscriptions (per 100 people)Fixed broadband Internet subscribers (per 100 people)Personal computers (per 100 people)Households with a television (%)UsageInternational voice traffic, total (minutes per person per month)Mobile telephone usage (minutes per user per month)Internet users (per 100 people)QualityPopulation covered by mobile cellular network (%)Fixed broadband Internet subscribers (% of total subscribers)International Internet bandwidth (bits per second per person)AffordabilityResidential fixed line tariff ($ a month)Mobile cellular prepaid tariff ($ a month)Fixed broadband Internet access tariff ($ a month)TradeICT goods exports (% of total goods exports)ICT goods imports (% of total goods imports)ICT service exports (% of total service exports)ApplicationsE-gov’t Web measure index (0–1, 1=highest presence)Secure Internet servers (per million people)
107The Little Data Book on Information and Communication Technology 2011
Middle East & North Africa Lower middle income
Country data
Lower middle-income group
2000 2009 2009
Iraq
25 31 3,81168 67 41
.. 2,210 2,32117.9 -0.3 8.5
74 78 8054 61 64
.. Yes
.. Public
M M.. P.. P
.. .. 3.0
.. 1,098 605
.. .. 22.4
2.7 3.5 12.70.0 62.6 57.80.1 0.0 5.50.8 .. 4.5
.. 88 ..
.. .. ..
.. 186 3420.0 1.0 17.2
.. 72 770.0 1.8 40.1
.. 3 151
.. .. 4.7
.. .. 7.1
.. .. 30.4
.. .. 21.3
.. .. 18.4
.. 0.6 19.9
.. 0.15 0.24
.. 0.1 2.7

Economic and social contextPopulation (millions)Urban population (% of total)GNI per capita, World Bank Atlas method ($)GDP growth, 1995–2000 and 2000–09 (avg. annual %)Adult literacy rate (% ages 15 and older) Gross primary, secondary, and tertiary enrollment (%) StructureSeparate telecommunications regulatorStatus of main fixed-line telephone operatorLevel of competition (competition, partial comp., monopoly)
International long distance serviceMobile telephone serviceInternet service
Efficiency and capacityTelecommunications revenue (% of GDP)Mobile cellular and fixed-line subscribers per employeeTelecommunications investment (% of revenue) PerformanceAccessTelephone lines (per 100 people)Mobile cellular subscriptions (per 100 people)Fixed broadband Internet subscribers (per 100 people)Personal computers (per 100 people)Households with a television (%)UsageInternational voice traffic total (minutes per person per month)Mobile telephone usage (minutes per user per month)Internet users (per 100 people)QualityPopulation covered by mobile cellular network (%)Fixed broadband Internet subscribers (% of total subscribers)International Internet bandwidth (bits per second per person)AffordabilityResidential fixed line tariff ($ a month)Mobile cellular prepaid tariff ($ a month)Fixed broadband Internet access tariff ($ a month)TradeICT goods exports (% of total goods exports)ICT goods imports (% of total goods imports)ICT service exports (% of total service exports)ApplicationsE-gov’t Web measure index (0–1, 1=highest presence)Secure Internet servers (per million people)
108 2011 The Little Data Book on Information and Communication Technology
High income
Country dataHigh-
income group
2000 2009 2009
Ireland
4 4 1,11759 62 77
23,180 44,280 37,9909.7 3.9 2.0
.. .. 9892 100 91
No YesPrivate Private
C CP CC C
2.7 2.5 3.0246 406 76514.3 7.1 15.5
48.1 46.7 45.164.7 109.5 111.214.5 24.8 24.335.7 58.2 65.4
.. 98 98
.. .. ..
.. 243 34317.8 68.4 72.3
98 99 990.0 88.4 89.2
241 15,261 19,521
.. 43.8 22.8
.. 20.9 14.8
.. 36.4 28.8
34.5 11.5 12.234.0 14.0 13.345.5 37.1 8.1
.. 0.50 0.4690.5 1,004.6 905.1

Economic and social contextPopulation (millions)Urban population (% of total)GNI per capita, World Bank Atlas method ($)GDP growth, 1995–2000 and 2000–09 (avg. annual %)Adult literacy rate (% ages 15 and older) Gross primary, secondary, and tertiary enrollment (%) StructureSeparate telecommunications regulatorStatus of main fixed-line telephone operatorLevel of competition (competition, partial comp., monopoly)
International long distance serviceMobile telephone serviceInternet service
Efficiency and capacityTelecommunications revenue (% of GDP)Mobile cellular and fixed-line subscribers per employeeTelecommunications investment (% of revenue) PerformanceAccessTelephone lines (per 100 people)Mobile cellular subscriptions (per 100 people)Fixed broadband Internet subscribers (per 100 people)Personal computers (per 100 people)Households with a television (%)UsageInternational voice traffic, total (minutes per person per month)Mobile telephone usage (minutes per user per month)Internet users (per 100 people)QualityPopulation covered by mobile cellular network (%)Fixed broadband Internet subscribers (% of total subscribers)International Internet bandwidth (bits per second per person)AffordabilityResidential fixed line tariff ($ a month)Mobile cellular prepaid tariff ($ a month)Fixed broadband Internet access tariff ($ a month)TradeICT goods exports (% of total goods exports)ICT goods imports (% of total goods imports)ICT service exports (% of total service exports)ApplicationsE-gov’t Web measure index (0–1, 1=highest presence)Secure Internet servers (per million people)
109The Little Data Book on Information and Communication Technology 2011
High income
Country dataHigh-
income group
2000 2009 2009
Isle of Man
0.08 0.08 1,11752 51 77
21,980 49,310 37,99010.4 6.2 2.0
.. .. 98
.. .. 91
.. No
.. ..
.. ..
.. ..
.. ..
.. .. 3.0
.. .. 765
.. .. 15.5
.. .. 45.1
.. .. 111.2
.. .. 24.3
.. .. 65.4
.. .. 98
.. .. ..
.. .. 343
.. .. 72.3
.. .. 99
.. .. 89.2
.. .. 19,521
.. .. 22.8
.. .. 14.8
.. .. 28.8
.. .. 12.2
.. .. 13.3
.. .. 8.1
.. .. 0.4677.4 857.6 905.1

Economic and social contextPopulation (millions)Urban population (% of total)GNI per capita, World Bank Atlas method ($)GDP growth, 1995–2000 and 2000–09 (avg. annual %)Adult literacy rate (% ages 15 and older) Gross primary, secondary, and tertiary enrollment (%) StructureSeparate telecommunications regulatorStatus of main fixed-line telephone operatorLevel of competition (competition, partial comp., monopoly)
International long distance serviceMobile telephone serviceInternet service
Efficiency and capacityTelecommunications revenue (% of GDP)Mobile cellular and fixed-line subscribers per employeeTelecommunications investment (% of revenue) PerformanceAccessTelephone lines (per 100 people)Mobile cellular subscriptions (per 100 people)Fixed broadband Internet subscribers (per 100 people)Personal computers (per 100 people)Households with a television (%)UsageInternational voice traffic total (minutes per person per month)Mobile telephone usage (minutes per user per month)Internet users (per 100 people)QualityPopulation covered by mobile cellular network (%)Fixed broadband Internet subscribers (% of total subscribers)International Internet bandwidth (bits per second per person)AffordabilityResidential fixed line tariff ($ a month)Mobile cellular prepaid tariff ($ a month)Fixed broadband Internet access tariff ($ a month)TradeICT goods exports (% of total goods exports)ICT goods imports (% of total goods imports)ICT service exports (% of total service exports)ApplicationsE-gov’t Web measure index (0–1, 1=highest presence)Secure Internet servers (per million people)
110 2011 The Little Data Book on Information and Communication Technology
Country dataHigh-
income group
2000 2009 2009
High income
Israel
6 7 1,11791 92 77
17,840 25,790 37,9904.6 3.6 2.0
.. .. 9888 91 91
.. NoMixed Mixed
C CC CC ..
3.0 4.0 3.0618 692 76516.1 .. 15.5
47.3 43.7 45.170.0 121.2 111.212.8 23.5 24.325.3 24.2 65.4
93 90 98
.. .. ..361 342 34320.2 49.7 72.3
97 100 990.0 98.2 89.253 2,003 19,521
.. 17.0 22.8
.. 13.8 14.8
.. 6.7 28.8
25.2 19.2 12.216.4 11.0 13.328.7 36.1 8.1
.. 0.58 0.4646.7 399.1 905.1

Economic and social contextPopulation (millions)Urban population (% of total)GNI per capita, World Bank Atlas method ($)GDP growth, 1995–2000 and 2000–09 (avg. annual %)Adult literacy rate (% ages 15 and older) Gross primary, secondary, and tertiary enrollment (%) StructureSeparate telecommunications regulatorStatus of main fixed-line telephone operatorLevel of competition (competition, partial comp., monopoly)
International long distance serviceMobile telephone serviceInternet service
Efficiency and capacityTelecommunications revenue (% of GDP)Mobile cellular and fixed-line subscribers per employeeTelecommunications investment (% of revenue) PerformanceAccessTelephone lines (per 100 people)Mobile cellular subscriptions (per 100 people)Fixed broadband Internet subscribers (per 100 people)Personal computers (per 100 people)Households with a television (%)UsageInternational voice traffic, total (minutes per person per month)Mobile telephone usage (minutes per user per month)Internet users (per 100 people)QualityPopulation covered by mobile cellular network (%)Fixed broadband Internet subscribers (% of total subscribers)International Internet bandwidth (bits per second per person)AffordabilityResidential fixed line tariff ($ a month)Mobile cellular prepaid tariff ($ a month)Fixed broadband Internet access tariff ($ a month)TradeICT goods exports (% of total goods exports)ICT goods imports (% of total goods imports)ICT service exports (% of total service exports)ApplicationsE-gov’t Web measure index (0–1, 1=highest presence)Secure Internet servers (per million people)
111The Little Data Book on Information and Communication Technology 2011
High income
Country dataHigh-
income group
2000 2009 2009
Italy
57 60 1,11767 68 77
20,890 35,110 37,9901.8 0.5 2.098 99 9881 92 91
Yes YesMixed Private
C CC CC C
2.2 2.9 3.0915 1,657 76526.7 14.6 15.5
47.7 35.4 45.174.2 150.5 111.210.2 34.3 24.318.1 36.7 65.4
95 94 98
.. .. ..116 135 34323.2 48.5 72.3
100 100 992.0 55.0 89.2
168 12,989 19,521
.. 28.2 22.8
.. 18.4 14.8
.. 28.8 28.8
5.3 3.0 12.29.9 6.7 13.33.0 2.4 8.1
.. 0.29 0.4618.3 154.2 905.1

Economic and social contextPopulation (millions)Urban population (% of total)GNI per capita, World Bank Atlas method ($)GDP growth, 1995–2000 and 2000–09 (avg. annual %)Adult literacy rate (% ages 15 and older) Gross primary, secondary, and tertiary enrollment (%) StructureSeparate telecommunications regulatorStatus of main fixed-line telephone operatorLevel of competition (competition, partial comp., monopoly)
International long distance serviceMobile telephone serviceInternet service
Efficiency and capacityTelecommunications revenue (% of GDP)Mobile cellular and fixed-line subscribers per employeeTelecommunications investment (% of revenue) PerformanceAccessTelephone lines (per 100 people)Mobile cellular subscriptions (per 100 people)Fixed broadband Internet subscribers (per 100 people)Personal computers (per 100 people)Households with a television (%)UsageInternational voice traffic total (minutes per person per month)Mobile telephone usage (minutes per user per month)Internet users (per 100 people)QualityPopulation covered by mobile cellular network (%)Fixed broadband Internet subscribers (% of total subscribers)International Internet bandwidth (bits per second per person)AffordabilityResidential fixed line tariff ($ a month)Mobile cellular prepaid tariff ($ a month)Fixed broadband Internet access tariff ($ a month)TradeICT goods exports (% of total goods exports)ICT goods imports (% of total goods imports)ICT service exports (% of total service exports)ApplicationsE-gov’t Web measure index (0–1, 1=highest presence)Secure Internet servers (per million people)
112 2011 The Little Data Book on Information and Communication Technology
Latin America & Caribbean Upper middle income
Country data
Upper middle-income group
2000 2009 2009
Jamaica
3 3 1,00252 54 75
3,310 4,590 7,502-0.5 1.5 4.4
80 86 9275 80 82
Yes YesPrivate Private
M CC CC C
5.3 1.4 3.3268 678 57632.5 31.2 18.0
19.1 11.2 22.114.2 110.1 100.6
.. 4.2 19.44.6 6.8 11.2
.. .. 93
.. 18.7 ..
.. .. 1573.1 58.6 34.6
80 95 94.. 99.8 41.6
28 741 1,120
.. 9.6 10.0
.. 5.6 8.8
.. 22.2 18.8
0.3 0.8 12.25.7 3.9 15.1
12.3 7.1 5.4
.. 0.23 0.301.9 39.1 32.2

Economic and social contextPopulation (millions)Urban population (% of total)GNI per capita, World Bank Atlas method ($)GDP growth, 1995–2000 and 2000–09 (avg. annual %)Adult literacy rate (% ages 15 and older) Gross primary, secondary, and tertiary enrollment (%) StructureSeparate telecommunications regulatorStatus of main fixed-line telephone operatorLevel of competition (competition, partial comp., monopoly)
International long distance serviceMobile telephone serviceInternet service
Efficiency and capacityTelecommunications revenue (% of GDP)Mobile cellular and fixed-line subscribers per employeeTelecommunications investment (% of revenue) PerformanceAccessTelephone lines (per 100 people)Mobile cellular subscriptions (per 100 people)Fixed broadband Internet subscribers (per 100 people)Personal computers (per 100 people)Households with a television (%)UsageInternational voice traffic, total (minutes per person per month)Mobile telephone usage (minutes per user per month)Internet users (per 100 people)QualityPopulation covered by mobile cellular network (%)Fixed broadband Internet subscribers (% of total subscribers)International Internet bandwidth (bits per second per person)AffordabilityResidential fixed line tariff ($ a month)Mobile cellular prepaid tariff ($ a month)Fixed broadband Internet access tariff ($ a month)TradeICT goods exports (% of total goods exports)ICT goods imports (% of total goods imports)ICT service exports (% of total service exports)ApplicationsE-gov’t Web measure index (0–1, 1=highest presence)Secure Internet servers (per million people)
113The Little Data Book on Information and Communication Technology 2011
Country dataHigh-
income group
2000 2009 2009
High income
Japan
127 128 1,11765 67 77
34,620 38,080 37,9900.6 1.1 2.0
.. .. 9883 87 91
.. NoMixed Private
C CC CC C
2.6 3.1 3.0830 12 76526.8 13.1 15.5
48.8 34.8 45.152.6 90.1 111.214.3 26.5 24.331.5 40.7 65.4
99 99 98
.. .. ..184 137 34330.0 77.7 72.3
99 100 994.7 44.0 89.257 5,770 19,521
.. 22.8 22.8
.. 44.3 14.8
.. 37.4 28.8
25.8 14.7 12.217.6 12.0 13.3
3.5 1.2 8.1
.. 0.67 0.4640.5 650.2 905.1

Economic and social contextPopulation (millions)Urban population (% of total)GNI per capita, World Bank Atlas method ($)GDP growth, 1995–2000 and 2000–09 (avg. annual %)Adult literacy rate (% ages 15 and older) Gross primary, secondary, and tertiary enrollment (%) StructureSeparate telecommunications regulatorStatus of main fixed-line telephone operatorLevel of competition (competition, partial comp., monopoly)
International long distance serviceMobile telephone serviceInternet service
Efficiency and capacityTelecommunications revenue (% of GDP)Mobile cellular and fixed-line subscribers per employeeTelecommunications investment (% of revenue) PerformanceAccessTelephone lines (per 100 people)Mobile cellular subscriptions (per 100 people)Fixed broadband Internet subscribers (per 100 people)Personal computers (per 100 people)Households with a television (%)UsageInternational voice traffic total (minutes per person per month)Mobile telephone usage (minutes per user per month)Internet users (per 100 people)QualityPopulation covered by mobile cellular network (%)Fixed broadband Internet subscribers (% of total subscribers)International Internet bandwidth (bits per second per person)AffordabilityResidential fixed line tariff ($ a month)Mobile cellular prepaid tariff ($ a month)Fixed broadband Internet access tariff ($ a month)TradeICT goods exports (% of total goods exports)ICT goods imports (% of total goods imports)ICT service exports (% of total service exports)ApplicationsE-gov’t Web measure index (0–1, 1=highest presence)Secure Internet servers (per million people)
114 2011 The Little Data Book on Information and Communication Technology
Country data
Lower middle-income group
2000 2009 2009
Middle East & North Africa Lower middle income
Jordan
5 6 3,81178 78 41
1,790 3,980 2,3213.2 6.9 8.5
.. 92 8075 77 64
Yes YesMixed Private
M CP PC C
6.7 6.3 3.0163 1,132 60538.5 11.4 22.4
12.9 8.4 12.78.1 101.1 57.80.7 4.1 5.53.1 7.6 4.596 97 ..
.. 21.5 ..
.. .. 3422.7 29.3 17.2
99 99 770.6 83.2 40.118 1,811 151
.. 9.4 4.7
.. 5.7 7.1
.. 30.4 30.4
3.7 3.1 21.35.9 5.4 18.4
.. 0.0 19.9
.. 0.53 0.240.4 19.7 2.7

Economic and social contextPopulation (millions)Urban population (% of total)GNI per capita, World Bank Atlas method ($)GDP growth, 1995–2000 and 2000–09 (avg. annual %)Adult literacy rate (% ages 15 and older) Gross primary, secondary, and tertiary enrollment (%) StructureSeparate telecommunications regulatorStatus of main fixed-line telephone operatorLevel of competition (competition, partial comp., monopoly)
International long distance serviceMobile telephone serviceInternet service
Efficiency and capacityTelecommunications revenue (% of GDP)Mobile cellular and fixed-line subscribers per employeeTelecommunications investment (% of revenue) PerformanceAccessTelephone lines (per 100 people)Mobile cellular subscriptions (per 100 people)Fixed broadband Internet subscribers (per 100 people)Personal computers (per 100 people)Households with a television (%)UsageInternational voice traffic, total (minutes per person per month)Mobile telephone usage (minutes per user per month)Internet users (per 100 people)QualityPopulation covered by mobile cellular network (%)Fixed broadband Internet subscribers (% of total subscribers)International Internet bandwidth (bits per second per person)AffordabilityResidential fixed line tariff ($ a month)Mobile cellular prepaid tariff ($ a month)Fixed broadband Internet access tariff ($ a month)TradeICT goods exports (% of total goods exports)ICT goods imports (% of total goods imports)ICT service exports (% of total service exports)ApplicationsE-gov’t Web measure index (0–1, 1=highest presence)Secure Internet servers (per million people)
115The Little Data Book on Information and Communication Technology 2011
Europe & Central Asia Upper middle income
Country data
Upper middle-income group
2000 2009 2009
Kazakhstan
15 16 1,00256 58 75
1,260 6,920 7,5021.9 8.8 4.4
100 100 9279 90 82
.. YesMixed Mixed
C CP P.. ..
1.5 2.9 3.366 253 576
26.7 22.5 18.0
12.3 23.7 22.11.3 94.4 100.6
.. 11.3 19.4
.. .. 11.292 .. 93
.. 4.3 ..
.. 92 1570.7 33.4 34.6
94 94 94.. 75.9 41.61 1,342 1,120
.. 1.9 10.0
.. 8.8 8.8
.. 17.2 18.8
0.6 0.1 12.27.1 4.3 15.13.4 3.0 5.4
.. 0.53 0.300.5 5.3 32.2

Economic and social contextPopulation (millions)Urban population (% of total)GNI per capita, World Bank Atlas method ($)GDP growth, 1995–2000 and 2000–09 (avg. annual %)Adult literacy rate (% ages 15 and older) Gross primary, secondary, and tertiary enrollment (%) StructureSeparate telecommunications regulatorStatus of main fixed-line telephone operatorLevel of competition (competition, partial comp., monopoly)
International long distance serviceMobile telephone serviceInternet service
Efficiency and capacityTelecommunications revenue (% of GDP)Mobile cellular and fixed-line subscribers per employeeTelecommunications investment (% of revenue) PerformanceAccessTelephone lines (per 100 people)Mobile cellular subscriptions (per 100 people)Fixed broadband Internet subscribers (per 100 people)Personal computers (per 100 people)Households with a television (%)UsageInternational voice traffic total (minutes per person per month)Mobile telephone usage (minutes per user per month)Internet users (per 100 people)QualityPopulation covered by mobile cellular network (%)Fixed broadband Internet subscribers (% of total subscribers)International Internet bandwidth (bits per second per person)AffordabilityResidential fixed line tariff ($ a month)Mobile cellular prepaid tariff ($ a month)Fixed broadband Internet access tariff ($ a month)TradeICT goods exports (% of total goods exports)ICT goods imports (% of total goods imports)ICT service exports (% of total service exports)ApplicationsE-gov’t Web measure index (0–1, 1=highest presence)Secure Internet servers (per million people)
116 2011 The Little Data Book on Information and Communication Technology
Sub-Saharan Africa Low income
Country dataLow-
income group
2000 2009 2009
Country dataLow-
income group
2000 2009 2009
Sub-Saharan Africa Low income
Kenya
31 40 84620 22 29
420 760 5092.2 4.4 5.474 87 6253 59 56
Yes YesPublic Mixed
M CP CC C
2.4 6.4 2.921 2,354 301
88.5 38.8 ..
0.9 1.7 1.20.4 48.7 26.60.1 0.0 0.10.5 1.4 0.9
.. 19 ..
.. 0.5 ..
.. 59 ..0.3 10.0 2.7
.. 83 530.0 99.0 5.4
0 477 7
.. 10.1 8.8
.. 7.5 8.0
.. 39.8 89.9
0.1 1.3 0.65.3 6.2 5.92.2 14.5 6.5
.. 0.24 0.090.0 2.6 0.6

Economic and social contextPopulation (millions)Urban population (% of total)GNI per capita, World Bank Atlas method ($)GDP growth, 1995–2000 and 2000–09 (avg. annual %)Adult literacy rate (% ages 15 and older) Gross primary, secondary, and tertiary enrollment (%) StructureSeparate telecommunications regulatorStatus of main fixed-line telephone operatorLevel of competition (competition, partial comp., monopoly)
International long distance serviceMobile telephone serviceInternet service
Efficiency and capacityTelecommunications revenue (% of GDP)Mobile cellular and fixed-line subscribers per employeeTelecommunications investment (% of revenue) PerformanceAccessTelephone lines (per 100 people)Mobile cellular subscriptions (per 100 people)Fixed broadband Internet subscribers (per 100 people)Personal computers (per 100 people)Households with a television (%)UsageInternational voice traffic, total (minutes per person per month)Mobile telephone usage (minutes per user per month)Internet users (per 100 people)QualityPopulation covered by mobile cellular network (%)Fixed broadband Internet subscribers (% of total subscribers)International Internet bandwidth (bits per second per person)AffordabilityResidential fixed line tariff ($ a month)Mobile cellular prepaid tariff ($ a month)Fixed broadband Internet access tariff ($ a month)TradeICT goods exports (% of total goods exports)ICT goods imports (% of total goods imports)ICT service exports (% of total service exports)ApplicationsE-gov’t Web measure index (0–1, 1=highest presence)Secure Internet servers (per million people)
117The Little Data Book on Information and Communication Technology 2011
East Asia & Pacific Lower middle income
Country data
Lower middle-income group
2000 2009 2009
Kiribati
0.08 0.10 3,81143 44 41
1,380 1,830 2,3216.2 1.3 8.5
.. .. 8081 76 64
.. YesMixed Public
M M.. P.. C
6.3 .. 3.028 .. 605
.. .. 22.4
4.0 4.1 12.70.4 1.0 57.80.6 .. 5.51.0 1.1 4.5
.. 11 ..
.. .. ..
.. .. 3421.8 2.0 17.2
.. .. 770.0 .. 40.1
2 .. 151
.. .. 4.7
.. .. 7.1
.. .. 30.4
.. .. 21.3
.. 9.0 18.4
.. .. 19.9
.. 0.03 0.24
.. 10.0 2.7

Economic and social contextPopulation (millions)Urban population (% of total)GNI per capita, World Bank Atlas method ($)GDP growth, 1995–2000 and 2000–09 (avg. annual %)Adult literacy rate (% ages 15 and older) Gross primary, secondary, and tertiary enrollment (%) StructureSeparate telecommunications regulatorStatus of main fixed-line telephone operatorLevel of competition (competition, partial comp., monopoly)
International long distance serviceMobile telephone serviceInternet service
Efficiency and capacityTelecommunications revenue (% of GDP)Mobile cellular and fixed-line subscribers per employeeTelecommunications investment (% of revenue) PerformanceAccessTelephone lines (per 100 people)Mobile cellular subscriptions (per 100 people)Fixed broadband Internet subscribers (per 100 people)Personal computers (per 100 people)Households with a television (%)UsageInternational voice traffic total (minutes per person per month)Mobile telephone usage (minutes per user per month)Internet users (per 100 people)QualityPopulation covered by mobile cellular network (%)Fixed broadband Internet subscribers (% of total subscribers)International Internet bandwidth (bits per second per person)AffordabilityResidential fixed line tariff ($ a month)Mobile cellular prepaid tariff ($ a month)Fixed broadband Internet access tariff ($ a month)TradeICT goods exports (% of total goods exports)ICT goods imports (% of total goods imports)ICT service exports (% of total service exports)ApplicationsE-gov’t Web measure index (0–1, 1=highest presence)Secure Internet servers (per million people)
118 2011 The Little Data Book on Information and Communication Technology
Country dataLow-
income group
2000 2009 2009
East Asia & Pacific Low income
Korea, Dem. Rep.
23 24 84660 63 29
.. .. 509
.. .. 5.4
.. 100 62
.. .. 56
.. NoPublic Public
M M.. .... ..
.. .. 2.9
.. .. 301
.. .. ..
2.2 4.9 1.20.0 0.3 26.60.0 0.0 0.1
.. .. 0.9
.. .. ..
.. .. ..
.. 200 ..0.0 0.0 2.7
0 0 53.. .. 5.40 0 7
.. .. 8.8
.. .. 8.0
.. .. 89.9
.. .. 0.6
.. .. 5.9
.. .. 6.5
.. 0.02 0.09
.. 0.0 0.6

Economic and social contextPopulation (millions)Urban population (% of total)GNI per capita, World Bank Atlas method ($)GDP growth, 1995–2000 and 2000–09 (avg. annual %)Adult literacy rate (% ages 15 and older) Gross primary, secondary, and tertiary enrollment (%) StructureSeparate telecommunications regulatorStatus of main fixed-line telephone operatorLevel of competition (competition, partial comp., monopoly)
International long distance serviceMobile telephone serviceInternet service
Efficiency and capacityTelecommunications revenue (% of GDP)Mobile cellular and fixed-line subscribers per employeeTelecommunications investment (% of revenue) PerformanceAccessTelephone lines (per 100 people)Mobile cellular subscriptions (per 100 people)Fixed broadband Internet subscribers (per 100 people)Personal computers (per 100 people)Households with a television (%)UsageInternational voice traffic, total (minutes per person per month)Mobile telephone usage (minutes per user per month)Internet users (per 100 people)QualityPopulation covered by mobile cellular network (%)Fixed broadband Internet subscribers (% of total subscribers)International Internet bandwidth (bits per second per person)AffordabilityResidential fixed line tariff ($ a month)Mobile cellular prepaid tariff ($ a month)Fixed broadband Internet access tariff ($ a month)TradeICT goods exports (% of total goods exports)ICT goods imports (% of total goods imports)ICT service exports (% of total service exports)ApplicationsE-gov’t Web measure index (0–1, 1=highest presence)Secure Internet servers (per million people)
119The Little Data Book on Information and Communication Technology 2011
Country dataHigh-
income group
2000 2009 2009
High income
Korea, Rep.
47 49 1,11780 82 77
9,910 19,830 37,9903.5 4.2 2.0
.. .. 9892 99 91
Yes YesMixed Private
C CC CC C
3.9 4.7 3.0758 657 76537.4 14.3 15.5
55.0 39.6 45.157.0 98.4 111.210.9 33.5 24.339.6 57.6 65.4
.. .. 98
.. 5.3 ..149 299 34340.5 80.9 72.3
99 94 9975.5 100.0 89.2
48 6,065 19,521
.. 5.2 22.8
.. 12.2 14.8
.. 25.3 28.8
35.7 22.6 12.224.4 14.6 13.3
1.3 1.5 8.1
.. 1.00 0.467.3 1,140.4 905.1
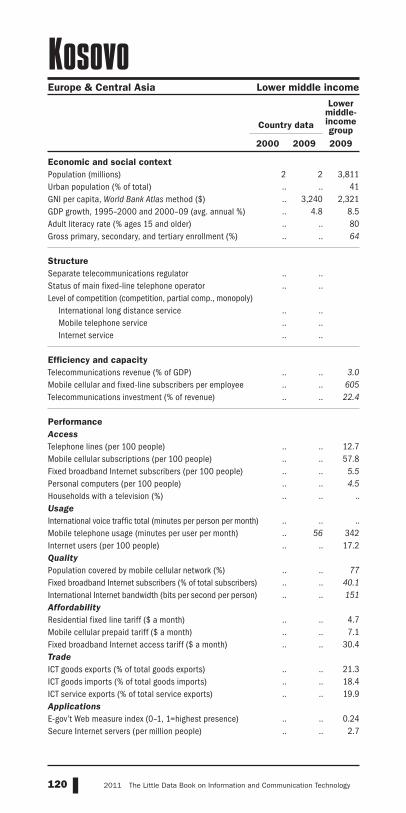
Economic and social contextPopulation (millions)Urban population (% of total)GNI per capita, World Bank Atlas method ($)GDP growth, 1995–2000 and 2000–09 (avg. annual %)Adult literacy rate (% ages 15 and older) Gross primary, secondary, and tertiary enrollment (%) StructureSeparate telecommunications regulatorStatus of main fixed-line telephone operatorLevel of competition (competition, partial comp., monopoly)
International long distance serviceMobile telephone serviceInternet service
Efficiency and capacityTelecommunications revenue (% of GDP)Mobile cellular and fixed-line subscribers per employeeTelecommunications investment (% of revenue) PerformanceAccessTelephone lines (per 100 people)Mobile cellular subscriptions (per 100 people)Fixed broadband Internet subscribers (per 100 people)Personal computers (per 100 people)Households with a television (%)UsageInternational voice traffic total (minutes per person per month)Mobile telephone usage (minutes per user per month)Internet users (per 100 people)QualityPopulation covered by mobile cellular network (%)Fixed broadband Internet subscribers (% of total subscribers)International Internet bandwidth (bits per second per person)AffordabilityResidential fixed line tariff ($ a month)Mobile cellular prepaid tariff ($ a month)Fixed broadband Internet access tariff ($ a month)TradeICT goods exports (% of total goods exports)ICT goods imports (% of total goods imports)ICT service exports (% of total service exports)ApplicationsE-gov’t Web measure index (0–1, 1=highest presence)Secure Internet servers (per million people)
120 2011 The Little Data Book on Information and Communication Technology
Country data
Lower middle-income group
2000 2009 2009
Europe & Central Asia Lower middle income
Kosovo
2 2 3,811.. .. 41.. 3,240 2,321.. 4.8 8.5.. .. 80.. .. 64
.. ..
.. ..
.. ..
.. ..
.. ..
.. .. 3.0
.. .. 605
.. .. 22.4
.. .. 12.7
.. .. 57.8
.. .. 5.5
.. .. 4.5
.. .. ..
.. .. ..
.. 56 342
.. .. 17.2
.. .. 77
.. .. 40.1
.. .. 151
.. .. 4.7
.. .. 7.1
.. .. 30.4
.. .. 21.3
.. .. 18.4
.. .. 19.9
.. .. 0.24
.. .. 2.7

Economic and social contextPopulation (millions)Urban population (% of total)GNI per capita, World Bank Atlas method ($)GDP growth, 1995–2000 and 2000–09 (avg. annual %)Adult literacy rate (% ages 15 and older) Gross primary, secondary, and tertiary enrollment (%) StructureSeparate telecommunications regulatorStatus of main fixed-line telephone operatorLevel of competition (competition, partial comp., monopoly)
International long distance serviceMobile telephone serviceInternet service
Efficiency and capacityTelecommunications revenue (% of GDP)Mobile cellular and fixed-line subscribers per employeeTelecommunications investment (% of revenue) PerformanceAccessTelephone lines (per 100 people)Mobile cellular subscriptions (per 100 people)Fixed broadband Internet subscribers (per 100 people)Personal computers (per 100 people)Households with a television (%)UsageInternational voice traffic, total (minutes per person per month)Mobile telephone usage (minutes per user per month)Internet users (per 100 people)QualityPopulation covered by mobile cellular network (%)Fixed broadband Internet subscribers (% of total subscribers)International Internet bandwidth (bits per second per person)AffordabilityResidential fixed line tariff ($ a month)Mobile cellular prepaid tariff ($ a month)Fixed broadband Internet access tariff ($ a month)TradeICT goods exports (% of total goods exports)ICT goods imports (% of total goods imports)ICT service exports (% of total service exports)ApplicationsE-gov’t Web measure index (0–1, 1=highest presence)Secure Internet servers (per million people)
121The Little Data Book on Information and Communication Technology 2011
Kuwait High income
Country dataHigh-
income group
2000 2009 2009
2 3 1,11798 98 77
16,790 43,930 37,9901.8 8.4 2.0
.. 94 9878 74 91
.. NoPublic Public
C MP MP P
1.7 3.5 3.0123 372 76519.7 27.0 15.5
21.3 19.8 45.121.7 106.6 111.2
.. 11.2 24.311.4 23.7 65.4100 .. 98
.. .. ..
.. .. 3436.8 39.4 72.3
100 100 99.. 8.8 89.2
26 871 19,521
.. 8.6 22.8
.. 7.8 14.8
.. 19.2 28.8
.. 0.4 12.2
.. 7.2 13.30.0 60.9 8.1
.. 0.46 0.461.8 132.7 905.1

Economic and social contextPopulation (millions)Urban population (% of total)GNI per capita, World Bank Atlas method ($)GDP growth, 1995–2000 and 2000–09 (avg. annual %)Adult literacy rate (% ages 15 and older) Gross primary, secondary, and tertiary enrollment (%) StructureSeparate telecommunications regulatorStatus of main fixed-line telephone operatorLevel of competition (competition, partial comp., monopoly)
International long distance serviceMobile telephone serviceInternet service
Efficiency and capacityTelecommunications revenue (% of GDP)Mobile cellular and fixed-line subscribers per employeeTelecommunications investment (% of revenue) PerformanceAccessTelephone lines (per 100 people)Mobile cellular subscriptions (per 100 people)Fixed broadband Internet subscribers (per 100 people)Personal computers (per 100 people)Households with a television (%)UsageInternational voice traffic total (minutes per person per month)Mobile telephone usage (minutes per user per month)Internet users (per 100 people)QualityPopulation covered by mobile cellular network (%)Fixed broadband Internet subscribers (% of total subscribers)International Internet bandwidth (bits per second per person)AffordabilityResidential fixed line tariff ($ a month)Mobile cellular prepaid tariff ($ a month)Fixed broadband Internet access tariff ($ a month)TradeICT goods exports (% of total goods exports)ICT goods imports (% of total goods imports)ICT service exports (% of total service exports)ApplicationsE-gov’t Web measure index (0–1, 1=highest presence)Secure Internet servers (per million people)
122 2011 The Little Data Book on Information and Communication Technology
Country dataLow-
income group
2000 2009 2009
Europe & Central Asia Low income
Kyrgyz Republic
5 5 84635 36 29
280 870 5095.4 4.6 5.499 99 6276 77 56
Yes YesPublic Mixed
M CP CP C
2.0 4.8 2.953 311 3018.0 3.2 ..
7.7 9.4 1.20.2 84.3 26.60.1 0.9 0.10.5 1.9 0.9
.. 99 ..
.. .. ..
.. .. ..1.0 41.2 2.7
.. 24 530.8 11.1 5.4
2 112 7
.. 1.3 8.8
.. 2.9 8.0
.. 48.1 89.9
0.8 0.3 0.64.6 2.6 5.9
15.7 1.2 6.5
.. 0.32 0.090.4 1.1 0.6

Economic and social contextPopulation (millions)Urban population (% of total)GNI per capita, World Bank Atlas method ($)GDP growth, 1995–2000 and 2000–09 (avg. annual %)Adult literacy rate (% ages 15 and older) Gross primary, secondary, and tertiary enrollment (%) StructureSeparate telecommunications regulatorStatus of main fixed-line telephone operatorLevel of competition (competition, partial comp., monopoly)
International long distance serviceMobile telephone serviceInternet service
Efficiency and capacityTelecommunications revenue (% of GDP)Mobile cellular and fixed-line subscribers per employeeTelecommunications investment (% of revenue) PerformanceAccessTelephone lines (per 100 people)Mobile cellular subscriptions (per 100 people)Fixed broadband Internet subscribers (per 100 people)Personal computers (per 100 people)Households with a television (%)UsageInternational voice traffic, total (minutes per person per month)Mobile telephone usage (minutes per user per month)Internet users (per 100 people)QualityPopulation covered by mobile cellular network (%)Fixed broadband Internet subscribers (% of total subscribers)International Internet bandwidth (bits per second per person)AffordabilityResidential fixed line tariff ($ a month)Mobile cellular prepaid tariff ($ a month)Fixed broadband Internet access tariff ($ a month)TradeICT goods exports (% of total goods exports)ICT goods imports (% of total goods imports)ICT service exports (% of total service exports)ApplicationsE-gov’t Web measure index (0–1, 1=highest presence)Secure Internet servers (per million people)
123The Little Data Book on Information and Communication Technology 2011
East Asia & Pacific Low income
Country dataLow-
income group
2000 2009 2009
Lao PDR
5 6 84622 32 29
280 880 5096.1 6.9 5.470 73 6255 59 56
.. YesPublic Mixed
M PM P.. P
1.5 1.8 2.947 748 301
31.3 63.0 ..
0.8 2.1 1.20.2 51.2 26.60.0 0.1 0.10.3 1.7 0.9
.. .. ..
.. .. ..
.. .. ..0.1 4.7 2.7
.. 55 530.0 116.2 5.4
0 142 7
.. 3.8 8.8
.. 3.5 8.0
.. 194.3 89.9
.. .. 0.6
.. .. 5.98.3 8.5 6.5
.. 0.08 0.09
.. 0.8 0.6

Economic and social contextPopulation (millions)Urban population (% of total)GNI per capita, World Bank Atlas method ($)GDP growth, 1995–2000 and 2000–09 (avg. annual %)Adult literacy rate (% ages 15 and older) Gross primary, secondary, and tertiary enrollment (%) StructureSeparate telecommunications regulatorStatus of main fixed-line telephone operatorLevel of competition (competition, partial comp., monopoly)
International long distance serviceMobile telephone serviceInternet service
Efficiency and capacityTelecommunications revenue (% of GDP)Mobile cellular and fixed-line subscribers per employeeTelecommunications investment (% of revenue) PerformanceAccessTelephone lines (per 100 people)Mobile cellular subscriptions (per 100 people)Fixed broadband Internet subscribers (per 100 people)Personal computers (per 100 people)Households with a television (%)UsageInternational voice traffic total (minutes per person per month)Mobile telephone usage (minutes per user per month)Internet users (per 100 people)QualityPopulation covered by mobile cellular network (%)Fixed broadband Internet subscribers (% of total subscribers)International Internet bandwidth (bits per second per person)AffordabilityResidential fixed line tariff ($ a month)Mobile cellular prepaid tariff ($ a month)Fixed broadband Internet access tariff ($ a month)TradeICT goods exports (% of total goods exports)ICT goods imports (% of total goods imports)ICT service exports (% of total service exports)ApplicationsE-gov’t Web measure index (0–1, 1=highest presence)Secure Internet servers (per million people)
124 2011 The Little Data Book on Information and Communication Technology
Country dataHigh
income group
2000 2009 2009
High income
Latvia
2 2 1,11768 68 77
3,220 12,390 37,9905.7 6.2 2.0
100 100 9884 93 91
No YesMixed Mixed
M CC PC C
4.4 4.0 3.0263 697 76520.9 .. 15.5
31.0 28.6 45.116.9 99.5 111.2
1.4 6.4 24.314.3 32.7 65.4
.. 99 98
.. .. ..
.. 176 3436.3 66.7 72.3
89 99 990.8 100.1 89.265 3,537 19,521
.. 11.2 22.8
.. 7.3 14.8
.. 24.9 28.8
1.7 6.1 12.27.7 6.2 13.33.5 5.9 8.1
.. 0.42 0.4618.2 173.0 905.1

Economic and social contextPopulation (millions)Urban population (% of total)GNI per capita, World Bank Atlas method ($)GDP growth, 1995–2000 and 2000–09 (avg. annual %)Adult literacy rate (% ages 15 and older) Gross primary, secondary, and tertiary enrollment (%) StructureSeparate telecommunications regulatorStatus of main fixed-line telephone operatorLevel of competition (competition, partial comp., monopoly)
International long distance serviceMobile telephone serviceInternet service
Efficiency and capacityTelecommunications revenue (% of GDP)Mobile cellular and fixed-line subscribers per employeeTelecommunications investment (% of revenue) PerformanceAccessTelephone lines (per 100 people)Mobile cellular subscriptions (per 100 people)Fixed broadband Internet subscribers (per 100 people)Personal computers (per 100 people)Households with a television (%)UsageInternational voice traffic, total (minutes per person per month)Mobile telephone usage (minutes per user per month)Internet users (per 100 people)QualityPopulation covered by mobile cellular network (%)Fixed broadband Internet subscribers (% of total subscribers)International Internet bandwidth (bits per second per person)AffordabilityResidential fixed line tariff ($ a month)Mobile cellular prepaid tariff ($ a month)Fixed broadband Internet access tariff ($ a month)TradeICT goods exports (% of total goods exports)ICT goods imports (% of total goods imports)ICT service exports (% of total service exports)ApplicationsE-gov’t Web measure index (0–1, 1=highest presence)Secure Internet servers (per million people)
125The Little Data Book on Information and Communication Technology 2011
Country data
Upper middle-income group
2000 2009 2009
Middle East & North Africa Upper middle income
Lebanon
4 4 1,00286 87 75
4,690 8,060 7,5021.2 4.6 4.4
.. 90 92
.. 80 82
.. YesPublic Public
M M.. MC C
3.4 7.9 3.3210 .. 576
.. .. 18.0
15.3 17.8 22.119.7 36.1 100.6
2.2 7.5 19.44.6 10.2 11.2
.. 98 93
.. 15.9 ..
.. .. 1578.0 23.7 34.6
.. 100 940.0 67.0 41.610 223 1,120
.. 10.3 10.0
.. 15.8 8.8
.. 22.7 18.8
1.6 3.0 12.24.5 3.5 15.11.4 2.9 5.4
.. 0.27 0.305.0 28.4 32.2

Economic and social contextPopulation (millions)Urban population (% of total)GNI per capita, World Bank Atlas method ($)GDP growth, 1995–2000 and 2000–09 (avg. annual %)Adult literacy rate (% ages 15 and older) Gross primary, secondary, and tertiary enrollment (%) StructureSeparate telecommunications regulatorStatus of main fixed-line telephone operatorLevel of competition (competition, partial comp., monopoly)
International long distance serviceMobile telephone serviceInternet service
Efficiency and capacityTelecommunications revenue (% of GDP)Mobile cellular and fixed-line subscribers per employeeTelecommunications investment (% of revenue) PerformanceAccessTelephone lines (per 100 people)Mobile cellular subscriptions (per 100 people)Fixed broadband Internet subscribers (per 100 people)Personal computers (per 100 people)Households with a television (%)UsageInternational voice traffic total (minutes per person per month)Mobile telephone usage (minutes per user per month)Internet users (per 100 people)QualityPopulation covered by mobile cellular network (%)Fixed broadband Internet subscribers (% of total subscribers)International Internet bandwidth (bits per second per person)AffordabilityResidential fixed line tariff ($ a month)Mobile cellular prepaid tariff ($ a month)Fixed broadband Internet access tariff ($ a month)TradeICT goods exports (% of total goods exports)ICT goods imports (% of total goods imports)ICT service exports (% of total service exports)ApplicationsE-gov’t Web measure index (0–1, 1=highest presence)Secure Internet servers (per million people)
126 2011 The Little Data Book on Information and Communication Technology
Sub-Saharan Africa Lower middle income
Country data
Lower middle-income group
2000 2009 2009
Lesotho
2 2 3,81120 26 41
550 980 2,3213.7 3.1 8.586 90 8061 59 64
Yes YesPublic Mixed
M CM C.. C
1.5 0.6 3.0126 1,111 6059.8 20.9 22.4
1.2 1.9 12.71.1 32.0 57.80.1 0.1 5.50.1 0.3 4.512 13 ..
.. .. ..
.. 38 3420.2 3.7 17.2
21 55 770.0 1.8 40.1
0 5 151
.. 12.8 4.7
.. 12.9 7.1
.. 50.0 30.4
.. .. 21.3
.. .. 18.4
.. 8.0 19.9
.. 0.26 0.24
.. 0.5 2.7

Economic and social contextPopulation (millions)Urban population (% of total)GNI per capita, World Bank Atlas method ($)GDP growth, 1995–2000 and 2000–09 (avg. annual %)Adult literacy rate (% ages 15 and older) Gross primary, secondary, and tertiary enrollment (%) StructureSeparate telecommunications regulatorStatus of main fixed-line telephone operatorLevel of competition (competition, partial comp., monopoly)
International long distance serviceMobile telephone serviceInternet service
Efficiency and capacityTelecommunications revenue (% of GDP)Mobile cellular and fixed-line subscribers per employeeTelecommunications investment (% of revenue) PerformanceAccessTelephone lines (per 100 people)Mobile cellular subscriptions (per 100 people)Fixed broadband Internet subscribers (per 100 people)Personal computers (per 100 people)Households with a television (%)UsageInternational voice traffic, total (minutes per person per month)Mobile telephone usage (minutes per user per month)Internet users (per 100 people)QualityPopulation covered by mobile cellular network (%)Fixed broadband Internet subscribers (% of total subscribers)International Internet bandwidth (bits per second per person)AffordabilityResidential fixed line tariff ($ a month)Mobile cellular prepaid tariff ($ a month)Fixed broadband Internet access tariff ($ a month)TradeICT goods exports (% of total goods exports)ICT goods imports (% of total goods imports)ICT service exports (% of total service exports)ApplicationsE-gov’t Web measure index (0–1, 1=highest presence)Secure Internet servers (per million people)
127The Little Data Book on Information and Communication Technology 2011
Sub-Saharan Africa Low income
Country dataLow-
income group
2000 2009 2009
Liberia
3 4 84654 61 29
140 160 50938.9 0.0 5.4
.. 59 6265 .. 56
.. YesPublic Public
M .... P.. C
.. 8.2 2.9
.. .. 301
.. .. ..
0.2 0.1 1.20.1 21.3 26.6
.. 0.4 0.1
.. .. 0.9
.. 9 ..
.. .. ..
.. 29 ..0.0 0.5 2.7
.. 16 53
.. .. 5.40 .. 7
.. .. 8.8
.. .. 8.0
.. .. 89.9
.. .. 0.6
.. .. 5.9
.. .. 6.5
.. 0.06 0.09
.. 0.7 0.6

Economic and social contextPopulation (millions)Urban population (% of total)GNI per capita, World Bank Atlas method ($)GDP growth, 1995–2000 and 2000–09 (avg. annual %)Adult literacy rate (% ages 15 and older) Gross primary, secondary, and tertiary enrollment (%) StructureSeparate telecommunications regulatorStatus of main fixed-line telephone operatorLevel of competition (competition, partial comp., monopoly)
International long distance serviceMobile telephone serviceInternet service
Efficiency and capacityTelecommunications revenue (% of GDP)Mobile cellular and fixed-line subscribers per employeeTelecommunications investment (% of revenue) PerformanceAccessTelephone lines (per 100 people)Mobile cellular subscriptions (per 100 people)Fixed broadband Internet subscribers (per 100 people)Personal computers (per 100 people)Households with a television (%)UsageInternational voice traffic total (minutes per person per month)Mobile telephone usage (minutes per user per month)Internet users (per 100 people)QualityPopulation covered by mobile cellular network (%)Fixed broadband Internet subscribers (% of total subscribers)International Internet bandwidth (bits per second per person)AffordabilityResidential fixed line tariff ($ a month)Mobile cellular prepaid tariff ($ a month)Fixed broadband Internet access tariff ($ a month)TradeICT goods exports (% of total goods exports)ICT goods imports (% of total goods imports)ICT service exports (% of total service exports)ApplicationsE-gov’t Web measure index (0–1, 1=highest presence)Secure Internet servers (per million people)
128 2011 The Little Data Book on Information and Communication Technology
Country data
Upper middle-income group
2000 2009 2009
Middle East & North Africa Upper middle income
Libya
5 6 1,00276 78 75
4,610 12,020 7,502.. 5.4 4.4.. 89 92
96 96 82
.. NoPublic Public
M MM M.. ..
.. .. 3.346 1,717 576
.. .. 18.0
11.3 17.1 22.10.7 77.9 100.6
.. 1.4 19.42.4 2.2 11.2
.. .. 93
.. .. ..
.. .. 1570.2 5.5 34.6
.. 71 94
.. 11.7 41.60 50 1,120
.. .. 10.0
.. .. 8.8
.. .. 18.8
.. .. 12.2
.. .. 15.12.3 2.6 5.4
.. 0.14 0.30
.. 1.4 32.2

Economic and social contextPopulation (millions)Urban population (% of total)GNI per capita, World Bank Atlas method ($)GDP growth, 1995–2000 and 2000–09 (avg. annual %)Adult literacy rate (% ages 15 and older) Gross primary, secondary, and tertiary enrollment (%) StructureSeparate telecommunications regulatorStatus of main fixed-line telephone operatorLevel of competition (competition, partial comp., monopoly)
International long distance serviceMobile telephone serviceInternet service
Efficiency and capacityTelecommunications revenue (% of GDP)Mobile cellular and fixed-line subscribers per employeeTelecommunications investment (% of revenue) PerformanceAccessTelephone lines (per 100 people)Mobile cellular subscriptions (per 100 people)Fixed broadband Internet subscribers (per 100 people)Personal computers (per 100 people)Households with a television (%)UsageInternational voice traffic, total (minutes per person per month)Mobile telephone usage (minutes per user per month)Internet users (per 100 people)QualityPopulation covered by mobile cellular network (%)Fixed broadband Internet subscribers (% of total subscribers)International Internet bandwidth (bits per second per person)AffordabilityResidential fixed line tariff ($ a month)Mobile cellular prepaid tariff ($ a month)Fixed broadband Internet access tariff ($ a month)TradeICT goods exports (% of total goods exports)ICT goods imports (% of total goods imports)ICT service exports (% of total service exports)ApplicationsE-gov’t Web measure index (0–1, 1=highest presence)Secure Internet servers (per million people)
129The Little Data Book on Information and Communication Technology 2011
Country dataHigh-
income group
2000 2009 2009
High income
Liechtenstein
0.03 0.04 1,11715 14 77
79,640 136,630 37,9907.5 2.5 2.0
.. .. 98
.. 86 91
Yes Yes.. Public
M P.. P.. C
1.1 1.4 3.0301 369 765
.. .. 15.5
61.1 54.6 45.130.4 97.5 111.224.3 47.3 24.3
.. .. 65.4
.. .. 98
.. .. ..
.. .. 34336.5 64.0 72.3
90 95 9910.3 83.8 89.2
.. 4,210 19,521
.. .. 22.8
.. .. 14.8
.. .. 28.8
.. .. 12.2
.. .. 13.3
.. .. 8.1
.. 0.52 0.46541.4 5,747.4 905.1

Economic and social contextPopulation (millions)Urban population (% of total)GNI per capita, World Bank Atlas method ($)GDP growth, 1995–2000 and 2000–09 (avg. annual %)Adult literacy rate (% ages 15 and older) Gross primary, secondary, and tertiary enrollment (%) StructureSeparate telecommunications regulatorStatus of main fixed-line telephone operatorLevel of competition (competition, partial comp., monopoly)
International long distance serviceMobile telephone serviceInternet service
Efficiency and capacityTelecommunications revenue (% of GDP)Mobile cellular and fixed-line subscribers per employeeTelecommunications investment (% of revenue) PerformanceAccessTelephone lines (per 100 people)Mobile cellular subscriptions (per 100 people)Fixed broadband Internet subscribers (per 100 people)Personal computers (per 100 people)Households with a television (%)UsageInternational voice traffic total (minutes per person per month)Mobile telephone usage (minutes per user per month)Internet users (per 100 people)QualityPopulation covered by mobile cellular network (%)Fixed broadband Internet subscribers (% of total subscribers)International Internet bandwidth (bits per second per person)AffordabilityResidential fixed line tariff ($ a month)Mobile cellular prepaid tariff ($ a month)Fixed broadband Internet access tariff ($ a month)TradeICT goods exports (% of total goods exports)ICT goods imports (% of total goods imports)ICT service exports (% of total service exports)ApplicationsE-gov’t Web measure index (0–1, 1=highest presence)Secure Internet servers (per million people)
130 2011 The Little Data Book on Information and Communication Technology
Europe & Central Asia Upper middle income
Country data
Upper middle-income group
2000 2009 2009
Lithuania
3 3 1,00267 67 75
3,200 11,410 7,5024.6 6.3 4.4
100 100 9287 92 82
No YesMixed Private
M CC CC C
2.3 2.8 3.3283 402 57649.8 14.5 18.0
33.9 22.4 22.115.0 148.6 100.6
1.5 19.0 19.46.9 24.2 11.2
.. 98 93
.. 11.0 ..
.. 145 1576.4 58.8 34.6
100 100 940.0 99.7 41.614 14,300 1,120
.. 14.3 10.0
.. 8.6 8.8
.. 15.2 18.8
5.2 2.9 12.25.6 4.3 15.14.8 3.8 5.4
.. 0.48 0.3012.4 176.0 32.2

Economic and social contextPopulation (millions)Urban population (% of total)GNI per capita, World Bank Atlas method ($)GDP growth, 1995–2000 and 2000–09 (avg. annual %)Adult literacy rate (% ages 15 and older) Gross primary, secondary, and tertiary enrollment (%) StructureSeparate telecommunications regulatorStatus of main fixed-line telephone operatorLevel of competition (competition, partial comp., monopoly)
International long distance serviceMobile telephone serviceInternet service
Efficiency and capacityTelecommunications revenue (% of GDP)Mobile cellular and fixed-line subscribers per employeeTelecommunications investment (% of revenue) PerformanceAccessTelephone lines (per 100 people)Mobile cellular subscriptions (per 100 people)Fixed broadband Internet subscribers (per 100 people)Personal computers (per 100 people)Households with a television (%)UsageInternational voice traffic, total (minutes per person per month)Mobile telephone usage (minutes per user per month)Internet users (per 100 people)QualityPopulation covered by mobile cellular network (%)Fixed broadband Internet subscribers (% of total subscribers)International Internet bandwidth (bits per second per person)AffordabilityResidential fixed line tariff ($ a month)Mobile cellular prepaid tariff ($ a month)Fixed broadband Internet access tariff ($ a month)TradeICT goods exports (% of total goods exports)ICT goods imports (% of total goods imports)ICT service exports (% of total service exports)ApplicationsE-gov’t Web measure index (0–1, 1=highest presence)Secure Internet servers (per million people)
131The Little Data Book on Information and Communication Technology 2011
Country dataHigh-
income group
2000 2009 2009
High income
Luxembourg
0.44 0.50 1,11784 82 77
43,660 76,710 37,9906.3 3.6 2.0
.. .. 9875 75 91
Yes YesPublic Private
C CP CC C
1.4 1.3 3.0622 691 76520.3 23.9 15.5
57.0 55.0 45.169.5 144.4 111.2
5.6 31.9 24.345.8 67.3 65.4
93 100 98
114.0 140.7 .... .. 343
22.9 85.3 72.3
98 100 990.0 91.7 89.2
690 7,1625,91 19,521
.. 29.7 22.8
.. 12.6 14.8
.. 42.0 28.8
14.1 4.8 12.212.1 5.7 13.3
4.2 7.2 8.1
.. 0.38 0.46120.0 1,413.2 905.1

Economic and social contextPopulation (millions)Urban population (% of total)GNI per capita, World Bank Atlas method ($)GDP growth, 1995–2000 and 2000–09 (avg. annual %)Adult literacy rate (% ages 15 and older) Gross primary, secondary, and tertiary enrollment (%) StructureSeparate telecommunications regulatorStatus of main fixed-line telephone operatorLevel of competition (competition, partial comp., monopoly)
International long distance serviceMobile telephone serviceInternet service
Efficiency and capacityTelecommunications revenue (% of GDP)Mobile cellular and fixed-line subscribers per employeeTelecommunications investment (% of revenue) PerformanceAccessTelephone lines (per 100 people)Mobile cellular subscriptions (per 100 people)Fixed broadband Internet subscribers (per 100 people)Personal computers (per 100 people)Households with a television (%)UsageInternational voice traffic total (minutes per person per month)Mobile telephone usage (minutes per user per month)Internet users (per 100 people)QualityPopulation covered by mobile cellular network (%)Fixed broadband Internet subscribers (% of total subscribers)International Internet bandwidth (bits per second per person)AffordabilityResidential fixed line tariff ($ a month)Mobile cellular prepaid tariff ($ a month)Fixed broadband Internet access tariff ($ a month)TradeICT goods exports (% of total goods exports)ICT goods imports (% of total goods imports)ICT service exports (% of total service exports)ApplicationsE-gov’t Web measure index (0–1, 1=highest presence)Secure Internet servers (per million people)
132 2011 The Little Data Book on Information and Communication Technology
High income
Country dataHigh-
income group
2000 2009 2009
Macao SAR, China
0.44 0.54 1,117100 100 77
14,350 39,550 37,990-1.1 14.7 2.0
91 93 98.. .. 91
.. No
.. ..
.. ..
.. ..
.. ..
3.2 2.2 3.0317 821 76514.1 15.8 15.5
40.1 31.7 45.132.0 192.8 111.2
6.3 23.8 24.315.9 38.4 65.4
.. .. 98
.. 59.9 ..
.. 112 34313.6 52.2 72.3
100 100 9913.5 98.4 89.2240 14,229 19,521
.. 9.0 22.8
.. 2.8 14.8
.. 8.9 28.8
4.3 6.3 12.27.2 11.3 13.30.9 0.6 8.1
.. .. 0.4617.8 208.2 905.1

Economic and social contextPopulation (millions)Urban population (% of total)GNI per capita, World Bank Atlas method ($)GDP growth, 1995–2000 and 2000–09 (avg. annual %)Adult literacy rate (% ages 15 and older) Gross primary, secondary, and tertiary enrollment (%) StructureSeparate telecommunications regulatorStatus of main fixed-line telephone operatorLevel of competition (competition, partial comp., monopoly)
International long distance serviceMobile telephone serviceInternet service
Efficiency and capacityTelecommunications revenue (% of GDP)Mobile cellular and fixed-line subscribers per employeeTelecommunications investment (% of revenue) PerformanceAccessTelephone lines (per 100 people)Mobile cellular subscriptions (per 100 people)Fixed broadband Internet subscribers (per 100 people)Personal computers (per 100 people)Households with a television (%)UsageInternational voice traffic, total (minutes per person per month)Mobile telephone usage (minutes per user per month)Internet users (per 100 people)QualityPopulation covered by mobile cellular network (%)Fixed broadband Internet subscribers (% of total subscribers)International Internet bandwidth (bits per second per person)AffordabilityResidential fixed line tariff ($ a month)Mobile cellular prepaid tariff ($ a month)Fixed broadband Internet access tariff ($ a month)TradeICT goods exports (% of total goods exports)ICT goods imports (% of total goods imports)ICT service exports (% of total service exports)ApplicationsE-gov’t Web measure index (0–1, 1=highest presence)Secure Internet servers (per million people)
133The Little Data Book on Information and Communication Technology 2011
Europe & Central Asia Upper middle income
Country data
Upper middle-income group
2000 2009 2009
Macedonia, FYR
2 2 1,00263 67 75
1,840 4,400 7,5023.0 3.1 4.496 97 9270 71 82
.. YesPublic Mixed
M MM CC C
5.2 6.3 3.3168 1,065 57626.7 31.2 18.0
25.2 21.7 22.15.8 95.1 100.61.5 10.7 19.43.6 36.8 11.2
.. 99 93
.. 21.3 ..
.. 112 1572.5 51.8 34.6
90 100 94.. 98.6 41.6
25 17 1,120
.. 13.4 10.0
.. 13.4 8.8
.. 14.2 18.8
0.3 0.5 12.24.4 5.5 15.1
12.7 14.3 5.4
.. 0.32 0.30
.. 24.5 32.2

Economic and social contextPopulation (millions)Urban population (% of total)GNI per capita, World Bank Atlas method ($)GDP growth, 1995–2000 and 2000–09 (avg. annual %)Adult literacy rate (% ages 15 and older) Gross primary, secondary, and tertiary enrollment (%) StructureSeparate telecommunications regulatorStatus of main fixed-line telephone operatorLevel of competition (competition, partial comp., monopoly)
International long distance serviceMobile telephone serviceInternet service
Efficiency and capacityTelecommunications revenue (% of GDP)Mobile cellular and fixed-line subscribers per employeeTelecommunications investment (% of revenue) PerformanceAccessTelephone lines (per 100 people)Mobile cellular subscriptions (per 100 people)Fixed broadband Internet subscribers (per 100 people)Personal computers (per 100 people)Households with a television (%)UsageInternational voice traffic total (minutes per person per month)Mobile telephone usage (minutes per user per month)Internet users (per 100 people)QualityPopulation covered by mobile cellular network (%)Fixed broadband Internet subscribers (% of total subscribers)International Internet bandwidth (bits per second per person)AffordabilityResidential fixed line tariff ($ a month)Mobile cellular prepaid tariff ($ a month)Fixed broadband Internet access tariff ($ a month)TradeICT goods exports (% of total goods exports)ICT goods imports (% of total goods imports)ICT service exports (% of total service exports)ApplicationsE-gov’t Web measure index (0–1, 1=highest presence)Secure Internet servers (per million people)
134 2011 The Little Data Book on Information and Communication Technology
Sub-Saharan Africa Low income
Country dataLow-
income group
2000 2009 2009
Madagascar
15 20 84627 30 29
250 430 5093.9 3.6 5.471 64 6245 66 56
Yes YesMixed Mixed
C CC CC C
10.3 3.9 2.944 2,427 301
14.0 32.8 ..
0.4 0.9 1.20.4 30.6 26.60.1 0.0 0.10.2 0.6 0.9
.. 18 ..
.. 0.6 ..
.. .. ..0.2 1.6 2.7
21 23 530.0 50.4 5.4
0 12 7
.. 12.2 8.8
.. 10.5 8.0
.. 101.6 89.9
0.9 1.6 0.63.4 3.9 5.9
.. 0.5 6.5
.. 0.17 0.09
.. 0.5 0.6

Economic and social contextPopulation (millions)Urban population (% of total)GNI per capita, World Bank Atlas method ($)GDP growth, 1995–2000 and 2000–09 (avg. annual %)Adult literacy rate (% ages 15 and older) Gross primary, secondary, and tertiary enrollment (%) StructureSeparate telecommunications regulatorStatus of main fixed-line telephone operatorLevel of competition (competition, partial comp., monopoly)
International long distance serviceMobile telephone serviceInternet service
Efficiency and capacityTelecommunications revenue (% of GDP)Mobile cellular and fixed-line subscribers per employeeTelecommunications investment (% of revenue) PerformanceAccessTelephone lines (per 100 people)Mobile cellular subscriptions (per 100 people)Fixed broadband Internet subscribers (per 100 people)Personal computers (per 100 people)Households with a television (%)UsageInternational voice traffic, total (minutes per person per month)Mobile telephone usage (minutes per user per month)Internet users (per 100 people)QualityPopulation covered by mobile cellular network (%)Fixed broadband Internet subscribers (% of total subscribers)International Internet bandwidth (bits per second per person)AffordabilityResidential fixed line tariff ($ a month)Mobile cellular prepaid tariff ($ a month)Fixed broadband Internet access tariff ($ a month)TradeICT goods exports (% of total goods exports)ICT goods imports (% of total goods imports)ICT service exports (% of total service exports)ApplicationsE-gov’t Web measure index (0–1, 1=highest presence)Secure Internet servers (per million people)
135The Little Data Book on Information and Communication Technology 2011
Country dataLow-
income group
2000 2009 2009
Sub-Saharan Africa Low income
Malawi
12 15 84615 19 29
150 290 5093.8 4.8 5.464 74 6268 59 56
Yes YesPublic Mixed
M PM PC P
1.7 3.6 2.933 .. 301
.. .. ..
0.4 1.1 1.20.4 15.7 26.60.0 0.7 0.10.1 0.2 0.9
3 9 ..
.. .. ..
.. .. ..0.1 4.7 2.7
20 93 530.0 2.4 5.4
0 5 7
.. 3.3 8.8
.. 10.8 8.0
.. 492.6 89.9
0.2 0.3 0.64.6 5.3 5.9
.. .. 6.5
.. 0.02 0.09
.. 0.3 0.6

Economic and social contextPopulation (millions)Urban population (% of total)GNI per capita, World Bank Atlas method ($)GDP growth, 1995–2000 and 2000–09 (avg. annual %)Adult literacy rate (% ages 15 and older) Gross primary, secondary, and tertiary enrollment (%) StructureSeparate telecommunications regulatorStatus of main fixed-line telephone operatorLevel of competition (competition, partial comp., monopoly)
International long distance serviceMobile telephone serviceInternet service
Efficiency and capacityTelecommunications revenue (% of GDP)Mobile cellular and fixed-line subscribers per employeeTelecommunications investment (% of revenue) PerformanceAccessTelephone lines (per 100 people)Mobile cellular subscriptions (per 100 people)Fixed broadband Internet subscribers (per 100 people)Personal computers (per 100 people)Households with a television (%)UsageInternational voice traffic total (minutes per person per month)Mobile telephone usage (minutes per user per month)Internet users (per 100 people)QualityPopulation covered by mobile cellular network (%)Fixed broadband Internet subscribers (% of total subscribers)International Internet bandwidth (bits per second per person)AffordabilityResidential fixed line tariff ($ a month)Mobile cellular prepaid tariff ($ a month)Fixed broadband Internet access tariff ($ a month)TradeICT goods exports (% of total goods exports)ICT goods imports (% of total goods imports)ICT service exports (% of total service exports)ApplicationsE-gov’t Web measure index (0–1, 1=highest presence)Secure Internet servers (per million people)
136 2011 The Little Data Book on Information and Communication Technology
East Asia & Pacific Upper middle income
Country data
Upper middle-income group
2000 2009 2009
Malaysia
23 27 1,00262 71 75
3,450 7,350 7,5023.7 5.1 4.489 92 9268 72 82
Yes YesMixed Mixed
P CP CC C
4.1 4.6 3.3394 571 57627.7 22.5 18.0
19.9 15.7 22.122.0 110.6 100.6
7.1 20.4 19.49.5 23.1 11.2
.. 97 93
.. .. ..204 197 15721.4 57.6 34.6
95 92 940.0 29.9 41.623 5,097 1,120
.. 4.8 10.0
.. 4.9 8.8
.. 19.0 18.8
56.6 38.1 12.245.8 32.0 15.1
1.9 7.0 5.4
.. 0.63 0.306.1 42.2 32.2

Economic and social contextPopulation (millions)Urban population (% of total)GNI per capita, World Bank Atlas method ($)GDP growth, 1995–2000 and 2000–09 (avg. annual %)Adult literacy rate (% ages 15 and older) Gross primary, secondary, and tertiary enrollment (%) StructureSeparate telecommunications regulatorStatus of main fixed-line telephone operatorLevel of competition (competition, partial comp., monopoly)
International long distance serviceMobile telephone serviceInternet service
Efficiency and capacityTelecommunications revenue (% of GDP)Mobile cellular and fixed-line subscribers per employeeTelecommunications investment (% of revenue) PerformanceAccessTelephone lines (per 100 people)Mobile cellular subscriptions (per 100 people)Fixed broadband Internet subscribers (per 100 people)Personal computers (per 100 people)Households with a television (%)UsageInternational voice traffic, total (minutes per person per month)Mobile telephone usage (minutes per user per month)Internet users (per 100 people)QualityPopulation covered by mobile cellular network (%)Fixed broadband Internet subscribers (% of total subscribers)International Internet bandwidth (bits per second per person)AffordabilityResidential fixed line tariff ($ a month)Mobile cellular prepaid tariff ($ a month)Fixed broadband Internet access tariff ($ a month)TradeICT goods exports (% of total goods exports)ICT goods imports (% of total goods imports)ICT service exports (% of total service exports)ApplicationsE-gov’t Web measure index (0–1, 1=highest presence)Secure Internet servers (per million people)
137The Little Data Book on Information and Communication Technology 2011
Country data
Lower middle-income group
2000 2009 2009
South Asia Lower middle income
Maldives
0.27 0.31 3,81128 39 41
2,150 3,970 2,3218.5 6.4 8.596 98 8078 69 64
No YesMixed Mixed
M MM PM P
8.5 12.7 3.060 353 605
21.6 15.2 22.4
9.0 15.8 12.72.8 147.9 57.80.4 6.5 5.53.7 20.2 4.557 85 ..
.. .. ..
.. .. 3422.2 28.4 17.2
40 100 770.0 89.0 40.111 3,028 151
.. 4.1 4.7
.. 3.5 7.1
.. 9.4 30.4
.. 0.2 21.36.1 6.6 18.4
.. .. 19.9
.. 0.16 0.24
.. 54.2 2.7

Economic and social contextPopulation (millions)Urban population (% of total)GNI per capita, World Bank Atlas method ($)GDP growth, 1995–2000 and 2000–09 (avg. annual %)Adult literacy rate (% ages 15 and older) Gross primary, secondary, and tertiary enrollment (%) StructureSeparate telecommunications regulatorStatus of main fixed-line telephone operatorLevel of competition (competition, partial comp., monopoly)
International long distance serviceMobile telephone serviceInternet service
Efficiency and capacityTelecommunications revenue (% of GDP)Mobile cellular and fixed-line subscribers per employeeTelecommunications investment (% of revenue) PerformanceAccessTelephone lines (per 100 people)Mobile cellular subscriptions (per 100 people)Fixed broadband Internet subscribers (per 100 people)Personal computers (per 100 people)Households with a television (%)UsageInternational voice traffic total (minutes per person per month)Mobile telephone usage (minutes per user per month)Internet users (per 100 people)QualityPopulation covered by mobile cellular network (%)Fixed broadband Internet subscribers (% of total subscribers)International Internet bandwidth (bits per second per person)AffordabilityResidential fixed line tariff ($ a month)Mobile cellular prepaid tariff ($ a month)Fixed broadband Internet access tariff ($ a month)TradeICT goods exports (% of total goods exports)ICT goods imports (% of total goods imports)ICT service exports (% of total service exports)ApplicationsE-gov’t Web measure index (0–1, 1=highest presence)Secure Internet servers (per million people)
138 2011 The Little Data Book on Information and Communication Technology
Sub-Saharan Africa Low income
Country dataLow-
income group
2000 2009 2009
Mali
11 13 84628 33 29
250 680 5095.5 5.3 5.419 26 6231 50 56
Yes YesPublic Mixed
P PP PC C
2.5 4.3 2.937 2,059 301
28.1 30.2 ..
0.4 0.6 1.20.1 28.8 26.6
.. 0.1 0.10.1 0.8 0.914 22 ..
.. 1.0 ..
.. .. ..0.1 1.9 2.7
15 22 53.. 52.1 5.40 51 7
.. 9.4 8.8
.. 10.0 8.0
.. 55.4 89.9
0.2 0.2 0.63.5 3.6 5.98.8 23.2 6.5
.. 0.18 0.090.1 0.8 0.6

Economic and social contextPopulation (millions)Urban population (% of total)GNI per capita, World Bank Atlas method ($)GDP growth, 1995–2000 and 2000–09 (avg. annual %)Adult literacy rate (% ages 15 and older) Gross primary, secondary, and tertiary enrollment (%) StructureSeparate telecommunications regulatorStatus of main fixed-line telephone operatorLevel of competition (competition, partial comp., monopoly)
International long distance serviceMobile telephone serviceInternet service
Efficiency and capacityTelecommunications revenue (% of GDP)Mobile cellular and fixed-line subscribers per employeeTelecommunications investment (% of revenue) PerformanceAccessTelephone lines (per 100 people)Mobile cellular subscriptions (per 100 people)Fixed broadband Internet subscribers (per 100 people)Personal computers (per 100 people)Households with a television (%)UsageInternational voice traffic, total (minutes per person per month)Mobile telephone usage (minutes per user per month)Internet users (per 100 people)QualityPopulation covered by mobile cellular network (%)Fixed broadband Internet subscribers (% of total subscribers)International Internet bandwidth (bits per second per person)AffordabilityResidential fixed line tariff ($ a month)Mobile cellular prepaid tariff ($ a month)Fixed broadband Internet access tariff ($ a month)TradeICT goods exports (% of total goods exports)ICT goods imports (% of total goods imports)ICT service exports (% of total service exports)ApplicationsE-gov’t Web measure index (0–1, 1=highest presence)Secure Internet servers (per million people)
139The Little Data Book on Information and Communication Technology 2011
Country dataHigh-
income group
2000 2009 2009
High income
Malta
0.39 0.41 1,11792 94 77
10,110 18,630 37,9904.9 2.0 2.0
.. 92 9876 78 91
Yes YesMixed Private
M CM CC C
2.8 4.7 3.0161 350 76523.0 15.1 15.5
52.4 60.9 45.129.3 101.7 111.2
8.8 26.9 24.320.5 .. 65.4
98 99 98
.. .. ..
.. 104 34313.1 58.0 72.3
99 100 994.8 89.5 89.287 7,549 19,521
.. 5.6 22.8
.. 10.8 14.8
.. 20.1 28.8
64.2 43.2 12.244.9 15.2 13.3
2.5 3.2 8.1
.. 0.47 0.4658.5 1,364.6 905.1
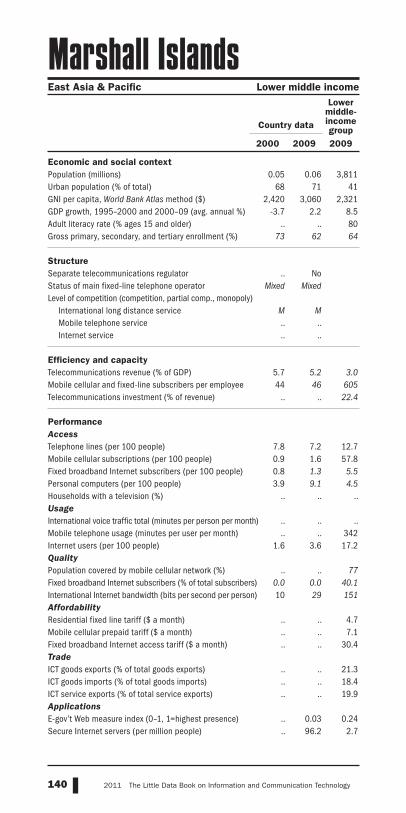
Economic and social contextPopulation (millions)Urban population (% of total)GNI per capita, World Bank Atlas method ($)GDP growth, 1995–2000 and 2000–09 (avg. annual %)Adult literacy rate (% ages 15 and older) Gross primary, secondary, and tertiary enrollment (%) StructureSeparate telecommunications regulatorStatus of main fixed-line telephone operatorLevel of competition (competition, partial comp., monopoly)
International long distance serviceMobile telephone serviceInternet service
Efficiency and capacityTelecommunications revenue (% of GDP)Mobile cellular and fixed-line subscribers per employeeTelecommunications investment (% of revenue) PerformanceAccessTelephone lines (per 100 people)Mobile cellular subscriptions (per 100 people)Fixed broadband Internet subscribers (per 100 people)Personal computers (per 100 people)Households with a television (%)UsageInternational voice traffic total (minutes per person per month)Mobile telephone usage (minutes per user per month)Internet users (per 100 people)QualityPopulation covered by mobile cellular network (%)Fixed broadband Internet subscribers (% of total subscribers)International Internet bandwidth (bits per second per person)AffordabilityResidential fixed line tariff ($ a month)Mobile cellular prepaid tariff ($ a month)Fixed broadband Internet access tariff ($ a month)TradeICT goods exports (% of total goods exports)ICT goods imports (% of total goods imports)ICT service exports (% of total service exports)ApplicationsE-gov’t Web measure index (0–1, 1=highest presence)Secure Internet servers (per million people)
140 2011 The Little Data Book on Information and Communication Technology
Country data
Lower middle-income group
2000 2009 2009
East Asia & Pacific Lower middle income
Marshall Islands
0.05 0.06 3,81168 71 41
2,420 3,060 2,321-3.7 2.2 8.5
.. .. 8073 62 64
.. NoMixed Mixed
M M.. .... ..
5.7 5.2 3.044 46 605
.. .. 22.4
7.8 7.2 12.70.9 1.6 57.80.8 1.3 5.53.9 9.1 4.5
.. .. ..
.. .. ..
.. .. 3421.6 3.6 17.2
.. .. 770.0 0.0 40.110 29 151
.. .. 4.7
.. .. 7.1
.. .. 30.4
.. .. 21.3
.. .. 18.4
.. .. 19.9
.. 0.03 0.24
.. 96.2 2.7

Economic and social contextPopulation (millions)Urban population (% of total)GNI per capita, World Bank Atlas method ($)GDP growth, 1995–2000 and 2000–09 (avg. annual %)Adult literacy rate (% ages 15 and older) Gross primary, secondary, and tertiary enrollment (%) StructureSeparate telecommunications regulatorStatus of main fixed-line telephone operatorLevel of competition (competition, partial comp., monopoly)
International long distance serviceMobile telephone serviceInternet service
Efficiency and capacityTelecommunications revenue (% of GDP)Mobile cellular and fixed-line subscribers per employeeTelecommunications investment (% of revenue) PerformanceAccessTelephone lines (per 100 people)Mobile cellular subscriptions (per 100 people)Fixed broadband Internet subscribers (per 100 people)Personal computers (per 100 people)Households with a television (%)UsageInternational voice traffic, total (minutes per person per month)Mobile telephone usage (minutes per user per month)Internet users (per 100 people)QualityPopulation covered by mobile cellular network (%)Fixed broadband Internet subscribers (% of total subscribers)International Internet bandwidth (bits per second per person)AffordabilityResidential fixed line tariff ($ a month)Mobile cellular prepaid tariff ($ a month)Fixed broadband Internet access tariff ($ a month)TradeICT goods exports (% of total goods exports)ICT goods imports (% of total goods imports)ICT service exports (% of total service exports)ApplicationsE-gov’t Web measure index (0–1, 1=highest presence)Secure Internet servers (per million people)
141The Little Data Book on Information and Communication Technology 2011
Country dataLow-
income group
2000 2009 2009
Sub-Saharan Africa Low income
Mauritania
3 3 84640 41 29
460 990 5092.3 4.7 5.451 57 6242 50 56
Yes YesPublic Mixed
M CM CC C
2.4 6.9 2.948 2,842 301
131.7 23.4 ..
0.7 2.3 1.20.6 66.3 26.60.0 0.3 0.11.0 4.5 0.920 22 ..
.. 4.8 ..
.. .. ..0.2 2.3 2.7
.. 62 530.0 60.6 5.4
0 76 7
.. 11.9 8.8
.. 9.9 8.0
.. 57.8 89.9
.. .. 0.63.7 1.6 5.9
.. .. 6.5
.. 0.09 0.090.4 2.1 0.6

Economic and social contextPopulation (millions)Urban population (% of total)GNI per capita, World Bank Atlas method ($)GDP growth, 1995–2000 and 2000–09 (avg. annual %)Adult literacy rate (% ages 15 and older) Gross primary, secondary, and tertiary enrollment (%) StructureSeparate telecommunications regulatorStatus of main fixed-line telephone operatorLevel of competition (competition, partial comp., monopoly)
International long distance serviceMobile telephone serviceInternet service
Efficiency and capacityTelecommunications revenue (% of GDP)Mobile cellular and fixed-line subscribers per employeeTelecommunications investment (% of revenue) PerformanceAccessTelephone lines (per 100 people)Mobile cellular subscriptions (per 100 people)Fixed broadband Internet subscribers (per 100 people)Personal computers (per 100 people)Households with a television (%)UsageInternational voice traffic total (minutes per person per month)Mobile telephone usage (minutes per user per month)Internet users (per 100 people)QualityPopulation covered by mobile cellular network (%)Fixed broadband Internet subscribers (% of total subscribers)International Internet bandwidth (bits per second per person)AffordabilityResidential fixed line tariff ($ a month)Mobile cellular prepaid tariff ($ a month)Fixed broadband Internet access tariff ($ a month)TradeICT goods exports (% of total goods exports)ICT goods imports (% of total goods imports)ICT service exports (% of total service exports)ApplicationsE-gov’t Web measure index (0–1, 1=highest presence)Secure Internet servers (per million people)
142 2011 The Little Data Book on Information and Communication Technology
Country data
Upper middle-income group
2000 2009 2009
Sub-Saharan Africa Upper middle income
Mauritius
1 1 1,00243 43 75
3,870 7,250 7,5025.5 3.7 4.484 88 9268 73 82
Yes Yes.. Mixed
M CP CM C
3.2 3.6 3.3251 492 57637.6 332.6 18.0
23.7 29.7 22.115.2 85.2 100.6
2.9 17.6 19.410.1 17.6 11.2
93 96 93
.. 17.9 ..
.. .. 1577.3 22.7 34.6
100 99 940.0 41.3 41.6
5 364 1,120
.. 5.6 10.0
.. 4.5 8.8
.. 16.6 18.8
0.8 0.6 12.26.1 4.2 15.11.8 3.7 5.4
.. 0.30 0.3010.0 86.6 32.2
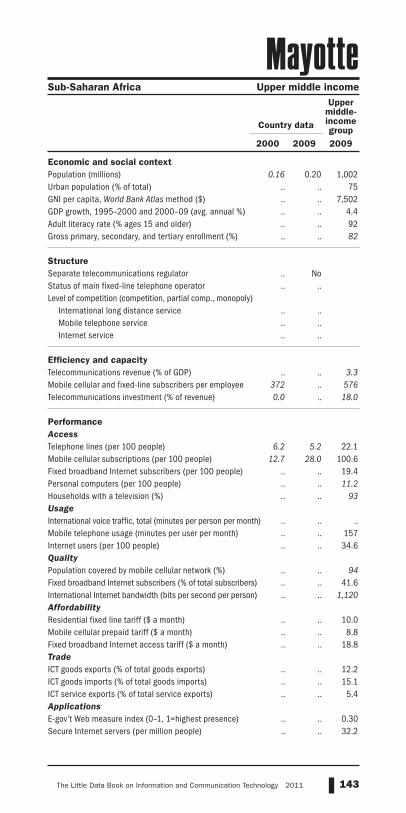
Economic and social contextPopulation (millions)Urban population (% of total)GNI per capita, World Bank Atlas method ($)GDP growth, 1995–2000 and 2000–09 (avg. annual %)Adult literacy rate (% ages 15 and older) Gross primary, secondary, and tertiary enrollment (%) StructureSeparate telecommunications regulatorStatus of main fixed-line telephone operatorLevel of competition (competition, partial comp., monopoly)
International long distance serviceMobile telephone serviceInternet service
Efficiency and capacityTelecommunications revenue (% of GDP)Mobile cellular and fixed-line subscribers per employeeTelecommunications investment (% of revenue) PerformanceAccessTelephone lines (per 100 people)Mobile cellular subscriptions (per 100 people)Fixed broadband Internet subscribers (per 100 people)Personal computers (per 100 people)Households with a television (%)UsageInternational voice traffic, total (minutes per person per month)Mobile telephone usage (minutes per user per month)Internet users (per 100 people)QualityPopulation covered by mobile cellular network (%)Fixed broadband Internet subscribers (% of total subscribers)International Internet bandwidth (bits per second per person)AffordabilityResidential fixed line tariff ($ a month)Mobile cellular prepaid tariff ($ a month)Fixed broadband Internet access tariff ($ a month)TradeICT goods exports (% of total goods exports)ICT goods imports (% of total goods imports)ICT service exports (% of total service exports)ApplicationsE-gov’t Web measure index (0–1, 1=highest presence)Secure Internet servers (per million people)
143The Little Data Book on Information and Communication Technology 2011
Sub-Saharan Africa Upper middle income
Country data
Upper middle-income group
2000 2009 2009
Mayotte
0.16 0.20 1,002.. .. 75.. .. 7,502.. .. 4.4.. .. 92.. .. 82
.. No
.. ..
.. ..
.. ..
.. ..
.. .. 3.3372 .. 5760.0 .. 18.0
6.2 5.2 22.112.7 28.0 100.6
.. .. 19.4
.. .. 11.2
.. .. 93
.. .. ..
.. .. 157
.. .. 34.6
.. .. 94
.. .. 41.6
.. .. 1,120
.. .. 10.0
.. .. 8.8
.. .. 18.8
.. .. 12.2
.. .. 15.1
.. .. 5.4
.. .. 0.30
.. .. 32.2

Economic and social contextPopulation (millions)Urban population (% of total)GNI per capita, World Bank Atlas method ($)GDP growth, 1995–2000 and 2000–09 (avg. annual %)Adult literacy rate (% ages 15 and older) Gross primary, secondary, and tertiary enrollment (%) StructureSeparate telecommunications regulatorStatus of main fixed-line telephone operatorLevel of competition (competition, partial comp., monopoly)
International long distance serviceMobile telephone serviceInternet service
Efficiency and capacityTelecommunications revenue (% of GDP)Mobile cellular and fixed-line subscribers per employeeTelecommunications investment (% of revenue) PerformanceAccessTelephone lines (per 100 people)Mobile cellular subscriptions (per 100 people)Fixed broadband Internet subscribers (per 100 people)Personal computers (per 100 people)Households with a television (%)UsageInternational voice traffic total (minutes per person per month)Mobile telephone usage (minutes per user per month)Internet users (per 100 people)QualityPopulation covered by mobile cellular network (%)Fixed broadband Internet subscribers (% of total subscribers)International Internet bandwidth (bits per second per person)AffordabilityResidential fixed line tariff ($ a month)Mobile cellular prepaid tariff ($ a month)Fixed broadband Internet access tariff ($ a month)TradeICT goods exports (% of total goods exports)ICT goods imports (% of total goods imports)ICT service exports (% of total service exports)ApplicationsE-gov’t Web measure index (0–1, 1=highest presence)Secure Internet servers (per million people)
144 2011 The Little Data Book on Information and Communication Technology
Country data
Upper middle-income group
2000 2009 2009
Latin America & Caribbean Upper middle income
Mexico
98 107 1,00275 78 75
5,110 8,960 7,5025.4 2.2 4.491 93 9272 80 82
Yes YesPrivate Private
C CP CC C
2.1 2.7 3.3375 838 57641.5 13.4 18.0
12.6 18.1 22.114.4 77.8 100.6
1.2 9.6 19.45.8 14.4 11.292 93 93
.. .. ..83 177 1575.2 26.5 34.6
86 100 941.3 96.2 41.6
9 312 1,120
.. 17.3 10.0
.. 8.6 8.8
.. 16.2 18.8
23.0 22.9 12.220.3 20.9 15.1
8.8 1.3 5.4
.. 0.44 0.302.6 21.5 32.2

Economic and social contextPopulation (millions)Urban population (% of total)GNI per capita, World Bank Atlas method ($)GDP growth, 1995–2000 and 2000–09 (avg. annual %)Adult literacy rate (% ages 15 and older) Gross primary, secondary, and tertiary enrollment (%) StructureSeparate telecommunications regulatorStatus of main fixed-line telephone operatorLevel of competition (competition, partial comp., monopoly)
International long distance serviceMobile telephone serviceInternet service
Efficiency and capacityTelecommunications revenue (% of GDP)Mobile cellular and fixed-line subscribers per employeeTelecommunications investment (% of revenue) PerformanceAccessTelephone lines (per 100 people)Mobile cellular subscriptions (per 100 people)Fixed broadband Internet subscribers (per 100 people)Personal computers (per 100 people)Households with a television (%)UsageInternational voice traffic, total (minutes per person per month)Mobile telephone usage (minutes per user per month)Internet users (per 100 people)QualityPopulation covered by mobile cellular network (%)Fixed broadband Internet subscribers (% of total subscribers)International Internet bandwidth (bits per second per person)AffordabilityResidential fixed line tariff ($ a month)Mobile cellular prepaid tariff ($ a month)Fixed broadband Internet access tariff ($ a month)TradeICT goods exports (% of total goods exports)ICT goods imports (% of total goods imports)ICT service exports (% of total service exports)ApplicationsE-gov’t Web measure index (0–1, 1=highest presence)Secure Internet servers (per million people)
145The Little Data Book on Information and Communication Technology 2011
East Asia & Pacific Lower middle income
Country data
Lower middle-income group
2000 2009 2009
Micronesia, Fed. Sts.
0.11 0.11 3,81122 23 41
2,270 2,500 2,321-0.3 -0.2 8.5
.. .. 80
.. 84 64
.. NoPublic Public
M MC M.. M
4.8 5.3 3.074 238 6054.9 13.2 22.4
9.0 7.9 12.70.0 34.3 57.81.4 1.2 5.51.3 5.5 4.5
.. .. ..
.. .. ..
.. .. 3423.7 15.4 17.2
0 .. 770.0 6.7 40.110 143 151
.. 8.0 4.7
.. 4.9 7.1
.. 40.0 30.4
.. .. 21.3
.. .. 18.4
.. .. 19.9
.. 0.13 0.24
.. 36.0 2.7

Economic and social contextPopulation (millions)Urban population (% of total)GNI per capita, World Bank Atlas method ($)GDP growth, 1995–2000 and 2000–09 (avg. annual %)Adult literacy rate (% ages 15 and older) Gross primary, secondary, and tertiary enrollment (%) StructureSeparate telecommunications regulatorStatus of main fixed-line telephone operatorLevel of competition (competition, partial comp., monopoly)
International long distance serviceMobile telephone serviceInternet service
Efficiency and capacityTelecommunications revenue (% of GDP)Mobile cellular and fixed-line subscribers per employeeTelecommunications investment (% of revenue) PerformanceAccessTelephone lines (per 100 people)Mobile cellular subscriptions (per 100 people)Fixed broadband Internet subscribers (per 100 people)Personal computers (per 100 people)Households with a television (%)UsageInternational voice traffic total (minutes per person per month)Mobile telephone usage (minutes per user per month)Internet users (per 100 people)QualityPopulation covered by mobile cellular network (%)Fixed broadband Internet subscribers (% of total subscribers)International Internet bandwidth (bits per second per person)AffordabilityResidential fixed line tariff ($ a month)Mobile cellular prepaid tariff ($ a month)Fixed broadband Internet access tariff ($ a month)TradeICT goods exports (% of total goods exports)ICT goods imports (% of total goods imports)ICT service exports (% of total service exports)ApplicationsE-gov’t Web measure index (0–1, 1=highest presence)Secure Internet servers (per million people)
146 2011 The Little Data Book on Information and Communication Technology
Country data
Lower middle-income group
2000 2009 2009
Europe & Central Asia Lower middle income
Moldova
4 4 3,81145 41 41
370 1,560 2,321-2.6 5.6 8.5
97 98 8071 68 64
Yes YesPublic Private
M CC CC C
3.9 10.1 3.097 294 605
67.9 35.7 22.4
14.2 31.6 12.73.4 77.3 57.80.3 5.6 5.51.5 11.4 4.583 69 ..
.. 38.1 ..
.. 113 3421.3 35.9 17.2
70 98 772.3 91.9 40.1
2 6,660 151
.. 2.9 4.7
.. 8.2 7.1
.. 13.4 30.4
1.6 7.5 21.35.5 5.1 18.4
10.5 20.2 19.9
.. 0.30 0.240.7 13.4 2.7

Economic and social contextPopulation (millions)Urban population (% of total)GNI per capita, World Bank Atlas method ($)GDP growth, 1995–2000 and 2000–09 (avg. annual %)Adult literacy rate (% ages 15 and older) Gross primary, secondary, and tertiary enrollment (%) StructureSeparate telecommunications regulatorStatus of main fixed-line telephone operatorLevel of competition (competition, partial comp., monopoly)
International long distance serviceMobile telephone serviceInternet service
Efficiency and capacityTelecommunications revenue (% of GDP)Mobile cellular and fixed-line subscribers per employeeTelecommunications investment (% of revenue) PerformanceAccessTelephone lines (per 100 people)Mobile cellular subscriptions (per 100 people)Fixed broadband Internet subscribers (per 100 people)Personal computers (per 100 people)Households with a television (%)UsageInternational voice traffic, total (minutes per person per month)Mobile telephone usage (minutes per user per month)Internet users (per 100 people)QualityPopulation covered by mobile cellular network (%)Fixed broadband Internet subscribers (% of total subscribers)International Internet bandwidth (bits per second per person)AffordabilityResidential fixed line tariff ($ a month)Mobile cellular prepaid tariff ($ a month)Fixed broadband Internet access tariff ($ a month)TradeICT goods exports (% of total goods exports)ICT goods imports (% of total goods imports)ICT service exports (% of total service exports)ApplicationsE-gov’t Web measure index (0–1, 1=highest presence)Secure Internet servers (per million people)
147The Little Data Book on Information and Communication Technology 2011
High income
Country dataHigh-
income group
2000 2009 2009
Monaco
0.03 0.03 1,117100 100 77
91,070 197,590 37,9902.9 4.3 2.0
.. .. 98
.. .. 91
.. NoMixed Mixed
M MM MC M
.. .. 3.0
.. .. 765
.. .. 15.5
.. .. 45.1
.. .. 111.2
.. .. 24.3
.. .. 65.4
.. .. 98
.. .. ..
.. .. 343
.. .. 72.3
.. .. 99
.. .. 89.2
.. .. 19,521
.. .. 22.8
.. .. 14.8
.. .. 28.8
.. .. 12.2
.. .. 13.3
.. .. 8.1
.. 0.14 0.46248.8 2,735.2 905.1

Economic and social contextPopulation (millions)Urban population (% of total)GNI per capita, World Bank Atlas method ($)GDP growth, 1995–2000 and 2000–09 (avg. annual %)Adult literacy rate (% ages 15 and older) Gross primary, secondary, and tertiary enrollment (%) StructureSeparate telecommunications regulatorStatus of main fixed-line telephone operatorLevel of competition (competition, partial comp., monopoly)
International long distance serviceMobile telephone serviceInternet service
Efficiency and capacityTelecommunications revenue (% of GDP)Mobile cellular and fixed-line subscribers per employeeTelecommunications investment (% of revenue) PerformanceAccessTelephone lines (per 100 people)Mobile cellular subscriptions (per 100 people)Fixed broadband Internet subscribers (per 100 people)Personal computers (per 100 people)Households with a television (%)UsageInternational voice traffic total (minutes per person per month)Mobile telephone usage (minutes per user per month)Internet users (per 100 people)QualityPopulation covered by mobile cellular network (%)Fixed broadband Internet subscribers (% of total subscribers)International Internet bandwidth (bits per second per person)AffordabilityResidential fixed line tariff ($ a month)Mobile cellular prepaid tariff ($ a month)Fixed broadband Internet access tariff ($ a month)TradeICT goods exports (% of total goods exports)ICT goods imports (% of total goods imports)ICT service exports (% of total service exports)ApplicationsE-gov’t Web measure index (0–1, 1=highest presence)Secure Internet servers (per million people)
148 2011 The Little Data Book on Information and Communication Technology
Country data
Lower middle-income group
2000 2009 2009
East Asia & Pacific Lower middle income
Mongolia
2 3 3,81157 57 41
410 1,630 2,3213.0 7.4 8.598 97 8066 81 64
No YesMixed Mixed
M PP CC C
4.3 6.7 3.060 341 6054.7 18.8 22.4
4.9 7.1 12.76.5 84.2 57.80.3 1.8 5.51.3 26.2 4.5
.. 88 ..
.. .. ..
.. .. 3421.3 13.1 17.2
58 82 770.5 49.7 40.1
3 2,920 151
.. 0.7 4.7
.. 3.6 7.1
.. 8.5 30.4
0.1 0.1 21.36.8 5.1 18.46.8 3.0 19.9
.. 0.56 0.240.4 10.7 2.7

Economic and social contextPopulation (millions)Urban population (% of total)GNI per capita, World Bank Atlas method ($)GDP growth, 1995–2000 and 2000–09 (avg. annual %)Adult literacy rate (% ages 15 and older) Gross primary, secondary, and tertiary enrollment (%) StructureSeparate telecommunications regulatorStatus of main fixed-line telephone operatorLevel of competition (competition, partial comp., monopoly)
International long distance serviceMobile telephone serviceInternet service
Efficiency and capacityTelecommunications revenue (% of GDP)Mobile cellular and fixed-line subscribers per employeeTelecommunications investment (% of revenue) PerformanceAccessTelephone lines (per 100 people)Mobile cellular subscriptions (per 100 people)Fixed broadband Internet subscribers (per 100 people)Personal computers (per 100 people)Households with a television (%)UsageInternational voice traffic, total (minutes per person per month)Mobile telephone usage (minutes per user per month)Internet users (per 100 people)QualityPopulation covered by mobile cellular network (%)Fixed broadband Internet subscribers (% of total subscribers)International Internet bandwidth (bits per second per person)AffordabilityResidential fixed line tariff ($ a month)Mobile cellular prepaid tariff ($ a month)Fixed broadband Internet access tariff ($ a month)TradeICT goods exports (% of total goods exports)ICT goods imports (% of total goods imports)ICT service exports (% of total service exports)ApplicationsE-gov’t Web measure index (0–1, 1=highest presence)Secure Internet servers (per million people)
149The Little Data Book on Information and Communication Technology 2011
Country data
Upper middle-income group
2000 2009 2009
Europe & Central Asia Upper middle income
Montenegro
0.66 0.62 1,00259 60 75
1,840 6,650 7,502-1.6 4.7 4.4
.. .. 92
.. .. 82
.. Yes
.. Private
.. C
.. C
.. C
.. .. 3.3
.. .. 576
.. .. 18.0
.. 58.7 22.1
.. 120.5 100.6
.. 14.3 19.4
.. .. 11.2
.. 97 93
.. .. ..
.. 111 157
.. 44.9 34.6
.. 99 94
.. 29.1 41.6
.. 1,208 1,120
.. 9.9 10.0
.. 6.3 8.8
.. 29.0 18.8
.. .. 12.2
.. .. 15.1
.. .. 5.4
.. 0.31 0.30
.. 25.6 32.2
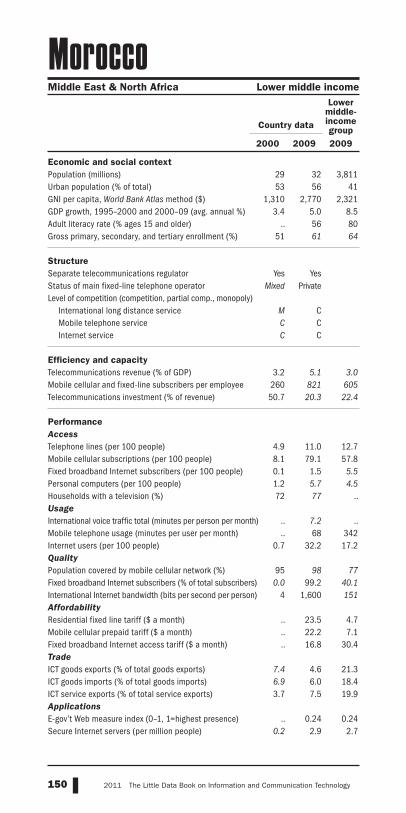
Economic and social contextPopulation (millions)Urban population (% of total)GNI per capita, World Bank Atlas method ($)GDP growth, 1995–2000 and 2000–09 (avg. annual %)Adult literacy rate (% ages 15 and older) Gross primary, secondary, and tertiary enrollment (%) StructureSeparate telecommunications regulatorStatus of main fixed-line telephone operatorLevel of competition (competition, partial comp., monopoly)
International long distance serviceMobile telephone serviceInternet service
Efficiency and capacityTelecommunications revenue (% of GDP)Mobile cellular and fixed-line subscribers per employeeTelecommunications investment (% of revenue) PerformanceAccessTelephone lines (per 100 people)Mobile cellular subscriptions (per 100 people)Fixed broadband Internet subscribers (per 100 people)Personal computers (per 100 people)Households with a television (%)UsageInternational voice traffic total (minutes per person per month)Mobile telephone usage (minutes per user per month)Internet users (per 100 people)QualityPopulation covered by mobile cellular network (%)Fixed broadband Internet subscribers (% of total subscribers)International Internet bandwidth (bits per second per person)AffordabilityResidential fixed line tariff ($ a month)Mobile cellular prepaid tariff ($ a month)Fixed broadband Internet access tariff ($ a month)TradeICT goods exports (% of total goods exports)ICT goods imports (% of total goods imports)ICT service exports (% of total service exports)ApplicationsE-gov’t Web measure index (0–1, 1=highest presence)Secure Internet servers (per million people)
150 2011 The Little Data Book on Information and Communication Technology
Country data
Lower middle-income group
2000 2009 2009
Middle East & North Africa Lower middle income
Morocco
29 32 3,81153 56 41
1,310 2,770 2,3213.4 5.0 8.5
.. 56 8051 61 64
Yes YesMixed Private
M CC CC C
3.2 5.1 3.0260 821 60550.7 20.3 22.4
4.9 11.0 12.78.1 79.1 57.80.1 1.5 5.51.2 5.7 4.572 77 ..
.. 7.2 ..
.. 68 3420.7 32.2 17.2
95 98 770.0 99.2 40.1
4 1,600 151
.. 23.5 4.7
.. 22.2 7.1
.. 16.8 30.4
7.4 4.6 21.36.9 6.0 18.43.7 7.5 19.9
.. 0.24 0.240.2 2.9 2.7

Economic and social contextPopulation (millions)Urban population (% of total)GNI per capita, World Bank Atlas method ($)GDP growth, 1995–2000 and 2000–09 (avg. annual %)Adult literacy rate (% ages 15 and older) Gross primary, secondary, and tertiary enrollment (%) StructureSeparate telecommunications regulatorStatus of main fixed-line telephone operatorLevel of competition (competition, partial comp., monopoly)
International long distance serviceMobile telephone serviceInternet service
Efficiency and capacityTelecommunications revenue (% of GDP)Mobile cellular and fixed-line subscribers per employeeTelecommunications investment (% of revenue) PerformanceAccessTelephone lines (per 100 people)Mobile cellular subscriptions (per 100 people)Fixed broadband Internet subscribers (per 100 people)Personal computers (per 100 people)Households with a television (%)UsageInternational voice traffic, total (minutes per person per month)Mobile telephone usage (minutes per user per month)Internet users (per 100 people)QualityPopulation covered by mobile cellular network (%)Fixed broadband Internet subscribers (% of total subscribers)International Internet bandwidth (bits per second per person)AffordabilityResidential fixed line tariff ($ a month)Mobile cellular prepaid tariff ($ a month)Fixed broadband Internet access tariff ($ a month)TradeICT goods exports (% of total goods exports)ICT goods imports (% of total goods imports)ICT service exports (% of total service exports)ApplicationsE-gov’t Web measure index (0–1, 1=highest presence)Secure Internet servers (per million people)
151The Little Data Book on Information and Communication Technology 2011
Country dataLow-
income group
2000 2009 2009
Sub-Saharan Africa Low income
Mozambique
18 23 84631 38 29
230 440 5098.1 7.9 5.4
.. 55 6237 52 56
Yes YesPublic Mixed
M MC CC C
2.6 1.2 2.960 605 301
49.6 24.6 ..
0.5 0.4 1.20.3 26.1 26.60.0 0.1 0.10.3 1.4 0.9
5 9 ..
.. .. ..
.. .. ..0.1 2.7 2.7
.. 44 53
.. 92.5 5.40 56 7
.. 13.1 8.8
.. 8.0 8.0
.. 80.2 89.9
0.0 0.4 0.62.7 3.9 5.94.1 5.8 6.5
.. 0.17 0.09
.. 0.9 0.6

Economic and social contextPopulation (millions)Urban population (% of total)GNI per capita, World Bank Atlas method ($)GDP growth, 1995–2000 and 2000–09 (avg. annual %)Adult literacy rate (% ages 15 and older) Gross primary, secondary, and tertiary enrollment (%) StructureSeparate telecommunications regulatorStatus of main fixed-line telephone operatorLevel of competition (competition, partial comp., monopoly)
International long distance serviceMobile telephone serviceInternet service
Efficiency and capacityTelecommunications revenue (% of GDP)Mobile cellular and fixed-line subscribers per employeeTelecommunications investment (% of revenue) PerformanceAccessTelephone lines (per 100 people)Mobile cellular subscriptions (per 100 people)Fixed broadband Internet subscribers (per 100 people)Personal computers (per 100 people)Households with a television (%)UsageInternational voice traffic total (minutes per person per month)Mobile telephone usage (minutes per user per month)Internet users (per 100 people)QualityPopulation covered by mobile cellular network (%)Fixed broadband Internet subscribers (% of total subscribers)International Internet bandwidth (bits per second per person)AffordabilityResidential fixed line tariff ($ a month)Mobile cellular prepaid tariff ($ a month)Fixed broadband Internet access tariff ($ a month)TradeICT goods exports (% of total goods exports)ICT goods imports (% of total goods imports)ICT service exports (% of total service exports)ApplicationsE-gov’t Web measure index (0–1, 1=highest presence)Secure Internet servers (per million people)
152 2011 The Little Data Book on Information and Communication Technology
Country dataLow-
income group
2000 2009 2009
East Asia & Pacific Low income
Myanmar
47 50 84628 33 29
.. .. 5098.1 13.0 5.490 92 6249 56 56
.. NoPublic Public
M MM MM M
0.2 0.5 2.937 90 301
25.3 2.6 ..
0.6 1.6 1.20.0 0.9 26.60.0 0.0 0.10.2 0.9 0.9
.. 26 ..
.. 0.2 ..
.. .. ..0.0 0.2 2.7
.. 10 53
.. 47.7 5.40 20 7
.. 0.9 8.8
.. 12.8 8.0
.. 28.5 89.9
.. .. 0.63.6 .. 5.9
.. .. 6.5
.. 0.08 0.09
.. 0.1 0.6

Economic and social contextPopulation (millions)Urban population (% of total)GNI per capita, World Bank Atlas method ($)GDP growth, 1995–2000 and 2000–09 (avg. annual %)Adult literacy rate (% ages 15 and older) Gross primary, secondary, and tertiary enrollment (%) StructureSeparate telecommunications regulatorStatus of main fixed-line telephone operatorLevel of competition (competition, partial comp., monopoly)
International long distance serviceMobile telephone serviceInternet service
Efficiency and capacityTelecommunications revenue (% of GDP)Mobile cellular and fixed-line subscribers per employeeTelecommunications investment (% of revenue) PerformanceAccessTelephone lines (per 100 people)Mobile cellular subscriptions (per 100 people)Fixed broadband Internet subscribers (per 100 people)Personal computers (per 100 people)Households with a television (%)UsageInternational voice traffic, total (minutes per person per month)Mobile telephone usage (minutes per user per month)Internet users (per 100 people)QualityPopulation covered by mobile cellular network (%)Fixed broadband Internet subscribers (% of total subscribers)International Internet bandwidth (bits per second per person)AffordabilityResidential fixed line tariff ($ a month)Mobile cellular prepaid tariff ($ a month)Fixed broadband Internet access tariff ($ a month)TradeICT goods exports (% of total goods exports)ICT goods imports (% of total goods imports)ICT service exports (% of total service exports)ApplicationsE-gov’t Web measure index (0–1, 1=highest presence)Secure Internet servers (per million people)
153The Little Data Book on Information and Communication Technology 2011
Sub-Saharan Africa Upper middle income
Country data
Upper middle-income group
2000 2009 2009
Namibia
2 2 1,00232 37 75
2,030 4,270 7,5023.5 5.3 4.485 89 9273 71 82
Yes YesPublic Public
M MM PC C
3.1 4.1 3.3115 435 57629.6 7.5 18.0
6.0 6.5 22.14.5 56.1 100.60.5 4.3 19.44.1 23.9 11.229 37 93
.. .. ..
.. .. 1571.6 5.9 34.6
85 95 940.0 0.3 41.6
2 27 1,120
.. 13.0 10.0
.. 12.8 8.8
.. 47.2 18.8
1.0 0.6 12.28.3 4.9 15.13.5 2.4 5.4
.. 0.07 0.301.6 14.5 32.2

Economic and social contextPopulation (millions)Urban population (% of total)GNI per capita, World Bank Atlas method ($)GDP growth, 1995–2000 and 2000–09 (avg. annual %)Adult literacy rate (% ages 15 and older) Gross primary, secondary, and tertiary enrollment (%) StructureSeparate telecommunications regulatorStatus of main fixed-line telephone operatorLevel of competition (competition, partial comp., monopoly)
International long distance serviceMobile telephone serviceInternet service
Efficiency and capacityTelecommunications revenue (% of GDP)Mobile cellular and fixed-line subscribers per employeeTelecommunications investment (% of revenue) PerformanceAccessTelephone lines (per 100 people)Mobile cellular subscriptions (per 100 people)Fixed broadband Internet subscribers (per 100 people)Personal computers (per 100 people)Households with a television (%)UsageInternational voice traffic total (minutes per person per month)Mobile telephone usage (minutes per user per month)Internet users (per 100 people)QualityPopulation covered by mobile cellular network (%)Fixed broadband Internet subscribers (% of total subscribers)International Internet bandwidth (bits per second per person)AffordabilityResidential fixed line tariff ($ a month)Mobile cellular prepaid tariff ($ a month)Fixed broadband Internet access tariff ($ a month)TradeICT goods exports (% of total goods exports)ICT goods imports (% of total goods imports)ICT service exports (% of total service exports)ApplicationsE-gov’t Web measure index (0–1, 1=highest presence)Secure Internet servers (per million people)
154 2011 The Little Data Book on Information and Communication Technology
Country dataLow-
income group
2000 2009 2009
South Asia Low income
Nepal
24 29 84613 18 29
220 440 5094.6 3.7 5.449 59 6256 61 56
Yes YesPublic Private
M CM CC C
1.3 1.0 2.960 565 301
26.7 26.7 ..
1.1 2.8 1.20.0 26.0 26.60.0 0.4 0.10.3 0.5 0.911 33 ..
.. .. ..
.. 103 ..0.2 2.1 2.7
.. 60 530.0 72.6 5.4
0 5 7
.. 3.0 8.8
.. 1.2 8.0
.. 21.5 89.9
0.1 0.2 0.63.2 5.6 5.9
.. .. 6.5
.. 0.17 0.09
.. 1.5 0.6

Economic and social contextPopulation (millions)Urban population (% of total)GNI per capita, World Bank Atlas method ($)GDP growth, 1995–2000 and 2000–09 (avg. annual %)Adult literacy rate (% ages 15 and older) Gross primary, secondary, and tertiary enrollment (%) StructureSeparate telecommunications regulatorStatus of main fixed-line telephone operatorLevel of competition (competition, partial comp., monopoly)
International long distance serviceMobile telephone serviceInternet service
Efficiency and capacityTelecommunications revenue (% of GDP)Mobile cellular and fixed-line subscribers per employeeTelecommunications investment (% of revenue) PerformanceAccessTelephone lines (per 100 people)Mobile cellular subscriptions (per 100 people)Fixed broadband Internet subscribers (per 100 people)Personal computers (per 100 people)Households with a television (%)UsageInternational voice traffic, total (minutes per person per month)Mobile telephone usage (minutes per user per month)Internet users (per 100 people)QualityPopulation covered by mobile cellular network (%)Fixed broadband Internet subscribers (% of total subscribers)International Internet bandwidth (bits per second per person)AffordabilityResidential fixed line tariff ($ a month)Mobile cellular prepaid tariff ($ a month)Fixed broadband Internet access tariff ($ a month)TradeICT goods exports (% of total goods exports)ICT goods imports (% of total goods imports)ICT service exports (% of total service exports)ApplicationsE-gov’t Web measure index (0–1, 1=highest presence)Secure Internet servers (per million people)
155The Little Data Book on Information and Communication Technology 2011
Country dataHigh-
income group
2000 2009 2009
High income
Netherlands
16 17 1,11777 82 77
26,580 48,460 37,9904.1 1.7 2.0
.. .. 9898 98 91
Yes YesMixed Private
C CC CC C
3.7 0.7 3.0353 .. 76521.6 .. 15.5
62.1 44.3 45.167.5 128.1 111.237.1 34.3 24.339.6 91.2 65.4
.. 98 98
.. .. ..113 131 34344.0 90.0 72.3
100 98 994.4 98.0 89.2
4,275 78,156 19,521
.. 27.8 22.8
.. 29.7 14.8
.. 36.2 28.8
19.3 12.6 12.221.2 13.5 13.3
5.3 11.3 8.1
.. 0.68 0.4649.7 2,275.7 905.1

Economic and social contextPopulation (millions)Urban population (% of total)GNI per capita, World Bank Atlas method ($)GDP growth, 1995–2000 and 2000–09 (avg. annual %)Adult literacy rate (% ages 15 and older) Gross primary, secondary, and tertiary enrollment (%) StructureSeparate telecommunications regulatorStatus of main fixed-line telephone operatorLevel of competition (competition, partial comp., monopoly)
International long distance serviceMobile telephone serviceInternet service
Efficiency and capacityTelecommunications revenue (% of GDP)Mobile cellular and fixed-line subscribers per employeeTelecommunications investment (% of revenue) PerformanceAccessTelephone lines (per 100 people)Mobile cellular subscriptions (per 100 people)Fixed broadband Internet subscribers (per 100 people)Personal computers (per 100 people)Households with a television (%)UsageInternational voice traffic total (minutes per person per month)Mobile telephone usage (minutes per user per month)Internet users (per 100 people)QualityPopulation covered by mobile cellular network (%)Fixed broadband Internet subscribers (% of total subscribers)International Internet bandwidth (bits per second per person)AffordabilityResidential fixed line tariff ($ a month)Mobile cellular prepaid tariff ($ a month)Fixed broadband Internet access tariff ($ a month)TradeICT goods exports (% of total goods exports)ICT goods imports (% of total goods imports)ICT service exports (% of total service exports)ApplicationsE-gov’t Web measure index (0–1, 1=highest presence)Secure Internet servers (per million people)
156 2011 The Little Data Book on Information and Communication Technology
High income
Country dataHigh-
income group
2000 2009 2009
Netherlands Antilles
0.18 0.20 1,11790 93 77
.. .. 37,990
.. .. 2.0
.. 96 9890 88 91
.. No
.. ..
.. ..
.. ..
.. ..
.. .. 3.0
.. .. 765
.. .. 15.5
44.3 44.9 45.116.5 108.6 111.2
.. .. 24.3
.. .. 65.4
.. .. 98
.. .. ..
.. .. 3431.1 .. 72.3
.. .. 99
.. .. 89.2
.. .. 19,521
.. .. 22.8
.. .. 14.8
.. .. 28.8
.. 3.3 12.2
.. 8.7 13.31.2 1.6 8.1
.. .. 0.46166.3 1,111.0 905.1

Economic and social contextPopulation (millions)Urban population (% of total)GNI per capita, World Bank Atlas method ($)GDP growth, 1995–2000 and 2000–09 (avg. annual %)Adult literacy rate (% ages 15 and older) Gross primary, secondary, and tertiary enrollment (%) StructureSeparate telecommunications regulatorStatus of main fixed-line telephone operatorLevel of competition (competition, partial comp., monopoly)
International long distance serviceMobile telephone serviceInternet service
Efficiency and capacityTelecommunications revenue (% of GDP)Mobile cellular and fixed-line subscribers per employeeTelecommunications investment (% of revenue) PerformanceAccessTelephone lines (per 100 people)Mobile cellular subscriptions (per 100 people)Fixed broadband Internet subscribers (per 100 people)Personal computers (per 100 people)Households with a television (%)UsageInternational voice traffic, total (minutes per person per month)Mobile telephone usage (minutes per user per month)Internet users (per 100 people)QualityPopulation covered by mobile cellular network (%)Fixed broadband Internet subscribers (% of total subscribers)International Internet bandwidth (bits per second per person)AffordabilityResidential fixed line tariff ($ a month)Mobile cellular prepaid tariff ($ a month)Fixed broadband Internet access tariff ($ a month)TradeICT goods exports (% of total goods exports)ICT goods imports (% of total goods imports)ICT service exports (% of total service exports)ApplicationsE-gov’t Web measure index (0–1, 1=highest presence)Secure Internet servers (per million people)
157The Little Data Book on Information and Communication Technology 2011
High income
Country dataHigh-
income group
2000 2009 2009
New Caledonia
0.21 0.25 1,11762 65 77
14,020 .. 37,9900.2 .. 2.0
.. 96 98
.. .. 91
.. No
.. ..
.. ..
.. ..
.. ..
2.8 .. 3.0345 637 76543.5 .. 15.5
23.9 26.3 45.123.4 83.1 111.2
4.2 10.8 24.36.4 17.1 65.4
.. .. 98
.. .. ..
.. .. 34314.1 34.0 72.3
85 90 990.0 95.7 89.2
9 4,053 19,521
.. .. 22.8
.. .. 14.8
.. .. 28.8
0.5 0.3 12.26.2 3.7 13.31.6 0.2 8.1
.. .. 0.4632.2 98.4 905.1

Economic and social contextPopulation (millions)Urban population (% of total)GNI per capita, World Bank Atlas method ($)GDP growth, 1995–2000 and 2000–09 (avg. annual %)Adult literacy rate (% ages 15 and older) Gross primary, secondary, and tertiary enrollment (%) StructureSeparate telecommunications regulatorStatus of main fixed-line telephone operatorLevel of competition (competition, partial comp., monopoly)
International long distance serviceMobile telephone serviceInternet service
Efficiency and capacityTelecommunications revenue (% of GDP)Mobile cellular and fixed-line subscribers per employeeTelecommunications investment (% of revenue) PerformanceAccessTelephone lines (per 100 people)Mobile cellular subscriptions (per 100 people)Fixed broadband Internet subscribers (per 100 people)Personal computers (per 100 people)Households with a television (%)UsageInternational voice traffic total (minutes per person per month)Mobile telephone usage (minutes per user per month)Internet users (per 100 people)QualityPopulation covered by mobile cellular network (%)Fixed broadband Internet subscribers (% of total subscribers)International Internet bandwidth (bits per second per person)AffordabilityResidential fixed line tariff ($ a month)Mobile cellular prepaid tariff ($ a month)Fixed broadband Internet access tariff ($ a month)TradeICT goods exports (% of total goods exports)ICT goods imports (% of total goods imports)ICT service exports (% of total service exports)ApplicationsE-gov’t Web measure index (0–1, 1=highest presence)Secure Internet servers (per million people)
158 2011 The Little Data Book on Information and Communication Technology
High income
Country dataHigh-
income group
2000 2009 2009
New Zealand
4 4 1,11786 87 77
13,620 28,810 37,9902.5 2.5 2.0
.. .. 9897 108 91
.. YesPrivate Private
C CC CC C
3.4 2.9 3.0630 605 76516.2 22.2 15.5
47.5 43.3 45.140.0 108.9 111.213.0 32.8 24.335.8 52.6 65.4
98 99 98
.. .. ..87 83 343
47.5 83.4 72.3
97 97 990.9 69.3 89.265 4,544 19,521
.. 33.1 22.8
.. 27.9 14.8
.. 28.5 28.8
2.2 1.8 12.212.6 9.4 13.3
6.2 4.8 8.1
.. 0.64 0.46156.9 1,488.5 905.1

Economic and social contextPopulation (millions)Urban population (% of total)GNI per capita, World Bank Atlas method ($)GDP growth, 1995–2000 and 2000–09 (avg. annual %)Adult literacy rate (% ages 15 and older) Gross primary, secondary, and tertiary enrollment (%) StructureSeparate telecommunications regulatorStatus of main fixed-line telephone operatorLevel of competition (competition, partial comp., monopoly)
International long distance serviceMobile telephone serviceInternet service
Efficiency and capacityTelecommunications revenue (% of GDP)Mobile cellular and fixed-line subscribers per employeeTelecommunications investment (% of revenue) PerformanceAccessTelephone lines (per 100 people)Mobile cellular subscriptions (per 100 people)Fixed broadband Internet subscribers (per 100 people)Personal computers (per 100 people)Households with a television (%)UsageInternational voice traffic, total (minutes per person per month)Mobile telephone usage (minutes per user per month)Internet users (per 100 people)QualityPopulation covered by mobile cellular network (%)Fixed broadband Internet subscribers (% of total subscribers)International Internet bandwidth (bits per second per person)AffordabilityResidential fixed line tariff ($ a month)Mobile cellular prepaid tariff ($ a month)Fixed broadband Internet access tariff ($ a month)TradeICT goods exports (% of total goods exports)ICT goods imports (% of total goods imports)ICT service exports (% of total service exports)ApplicationsE-gov’t Web measure index (0–1, 1=highest presence)Secure Internet servers (per million people)
159The Little Data Book on Information and Communication Technology 2011
Latin America & Caribbean Lower middle income
Country data
Lower middle-income group
2000 2009 2009
Nicaragua
5 6 3,81155 57 41
730 1,000 2,3215.0 3.3 8.577 78 8068 73 64
Yes YesPublic Private
M CC CC C
2.6 3.7 3.0114 334 6055.9 24.0 22.4
3.2 4.4 12.71.8 55.8 57.80.3 0.4 5.52.4 4.0 4.559 67 ..
.. .. ..
.. .. 3421.0 3.5 17.2
.. 70 774.5 80.6 40.1
1 144 151
.. 4.7 4.7
.. 14.0 7.1
.. 34.4 30.4
0.1 0.4 21.34.1 4.4 18.4
11.3 7.2 19.9
.. 0.25 0.241.2 7.7 2.7

Economic and social contextPopulation (millions)Urban population (% of total)GNI per capita, World Bank Atlas method ($)GDP growth, 1995–2000 and 2000–09 (avg. annual %)Adult literacy rate (% ages 15 and older) Gross primary, secondary, and tertiary enrollment (%) StructureSeparate telecommunications regulatorStatus of main fixed-line telephone operatorLevel of competition (competition, partial comp., monopoly)
International long distance serviceMobile telephone serviceInternet service
Efficiency and capacityTelecommunications revenue (% of GDP)Mobile cellular and fixed-line subscribers per employeeTelecommunications investment (% of revenue) PerformanceAccessTelephone lines (per 100 people)Mobile cellular subscriptions (per 100 people)Fixed broadband Internet subscribers (per 100 people)Personal computers (per 100 people)Households with a television (%)UsageInternational voice traffic total (minutes per person per month)Mobile telephone usage (minutes per user per month)Internet users (per 100 people)QualityPopulation covered by mobile cellular network (%)Fixed broadband Internet subscribers (% of total subscribers)International Internet bandwidth (bits per second per person)AffordabilityResidential fixed line tariff ($ a month)Mobile cellular prepaid tariff ($ a month)Fixed broadband Internet access tariff ($ a month)TradeICT goods exports (% of total goods exports)ICT goods imports (% of total goods imports)ICT service exports (% of total service exports)ApplicationsE-gov’t Web measure index (0–1, 1=highest presence)Secure Internet servers (per million people)
160 2011 The Little Data Book on Information and Communication Technology
Country dataLow-
income group
2000 2009 2009
Sub-Saharan Africa Low income
Niger
11 15 84616 17 29
170 340 5093.4 4.3 5.4
9 29 6216 29 56
.. YesPublic Mixed
M MC CC M
0.9 2.2 2.916 328 301
.. .. ..
0.2 0.4 1.20.0 17.0 26.60.0 0.0 0.10.0 0.1 0.9
6 10 ..
.. .. ..
.. .. ..0.0 0.8 2.7
13 45 530.0 5.9 5.4
0 11 7
.. 12.9 8.8
.. 15.3 8.0
.. 265.9 89.9
0.2 0.7 0.62.1 3.6 5.90.5 11.6 6.5
.. 0.04 0.09
.. 0.2 0.6

Economic and social contextPopulation (millions)Urban population (% of total)GNI per capita, World Bank Atlas method ($)GDP growth, 1995–2000 and 2000–09 (avg. annual %)Adult literacy rate (% ages 15 and older) Gross primary, secondary, and tertiary enrollment (%) StructureSeparate telecommunications regulatorStatus of main fixed-line telephone operatorLevel of competition (competition, partial comp., monopoly)
International long distance serviceMobile telephone serviceInternet service
Efficiency and capacityTelecommunications revenue (% of GDP)Mobile cellular and fixed-line subscribers per employeeTelecommunications investment (% of revenue) PerformanceAccessTelephone lines (per 100 people)Mobile cellular subscriptions (per 100 people)Fixed broadband Internet subscribers (per 100 people)Personal computers (per 100 people)Households with a television (%)UsageInternational voice traffic, total (minutes per person per month)Mobile telephone usage (minutes per user per month)Internet users (per 100 people)QualityPopulation covered by mobile cellular network (%)Fixed broadband Internet subscribers (% of total subscribers)International Internet bandwidth (bits per second per person)AffordabilityResidential fixed line tariff ($ a month)Mobile cellular prepaid tariff ($ a month)Fixed broadband Internet access tariff ($ a month)TradeICT goods exports (% of total goods exports)ICT goods imports (% of total goods imports)ICT service exports (% of total service exports)ApplicationsE-gov’t Web measure index (0–1, 1=highest presence)Secure Internet servers (per million people)
161The Little Data Book on Information and Communication Technology 2011
Country data
Lower middle-income group
2000 2009 2009
Sub-Saharan Africa Lower middle income
Nigeria
125 155 3,81143 49 41
270 1,190 2,3212.7 6.6 8.5
.. 61 8049 51 64
Yes YesPublic Public
M CC CC C
0.8 3.4 3.050 256 605
37.2 7.8 22.4
0.4 0.9 12.70.0 47.2 57.80.0 0.6 5.50.6 0.9 4.5
.. 39 ..
.. 2.2 ..
.. .. 3420.1 28.4 17.2
38 83 770.0 9.1 40.1
0 5 151
.. 5.7 4.7
.. 10.4 7.1
.. 105.0 30.4
0.0 0.0 21.33.4 7.2 18.4
.. 1.6 19.9
.. 0.10 0.240.0 1.2 2.7

Economic and social contextPopulation (millions)Urban population (% of total)GNI per capita, World Bank Atlas method ($)GDP growth, 1995–2000 and 2000–09 (avg. annual %)Adult literacy rate (% ages 15 and older) Gross primary, secondary, and tertiary enrollment (%) StructureSeparate telecommunications regulatorStatus of main fixed-line telephone operatorLevel of competition (competition, partial comp., monopoly)
International long distance serviceMobile telephone serviceInternet service
Efficiency and capacityTelecommunications revenue (% of GDP)Mobile cellular and fixed-line subscribers per employeeTelecommunications investment (% of revenue) PerformanceAccessTelephone lines (per 100 people)Mobile cellular subscriptions (per 100 people)Fixed broadband Internet subscribers (per 100 people)Personal computers (per 100 people)Households with a television (%)UsageInternational voice traffic total (minutes per person per month)Mobile telephone usage (minutes per user per month)Internet users (per 100 people)QualityPopulation covered by mobile cellular network (%)Fixed broadband Internet subscribers (% of total subscribers)International Internet bandwidth (bits per second per person)AffordabilityResidential fixed line tariff ($ a month)Mobile cellular prepaid tariff ($ a month)Fixed broadband Internet access tariff ($ a month)TradeICT goods exports (% of total goods exports)ICT goods imports (% of total goods imports)ICT service exports (% of total service exports)ApplicationsE-gov’t Web measure index (0–1, 1=highest presence)Secure Internet servers (per million people)
162 2011 The Little Data Book on Information and Communication Technology
High income
Country dataHigh-
income group
2000 2009 2009
Northern Mariana Islands
0.07 0.09 1,11790 91 77
.. .. 37,990
.. .. 2.0
.. .. 98
.. .. 91
.. No
.. ..
.. ..
.. ..
.. ..
.. .. 3.0
.. .. 765
.. .. 15.5
30.4 28.9 45.14.3 26.2 111.23.4 .. 24.3
.. .. 65.4
.. .. 98
.. .. ..
.. .. 343
.. .. 72.3
.. .. 99
.. .. 89.2
.. .. 19,521
.. .. 22.8
.. .. 14.8
.. .. 28.8
.. .. 12.2
.. .. 13.3
.. .. 8.1
.. .. 0.4628.1 56.6 905.1

Economic and social contextPopulation (millions)Urban population (% of total)GNI per capita, World Bank Atlas method ($)GDP growth, 1995–2000 and 2000–09 (avg. annual %)Adult literacy rate (% ages 15 and older) Gross primary, secondary, and tertiary enrollment (%) StructureSeparate telecommunications regulatorStatus of main fixed-line telephone operatorLevel of competition (competition, partial comp., monopoly)
International long distance serviceMobile telephone serviceInternet service
Efficiency and capacityTelecommunications revenue (% of GDP)Mobile cellular and fixed-line subscribers per employeeTelecommunications investment (% of revenue) PerformanceAccessTelephone lines (per 100 people)Mobile cellular subscriptions (per 100 people)Fixed broadband Internet subscribers (per 100 people)Personal computers (per 100 people)Households with a television (%)UsageInternational voice traffic, total (minutes per person per month)Mobile telephone usage (minutes per user per month)Internet users (per 100 people)QualityPopulation covered by mobile cellular network (%)Fixed broadband Internet subscribers (% of total subscribers)International Internet bandwidth (bits per second per person)AffordabilityResidential fixed line tariff ($ a month)Mobile cellular prepaid tariff ($ a month)Fixed broadband Internet access tariff ($ a month)TradeICT goods exports (% of total goods exports)ICT goods imports (% of total goods imports)ICT service exports (% of total service exports)ApplicationsE-gov’t Web measure index (0–1, 1=highest presence)Secure Internet servers (per million people)
163The Little Data Book on Information and Communication Technology 2011
High income
Country dataHigh-
income group
2000 2009 2009
Norway
4 5 1,11776 78 77
35,870 84,640 37,9903.6 2.1 2.0
.. .. 9898 98 91
Yes YesPublic Mixed
C CP CC C
1.4 1.2 3.0251 445 76589.3 .. 15.5
53.5 39.4 45.171.8 110.5 111.226.2 35.9 24.349.0 62.9 65.4
.. 95 98
.. .. ..163 232 34326.7 91.8 72.3
96 .. 992.0 92.7 89.2
875 26,904 19,521
.. 29.4 22.8
.. 8.7 14.8
.. 51.0 28.8
2.4 2.4 12.210.6 8.8 13.3
5.4 8.6 8.1
.. 0.74 0.4681.8 1,653.3 905.1

Economic and social contextPopulation (millions)Urban population (% of total)GNI per capita, World Bank Atlas method ($)GDP growth, 1995–2000 and 2000–09 (avg. annual %)Adult literacy rate (% ages 15 and older) Gross primary, secondary, and tertiary enrollment (%) StructureSeparate telecommunications regulatorStatus of main fixed-line telephone operatorLevel of competition (competition, partial comp., monopoly)
International long distance serviceMobile telephone serviceInternet service
Efficiency and capacityTelecommunications revenue (% of GDP)Mobile cellular and fixed-line subscribers per employeeTelecommunications investment (% of revenue) PerformanceAccessTelephone lines (per 100 people)Mobile cellular subscriptions (per 100 people)Fixed broadband Internet subscribers (per 100 people)Personal computers (per 100 people)Households with a television (%)UsageInternational voice traffic total (minutes per person per month)Mobile telephone usage (minutes per user per month)Internet users (per 100 people)QualityPopulation covered by mobile cellular network (%)Fixed broadband Internet subscribers (% of total subscribers)International Internet bandwidth (bits per second per person)AffordabilityResidential fixed line tariff ($ a month)Mobile cellular prepaid tariff ($ a month)Fixed broadband Internet access tariff ($ a month)TradeICT goods exports (% of total goods exports)ICT goods imports (% of total goods imports)ICT service exports (% of total service exports)ApplicationsE-gov’t Web measure index (0–1, 1=highest presence)Secure Internet servers (per million people)
164 2011 The Little Data Book on Information and Communication Technology
High income
Country dataHigh-
income group
2000 2009 2009
Oman
2 3 1,11772 72 77
6,720 17,890 37,9903.2 4.5 2.0
.. 87 9868 66 91
No YesPublic Mixed
M CM C.. C
1.9 2.5 3.0186 967 76519.0 65.8 15.5
9.2 10.5 45.16.7 139.5 111.21.0 2.7 24.33.3 16.9 65.4
.. 88 98
.. 35.9 ..
.. .. 3433.5 43.5 72.3
91 96 990.0 52.6 89.216 1,365 19,521
.. 12.8 22.8
.. 6.2 14.8
.. 31.3 28.8
0.6 1.5 12.23.7 3.2 13.3
.. .. 8.1
.. 0.37 0.460.8 26.5 905.1

Economic and social contextPopulation (millions)Urban population (% of total)GNI per capita, World Bank Atlas method ($)GDP growth, 1995–2000 and 2000–09 (avg. annual %)Adult literacy rate (% ages 15 and older) Gross primary, secondary, and tertiary enrollment (%) StructureSeparate telecommunications regulatorStatus of main fixed-line telephone operatorLevel of competition (competition, partial comp., monopoly)
International long distance serviceMobile telephone serviceInternet service
Efficiency and capacityTelecommunications revenue (% of GDP)Mobile cellular and fixed-line subscribers per employeeTelecommunications investment (% of revenue) PerformanceAccessTelephone lines (per 100 people)Mobile cellular subscriptions (per 100 people)Fixed broadband Internet subscribers (per 100 people)Personal computers (per 100 people)Households with a television (%)UsageInternational voice traffic, total (minutes per person per month)Mobile telephone usage (minutes per user per month)Internet users (per 100 people)QualityPopulation covered by mobile cellular network (%)Fixed broadband Internet subscribers (% of total subscribers)International Internet bandwidth (bits per second per person)AffordabilityResidential fixed line tariff ($ a month)Mobile cellular prepaid tariff ($ a month)Fixed broadband Internet access tariff ($ a month)TradeICT goods exports (% of total goods exports)ICT goods imports (% of total goods imports)ICT service exports (% of total service exports)ApplicationsE-gov’t Web measure index (0–1, 1=highest presence)Secure Internet servers (per million people)
165The Little Data Book on Information and Communication Technology 2011
Country data
Lower middle-income group
2000 2009 2009
South Asia Lower middle income
Pakistan
138 170 3,81133 37 41
490 1,000 2,3213.0 5.2 8.543 56 80
.. 42 64
Yes YesMixed Mixed
M CP CC C
1.8 2.7 3.050 50 605
19.5 1.7 22.4
2.2 2.4 12.70.2 60.7 57.80.1 2.2 5.50.4 .. 4.540 58 ..
.. .. ..
.. 181 3421.4 12.0 17.2
27 90 770.0 4.5 40.1
0 43 151
.. 2.9 4.7
.. 1.0 7.1
.. 14.6 30.4
.. 0.3 21.3
.. 3.7 18.415.4 12.0 19.9
.. 0.25 0.240.0 1.0 2.7

Economic and social contextPopulation (millions)Urban population (% of total)GNI per capita, World Bank Atlas method ($)GDP growth, 1995–2000 and 2000–09 (avg. annual %)Adult literacy rate (% ages 15 and older) Gross primary, secondary, and tertiary enrollment (%) StructureSeparate telecommunications regulatorStatus of main fixed-line telephone operatorLevel of competition (competition, partial comp., monopoly)
International long distance serviceMobile telephone serviceInternet service
Efficiency and capacityTelecommunications revenue (% of GDP)Mobile cellular and fixed-line subscribers per employeeTelecommunications investment (% of revenue) PerformanceAccessTelephone lines (per 100 people)Mobile cellular subscriptions (per 100 people)Fixed broadband Internet subscribers (per 100 people)Personal computers (per 100 people)Households with a television (%)UsageInternational voice traffic total (minutes per person per month)Mobile telephone usage (minutes per user per month)Internet users (per 100 people)QualityPopulation covered by mobile cellular network (%)Fixed broadband Internet subscribers (% of total subscribers)International Internet bandwidth (bits per second per person)AffordabilityResidential fixed line tariff ($ a month)Mobile cellular prepaid tariff ($ a month)Fixed broadband Internet access tariff ($ a month)TradeICT goods exports (% of total goods exports)ICT goods imports (% of total goods imports)ICT service exports (% of total service exports)ApplicationsE-gov’t Web measure index (0–1, 1=highest presence)Secure Internet servers (per million people)
166 2011 The Little Data Book on Information and Communication Technology
Country data
Upper middle-income group
2000 2009 2009
East Asia & Pacific Upper middle income
Palau
0.02 0.02 1,00270 82 75
6,260 6,220 7,5021.2 1.2 4.4
.. .. 92
.. 97 82
.. No
.. ..
.. ..
.. ..
.. ..
4.4 5.6 3.3.. 204 576.. 11.3 18.0
34.7 34.6 22.112.3 64.5 100.6
5.2 5.1 19.4.. .. 11.2.. .. 93
.. 39.6 ..
.. .. 15720.0 27.3 34.6
.. 95 940.0 16.1 41.6
150 1,128 1,120
.. .. 10.0
.. .. 8.8
.. .. 18.8
.. .. 12.2
.. .. 15.1
.. .. 5.4
.. 0.05 0.3051.0 48.7 32.2

Economic and social contextPopulation (millions)Urban population (% of total)GNI per capita, World Bank Atlas method ($)GDP growth, 1995–2000 and 2000–09 (avg. annual %)Adult literacy rate (% ages 15 and older) Gross primary, secondary, and tertiary enrollment (%) StructureSeparate telecommunications regulatorStatus of main fixed-line telephone operatorLevel of competition (competition, partial comp., monopoly)
International long distance serviceMobile telephone serviceInternet service
Efficiency and capacityTelecommunications revenue (% of GDP)Mobile cellular and fixed-line subscribers per employeeTelecommunications investment (% of revenue) PerformanceAccessTelephone lines (per 100 people)Mobile cellular subscriptions (per 100 people)Fixed broadband Internet subscribers (per 100 people)Personal computers (per 100 people)Households with a television (%)UsageInternational voice traffic, total (minutes per person per month)Mobile telephone usage (minutes per user per month)Internet users (per 100 people)QualityPopulation covered by mobile cellular network (%)Fixed broadband Internet subscribers (% of total subscribers)International Internet bandwidth (bits per second per person)AffordabilityResidential fixed line tariff ($ a month)Mobile cellular prepaid tariff ($ a month)Fixed broadband Internet access tariff ($ a month)TradeICT goods exports (% of total goods exports)ICT goods imports (% of total goods imports)ICT service exports (% of total service exports)ApplicationsE-gov’t Web measure index (0–1, 1=highest presence)Secure Internet servers (per million people)
167The Little Data Book on Information and Communication Technology 2011
Country data
Upper middle-income group
2000 2009 2009
Latin America & Caribbean Upper middle income
Panama
3 3 1,00266 74 75
3,740 6,570 7,5025.0 6.9 4.492 94 9276 80 82
Yes YesMixed Mixed
M CP PC C
3.8 3.2 3.3153 380 576
.. .. 18.0
14.5 15.6 22.113.9 164.4 100.6
1.5 6.2 19.43.6 6.3 11.2
.. 83 93
.. 9.9 ..
.. .. 1576.6 27.8 34.6
74 83 9416.0 94.3 41.6112 15,964 1,120
.. 12.0 10.0
.. 5.0 8.8
.. 16.6 18.8
0.1 0.0 12.28.2 7.3 15.11.7 4.8 5.4
.. 0.28 0.309.6 127.1 32.2

Economic and social contextPopulation (millions)Urban population (% of total)GNI per capita, World Bank Atlas method ($)GDP growth, 1995–2000 and 2000–09 (avg. annual %)Adult literacy rate (% ages 15 and older) Gross primary, secondary, and tertiary enrollment (%) StructureSeparate telecommunications regulatorStatus of main fixed-line telephone operatorLevel of competition (competition, partial comp., monopoly)
International long distance serviceMobile telephone serviceInternet service
Efficiency and capacityTelecommunications revenue (% of GDP)Mobile cellular and fixed-line subscribers per employeeTelecommunications investment (% of revenue) PerformanceAccessTelephone lines (per 100 people)Mobile cellular subscriptions (per 100 people)Fixed broadband Internet subscribers (per 100 people)Personal computers (per 100 people)Households with a television (%)UsageInternational voice traffic total (minutes per person per month)Mobile telephone usage (minutes per user per month)Internet users (per 100 people)QualityPopulation covered by mobile cellular network (%)Fixed broadband Internet subscribers (% of total subscribers)International Internet bandwidth (bits per second per person)AffordabilityResidential fixed line tariff ($ a month)Mobile cellular prepaid tariff ($ a month)Fixed broadband Internet access tariff ($ a month)TradeICT goods exports (% of total goods exports)ICT goods imports (% of total goods imports)ICT service exports (% of total service exports)ApplicationsE-gov’t Web measure index (0–1, 1=highest presence)Secure Internet servers (per million people)
168 2011 The Little Data Book on Information and Communication Technology
Country data
Lower middle-income group
2000 2009 2009
East Asia & Pacific Lower middle income
Papua New Guinea
5 7 3,81113 13 41
620 1,180 2,321-0.8 3.4 8.5
57 60 80.. .. 64
Yes YesPublic Public
M MM MP P
2.3 .. 3.041 .. 605
82.6 .. 22.4
1.2 0.9 12.70.2 13.4 57.80.5 .. 5.55.2 6.4 4.5
.. .. ..
.. .. ..
.. .. 3420.8 1.9 17.2
.. .. 77
.. .. 40.11 2 151
.. 4.0 4.7
.. 17.8 7.1
.. 141.8 30.4
0.0 0.1 21.33.6 4.1 18.4
.. 1.2 19.9
.. 0.07 0.24
.. 3.2 2.7

Economic and social contextPopulation (millions)Urban population (% of total)GNI per capita, World Bank Atlas method ($)GDP growth, 1995–2000 and 2000–09 (avg. annual %)Adult literacy rate (% ages 15 and older) Gross primary, secondary, and tertiary enrollment (%) StructureSeparate telecommunications regulatorStatus of main fixed-line telephone operatorLevel of competition (competition, partial comp., monopoly)
International long distance serviceMobile telephone serviceInternet service
Efficiency and capacityTelecommunications revenue (% of GDP)Mobile cellular and fixed-line subscribers per employeeTelecommunications investment (% of revenue) PerformanceAccessTelephone lines (per 100 people)Mobile cellular subscriptions (per 100 people)Fixed broadband Internet subscribers (per 100 people)Personal computers (per 100 people)Households with a television (%)UsageInternational voice traffic, total (minutes per person per month)Mobile telephone usage (minutes per user per month)Internet users (per 100 people)QualityPopulation covered by mobile cellular network (%)Fixed broadband Internet subscribers (% of total subscribers)International Internet bandwidth (bits per second per person)AffordabilityResidential fixed line tariff ($ a month)Mobile cellular prepaid tariff ($ a month)Fixed broadband Internet access tariff ($ a month)TradeICT goods exports (% of total goods exports)ICT goods imports (% of total goods imports)ICT service exports (% of total service exports)ApplicationsE-gov’t Web measure index (0–1, 1=highest presence)Secure Internet servers (per million people)
169The Little Data Book on Information and Communication Technology 2011
Country data
Lower middle-income group
2000 2009 2009
Latin America & Caribbean Lower middle income
Paraguay
5 6 3,81155 61 41
1,350 2,250 2,3210.1 3.4 8.5
.. 95 8072 72 64
Yes YesPublic Public
M CC CC C
4.6 4.8 3.0123 799 60526.3 .. 22.4
5.3 6.1 12.715.3 88.5 57.8
0.5 2.5 5.51.3 7.8 4.576 85 ..
.. .. ..62 244 3420.7 15.8 17.2
.. .. 770.5 89.8 40.1
2 662 151
.. 6.6 4.7
.. 5.3 7.1
.. 21.6 30.4
0.2 0.2 21.310.8 21.6 18.4
1.8 1.4 19.9
.. 0.26 0.240.7 6.7 2.7

Economic and social contextPopulation (millions)Urban population (% of total)GNI per capita, World Bank Atlas method ($)GDP growth, 1995–2000 and 2000–09 (avg. annual %)Adult literacy rate (% ages 15 and older) Gross primary, secondary, and tertiary enrollment (%) StructureSeparate telecommunications regulatorStatus of main fixed-line telephone operatorLevel of competition (competition, partial comp., monopoly)
International long distance serviceMobile telephone serviceInternet service
Efficiency and capacityTelecommunications revenue (% of GDP)Mobile cellular and fixed-line subscribers per employeeTelecommunications investment (% of revenue) PerformanceAccessTelephone lines (per 100 people)Mobile cellular subscriptions (per 100 people)Fixed broadband Internet subscribers (per 100 people)Personal computers (per 100 people)Households with a television (%)UsageInternational voice traffic total (minutes per person per month)Mobile telephone usage (minutes per user per month)Internet users (per 100 people)QualityPopulation covered by mobile cellular network (%)Fixed broadband Internet subscribers (% of total subscribers)International Internet bandwidth (bits per second per person)AffordabilityResidential fixed line tariff ($ a month)Mobile cellular prepaid tariff ($ a month)Fixed broadband Internet access tariff ($ a month)TradeICT goods exports (% of total goods exports)ICT goods imports (% of total goods imports)ICT service exports (% of total service exports)ApplicationsE-gov’t Web measure index (0–1, 1=highest presence)Secure Internet servers (per million people)
170 2011 The Little Data Book on Information and Communication Technology
Latin America & Caribbean Upper middle income
Country data
Upper middle-income group
2000 2009 2009
Peru
26 29 1,00271 72 75
2,050 4,200 7,5022.4 6.0 4.4
.. 90 9287 87 82
Yes YesPrivate Private
C CC CC C
2.7 3.1 3.3473 624 57622.2 22.0 18.0
6.6 10.2 22.14.9 84.7 100.60.5 3.7 19.44.0 10.1 11.272 73 93
.. 9.5 ..
.. 97 1573.1 27.7 34.6
.. 95 940.8 47.1 41.6
4 2,646 1,120
.. 14.3 10.0
.. 8.9 8.8
.. 36.5 18.8
0.4 0.1 12.210.1 8.3 15.1
5.8 3.5 5.4
.. 0.41 0.301.3 14.0 32.2
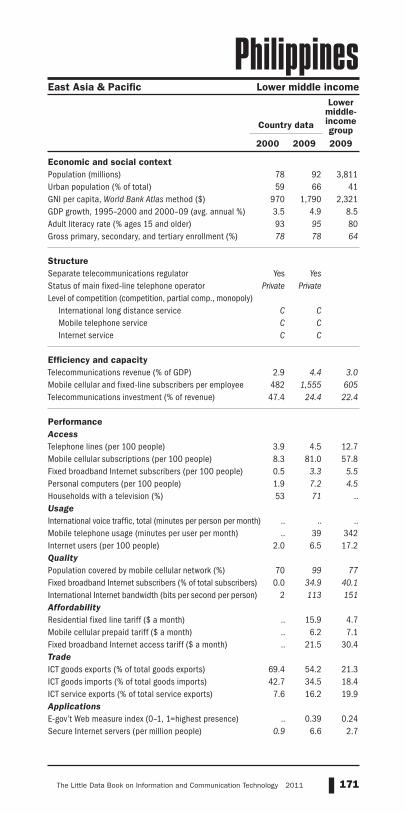
Economic and social contextPopulation (millions)Urban population (% of total)GNI per capita, World Bank Atlas method ($)GDP growth, 1995–2000 and 2000–09 (avg. annual %)Adult literacy rate (% ages 15 and older) Gross primary, secondary, and tertiary enrollment (%) StructureSeparate telecommunications regulatorStatus of main fixed-line telephone operatorLevel of competition (competition, partial comp., monopoly)
International long distance serviceMobile telephone serviceInternet service
Efficiency and capacityTelecommunications revenue (% of GDP)Mobile cellular and fixed-line subscribers per employeeTelecommunications investment (% of revenue) PerformanceAccessTelephone lines (per 100 people)Mobile cellular subscriptions (per 100 people)Fixed broadband Internet subscribers (per 100 people)Personal computers (per 100 people)Households with a television (%)UsageInternational voice traffic, total (minutes per person per month)Mobile telephone usage (minutes per user per month)Internet users (per 100 people)QualityPopulation covered by mobile cellular network (%)Fixed broadband Internet subscribers (% of total subscribers)International Internet bandwidth (bits per second per person)AffordabilityResidential fixed line tariff ($ a month)Mobile cellular prepaid tariff ($ a month)Fixed broadband Internet access tariff ($ a month)TradeICT goods exports (% of total goods exports)ICT goods imports (% of total goods imports)ICT service exports (% of total service exports)ApplicationsE-gov’t Web measure index (0–1, 1=highest presence)Secure Internet servers (per million people)
171The Little Data Book on Information and Communication Technology 2011
East Asia & Pacific Lower middle income
Country data
Lower middle-income group
2000 2009 2009
Philippines
78 92 3,81159 66 41
970 1,790 2,3213.5 4.9 8.593 95 8078 78 64
Yes YesPrivate Private
C CC CC C
2.9 4.4 3.0482 1,555 60547.4 24.4 22.4
3.9 4.5 12.78.3 81.0 57.80.5 3.3 5.51.9 7.2 4.553 71 ..
.. .. ..
.. 39 3422.0 6.5 17.2
70 99 770.0 34.9 40.1
2 113 151
.. 15.9 4.7
.. 6.2 7.1
.. 21.5 30.4
69.4 54.2 21.342.7 34.5 18.4
7.6 16.2 19.9
.. 0.39 0.240.9 6.6 2.7

Economic and social contextPopulation (millions)Urban population (% of total)GNI per capita, World Bank Atlas method ($)GDP growth, 1995–2000 and 2000–09 (avg. annual %)Adult literacy rate (% ages 15 and older) Gross primary, secondary, and tertiary enrollment (%) StructureSeparate telecommunications regulatorStatus of main fixed-line telephone operatorLevel of competition (competition, partial comp., monopoly)
International long distance serviceMobile telephone serviceInternet service
Efficiency and capacityTelecommunications revenue (% of GDP)Mobile cellular and fixed-line subscribers per employeeTelecommunications investment (% of revenue) PerformanceAccessTelephone lines (per 100 people)Mobile cellular subscriptions (per 100 people)Fixed broadband Internet subscribers (per 100 people)Personal computers (per 100 people)Households with a television (%)UsageInternational voice traffic total (minutes per person per month)Mobile telephone usage (minutes per user per month)Internet users (per 100 people)QualityPopulation covered by mobile cellular network (%)Fixed broadband Internet subscribers (% of total subscribers)International Internet bandwidth (bits per second per person)AffordabilityResidential fixed line tariff ($ a month)Mobile cellular prepaid tariff ($ a month)Fixed broadband Internet access tariff ($ a month)TradeICT goods exports (% of total goods exports)ICT goods imports (% of total goods imports)ICT service exports (% of total service exports)ApplicationsE-gov’t Web measure index (0–1, 1=highest presence)Secure Internet servers (per million people)
172 2011 The Little Data Book on Information and Communication Technology
Country dataHigh
income group
2000 2009 2009
High income
Poland
38 38 1,11762 61 77
4,590 12,260 37,9905.4 4.4 2.0
.. 100 9886 88 91
Yes YesMixed Mixed
M CP PC C
4.1 3.9 3.0256 396 76519.4 14.4 15.5
28.5 25.0 45.117.5 116.8 111.2
2.4 14.6 24.36.9 16.9 65.4
.. 98 98
.. 2.6 ..161 128 3437.3 58.8 72.3
95 99 990.0 92.6 89.220 2,748 19,521
.. 17.4 22.8
.. 9.6 14.8
.. 13.7 28.8
4.5 7.5 12.210.5 8.9 13.3
2.8 5.3 8.1
.. 0.39 0.468.5 210.8 905.1

Economic and social contextPopulation (millions)Urban population (% of total)GNI per capita, World Bank Atlas method ($)GDP growth, 1995–2000 and 2000–09 (avg. annual %)Adult literacy rate (% ages 15 and older) Gross primary, secondary, and tertiary enrollment (%) StructureSeparate telecommunications regulatorStatus of main fixed-line telephone operatorLevel of competition (competition, partial comp., monopoly)
International long distance serviceMobile telephone serviceInternet service
Efficiency and capacityTelecommunications revenue (% of GDP)Mobile cellular and fixed-line subscribers per employeeTelecommunications investment (% of revenue) PerformanceAccessTelephone lines (per 100 people)Mobile cellular subscriptions (per 100 people)Fixed broadband Internet subscribers (per 100 people)Personal computers (per 100 people)Households with a television (%)UsageInternational voice traffic, total (minutes per person per month)Mobile telephone usage (minutes per user per month)Internet users (per 100 people)QualityPopulation covered by mobile cellular network (%)Fixed broadband Internet subscribers (% of total subscribers)International Internet bandwidth (bits per second per person)AffordabilityResidential fixed line tariff ($ a month)Mobile cellular prepaid tariff ($ a month)Fixed broadband Internet access tariff ($ a month)TradeICT goods exports (% of total goods exports)ICT goods imports (% of total goods imports)ICT service exports (% of total service exports)ApplicationsE-gov’t Web measure index (0–1, 1=highest presence)Secure Internet servers (per million people)
173The Little Data Book on Information and Communication Technology 2011
Country dataHigh-
income group
2000 2009 2009
High income
Portugal
10 11 1,11754 60 77
12,070 21,910 37,9904.3 0.8 2.0
.. 95 9891 91 91
Yes YesMixed Mixed
C CP CC C
4.3 4.5 3.0594 1,534 76522.7 16.3 15.5
42.3 38.1 45.165.2 142.8 111.2
6.3 17.9 24.310.3 18.2 65.4
.. 99 98
.. .. ..133 125 34316.4 48.6 72.3
99 99 990.0 98.3 89.249 4,790 19,521
.. 27.5 22.8
.. 9.2 14.8
.. 29.0 28.8
7.8 4.6 12.29.0 6.6 13.32.6 4.5 8.1
.. 0.39 0.4613.4 173.6 905.1

Economic and social contextPopulation (millions)Urban population (% of total)GNI per capita, World Bank Atlas method ($)GDP growth, 1995–2000 and 2000–09 (avg. annual %)Adult literacy rate (% ages 15 and older) Gross primary, secondary, and tertiary enrollment (%) StructureSeparate telecommunications regulatorStatus of main fixed-line telephone operatorLevel of competition (competition, partial comp., monopoly)
International long distance serviceMobile telephone serviceInternet service
Efficiency and capacityTelecommunications revenue (% of GDP)Mobile cellular and fixed-line subscribers per employeeTelecommunications investment (% of revenue) PerformanceAccessTelephone lines (per 100 people)Mobile cellular subscriptions (per 100 people)Fixed broadband Internet subscribers (per 100 people)Personal computers (per 100 people)Households with a television (%)UsageInternational voice traffic total (minutes per person per month)Mobile telephone usage (minutes per user per month)Internet users (per 100 people)QualityPopulation covered by mobile cellular network (%)Fixed broadband Internet subscribers (% of total subscribers)International Internet bandwidth (bits per second per person)AffordabilityResidential fixed line tariff ($ a month)Mobile cellular prepaid tariff ($ a month)Fixed broadband Internet access tariff ($ a month)TradeICT goods exports (% of total goods exports)ICT goods imports (% of total goods imports)ICT service exports (% of total service exports)ApplicationsE-gov’t Web measure index (0–1, 1=highest presence)Secure Internet servers (per million people)
174 2011 The Little Data Book on Information and Communication Technology
High income
Country dataHigh-
income group
2000 2009 2009
Puerto Rico
4 4 1,11795 99 77
10,560 .. 37,9904.4 .. 2.0
.. 90 98
.. .. 91
.. No
.. ..
.. ..
.. ..
.. ..
3.2 .. 3.0455 .. 765
.. .. 15.5
34.1 21.9 45.134.6 68.5 111.2
6.6 13.0 24.30.7 0.8 65.4
.. .. 98
.. .. ..
.. 1,739 34310.5 25.2 72.3
.. 100 998.9 83.0 89.220 1,764 19,521
.. .. 22.8
.. .. 14.8
.. .. 28.8
.. .. 12.2
.. .. 13.3
.. .. 8.1
.. .. 0.4616.4 83.7 905.1

Economic and social contextPopulation (millions)Urban population (% of total)GNI per capita, World Bank Atlas method ($)GDP growth, 1995–2000 and 2000–09 (avg. annual %)Adult literacy rate (% ages 15 and older) Gross primary, secondary, and tertiary enrollment (%) StructureSeparate telecommunications regulatorStatus of main fixed-line telephone operatorLevel of competition (competition, partial comp., monopoly)
International long distance serviceMobile telephone serviceInternet service
Efficiency and capacityTelecommunications revenue (% of GDP)Mobile cellular and fixed-line subscribers per employeeTelecommunications investment (% of revenue) PerformanceAccessTelephone lines (per 100 people)Mobile cellular subscriptions (per 100 people)Fixed broadband Internet subscribers (per 100 people)Personal computers (per 100 people)Households with a television (%)UsageInternational voice traffic, total (minutes per person per month)Mobile telephone usage (minutes per user per month)Internet users (per 100 people)QualityPopulation covered by mobile cellular network (%)Fixed broadband Internet subscribers (% of total subscribers)International Internet bandwidth (bits per second per person)AffordabilityResidential fixed line tariff ($ a month)Mobile cellular prepaid tariff ($ a month)Fixed broadband Internet access tariff ($ a month)TradeICT goods exports (% of total goods exports)ICT goods imports (% of total goods imports)ICT service exports (% of total service exports)ApplicationsE-gov’t Web measure index (0–1, 1=highest presence)Secure Internet servers (per million people)
175The Little Data Book on Information and Communication Technology 2011
High income
Country dataHigh-
income group
2000 2009 2009
Qatar
0.62 1 1,11795 96 77
.. .. 37,990
.. 14.2 2.0
.. 95 9877 61 91
.. YesMixed Mixed
M PM PM P
1.9 1.7 3.0169 597 76510.8 22.5 15.5
26.0 20.2 45.119.6 175.4 111.2
1.7 9.9 24.314.6 15.7 65.4
.. .. 98
.. .. ..
.. .. 3434.9 28.3 72.3
95 100 990.0 93.4 89.269 2,044 19,521
.. 9.1 22.8
.. 8.6 14.8
.. 54.9 28.8
0.1 0.0 12.25.1 8.2 13.3
.. .. 8.1
.. 0.28 0.464.6 99.4 905.1

Economic and social contextPopulation (millions)Urban population (% of total)GNI per capita, World Bank Atlas method ($)GDP growth, 1995–2000 and 2000–09 (avg. annual %)Adult literacy rate (% ages 15 and older) Gross primary, secondary, and tertiary enrollment (%) StructureSeparate telecommunications regulatorStatus of main fixed-line telephone operatorLevel of competition (competition, partial comp., monopoly)
International long distance serviceMobile telephone serviceInternet service
Efficiency and capacityTelecommunications revenue (% of GDP)Mobile cellular and fixed-line subscribers per employeeTelecommunications investment (% of revenue) PerformanceAccessTelephone lines (per 100 people)Mobile cellular subscriptions (per 100 people)Fixed broadband Internet subscribers (per 100 people)Personal computers (per 100 people)Households with a television (%)UsageInternational voice traffic total (minutes per person per month)Mobile telephone usage (minutes per user per month)Internet users (per 100 people)QualityPopulation covered by mobile cellular network (%)Fixed broadband Internet subscribers (% of total subscribers)International Internet bandwidth (bits per second per person)AffordabilityResidential fixed line tariff ($ a month)Mobile cellular prepaid tariff ($ a month)Fixed broadband Internet access tariff ($ a month)TradeICT goods exports (% of total goods exports)ICT goods imports (% of total goods imports)ICT service exports (% of total service exports)ApplicationsE-gov’t Web measure index (0–1, 1=highest presence)Secure Internet servers (per million people)
176 2011 The Little Data Book on Information and Communication Technology
Country data
Upper middle-income group
2000 2009 2009
Europe & Central Asia Upper middle income
Romania
22 21 1,00254 54 75
1,690 8,330 7,502-2.1 5.6 4.4
97 98 9268 82 82
No YesMixed Mixed
M CC CC C
2.3 3.4 3.3151 564 57667.8 21.5 18.0
17.4 24.7 22.111.1 118.1 100.6
1.7 13.1 19.43.2 19.2 11.2
.. 97 93
.. 10.3 ..
.. 146 1573.6 36.2 34.6
97 98 944.3 100.0 41.6
4 18,271 1,120
.. 19.3 10.0
.. 10.6 8.8
.. 7.2 18.8
5.3 8.4 12.212.0 9.3 15.110.8 18.9 5.4
.. 0.42 0.302.4 39.8 32.2

Economic and social contextPopulation (millions)Urban population (% of total)GNI per capita, World Bank Atlas method ($)GDP growth, 1995–2000 and 2000–09 (avg. annual %)Adult literacy rate (% ages 15 and older) Gross primary, secondary, and tertiary enrollment (%) StructureSeparate telecommunications regulatorStatus of main fixed-line telephone operatorLevel of competition (competition, partial comp., monopoly)
International long distance serviceMobile telephone serviceInternet service
Efficiency and capacityTelecommunications revenue (% of GDP)Mobile cellular and fixed-line subscribers per employeeTelecommunications investment (% of revenue) PerformanceAccessTelephone lines (per 100 people)Mobile cellular subscriptions (per 100 people)Fixed broadband Internet subscribers (per 100 people)Personal computers (per 100 people)Households with a television (%)UsageInternational voice traffic, total (minutes per person per month)Mobile telephone usage (minutes per user per month)Internet users (per 100 people)QualityPopulation covered by mobile cellular network (%)Fixed broadband Internet subscribers (% of total subscribers)International Internet bandwidth (bits per second per person)AffordabilityResidential fixed line tariff ($ a month)Mobile cellular prepaid tariff ($ a month)Fixed broadband Internet access tariff ($ a month)TradeICT goods exports (% of total goods exports)ICT goods imports (% of total goods imports)ICT service exports (% of total service exports)ApplicationsE-gov’t Web measure index (0–1, 1=highest presence)Secure Internet servers (per million people)
177The Little Data Book on Information and Communication Technology 2011
Europe & Central Asia Upper middle income
Country data
Upper middle-income group
2000 2009 2009
Russian Federation
146 142 1,00273 73 75
1,710 9,340 7,5021.2 6.0 4.499 100 92
.. 83 82
.. NoMixed Mixed
P PC C.. ..
2.0 2.6 3.383 439 576
11.5 .. 18.0
21.9 31.6 22.12.2 162.5 100.60.3 62.1 19.46.4 13.3 11.2
.. .. 93
.. .. ..137 227 1572.0 42.1 34.6
.. 95 940.0 14.6 41.621 573 1,120
.. 5.4 10.0
.. 5.8 8.8
.. 13.3 18.8
0.8 0.6 12.25.6 8.4 15.14.6 6.3 5.4
.. 0.33 0.302.0 20.3 32.2

Economic and social contextPopulation (millions)Urban population (% of total)GNI per capita, World Bank Atlas method ($)GDP growth, 1995–2000 and 2000–09 (avg. annual %)Adult literacy rate (% ages 15 and older) Gross primary, secondary, and tertiary enrollment (%) StructureSeparate telecommunications regulatorStatus of main fixed-line telephone operatorLevel of competition (competition, partial comp., monopoly)
International long distance serviceMobile telephone serviceInternet service
Efficiency and capacityTelecommunications revenue (% of GDP)Mobile cellular and fixed-line subscribers per employeeTelecommunications investment (% of revenue) PerformanceAccessTelephone lines (per 100 people)Mobile cellular subscriptions (per 100 people)Fixed broadband Internet subscribers (per 100 people)Personal computers (per 100 people)Households with a television (%)UsageInternational voice traffic total (minutes per person per month)Mobile telephone usage (minutes per user per month)Internet users (per 100 people)QualityPopulation covered by mobile cellular network (%)Fixed broadband Internet subscribers (% of total subscribers)International Internet bandwidth (bits per second per person)AffordabilityResidential fixed line tariff ($ a month)Mobile cellular prepaid tariff ($ a month)Fixed broadband Internet access tariff ($ a month)TradeICT goods exports (% of total goods exports)ICT goods imports (% of total goods imports)ICT service exports (% of total service exports)ApplicationsE-gov’t Web measure index (0–1, 1=highest presence)Secure Internet servers (per million people)
178 2011 The Little Data Book on Information and Communication Technology
Sub-Saharan Africa Low income
Country dataLow-
income group
2000 2009 2009
Rwanda
8 10 84614 19 29
250 490 50910.1 7.6 5.4
65 71 6248 65 56
No YesMixed Mixed
M PM P.. C
1.0 3.0 2.9189 1,952 30193.1 15.8 ..
0.2 0.3 1.20.5 24.3 26.60.0 1.5 0.10.1 0.3 0.9
2 3 ..
.. 0.7 ..
.. .. ..0.1 4.5 2.7
50 92 530.0 5.7 5.4
0 35 7
.. 8.1 8.8
.. 6.6 8.0
.. 88.0 89.9
0.0 1.4 0.69.3 12.3 5.90.0 0.1 6.5
.. 0.17 0.090.1 0.7 0.6

Economic and social contextPopulation (millions)Urban population (% of total)GNI per capita, World Bank Atlas method ($)GDP growth, 1995–2000 and 2000–09 (avg. annual %)Adult literacy rate (% ages 15 and older) Gross primary, secondary, and tertiary enrollment (%) StructureSeparate telecommunications regulatorStatus of main fixed-line telephone operatorLevel of competition (competition, partial comp., monopoly)
International long distance serviceMobile telephone serviceInternet service
Efficiency and capacityTelecommunications revenue (% of GDP)Mobile cellular and fixed-line subscribers per employeeTelecommunications investment (% of revenue) PerformanceAccessTelephone lines (per 100 people)Mobile cellular subscriptions (per 100 people)Fixed broadband Internet subscribers (per 100 people)Personal computers (per 100 people)Households with a television (%)UsageInternational voice traffic, total (minutes per person per month)Mobile telephone usage (minutes per user per month)Internet users (per 100 people)QualityPopulation covered by mobile cellular network (%)Fixed broadband Internet subscribers (% of total subscribers)International Internet bandwidth (bits per second per person)AffordabilityResidential fixed line tariff ($ a month)Mobile cellular prepaid tariff ($ a month)Fixed broadband Internet access tariff ($ a month)TradeICT goods exports (% of total goods exports)ICT goods imports (% of total goods imports)ICT service exports (% of total service exports)ApplicationsE-gov’t Web measure index (0–1, 1=highest presence)Secure Internet servers (per million people)
179The Little Data Book on Information and Communication Technology 2011
Country data
Lower middle-income group
2000 2009 2009
East Asia & Pacific Lower middle income
Samoa
0.18 0.18 3,81122 23 41
1,420 2,840 2,3213.3 3.5 8.5
.. 99 8072 74 64
.. Yes
.. Mixed
.. M
.. C
.. C
4.2 4.7 3.055 95 605
13.3 .. 22.4
4.8 17.8 12.71.4 84.4 57.80.2 .. 5.50.6 2.3 4.5
.. 62 ..
.. .. ..
.. .. 3420.6 5.0 17.2
.. .. 770.0 .. 40.1
1 50 151
.. 10.3 4.7
.. 8.8 7.1
.. 469.0 30.4
0.3 0.0 21.33.4 2.2 18.4
.. 3.9 19.9
.. 0.14 0.2411.3 22.4 2.7

Economic and social contextPopulation (millions)Urban population (% of total)GNI per capita, World Bank Atlas method ($)GDP growth, 1995–2000 and 2000–09 (avg. annual %)Adult literacy rate (% ages 15 and older) Gross primary, secondary, and tertiary enrollment (%) StructureSeparate telecommunications regulatorStatus of main fixed-line telephone operatorLevel of competition (competition, partial comp., monopoly)
International long distance serviceMobile telephone serviceInternet service
Efficiency and capacityTelecommunications revenue (% of GDP)Mobile cellular and fixed-line subscribers per employeeTelecommunications investment (% of revenue) PerformanceAccessTelephone lines (per 100 people)Mobile cellular subscriptions (per 100 people)Fixed broadband Internet subscribers (per 100 people)Personal computers (per 100 people)Households with a television (%)UsageInternational voice traffic total (minutes per person per month)Mobile telephone usage (minutes per user per month)Internet users (per 100 people)QualityPopulation covered by mobile cellular network (%)Fixed broadband Internet subscribers (% of total subscribers)International Internet bandwidth (bits per second per person)AffordabilityResidential fixed line tariff ($ a month)Mobile cellular prepaid tariff ($ a month)Fixed broadband Internet access tariff ($ a month)TradeICT goods exports (% of total goods exports)ICT goods imports (% of total goods imports)ICT service exports (% of total service exports)ApplicationsE-gov’t Web measure index (0–1, 1=highest presence)Secure Internet servers (per million people)
180 2011 The Little Data Book on Information and Communication Technology
High income
Country dataHigh-
income group
2000 2009 2009
San Marino
.. 0.03 1,11793 94 77
.. 50,670 37,9905.5 3.2 2.0
.. .. 98
.. .. 91
.. NoMixed Mixed
M MC C.. ..
0.4 0.4 3.0497 438 76562.9 45.6 15.5
.. 68.4 45.1
.. 76.3 111.2
.. 20.9 24.3
.. 80.0 65.4
.. .. 98
.. .. ..
.. .. 343
.. 54.1 72.3
.. 98 99
.. 75.4 89.2
.. 257,807 19,521
.. .. 22.8
.. .. 14.8
.. .. 28.8
.. .. 12.2
.. .. 13.3
.. .. 8.1
.. 0.18 0.46
.. 1,225.8 905.1

Economic and social contextPopulation (millions)Urban population (% of total)GNI per capita, World Bank Atlas method ($)GDP growth, 1995–2000 and 2000–09 (avg. annual %)Adult literacy rate (% ages 15 and older) Gross primary, secondary, and tertiary enrollment (%) StructureSeparate telecommunications regulatorStatus of main fixed-line telephone operatorLevel of competition (competition, partial comp., monopoly)
International long distance serviceMobile telephone serviceInternet service
Efficiency and capacityTelecommunications revenue (% of GDP)Mobile cellular and fixed-line subscribers per employeeTelecommunications investment (% of revenue) PerformanceAccessTelephone lines (per 100 people)Mobile cellular subscriptions (per 100 people)Fixed broadband Internet subscribers (per 100 people)Personal computers (per 100 people)Households with a television (%)UsageInternational voice traffic, total (minutes per person per month)Mobile telephone usage (minutes per user per month)Internet users (per 100 people)QualityPopulation covered by mobile cellular network (%)Fixed broadband Internet subscribers (% of total subscribers)International Internet bandwidth (bits per second per person)AffordabilityResidential fixed line tariff ($ a month)Mobile cellular prepaid tariff ($ a month)Fixed broadband Internet access tariff ($ a month)TradeICT goods exports (% of total goods exports)ICT goods imports (% of total goods imports)ICT service exports (% of total service exports)ApplicationsE-gov’t Web measure index (0–1, 1=highest presence)Secure Internet servers (per million people)
181The Little Data Book on Information and Communication Technology 2011
Country data
Lower middle-income group
2000 2009 2009
Sub-Saharan Africa Lower middle income
São Tomé and Príncipe
0.14 0.16 3,81153 61 41
.. 1,130 2,321
.. 6.3 8.585 89 80
.. 68 64
.. YesMixed Mixed
M M.. M.. M
6.6 8.0 3.043 466 605
16.6 11.8 22.4
3.3 4.8 12.70.0 39.3 57.80.3 1.6 5.51.0 3.9 4.531 36 ..
.. 4.6 ..
.. 48 3424.6 16.4 17.2
.. 20 770.0 12.2 40.114 51 151
.. 9.6 4.7
.. 7.9 7.1
.. 207.3 30.4
0.0 0.4 21.31.0 5.7 18.4
15.9 11.7 19.9
.. 0.09 0.24
.. 18.1 2.7

Economic and social contextPopulation (millions)Urban population (% of total)GNI per capita, World Bank Atlas method ($)GDP growth, 1995–2000 and 2000–09 (avg. annual %)Adult literacy rate (% ages 15 and older) Gross primary, secondary, and tertiary enrollment (%) StructureSeparate telecommunications regulatorStatus of main fixed-line telephone operatorLevel of competition (competition, partial comp., monopoly)
International long distance serviceMobile telephone serviceInternet service
Efficiency and capacityTelecommunications revenue (% of GDP)Mobile cellular and fixed-line subscribers per employeeTelecommunications investment (% of revenue) PerformanceAccessTelephone lines (per 100 people)Mobile cellular subscriptions (per 100 people)Fixed broadband Internet subscribers (per 100 people)Personal computers (per 100 people)Households with a television (%)UsageInternational voice traffic total (minutes per person per month)Mobile telephone usage (minutes per user per month)Internet users (per 100 people)QualityPopulation covered by mobile cellular network (%)Fixed broadband Internet subscribers (% of total subscribers)International Internet bandwidth (bits per second per person)AffordabilityResidential fixed line tariff ($ a month)Mobile cellular prepaid tariff ($ a month)Fixed broadband Internet access tariff ($ a month)TradeICT goods exports (% of total goods exports)ICT goods imports (% of total goods imports)ICT service exports (% of total service exports)ApplicationsE-gov’t Web measure index (0–1, 1=highest presence)Secure Internet servers (per million people)
182 2011 The Little Data Book on Information and Communication Technology
High income
Country dataHigh-
income group
2000 2009 2009
Saudi Arabia
21 25 1,11780 82 77
8,150 17,210 37,9902.3 3.8 2.079 86 98
.. 80 91
No YesPublic Mixed
M CM PC C
2.4 2.7 3.0189 1,618 76533.9 84.1 15.5
14.4 16.4 45.16.7 176.7 111.21.0 7.4 24.36.3 69.3 65.4
.. .. 98
.. .. ..
.. .. 3432.2 38.6 72.3
92 98 993.5 76.4 89.216 1,731 19,521
.. 9.2 22.8
.. 7.4 14.8
.. 26.7 28.8
0.1 0.3 12.25.1 4.6 13.3
.. .. 8.1
.. 0.31 0.460.5 18.5 905.1

Economic and social contextPopulation (millions)Urban population (% of total)GNI per capita, World Bank Atlas method ($)GDP growth, 1995–2000 and 2000–09 (avg. annual %)Adult literacy rate (% ages 15 and older) Gross primary, secondary, and tertiary enrollment (%) StructureSeparate telecommunications regulatorStatus of main fixed-line telephone operatorLevel of competition (competition, partial comp., monopoly)
International long distance serviceMobile telephone serviceInternet service
Efficiency and capacityTelecommunications revenue (% of GDP)Mobile cellular and fixed-line subscribers per employeeTelecommunications investment (% of revenue) PerformanceAccessTelephone lines (per 100 people)Mobile cellular subscriptions (per 100 people)Fixed broadband Internet subscribers (per 100 people)Personal computers (per 100 people)Households with a television (%)UsageInternational voice traffic, total (minutes per person per month)Mobile telephone usage (minutes per user per month)Internet users (per 100 people)QualityPopulation covered by mobile cellular network (%)Fixed broadband Internet subscribers (% of total subscribers)International Internet bandwidth (bits per second per person)AffordabilityResidential fixed line tariff ($ a month)Mobile cellular prepaid tariff ($ a month)Fixed broadband Internet access tariff ($ a month)TradeICT goods exports (% of total goods exports)ICT goods imports (% of total goods imports)ICT service exports (% of total service exports)ApplicationsE-gov’t Web measure index (0–1, 1=highest presence)Secure Internet servers (per million people)
183The Little Data Book on Information and Communication Technology 2011
Sub-Saharan Africa Lower middle income
Country data
Lower- middle-income group
2000 2009 2009
Senegal
10 13 3,81141 43 41
510 1,040 2,3214.4 4.3 8.539 50 8034 44 64
No YesMixed Mixed
M PP PC P
4.2 9.8 3.0324 1,859 60540.4 18.7 22.4
2.1 2.2 12.72.5 55.1 57.80.1 0.5 5.51.6 2.2 4.527 48 ..
.. 8.4 ..
.. .. 3420.4 7.4 17.2
.. 85 770.0 98.3 40.1
4 372 151
.. 24.0 4.7
.. 8.3 7.1
.. 39.9 30.4
0.2 0.4 21.33.2 4.5 18.4
13.5 15.6 19.9
.. 0.18 0.240.1 1.1 2.7

Economic and social contextPopulation (millions)Urban population (% of total)GNI per capita, World Bank Atlas method ($)GDP growth, 1995–2000 and 2000–09 (avg. annual %)Adult literacy rate (% ages 15 and older) Gross primary, secondary, and tertiary enrollment (%) StructureSeparate telecommunications regulatorStatus of main fixed-line telephone operatorLevel of competition (competition, partial comp., monopoly)
International long distance serviceMobile telephone serviceInternet service
Efficiency and capacityTelecommunications revenue (% of GDP)Mobile cellular and fixed-line subscribers per employeeTelecommunications investment (% of revenue) PerformanceAccessTelephone lines (per 100 people)Mobile cellular subscriptions (per 100 people)Fixed broadband Internet subscribers (per 100 people)Personal computers (per 100 people)Households with a television (%)UsageInternational voice traffic total (minutes per person per month)Mobile telephone usage (minutes per user per month)Internet users (per 100 people)QualityPopulation covered by mobile cellular network (%)Fixed broadband Internet subscribers (% of total subscribers)International Internet bandwidth (bits per second per person)AffordabilityResidential fixed line tariff ($ a month)Mobile cellular prepaid tariff ($ a month)Fixed broadband Internet access tariff ($ a month)TradeICT goods exports (% of total goods exports)ICT goods imports (% of total goods imports)ICT service exports (% of total service exports)ApplicationsE-gov’t Web measure index (0–1, 1=highest presence)Secure Internet servers (per million people)
184 2011 The Little Data Book on Information and Communication Technology
Europe & Central Asia Upper middle income
Country data
Upper middle-income group
2000 2009 2009
Serbia
8 7 1,00251 52 75
1,400 6,000 7,5021.5 5.0 4.4
.. .. 92
.. 78 82
.. Yes
.. Mixed
.. M
.. C
.. C
3.3 4.9 3.3.. 883 576
28.0 19.1 18.0
.. 42.4 22.1
.. 135.4 100.6
.. 11.5 19.4
.. 17.6 11.2
.. .. 93
.. 16.9 ..
.. 88 157
.. 56.1 34.6
.. 94 94
.. 70.1 41.6
.. 12,660 1,120
.. 3.9 10.0
.. 5.2 8.8
.. 13.7 18.8
0.5 2.2 12.24.5 5.4 15.1
.. 8.0 5.4
.. 0.22 0.30
.. 19.9 32.2

Economic and social contextPopulation (millions)Urban population (% of total)GNI per capita, World Bank Atlas method ($)GDP growth, 1995–2000 and 2000–09 (avg. annual %)Adult literacy rate (% ages 15 and older) Gross primary, secondary, and tertiary enrollment (%) StructureSeparate telecommunications regulatorStatus of main fixed-line telephone operatorLevel of competition (competition, partial comp., monopoly)
International long distance serviceMobile telephone serviceInternet service
Efficiency and capacityTelecommunications revenue (% of GDP)Mobile cellular and fixed-line subscribers per employeeTelecommunications investment (% of revenue) PerformanceAccessTelephone lines (per 100 people)Mobile cellular subscriptions (per 100 people)Fixed broadband Internet subscribers (per 100 people)Personal computers (per 100 people)Households with a television (%)UsageInternational voice traffic, total (minutes per person per month)Mobile telephone usage (minutes per user per month)Internet users (per 100 people)QualityPopulation covered by mobile cellular network (%)Fixed broadband Internet subscribers (% of total subscribers)International Internet bandwidth (bits per second per person)AffordabilityResidential fixed line tariff ($ a month)Mobile cellular prepaid tariff ($ a month)Fixed broadband Internet access tariff ($ a month)TradeICT goods exports (% of total goods exports)ICT goods imports (% of total goods imports)ICT service exports (% of total service exports)ApplicationsE-gov’t Web measure index (0–1, 1=highest presence)Secure Internet servers (per million people)
185The Little Data Book on Information and Communication Technology 2011
Country data
Upper middle-income group
2000 2009 2009
Sub-Saharan Africa Upper middle income
Seychelles
0.08 0.09 1,00251 55 75
7,420 8,480 7,5026.6 1.7 4.492 92 92
.. 88 82
.. NoPrivate Private
P CP PP C
6.5 4.0 3.3126 .. 57610.3 20.3 18.0
25.4 25.1 22.132.0 104.9 100.6
1.6 6.8 19.413.6 21.2 11.2
92 92 93
.. 17.2 ..
.. .. 1577.4 38.6 34.6
97 98 940.0 63.8 41.625 1,745 1,120
.. 11.2 10.0
.. 11.3 8.8
.. 57.1 18.8
0.7 0.5 12.22.2 2.9 15.1
.. 1.2 5.4
.. 0.06 0.3012.3 1,123.6 32.2

Economic and social contextPopulation (millions)Urban population (% of total)GNI per capita, World Bank Atlas method ($)GDP growth, 1995–2000 and 2000–09 (avg. annual %)Adult literacy rate (% ages 15 and older) Gross primary, secondary, and tertiary enrollment (%) StructureSeparate telecommunications regulatorStatus of main fixed-line telephone operatorLevel of competition (competition, partial comp., monopoly)
International long distance serviceMobile telephone serviceInternet service
Efficiency and capacityTelecommunications revenue (% of GDP)Mobile cellular and fixed-line subscribers per employeeTelecommunications investment (% of revenue) PerformanceAccessTelephone lines (per 100 people)Mobile cellular subscriptions (per 100 people)Fixed broadband Internet subscribers (per 100 people)Personal computers (per 100 people)Households with a television (%)UsageInternational voice traffic total (minutes per person per month)Mobile telephone usage (minutes per user per month)Internet users (per 100 people)QualityPopulation covered by mobile cellular network (%)Fixed broadband Internet subscribers (% of total subscribers)International Internet bandwidth (bits per second per person)AffordabilityResidential fixed line tariff ($ a month)Mobile cellular prepaid tariff ($ a month)Fixed broadband Internet access tariff ($ a month)TradeICT goods exports (% of total goods exports)ICT goods imports (% of total goods imports)ICT service exports (% of total service exports)ApplicationsE-gov’t Web measure index (0–1, 1=highest presence)Secure Internet servers (per million people)
186 2011 The Little Data Book on Information and Communication Technology
Country dataLow-
income group
2000 2009 2009
Sub-Saharan Africa Low income
Sierra Leone
4 6 84636 38 29
150 340 509-5.0 9.5 5.4
.. 41 6246 77 56
.. YesPublic Mixed
M MC PC P
.. .. 2.931 .. 301
.. .. ..
0.4 0.6 1.20.3 20.4 26.60.0 .. 0.1
.. .. 0.9
.. 10 ..
.. .. ..
.. .. ..0.1 0.3 2.7
.. 70 53
.. .. 5.40 .. 7
.. .. 8.8
.. .. 8.0
.. .. 89.9
.. .. 0.6
.. .. 5.90.0 2.2 6.5
.. 0.00 0.090.2 0.2 0.6

Economic and social contextPopulation (millions)Urban population (% of total)GNI per capita, World Bank Atlas method ($)GDP growth, 1995–2000 and 2000–09 (avg. annual %)Adult literacy rate (% ages 15 and older) Gross primary, secondary, and tertiary enrollment (%) StructureSeparate telecommunications regulatorStatus of main fixed-line telephone operatorLevel of competition (competition, partial comp., monopoly)
International long distance serviceMobile telephone serviceInternet service
Efficiency and capacityTelecommunications revenue (% of GDP)Mobile cellular and fixed-line subscribers per employeeTelecommunications investment (% of revenue) PerformanceAccessTelephone lines (per 100 people)Mobile cellular subscriptions (per 100 people)Fixed broadband Internet subscribers (per 100 people)Personal computers (per 100 people)Households with a television (%)UsageInternational voice traffic, total (minutes per person per month)Mobile telephone usage (minutes per user per month)Internet users (per 100 people)QualityPopulation covered by mobile cellular network (%)Fixed broadband Internet subscribers (% of total subscribers)International Internet bandwidth (bits per second per person)AffordabilityResidential fixed line tariff ($ a month)Mobile cellular prepaid tariff ($ a month)Fixed broadband Internet access tariff ($ a month)TradeICT goods exports (% of total goods exports)ICT goods imports (% of total goods imports)ICT service exports (% of total service exports)ApplicationsE-gov’t Web measure index (0–1, 1=highest presence)Secure Internet servers (per million people)
187The Little Data Book on Information and Communication Technology 2011
Country dataHigh-
income group
2000 2009 2009
High income
Singapore
4 5 1,117100 100 77
23,350 37,220 37,9905.7 6.5 2.093 95 98
.. .. 91
Yes YesMixed Mixed
C CC CC C
3.4 2.6 3.0584 .. 76514.9 12.6 15.5
48.3 37.1 45.168.2 133.4 111.221.2 22.8 24.348.2 74.3 65.4
99 .. 98
.. .. ..411 377 34332.3 73.3 72.3
100 100 998.1 90.9 89.2
558 22,783 19,521
.. 7.7 22.8
.. 3.9 14.8
.. 16.7 28.8
56.1 35.4 12.244.4 28.2 13.3
2.4 2.9 8.1
.. 0.69 0.46126.9 523.1 905.1

Economic and social contextPopulation (millions)Urban population (% of total)GNI per capita, World Bank Atlas method ($)GDP growth, 1995–2000 and 2000–09 (avg. annual %)Adult literacy rate (% ages 15 and older) Gross primary, secondary, and tertiary enrollment (%) StructureSeparate telecommunications regulatorStatus of main fixed-line telephone operatorLevel of competition (competition, partial comp., monopoly)
International long distance serviceMobile telephone serviceInternet service
Efficiency and capacityTelecommunications revenue (% of GDP)Mobile cellular and fixed-line subscribers per employeeTelecommunications investment (% of revenue) PerformanceAccessTelephone lines (per 100 people)Mobile cellular subscriptions (per 100 people)Fixed broadband Internet subscribers (per 100 people)Personal computers (per 100 people)Households with a television (%)UsageInternational voice traffic total (minutes per person per month)Mobile telephone usage (minutes per user per month)Internet users (per 100 people)QualityPopulation covered by mobile cellular network (%)Fixed broadband Internet subscribers (% of total subscribers)International Internet bandwidth (bits per second per person)AffordabilityResidential fixed line tariff ($ a month)Mobile cellular prepaid tariff ($ a month)Fixed broadband Internet access tariff ($ a month)TradeICT goods exports (% of total goods exports)ICT goods imports (% of total goods imports)ICT service exports (% of total service exports)ApplicationsE-gov’t Web measure index (0–1, 1=highest presence)Secure Internet servers (per million people)
188 2011 The Little Data Book on Information and Communication Technology
High income
Country dataHigh-
income group
2000 2009 2009
Slovak Republic
5 5 1,11756 57 77
5,370 16,130 37,9903.7 5.8 2.0
.. .. 9872 81 91
Yes YesMixed Mixed
M CC PC C
3.9 3.3 3.0191 665 765
681.4 545.6 15.5
31.5 18.9 45.123.1 101.5 111.2
1.3 15.4 24.313.7 58.1 65.4
.. 99 98
.. 19.0 ..148 112 3439.4 75.0 72.3
98 100 990.0 93.4 89.241 7,567 19,521
.. 22.7 22.8
.. 24.9 14.8
.. 28.6 28.8
3.9 17.5 12.27.8 14.7 13.34.6 8.0 8.1
.. 0.35 0.4614.7 127.6 905.1
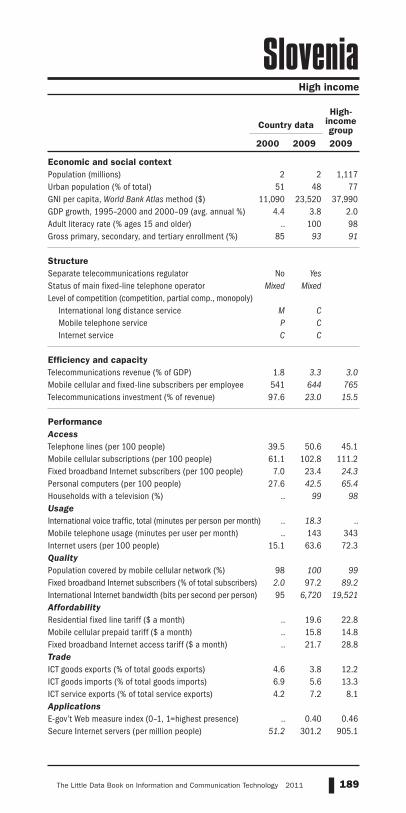
Economic and social contextPopulation (millions)Urban population (% of total)GNI per capita, World Bank Atlas method ($)GDP growth, 1995–2000 and 2000–09 (avg. annual %)Adult literacy rate (% ages 15 and older) Gross primary, secondary, and tertiary enrollment (%) StructureSeparate telecommunications regulatorStatus of main fixed-line telephone operatorLevel of competition (competition, partial comp., monopoly)
International long distance serviceMobile telephone serviceInternet service
Efficiency and capacityTelecommunications revenue (% of GDP)Mobile cellular and fixed-line subscribers per employeeTelecommunications investment (% of revenue) PerformanceAccessTelephone lines (per 100 people)Mobile cellular subscriptions (per 100 people)Fixed broadband Internet subscribers (per 100 people)Personal computers (per 100 people)Households with a television (%)UsageInternational voice traffic, total (minutes per person per month)Mobile telephone usage (minutes per user per month)Internet users (per 100 people)QualityPopulation covered by mobile cellular network (%)Fixed broadband Internet subscribers (% of total subscribers)International Internet bandwidth (bits per second per person)AffordabilityResidential fixed line tariff ($ a month)Mobile cellular prepaid tariff ($ a month)Fixed broadband Internet access tariff ($ a month)TradeICT goods exports (% of total goods exports)ICT goods imports (% of total goods imports)ICT service exports (% of total service exports)ApplicationsE-gov’t Web measure index (0–1, 1=highest presence)Secure Internet servers (per million people)
189The Little Data Book on Information and Communication Technology 2011
Country dataHigh-
income group
2000 2009 2009
High income
Slovenia
2 2 1,11751 48 77
11,090 23,520 37,9904.4 3.8 2.0
.. 100 9885 93 91
No YesMixed Mixed
M CP CC C
1.8 3.3 3.0541 644 76597.6 23.0 15.5
39.5 50.6 45.161.1 102.8 111.2
7.0 23.4 24.327.6 42.5 65.4
.. 99 98
.. 18.3 ..
.. 143 34315.1 63.6 72.3
98 100 992.0 97.2 89.295 6,720 19,521
.. 19.6 22.8
.. 15.8 14.8
.. 21.7 28.8
4.6 3.8 12.26.9 5.6 13.34.2 7.2 8.1
.. 0.40 0.4651.2 301.2 905.1

Economic and social contextPopulation (millions)Urban population (% of total)GNI per capita, World Bank Atlas method ($)GDP growth, 1995–2000 and 2000–09 (avg. annual %)Adult literacy rate (% ages 15 and older) Gross primary, secondary, and tertiary enrollment (%) StructureSeparate telecommunications regulatorStatus of main fixed-line telephone operatorLevel of competition (competition, partial comp., monopoly)
International long distance serviceMobile telephone serviceInternet service
Efficiency and capacityTelecommunications revenue (% of GDP)Mobile cellular and fixed-line subscribers per employeeTelecommunications investment (% of revenue) PerformanceAccessTelephone lines (per 100 people)Mobile cellular subscriptions (per 100 people)Fixed broadband Internet subscribers (per 100 people)Personal computers (per 100 people)Households with a television (%)UsageInternational voice traffic total (minutes per person per month)Mobile telephone usage (minutes per user per month)Internet users (per 100 people)QualityPopulation covered by mobile cellular network (%)Fixed broadband Internet subscribers (% of total subscribers)International Internet bandwidth (bits per second per person)AffordabilityResidential fixed line tariff ($ a month)Mobile cellular prepaid tariff ($ a month)Fixed broadband Internet access tariff ($ a month)TradeICT goods exports (% of total goods exports)ICT goods imports (% of total goods imports)ICT service exports (% of total service exports)ApplicationsE-gov’t Web measure index (0–1, 1=highest presence)Secure Internet servers (per million people)
190 2011 The Little Data Book on Information and Communication Technology
East Asia & Pacific Low income
Country dataLow
income group
2000 2009 2009
Solomon Islands
0.42 0.52 84616 18 29
1,000 910 509-1.9 4.5 5.4
77 .. 6240 50 56
.. YesMixed Mixed
M M.. .... ..
2.8 3.4 2.959 .. 301
167.6 .. ..
1.9 1.6 1.20.3 5.7 26.60.3 0.4 0.13.9 4.6 0.9
.. .. ..
.. .. ..
.. .. ..0.5 1.9 2.7
35 .. 530.0 23.7 5.4
1 17 7
.. .. 8.8
.. .. 8.0
.. .. 89.9
.. .. 0.6
.. .. 5.93.5 3.5 6.5
.. 0.04 0.09
.. 3.7 0.6
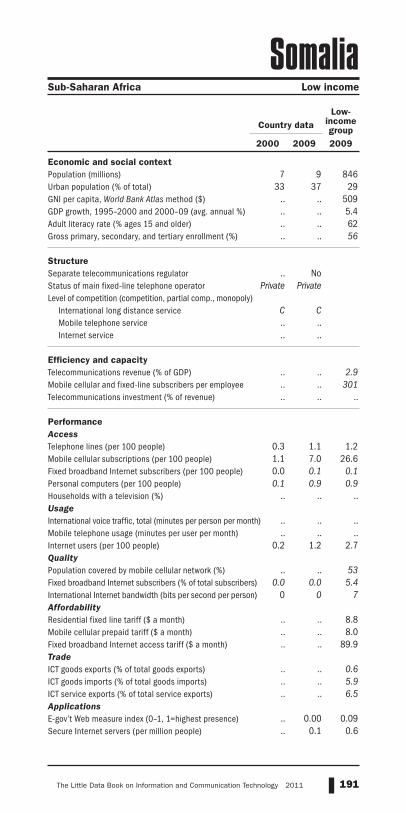
Economic and social contextPopulation (millions)Urban population (% of total)GNI per capita, World Bank Atlas method ($)GDP growth, 1995–2000 and 2000–09 (avg. annual %)Adult literacy rate (% ages 15 and older) Gross primary, secondary, and tertiary enrollment (%) StructureSeparate telecommunications regulatorStatus of main fixed-line telephone operatorLevel of competition (competition, partial comp., monopoly)
International long distance serviceMobile telephone serviceInternet service
Efficiency and capacityTelecommunications revenue (% of GDP)Mobile cellular and fixed-line subscribers per employeeTelecommunications investment (% of revenue) PerformanceAccessTelephone lines (per 100 people)Mobile cellular subscriptions (per 100 people)Fixed broadband Internet subscribers (per 100 people)Personal computers (per 100 people)Households with a television (%)UsageInternational voice traffic, total (minutes per person per month)Mobile telephone usage (minutes per user per month)Internet users (per 100 people)QualityPopulation covered by mobile cellular network (%)Fixed broadband Internet subscribers (% of total subscribers)International Internet bandwidth (bits per second per person)AffordabilityResidential fixed line tariff ($ a month)Mobile cellular prepaid tariff ($ a month)Fixed broadband Internet access tariff ($ a month)TradeICT goods exports (% of total goods exports)ICT goods imports (% of total goods imports)ICT service exports (% of total service exports)ApplicationsE-gov’t Web measure index (0–1, 1=highest presence)Secure Internet servers (per million people)
191The Little Data Book on Information and Communication Technology 2011
Sub-Saharan Africa Low income
Country dataLow-
income group
2000 2009 2009
Somalia
7 9 84633 37 29
.. .. 509
.. .. 5.4
.. .. 62
.. .. 56
.. NoPrivate Private
C C.. .... ..
.. .. 2.9
.. .. 301
.. .. ..
0.3 1.1 1.21.1 7.0 26.60.0 0.1 0.10.1 0.9 0.9
.. .. ..
.. .. ..
.. .. ..0.2 1.2 2.7
.. .. 530.0 0.0 5.4
0 0 7
.. .. 8.8
.. .. 8.0
.. .. 89.9
.. .. 0.6
.. .. 5.9
.. .. 6.5
.. 0.00 0.09
.. 0.1 0.6
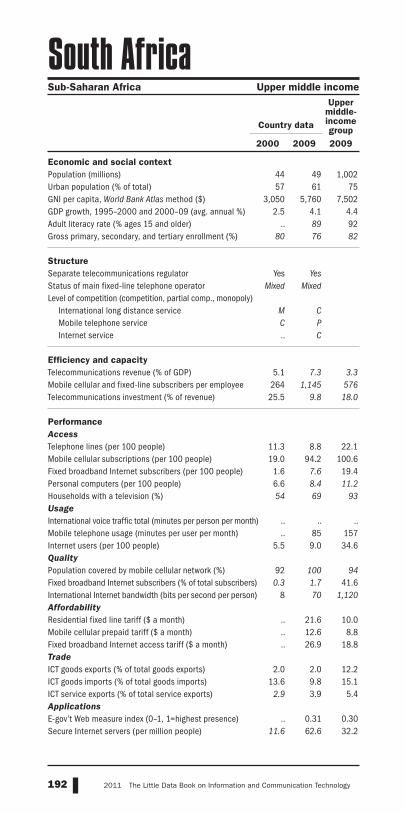
Economic and social contextPopulation (millions)Urban population (% of total)GNI per capita, World Bank Atlas method ($)GDP growth, 1995–2000 and 2000–09 (avg. annual %)Adult literacy rate (% ages 15 and older) Gross primary, secondary, and tertiary enrollment (%) StructureSeparate telecommunications regulatorStatus of main fixed-line telephone operatorLevel of competition (competition, partial comp., monopoly)
International long distance serviceMobile telephone serviceInternet service
Efficiency and capacityTelecommunications revenue (% of GDP)Mobile cellular and fixed-line subscribers per employeeTelecommunications investment (% of revenue) PerformanceAccessTelephone lines (per 100 people)Mobile cellular subscriptions (per 100 people)Fixed broadband Internet subscribers (per 100 people)Personal computers (per 100 people)Households with a television (%)UsageInternational voice traffic total (minutes per person per month)Mobile telephone usage (minutes per user per month)Internet users (per 100 people)QualityPopulation covered by mobile cellular network (%)Fixed broadband Internet subscribers (% of total subscribers)International Internet bandwidth (bits per second per person)AffordabilityResidential fixed line tariff ($ a month)Mobile cellular prepaid tariff ($ a month)Fixed broadband Internet access tariff ($ a month)TradeICT goods exports (% of total goods exports)ICT goods imports (% of total goods imports)ICT service exports (% of total service exports)ApplicationsE-gov’t Web measure index (0–1, 1=highest presence)Secure Internet servers (per million people)
192 2011 The Little Data Book on Information and Communication Technology
Country data
Upper middle-income group
2000 2009 2009
Sub-Saharan Africa Upper middle income
South Africa
44 49 1,00257 61 75
3,050 5,760 7,5022.5 4.1 4.4
.. 89 9280 76 82
Yes YesMixed Mixed
M CC P.. C
5.1 7.3 3.3264 1,145 57625.5 9.8 18.0
11.3 8.8 22.119.0 94.2 100.6
1.6 7.6 19.46.6 8.4 11.254 69 93
.. .. ..
.. 85 1575.5 9.0 34.6
92 100 940.3 1.7 41.6
8 70 1,120
.. 21.6 10.0
.. 12.6 8.8
.. 26.9 18.8
2.0 2.0 12.213.6 9.8 15.1
2.9 3.9 5.4
.. 0.31 0.3011.6 62.6 32.2

Economic and social contextPopulation (millions)Urban population (% of total)GNI per capita, World Bank Atlas method ($)GDP growth, 1995–2000 and 2000–09 (avg. annual %)Adult literacy rate (% ages 15 and older) Gross primary, secondary, and tertiary enrollment (%) StructureSeparate telecommunications regulatorStatus of main fixed-line telephone operatorLevel of competition (competition, partial comp., monopoly)
International long distance serviceMobile telephone serviceInternet service
Efficiency and capacityTelecommunications revenue (% of GDP)Mobile cellular and fixed-line subscribers per employeeTelecommunications investment (% of revenue) PerformanceAccessTelephone lines (per 100 people)Mobile cellular subscriptions (per 100 people)Fixed broadband Internet subscribers (per 100 people)Personal computers (per 100 people)Households with a television (%)UsageInternational voice traffic, total (minutes per person per month)Mobile telephone usage (minutes per user per month)Internet users (per 100 people)QualityPopulation covered by mobile cellular network (%)Fixed broadband Internet subscribers (% of total subscribers)International Internet bandwidth (bits per second per person)AffordabilityResidential fixed line tariff ($ a month)Mobile cellular prepaid tariff ($ a month)Fixed broadband Internet access tariff ($ a month)TradeICT goods exports (% of total goods exports)ICT goods imports (% of total goods imports)ICT service exports (% of total service exports)ApplicationsE-gov’t Web measure index (0–1, 1=highest presence)Secure Internet servers (per million people)
193The Little Data Book on Information and Communication Technology 2011
Country dataHigh-
income group
2000 2009 2009
High income
Spain
40 46 1,11776 77 77
15,420 32,120 37,9904.2 2.8 2.0
.. 98 9892 97 91
Yes YesPrivate Private
C CC CC C
3.2 4.1 3.0638 855 76536.7 11.7 15.5
42.5 43.6 45.160.3 111.0 111.2
8.0 21.5 24.317.4 39.3 65.4100 100 98
.. .. ..101 156 34313.6 61.2 72.3
99 99 992.4 98.1 89.2
297 11,008 19,521
.. 28.5 22.8
.. 31.6 14.8
.. 28.8 28.8
5.4 3.0 12.29.3 8.4 13.35.2 6.6 8.1
.. 0.77 0.4623.0 232.7 905.1

Economic and social contextPopulation (millions)Urban population (% of total)GNI per capita, World Bank Atlas method ($)GDP growth, 1995–2000 and 2000–09 (avg. annual %)Adult literacy rate (% ages 15 and older) Gross primary, secondary, and tertiary enrollment (%) StructureSeparate telecommunications regulatorStatus of main fixed-line telephone operatorLevel of competition (competition, partial comp., monopoly)
International long distance serviceMobile telephone serviceInternet service
Efficiency and capacityTelecommunications revenue (% of GDP)Mobile cellular and fixed-line subscribers per employeeTelecommunications investment (% of revenue) PerformanceAccessTelephone lines (per 100 people)Mobile cellular subscriptions (per 100 people)Fixed broadband Internet subscribers (per 100 people)Personal computers (per 100 people)Households with a television (%)UsageInternational voice traffic total (minutes per person per month)Mobile telephone usage (minutes per user per month)Internet users (per 100 people)QualityPopulation covered by mobile cellular network (%)Fixed broadband Internet subscribers (% of total subscribers)International Internet bandwidth (bits per second per person)AffordabilityResidential fixed line tariff ($ a month)Mobile cellular prepaid tariff ($ a month)Fixed broadband Internet access tariff ($ a month)TradeICT goods exports (% of total goods exports)ICT goods imports (% of total goods imports)ICT service exports (% of total service exports)ApplicationsE-gov’t Web measure index (0–1, 1=highest presence)Secure Internet servers (per million people)
194 2011 The Little Data Book on Information and Communication Technology
Country data
Lower middle-income group
2000 2009 2009
South Asia Lower middle income
Sri Lanka
19 20 3,81116 15 41
880 1,990 2,3215.1 5.5 8.591 91 8071 69 64
Yes YesMixed Mixed
M MP PC P
1.9 2.5 3.0101 919 60535.8 12.2 22.4
4.1 16.9 12.72.3 69.4 57.80.2 1.2 5.50.7 3.7 4.541 76 ..
.. .. ..
.. 153 3420.6 8.7 17.2
58 95 770.5 67.9 40.1
1 190 151
.. 4.7 4.7
.. 0.9 7.1
.. 4.4 30.4
2.7 1.0 21.34.2 3.6 18.47.8 17.2 19.9
.. 0.26 0.240.3 4.5 2.7

Economic and social contextPopulation (millions)Urban population (% of total)GNI per capita, World Bank Atlas method ($)GDP growth, 1995–2000 and 2000–09 (avg. annual %)Adult literacy rate (% ages 15 and older) Gross primary, secondary, and tertiary enrollment (%) StructureSeparate telecommunications regulatorStatus of main fixed-line telephone operatorLevel of competition (competition, partial comp., monopoly)
International long distance serviceMobile telephone serviceInternet service
Efficiency and capacityTelecommunications revenue (% of GDP)Mobile cellular and fixed-line subscribers per employeeTelecommunications investment (% of revenue) PerformanceAccessTelephone lines (per 100 people)Mobile cellular subscriptions (per 100 people)Fixed broadband Internet subscribers (per 100 people)Personal computers (per 100 people)Households with a television (%)UsageInternational voice traffic, total (minutes per person per month)Mobile telephone usage (minutes per user per month)Internet users (per 100 people)QualityPopulation covered by mobile cellular network (%)Fixed broadband Internet subscribers (% of total subscribers)International Internet bandwidth (bits per second per person)AffordabilityResidential fixed line tariff ($ a month)Mobile cellular prepaid tariff ($ a month)Fixed broadband Internet access tariff ($ a month)TradeICT goods exports (% of total goods exports)ICT goods imports (% of total goods imports)ICT service exports (% of total service exports)ApplicationsE-gov’t Web measure index (0–1, 1=highest presence)Secure Internet servers (per million people)
195The Little Data Book on Information and Communication Technology 2011
Latin America & Caribbean Upper middle income
Country data
Upper middle-income group
2000 2009 2009
St. Kitts and Nevis
0.04 0.05 1,00233 32 75
6,470 10,150 7,5024.3 3.2 4.4
.. .. 9284 62 82
.. No
.. ..
.. ..
.. ..
.. ..
9.1 .. 3.3167 .. 576
.. .. 18.0
49.5 41.3 22.12.7 167.4 100.69.8 .. 19.4
15.8 23.4 11.2.. .. 93
.. .. ..
.. .. 1576.1 34.3 34.6
.. .. 9410.9 .. 41.6
42 .. 1,120
.. 9.8 10.0
.. 10.8 8.8
.. 36.7 18.8
1.1 29.9 12.29.8 4.8 15.15.4 5.5 5.4
.. 0.10 0.30347.0 1,320.0 32.2

Economic and social contextPopulation (millions)Urban population (% of total)GNI per capita, World Bank Atlas method ($)GDP growth, 1995–2000 and 2000–09 (avg. annual %)Adult literacy rate (% ages 15 and older) Gross primary, secondary, and tertiary enrollment (%) StructureSeparate telecommunications regulatorStatus of main fixed-line telephone operatorLevel of competition (competition, partial comp., monopoly)
International long distance serviceMobile telephone serviceInternet service
Efficiency and capacityTelecommunications revenue (% of GDP)Mobile cellular and fixed-line subscribers per employeeTelecommunications investment (% of revenue) PerformanceAccessTelephone lines (per 100 people)Mobile cellular subscriptions (per 100 people)Fixed broadband Internet subscribers (per 100 people)Personal computers (per 100 people)Households with a television (%)UsageInternational voice traffic total (minutes per person per month)Mobile telephone usage (minutes per user per month)Internet users (per 100 people)QualityPopulation covered by mobile cellular network (%)Fixed broadband Internet subscribers (% of total subscribers)International Internet bandwidth (bits per second per person)AffordabilityResidential fixed line tariff ($ a month)Mobile cellular prepaid tariff ($ a month)Fixed broadband Internet access tariff ($ a month)TradeICT goods exports (% of total goods exports)ICT goods imports (% of total goods imports)ICT service exports (% of total service exports)ApplicationsE-gov’t Web measure index (0–1, 1=highest presence)Secure Internet servers (per million people)
196 2011 The Little Data Book on Information and Communication Technology
Country data
Upper middle-income group
2000 2009 2009
Latin America & Caribbean Upper middle income
St. Lucia
0.16 0.17 1,00228 28 75
4,130 5,190 7,5023.0 2.7 4.4
.. .. 9273 75 82
No YesPrivate Private
M ..M CM ..
.. .. 3.3
.. .. 576
.. .. 18.0
31.3 23.8 22.11.6 102.3 100.6
.. 9.1 19.414.1 16.0 11.2
79 .. 93
.. .. ..
.. .. 1575.1 83.0 34.6
.. 80 94
.. 100.1 41.695 .. 1,120
.. 11.6 10.0
.. 10.5 8.8
.. 29.3 18.8
9.7 5.7 12.27.1 4.2 15.14.2 1.6 5.4
.. 0.11 0.3012.7 126.4 32.2

Economic and social contextPopulation (millions)Urban population (% of total)GNI per capita, World Bank Atlas method ($)GDP growth, 1995–2000 and 2000–09 (avg. annual %)Adult literacy rate (% ages 15 and older) Gross primary, secondary, and tertiary enrollment (%) StructureSeparate telecommunications regulatorStatus of main fixed-line telephone operatorLevel of competition (competition, partial comp., monopoly)
International long distance serviceMobile telephone serviceInternet service
Efficiency and capacityTelecommunications revenue (% of GDP)Mobile cellular and fixed-line subscribers per employeeTelecommunications investment (% of revenue) PerformanceAccessTelephone lines (per 100 people)Mobile cellular subscriptions (per 100 people)Fixed broadband Internet subscribers (per 100 people)Personal computers (per 100 people)Households with a television (%)UsageInternational voice traffic, total (minutes per person per month)Mobile telephone usage (minutes per user per month)Internet users (per 100 people)QualityPopulation covered by mobile cellular network (%)Fixed broadband Internet subscribers (% of total subscribers)International Internet bandwidth (bits per second per person)AffordabilityResidential fixed line tariff ($ a month)Mobile cellular prepaid tariff ($ a month)Fixed broadband Internet access tariff ($ a month)TradeICT goods exports (% of total goods exports)ICT goods imports (% of total goods imports)ICT service exports (% of total service exports)ApplicationsE-gov’t Web measure index (0–1, 1=highest presence)Secure Internet servers (per million people)
197The Little Data Book on Information and Communication Technology 2011
Latin America & Caribbean Upper middle income
Country data
Upper middle-income group
2000 2009 2009
St. Vincent & Grenadines
0.11 0.11 1,00244 47 75
2,920 5,130 7,5025.7 4.5 4.4
.. .. 9276 80 82
No YesPrivate Private
M CM CM C
8.5 0.4 3.3165 19,109 57615.2 .. 18.0
23.1 21.1 22.12.2 110.9 100.62.5 10.8 19.4
11.1 15.2 11.2.. .. 93
.. .. ..
.. .. 1573.2 69.6 34.6
55 100 940.0 97.4 41.637 275 1,120
.. 10.9 10.0
.. 8.3 8.8
.. 33.6 18.8
0.6 11.0 12.25.7 4.0 15.19.2 6.1 5.4
.. 0.13 0.3027.8 109.8 32.2

Economic and social contextPopulation (millions)Urban population (% of total)GNI per capita, World Bank Atlas method ($)GDP growth, 1995–2000 and 2000–09 (avg. annual %)Adult literacy rate (% ages 15 and older) Gross primary, secondary, and tertiary enrollment (%) StructureSeparate telecommunications regulatorStatus of main fixed-line telephone operatorLevel of competition (competition, partial comp., monopoly)
International long distance serviceMobile telephone serviceInternet service
Efficiency and capacityTelecommunications revenue (% of GDP)Mobile cellular and fixed-line subscribers per employeeTelecommunications investment (% of revenue) PerformanceAccessTelephone lines (per 100 people)Mobile cellular subscriptions (per 100 people)Fixed broadband Internet subscribers (per 100 people)Personal computers (per 100 people)Households with a television (%)UsageInternational voice traffic total (minutes per person per month)Mobile telephone usage (minutes per user per month)Internet users (per 100 people)QualityPopulation covered by mobile cellular network (%)Fixed broadband Internet subscribers (% of total subscribers)International Internet bandwidth (bits per second per person)AffordabilityResidential fixed line tariff ($ a month)Mobile cellular prepaid tariff ($ a month)Fixed broadband Internet access tariff ($ a month)TradeICT goods exports (% of total goods exports)ICT goods imports (% of total goods imports)ICT service exports (% of total service exports)ApplicationsE-gov’t Web measure index (0–1, 1=highest presence)Secure Internet servers (per million people)
198 2011 The Little Data Book on Information and Communication Technology
Country data
Lower middle-income group
2000 2009 2009
Sub-Saharan Africa Lower middle income
Sudan
35 42 3,81136 44 41
320 1,220 2,3216.2 7.3 8.561 70 8029 38 64
Yes YesMixed Mixed
M PM PC C
1.1 3.2 3.0146 2,168 60571.2 418.3 22.4
1.1 0.9 12.70.1 36.3 57.8
.. 0.1 5.50.3 10.7 4.5
.. 16 ..
.. 1.1 ..
.. .. 3420.0 9.9 17.2
20 66 77.. 4.7 40.10 322 151
.. 3.9 4.7
.. 3.4 7.1
.. 23.3 30.4
0.0 0.0 21.35.7 4.7 18.49.5 1.2 19.9
.. 0.16 0.24
.. 0.0 2.7

Economic and social contextPopulation (millions)Urban population (% of total)GNI per capita, World Bank Atlas method ($)GDP growth, 1995–2000 and 2000–09 (avg. annual %)Adult literacy rate (% ages 15 and older) Gross primary, secondary, and tertiary enrollment (%) StructureSeparate telecommunications regulatorStatus of main fixed-line telephone operatorLevel of competition (competition, partial comp., monopoly)
International long distance serviceMobile telephone serviceInternet service
Efficiency and capacityTelecommunications revenue (% of GDP)Mobile cellular and fixed-line subscribers per employeeTelecommunications investment (% of revenue) PerformanceAccessTelephone lines (per 100 people)Mobile cellular subscriptions (per 100 people)Fixed broadband Internet subscribers (per 100 people)Personal computers (per 100 people)Households with a television (%)UsageInternational voice traffic, total (minutes per person per month)Mobile telephone usage (minutes per user per month)Internet users (per 100 people)QualityPopulation covered by mobile cellular network (%)Fixed broadband Internet subscribers (% of total subscribers)International Internet bandwidth (bits per second per person)AffordabilityResidential fixed line tariff ($ a month)Mobile cellular prepaid tariff ($ a month)Fixed broadband Internet access tariff ($ a month)TradeICT goods exports (% of total goods exports)ICT goods imports (% of total goods imports)ICT service exports (% of total service exports)ApplicationsE-gov’t Web measure index (0–1, 1=highest presence)Secure Internet servers (per million people)
199The Little Data Book on Information and Communication Technology 2011
Latin America & Caribbean Upper middle income
Country data
Upper middle-income group
2000 2009 2009
Suriname
0.47 0.52 1,00272 75 75
1,930 4,760 7,5021.7 5.4 4.4
.. 95 9272 69 82
No YesPublic Public
P MP CC C
5.5 5.2 3.3111 318 57638.8 32.4 18.0
16.1 16.1 22.18.8 147.0 100.60.8 2.4 19.44.2 4.0 11.2
.. .. 93
.. .. ..
.. .. 1572.5 31.4 34.6
.. .. 940.0 67.9 41.6
6 385 1,120
.. 2.3 10.0
.. 9.2 8.8
.. 79.9 18.8
.. .. 12.27.0 4.9 15.10.0 0.0 5.4
.. 0.02 0.30
.. 21.0 32.2

Economic and social contextPopulation (millions)Urban population (% of total)GNI per capita, World Bank Atlas method ($)GDP growth, 1995–2000 and 2000–09 (avg. annual %)Adult literacy rate (% ages 15 and older) Gross primary, secondary, and tertiary enrollment (%) StructureSeparate telecommunications regulatorStatus of main fixed-line telephone operatorLevel of competition (competition, partial comp., monopoly)
International long distance serviceMobile telephone serviceInternet service
Efficiency and capacityTelecommunications revenue (% of GDP)Mobile cellular and fixed-line subscribers per employeeTelecommunications investment (% of revenue) PerformanceAccessTelephone lines (per 100 people)Mobile cellular subscriptions (per 100 people)Fixed broadband Internet subscribers (per 100 people)Personal computers (per 100 people)Households with a television (%)UsageInternational voice traffic total (minutes per person per month)Mobile telephone usage (minutes per user per month)Internet users (per 100 people)QualityPopulation covered by mobile cellular network (%)Fixed broadband Internet subscribers (% of total subscribers)International Internet bandwidth (bits per second per person)AffordabilityResidential fixed line tariff ($ a month)Mobile cellular prepaid tariff ($ a month)Fixed broadband Internet access tariff ($ a month)TradeICT goods exports (% of total goods exports)ICT goods imports (% of total goods imports)ICT service exports (% of total service exports)ApplicationsE-gov’t Web measure index (0–1, 1=highest presence)Secure Internet servers (per million people)
200 2011 The Little Data Book on Information and Communication Technology
Country data
Lower middle-income group
2000 2009 2009
Sub-Saharan Africa Lower middle income
Swaziland
1 1 3,81123 25 41
1,550 2,470 2,3214.3 2.6 8.580 87 8058 64 64
.. NoPublic Public
M MM MC ..
2.6 4.5 3.0137 1,118 6059.9 22.4 22.4
3.0 3.7 12.73.1 55.4 57.80.5 1.9 5.51.1 3.7 4.5
.. 35 ..
.. 3.4 ..
.. .. 3420.9 7.6 17.2
70 91 770.0 6.8 40.1
1 35 151
.. 4.9 4.7
.. 12.8 7.1
.. 858.0 30.4
0.4 0.1 21.32.8 3.6 18.41.3 11.3 19.9
.. 0.00 0.24

Economic and social contextPopulation (millions)Urban population (% of total)GNI per capita, World Bank Atlas method ($)GDP growth, 1995–2000 and 2000–09 (avg. annual %)Adult literacy rate (% ages 15 and older) Gross primary, secondary, and tertiary enrollment (%) StructureSeparate telecommunications regulatorStatus of main fixed-line telephone operatorLevel of competition (competition, partial comp., monopoly)
International long distance serviceMobile telephone serviceInternet service
Efficiency and capacityTelecommunications revenue (% of GDP)Mobile cellular and fixed-line subscribers per employeeTelecommunications investment (% of revenue) PerformanceAccessTelephone lines (per 100 people)Mobile cellular subscriptions (per 100 people)Fixed broadband Internet subscribers (per 100 people)Personal computers (per 100 people)Households with a television (%)UsageInternational voice traffic, total (minutes per person per month)Mobile telephone usage (minutes per user per month)Internet users (per 100 people)QualityPopulation covered by mobile cellular network (%)Fixed broadband Internet subscribers (% of total subscribers)International Internet bandwidth (bits per second per person)AffordabilityResidential fixed line tariff ($ a month)Mobile cellular prepaid tariff ($ a month)Fixed broadband Internet access tariff ($ a month)TradeICT goods exports (% of total goods exports)ICT goods imports (% of total goods imports)ICT service exports (% of total service exports)ApplicationsE-gov’t Web measure index (0–1, 1=highest presence)Secure Internet servers (per million people)
201The Little Data Book on Information and Communication Technology 2011
High income
Country dataHigh-
income group
2000 2009 2009
Sweden
9 9 1,11784 85 77
29,500 48,840 37,9903.6 2.4 2.0
.. .. 98112 92 91
Yes YesMixed Mixed
C CP CC C
3.1 2.7 3.0422 894 76531.9 12.7 15.5
64.8 55.3 45.171.8 122.8 111.225.3 46.3 24.350.7 88.1 65.4
.. 94 98
.. .. ..112 206 34345.6 90.3 72.3
99 98 9911.1 88.8 89.2
2,098 49,828 19,521
.. 26.2 22.8
.. 14.8 14.8
.. 35.5 28.8
19.1 10.0 12.216.3 11.5 13.3
9.1 14.8 8.1
.. 0.53 0.46116.1 1,266.2 905.1

Economic and social contextPopulation (millions)Urban population (% of total)GNI per capita, World Bank Atlas method ($)GDP growth, 1995–2000 and 2000–09 (avg. annual %)Adult literacy rate (% ages 15 and older) Gross primary, secondary, and tertiary enrollment (%) StructureSeparate telecommunications regulatorStatus of main fixed-line telephone operatorLevel of competition (competition, partial comp., monopoly)
International long distance serviceMobile telephone serviceInternet service
Efficiency and capacityTelecommunications revenue (% of GDP)Mobile cellular and fixed-line subscribers per employeeTelecommunications investment (% of revenue) PerformanceAccessTelephone lines (per 100 people)Mobile cellular subscriptions (per 100 people)Fixed broadband Internet subscribers (per 100 people)Personal computers (per 100 people)Households with a television (%)UsageInternational voice traffic total (minutes per person per month)Mobile telephone usage (minutes per user per month)Internet users (per 100 people)QualityPopulation covered by mobile cellular network (%)Fixed broadband Internet subscribers (% of total subscribers)International Internet bandwidth (bits per second per person)AffordabilityResidential fixed line tariff ($ a month)Mobile cellular prepaid tariff ($ a month)Fixed broadband Internet access tariff ($ a month)TradeICT goods exports (% of total goods exports)ICT goods imports (% of total goods imports)ICT service exports (% of total service exports)ApplicationsE-gov’t Web measure index (0–1, 1=highest presence)Secure Internet servers (per million people)
202 2011 The Little Data Book on Information and Communication Technology
Country dataHigh-
income group
2000 2009 2009
High income
Switzerland
7 8 1,11773 74 77
40,280 65,430 37,9902.1 1.9 2.0
.. .. 9884 85 91
Yes YesMixed Mixed
C CC CC C
3.3 3.3 3.0409 601 76527.2 14.2 15.5
72.9 60.1 45.164.6 119.7 111.223.2 35.9 24.365.4 96.2 65.4
94 92 98
.. .. ..
.. 130 34347.9 70.9 72.3
98 100 993.4 94.6 89.2
2,941 29,413 19,521
.. 31.5 22.8
.. 33.7 14.8
.. 32.7 28.8
5.8 3.3 12.211.0 6.6 13.3
.. .. 8.1
.. 0.44 0.46149.2 1,876.0 905.1

Economic and social contextPopulation (millions)Urban population (% of total)GNI per capita, World Bank Atlas method ($)GDP growth, 1995–2000 and 2000–09 (avg. annual %)Adult literacy rate (% ages 15 and older) Gross primary, secondary, and tertiary enrollment (%) StructureSeparate telecommunications regulatorStatus of main fixed-line telephone operatorLevel of competition (competition, partial comp., monopoly)
International long distance serviceMobile telephone serviceInternet service
Efficiency and capacityTelecommunications revenue (% of GDP)Mobile cellular and fixed-line subscribers per employeeTelecommunications investment (% of revenue) PerformanceAccessTelephone lines (per 100 people)Mobile cellular subscriptions (per 100 people)Fixed broadband Internet subscribers (per 100 people)Personal computers (per 100 people)Households with a television (%)UsageInternational voice traffic, total (minutes per person per month)Mobile telephone usage (minutes per user per month)Internet users (per 100 people)QualityPopulation covered by mobile cellular network (%)Fixed broadband Internet subscribers (% of total subscribers)International Internet bandwidth (bits per second per person)AffordabilityResidential fixed line tariff ($ a month)Mobile cellular prepaid tariff ($ a month)Fixed broadband Internet access tariff ($ a month)TradeICT goods exports (% of total goods exports)ICT goods imports (% of total goods imports)ICT service exports (% of total service exports)ApplicationsE-gov’t Web measure index (0–1, 1=highest presence)Secure Internet servers (per million people)
203The Little Data Book on Information and Communication Technology 2011
Middle East & North Africa Lower middle income
Country data
Lower middle-income group
2000 2009 2009
Syrian Arab Republic
17 21 3,81152 55 41
960 2,410 2,3212.2 4.4 8.583 84 8057 66 64
.. NoPublic Public
M MP P.. P
1.9 3.0 3.080 409 605
58.2 9.1 22.4
10.1 18.4 12.70.2 46.0 57.80.1 3.7 5.51.5 9.0 4.5
.. .. ..
.. .. ..
.. 198 3420.2 18.7 17.2
50 96 770.0 4.4 40.1
1 261 151
.. 1.3 4.7
.. 7.6 7.1
.. 31.5 30.4
0.0 0.2 21.31.3 1.4 18.4
.. 4.4 19.9
.. 0.04 0.240.1 0.1 2.7

Economic and social contextPopulation (millions)Urban population (% of total)GNI per capita, World Bank Atlas method ($)GDP growth, 1995–2000 and 2000–09 (avg. annual %)Adult literacy rate (% ages 15 and older) Gross primary, secondary, and tertiary enrollment (%) StructureSeparate telecommunications regulatorStatus of main fixed-line telephone operatorLevel of competition (competition, partial comp., monopoly)
International long distance serviceMobile telephone serviceInternet service
Efficiency and capacityTelecommunications revenue (% of GDP)Mobile cellular and fixed-line subscribers per employeeTelecommunications investment (% of revenue) PerformanceAccessTelephone lines (per 100 people)Mobile cellular subscriptions (per 100 people)Fixed broadband Internet subscribers (per 100 people)Personal computers (per 100 people)Households with a television (%)UsageInternational voice traffic total (minutes per person per month)Mobile telephone usage (minutes per user per month)Internet users (per 100 people)QualityPopulation covered by mobile cellular network (%)Fixed broadband Internet subscribers (% of total subscribers)International Internet bandwidth (bits per second per person)AffordabilityResidential fixed line tariff ($ a month)Mobile cellular prepaid tariff ($ a month)Fixed broadband Internet access tariff ($ a month)TradeICT goods exports (% of total goods exports)ICT goods imports (% of total goods imports)ICT service exports (% of total service exports)ApplicationsE-gov’t Web measure index (0–1, 1=highest presence)Secure Internet servers (per million people)
204 2011 The Little Data Book on Information and Communication Technology
Country dataLow-
income group
2000 2009 2009
Europe & Central Asia Low income
Tajikistan
6 7 84627 26 29
170 700 5091.1 8.2 5.499 100 6268 72 56
.. NoMixed Mixed
M M.. .... ..
0.7 2.9 2.945 114 3011.0 71.4 ..
3.5 4.2 1.20.0 70.5 26.60.0 0.0 0.1
.. 1.3 0.9
.. .. ..
.. .. ..
.. 168 ..0.0 10.1 2.7
0 .. 530.0 2.2 5.4
0 37 7
.. 0.9 8.8
.. 2.9 8.0
.. 363.6 89.9
.. .. 0.6
.. .. 5.99.5 19.6 6.5
.. 0.09 0.09
.. 0.4 0.6

Economic and social contextPopulation (millions)Urban population (% of total)GNI per capita, World Bank Atlas method ($)GDP growth, 1995–2000 and 2000–09 (avg. annual %)Adult literacy rate (% ages 15 and older) Gross primary, secondary, and tertiary enrollment (%) StructureSeparate telecommunications regulatorStatus of main fixed-line telephone operatorLevel of competition (competition, partial comp., monopoly)
International long distance serviceMobile telephone serviceInternet service
Efficiency and capacityTelecommunications revenue (% of GDP)Mobile cellular and fixed-line subscribers per employeeTelecommunications investment (% of revenue) PerformanceAccessTelephone lines (per 100 people)Mobile cellular subscriptions (per 100 people)Fixed broadband Internet subscribers (per 100 people)Personal computers (per 100 people)Households with a television (%)UsageInternational voice traffic, total (minutes per person per month)Mobile telephone usage (minutes per user per month)Internet users (per 100 people)QualityPopulation covered by mobile cellular network (%)Fixed broadband Internet subscribers (% of total subscribers)International Internet bandwidth (bits per second per person)AffordabilityResidential fixed line tariff ($ a month)Mobile cellular prepaid tariff ($ a month)Fixed broadband Internet access tariff ($ a month)TradeICT goods exports (% of total goods exports)ICT goods imports (% of total goods imports)ICT service exports (% of total service exports)ApplicationsE-gov’t Web measure index (0–1, 1=highest presence)Secure Internet servers (per million people)
205The Little Data Book on Information and Communication Technology 2011
Country dataLow-
income group
2000 2009 2009
Sub-Saharan Africa Low income
Tanzania
34 44 84622 26 29
300 500 5094.2 7.1 5.469 73 6233 54 56
Yes YesMixed Mixed
P MC CC C
1.7 .. 2.978 .. 301
12.6 .. ..
0.5 0.4 1.20.3 39.9 26.60.0 0.1 0.10.3 0.9 0.9
3 9 ..
.. 0.1 ..
.. .. ..0.1 1.5 2.7
25 65 530.0 0.0 5.4
0 2 7
.. 12.2 8.8
.. 10.2 8.0
.. 63.6 89.9
0.4 0.6 0.66.0 6.9 5.94.3 2.7 6.5
.. 0.17 0.09
.. 0.4 0.6

Economic and social contextPopulation (millions)Urban population (% of total)GNI per capita, World Bank Atlas method ($)GDP growth, 1995–2000 and 2000–09 (avg. annual %)Adult literacy rate (% ages 15 and older) Gross primary, secondary, and tertiary enrollment (%) StructureSeparate telecommunications regulatorStatus of main fixed-line telephone operatorLevel of competition (competition, partial comp., monopoly)
International long distance serviceMobile telephone serviceInternet service
Efficiency and capacityTelecommunications revenue (% of GDP)Mobile cellular and fixed-line subscribers per employeeTelecommunications investment (% of revenue) PerformanceAccessTelephone lines (per 100 people)Mobile cellular subscriptions (per 100 people)Fixed broadband Internet subscribers (per 100 people)Personal computers (per 100 people)Households with a television (%)UsageInternational voice traffic total (minutes per person per month)Mobile telephone usage (minutes per user per month)Internet users (per 100 people)QualityPopulation covered by mobile cellular network (%)Fixed broadband Internet subscribers (% of total subscribers)International Internet bandwidth (bits per second per person)AffordabilityResidential fixed line tariff ($ a month)Mobile cellular prepaid tariff ($ a month)Fixed broadband Internet access tariff ($ a month)TradeICT goods exports (% of total goods exports)ICT goods imports (% of total goods imports)ICT service exports (% of total service exports)ApplicationsE-gov’t Web measure index (0–1, 1=highest presence)Secure Internet servers (per million people)
206 2011 The Little Data Book on Information and Communication Technology
Country data
Lower middle-income group
2000 2009 2009
East Asia & Pacific Lower middle income
Thailand
62 68 3,81131 34 41
1,960 3,760 2,321-0.7 4.6 8.5
93 94 80.. .. 64
No YesPublic Public
M CC CC C
2.6 4.0 3.0353 1,957 60527.0 9.8 22.4
9.0 10.4 12.74.9 122.6 57.81.0 .. 5.52.7 6.7 4.5
.. 92 ..
.. .. ..
.. 459 3423.7 25.8 17.2
.. 38 770.0 .. 40.1
4 818 151
.. 8.3 4.7
.. 2.4 7.1
.. 18.8 30.4
29.5 19.8 21.325.3 18.1 18.4
.. .. 19.9
.. 0.33 0.241.8 13.4 2.7

Economic and social contextPopulation (millions)Urban population (% of total)GNI per capita, World Bank Atlas method ($)GDP growth, 1995–2000 and 2000–09 (avg. annual %)Adult literacy rate (% ages 15 and older) Gross primary, secondary, and tertiary enrollment (%) StructureSeparate telecommunications regulatorStatus of main fixed-line telephone operatorLevel of competition (competition, partial comp., monopoly)
International long distance serviceMobile telephone serviceInternet service
Efficiency and capacityTelecommunications revenue (% of GDP)Mobile cellular and fixed-line subscribers per employeeTelecommunications investment (% of revenue) PerformanceAccessTelephone lines (per 100 people)Mobile cellular subscriptions (per 100 people)Fixed broadband Internet subscribers (per 100 people)Personal computers (per 100 people)Households with a television (%)UsageInternational voice traffic, total (minutes per person per month)Mobile telephone usage (minutes per user per month)Internet users (per 100 people)QualityPopulation covered by mobile cellular network (%)Fixed broadband Internet subscribers (% of total subscribers)International Internet bandwidth (bits per second per person)AffordabilityResidential fixed line tariff ($ a month)Mobile cellular prepaid tariff ($ a month)Fixed broadband Internet access tariff ($ a month)TradeICT goods exports (% of total goods exports)ICT goods imports (% of total goods imports)ICT service exports (% of total service exports)ApplicationsE-gov’t Web measure index (0–1, 1=highest presence)Secure Internet servers (per million people)
207The Little Data Book on Information and Communication Technology 2011
East Asia & Pacific Lower middle income
Country data
Lower middle-income group
2000 2009 2009
Timor-Leste
0.82 1 3,81124 28 41
330 2,460 2,321.. 2.4 8.5
38 51 8072 59 64
.. No
.. ..
.. ..
.. ..
.. ..
.. 7.9 3.0
.. .. 605
.. 6.2 22.4
.. .. 12.7
.. .. 57.8
.. 0.1 5.5
.. .. 4.5
.. .. ..
.. .. ..
.. 79 342
.. .. 17.2
.. .. 77
.. .. 40.1
.. .. 151
.. .. 4.7
.. .. 7.1
.. .. 30.4
.. .. 21.3
.. .. 18.4
.. .. 19.9
.. 0.13 0.24
.. 0.9 2.7

Economic and social contextPopulation (millions)Urban population (% of total)GNI per capita, World Bank Atlas method ($)GDP growth, 1995–2000 and 2000–09 (avg. annual %)Adult literacy rate (% ages 15 and older) Gross primary, secondary, and tertiary enrollment (%) StructureSeparate telecommunications regulatorStatus of main fixed-line telephone operatorLevel of competition (competition, partial comp., monopoly)
International long distance serviceMobile telephone serviceInternet service
Efficiency and capacityTelecommunications revenue (% of GDP)Mobile cellular and fixed-line subscribers per employeeTelecommunications investment (% of revenue) PerformanceAccessTelephone lines (per 100 people)Mobile cellular subscriptions (per 100 people)Fixed broadband Internet subscribers (per 100 people)Personal computers (per 100 people)Households with a television (%)UsageInternational voice traffic total (minutes per person per month)Mobile telephone usage (minutes per user per month)Internet users (per 100 people)QualityPopulation covered by mobile cellular network (%)Fixed broadband Internet subscribers (% of total subscribers)International Internet bandwidth (bits per second per person)AffordabilityResidential fixed line tariff ($ a month)Mobile cellular prepaid tariff ($ a month)Fixed broadband Internet access tariff ($ a month)TradeICT goods exports (% of total goods exports)ICT goods imports (% of total goods imports)ICT service exports (% of total service exports)ApplicationsE-gov’t Web measure index (0–1, 1=highest presence)Secure Internet servers (per million people)
208 2011 The Little Data Book on Information and Communication Technology
Country dataLow-
income group
2000 2009 2009
Sub-Saharan Africa Low income
Togo
5 7 84637 43 29
280 440 5094.2 2.5 5.453 57 6255 57 56
Yes YesPublic Public
P MP CC C
2.9 7.4 2.986 1,059 301
45.3 41.1 ..
0.8 2.7 1.21.0 33.0 26.60.1 0.9 0.11.9 3.1 0.9
.. .. ..
.. 2.3 ..
.. .. ..1.9 5.4 2.7
80 85 530.0 4.5 5.4
0 23 7
.. 12.8 8.8
.. 12.4 8.0
.. 186.1 89.9
0.0 0.1 0.63.3 4.2 5.97.7 18.6 6.5
.. 0.07 0.09
.. 1.8 0.6

Economic and social contextPopulation (millions)Urban population (% of total)GNI per capita, World Bank Atlas method ($)GDP growth, 1995–2000 and 2000–09 (avg. annual %)Adult literacy rate (% ages 15 and older) Gross primary, secondary, and tertiary enrollment (%) StructureSeparate telecommunications regulatorStatus of main fixed-line telephone operatorLevel of competition (competition, partial comp., monopoly)
International long distance serviceMobile telephone serviceInternet service
Efficiency and capacityTelecommunications revenue (% of GDP)Mobile cellular and fixed-line subscribers per employeeTelecommunications investment (% of revenue) PerformanceAccessTelephone lines (per 100 people)Mobile cellular subscriptions (per 100 people)Fixed broadband Internet subscribers (per 100 people)Personal computers (per 100 people)Households with a television (%)UsageInternational voice traffic, total (minutes per person per month)Mobile telephone usage (minutes per user per month)Internet users (per 100 people)QualityPopulation covered by mobile cellular network (%)Fixed broadband Internet subscribers (% of total subscribers)International Internet bandwidth (bits per second per person)AffordabilityResidential fixed line tariff ($ a month)Mobile cellular prepaid tariff ($ a month)Fixed broadband Internet access tariff ($ a month)TradeICT goods exports (% of total goods exports)ICT goods imports (% of total goods imports)ICT service exports (% of total service exports)ApplicationsE-gov’t Web measure index (0–1, 1=highest presence)Secure Internet servers (per million people)
209The Little Data Book on Information and Communication Technology 2011
East Asia & Pacific Lower middle income
Country data
Lower middle-income group
2000 2009 2009
Tonga
0.10 0.10 3,81123 25 41
2,020 3,260 2,3212.0 1.0 8.5
.. 99 8078 82 64
.. NoPublic Private
P C.. CP C
2.2 .. 3.035 .. 605
.. .. 22.4
9.8 29.8 12.70.2 51.0 57.81.2 4.3 5.51.3 5.9 4.5
.. .. ..
.. .. ..
.. .. 3422.4 8.1 17.2
70 90 770.0 16.2 40.1
5 116 151
.. 6.5 4.7
.. 5.9 7.1
.. 127.8 30.4
.. .. 21.3
.. .. 18.4
.. 2.8 19.9
.. 0.07 0.2430.3 19.2 2.7

Economic and social contextPopulation (millions)Urban population (% of total)GNI per capita, World Bank Atlas method ($)GDP growth, 1995–2000 and 2000–09 (avg. annual %)Adult literacy rate (% ages 15 and older) Gross primary, secondary, and tertiary enrollment (%) StructureSeparate telecommunications regulatorStatus of main fixed-line telephone operatorLevel of competition (competition, partial comp., monopoly)
International long distance serviceMobile telephone serviceInternet service
Efficiency and capacityTelecommunications revenue (% of GDP)Mobile cellular and fixed-line subscribers per employeeTelecommunications investment (% of revenue) PerformanceAccessTelephone lines (per 100 people)Mobile cellular subscriptions (per 100 people)Fixed broadband Internet subscribers (per 100 people)Personal computers (per 100 people)Households with a television (%)UsageInternational voice traffic total (minutes per person per month)Mobile telephone usage (minutes per user per month)Internet users (per 100 people)QualityPopulation covered by mobile cellular network (%)Fixed broadband Internet subscribers (% of total subscribers)International Internet bandwidth (bits per second per person)AffordabilityResidential fixed line tariff ($ a month)Mobile cellular prepaid tariff ($ a month)Fixed broadband Internet access tariff ($ a month)TradeICT goods exports (% of total goods exports)ICT goods imports (% of total goods imports)ICT service exports (% of total service exports)ApplicationsE-gov’t Web measure index (0–1, 1=highest presence)Secure Internet servers (per million people)
210 2011 The Little Data Book on Information and Communication Technology
High income
Country dataHigh-
income group
2000 2009 2009
Trinidad and Tobago
1 1 1,11711 14 77
5,190 16,700 37,9905.0 7.4 2.0
.. 99 9866 66 91
No YesMixed Mixed
M CC PC P
3.0 2.6 3.0157 .. 76539.2 .. 15.5
24.5 23.5 45.112.5 147.2 111.2
2.0 8.6 24.36.2 13.2 65.4
.. .. 98
.. 36.9 ..
.. .. 3437.7 36.2 72.3
.. 100 990.0 74.9 89.246 7,916 19,521
.. 19.5 22.8
.. 6.5 14.8
.. 12.6 28.8
0.1 0.2 12.24.1 4.0 13.3
.. .. 8.1
.. 0.34 0.469.2 72.2 905.1

Economic and social contextPopulation (millions)Urban population (% of total)GNI per capita, World Bank Atlas method ($)GDP growth, 1995–2000 and 2000–09 (avg. annual %)Adult literacy rate (% ages 15 and older) Gross primary, secondary, and tertiary enrollment (%) StructureSeparate telecommunications regulatorStatus of main fixed-line telephone operatorLevel of competition (competition, partial comp., monopoly)
International long distance serviceMobile telephone serviceInternet service
Efficiency and capacityTelecommunications revenue (% of GDP)Mobile cellular and fixed-line subscribers per employeeTelecommunications investment (% of revenue) PerformanceAccessTelephone lines (per 100 people)Mobile cellular subscriptions (per 100 people)Fixed broadband Internet subscribers (per 100 people)Personal computers (per 100 people)Households with a television (%)UsageInternational voice traffic, total (minutes per person per month)Mobile telephone usage (minutes per user per month)Internet users (per 100 people)QualityPopulation covered by mobile cellular network (%)Fixed broadband Internet subscribers (% of total subscribers)International Internet bandwidth (bits per second per person)AffordabilityResidential fixed line tariff ($ a month)Mobile cellular prepaid tariff ($ a month)Fixed broadband Internet access tariff ($ a month)TradeICT goods exports (% of total goods exports)ICT goods imports (% of total goods imports)ICT service exports (% of total service exports)ApplicationsE-gov’t Web measure index (0–1, 1=highest presence)Secure Internet servers (per million people)
211The Little Data Book on Information and Communication Technology 2011
Middle East & North Africa Lower middle income
Country data
Lower middle-income group
2000 2009 2009
Tunisia
10 10 3,81163 67 41
2,090 3,720 2,3215.5 4.9 8.5
.. 78 8075 78 64
No YesPublic Mixed
M MM CC P
2.1 4.3 3.0153 1,004 60539.8 17.4 22.4
10.0 12.3 12.71.2 93.5 57.80.4 4.0 5.52.2 9.7 4.589 .. ..
.. .. ..
.. 171 3422.7 33.5 17.2
60 100 770.0 90.1 40.1
5 2,699 151
.. 2.8 4.7
.. 7.2 7.1
.. 11.7 30.4
3.4 6.0 21.35.5 7.5 18.41.2 4.9 19.9
.. 0.48 0.240.4 14.1 2.7

Economic and social contextPopulation (millions)Urban population (% of total)GNI per capita, World Bank Atlas method ($)GDP growth, 1995–2000 and 2000–09 (avg. annual %)Adult literacy rate (% ages 15 and older) Gross primary, secondary, and tertiary enrollment (%) StructureSeparate telecommunications regulatorStatus of main fixed-line telephone operatorLevel of competition (competition, partial comp., monopoly)
International long distance serviceMobile telephone serviceInternet service
Efficiency and capacityTelecommunications revenue (% of GDP)Mobile cellular and fixed-line subscribers per employeeTelecommunications investment (% of revenue) PerformanceAccessTelephone lines (per 100 people)Mobile cellular subscriptions (per 100 people)Fixed broadband Internet subscribers (per 100 people)Personal computers (per 100 people)Households with a television (%)UsageInternational voice traffic total (minutes per person per month)Mobile telephone usage (minutes per user per month)Internet users (per 100 people)QualityPopulation covered by mobile cellular network (%)Fixed broadband Internet subscribers (% of total subscribers)International Internet bandwidth (bits per second per person)AffordabilityResidential fixed line tariff ($ a month)Mobile cellular prepaid tariff ($ a month)Fixed broadband Internet access tariff ($ a month)TradeICT goods exports (% of total goods exports)ICT goods imports (% of total goods imports)ICT service exports (% of total service exports)ApplicationsE-gov’t Web measure index (0–1, 1=highest presence)Secure Internet servers (per million people)
212 2011 The Little Data Book on Information and Communication Technology
Country data
Upper middle-income group
2000 2009 2009
Europe & Central Asia Upper middle income
Turkey
66 75 1,00265 69 75
3,990 8,720 7,5023.5 4.9 4.4
.. 91 9269 74 82
Yes YesPublic Mixed
M CC PC C
3.0 2.3 3.3477 2,145 5767.7 18.6 18.0
27.7 22.1 22.124.3 83.9 100.6
2.3 8.5 19.43.8 6.1 11.2
.. 98 93
.. 5.0 ..81 169 1573.8 35.3 34.6
50 100 940.0 99.9 41.6
9 4,323 1,120
.. 13.8 10.0
.. 23.9 8.8
.. 18.2 18.8
4.0 2.3 12.211.1 5.9 15.1
0.0 1.9 5.4
.. 0.35 0.303.2 95.1 32.2

Economic and social contextPopulation (millions)Urban population (% of total)GNI per capita, World Bank Atlas method ($)GDP growth, 1995–2000 and 2000–09 (avg. annual %)Adult literacy rate (% ages 15 and older) Gross primary, secondary, and tertiary enrollment (%) StructureSeparate telecommunications regulatorStatus of main fixed-line telephone operatorLevel of competition (competition, partial comp., monopoly)
International long distance serviceMobile telephone serviceInternet service
Efficiency and capacityTelecommunications revenue (% of GDP)Mobile cellular and fixed-line subscribers per employeeTelecommunications investment (% of revenue) PerformanceAccessTelephone lines (per 100 people)Mobile cellular subscriptions (per 100 people)Fixed broadband Internet subscribers (per 100 people)Personal computers (per 100 people)Households with a television (%)UsageInternational voice traffic, total (minutes per person per month)Mobile telephone usage (minutes per user per month)Internet users (per 100 people)QualityPopulation covered by mobile cellular network (%)Fixed broadband Internet subscribers (% of total subscribers)International Internet bandwidth (bits per second per person)AffordabilityResidential fixed line tariff ($ a month)Mobile cellular prepaid tariff ($ a month)Fixed broadband Internet access tariff ($ a month)TradeICT goods exports (% of total goods exports)ICT goods imports (% of total goods imports)ICT service exports (% of total service exports)ApplicationsE-gov’t Web measure index (0–1, 1=highest presence)Secure Internet servers (per million people)
213The Little Data Book on Information and Communication Technology 2011
Europe & Central Asia Lower middle income
Country data
Lower middle-income group
2000 2009 2009
Turkmenistan
5 5 3,81146 49 41
650 3,420 2,3213.9 13.9 8.5
.. 100 80
.. .. 64
.. NoPublic Public
M MC C.. ..
0.9 0.7 3.050 72 6059.0 .. 22.4
8.1 9.4 12.70.2 29.4 57.80.0 .. 5.51.5 7.2 4.593 .. ..
.. .. ..
.. 239 3420.1 1.6 17.2
12 14 77.. .. 40.10 48 151
.. .. 4.7
.. .. 7.1
.. .. 30.4
0.0 .. 21.36.3 .. 18.4
.. .. 19.9
.. 0.03 0.24
.. 0.2 2.7
Europe & Central Asia Lower middle income
Country data
Lower middle-income group
2000 2009 2009

Economic and social contextPopulation (millions)Urban population (% of total)GNI per capita, World Bank Atlas method ($)GDP growth, 1995–2000 and 2000–09 (avg. annual %)Adult literacy rate (% ages 15 and older) Gross primary, secondary, and tertiary enrollment (%) StructureSeparate telecommunications regulatorStatus of main fixed-line telephone operatorLevel of competition (competition, partial comp., monopoly)
International long distance serviceMobile telephone serviceInternet service
Efficiency and capacityTelecommunications revenue (% of GDP)Mobile cellular and fixed-line subscribers per employeeTelecommunications investment (% of revenue) PerformanceAccessTelephone lines (per 100 people)Mobile cellular subscriptions (per 100 people)Fixed broadband Internet subscribers (per 100 people)Personal computers (per 100 people)Households with a television (%)UsageInternational voice traffic total (minutes per person per month)Mobile telephone usage (minutes per user per month)Internet users (per 100 people)QualityPopulation covered by mobile cellular network (%)Fixed broadband Internet subscribers (% of total subscribers)International Internet bandwidth (bits per second per person)AffordabilityResidential fixed line tariff ($ a month)Mobile cellular prepaid tariff ($ a month)Fixed broadband Internet access tariff ($ a month)TradeICT goods exports (% of total goods exports)ICT goods imports (% of total goods imports)ICT service exports (% of total service exports)ApplicationsE-gov’t Web measure index (0–1, 1=highest presence)Secure Internet servers (per million people)
214 2011 The Little Data Book on Information and Communication Technology
Turks and Caicos IslandsCountry data
Highincome group
2000 2009 2009
High income
0.02 0.03 1,11785 93 77
.. .. 37,990
.. .. 2.0
.. .. 98
.. 72 91
.. ..
.. ..
.. ..
.. ..
.. ..
.. .. 3.0
.. .. 765
.. .. 15.5
.. .. 45.1
.. .. 111.2
.. .. 24.3
.. .. 65.4
.. .. 98
.. .. ..
.. .. 343
.. .. 72.3
.. .. 99
.. .. 89.2
.. .. 19,521
.. .. 22.8
.. .. 14.8
.. .. 28.8
3.9 4.1 12.24.9 4.6 13.3
.. .. 8.1
.. .. 0.46
.. 394.1 905.1

Economic and social contextPopulation (millions)Urban population (% of total)GNI per capita, World Bank Atlas method ($)GDP growth, 1995–2000 and 2000–09 (avg. annual %)Adult literacy rate (% ages 15 and older) Gross primary, secondary, and tertiary enrollment (%) StructureSeparate telecommunications regulatorStatus of main fixed-line telephone operatorLevel of competition (competition, partial comp., monopoly)
International long distance serviceMobile telephone serviceInternet service
Efficiency and capacityTelecommunications revenue (% of GDP)Mobile cellular and fixed-line subscribers per employeeTelecommunications investment (% of revenue) PerformanceAccessTelephone lines (per 100 people)Mobile cellular subscriptions (per 100 people)Fixed broadband Internet subscribers (per 100 people)Personal computers (per 100 people)Households with a television (%)UsageInternational voice traffic, total (minutes per person per month)Mobile telephone usage (minutes per user per month)Internet users (per 100 people)QualityPopulation covered by mobile cellular network (%)Fixed broadband Internet subscribers (% of total subscribers)International Internet bandwidth (bits per second per person)AffordabilityResidential fixed line tariff ($ a month)Mobile cellular prepaid tariff ($ a month)Fixed broadband Internet access tariff ($ a month)TradeICT goods exports (% of total goods exports)ICT goods imports (% of total goods imports)ICT service exports (% of total service exports)ApplicationsE-gov’t Web measure index (0–1, 1=highest presence)Secure Internet servers (per million people)
215The Little Data Book on Information and Communication Technology 2011
TuvaluEast Asia & Pacific Lower middle income
Country data
Lower middle-income group
2000 2009 2009
.. 0.01 3,81146 50 41
.. .. 2,321
.. .. 8.5
.. .. 80
.. .. 64
.. No
.. Public
.. M
.. M
.. M
.. .. 3.013 54 605
.. .. 22.4
.. 8.5 12.7
.. 12.5 57.8
.. 5.0 5.5
.. 8.0 4.5
.. 50 ..
.. .. ..
.. .. 342
.. 23.9 17.2
.. 18 770.0 38.9 40.1
.. 135 151
.. .. 4.7
.. .. 7.1
.. .. 30.4
.. .. 21.36.6 .. 18.4
.. .. 19.9
.. 0.01 0.24
.. .. 2.7

Economic and social contextPopulation (millions)Urban population (% of total)GNI per capita, World Bank Atlas method ($)GDP growth, 1995–2000 and 2000–09 (avg. annual %)Adult literacy rate (% ages 15 and older) Gross primary, secondary, and tertiary enrollment (%) StructureSeparate telecommunications regulatorStatus of main fixed-line telephone operatorLevel of competition (competition, partial comp., monopoly)
International long distance serviceMobile telephone serviceInternet service
Efficiency and capacityTelecommunications revenue (% of GDP)Mobile cellular and fixed-line subscribers per employeeTelecommunications investment (% of revenue) PerformanceAccessTelephone lines (per 100 people)Mobile cellular subscriptions (per 100 people)Fixed broadband Internet subscribers (per 100 people)Personal computers (per 100 people)Households with a television (%)UsageInternational voice traffic total (minutes per person per month)Mobile telephone usage (minutes per user per month)Internet users (per 100 people)QualityPopulation covered by mobile cellular network (%)Fixed broadband Internet subscribers (% of total subscribers)International Internet bandwidth (bits per second per person)AffordabilityResidential fixed line tariff ($ a month)Mobile cellular prepaid tariff ($ a month)Fixed broadband Internet access tariff ($ a month)TradeICT goods exports (% of total goods exports)ICT goods imports (% of total goods imports)ICT service exports (% of total service exports)ApplicationsE-gov’t Web measure index (0–1, 1=highest presence)Secure Internet servers (per million people)
216 2011 The Little Data Book on Information and Communication Technology
Country dataLow-
income group
2000 2009 2009
Sub-Saharan Africa Low income
Uganda
24 33 84612 13 29
270 460 5097.4 7.8 5.468 .. 6267 66 56
Yes YesMixed Mixed
C CC CC C
1.5 3.2 2.979 255 301
26.2 23.4 ..
0.3 0.7 1.20.5 28.7 26.60.0 0.1 0.10.2 1.7 0.9
6 7 ..
.. .. ..
.. .. ..0.2 9.8 2.7
16 100 530.0 20.0 5.4
0 36 7
.. 9.9 8.8
.. 7.9 8.0
.. 194.4 89.9
1.1 4.9 0.66.1 9.3 5.95.6 6.1 6.5
.. 0.10 0.09
.. 0.9 0.6

Economic and social contextPopulation (millions)Urban population (% of total)GNI per capita, World Bank Atlas method ($)GDP growth, 1995–2000 and 2000–09 (avg. annual %)Adult literacy rate (% ages 15 and older) Gross primary, secondary, and tertiary enrollment (%) StructureSeparate telecommunications regulatorStatus of main fixed-line telephone operatorLevel of competition (competition, partial comp., monopoly)
International long distance serviceMobile telephone serviceInternet service
Efficiency and capacityTelecommunications revenue (% of GDP)Mobile cellular and fixed-line subscribers per employeeTelecommunications investment (% of revenue) PerformanceAccessTelephone lines (per 100 people)Mobile cellular subscriptions (per 100 people)Fixed broadband Internet subscribers (per 100 people)Personal computers (per 100 people)Households with a television (%)UsageInternational voice traffic, total (minutes per person per month)Mobile telephone usage (minutes per user per month)Internet users (per 100 people)QualityPopulation covered by mobile cellular network (%)Fixed broadband Internet subscribers (% of total subscribers)International Internet bandwidth (bits per second per person)AffordabilityResidential fixed line tariff ($ a month)Mobile cellular prepaid tariff ($ a month)Fixed broadband Internet access tariff ($ a month)TradeICT goods exports (% of total goods exports)ICT goods imports (% of total goods imports)ICT service exports (% of total service exports)ApplicationsE-gov’t Web measure index (0–1, 1=highest presence)Secure Internet servers (per million people)
217The Little Data Book on Information and Communication Technology 2011
Europe & Central Asia Lower middle income
Country data
Lower middle-income group
2000 2009 2009
Ukraine
49 46 3,81167 68 41
700 2,800 2,321-1.9 5.6 8.5
99 100 8085 91 64
.. YesPublic Mixed
C CC C.. C
3.7 5.7 3.088 210 605
23.1 31.4 22.4
21.2 28.3 12.71.7 120.3 57.80.5 5.8 5.51.8 4.5 4.5
.. 97 ..
.. .. ..49 269 3420.7 33.3 17.2
75 100 770.0 72.0 40.1
1 206 151
.. 2.8 4.7
.. 4.3 7.1
.. 7.2 30.4
1.3 1.3 21.33.6 2.6 18.42.5 5.6 19.9
.. 0.35 0.240.9 13.3 2.7

Economic and social contextPopulation (millions)Urban population (% of total)GNI per capita, World Bank Atlas method ($)GDP growth, 1995–2000 and 2000–09 (avg. annual %)Adult literacy rate (% ages 15 and older) Gross primary, secondary, and tertiary enrollment (%) StructureSeparate telecommunications regulatorStatus of main fixed-line telephone operatorLevel of competition (competition, partial comp., monopoly)
International long distance serviceMobile telephone serviceInternet service
Efficiency and capacityTelecommunications revenue (% of GDP)Mobile cellular and fixed-line subscribers per employeeTelecommunications investment (% of revenue) PerformanceAccessTelephone lines (per 100 people)Mobile cellular subscriptions (per 100 people)Fixed broadband Internet subscribers (per 100 people)Personal computers (per 100 people)Households with a television (%)UsageInternational voice traffic total (minutes per person per month)Mobile telephone usage (minutes per user per month)Internet users (per 100 people)QualityPopulation covered by mobile cellular network (%)Fixed broadband Internet subscribers (% of total subscribers)International Internet bandwidth (bits per second per person)AffordabilityResidential fixed line tariff ($ a month)Mobile cellular prepaid tariff ($ a month)Fixed broadband Internet access tariff ($ a month)TradeICT goods exports (% of total goods exports)ICT goods imports (% of total goods imports)ICT service exports (% of total service exports)ApplicationsE-gov’t Web measure index (0–1, 1=highest presence)Secure Internet servers (per million people)
218 2011 The Little Data Book on Information and Communication Technology
United Arab EmiratesCountry data
High-income group
2000 2009 2009
High income
3 5 1,11778 78 77
19,330 26,370 37,9905.1 7.0 2.0
.. 90 9863 65 91
.. YesMixed Mixed
M PM PM P
2.7 3.1 3.0294 924 76528.9 9.8 15.5
31.5 33.9 45.144.1 232.1 111.2
6.5 30.6 24.312.4 33.1 65.4
.. 94 98
.. .. ..
.. .. 34323.6 82.2 72.3
100 100 990.7 49.0 89.2
5 13,233 19,521
.. 4.1 22.8
.. 4.1 14.8
.. 40.6 28.8
.. 2.0 12.2
.. 5.3 13.3
.. .. 8.1
.. 0.25 0.469.1 243.2 905.1

Economic and social contextPopulation (millions)Urban population (% of total)GNI per capita, World Bank Atlas method ($)GDP growth, 1995–2000 and 2000–09 (avg. annual %)Adult literacy rate (% ages 15 and older) Gross primary, secondary, and tertiary enrollment (%) StructureSeparate telecommunications regulatorStatus of main fixed-line telephone operatorLevel of competition (competition, partial comp., monopoly)
International long distance serviceMobile telephone serviceInternet service
Efficiency and capacityTelecommunications revenue (% of GDP)Mobile cellular and fixed-line subscribers per employeeTelecommunications investment (% of revenue) PerformanceAccessTelephone lines (per 100 people)Mobile cellular subscriptions (per 100 people)Fixed broadband Internet subscribers (per 100 people)Personal computers (per 100 people)Households with a television (%)UsageInternational voice traffic, total (minutes per person per month)Mobile telephone usage (minutes per user per month)Internet users (per 100 people)QualityPopulation covered by mobile cellular network (%)Fixed broadband Internet subscribers (% of total subscribers)International Internet bandwidth (bits per second per person)AffordabilityResidential fixed line tariff ($ a month)Mobile cellular prepaid tariff ($ a month)Fixed broadband Internet access tariff ($ a month)TradeICT goods exports (% of total goods exports)ICT goods imports (% of total goods imports)ICT service exports (% of total service exports)ApplicationsE-gov’t Web measure index (0–1, 1=highest presence)Secure Internet servers (per million people)
219The Little Data Book on Information and Communication Technology 2011
High income
Country dataHigh-
income group
2000 2009 2009
United Kingdom
59 62 1,11789 90 77
25,910 41,370 37,9903.4 2.0 2.0
.. .. 9890 88 91
Yes YesPrivate Private
C CC CC C
3.7 4.3 3.0380 .. 76530.4 .. 15.5
59.8 54.4 45.173.8 130.0 111.214.3 31.6 24.334.3 80.2 65.4
99 99 98
.. .. ..150 191 34326.8 83.2 72.3
99 100 990.6 89.1 89.2
1,469 39,664 19,521
.. 24.1 22.8
.. 16.5 14.8
.. 23.8 28.8
19.8 8.6 12.220.0 10.5 13.3
5.9 7.9 8.1
.. 0.77 0.46109.4 1,395.7 905.1

Economic and social contextPopulation (millions)Urban population (% of total)GNI per capita, World Bank Atlas method ($)GDP growth, 1995–2000 and 2000–09 (avg. annual %)Adult literacy rate (% ages 15 and older) Gross primary, secondary, and tertiary enrollment (%) StructureSeparate telecommunications regulatorStatus of main fixed-line telephone operatorLevel of competition (competition, partial comp., monopoly)
International long distance serviceMobile telephone serviceInternet service
Efficiency and capacityTelecommunications revenue (% of GDP)Mobile cellular and fixed-line subscribers per employeeTelecommunications investment (% of revenue) PerformanceAccessTelephone lines (per 100 people)Mobile cellular subscriptions (per 100 people)Fixed broadband Internet subscribers (per 100 people)Personal computers (per 100 people)Households with a television (%)UsageInternational voice traffic total (minutes per person per month)Mobile telephone usage (minutes per user per month)Internet users (per 100 people)QualityPopulation covered by mobile cellular network (%)Fixed broadband Internet subscribers (% of total subscribers)International Internet bandwidth (bits per second per person)AffordabilityResidential fixed line tariff ($ a month)Mobile cellular prepaid tariff ($ a month)Fixed broadband Internet access tariff ($ a month)TradeICT goods exports (% of total goods exports)ICT goods imports (% of total goods imports)ICT service exports (% of total service exports)ApplicationsE-gov’t Web measure index (0–1, 1=highest presence)Secure Internet servers (per million people)
220 2011 The Little Data Book on Information and Communication Technology
Country dataHigh-
income group
2000 2009 2009
High income
United States
282 307 1,11779 82 77
34,890 46,360 37,9904.4 2.0 2.0
.. .. 9890 92 91
Yes YesPrivate Private
C CC CC C
3.0 2.8 3.0239 416 76525.3 15.6 15.5
68.2 50.5 45.138.8 97.2 111.220.0 26.7 24.357.1 80.5 65.4
98 98 98
.. 18.0 ..387 829 34343.9 78.1 72.3
99 100 9922.4 104.1 89.2394 11,279 19,521
.. 12.8 22.8
.. 15.3 14.8
.. 20.0 28.8
23.4 13.0 12.218.9 15.1 13.3
3.4 4.6 8.1
.. 0.94 0.46274.0 1,443.3 905.1

Economic and social contextPopulation (millions)Urban population (% of total)GNI per capita, World Bank Atlas method ($)GDP growth, 1995–2000 and 2000–09 (avg. annual %)Adult literacy rate (% ages 15 and older) Gross primary, secondary, and tertiary enrollment (%) StructureSeparate telecommunications regulatorStatus of main fixed-line telephone operatorLevel of competition (competition, partial comp., monopoly)
International long distance serviceMobile telephone serviceInternet service
Efficiency and capacityTelecommunications revenue (% of GDP)Mobile cellular and fixed-line subscribers per employeeTelecommunications investment (% of revenue) PerformanceAccessTelephone lines (per 100 people)Mobile cellular subscriptions (per 100 people)Fixed broadband Internet subscribers (per 100 people)Personal computers (per 100 people)Households with a television (%)UsageInternational voice traffic, total (minutes per person per month)Mobile telephone usage (minutes per user per month)Internet users (per 100 people)QualityPopulation covered by mobile cellular network (%)Fixed broadband Internet subscribers (% of total subscribers)International Internet bandwidth (bits per second per person)AffordabilityResidential fixed line tariff ($ a month)Mobile cellular prepaid tariff ($ a month)Fixed broadband Internet access tariff ($ a month)TradeICT goods exports (% of total goods exports)ICT goods imports (% of total goods imports)ICT service exports (% of total service exports)ApplicationsE-gov’t Web measure index (0–1, 1=highest presence)Secure Internet servers (per million people)
221The Little Data Book on Information and Communication Technology 2011
Latin America & Caribbean Upper middle income
Country data
Upper middle-income group
2000 2009 2009
Uruguay
3 3 1,00291 92 75
7,100 9,010 7,5023.1 3.4 4.4
.. 98 9282 92 82
No YesPublic Public
M CC CP P
3.4 3.2 3.3243 692 57613.5 16.4 18.0
28.1 28.5 22.112.4 113.7 100.6
.. 8.6 19.410.6 13.6 11.2
93 91 93
.. 10.4 ..
.. 118 15710.6 55.5 34.6
100 100 94.. 85.0 41.6
18 903 1,120
.. 12.5 10.0
.. 12.7 8.8
.. 18.1 18.8
0.2 0.1 12.27.4 7.0 15.12.9 9.5 5.4
.. 0.48 0.3011.2 45.0 32.2

Economic and social contextPopulation (millions)Urban population (% of total)GNI per capita, World Bank Atlas method ($)GDP growth, 1995–2000 and 2000–09 (avg. annual %)Adult literacy rate (% ages 15 and older) Gross primary, secondary, and tertiary enrollment (%) StructureSeparate telecommunications regulatorStatus of main fixed-line telephone operatorLevel of competition (competition, partial comp., monopoly)
International long distance serviceMobile telephone serviceInternet service
Efficiency and capacityTelecommunications revenue (% of GDP)Mobile cellular and fixed-line subscribers per employeeTelecommunications investment (% of revenue) PerformanceAccessTelephone lines (per 100 people)Mobile cellular subscriptions (per 100 people)Fixed broadband Internet subscribers (per 100 people)Personal computers (per 100 people)Households with a television (%)UsageInternational voice traffic total (minutes per person per month)Mobile telephone usage (minutes per user per month)Internet users (per 100 people)QualityPopulation covered by mobile cellular network (%)Fixed broadband Internet subscribers (% of total subscribers)International Internet bandwidth (bits per second per person)AffordabilityResidential fixed line tariff ($ a month)Mobile cellular prepaid tariff ($ a month)Fixed broadband Internet access tariff ($ a month)TradeICT goods exports (% of total goods exports)ICT goods imports (% of total goods imports)ICT service exports (% of total service exports)ApplicationsE-gov’t Web measure index (0–1, 1=highest presence)Secure Internet servers (per million people)
222 2011 The Little Data Book on Information and Communication Technology
Europe & Central Asia Lower middle income
Country data
Lower middle-income group
2000 2009 2009
Uzbekistan
25 28 3,81137 37 41
630 1,100 2,3214.1 6.9 8.597 99 8072 73 64
.. NoPublic Public
P PC C.. ..
1.6 2.5 3.066 739 605
25.3 27.9 22.4
6.7 6.7 12.70.2 59.1 57.80.0 9.9 5.5
.. 3.1 4.5
.. .. ..
.. .. ..
.. 378 3420.5 16.9 17.2
75 93 770.0 3.2 40.1
0 46 151
.. 1.1 4.7
.. 1.1 7.1
.. 199.5 30.4
.. .. 21.3
.. .. 18.4
.. .. 19.9
.. 0.38 0.24
.. 0.2 2.7

Economic and social contextPopulation (millions)Urban population (% of total)GNI per capita, World Bank Atlas method ($)GDP growth, 1995–2000 and 2000–09 (avg. annual %)Adult literacy rate (% ages 15 and older) Gross primary, secondary, and tertiary enrollment (%) StructureSeparate telecommunications regulatorStatus of main fixed-line telephone operatorLevel of competition (competition, partial comp., monopoly)
International long distance serviceMobile telephone serviceInternet service
Efficiency and capacityTelecommunications revenue (% of GDP)Mobile cellular and fixed-line subscribers per employeeTelecommunications investment (% of revenue) PerformanceAccessTelephone lines (per 100 people)Mobile cellular subscriptions (per 100 people)Fixed broadband Internet subscribers (per 100 people)Personal computers (per 100 people)Households with a television (%)UsageInternational voice traffic, total (minutes per person per month)Mobile telephone usage (minutes per user per month)Internet users (per 100 people)QualityPopulation covered by mobile cellular network (%)Fixed broadband Internet subscribers (% of total subscribers)International Internet bandwidth (bits per second per person)AffordabilityResidential fixed line tariff ($ a month)Mobile cellular prepaid tariff ($ a month)Fixed broadband Internet access tariff ($ a month)TradeICT goods exports (% of total goods exports)ICT goods imports (% of total goods imports)ICT service exports (% of total service exports)ApplicationsE-gov’t Web measure index (0–1, 1=highest presence)Secure Internet servers (per million people)
223The Little Data Book on Information and Communication Technology 2011
Country data
Lower middle-income group
2000 2009 2009
East Asia & Pacific Lower middle income
Vanuatu
0.19 0.24 3,81122 25 41
1,440 2,620 2,3213.5 4.0 8.5
.. 82 8061 62 64
.. YesMixed Private
M P.. C.. P
4.2 3.4 3.039 131 605
.. 20.0 22.4
3.5 3.0 12.70.2 52.7 57.80.7 1.1 5.51.3 1.4 4.5
.. .. ..
.. .. ..
.. .. 3422.1 7.1 17.2
20 50 770.0 19.3 40.1
3 221 151
.. 23.7 4.7
.. 12.9 7.1
.. 168.2 30.4
.. 0.2 21.3
.. 3.2 18.4
.. .. 19.9
.. 0.01 0.2410.3 207.5 2.7

Economic and social contextPopulation (millions)Urban population (% of total)GNI per capita, World Bank Atlas method ($)GDP growth, 1995–2000 and 2000–09 (avg. annual %)Adult literacy rate (% ages 15 and older) Gross primary, secondary, and tertiary enrollment (%) StructureSeparate telecommunications regulatorStatus of main fixed-line telephone operatorLevel of competition (competition, partial comp., monopoly)
International long distance serviceMobile telephone serviceInternet service
Efficiency and capacityTelecommunications revenue (% of GDP)Mobile cellular and fixed-line subscribers per employeeTelecommunications investment (% of revenue) PerformanceAccessTelephone lines (per 100 people)Mobile cellular subscriptions (per 100 people)Fixed broadband Internet subscribers (per 100 people)Personal computers (per 100 people)Households with a television (%)UsageInternational voice traffic total (minutes per person per month)Mobile telephone usage (minutes per user per month)Internet users (per 100 people)QualityPopulation covered by mobile cellular network (%)Fixed broadband Internet subscribers (% of total subscribers)International Internet bandwidth (bits per second per person)AffordabilityResidential fixed line tariff ($ a month)Mobile cellular prepaid tariff ($ a month)Fixed broadband Internet access tariff ($ a month)TradeICT goods exports (% of total goods exports)ICT goods imports (% of total goods imports)ICT service exports (% of total service exports)ApplicationsE-gov’t Web measure index (0–1, 1=highest presence)Secure Internet servers (per million people)
224 2011 The Little Data Book on Information and Communication Technology
Latin America & Caribbean Upper middle income
Country data
Upper middle-income group
2000 2009 2009
Venezuela, RB
24 28 1,00290 94 75
4,100 10,090 7,5020.6 4.9 4.493 95 9267 89 82
Yes YesMixed Private
M CC CC C
3.3 3.5 3.3386 1,500 57626.3 11.9 18.0
10.4 24.2 22.122.4 99.1 100.6
1.1 7.2 19.44.5 9.3 11.2
.. 95 93
.. 6.6 ..
.. 119 1573.4 31.2 34.6
.. 90 941.6 91.5 41.6
6 628 1,120
.. 9.0 10.0
.. 28.6 8.8
.. 31.3 18.8
0.1 0.1 12.29.4 9.3 15.19.6 7.4 5.4
.. 0.30 0.303.7 7.4 32.2

Economic and social contextPopulation (millions)Urban population (% of total)GNI per capita, World Bank Atlas method ($)GDP growth, 1995–2000 and 2000–09 (avg. annual %)Adult literacy rate (% ages 15 and older) Gross primary, secondary, and tertiary enrollment (%) StructureSeparate telecommunications regulatorStatus of main fixed-line telephone operatorLevel of competition (competition, partial comp., monopoly)
International long distance serviceMobile telephone serviceInternet service
Efficiency and capacityTelecommunications revenue (% of GDP)Mobile cellular and fixed-line subscribers per employeeTelecommunications investment (% of revenue) PerformanceAccessTelephone lines (per 100 people)Mobile cellular subscriptions (per 100 people)Fixed broadband Internet subscribers (per 100 people)Personal computers (per 100 people)Households with a television (%)UsageInternational voice traffic, total (minutes per person per month)Mobile telephone usage (minutes per user per month)Internet users (per 100 people)QualityPopulation covered by mobile cellular network (%)Fixed broadband Internet subscribers (% of total subscribers)International Internet bandwidth (bits per second per person)AffordabilityResidential fixed line tariff ($ a month)Mobile cellular prepaid tariff ($ a month)Fixed broadband Internet access tariff ($ a month)TradeICT goods exports (% of total goods exports)ICT goods imports (% of total goods imports)ICT service exports (% of total service exports)ApplicationsE-gov’t Web measure index (0–1, 1=highest presence)Secure Internet servers (per million people)
225The Little Data Book on Information and Communication Technology 2011
East Asia & Pacific Lower middle income
Country data
Lower middle-income group
2000 2009 2009
Vietnam
78 87 3,81124 28 41
390 1,000 2,3216.7 7.6 8.590 93 8064 .. 64
.. NoPublic Mixed
M CM CP C
3.5 4.7 3.043 79 605
50.1 .. 22.4
3.3 35.2 12.71.0 101.5 57.80.1 6.2 5.50.8 9.6 4.570 .. ..
.. .. ..
.. .. 3420.3 27.5 17.2
.. 70 770.0 24.7 40.1
0 581 151
.. 2.1 4.7
.. 3.2 7.1
.. 15.4 30.4
5.9 3.8 21.37.5 7.1 18.4
.. .. 19.9
.. 0.30 0.240.1 3.1 2.7

Economic and social contextPopulation (millions)Urban population (% of total)GNI per capita, World Bank Atlas method ($)GDP growth, 1995–2000 and 2000–09 (avg. annual %)Adult literacy rate (% ages 15 and older) Gross primary, secondary, and tertiary enrollment (%) StructureSeparate telecommunications regulatorStatus of main fixed-line telephone operatorLevel of competition (competition, partial comp., monopoly)
International long distance serviceMobile telephone serviceInternet service
Efficiency and capacityTelecommunications revenue (% of GDP)Mobile cellular and fixed-line subscribers per employeeTelecommunications investment (% of revenue) PerformanceAccessTelephone lines (per 100 people)Mobile cellular subscriptions (per 100 people)Fixed broadband Internet subscribers (per 100 people)Personal computers (per 100 people)Households with a television (%)UsageInternational voice traffic total (minutes per person per month)Mobile telephone usage (minutes per user per month)Internet users (per 100 people)QualityPopulation covered by mobile cellular network (%)Fixed broadband Internet subscribers (% of total subscribers)International Internet bandwidth (bits per second per person)AffordabilityResidential fixed line tariff ($ a month)Mobile cellular prepaid tariff ($ a month)Fixed broadband Internet access tariff ($ a month)TradeICT goods exports (% of total goods exports)ICT goods imports (% of total goods imports)ICT service exports (% of total service exports)ApplicationsE-gov’t Web measure index (0–1, 1=highest presence)Secure Internet servers (per million people)
226 2011 The Little Data Book on Information and Communication Technology
Country dataHigh-
income group
2000 2009 2009
High income
Virgin Islands (U.S.)
0.11 0.11 1,11793 95 77
.. .. 37,990
.. .. 2.0
.. .. 98
.. .. 91
.. No
.. ..
.. ..
.. ..
.. ..
.. .. 3.0
.. .. 765
.. .. 15.5
62.9 68.3 45.132.2 73.3 111.2
.. .. 24.32.4 2.7 65.4
.. .. 98
.. .. ..
.. .. 34313.8 27.3 72.3
.. .. 99
.. .. 89.2414 411 19,521
.. .. 22.8
.. .. 14.8
.. .. 28.8
.. .. 12.2
.. .. 13.3
.. .. 8.1
.. .. 0.4636.8 373.5 905.1

Economic and social contextPopulation (millions)Urban population (% of total)GNI per capita, World Bank Atlas method ($)GDP growth, 1995–2000 and 2000–09 (avg. annual %)Adult literacy rate (% ages 15 and older) Gross primary, secondary, and tertiary enrollment (%) StructureSeparate telecommunications regulatorStatus of main fixed-line telephone operatorLevel of competition (competition, partial comp., monopoly)
International long distance serviceMobile telephone serviceInternet service
Efficiency and capacityTelecommunications revenue (% of GDP)Mobile cellular and fixed-line subscribers per employeeTelecommunications investment (% of revenue) PerformanceAccessTelephone lines (per 100 people)Mobile cellular subscriptions (per 100 people)Fixed broadband Internet subscribers (per 100 people)Personal computers (per 100 people)Households with a television (%)UsageInternational voice traffic, total (minutes per person per month)Mobile telephone usage (minutes per user per month)Internet users (per 100 people)QualityPopulation covered by mobile cellular network (%)Fixed broadband Internet subscribers (% of total subscribers)International Internet bandwidth (bits per second per person)AffordabilityResidential fixed line tariff ($ a month)Mobile cellular prepaid tariff ($ a month)Fixed broadband Internet access tariff ($ a month)TradeICT goods exports (% of total goods exports)ICT goods imports (% of total goods imports)ICT service exports (% of total service exports)ApplicationsE-gov’t Web measure index (0–1, 1=highest presence)Secure Internet servers (per million people)
227The Little Data Book on Information and Communication Technology 2011
Middle East & North Africa Lower middle income
Country data
Lower middle-income group
2000 2009 2009
West Bank and Gaza
3 4 3,81172 72 41
1,560 1,250 2,3217.4 -0.9 8.5
.. 95 8077 78 64
.. No
.. ..
.. ..
.. ..
.. ..
0.4 0.8 3.0263 880 60546.2 18.4 22.4
9.1 8.6 12.75.9 30.3 57.80.2 2.7 5.53.4 5.5 4.5
.. 95 ..
.. .. ..
.. .. 3421.2 8.8 17.2
95 95 770.0 54.5 40.1
6 313 151
.. .. 4.7
.. .. 7.1
.. .. 30.4
.. .. 21.3
.. .. 18.40.4 5.4 19.9
.. .. 0.24
.. 3.6 2.7

Economic and social contextPopulation (millions)Urban population (% of total)GNI per capita, World Bank Atlas method ($)GDP growth, 1995–2000 and 2000–09 (avg. annual %)Adult literacy rate (% ages 15 and older) Gross primary, secondary, and tertiary enrollment (%) StructureSeparate telecommunications regulatorStatus of main fixed-line telephone operatorLevel of competition (competition, partial comp., monopoly)
International long distance serviceMobile telephone serviceInternet service
Efficiency and capacityTelecommunications revenue (% of GDP)Mobile cellular and fixed-line subscribers per employeeTelecommunications investment (% of revenue) PerformanceAccessTelephone lines (per 100 people)Mobile cellular subscriptions (per 100 people)Fixed broadband Internet subscribers (per 100 people)Personal computers (per 100 people)Households with a television (%)UsageInternational voice traffic total (minutes per person per month)Mobile telephone usage (minutes per user per month)Internet users (per 100 people)QualityPopulation covered by mobile cellular network (%)Fixed broadband Internet subscribers (% of total subscribers)International Internet bandwidth (bits per second per person)AffordabilityResidential fixed line tariff ($ a month)Mobile cellular prepaid tariff ($ a month)Fixed broadband Internet access tariff ($ a month)TradeICT goods exports (% of total goods exports)ICT goods imports (% of total goods imports)ICT service exports (% of total service exports)ApplicationsE-gov’t Web measure index (0–1, 1=highest presence)Secure Internet servers (per million people)
228 2011 The Little Data Book on Information and Communication Technology
Country data
Lower middle-income group
2000 2009 2009
Middle East & North Africa Lower middle income
Yemen, Rep.
18 24 3,81126 31 41
400 1,060 2,3215.6 3.9 8.5
.. 62 8049 54 64
.. No
.. Public
M MC CM C
1.0 1.2 3.072 .. 605
51.1 .. 22.4
1.9 5.1 12.70.2 16.3 57.80.0 1.3 5.50.2 2.8 4.5
.. 44 ..
.. .. ..
.. .. 3420.1 1.8 17.2
.. 68 770.0 0.0 40.1
0 28 151
.. 0.7 4.7
.. 4.8 7.1
.. 219.9 30.4
.. 0.1 21.3
.. 2.5 18.428.1 8.5 19.9
.. 0.05 0.24
.. 0.3 2.7

Economic and social contextPopulation (millions)Urban population (% of total)GNI per capita, World Bank Atlas method ($)GDP growth, 1995–2000 and 2000–09 (avg. annual %)Adult literacy rate (% ages 15 and older) Gross primary, secondary, and tertiary enrollment (%) StructureSeparate telecommunications regulatorStatus of main fixed-line telephone operatorLevel of competition (competition, partial comp., monopoly)
International long distance serviceMobile telephone serviceInternet service
Efficiency and capacityTelecommunications revenue (% of GDP)Mobile cellular and fixed-line subscribers per employeeTelecommunications investment (% of revenue) PerformanceAccessTelephone lines (per 100 people)Mobile cellular subscriptions (per 100 people)Fixed broadband Internet subscribers (per 100 people)Personal computers (per 100 people)Households with a television (%)UsageInternational voice traffic, total (minutes per person per month)Mobile telephone usage (minutes per user per month)Internet users (per 100 people)QualityPopulation covered by mobile cellular network (%)Fixed broadband Internet subscribers (% of total subscribers)International Internet bandwidth (bits per second per person)AffordabilityResidential fixed line tariff ($ a month)Mobile cellular prepaid tariff ($ a month)Fixed broadband Internet access tariff ($ a month)TradeICT goods exports (% of total goods exports)ICT goods imports (% of total goods imports)ICT service exports (% of total service exports)ApplicationsE-gov’t Web measure index (0–1, 1=highest presence)Secure Internet servers (per million people)
229The Little Data Book on Information and Communication Technology 2011
Sub-Saharan Africa Low income
Country dataLow-
income group
2000 2009 2009
Zambia
10 13 84635 36 29
300 960 5092.2 5.4 5.468 71 6246 69 56
Yes YesPublic Public
M MC CC C
2.0 2.6 2.959 175 301
12.3 29.3 ..
0.8 0.7 1.20.9 34.1 26.60.1 0.1 0.10.7 1.1 0.919 24 ..
.. .. ..
.. .. ..0.2 6.3 2.7
51 50 530.3 31.4 5.4
0 8 7
.. 24.6 8.8
.. 12.7 8.0
.. 51.4 89.9
0.0 0.1 0.66.7 3.7 5.90.1 8.0 6.5
.. 0.10 0.09
.. 1.2 0.6

Economic and social contextPopulation (millions)Urban population (% of total)GNI per capita, World Bank Atlas method ($)GDP growth, 1995–2000 and 2000–09 (avg. annual %)Adult literacy rate (% ages 15 and older) Gross primary, secondary, and tertiary enrollment (%) StructureSeparate telecommunications regulatorStatus of main fixed-line telephone operatorLevel of competition (competition, partial comp., monopoly)
International long distance serviceMobile telephone serviceInternet service
Efficiency and capacityTelecommunications revenue (% of GDP)Mobile cellular and fixed-line subscribers per employeeTelecommunications investment (% of revenue) PerformanceAccessTelephone lines (per 100 people)Mobile cellular subscriptions (per 100 people)Fixed broadband Internet subscribers (per 100 people)Personal computers (per 100 people)Households with a television (%)UsageInternational voice traffic total (minutes per person per month)Mobile telephone usage (minutes per user per month)Internet users (per 100 people)QualityPopulation covered by mobile cellular network (%)Fixed broadband Internet subscribers (% of total subscribers)International Internet bandwidth (bits per second per person)AffordabilityResidential fixed line tariff ($ a month)Mobile cellular prepaid tariff ($ a month)Fixed broadband Internet access tariff ($ a month)TradeICT goods exports (% of total goods exports)ICT goods imports (% of total goods imports)ICT service exports (% of total service exports)ApplicationsE-gov’t Web measure index (0–1, 1=highest presence)Secure Internet servers (per million people)
230 2011 The Little Data Book on Information and Communication Technology
Country dataLow-
income group
2000 2009 2009
Sub-Saharan Africa Low income
Zimbabwe
12 13 84634 38 29
480 360 5091.5 -7.5 5.4
.. 92 6258 56 56
No YesPublic Public
M PC PC C
2.4 5.2 2.9112 711 30190.9 4.1 ..
2.0 3.1 1.22.1 23.9 26.60.2 0.8 0.11.6 7.6 0.9
.. 31 ..
.. 1.6 ..
.. 98 ..0.4 11.4 2.7
.. 75 532.2 18.1 5.4
1 17 7
.. .. 8.8
.. .. 8.0
.. .. 89.9
0.2 0.6 0.64.0 4.8 5.9
.. .. 6.5
.. 0.13 0.090.1 1.0 0.6

231The Little Data Book on Information and Communication Technology 2011
GlossaryAdult literacy rate is the percentage of people ages 15 and older who can, with understanding, read and write a short, simple statement about their everyday life. (United Nations Educational, Scientific, and Cultural Organiza-tion Institute for Statistics)
E-government Web measure index measures the level of sophistication of a government’s online presence based on four stages of e-government evolu-tion: emerging presence, enhanced presence, transactional presence, and connected presence. A value of 0 indicates the lowest presence, a value of 1 the highest. Data listed for 2009 are for 2010. (United Nations Depart-ment of Economic and Social Affairs and United Nations Public Administra-tion Network)
Fixed broadband Internet access tariff is the lowest sampled cost per 100 kilobits per second per month and are calculated from low- and high-speed monthly service charges. Monthly charges do not include installation fees or modem rentals. (International Telecommunication Union)
Fixed broadband Internet subscribers are the number of broadband sub-scribers with a digital subscriber line, cable modem, or other high-speed technology. (International Telecommunication Union)
GDP growth is the annual percentage growth rate of gross domestic prod-uct (GDP) at market prices based on constant local currency. Aggregates are based on constant 2000 U.S. dollars. GDP is the sum of gross value added by all resident producers in the economy plus any product taxes and minus any subsidies not included in the value of the products. It is calcu-lated without making deductions for depreciation of fabricated assets or for depletion and degradation of natural resources. (World Bank and Organisa-tion for Economic Co-operation and Development)
GNI per capita, World Bank Atlas method, is gross national income (GNI) converted to U.S. dollars using the World Bank Atlas method divided by the midyear population. GNI is the sum of value added by all resident produc-ers plus any product taxes (less subsidies) not included in the valuation of output plus net receipts of primary income (compensation of employees and property income) from abroad. GNI, calculated in national currency, is usually converted to U.S. dollars at official exchange rates for comparisons across economies. The World Bank Atlas method is used to smooth fluctuations in prices and exchange rates. It averages the exchange rate for a given year and the two preceding years, adjusted for differences in rates of inflation between the country and the Euro area, Japan, the United Kingdom, and the United States. (World Bank)
Gross primary, secondary, and tertiary enrollment is the combined number of students enrolled in primary, secondary, and tertiary levels of education, regardless of age, as a percentage of the population of official school age for the three levels. (United Nations Educational, Scientific and Cultural Organization Institute for Statistics)
Households with a television are the percentage of households with a tele-vision (a standalone device capable of receiving broadcast television sig-nals using such access means as over-the-air reception, cable, or satellite. (International Telecommunication Union)

232 2011 The Little Data Book on Information and Communication Technology
ICT goods exports and imports are goods that are intended to fulfill the function of information processing and communication by electronic means, including transmission and display, or that use electronic processing to detect, measure, or record physical phenomena or to control a physical pro-cess. They include telecommunications equipment, computer and related equipment, electronic components, audio and video equipment, and other goods. Re-exports (exports of foreign goods in the same state as previously imported) are included. (United Nations Statistics Division)
ICT service exports comprise communications services (telecommunica-tions, business network services, teleconferencing, support services, and postal services) and computer and information services (database, data processing, software design and development, maintenance and repair, and news agency services). (International Monetary Fund)
International Internet bandwidth is the capacity that backbone operators provide to carry Internet traffic. (International Telecommunication Union and TeleGeography)
International voice traffic, total is the sum of international incoming and out-going telephone traffic (in minutes). (International Telecommunication Union)
Internet users are people who pay for Internet access (dialup, leased line, and fixed broadband) and people with access to the worldwide computer network who do not directly pay (for example, people who are a member of a household with access and people who access the Internet from work or school). (International Telecommunication Union)
Level of competition, international long distance service, is the level of competition for international long distance telephone calls (M = monopoly, P = partial competition, C = full competition). (International Telecommunica-tion Union and World Bank)
Level of competition, Internet service, is the level of competition for retail Internet access service (M = monopoly, P = partial competition, C = full com-petition). (International Telecommunication Union and World Bank)
Level of competition, mobile telephone service, is the level of competition for digital cellular mobile services (M = monopoly, P = partial competition, C = full competition). (International Telecommunication Union and World Bank)
Mobile cellular and fixed-line subscribers per employee are telephone sub-scribers (fixed-line plus mobile) divided by the total number of telecommuni-cations employees. (International Telecommunication Union)
Mobile cellular subscriptions are the number of subscriptions—including postpaid and prepaid subscriptions—to a public mobile telephone service using cellular technology that provides access to the public switched tele-phone network. (International Telecommunication Union)
Mobile cellular prepaid tariff is based on the Organisation for Economic Cooperation and Development’s low-user definition, which includes the cost of monthly mobile use for 25 outgoing calls per month spread over the same network, other mobile networks, and mobile to fixed-line calls and during peak, off-peak, and weekend times as well as 30 text messages per month. (International Telecommunication Union)
Glossary

233The Little Data Book on Information and Communication Technology 2011
Mobile telephone usage is the minutes of use per mobile (both prepaid and contract) user per month. (Wireless Intelligence)
Personal computers are self-contained computers designed to be used by a single individual. (International Telecommunication Union)
Population is based on the de facto definition of population, which counts all residents regardless of legal status or citizenship, except for refugees not permanently settled in the country of asylum, who are generally con-sidered part of the population of their country of origin. Data are midyear estimates. (World Bank)
Population covered by mobile cellular network is the percentage of people who live within areas served by a mobile cellular signal regardless of whether they use it. (International Telecommunication Union)
Residential fixed-line tariff is the monthly subscription charge plus the cost of 30 three-minute local calls (15 peak and 15 off-peak). (International Tele-communication Union)
Secure Internet servers are the number of servers using encryption tech-nology for Internet transactions. Data listed for 2009 are for December 2010. (Netcraft)
Separate telecommunications regulator indicates whether the country has a separate telecommunications regulator. (International Telecommunica-tion Union)
Status of main fixed-line telephone operator indicates whether the incum-bent fixed-line operator is a public or private entity. Public refers to a fully state-owned operator, private refers to a fully private operator, and mixed refers to a partially private operator. (International Telecommunication Union and World Bank)
Telecommunications revenue is revenue from the provision of telecom-munications services such as fixed line, mobile, and data. (International Telecommunication Union)
Telecommunications investment is total telecommunications investment (capital expenditure) as a percentage of telecommunications revenue. (Inter-national Telecommunication Union)
Telephone lines are lines that connect a subscriber’s terminal equipment to the public switched telephone network and that have a port on a telephone exchange. Integrated services digital network channels and fixed wireless subscribers are included. (International Telecommunication Union)
Urban population is the midyear population of areas defined as urban in each country and reported to the United Nations. (United Nations)