the effect of habitat type on rodent, shrew and sengi
TRANSCRIPT

THE EFFECT OF HABITAT TYPE ON RODENT, SHREW AND SENGI SPECIES
ABUNDANCE, RICHNESS, DIVERSITY AND COMPOSITION AT FARM
KARACHAS, OUTJO, NAMIBIA
A RESEARCH THESIS SUBMITTED IN PARTIAL FULFILMENT OF THE
REQUIREMENTS FOR THE DEGREE OF MASTER OF SCIENCE
(BIODIVERSITY MANAGEMENT AND RESEARCH)
OF
THE UNIVERSITY OF NAMIBIA
BY
SALMI KAPALA
201201786
APRIL 2021
SUPERVISOR: Prof. John K. Mfune (University of Namibia)

i
ABSTRACT
Natural habitats have been fragmented by many human activities including farming, hence
affecting vegetation structure. Despite being very dry, Namibia has many farms in which
game, livestock and crop farming are practiced. Yet such activities affect populations of
many other organisms including small mammals such as rodents, shrews and sengis. The
present study investigated the effect of habitat type on rodent, shrew and sengi species
abundance, richness, diversity and composition in selected open grassland habitat and
woody habitats at Karachas Farm, Outjo, Namibia. Sampling at each habitat type was
replicated twice. Woody plant species abundance, composition, height and percentage
grass cover were determined and compared between the open grassland and woody
habitats. A capture-mark-recapture (CMR) technique was employed to obtain data on
rodents, shrews and sengis. Each habitat type was sampled over five consecutive nights
using Sherman live traps. The result of t-, chi-square and Mann-Whitney tests,
respectively, showed a statistically significant difference in the mean abundance of woody
plants, plant height, and plant species richness between the open grassland and woody
habitats. A Mann-Whitney test showed no statistically significant difference in the
percentage grass cover between the open grassland and woody habitats. A Hierarchical
Cluster Analysis (HCA) based on a Bray Curtis Similarity Index showed a low (31%)
level of similarity in woody plants species composition between the open grassland and
woody habitats. A total of 800 trap-nights yielded 145 individuals comprising 6 rodent
red veld rat (Aethomys chrysophilus), namaqua rock mouse (Micaelamys namaquensis),
bushveld gerbil (Gebilliscus leucogaster), maltimammate mouse (Mastomys natalensis),
tree mouse (Thallomys paedulcus), pouched mouse (Saccostomus campestris), sengi
(Elephantulus intufi) and shrew (Crocidura hirta) species. t- tests and a Mann- Whitney
test, respectively, showed no statistically significant variation in rodent, shrew and sengi
species abundance, richness, and diversity between the open and woody habitats. An HCA
based on a Bray Curtis Similarity Index showed a high (63 %) level of similarity in rodent,
shrew and sengi species composition between the open grassland and woody habitats. The
present study therefore showed insufficient evidence to support the hypotheses that habitat
type has an effect on rodent, shrew and sengi species abundance, richness, diversity and
composition. Further studies should focus on researching the range of factors that drive

ii
rodent, shrew and sengi diversity in different habitat types of the farm. The study also
recommend the use of more than one trap type when surveying rodent, shrew and sengi
communities.
Keywords: rodents, shrews, sengis, abundance, richness, diversity, composition, open
grassland, woody plants/habitat, plant height, grass cover, Outjo, Namibia

iii
TABLE OF CONTENTS
ABSTRACT ................................................................................................................................... i
LIST OF FIGURES .................................................................................................................... vii
LIST OF TABLES ........................................................................................................................ x
APPENDICES .............................................................................................................................. xi
LIST OF ABBREVIATIONS AND/ OR ACRONYMYS ....................................................... xii
ACKNOWLEDGEMENTS ...................................................................................................... xiv
DEDICATIONS .......................................................................................................................... xv
DECLARATIONS ..................................................................................................................... xvi
CHAPTER 1: INTRODUCTION ............................................................................................... 1
1.1 Background of the study ...................................................................................................... 1
1.2 Problem statement ................................................................................................................ 3
1.3 Research objectives .............................................................................................................. 4
1.3.1 General objective .......................................................................................................... 4
1.3 2 Specific objectives ........................................................................................................ 4
1.4 Research hypotheses ............................................................................................................ 5
1.5 Significance of the study ...................................................................................................... 5
1.6 Limitations of the study ....................................................................................................... 7
CHAPTER 2: LITERATURE REVIEW ................................................................................... 8
2.1 The biology of rodents, shrews and sengis .......................................................................... 8

iv
2.2 Significance of rodents, shrews and sengis in ecosystems ................................................ 10
2.3 Habitat type in terrestrial ecosystems ................................................................................ 11
2.3.1 Open grassland habitat ................................................................................................ 12
2.3.1 Woody habitat ............................................................................................................. 13
2.4 The influence of habitat type on rodent, shrew and sengi ecology .................................... 13
2.5 The effect of land use on rodent, shrew and sengi ecology ............................................... 16
CHAPTER 3: MATERIALS AND METHODS ..................................................................... 19
3.1 Description of the study area ............................................................................................. 19
3.1.1 Location and extent ..................................................................................................... 19
3.1.2 Climate ........................................................................................................................ 20
3.1.3 Fauna ........................................................................................................................... 20
3.1.4 Flora ............................................................................................................................ 21
3.1.5 Geology and soil ......................................................................................................... 22
3.2 Data collection ................................................................................................................... 22
3.2.1 Selection of the study sites .......................................................................................... 22
3.2.2 Vegetation structure parameters .................................................................................. 24
3.2.3 Rodent, shrew and sengi sampling .............................................................................. 26
3.3 Data analysis ...................................................................................................................... 29
3.3.1 Vegetation structure parameters .................................................................................. 29
3.3.2 Rodent, shrew and sengi species abundance and richness .......................................... 29

v
3.3.3 Statistical analysis ....................................................................................................... 30
CHAPTER 4: RESULTS .......................................................................................................... 33
4.1 Vegetation structure ........................................................................................................... 33
4.1.1 Woody plants species abundance ................................................................................ 34
4.1.2 Height structure ........................................................................................................... 35
4.1.3 Woody plant species richness ..................................................................................... 36
4.1.4 Woody plant species composition ............................................................................... 37
4.1.5 Grass cover .................................................................................................................. 38
4.2 Rodent, shrew and sengi species community structure and composition .......................... 39
4.2.1 Rodent, shrew and sengi species abundance ............................................................... 39
4.2.2 Rodent, shrew and sengi species richness ................................................................... 41
4.2.3 Rodent, shrew and sengi species diversity .................................................................. 42
4.2.4 Rodent, shrew and sengi species composition ............................................................ 44
CHAPTER 5: DISCUSSION .................................................................................................... 46
5.1 Comparison of vegetation characteristics in the open grassland and woody habitats. ....... 46
5.2 Small mammal community structure and composition ...................................................... 46
5.2.1 Rodent, shrew and sengi species abundance ............................................................... 46
5.2.2 Rodent, shrew and sengi species richness ................................................................... 51
5.2.3 Rodent, shrew and sengi species diversity .................................................................. 52
5.2.4 Rodent, shrew and sengi species composition ............................................................ 54

vi
CHAPTER 6: CONCLUSIONS AND RECOMMENDATIONS ....................................... 59
6.1 Conclusions .................................................................................................................. 59
6.2 Recommendations: ....................................................................................................... 60
REFERENCES ........................................................................................................................... 61
APPENDICES ............................................................................................................................ 86
vii
LIST OF FIGURES
Figure 1: A biome map of Namibia (with an insert map of Sothern Africa) showing its
biomes and the study area (Farm Karachas, Outjo District, Kunene (Adopted from: Map
of Namibian biomes, Atlas of Namibia:
http://www.unikoeln.de/sfb389/e/e1/download/atlas_namibia/pics/living_resources/biom
es.jpg ................................................................................................................................ 19
Figure 2: A typical sampled open grassland habitat at Farm Karachas in Outjo. Photo by
S. Kapala (2020)............................................................................................................... 23
Figure 3: A typical sampled woody habitat at Farm Karachas in Outjo. Photo by S. Kapala
(2020). .............................................................................................................................. 24
Figure 4: A systematic diagram of the plots used to sample vegetation parameters in the
open grassland and woody habitat at Farm Karachas, Outjo, Namibia ........................... 25
Figure 5: A) Balls of bait including a mixture of peanut butter and oats and B) A typical
sampled small mammal in a zip-lock bag. Photo by Kapala (2020). ............................... 27
Figure 6: The mean (±SE) woody species abundance in the open grassland and woody
habitat at Farm Karachas, Outjo....................................................................................... 34
Figure 7: Tree height (m) classes in the open grassland and woody habitat at Farm
Karachas, Outjo ................................................................................................................ 35
Figure 8: A box and whisker plot of the median species richness of woody plant species
in the open grassland habitat and woody habitat at farm Karachas, Outjo. The horizontal

viii
line (thick) inside the box represents the median. The top part of each box represents the
75th percentile (upper quartile) while the lower part is the 25th percentile (lower quartile).
The end of each line above and below the open box indicates the largest and lowest values,
respectively, that are not outliers. Extreme values are outside the box. .......................... 36
Figure 9: A Hierarchical Cluster Analysis (HCA) dendrogram illustrating the
classification of habitat types into two clusters based on the variation of woody plant
species composition in the open grassland and woody habitat types at sites 1 and 2 at Farm
Karachas, Outjo. OPEN1 = open grassland habitat, site 1; OPEN2 = open grassland
habitat, site 2; WOODY1 = woody habitat, site 1; and WOODY2 = woody habitat, site 2.
.......................................................................................................................................... 37
Figure 10: The mean percentage (%) grass cover in the open grassland and woody habitats
at Farm Karachas, Outjo. The horizontal line (thick) inside the box is the median. The top
part of each box represents the 75th percentile (upper quartile) while the lower part is the
25th percentile (lower quartile). The end of each line above and below the open box
indicates the largest and lowest values, respectively, that are not outliers. ..................... 39
Figure 11: The mean (± Standard Error (SE)) rodent, shrew and sengi species richness in
the open grassland and woody habitats at Farm Karachas, Outjo.................................... 42
Figure 12: A box and whisker plot comparing the median of rodent, shrew and sengi
species diversity (H’) between the open grassland and woody habitats at Farm Karachas,
Outjo. ................................................................................................................................ 43
ix
Figure 13: A dendrogram of a hierarchical cluster analysis (HCA) based on Bray-Curtis
similarity matrix using binary data showing rodent, shrew and sengi species composition
between open grassland and woody habitat (site 1 and 2) at Farm Karachas. OPEN1 =
open grassland, site 1; OPEN2 = open grassland, site 2; WOODY1 = woody habitat, site
1; and WOODY2 = woody habitat, site 2. ....................................................................... 44

x
LIST OF TABLES
Table 1: Rodent, shrew and sengi species abundance recorded during the study period in
the open grassland and woody habitats at Farm Karachas, Outjo. n = number of individuals
sampled; % = relative abundance. .................................................................................... 40

xi
APPENDICES
Appendix 1: Research permission letter ......................................................................... 86

xii
LIST OF ABBREVIATIONS AND/ OR ACRONYMYS
~ About
(α) Alpha
CMR Capture-Mark-Recapture
°C Degrees Celsius
df Degree of freedom
= Equal to
E East
i.e. For example
GPS Geographic Position System
g Grams
> Greater than
HCA Hierarchical Cluster Analysis
< Less than
Mastomys spp Mastomys species
m Metres
PAST Paleontological Statistics
% Percentage

xiii
± Plus minus
p Probability
n Sample size
H’ Shannon Diversity Index
sp. Single species
S South
SE Standard Error
SPSS Statistical Software Package for Social Science
Subsp Subspecies
e.g., Such as
- To
Spp. Two or more species

xiv
ACKNOWLEDGEMENTS
Firstly, I would like to thank the Almighty God for the wisdom, courage and strength he
granted me to carry out this research project. Secondly, I give my greatest appreciation to
Prof. J. K. Mfune for his role as my supervisor. His generous support, helpful comments,
field guidance and assistance throughout all aspect of my research is very much
appreciated.
My deepest appreciation is due to Mr. F. Puriza and his workers of Farm Karachas for
their good hospitality and for allowing me to do my field work on their farm. Furthermore,
I would like acknowledge Mr. A. Mbangu for all the logistical arrangements, for helping
me throughout the data collection period and for being a good driver. I would like to give
my sincere gratitude to Ms N. K. Iiyambo for her guidance and constructive contribution
during my write ups despite her busy schedule.
I thank the University of Namibia for making this study possible through funding. I would
also like to thank the Department of Biological Sciences, University of Namibia for
providing all the necessary and required equipment and tools needed for data collection.
Not to forget my lecturers, I thank them for their academic guidance.
Lastly, I would like to thank my parents, Mr. and Mrs. Kapala for their continued parental
support throughout my study. I also thank my sister Maria Kapala and my friend Jonathan
Haimbodi for their love, support and tolerance throughout my study.

xv
DEDICATIONS
This thesis is dedicated to my mother, Mrs. Ndinomukulili Kapala, whose love, support
and encouragement have enriched my soul to pursue and complete this research.

xvi
DECLARATIONS
I, Salmi Kapala, hereby declare that this study is my own work and is a true reflection of
my research, and that this work, or any part thereof has not been submitted for a degree at
any other institution.
No part of this thesis/dissertation may be reproduced, stored in any retrieval system, or
transmitted in any form, or by means (e.g., electronic, mechanical, photocopying,
recording or otherwise) without the prior permission of the author, or The University of
Namibia in that behalf.
I, Salmi Kapala, grant The University of Namibia the right to reproduce this thesis in
whole or in part, in any manner or format, which The University of Namibia may deem
fit.
………………………… ………………………… …………………….
Name of Student Signature Date
1
CHAPTER 1: INTRODUCTION
1.1 Background of the study
African terrestrial ecosystems are important wildlife habitats offering multiple resources
and services including food, fuel, and shelter needed by species for survival (Lacher et al.,
2019). Complex and dynamic interactions between climate, soils, and disturbances (e.g.,
fire and herbivory) determines the structure and productivity of habitats (Sebata, 2017).
In Namibia terrestrial ecosystems occupy about 64% of the land area (Sweet & Burke,
2000), of which the largest portion is utilized for both commercial and subsistence
livestock farming with natural vegetation for grazing (Mendelsohn et al., 2002). Farms
provide various habitats including, native woodland, freshwater habitats, and species-rich
grassland needed for animal survival and reproduction (Malmstrom, 2012; Sheridan et al.,
2017).
Small mammals (mammal species that weigh less than 5 kg as adults; Hoffmann et al.,
2010; Merritt, 2010) are one of the most common vertebrates that utilise in a terrestrial
ecosystems (Łopucki & Mróz, 2016) and they are considered to be good indicator of
ecosystem functionality and health, mainly in African savannas (Avenant, 2011). Merritt
(2010) reported that 90% of ~5,416 recognized species of living mammals are “small”.
There is a considerable range of small mammal species that include species such as mice,
voles, shrews, gerbils, flying squirrel, and chipmunks (Hoffmann et al., 2010; Merritt,
2010). Rodents are the most varied group of small mammals with numerous habitat
associations, and they account for ~44% of mammalian species (Wolff, 2007). Shrew
made up ~312 species (Bantihun & Bekele, 2015), whereas sengis (elephant shrews) are

2
restricted to Africa, with the exception of western Africa and the vast Sahara region
(Rathbun, 2009). Rodents and shrews exploit a range of habitats globally (Datiko &
Bekele, 2014). Thus, even minor changes in the habitat may affect the abundance,
diversity, and composition of some rodent species (Malcom & Ray, 2000; Flores-
Peredoand & Vázquez-Domínguez, 2016).
Numerous activities imposed in ecosystems by humans (e.g., clearing land for agricultural
purposes) and wildlife (e.g., heavy grazing) result in changes in rodent and shrew species
composition and diversity (Hoffmann & Zeller, 2005). Farms are no exception as activities
such as grazing by herbivores, trampling by large wildlife (Ministry of Environment and
Tourism, 2013), burning, and biological processes such as woody encroachment (Luza et
al., 2016), usually damage habitat integrity and persistence of species thus influencing
vegetation structure and cover needed by rodents to survive (Magige, 2016). Intensive
grazing by large mammals degrades the land and makes it inhabitable for rodents because
of loss of cover and food resources (Liu et al., 2008; Bantihun & Bekele, 2015). For
instance, continuous and selective grazing by megaherbivores may lead to consistently
reduced vegetation cover, known to be unfavourable for small mammals (Hauptfleisch &
Avenant, 2015). The absence of most common rodent species such as the multimammate
mouse (Mastomys natalensis) and unstriped grass rats (Arvicanthis species) in some
habitats of the Komto protected forest in Western Ethiopia in sub-Saharan Africa may be
attributed to a prolonged habitat disturbance and the application of rodenticides (Erena,
Yosef & Bekele, 2011).
The reduction or loss of vegetation cover adversely affects rodent and shrew species
abundance, diversity and composition because they are highly exposed to predation

3
(Hoffmann & Zeller, 2005). The abundance of animals largely depends on the seasonal
availability of food resources and water (Datiko & Bekele, 2014). For example, during the
wet season, rodent and shrew species abundance and richness were shown to be highest
and lowest during the dry season, respectively (Rautenbach, Dickerson & Schoeman,
2014). Furthermore, Datiko & Bekele (2014) reported that the disturbance of vegetation
structure and cover affects the micro-climate and necessary ground cover needed by
rodents and shrews, and sengis against their predators.
Although there are several studies on small mammals (e.g., Muck & Zeller, 2006;
Katakweba et al., 2012; Hauptfleisch, Vinte & Blaum, 2017; Kapia, 2018) in Namibia
very few studies have focussed on the diversity of small mammals with habitat types on
farms with reference to their associated habitat types. Hence, small mammal habitat
preference on farm in the country are poorly known. The present study was therefore
aimed at gaining insight into the effects of habitat type on rodent and shrew species
abundance, richness, diversity and composition at Farm Karachas, Outjo, Namibia as a
model study. The findings of the present study will allow insights into how changes in
farm ecosystems may affect the rodent, shrew and sengi ecology.
1.2 Problem statement
Numerous studies on small mammals have been conducted in Namibia, however not many
studies have focused on the ecological variation of habitat types available for rodents,
shrews and sengis on farms in the country. Rodents and shrews are important contributors
to biodiversity of ecosystems (Hoffman & Zeller, 2005; Bertolino, Girardello & Amori,
2014), as prey animals, dispersers of seeds and soil engineers (Avenant, 2011) thus
forming an integral part of farms. The maintenance of these functions and services are

4
critically less effective due to the reduced abundance and species richness of small
mammals in the land used by wildlife (Hauptfleisch, Vinte & Blaum, 2017).
Changes of habitat structure and diversity are often associated with changes in small
mammal community structure and species richness (Hoffman & Zeller, 2005). Rodents
and shrews are more likely to be negatively affected by habitat overuse by either domestic
or wildlife such as large mammals (Mulungu et al., 2008) and disturbance due to fire
occurring on farms as a result of destruction to food resources and habitat cover.
Agricultural practices often neglect general biodiversity and wildlife while concentrating
on livestock and crop production despite their devastating impacts on the environment
(Michael, Ringo & Ratnayeke, 2016) which influences vegetation structure and cover
biologically and ecologically needed by small mammals (Magige, 2016). Hence, the
present study assessed the effects of habitat types on rodent, shrew and sengi species
abundance, richness, diversity and composition at Farm Karachas, Outjo, Namibia.
1.3 Research objectives
1.3.1 General objective
The overall objective of the present study was to assess the effect of habitat type on rodent,
shrew and sengi species abundance, richness, diversity and composition at Farm Karachas,
Outjo, Namibia.
1.3 2 Specific objectives
The specific objectives of the study were to determine and compare rodent, shrew and
sengi:
5
a) Species abundance in an open grassland and woody habitats at Farm Karachas in
Outjo;
b) Species richness in an open grassland and woody habitats at Farm Karachas in
Outjo;
c) Species diversity in an open grassland and woody habitats at Farm Karachas in
Outjo; and
d) Species composition in an open grassland and woody habitats at Farm Karachas
in Outjo.
1.4 Research hypotheses
The following null hypotheses (H0) were tested in the present study:
a) Open grassland and woody habitats do not influence rodent, shrew and sengi
species abundance at Farm Karachas in Outjo;
b) Open grassland and woody habitats do not influence rodent, shrew and sengi
species richness at Farm Karachas in Outjo;
c) Open grassland and woody habitats do not influence rodent, shrew and sengi
species diversity at Farm Karachas in Outjo; and
d) Open grassland and woody habitats do not influence rodent, shrew sand pecies
composition at Farm Karachas in Outjo.
1.5 Significance of the study
Given the habitat change due to human activities such as farming, the present study
provides data on the influence of habitat types on rodent, shrew and sengi species
abundance, richness, diversity and composition at Farm Karachas, Outjo Namibia. Some
rodent and shrew species are considered to be good indicators of ecosystem disturbance

6
where they become dominant such as the multimammate mouse (Mastomys coucha)
(Avenant, 2011). Some are considered to be good pioneer species (e.g., multimammate
mice (Mastomys spp) and brush-tailed Hairy-footed Gerbil (Gerbilliscus vallinus)) and
flourish after disturbances caused by drought, fire, overgrazing and cultivation (Ferreira
& Van Aarde, 2000; Caro, 2001; Hoffmann & Zeller, 2005). On the other hand, some
small mammals (e.g., M. coucha) are considered to be indicators of good quality habitats
when they are less abundant (Avenant, 2003).
Understanding species abundance and richness in a habitat may be an important indicator
of habitat quality, therefore useful for monitoring habitat degradation (Kiwia, 2006). The
level of rodent, shrew and sengi species abundance show their habitat type preference.
The result of the present study may therefore assist in identifying rodent, shrew and sengi
species habitat preference in the study area, which may be critical to understand and
identify indicators of disturbance (e.g., fire and heavy grazing) and therefore allow the
development of methods to protect habitats overlooked for conservation on farms.
Furthermore, management decisions (e.g., rotational grazing, as opposed to continuous
grazing) made to benefit rodents, shrews and sengis may also benefit other species
(Avenant & Cavallini, 2007; Avenant, 2011).
The present study investigates difference in rodent, shrew and sengi species abundance,
richness, diversity and composition in two contrasting habitats on the farm that included
open grassland and woody habitat. This may assist in gaining insights into the reasons for
the differences in species abundance, richness, diversity and composition. The result of
the present study may therefore contribute to the body of knowledge and also provide a
baseline for potential future studies on the ecological effect of habitat types on rodents

7
and shrew diversity in the study and other areas in Namibia and beyond. Although rodents
and shrews form an important component of biodiversity in ecosystems (Mulungu et al.,
2008), little is known on the effect of habitat types on small mammal diversity in Namibia.
1.6 Limitations of the study
Due to limited time, the study did not allow for a full assessment of the habitat
characteristics (this study only characterized habitats based on woody plant structures and
grass cover). Other factors that might have influenced habitat types may include soil types,
presence of herbivores, seasons, fire disturbance and as a result influencing the rodents,
shrews and sengis found within the farm. The present study only used Sherman live traps
to capture rodents and shrews. Trap type has been reported for its limitations when
assessing small mammal populations (Santos-Filho et al., 2015). The use of different trap
types increases the probability of capturing rare or shy species (Astúa et al., 2006). Other
traps may also need to be considered in future studies such as pitfalls traps that commonly
trap rare, trap-shy species (Caceres, Nápoli & Hannibal, 2011). Trap position (Astúa et
al., 2006) and behavioral attributes such as foraging activity pattern have also been
highlighted to adversely affect small mammal trapping (Santos-Filho et al., 2015). During
the present study, Thallomys paedulcus was habitat-specific, only present in the woody
habitat. It forages most of the time on trees (Nel, 2013), thus making it difficult to trap
since traps were set on the ground. The commonly used rolled oats mixed with peanut
butter as bait, used for this study may not be appropriate for shrews because they are
insectivorous hence shrews may be under-represented. Lastly, there was no voucher
specimen collection of rodent, shrew and sengi, hence identification was limited.

8
CHAPTER 2: LITERATURE REVIEW
2.1 The biology of rodents, shrews and sengis
Small mammals, such as rodents and shrews are well-adapted to the environment and have
a wide distribution (Liu et al., 2008). Their life histories are characterized by fluctuating
populations, high reproductive rates and short life expectancy (Rautenbach, Dickerson &
Schoeman, 2014). Despite similarities in body size and attributes scaling to body size,
they exhibit significant differences in other properties such as life history traits (Gliwicz
& Taylor, 2002).
Rodents belong to the order Rodentia, the most diverse group of living mammals with
numerous habitat associations, and include over 40 % of all mammalian fauna globally
(Wilson & Reeder, 2005; 2011; Rautenbach, 2013; Flores-Peredo & Vázquez-Domínguez,
2016). The order includes ~2000 extant species and has members found on all continents
except Antarctica (Kay & Hoekstra, 2008; Samuels & Van Valkenburgh, 2008; Verde
Arregoitia, Fisher & Schweizer, 2017).
Rodents are conspicuous inhabitants of terrestrial ecosystems including human-modified
habitats such as agricultural and urban areas (Jayaraj et al., 2012) due to their
morphological and behavioural adaptations to a wide range of environmental conditions
(Viera & Paise, 2011; Sponchiado, Melo & Cáceres, 2012; Luza et al., 2016; Luza et al.,
2018). They have a wide range of ecological specialization, and they have arboreal,
fossorial (burrowing), semiaquatic, jumping and gliding forms (Samuels & Van
Valkenburgh, 2008; Verde Arregoitia, Fisher & Schweizer, 2017). Compared with other
mammalian orders, rodents exhibit a wide array of body sizes (Verde Arregoitia, Fisher

9
& Schweizer, 2017) ranging from < 10 g to >500 kg (Samuels & Van Valkenburgh, 2008)
and all have gnawing teeth with space behind them, the diastema (Tobin, Michael & Fall,
2004). Most rodents are herbivorous, feeding entirely on plant material such as seeds,
stems, leaves, flowers and roots, some are omnivorous and a few are predators (Hoffmann
& Zeller, 2005), exhibiting choices and preferences in their diets, but often selecting the
most abundant, palatable food available (Tobin, Michael & Fall, 2004). Rodents have
advanced cognitive abilities, they can quickly learn to avoid poisoned baits, which makes
them difficult pests to eliminate (Krojerová-Prokešová et al., 2016). They are prolific
breeders with a short lifespan (Auffray, Renaud & Claude, 2009), and their population can
grow rapidly to utilize available habitats and food resources because of high reproductive
capacity (Tobin, Michael & Fall, 2004).
There are about ~429 species of insectivorous species worldwide of which ~312 are
shrews (Bantihun & Bekele, 2015). Shrews are widely globally and they occur in all
terrestrial habitats, from montane, boreal regions to arid areas (Churchfield, 1990). Shrews
belong to the order Eulipotyphla, suborder. Although shrews predominantly feed on
insects, they also feed on small birds, grasshoppers, butterfly and moth larvae, wasps,
crickets, spiders, mice, small snakes, while some shrew species are herbivorous (Stuart &
Stuart, 2007). Shrews use burrows constructed by other small mammals (Rzebik-
Kowalska & Lungu, 2009). They are generally small with nocturnal habits (Merritt et al.,
2005) and have a long snout, poor sight, but with a good sense of smell and hearing
(Churchfield, 1990). They therefore rely on their senses of smell and hearing to locate
prey and avoid predators such as snakes and owls (Siemers et al., 2009), that are
particularly significant consumers of shrews (Tores et al., 2005).

10
Sengis also called “elephant-shrews” belong to the order Macroscelidea, Family
Macroscelididae and their evolutionary history confined to Africa (Carlen et al., 2017). In
the past, it was recognized that all living sengis were mostly insectivorous, which
supported their inclusion in the order Insectivora (Rathbun, 2009), currently, elephant
shrews have been recognized as a distinct order (Smit, 2008). Sengis occupy the extremes
of terrestrial habitats, which typically provide adequate cover from predators with either
vegetation or overhanging ledges (Rathbun, 2009). Depending on the habitat and species,
sengis shelter in rock crevices, bases of bushes in thickets and less commonly in shallow
burrows abandoned by rodents, whereas some sengis may excavate their burrows in soft
substrates (Ribble & Perrin, 2005). They use their long nose as a probe to search for prey
(such as invertebrates, fruits and seeds) and their long tongue to flick food items into their
small, under‐slung mouths (Rathbun, 2009). Although studies have shown that these
species are partially nocturnal, sengis are primarily diurnal with a good deal of activity at
sunrise and sunset (Skinner & Chimimba, 2005).
2.2 Significance of rodents, shrews and sengis in ecosystems
Despite their diverse range, rodents and shrews have complex effects on the structure,
composition and functional diversity of their environment through various ecological
interactions such as pollination (Johnson et al., 2011), seed dispersal and seed removal,
consumption of seedlings, seeds, fruits and arthropods (Flores-Peredo et al., 2011),
nutrient cycling (Delcros, Taylor & Schoeman, 2015), bioturbation, and as vectors of
human diseases (Medan et al., 2011). Rodents are important herbivores that aerate the soil
and improve plant regeneration from buried seeds or exposed soils as a seed bed through
their burrowing activities (Tobin, Michael & Fall, 2004). The burrow-digging species such

11
as pouched mice (Saccostomus spp) excavate their own burrows (Jacques, McBee &
Elmore, 2015), thus contributing to soil mixing, improved soil aeration, and improved
plant germination (Witmer, Moulton & Swartz, 2012). Rodents, shrews and sengis are
also primary prey for many mammals, birds, and reptiles, therefore sustaining population
of these species (Tobin, Michael & Fall, 2004; Hauptfleisch, Vinte & Blaum, 2017).
Furthermore, rodents and shrews act as useful indicators of ecological integrity and can
be used to predict environmental change (Avenant & Cavallini, 2007; Mortellitietal, 2010;
2011; Delcros, Taylor & Schoeman, 2015) by responding to habitat disturbance (Leis et
al., 2008, Mortellitietal, 2010; 2011). This is due to their rapid turnover rate, high biotic
potential, ability to invade reclaimed land and their sensitivity to environmental
disturbance (Garshong et al., 2013). Moreover, most species reproduce rapidly and
consequently showing good response to successional changes in vegetation (Avenant,
Watson & Schulze, 2008). For example, the dominance of specialist species such as M.
coucha (Avenant, 2000) in a habitat may be an indication of a disturbed habitat (Avenant,
2003), while it is low involvement in the habitat may be an indication of a healthy and a
relatively stable ecosystem (Avenant, 2011).
2.3 Habitat type in terrestrial ecosystems
Habitat type is broadly defined as a set of physiognomically distinct categories of
vegetation communities (Hutto, 1985). Habitat type has also been defined as the suite of
resources (food, shelter) and environmental conditions (abiotic and biotic)
that determine the presence, survival and reproduction of a population (Caughley &
Sinclair, 1994; Sinclair, Fryxell & Caughley, 2005). Habitats depends on both abiotic
characteristics of the environment such as the underlying geology and climatic patterns,

12
and biotic characteristics such as the presence of particular species to determine their
distribution (Peña‐Claros et al., 2012). Animals select different structural habitats (i.e.,
local resources or conditions) in a way that is intended to increase their performance at
small spatial and temporal scales (Gaillard et al., 2010). The increase in spatial and
temporal scales result in individual behavioural decisions to only select resources that
enhance survival and reproductive performance at the individual and population levels
(Gaillard et al., 2010).
The major activities such as land conversion for road use, timber harvesting practices,
incorrect grazing practices and misuse of fire, lead to the loss of a once continuous habitat,
resulting in distinct habitats such as open grassland and woody habitats on farms (Deák et
al., 2020). Such habitats may differ in terms of their vegetation, soil type, soil condition,
nutrients and other factors (Rodrigues et al., 2018).
2.3.1 Open grassland habitat
Grasslands are defined as an ecosystem with a significant grass cover combined with
varying degrees of woody vegetation, including relatively open savannas and woodlands
and some deserts and shrub grasslands that include a significant cover of grasses
interspersed with succulent plants and/or shrubs (Blair, Nippert & Briggs, 2014). Open
grasslands are characterized as land that is dominated by grasses rather than large shrubs
or trees (Carpenter, 1940). On farms, open grassland habitat is the result of inappropriate
fire management (Joubert, Rothauge & Smit, 2008), harvesting of trees for charcoal
production, intense herbivory, or their combination (Barger, 2011). Foster et al. (2014)
demonstrated that decreasing biodiversity by reducing woody species in ecosystems
creates open grasslands.

13
2.3.1 Woody habitat
Woody habitat in woodland savanna’ refers to the more mesic savanna where tree stands
occur in open formations, with some shrubs in a ground layer dominated by grasses
(Levin, 2013). Woody plants are key components to ecosystems as they create favourable
microenvironments (e.g., through deposition of leaf litter and shading) and habitats that
can support diversity (Sebata, 2017). They offer browsing landscape for ungulates and are
also a major source of fuelwood (Sebata, 2017). Additionally, an increase in woody
vegetation is associated with intensive grazing by cattle, and where woody plants have
evolved with herbivory, herbivores play a key role in regulating plant cover needed by
other organisms (Holdo, Holt & Fryxell, 2013). Increased woody vegetation may be
attributed to overgrazing (Riginos & Young, 2007) which leads to increased dispersal of
woody seeds, reduce fire frequency and intensity due to lowered grass-fuel loads and
increase water availability for deep-rooted woody plants (Sebata, 2017), facilitating an
increase in germination rates and woody cover.
2.4 The influence of habitat type on rodent, shrew and sengi ecology
Various habitat characteristics such as foliage height, vegetation cover, soil structure and
type are important factors in rodent ecology (Rhodes & Richmond, 1983) as they influence
ground cover, food and other resources needed for survival and reproduction (Malmstrom,
2012). In a study on the diversity, relative abundance and habitat association of rodents in
forest patches and adjacent farmland in Aquatimo, East Gojjam, Ethiopia, small mammal
species such as the woodland thicket rat (Grammomys dolichurus), black rat (Rattus
rattus), lovat's climbing mouse (Dendromus lovati), and smoky white-toothed shrew
(Crocidura fumosa) indicated restricted distribution suggesting that their distribution was

14
influenced by habitat types (Dubale & Ejigu, 2015). It has however, been reported that
habitat association and distribution of rodents may be determined by the extent of ground
cover, habitat structure and availability of food resources (Dubale & Ejigu, 2015).
The quantity of ground cover is critical to the density and diversity of small mammals
(Hoffmann & Zeller, 2005). The diversity of small mammals can be influenced by the
presence of limited resources, the abundance of forage and its nutritional attributes, and
availability of shelter (Hebblewhite, Merrill & McDermid, 2008; Krojerová-Prokešovà et
al., 2016). The diversity of rodents and shrew assemblages may also vary both seasonally
and annually in different vegetation types (Rautenbach, Dickerson & Schoeman, 2014) as
a result of a change in the quality and quantity of resources such as food and shelter
(Chekol, Bekele & Balakrishnan, 2012; Dubale & Ejigu, 2015). A study by Datiko and
Bekele (2014) reported that the natal multimammate mouse (Mastomys natalensis),
striped grass mouse (Lemniscomys striatus) and spiny mouse (Acomys cahirinus) were
found in all habitat types in Chebera Churchura National Park, in Ethiopia with varied
abundance, suggesting their ecological adaptability.
Furthermore, the distribution of rodent and shrew species have been reported to be
influenced by habitat complexity in relation to food availability and vegetation cover
(Datiko & Bekele, 2014), and that there is an association between species composition
and the available food resources (Makundi et al., 2005). The difference in abundance of
habitats may be attributed to the presence of several microhabitats such as habitat covers
and diverse resources in wooded grassland (Datiko & Bekele, 2014). This is evident in a
study where more individuals were sampled from bushland habitats than in other habitats,
likely as a result of the habitat’s composition of plants such as redwing (Pterolobium

15
stellatum), woolly caper-bush (Capparis tomentosa) and stinging nettle (Urtica simensis)
(Bantihun & Bekele, 2015). These plants are thorny, and hence prevent the movement of
humans and livestock, thereby resulting in more shelter for small mammals (Bantihun &
Bekele, 2015). Variation in nature and density of vegetation may also contributed to more
individual rodents and shrews being sampled from disturbed forest habitats than in other
habitats (Mulungu et al., 2008).
Generally, farmlands harbor high population numbers of rodent pests than to natural
forests (Datiko, Bekele & Belay, 2007) partially due to the availability of nutritious food
in farmlands being highly preferred during the fruiting and before harvesting periods, thus
providing enough cover and nutritious food (Dubale & Ejigu, 2015). In their study, Dubale
& Ejigu, (2015) found that bushy habitat type was inhabited by more species than
grassland and the forest habitats, because bushy habitats are known to provide enough
food and cover than grassland and forest habitats. Additionally, bushy vegetation provides
safe sites for germination and growth of herbaceous plants, therefore increasing the
diversity of the potential food resources for small mammals (Kerley et al., 2004).
The distribution of rodents and shrews is not only influenced by vegetation cover, edaphic
factors may also influence small mammal populations (Hardy, 1945). Soil components
such as soil texture, moisture, aeration, soil chemical contents, soil fertility, and soil types
directly and indirectly affect the distribution and abundance of animals (Erena, Yosef &
Bekele, 2011). In fossorial mammals, soils directly affect their distribution by providing
shelter and indirectly by influencing the distribution of vegetation (Hardy, 1945). For
example, loam soil is mostly preferred by M. natalensis because the burrowing that
provides good aeration and drainage is relatively easy to undertake (Massaweet et al.,

16
2008). Therefore, soil type is very important as burrows may be needed to create a safe
site for the reproduction and survival of young and food hoarding sites (Erena, Yosef &
Bekele, 2011).
2.5 The effect of land use on rodent, shrew and sengi ecology
African savannas accommodate a high diversity of larger herbivore species of different
body sizes (Hagenah, Prins & Olff, 2009) resulting in competition for grass and woody
vegetation (Loggins et al., 2019). In Namibia, livestock and wildlife farming plays a major
role in agriculture (Mendelsohn et al., 2002). Various studies including but not limited to
Namibia (Muck & Zeller, 2006; Erckie, 2007; Hagenah, Prins & Olff, 2009; Ellis &
Cushman, 2018) have investigated at the impacts of larger herbivore on rodent species
abundance and community composition. It has been reported that rodents and larger
herbivores in ecosystems compete for food resources (such as seeds, stems and leaves),
and were larger herbivores where absent, habitat quality for rodents was higher (Hagenah,
Prins & Olff, 2009).
Overuse of habitats by either domestic or wild species of larger mammals adversely
impacted food and cover required by rodents and shrews (Mulungu et al., 2008). The
effect of livestock grazing on rodents and shrews varies depending on the level of grazing,
habitat type and species involved (Rickel, 2004). Furthermore moderate grazing may
result in a positive effect for some species while overgrazing decreases the population of
most species (Rickel, 2004). In a study on evidence-based review on the positive and
negative effects of livestock grazing on wildlife, overall small mammal abundance
declined with grazing, while individual species responses varied significantly, such that
species richness either declined or remained the same but rarely increased with grazing

17
(Schieltz & Rubenstein, 2016). This may be a result of the interaction between the
behaviour and habitat requirements of individual small mammals and the effect that
grazing has on the modification of the vegetation (Schieltz & Rubenstein, 2016).
Different body size classes of herbivores have positive and negative effects on rodents
diversity, intense grazing by larger herbivores (such as by buffalo, zebra) improves the
vegetation structure for smaller herbivores as it results in the development of patchy
vegetation with short grazing lawn (Hagenah, Prins & Olff, 2009). However, medium
sized herbivores such as impala, decreases the number of high-quality plant species
available for smaller herbivores species, thus negatively influencing rodents through
competition for food (Hagenah, Prins & Olff, 2009).
Vegetation modification by larger herbivores such as by grazing and trampling, limits the
habitats available and reduces the vegetation cover needed by rodents (Goheen et al.,
2004). A decrease in vegetation cover leads to higher exposure of rodents to their predators
and thus, increases their predation risk (Siemers et al., 2009). Rodents and shrews serve
as prey for many different species of reptiles, birds and mammals, thus they avoid areas
where the risk of predation is high (Krijger et al., 2017). To avoid high predation risks,
rodents and shrews use indirect cues such as vegetation cover, weather conditions, light
intensity and direct cues such as sound, odor, urine or other excrements from potential
predators to assist in assessing predation risk during foraging (Krijger et al., 2017). Many
smaller vertebrates preferentially forage under vegetative cover, where it is more difficult
to be detected by predators, avoiding areas with sparse cover or greater distances between
refuges (Baker & Brown, 2014; Banasiak & Shrader, 2016). On the other hand, other

18
species prefer foraging in areas with better visibility in order to easily detect (Heithaus,
2009).

19
CHAPTER 3: MATERIALS AND METHODS
3.1 Description of the study area
3.1.1 Location and extent
The study was conducted on Farm Karachas on the Outjo-Otavi gravel road located in
Outjo District, Kunene Region, Namibia (20.1128°S and 16.1610°E; Figure 1) in July
2020. The study site is located within the tree and shrub savanna biome of Namibia (Figure
1) (Mendelsohn et al., 2002).
Figure 1: A biome map of Namibia (with an insert map of Southern Africa) showing its
biomes and the study area (Farm Karachas, Outjo District, Kunene) (Adopted from: Map
of Namibian biomes, Atlas of Namibia:
http://www.unikoeln.de/sfb389/e/e1/download/atlas_namibia/pics/living_resources/biom
es.jpg
20
3.1.2 Climate
Rainfall and temperature are the two main environmental factors that influence mammals
both directly and indirectly (Skinner & Chimimba, 2005). Namibia is predominantly an
arid to semi-arid country due to its geographic location (Goudie & Viles, 2014). Outjo
town, just as the rest of Namibia, falls within the Subtropical High-Pressure Zone, which
is known for its massive dry air (Mendelsohn et al., 2002). Outjo town, located 30 km
west of the study site, has a distinct seasonal variation in temperature (Mendelsohn et al.,
2002). During winter, temperatures can get to below 0o C, although winters are often mild,
with the coldest month being July (Mendelsohn et al., 2002). Average minimum
temperatures range from 0° C during winter to 15.5° C in summer. The area receives a
minimum of 350 mm and a maximum of 400 mm of precipitation per year. Heavier rainfall
is most common between January and March with little to no rainfall in September
(Mendelsohn et al., 2002).
3.1.3 Fauna
Farm Karachas is home to numerous wildlife and domestic mammals. Livestock farming
is one of the main agricultural activities on the farm. During the data collection period
large mammal wildlife observed on the farm included: - jackal (Canis mesomelas), kudu
(Tragelaphus strepsiceros), springbok (Antidorcas marsupialis), steenbok (Raphicerus
campestris), leopard (Panthera pardus) and common warthog (Phacochoerus africanus),
and domestic mammals that included cattle, goat, sheep, horses, and donkeys.
The small mammals previously reported to occur in the tree and shrub savannah include:
large-eared mouse (Malacothrix typica), pouched mouse (Saccostomus campestris),
bushveld gerbil (Gebilliscus leucogaster), hairly-footed gerbil (Gerbilliscus paeba.), red

21
veld rat (Aethomys chrysophilus), Namaqua rock mouse (Micaelamys namaquensis), tree
mouse (Thallomys paedulcus), multimammate mouse (Mastomys natalensis), stripped
mouse (Rhabdomys pumilio), bushveld sengi (Elephantulus intufi), lesser red musk shrew
(Crocidura hirta) and dent’s houses bat (Phinolophus denti) (Stuart & Stuart, 2007).
Reptiles, such as lizards, were also sighted on the farm during the sampling period. A
variety of birds such as the laughing dove (Spilopelia senegalensis), helmeted guinea fowl
(Numida meleagris), and common quail (Coturnix coturnix) were also observed during
the sampling period. As were many insects such as common flies, grasshoppers,
butterflies, spiders, and ants.
3.1.4 Flora
The Tree and Shrub Savanna biome (Figure 1) supports > 500 t plants species
(Mendelsohn et al., 2002). The vegetation of this biome include species such as false
umbrella thorn (Vachellia reficiens), candle thorn (Vachellia hebeclada subsp.
Hebeclada), black thorn (Senegalia mellifera xtbsp. Detinens), blue thorn (Senegalia
erubescens), blade Thorn (Senegalia cinerea), and in some areas, umbrella thorn
(Vachellia tortilis subsp. Heteracantha) (Mendelsohn et al., 2002). The dominant woody
plants species include False-umbrella thorn (Vachellia reficiens), sickle bush
(Dichrostachys cinerea), purple-pod Terminalia (Terminalia prunoides), mopane
(Colophospermum mopane), red bushwillow (Combretum apiculatum) and Comiphora
species (Mendelsohn et al., 2002). The dominant vegetation of the study areas, D. cinerea
shrub, the velvet raisin Grewia flava, and the sand-paper raisin Grewia flavences. Tree
distribution during the sampling period was variable, but mostly included shepherd tree
(Boscia albitrunca), blade thorn (S. cenerea), and black thorn (S. mellifera). Grass cover

22
in the Tree and Shrub Savanna biome ranged from sparse to clumped (Stuart & Stuart,
2007).
3.1.5 Geology and soil
The geology of Outjo is characterized and dominated by limestone and schists
(Mendelsohn et al., 2002). The soils are of moderate to high fertility, and the dominant
soil type is cambic soil characterized by changes in color, structure and consistency with
a coarse texture (Mendelsohn et al., 2002).
3.2 Data collection
3.2.1 Selection of the study sites
The specific sampling sites at Farm Karachas were randomly selected but included
replicates in contrasting habitats. The GPS coordinate points of selected contrasting
habitat were as follow: Site 1, Open grassland (20.57713˚S, 016.78233˚E); woody habitat
(20.05148˚S, 016.43509˚E) and Site 2 open grassland (20.04673˚S, 014.716˚E); woody
habitat (20.04689˚S, 016.43316˚E). Open grassland habitat on a fallow field and a woody
habitat with grass under-growth were selected as contrasting habitats and was supported
by a vegetation survey to ensure these two habitats were different in terms of vegetation
structure. The two contrasting sampling habitat on each sites were 600 meters apart to
avoid sampling rodents and shrews from an adjacent trapping site (Fauteux et al., 2018).
The areas that were considered open grassland (Figure 2) were characterized by a
relatively high grass cover and other graminoid vegetation in an open land with little or
no tree and shrub cover (Sanderson, Wedin & Tracy, 2009; Blair, Nippert & Briggs,
2014). In contrast, the woody habitat (Figure 3) was dominated by woody plants with

23
areas dominated by trees and shrubs (Sebata, 2017). A Global Position System (GPS) was
used to mark the location of each sampling habitat.
Figure 2: A typical sampled open grassland habitat at Farm Karachas in Outjo. Photo by
S. Kapala (2020).

24
Figure 3: A typical sampled woody habitat at Farm Karachas in Outjo. Photo by S. Kapala
(2020).
3.2.2 Vegetation structure parameters
In the present study, it was critical to establish that the two sampling habitats were
contrasting in terms of vegetation structure. Hence, in each habitat ,10 plots of 10 m × 10
m (Figure 4) spaced 10 m apart were demarcated using a standard measuring tape and
were sampled for woody plant species composition, richness, abundance, and height.
Within each 10 m × 10 m plot, a 1 m × 1 m plot was demarcated (Figure 4) to assess the
percentage grass covers. In total, 40 plots (20 open grassland, 20 woody habitat) were
sampled over the entire study area.

25
10 m
Keys:
Woody plants plot
% Grass cover
10 m
Figure 4: A systematic diagram of the plots used to sample vegetation parameters in the
open grassland and woody habitat at Farm Karachas, Outjo, Namibia
Within each plot, individual woody plants were counted and identified to the species level
using Le Roux and Müller's Field Guide to the Trees and Shrubs of Namibia by Le Roux
et al. (2009). The total number of woody plants sampled at each habitat site was
determined. All the trees and shrubs were counted and each was measured and categorized
into height classes. The height of each woody plant in each plot was estimated by placing
the range pole against the plant and was allocated into a predetermined class that include:
< 1 m, 1 – 1.5 m, 1.5 – 2 m, 2 – 2.5 m, 2.5 – 3 m, and > 3 m depending on its estimated
height. Total grass cover was visually estimated as a percentage of the ground cover within
1 m × 1 m plot (Figure 4) using the modified Blaun-Blanquet cover scale that includes: 0-
25%, 25-50%, 50-75% and 75-100% (Werger, 1974).
1 m
1 m

26
3.2.3 Rodent, shrew and sengi sampling
Before sampling, the present study received approval from the University of Namibia,
Centre of Research and Publication and the Research Ethics Committee. Research
Permission Letter was issued by Dr. Seith. J. Eiseb, the Director: Postgraduate Studies,
University of Namibia (Appendix 1). Data collection permission on Farm Karachas was
granted by Mr. F. Puriza, the owner. Sampling the study area was performed according to
the ethics policy and research ethics guidelines. The present study used a quantitative
research design to collect data on rodents, shrews and sengis species abundance, richness,
diversity and composition in the open grassland and woody habitat sites. Sampling was
undertaken on two transects, spaced 20 m apart using a standard measuring tape. Each
transect consisted of 40 Sherman-live traps spaced at 10 m intervals using metal droppers
as flagging for identifying the positions of the traps, forming a distance of 400 m per
transect and giving a total of 80 traps per site. Traps were marked with unique numbers
for each transect and site (i.e., Open grassland O1, O2, O3… O80 and woody habitat W1,
W2, W3….W80) using pen-tel markers to match the flagging droppers to ensure animals
were released at the point of capture facilitating re-bait and preventing the loss of traps
(Hoffmann et al., 2010).
A capture-mark-recapture (CMR) sampling method (Hoffmann & Zeller, 2005) was
employed to collect data on rodent and shrew species abundance and diversity. CMR
studies have shown that the majority of small mammals during the trapping sessions are
recaptured from the 4th day of consecutive trapping (Tasker & Dickman, 2001). In each
habitat, trapping was conducted consecutively for 5 nights (Hauptfleisch, Vinte & Blaum,
2017). Traps were baited with rolled mixture of oats and peanut butter (Mfune, Kangombe

27
& Eiseb, 2013; Kapia, 2018) (Figure 5A) in the late afternoon before sunset around 17h00
and inspected for the presence of small mammals the next morning at sun rise around
07h00. Sikes and Gannon (2011) reported that live traps for nocturnal species is set before
dusk and checked at dawn. Trapping regimes were designed to target nocturnal small
mammal species (Lim & Pacheco, 2016). Diurnal trapping is not recommended to prevent
small mammal mortalities because Sherman traps get very hot (Thibault et al., 2019).
Figure 5: A) Balls of bait including a mixture of peanut butter and oats and B) A typical
sampled small mammal in a zip-lock bag. Photo by Kapala (2020).
During the inspection of traps, surgical gloves and protective masks were worn at all times
because the small mammals host a variety of ecto-parasites and endo-parasites (Hoveka,
2015), thus gloves and mask provided a barrier against infectious excreta and body fluids
during handling (Thibault et al., 2019). Captured rodents, shrews and sengis were
transferred from traps into standard zip-lock plastic bags (Figure 5B) to allow safe data
processing of the trapped animal. The Zip-lock bags were cut open at the corners to ensure
air ventilation.
A
A
A
B

28
The following data were recorded for each individual trapped rodent, shrew and sengi:
species (as identified using the Field Guide to Mammals of Southern Africa by Stuart and
Stuart (2007), and Smither’s Mammals of Southern Africa: A Field Guide by Smithers
(2012)), date, trap number and sex. Body mass was recorded to the nearest grams using
the compact scale (HT Series Compact Scales A&D Australasia Pty. Ltd, Thebarton,
Australia) while the reproductive status was noted as either breeding or non-breeding.
(Hoffmann et al., 2010). Characteristics of breeding individuals include descended testes
in males and open vagina, lactating or pregnant (identified by palpation technique) in
females (Hoffmann et al., 2010). Non-breeding characteristics included abdominal testes
in males and closed vagina in females. Standard body measurements such as head and
body length (measured from the tip of the nose to the end of the chordate bone; Hoffmann
et al., 2010), tail length, ear length, and hind foot length was measured with a standard
ruler. These standard body measurements facilitated the morphological identification of
species. Small mammals that were trapped for the first time were toe clipped (small part
of the end of the nail) using a nail cutter and assigned a reference number and released, at
the point of initial capture. Unique single and or combinations of multiple digits,
(computer generated random combination of numbers) are removed from the hands and/
or feet when the animal is first captured, to allow recognition of each individuals (Blair,
1941, Gannon et al., 2007). Toe clipping small part of the end of the nail is considered
ethical as it provide minimal invasive in terms of pain and discomfort to the animal (Wever
et al., 2017). The method is also known to improve survival during handling of a sensitive
species than other methods such as ear notching (Petit et al., 2012). Traps without animals
were closed immediately after checking to prevent the capturing of diurnal, non-targeted
taxa (Sikes & Gannon, 2011).

29
3.3 Data analysis
3.3.1 Vegetation structure parameters
For all ecological analyses, data was firstly compared between the two open grassland
habitats and the two woody habitats to justify the need for pooling or separately analyzing
the factors contributing to variations in preferred habitat type. The percentage proportion
for each height class was then determined by dividing the total number of woody plant
species in each height class with the total number of all woody plants sampled in the
habitat, and then multiplied with hundred. To estimate the percentage grass cover, the
grass cover was divided into 4 percentage cover categories that included: 0-25%, 25-50%,
50-75% and 75-100%. The percentage grass cover for each plot was determined for all
habitats. Plots with similar percentage grass cover were counted per habitat. The midpoint
for each grass category was determined, multiplied with the frequency of the category and
divide by the sum of the number of plots per habitat to yield the mean percentage grass
cover.
3.3.2 Rodent, shrew and sengi species abundance and richness
Species abundance and richness in both open grassland and woody habitat were
determined. Species abundance was determine determined by the total number of
individuals per rodent, shrew and sengi species per habitat, whereas species richness was
determined by the number of different species of rodent, shrew and sengi species per
habitat (Hauptfleisch, Vinte & Blaum, 2017).
30
3.3.3 Statistical analysis
Descriptive statistics were used to summarize the recorded woody vegetation data. Woody
structures (height class, species abundance, richness, and composition) were used as test
variable while habitats were used as grouping variable (open grassland and woody
habitat). All data were first tested for normality using the Shapiro-Wilk test (Shapiro and
Wilk, 1965). Parametric tests were used when data were normally distributed (P > 0.05)
and non-parametric test were used when data were not normally distributed (P < 0.05).
Independent sample two-tailed t-test were used to analyze woody species abundance of
the sampled plots. Woody plants species richness and the percentage grass cover data were
not normally distributed (P < 0.05) thus a Mann-Whitney U test was used to analyze
species richness of woody species and percentage grass cover. Mann-Whitney U test is a
non-parametric test that does not require assumption of a normal distribution (Corder &
Foreman, 2014). The height structures were compared among the habitats using a Chi-
square goodness-of-fit test (χ2). Chi-Square goodness-of-fit test is based on the difference
between the observed and the expected values for each category, thus it is used to estimate
how much the observed values of a particular given sample are significantly different from
the expected values of the distribution (Miller & Siegmund, 1982). An independent t-test
was used to estimate the mean difference in rodent, shrew and sengi species abundance
between open grassland and woody habitat. A t-test is aimed at comparing characteristics
representing groups, and the mean values become representative when the population has
a normal distribution (Kim & Park, 2019). A Mann Whitney-U test was used to compare
whether there was any statistically significant difference in the mean rodent, shrew and
sengi species richness between open grassland and woody habitat at Farm Karachas. All
the above statistical analyses were based on algorithms in the Statistical Package of Social

31
Science (SPSS) software programme IBM version 26, with the level of significance set at
(α) = 0.05.
Species diversity was calculated using the Shannon-Wiener index of diversity (Shannon
& Weaver, 1946) to compare the rodent, shrew and sengi species diversity in the open and
woody habitat using the formula below which considers both species richness and
evenness:-
𝐻′ =∑𝑃𝑖 ln 𝑃𝑖
𝑠
𝑖=1
Where 𝐻′ is the species diversity index, s is the number of species, and 𝑃𝑖 is the proportion
of individuals of each species belonging to the ith species of the total number of
individuals. A Mann-Whitney U test was used to determine whether there were any
statistically significant differences in the mean rodent, shrew and sengi species diversity
between the open grassland and woody habitat on Farm Karachas. A Mann-Whitney U
test can also be used to test for the difference in means (Campbell & Swinscow, 2009).
A Hierarchical Cluster Analysis (HCA) was used to assess % similarity difference in the
species composition of woody plant species and rodent, shrew and sengi species
composition between the open grassland and woody habitat in the study area. HCA
grouping objects based on the similarity of their attributes (Leal et al., 2016). The HCA
based on Bray-Curtis Index to determine similarities between the habitats. The Bray-
Curtis Index is recommended for analyses of species composition data (McKillup, 2011)
and classifies measures as percent similarity (Yoshioka, 2008). The results of an HCA are
presented as a dendrogram to illustrate the relationships between all the samples based on

32
a defined measure of similarity, where the objects are joined together in a hierarchical
fashion from the closest (most similar) to the furthest (i.e., the most dissimilar) (Aljumily,
2016). The HCA was performed using algorithms in Paleontological Statistics (PAST),
Version 4.03 (Hammer et al., 2001).

33
CHAPTER 4: RESULTS
4.1 Vegetation structure
There was no statistically significant difference in the species abundance of woody plants
between sites 1 and 2 in both open grassland and woody habitats: t18 = -1.197; n = 20; P
= 0. 247; and woody habitats: t18 = -0.384; n =20; P = 0.705). Similarly, there was no
significant difference in the height of woody plant classes between sites 1 and 2 in both
habitats (open grassland habitats: χ23 = 5.498; n = 20; P = 0.139; and woody habitats: χ2
3
= 59.862; n = 20; P = 0.100). Mann-Whitney U-test revealed that species richness of
woody plants between site 1 and site 2 of both habitats did not differ significantly (open
grassland habitats: U1 = 39.5; n = 20; P = 0.380; and woody habitats: U1 = 46.5; n = 20;
P = 0.779). Similarly, grass cover between sites 1 and 2 in both habitats did not differ
significantly (open grassland habitats: U1 = 49.5; n = 20; P = 0. 968; and woody habitats:
U1 = 12.5; n = 20; P = 0.100). Since there was no significant difference in the species
abundance and richness, height, and percentage grass cover between the two open
grassland and the two woody habitat, these data were pooled (open grassland site 1 and
open grassland site 2 and woody habitat site 1 with woody habitat site 2) to represent two
single data sets: open grassland and woody habitat as presented below:

34
4.1.1 Woody plants species abundance
A total of 539 woody plant species were recorded in 40 sampled plots. Out of 539, 113
woody plants were from the open grassland habitat and 426 from the woody habitat. The
woody habitat had a statistically significantly higher mean abundance (21.30 ± 2.035) of
woody plants than the open grassland habitat (mean 5.65 ± 0.545; t38 = -7.424; n = 40; P
= 0.000) (Figure 6). The most abundant woody plant species in the open grassland were
Boscia albitrunca and Dichrostachys cinerea. Senegalia cenerea, Catophractes
alexandrii, Dichrostachys cinerea, Grewia flava, Grewia flavences were most abundant
in the woody habitat.
Figure 6: The mean (±SE) woody species abundance in the open grassland and woody
habitat at Farm Karachas, Outjo

35
4.1.2 Height structure
Chi-square analysis showed a statistically significant difference in the tree height classes
of woody plants in the open grassland and woody habitats (χ25 = 101.1; n = 539; P =
0.000). The height of woody plants varied amongst the different classes, being most
frequent in the > 3 m height and < 1 m height classes (Figure 7). According to Figure 7,
77% of woody plants observed in the open grassland habitat were in the height class < 1
m. No woody plants were in the height classes 2- 2.5 m and 2.5 – 3 m in the open grassland
habitat. In the woody habitat, 30% of the woody plants were in the height classes < 1m
and > 3m making 60% of plants recorded in this study site. The lowest proportion (1%)
of woody species was in the height class 2.5 – 3 m.
Figure 7: Tree height (m) classes in the open grassland and woody habitat at Farm
Karachas, Outjo
0
10
20
30
40
50
60
70
80
90
<1 m 1 - 1.5 m 1.5 - 2 m 2 - 2.5 m 2.5 - 3 m >3 m
Height classes
Pro
port
ion (
%)
OPEN GRASSLAND WOODY HABITAT

36
4.1.3 Woody plant species richness
Woody plant species richness was statistically significantly higher (U1 = 12.5; n = 40, P =
0.00) in the woody habitat (range 4-7 species) than in the open grassland habitat (range 1-
4 species) (Figure 8).
Figure 8: A box and whisker plot of the median species richness of woody plant species
in the open grassland habitat and woody habitat at farm Karachas, Outjo. The horizontal
line (thick) inside the box represents the median. The top part of each box represents the
75th percentile (upper quartile) while the lower part is the 25th percentile (lower quartile).
The end of each line above and below the open box indicates the largest and lowest values,
respectively, that are not outliers. Extreme values are outside the box.
37
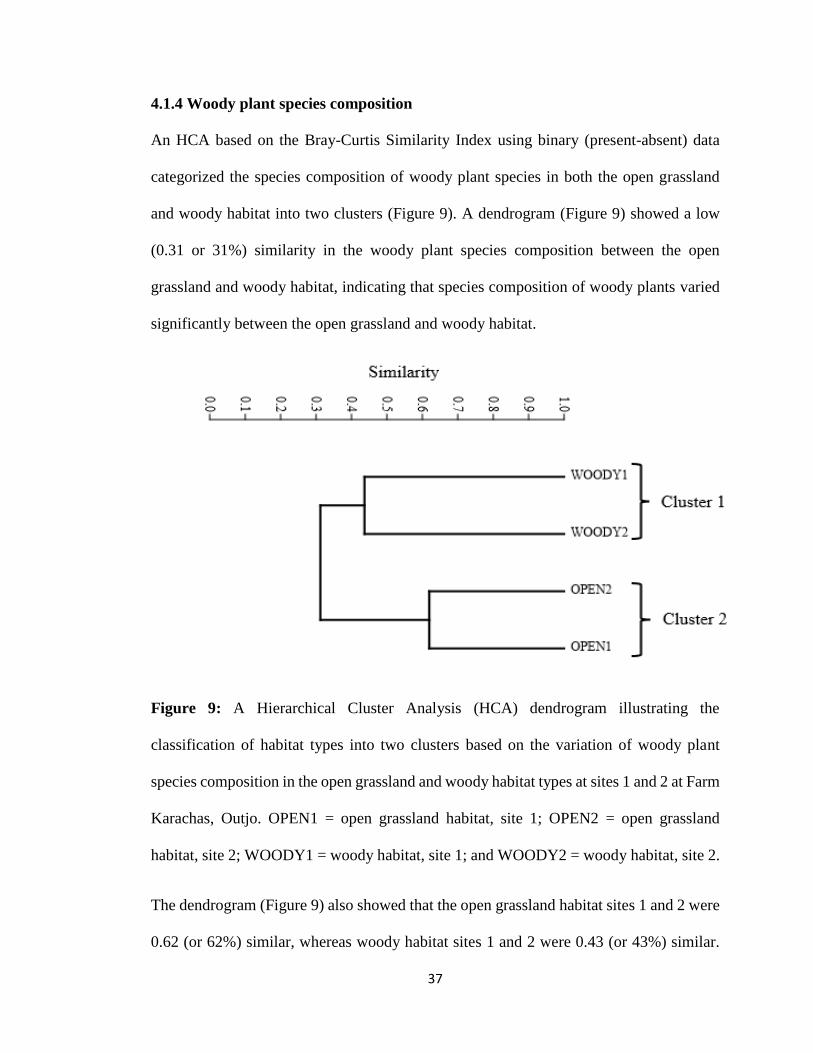
4.1.4 Woody plant species composition
An HCA based on the Bray-Curtis Similarity Index using binary (present-absent) data
categorized the species composition of woody plant species in both the open grassland
and woody habitat into two clusters (Figure 9). A dendrogram (Figure 9) showed a low
(0.31 or 31%) similarity in the woody plant species composition between the open
grassland and woody habitat, indicating that species composition of woody plants varied
significantly between the open grassland and woody habitat.
Figure 9: A Hierarchical Cluster Analysis (HCA) dendrogram illustrating the
classification of habitat types into two clusters based on the variation of woody plant
species composition in the open grassland and woody habitat types at sites 1 and 2 at Farm
Karachas, Outjo. OPEN1 = open grassland habitat, site 1; OPEN2 = open grassland
habitat, site 2; WOODY1 = woody habitat, site 1; and WOODY2 = woody habitat, site 2.
The dendrogram (Figure 9) also showed that the open grassland habitat sites 1 and 2 were
0.62 (or 62%) similar, whereas woody habitat sites 1 and 2 were 0.43 (or 43%) similar.

38
Cluster one represent the open grassland habitat sites 1 and 2 that were dominant by the
woody plant species Dichrostachys cinerea, Grewia flavences and Boscia albitrunca. The
least recorded woody species included Senegalia hereroensis, Catophractes alexandri,
Croton gratissimus and Grewia favences. Terminalia prunioides, Combretum apiculatum
and Albizia anthelmintica were absent from this cluster. Cluster 2 consist of woody plant
species found in the woody habitat sites 1 and 2. The most dominant woody species in
this cluster were Senegalia ceneria, S. mellifera, Dichrostachys cinerea, Grewia flava and
G. flavences. The least observed woody plant species were Terminalia pruinoides,
Compretum apiculatum, Boscia albitrunca, Albizia anthelmintica and Senegalia
hereroensis.
4.1.5 Grass cover
A Mann Whitney U test showed no statistically significant difference in mean percentage
(%) grass cover (U1 = 195; n = 40; P = 0.899) between the open grassland and woody
habitats. The mean % grass cover in open grassland and woody habitats ranged from
12.5% to 87.5% and 12.5% to 87.5%, respectively, (Figure 10).

39
Figure 10: The mean percentage (%) grass cover in the open grassland and woody habitats
at Farm Karachas, Outjo. The horizontal line (thick) inside the box is the median. The top
part of each box represents the 75th percentile (upper quartile) while the lower part is the
25th percentile (lower quartile). The end of each line above and below the open box
indicates the largest and lowest values, respectively, that are not outliers.
4.2 Rodent, shrew and sengi species community structure and composition
4.2.1 Rodent, shrew and sengi species abundance
Out of 800 traps set during the sampling period, 145 rodent, shrew and sengi species were
trapped during the sampling period with 60 in open grassland and 85 in the woody
habitats, respectively. In the open grassland habitat, rodents accounted for 60% and
shrews for 40% of the total catch, respectively, while in the woody habitat they accounted
for 75% and 25%, respectively (Table 1). An independent t-test showed no statistically

40
significant difference in rodent, shrew and sengi species abundance (t18 = -1.157; n = 20;
P = 0.263) between the open grassland and woody habitats.
Table 1: Rodent, shrew and sengi species abundance recorded during the study period in
the open grassland and woody habitats at Farm Karachas, Outjo. n = number of individuals
sampled; % = relative abundance.
Habitat
Small mammals
Open
grassland
Woody
Habitat
n % n %
Family and species Common name
Muridae
Aethomys chrysophilus
Red veld rat
6
10
18
21
Micaelamys namaquensis Namaqua rock mouse 4 7 4 5
Gerbilliscus leucogaster Bushveld gerbil 6 10 33 39
Mastomys natalensis Natal multimammate
mouse
3 5 2 2
Thallomys paedulcus Acacia rat 0 0 2 2
Nesomyidae
Saccostomus campestris
Pouched mouse
17
28
5
6
Soricidae
Crocidura hirta
Lesser red musk shrew
5
8
3
4
Macroscelididae
Elephantulus intufi
Bushveld sengi
19
32
18
21
Sum of captures 60 85
Species richness 7 8

41
In the open grassland habitat, S. campestris dominated the catches (n = 17) followed by
A. chrysophilus and G. leucogaster (n = 6). The least captured rodent species was M.
natalensis (n = 3). Sengi (Elephantulus intufi) species recorded (n = 19) than shrew species
(Crocidura spp.) (n = 5). In the woody habitat, G. leucogaster dominated (n = 33) the
rodent species sampled, followed by A. chrysophilus (n = 18). The least captured rodent
species were M. natalensis and T. paedulcus spp. (n = 2). Sengis (E. intufi) recorded (n =
18) and shrew species (Crocidura spp.; n = 3) (Table 1).
4.2.2 Rodent, shrew and sengi species richness
A t-test showed no statistically significant difference in rodent, shrew and sengi species
richness (t18 = 0.00; n = 20; P = 1.000) between open grassland (mean 4.2 ± 0.416;
standard error (SE)) and woody habitats (mean 4.2 ± 0.611 standard error (SE)) (Figure
11). Seven species were recorded in the open grassland habitat (5 rodent and one shrew
and sengi species) compared to 8 species in the woody habitat (6 rodent and one shrew
and sengi species each).

42
Figure 11: The mean (± Standard Error (SE)) rodent, shrew and sengi species richness in
the open grassland and woody habitats at Farm Karachas, Outjo.
4.2.3 Rodent, shrew and sengi species diversity
A Mann–Whitney U test showed no statistically significant difference (U1 = 32.50; n =
20, P = 0.184) in rodent, shrew and sengi species diversity recorded in the open grassland
(ranged from 0-1.61) and woody habitat (ranged from 0-1.46) (Figure 12). The highest
mean species diversity (H’ = 1.61) was recorded in the open grassland habitat.

43
Figure 12: A box and whisker plot comparing the median of rodent, shrew and sengi
species diversity (H’) between the open grassland and woody habitats at Farm Karachas,
Outjo.
The horizontal line (thick) in the box is the median. The top part of each box represents
the 75th percentile (upper quartile) while the lower part is the 25th percentile (lower
quartile). The end of each line above and below the open box indicates the largest and
lowest values, respectively, that are not outliers. Extreme values are outside the box.

44
4.2.4 Rodent, shrew and sengi species composition
A dendrogram from an HCA based on a Bray-Curtis Similarity Index using binary
(present-absent) data separated rodent, shrew and sengi species composition into three
clusters (Figure 15). It indicated a high similarity in rodent, shrew and sengi species
composition between the habitats. Cluster 1 and 2 were 63% similar with clusters 3,
indicating that rodent, shrew and sengi species composition was not dissimilar between
the open grassland and woody habitats (Figure 13).
Figure 13: A dendrogram of a hierarchical cluster analysis (HCA) based on Bray-Curtis
similarity matrix using binary data showing rodent, shrew and sengi species composition
between open grassland and woody habitat (site 1 and 2) at Farm Karachas. OPEN1 =
open grassland, site 1; OPEN2 = open grassland, site 2; WOODY1 = woody habitat, site
1; and WOODY2 = woody habitat, site 2.

45
Cluster 1 of the HCA dedrogram consisted of all rodents, shrew and sengi species that
were trapped during sampling period (A. chrysophilus, M. namaquensis, G. leucogaster,
M. natalensis, S. campestris, T. paedulcus, C. hirta, and E. intufi) in the woody habitat,
site 2. The rodent species, A. chrysophilus and G. leucogaster and the sengi species, E.
intufi occurred in high numbers, indicating that this species had a preference for the woody
habitat. Thallomys paedulcus species was only observed in this cluster. Cluster 2
represents three rodents (A. chrysophilus, G. leucogaster, S. campestris) and a sengi (E.
intufi) species from the woody habitat, site 1. The dominant rodent species was A.
chrysophilus, while E. intufi was the dominant sengi species. Cluster 3 comprises rodents,
shrews and sengi species recorded in the open grassland, sites 1 and 2. The dominant
rodent species in the open grassland were S. campestris and A. chrysophilus, more sengis
(E. intufi) were also recorded in the habitat. Other small mammal species belonging to this
cluster included the rodent species M. namaquensis, M. natalensi, and G. leucogaster and
the shrew species C. hirta. Thallomys paedulcus was absent from this cluster.

46
CHAPTER 5: DISCUSSION
5.1 Comparison of vegetation characteristics in the open grassland and woody
habitats.
In order to investigate the effect of habitat type on rodent and shrew species abundance,
richness, diversity, and composition in contrasting habitats in the present study, it was
critical to ascertain that the two selected habitats differed significantly in vegetation
attributes. Analysis of vegetation structure showed that the open grassland and woody
habitats that were selected for this study differed significantly in species abundance, tree
heights structure, and species richness of woody plants, except for the percentage of grass
cover. Furthermore, HCA revealed a low level of similarity (31%) in species composition
of woody plants between the open grassland and woody habitats. These vegetation
analysis clearly indicate that the two selected habitats were different enough from each
other.
5.2 Small mammal community structure and composition
5.2.1 Rodent, shrew and sengi species abundance
The result of this study showed no statistically significant difference in rodent, shrew and
sengi species abundance between the open grassland and woody habitats. The lack of a
statistically significant difference in the mean percentage grass cover between open
grassland and woody habitat may explain the similarity in rodent, shrew and sengi species
abundance in the open grassland and woody habitats. Both habitats had sufficient grass
cover to support these small mammals, therefore the null hypothesis that there will be no

47
difference in rodent, shrew and sengi species abundance in the open grassland and woody
habitats is supported.
Generally, vegetation cover is primarily an important component of habitats that greatly
affects small mammal species diversity and compositions (Monadjem, 1999; Gumbi et
al., 2018). This is because vegetation cover especially grass and herbaceous plant covers
provide not only food but also reduces the probability of small mammals being detected
and predated on by the aerial and ground predator (Symes et al., 2013). Additionally, the
safety for small mammals appears to correlate with some measure of vegetation such as
shrub cover or grass height (Loggins et al., 2019). For example, Tattersall et al. (2001)
demonstrated that tall grasses provide cover and protection from predators for small
mammals, whereas short grasses and open patches provide little protection and tend to be
avoided by small mammals. Similarly, in the grasslands of KwaZulu-Natal, Province,
South Africa. Banasiak and Shrader (2016) showed that small mammals improved their
foraging effort in places with high vegetation cover, likely because such sites were
perceived to be safe, thus suggesting that vegetation cover influences small mammal
movements and use of microhabitats. However, the present study did not find any link
between the recorded vegetation parameters and rodent species abundance, richness,
diversity, and composition, despite significantly different habitat types.
The present study showed that rodents were most abundant while shrews were the least
abundant in both habitats. Similar results have been reported in agricultural areas in the
Mbeya region, Tanzania where rodents and shrews formed 96.6% and 3.4%, respectively,
of the total rodent and shrew species abundance trapped (Michael, Ringo & Ratnayeke,
2016). Furthermore, Simelane et al. (2018) recorded a greater number of rodents than

48
shrews in the foothills of the Drakensberg Mountains. Moreover, in a study by Bantihun
and Bekele (2015) on diversity and habitat association of small mammals in the Aridtsy
forest, Awi Zone, Ethiopia, the total capture included eight species of small mammals of
which only 1.1% were shrews. The low number of shrews and sengis trapped in studies
of small mammals is attributable to the trapping method used, especially the Sherman trap
(Nicolas et al., 2006; Hurst et al., 2014; Simelane et al., 2018). Besides, the commonly
used rolled oats mixed with peanut butter as bait, it is not most appropriate for shrews
because they are insectivorous hence shrews that are trapped are the ones that may have
just stumbled into the Sherman live traps (Kok, Parker & Barker, 2013). In contrast,
Armand et al. (2013) demonstrated that baits or lure commonly used to trap small
mammals do not only attract them but also serve as food for sustenance for trapped
individuals. For example, peanut butter and oats mixtures baits provide an extra smell that
probably acts to provide extra food, depending on the seasonal availability of other food
resources (Kok, Parker & Barker, 2013). For instance, bait attracts insects such as bees,
beetles, butterflies, crickets, grasshoppers, and moths that are being preyed on by
insectivorous shrew and sengi species.
Compared to open grassland habitat, the total abundance of rodents, shrews and sengis
was higher in the woody habitat. This may be a reflection of high plant species diversity,
abundance, and grass cover which provided suitable habitat for rodents, shrews and sengis
in the woody habitat compared to open grassland through an abundance of food, shelter,
and safer movement of small mammals. Silva, Hartling and Opps (2005) also found that
mammalian diversity is likely to be lower in open habitats, where cover providing food
and shelter is reduced, as well as increasing predation risk. It is also possible that the

49
canopy cover of woody plants compensate for aerial predation and provides a suitable
microclimate for small mammals (Melo et al., 2013). Furthermore, foraging behavior
influenced species abundance of rodents, shrews and sengis, for instance, in a dry
environment, such as that of the present study (Mendelsohn et al., 2003), captures could
reduce in the open grassland during the dry seasons as also observed by Mulungu et al.
(2011) in Tanzania and Swaziland. Generally, species are expected to adapt their behavior
to avoid predation, and successfully search for food, mates, shelter, and a suite of
environmental conditions for their survival (Yadok, Pech & Chapman, 2019), thus
affecting their distribution.
The dominance of individual rodents also varied, G. leucogaster and A. chrysophilus were
the most trapped rodents in the woody habitat whereas, in the open grassland habitat, S.
campestris was the frequently trapped rodent species. Although G. leucogaster utilizes a
wide variety of habitats including grasslands, savannas, woodlands, and cultivated areas
(Smithers, 2011) and displays a wide range of environmental tolerance (Campbell, Lewis
& Williams, 2011), the presence of a large number of G. leucogaster in the woody habitat
may be that it is a generalist while the other rodent species have specific microhabitat
requirements that can be found embedded within a microhabitat (Matthews et al., 2005).
Hence, the high abundance in the woody habitat may reflect the use of the microhabitats
irrespective of their wide range of habitat tolerance.
Saccostomus campestris is known to have a wide habitat tolerance and can be found in
open, dense vegetation and rocky areas (Stuart & Stuart, 2007). It is a granivorous species
(Hurst et al., 2014), hence its higher abundance in the open grassland habitat than in the
woody habitat because open grassland provides more seeds. Aethomys chrysophilus is

50
omnivorous therefore had higher abundance in the woody habitat because it typically
relyies more on plants than animal food resources (Linzey & Chimimba, 2008).
Across all habitats, M. namaquensis showed equal preference for the open grassland and
woody habitats. It occurs widely throughout the Southern Africa sub-region (Mills, 1997)
irrespective of habitat type (Fagir et al., 2014). Equal preferences, may be an indication
of habitat tolerance. Mastomys natalensis was the least recorded rodent species in both
open grassland and woody habitats. In contrast, several studies (Magige, 2016; Michael,
Ringo & Ratnayeke, 2016; Kapia, 2018; Simelane et al., 2018) reported M. natalensis as
the most abundant and successful rodent sampled in study their areas, which is more likely
to be an indication that the species is common in agricultural areas (Magige, 2016).
Mastomys natalensis was expected to be abundant (Stuart & Stuart, 2007) because it is
omnivorous and a generalist species (Mamba et al., 2019). However, few were captured
and recorded during this study. Thallomys paedulcus was also a least sampled rodent
species and was also absent in the open grassland habitat. It is an arboreal species
(Karantanis et al., 2017) that prefers areas dominated by Acacias (Stuart & Stuart, 2007;
Karantanis et al., 2017), and is also known to have a low density throughout its
distributional range (Skinner & Chimimba, 2005).
Sengis (Elephantulus intufi) accounted for 31% and 21%, compared to shrews (Crocidura
hirta) 8% and 4% respectively, in the open grassland and woody habitat. Elephantulus
intufi is known to be less influenced by land use compared to many other small mammals
(Child et al., 2017) has a broad habitat tolerance (Smit, 2011). On the other hand, C. hirta
was the least sampled shrew species on the farm in both the open grassland and woody
habitats. This species is predominantly found in association with moist habitats, although

51
it is also found in very dry areas (Stuart & Stuart, 2007) that are seasonally independent
of water (Smithers, 2012). The moist environments are linked with a high abundance of
invertebrates which serves as prey for the shrew species (Simelane et al., 2018). The low
levels of moisture may therefore explain the low numbers of C. hirta in the habitats. The
use of Sherman live traps may have contributed to the low abundance of C. hirta in both
habitats. Bantihul & Bekele (2015) reported that the use of Sherman live traps led to the
capture of a low number of shrews. This is in contrast to the high trap success of shrews
in a study in Ethiopia when pitfall traps were used compared to Sherman live traps
(Nicolas & Colyn, 2006). They argued that many shrews are lightweight hence rarely
trigger the door trapping mechanism of the Sherman live traps.
5.2.2 Rodent, shrew and sengi species richness
The species richness of rodents, shrews and sengis in the present study was expressed as
the number of species that were trapped per habitat during the trapping period and as the
mean number of species per trap-night from each habitat. It was expected that species
richness would be higher in the woody habitat than in the open grassland habitat.
However, the present study showed that there was no significant difference in the mean
rodent, shrew and sengi species richness between the open grassland and woody habitats,
thus accepting the null hypothesis which state that open grassland and woody habitats do
not influence rodent, shrew and sengi species richness at Farm Karachas in Outjo. It has
been shown that changes in grass biomass influence species occurrence and species
richness, hence increased grass cover would increase small mammal species richness
(Loggins et al., 2019). Hence, the lack of a significant difference in rodent and shrew the
mean percentage grass cover between the open grassland and woody habitats in the

52
present study may have contributed to lack of a significant difference in rodent, shrew and
sengi species richness. Grass cover contributes to the provision of both food and protection
from predation, especially from aerial predators. Moreover, Saeed (2010) reported that,
low variation in species richness among habitats may suggest that small mammal selection
of habitat may not be influenced by individual perception and response to environmental
conditions.
Furthermore, a study in the Nama Karoo, South Africa by Hoffmann and Zeller (2005)
reported that intensive and uncontrolled grazing by animals had a clear negative impact
on species richness, diversity, and settlement or survival of small mammals due to the loss
of ground vegetation cover which leads to a reduction in food supply (plants, arthropods)
and available dew for small mammals. The present study site was not intensively grazed
(personal observations), therefore open grassland and woody habitat exhibited the same
species richness (Figure 13).
5.2.3 Rodent, shrew and sengi species diversity
The present study showed that there was no significant difference in the mean rodent,
shrew and sengi species diversity sampled in the open grassland and woody habitats,
therefore accepting the null hypothesis which predicted that open grassland and woody
habitat do not influence rodent and shrew species diversity at Farm Karachas. Many
rodent, shrew and sengi species were caught both in the open grassland and woody habitat,
suggesting these small mammals were responding to other vegetation parameters such as
woody plant canopy cover, species composition of grasses that were not considered, or a
completely different set of variables such as competition for food (Symes et al., 2013).
Both habitats were situated on the same farm which is likely to provide similar
53
environmental conditions needed by the species to obtain food resources, select a mate,
and successfully reproduce. The open grassland habitat had a mean species diversity
ranging from 0 to 1.61, whereas the woody habitat ranged from 0 to 1.46. This may be
attributed to an association of the trapped species with grassland microhabitats and that
some small mammals prefer habitats dominated by graminoids (Michał & Rafał, 2014).
Rosenzweig (1995) reported that the better the variety of resources in a habitat, the better
the species diversity of organisms that inhabit them and this may correspond to the number
of niches available within that particular habitat. Rodents, shrews and sengis may
therefore, have found open grassland sufficient in providing food.
Rautenbach et al. (2013) reported that rodent and shrew species diversity assemblages
vary both seasonally and annually in different vegetation types due to differences in the
vegetation structure and cover among seasons. Data on rodent, shrew and sengi species
diversity in the open grassland and woody habitats were collected in the same year and
season, providing these small mammals with similar niche opportunities to exploit such
as quantity and quality of crucial resources (e.g., shelter and food) (Mulungu et al., 2008).
Moreover, this may be affected by the breeding and reproductive season, thus resulting in
no significant difference in the rodent, shrew and sengi species diversity between the two
habitats. The same trend was observed by Simelane et al. (2018) who reported that species
diversity did not vary significantly across six habitats, but varied between the dry and wet
seasons. In contrast, a study by Imasiku (2011) in selected grassland and mixed shrub and
vegetation in Etosha National Park, Namibia showed no statistically significant difference
in small mammal species diversity between study sites and seasons.

54
5.2.4 Rodent, shrew and sengi species composition
Most of the rodents and shrew, and sengi sampled during the present study have been
documented by previous studies undertaken elsewhere in Namibia (e.g., Hoffmann &
Zeller, 2005; Imasiku, 2011; Karuaera, 2011; Mfune, Kangombe & Eiseb, 2013;
Hauptfleisch, 2014; Hauptfleisch, Vinte & Blaum, 2017; Kapia, 2018). The two habitats
in the present study shared the same rodent species that included (A. chrysophilus, M.
namaquensis, G. leucogaster, M. natalensis, S. campestris), shrew species (C. hirta) and
sengi species (E. intufi). Only T. paedulcus was caught exclusively in the woody habitat.
A dendrogram from an HCA based Bray – Curtis Index Similarity using present/absent
binary data showed a high similarity (63%) in rodent, shrew and sengi species composition
between the open grassland and woody habitats, indicating that heterogeneity was
relatively low. The heterogeneity hypothesis suggests that the more spatially diverse the
community is, the greater the species richness, which also accounts for species
composition (Waide, 1999). The observed high similarity in the present stud may also
suggest minimal species migrations between the open grassland and woody habitats. This
may also indicate that the farm is in good health and species are dependent on the farm.
The present study therefore, accepts the null hypothesis of no difference in rodent, shrew
and sengi species composition in the open grassland and woody habitats.
There was little variation (63% similarity) in rodent, shrew and sengi species composition
between the open grassland and woody habitats, indicating that some species, such as T.
paedulcus that was absent in the open grassland habitat were not common among the
habitats. This may suggest a more even distribution of rodents, shrews and sengi and
resemblances in habitat qualities. On the other hand, variations in small mammal

55
composition may also be influenced by factors such as food, niche separation, and
microhabitats (Saeed, 2010).
The result of the present study suggests that seven species, i.e., A. chrysophilus, M.
namaquensis, G. leucogaster, M. natalensis, S. campestris, C. hirta and E. intufi have a
wide range of habitat preference among the species captured, as they were observed in
both the open grassland and woody habitats. The spatial distance of 600 m between the
habitats did not have a significant impact on the rodent, shrew and shrew species
composition because no species captured in the open grassland was recaptured in the
woody habitat and vice versa. Both habitats were sampled on the same month, year, and
season and were therefore exposed to similar environmental conditions such as exposure
to sunlight, temperature, and moonlight. Stromgren (2008) reported that temperature may
have an effect on the activity of small mammals, especially on the timing of the activity.
The dominant rodent species in the woody habitat was G. leucogaster followed by A.
chrysophilus. Both species are widely distributed and are omnivorous (Stuart & Stuart,
2007). The diet of G. leucogaster typically comprises of more arthropods than plants
materials, seeds (Skinner & Smithers, 1990). Hoffmann and Zeller (2005) reported that G.
leucogaster depends much on adequate vegetation cover and not necessarily on food
availability as it was found to depend on other resources availability such as availability
of water. It can therefore be inferred that the dominance of G. leucogaster is a result of
vegetation cover in the woody habitat. Despite its wide distribution, some studies have
found G. leucogaster to be sensitive to change in vegetation cover (Muck & Zeller, 2006).

56
Vesey-Fitzgerald (1966) reported that the diet of A. chrysophilus mainly consists of hard
dry fruit of trees and shrubs such as Grewia spp and Combretum spp which they collect
on the ground and store in their shelter to be eaten at any season. In the present study, G.
flava and G. flavences were amongst the most abundant woody plant species in the woody
habitat, therefore contributing to the higher dominance of A. chrysophilus in the woody
habitat.
The pouched mouse Saccostomus campestris dominated the open grassland habitat. It is
a granivore, primarily eating seeds, grains, and nuts and prefers open patches with tall
vegetation for cover rather than heavily grazed vegetation (Hagenah, Prins & Olff, 2009).
In the present study, grasses in the open grassland habitat were more than 1 m high
(personal observation), therefore contributing to its higher capture. However, in a study
by Fitzherbert et al. (2007) on habitat preferences of small mammals in the Katavi
ecosystem in western Tanzania, S. campestris abundance was found to significantly
correlate with measures of leaf and tree cover.
Sengi species (Elephantulus intufi) dominated both the open grassland and woody habitats
while shrew species (C. hirta) was the least captured in both. Stuart and Stuart (2007)
reported that E. intufi rely more on bush or grass cover that have pathways between
shelters. It feeds on insects and other invertebrates, with a marked preference for ants and
termites (Stuart & Stuart, 2007). Its dominance may be an indication of a high abundance
of food resources. Crocidura hirta is mostly associated with moist habitats with good
ground vegetation cover (Stuart & Stuart, 2007), hence, is sensitive to dry and lowly
covered vegetation areas. Loggins et al. (2019) reported that C. hirta populations decline

57
with an increase in woody cover, therefore contributing to its low capture in the woody
habitat in the present study.
The distribution of organisms is affected by environmental characteristics they are
exposed to (Malmstrom, 2012). For example, soil and/or climate may influence small
mammal species composition (Rautenbach et al., 2013), perhaps why some species such
as T. paedulcus was found in the woody habitat rather than in the open habitat. The
arboreal Acacia rat (T. paedulcus) depends on Acacia tree species, for food and nesting
(Stuart & Stuart, 2007). Acacia thorns provide optimal protection against predators during
foraging (Delany, 1972). It lives under the ragged bark of Acacia tree trunks and branches
and nests as high as 4 m from the ground (Hutchins, 2014). Thallomys paedulcus species
can serve as an ecological indicator by identifying areas with Acacia species. Senegalia
spp (previously known as Acacia spp) were one of the most abundant woody plant species
in the woody habitat. The woody habitat accounted for 30% of the woody plants that were
in the height classes < 1 m and > 3 m. The sampling technique that was used to trap small
mammals in the study site may have been ineffective in capturing arboreal species such
as T. paedulcus (Rautenbach, 2013) therefore explaining their exclusive presence in the
open grassland.
Mastomys natalensis and M. namaquensis were less dominant in both habitats the open
grassland and woody habitat. Jackson and Van Aarde et al. (2003) reported that M.
natalensis generally occurs in areas receiving more than 600 mm per annum. The present
study area however receives a minimum of 350 mm and a maximum of 400 mm of
precipitation per year (Mendelsohn et al., 2002). Mastomys natalensis is omnivorous and
a generalist (Mamba et al., 2019), but has a poor colonizing ability and prefers randomly

58
unstable habitats (Willan & Meester, 1989), hence contributing to its low capture. On the
other hand, species within the genus Mastomys are considered to be indicator species that
increases following a disturbance (Erena, Yosef & Bekele, 2011). It is also possible that
this may also be attributed to inter-specific competition, where one species dominates
another that is also important in shaping small mammal community structure (Cao et al.,
2016). The low dominance of M. natalensis in the present study may therefore indicate
that the farm is of good quality.
It is noteworthy in the present study that M. namaquensis was the least dominant species
in both the open grassland and woody habitats. Fagir et al. (2014) and Van Maltilz et al.
(2006) reported that M. namaquensis is one of the dominant small mammals irrespective
of the habitat type. The low dominance of M. namaquensis in the present study may be
due to its preference for rocky outcrops or hillsides (Fagir et al., 2014) which was not
typical landscape for the study area in the present study (personal observation).

59
CHAPTER 6: CONCLUSIONS AND RECOMMENDATIONS
6.1 Conclusions
The present study has shown that there was no significant difference in rodent, shrew and
sengi species abundance on the open grassland and woody habitats. This may be due to
the percentage of grass cover similar in both habitats. Hence, there was sufficient evidence
to accept the null hypothesis that rodent, shrew and sengi species abundance will not be
significantly different in the woody habitat than open grassland habitat. Gerbilliscus
leucogaster and A. chrysophilus were found to be the dominant rodent species in the
woody habitat, while S. campestris was dominant in the open grassland habitat.
Elephantulus intufi was found to be the dominant sengi species in both habitats with C.
hirta being the least trapped shrew species in both habitats.
The results of the present study suggest that rodent, shrew and sengi species richness and
diversity were not influenced by the open grassland habitat and woody habitat. This may
indicate that the two habitats did not have a sufficient difference in key vegetation factors
that would have led to or be associated with a difference in rodent, shrew and sengi species
richness and diversity. Hence, there was sufficient evidence to accept the null hypotheses
that rodent, shrew and sengi species richness and diversity will not be significantly
different in the woody habitat than open grassland habitat.
The common rodent, shrew and sengi species found in the open grassland and woody
habitats were A. chrysophilus, M. namaquensis, G. leucogaster, M. natalensis, S.
campestris, C. hirta, and E. intufi. Thallomys paedulcus was absent in the open grassland
habitat. The rodent, shrew and sengi species composition did not differ among the habitats
probably as a result of similarity in ground cover and food resources which are major

60
determinants of species compositions of small mammals. There was a high level of
similarity (63%) in rodent, shrew and sengi species compositions. Hence, there was
sufficient evidence to accept the null hypothesis that rodent, shrew and sengi species
composition will not be significantly different in the woody than open grassland habitat.
6.2 Recommendations:
While the data collection period of the present study was of short duration, the limited
data available highlighted the critical need for further studies on the effect of habitat type
on rodent and shrew species abundance, richness, diversity, and composition of the
community structure, therefore further studies must be conducted to improve the
reliability of the result in the present study. Similar rodent and shrew species diversity in
the open grassland and woody habitats remain unclear and therefore, it is critical to
conduct a similar study over a longer period of time where no ecological disturbance has
occurred, to assess if these findings will be supported by other studies. The is also a critical
need for a comparative study of rodents and shrews species abundance, richness, diversity
and composition to be undertaken in the two habitats over different seasons to evaluate
whether there is seasonal variation. Seasonality represents a major factor that determines
how individuals use vegetation type as it influences the dynamics of their food, cover, and
reproductive period. In addition, there is a critical need to evaluate edaphic (soil
properties) and grazing intensity on the farm in order to assess the response of rodents and
shrews to different habitat types.
61
REFERENCES
Addisu, A. and Bekele, A., 2014. Habitat preferences, seasonal abundance and diets of
rodents in Alage, Southern Ethiopia. African Journal of ecology, 52(3),
pp.284-291.
Aljumily, R., 2016. Agglomerative hierarchical clustering: an introduction to
essentials. (1) Proximity coefficients and creation of a vector-distance matrix and
(2) construction of the hierarchical tree and a selection of methods. Global
Journal of Human-Social Science, 16(3), pp.22-50.
Astúa, D., Moura, R.T., Grelle, C.E. and Fonseca, M.T., 2006. Influence of baits, trap type
and position for small mammal capture in a Brazilian lowland Atlantic
Forest. Boletim do Museu de Biologia Mello Leitão, 19(1), pp.31-44.
Auffray, J.C., Renaud, S. and Claude, J., 2009. Rodent biodiversity in changing
environments. Kasetsart Journal, Natural Sciences, 43(1), pp.83-93.
Avenant, N.L., 2000. Small mammal community characteristics as indicators of
ecological disturbance in the Willem Pretorius Nature Reserve, Free State,
South Africa. South African Journal of Wildlife Research-24-month
delayed open access, 30(1), pp.26-33.
Avenant, N.L., 2003. The use of small mammal community characteristics as an
indicator of ecological disturbance in the Korannaberg Conservancy. Aciar
Monograph Series, 96, pp.95-98.

62
Avenant, N.L. and Cavallini, P., 2007. Correlating rodent community structure with
ecological integrity, Tussen‐die‐Riviere Nature Reserve, Free State
province, South Africa. Integrative zoology, 2(4), pp.212-219.
Avenant, N.L., Watson, J.P. and Schulze, E., 2008. Correlating small mammal community
characteristics and habitat integrity in the Caledon Nature Reserve, South
Africa. Mammalia, 72(3), pp.186-191.
Avenant, N., 2011. The potential utility of rodents and other small mammals as
indicators of ecosystem ‘integrity’of South African grasslands. Wildlife
Research, 38(7), pp.626-639.
Baker, M.A.A. and Brown, J.S., 2014. Foraging in space and time structure an African
small mammal community. Oecologia, 175(2), pp.521-535.
Banasiak, N. and Shrader, A.M., 2016. Similarities in perceived predation risk prevent
temporal partitioning of food by rodents in an African grassland. Journal of
Mammalogy, 97(2), pp.483-489.
Bantihun, G. and Bekele, A., 2015. Diversity and habitat association of small mammals
in Aridtsy forest, Awi Zone, Ethiopia. Zoological Research, 36(2), p.88.
Barger, N.N., Archer, S.R., Campbell, J.L., Huang, C.Y., Morton, J.A. and Knapp,
A.K., 2011. Woody plant proliferation in North American drylands: a
synthesis of impacts on ecosystem carbon balance. Journal of Geophysical
Research: Biogeosciences, 116(G4).

63
Bertolino, S., Girardello, M. and Amori, G., 2014. Identifying conservation priorities
when data are scanty: a case study with small mammals in Italy. Mammalian
Biology, 79(6), pp.349-356.
Blair, W.F., 1941. Techniques for the study of mammal populations. Journal of
Mammalogy, 22(2), pp.148-157.
Blair, J., Nippert, J. and Briggs, J., 2014. Grassland ecology. Ecology and the
Environment, pp.389-423.
Caceres, N., Nápoli, R. and Hannibal, W., 2011. Differential trapping success for small
mammals using pitfall and standard cage traps in a woodland savannah region of
southwestern Brazil. mammalia, 75(1), pp.45-52.
Campbell, M.J. and Swinscow, T.D.V., 2009. Statistics at square one. 11th ed. John Wiley
& Sons.
Campbell, T.L., Lewis, P.J. and Williams, J.K., 2011. Analysis of the modern
distribution of South African Gerbilliscus (Rodentia: Gerbillinae) with
implications for Plio-Pleistocene palaeoenvironmental reconstruction. South
African Journal of Science, 107(1-2), pp.1-7.
Cao, C., Shuai, L.Y., Xin, X.P., Liu, Z.T., Song, Y.L. and Zeng, Z.G., 2016. Effects of
cattle grazing on small mammal communities in the Hulunber meadow
steppe. PeerJ, 4, p.2349.
Carlen, E.J., Rathbun, G.B., Olson, L.E., Sabuni, C.A., Stanley, W.T. and Dumbacher,
J.P., 2017. Reconstructing the molecular phylogeny of giant sengis

64
(Macroscelidea; Macroscelididae; Rhynchocyon). Molecular phylogenetics and
evolution, 113, pp.150-160.
Caro, T.M., 2001. Species richness and abundance of small mammals inside and
outside an African national park. Biological Conservation, 98(3), pp.251-257.
Carpenter, J.R., 1940. The grassland biome. Ecological Monographs, 10(4), pp.617-684.
Caughley, G. and Sinclair, A.R.E., 1994. Wildlife ecology and management. Blackwell
Science.
Chekol, T., Bekele, A. and Balakrishnan, M., 2012. Population density, biomass and
habitat association of rodents and insectivores in Pawe area, Northwestern
Ethiopia. Tropical Ecology, 53(1), pp.15-24.
Child, M.F., Roxburgh, L., Do Linh San, E., Raimondo, D. and Davies-Mostert, H.T.,
2017.The red list of mammals of South Africa, Swaziland and Lesotho
2016. South African National Biodiversity Institute and Endangered Wildlife
Trust, South Africa.
Churchfield, S., 1990. The natural history of shrews. Cornell University Press.
Corder, G.W. and Foreman, D.I., 2014. Nonparametric statistics: A step-by-step
approach. John Wiley & Sons.
Datiko, D., Bekele, A. and Belay, G., 2007. Species composition, distribution and
habitat association of rodents from Arbaminch forest and farmlands,
Ethiopia. African Journal of Ecology, 45(4), p.651.

65
Datiko, D. and Bekele, A., 2014. Habitat association and distribution of rodents and
insectivores in Chebera Churchura National Park, Ethiopia. Tropical
Ecology, 55(2), pp.221-229.
Deák, B., Rádai, Z., Lukács, K., Kelemen, A., Kiss, R., Bátori, Z., Kiss, P.J. and Valkó,
O., 2020. Fragmented dry grasslands preserve unique components of plant species
and phylogenetic diversity in agricultural landscapes. Biodiversity and
Conservation, 29(14), pp.4091-4110.
Delany, M.J., 1972. The ecology of small rodents in tropical Africa. Mammal
Review, 2(1), pp.1-42.
Delcros, G., Taylor, P.J. and Schoeman, M.C., 2015. Ecological correlates of small
mammal assemblage structure at different spatial scales in the savannah biome of
South Africa. Mammalia, 79(1), pp.1-14.
Dubale, M. and Ejigu, D., 2015. Diversity, relative abundance and habitat association of
rodents in Aquatimo forest patches and adjacent farmland, East Gojjam,
Ethiopia. Ethiopian Journal of Biological Sciences, 14(2), pp.201-216.
Ellis, T.D. and Cushman, J.H., 2018. Indirect effects of a large mammalian herbivore on
small mammal populations: Context‐dependent variation across habitat types,
mammal species, and seasons. Ecology and Evolution, 8(23), pp.12115-
12125.
Erckie, J., 2007. Assessing the effects of grazing intensity by larger herbivores on species
diversity and abundance of small mammals at Waterberg Plateau Park, Namibia.
(Master's thesis, University of Namibia).

66
Erena, M.G., Yosef, M. and Bekele, A., 2011. Species richness, abundance and habitat
preference of rodents in Komto protected forest, Western Ethiopia. Journal of
Agriculture and Biological Science, 2(6), pp.166-175.
Fagir, D.M., Ueckermann, E.A., Horak, I.G., Bennett, N.C. and Lutermann, H., 2014. The
Namaqua rock mouse (Micaelamys namaquensis) as a potential reservoir and
host of arthropod vectors of diseases of medical and veterinary importance
in South Africa. Parasites & vectors, 7(1), p.366.
Fauteux, D., Gauthier, G., Mazerolle, M.J., Coallier, N., Bêty, J. and Berteaux, D., 2018.
Evaluation of invasive and non‐invasive methods to monitor rodent abundance in
the Arctic. Ecosphere, 9(2), pp.1-18.
Ferreira, S.M. and Van Aarde, R.J., 2000. Maintaining diversity through intermediate
disturbances: evidence from rodents colonizing rehabilitating coastal dunes.
African Journal of Ecology, 38(4), pp.286-294.
Fitzherbert, E., Gardner, T., Caro, T. and Jenkins, P., 2007. Habitat preferences of small
mammals in the Katavi ecosystem of western Tanzania. African Journal of
Ecology, 45(3), pp.249-257.
Flores-Peredo, R., Sánchez-Velásquez, L.R., Galindo-González, J. and Morales- Mávil,
J.E., 2011. Post-dispersed pine seed removal and its effect on seedling
establishment in a Mexican Temperate Forest. Plant ecology, 212(6), pp.1037-
1046.

67
Flores-Peredo, R. and Vázquez-Domínguez, G., 2016. Influence of vegetation type and
season on rodent assemblage in a Mexican temperate forest mosaic. Therya, 7(3),
pp.357-369.
Foster, C.N., Barton, P.S. and Lindenmayer, D.B., 2014. Effects of large native herbivores
on other animals. Journal of Applied Ecology, 51(4), pp.929-938.
Gaillard, J.M., Hebblewhite, M., Loison, A., Fuller, M., Powell, R., Basille, M. and
Van Moorter, B., 2010. Habitat–performance relationships: finding the right
metric at a given spatial scale. Philosophical Transactions of the Royal
Society B: Biological Sciences, 365(1550), pp.2255-2265.
Gannon, W.L. and Sikes, R.S., 2007. Guidelines of the American Society of
Mammalogists for the use of wild mammals in research. Journal of
Mammalogy, 88(3), pp.809-823.
Garshong, R.A., Attuquayefio, D.K., Holbech, L.H. and Adomako, J.K., 2013.
Distribution and abundance of small mammals in different habitat types in the
Owabi Wildlife Sanctuary, Ghana. Journal of Ecology and the Natural
Environment, 5(5), pp.83-87.
Gliwicz, J. and Taylor, J.R., 2002. Comparing life histories of shrews and
rodents. Actatheriologica, 47(1), pp.185-208.
Goheen, J.R., Keesing, F., Allan, B.F., Ogada, D. and Ostfeld, R.S., 2004. Net effects
of large mammals on Acacia seedling survival in an African
savanna. Ecology, 85(6), pp.1555-1561.
Goudie, A. and Viles, H., 2014. Landscapes and landforms of Namibia. Springer.

68
Gumbi, B.C., Shapiro, J.T., Mahlaba, T., McCleery, R., MacFadyen, D. and Monadjem,
A., 2018. Assessing the impacts of domesticated versus wild ungulates on
terrestrial small mammal assemblages at Telperion Nature Reserve, South
Africa. African Zoology, 53(1), pp.23-29.
Hagenah, N., Prins, H.H. and Olff, H., 2009. Effects of large herbivores on murid
rodents in a South African savanna. Journal of Tropical Ecology, pp.483-492.
Hammer, Ø., Harper, D.A. and Ryan, P.D., 2001. PAST: Paleontological statistics
software package for education and data analysis. Palaeontologia
electronica, 4(1), p.9.
Hardy, R., 1945. The influence of types of soil upon the local distribution of some
mammals in southwestern Utah. Ecological Monographs, 15(1), pp.71-108.
Hauptfleisch, M.L., 2014. The use of ecosystem parameters in predicting the risk of
aicraft-wildlife collisions at Namibian airports (Doctoral dissertation, University
of the Free State).
Hauptfleisch, M.L. and Avenant, N.L., 2015. Integrating small mammal community
variables into aircraft–wildlife collision management plans at Namibian
airports. Integrative zoology, 10(6), pp.515-530.
Hauptfleisch, M.L., Vinte, M.P. and Blaum, N., 2017. A comparison of the community
dynamics of bioturbating small mammals between livestock and wildlife
farming areas in the Kalahari, Namibia. Namibian Journal of Environment,
1, pp.A34-39.

69
Heathens, M.R., Wirsing, A.J., Burkholder, D., Thomson, J. and Dill, L.M., 2009.
Towards a predictive framework for predator risk effects: the interaction of
landscapefeatures and prey escape tactics. Journal of Animal Ecology, 78(3),
pp.556-562.
Hebblewhite, M., Merrill, E. and McDermid, G., 2008. A multi‐scale test of the forage
maturation hypothesis in a partially migratory ungulate population. Ecological
monographs, 78(2), pp.141-166.
Hoffmann, A. and Zeller, U., 2005. Influence of variations in land use intensity on
species diversity and abundance of small mammals in the Nama Karoo,
Namibia. Belgian Journal of Zoology, 135(1), pp.91-96.
Hoffmann, A., Decher, J., Rovero, F., Schaer, J., Voigt, C. and Wibbelt, G., 2010. Field
methods and techniques for monitoring mammals. Manual on field recording
techniques and protocols for all taxa biodiversity inventories, 8, pp.482-529.
Holdo, R.M., Holt, R.D. and Fryxell, J.M., 2013. Herbivore–vegetation feedbacks can
expand the range of savanna persistence: insights from a simple theoretical
model. Oikos, 122(3), pp.441-453.
Hoveka, J., 2015. Molecular characterization of rodent-and-shrew-borne viruses and the
prevalence and intensity of infestation of small mammal fleas, in
Namibia (Master’s thesis, University of Namibia).
Hurst, Z.M., McCleery, R.A., Collier, B.A., Silvy, N.J., Taylor, P.J. and Monadjem, A.,
2014. Linking changes in small mammal communities to ecosystem functions in
an agricultural landscape. Mammalian Biology, 79(1), pp.17-23.

70
Hutchins, M., 2004. Rats, mice, and relatives V. Grizimek's Animal Life
Encyclopedia, 16, p.281295.
Hutto, R.L., 1985. Habitat selection by nonbreeding, migratory land. Habitat selection
in birds, pp.455-476.
Imasiku, N.N.T., 2011. Seasonal variation in species composition, diversity and
abundance of small mammals in a selected grassland and mixed-shrub land
vegetation in Etosha National Park, Namibia. (Master’s thesis, University of
Namibia).
Jackson, T.P. and Van Aarde, R.J., 2003. Sex-and species-specific growth patterns in
cryptic African rodents, Mastomys natalensis and M. coucha. Journal of
mammalogy, 84(3), pp.851-860.
Jacques, M.E., McBee, K. and Elmore, D., 2015. Managing for Small Mammal
Diversity. Oklahoma State University.
Jayaraj, V.K., Tahir, N.F.D.A., Udin, N.A., Baharin, N.F.K., Ismail, S.K. and Zakaria,
S.N.A., 2012. Species diversity of small mammals at Gunung Stong state park,
Kelantan, Malaysia. Journal of Threatened Taxa, 4(6), pp.2617-2628.
Johnson, S.D., Burgoyne, P.M., Harder, L.D. and Dötterl, S., 2011. Mammal pollinators
lured by the scent of a parasitic plant. Proceedings of the Royal Society B:
Biological Sciences, 278(1716), pp.2303-2310.
Joubert, D.F., Rothauge, A. and Smit, G.N., 2008. A conceptual model of vegetation
dynamics in the semiarid Highland savanna of Namibia, with particular

71
reference to bush thickening by Acacia mellifera. Journal of Arid
Environments, 72(12), pp.2201-2210.
Kapia, S., 2018. Detection of Leptospira and seasonal prevalence of fleas collected
from small mammals in Mukwe constituency, Kavango East region of
Namibia (Master’s thesis, University of Namibia).
Karantanis, N.E., Rychlik, L., Herrel, A. and Youlatos, D., 2017. Arboreality in acacia
rats (Thallomys paedulcus; Rodentia, Muridae): gaits and gait metrics. Journal
of Zoology, 303(2), pp.107-119
Karuaera, N.A., 2011. Assessing the effects of bush encroachment on species
abundance, composition and diversity of small mammals at the Neudamm
Agricultural Farm, Khomas Region Namibia (Master’s thesis, University of
Namibia).
Katakweba, A.A., Mulungu, L.S., Eiseb, S.J., Mahlaba, T.A.A., Makundi, R.H.,
Massawe, A.W., Borremans, B. and Belmain, S.R., 2012. Prevalence of
haemoparasites, leptospires and coccobacilli with potential for human
infection in the blood of rodents and shrews from selected localities in
Tanzania, Namibia and Swaziland. African Zoology, 47(1), pp.119-127.
Kay, E.H. and Hoekstra, H.E., 2008. Rodents. Current Biology, 18(10), pp.R406- R410.
Kerley, G.I., Whitford, W.G. and Kay, F.R., 2004. Effects of pocket gophers on desert
soils and vegetation. Journal of Arid Environments, 58(2), pp.155-166.
Kim, T.K. and Park, J.H., 2019. More about the basic assumptions of t-test: normality and
sample size. Korean journal of anesthesiology, 72(4), p.331.

72
Kiwia, H.Y.D., 2006. Species richness and abundance estimates of small mammals in
Zaraninge coastal forest in Tanzania. Tanzania Journal of Science, 32(2), pp.51-
60.
Kok, A.D., Parker, D.M. and Barker, N.P., 2013. Rules of attraction: the role of bait in
small mammal sampling at high altitude in South Africa. African Zoology, 48(1),
pp.84-95.
Krijger, I.M., Belmain, S.R., Singleton, G.R., Groot Koerkamp, P.W. and Meerburg,
B.G., 2017. The need to implement the landscape of fear within rodent pest
management strategies. Pest management science, 73(12), pp.2397-2402.
Krojerová-Prokešová, J., Homolka, M., Barančeková, M., Heroldová, M., Baňař, P.,
Kamler, J., Purchart, L., Suchomel, J. and Zejda, J., 2016. Structure of small
mammal communities on clearings in managed Central European
forests. Forest Ecology and Management, 367, pp.41-51.
Lacher Jr, T.E., Davidson, A.D., Fleming, T.H., Gómez-Ruiz, E.P., McCracken, G.F.,
Owen- Smith, N., Peres, C.A. and Vander Wall, S.B., 2019. The functional
roles of mammals in ecosystems. Journal of Mammalogy, 100(3), pp.942- 964.
Leal, W., Llanos, E.J., Restrepo, G., Suárez, C.F. and Patarroyo, M.E., 2016. How
frequently do clusters occur in hierarchical clustering analysis? A graph theoretical
approach to studying ties in proximity. Journal of cheminformatics, 8(1), pp.1-16.
Le Roux, P.J., Müller, M.A.N., Curtis, B. and Mannheimer, C., 2009. Le Roux and
Müller's Field Guide to the Trees & Shrubs of Namibia. Macmillan
Education Namibia.

73
Leis, S.A., Leslie, D.M., Engle, D.M. and Fehmi, J.S., 2008. Small mammals as indicators
of short-term and long-term disturbance in mixed prairie. Environmental
monitoring and assessment, 137(1-3), pp.75-
Levin, S.A., 2013. Encyclopedia of biodiversity. Elsevier Inc.
Lim, B.K. and Pacheco, V., 2016. Small mammals. Core Standardized Methods, pp.84-
92.
Linzey, A.V. and Chimimba, C.T., 2008. Aethomys chrysophilus (Rodentia:
Muridae). Mammalian Species, 808(1), pp.1-10.
Liu, J.Y., Du, H., Tian, G.B., Yu, P.H., Wang, S.W. and Peng, H., 2008. Community
structure and diversity distributions of small mammals in different sample plots
in the eastern part of Wuling Mountains. Zoological Research, 29(6), pp.637-
645.
Loggins, A.A., Monadjem, A., Kruger, L.M., Reichert, B.E. and McCleery, R.A., 2019.
Vegetation structure shapes small mammal communities in African
savannas. Journal of Mammalogy, 100(4), pp.1243-1252.
Loggins, A.A., Shrader, A.M., Monadjem, A. and McCleery, R.A., 2019. Shrub cover
homogenizes small mammals’ activity and perceived predation risk. Scientific
reports, 9(1), pp.1-11.
Łopucki, R. and Mróz, I., 2016. An assessment of non-volant terrestrial vertebrate’s
response to wind farms—a study of small mammals. Environmental
monitoring and assessment, 188(2), p.122.

74
Luza, A.L., Gonçalves, G.L., Pillar, V.D. and Hartz, S.M., 2016. Processes related to
habitat selection, diversity and niche similarity in assemblages of non-volant
small mammals at grassland–forest ecotones. Natureza & Conservação, 14(2),
pp.88-98.
Luza, A.L., Trindade, J.P.P., Maestri, R., da Silva Duarte, L. and Hartz, S.M., 2018.
Rodent occupancy in grassland paddocks subjected to different grazing
intensities in South Brazil. Perspectives in Ecology and Conservation, 16(3),
pp.151-157.
Magige, F., 2016. Variation of small mammal populations across different habitat types
in the Serengeti ecosystem. Tanzania Journal of Science, 42(1), pp.15-23.
Makundi, R.H., Bekele, A., Leirs, H., Massawe, A.W., Rwamugira, W. and Mulungu,
L.S., 2005. Farmer’s perceptions of rodents as crop pests: Knowledge,
attitudes and practices in rodent pest management in in Tanzania and Ethiopia.
Belgian Journal of zoology, 135(1), pp.153-157.
Malcolm, J.R. and Ray, J.C., 2000. Influence of timber extraction routes on central
African small‐mammal communities, forest structure, and tree
diversity. Conservation Biology, 14(6), pp.1623-1638.
Malmstrom, C., 2012. Ecologists study the interactions of organisms and their
environment. Nature Education Knowledge, 3, pp.10-88.
Mamba, M., Fasel, N.J., Themb'alilahlwa, A.M., Austin, J.D., McCleery, R.A. and
Monadjem, A., 2019. Influence of sugarcane plantations on the population

75
dynamics and community structure of small mammals in a savanna-
agricultural landscape. Global Ecology and Conservation, 20, p.00752.
Massawe, A.W., Rwamugira, W., Leirs, H., Makundi, R.H., Mulungu, L., Ngowo, V. and
Machang'u, R., 2008. Soil type limits population abundance of rodents in crop
fields: case study of the multimammate rat Mastomys natalensis Smith, 1834
in Tanzania. Integrative Zoology, 3(1), pp.27-30.
Matthews, T., Denys, C. and Parkington, J.E., 2005. The palaeoecology of the
micromammals from the late middle Pleistocene site of Hoedjiespunt 1 (Cape
Province, South Africa). Journal of Human Evolution, 49(4), pp.432-451.
McKillup, S., 2011. Statistics explained: An introductory guide for life scientists.
Cambridge University Press.
Medan, D., Torretta, J.P., Hodara, K., Elba, B. and Montaldo, N.H., 2011. Effects of
agriculture expansion and intensification on the vertebrate and invertebrate
diversity in the Pampas of Argentina. Biodiversity and Conservation, 20(13),
pp.3077-3100.
Melo, G.L., Miotto, B., Peres, B. and Caceres, N.C., 2013. Microhabitat of small
mammals at ground and understory levels in a deciduous, southern Atlantic
Forest. Anais da Academia Brasileira de Ciências, 85(2), pp.727-736.
Mendelsohn, J., Jarvis, A., Roberts, C. and Robertson, T., 2002. Atlas of Namibia, a
portrait of the land and its people. Cape Town.
Merritt, J.F., 2010. The biology of small mammals. Johns Hopkins University Press.

76
Merritt, J., Churchfield, S., Hutterer, R. and Sheftel, B., 2005. Advances in the biology of
shrews II. New York: International Society of Shrew Biologists.
Mfune, J.K., Kangombe, F. and Eiseb, S.J., 2013. Host specificity, prevalence and
intensity of infestation of fleas (Order Siphonaptera) of small mammal’s at
selected sites in the city of Windhoek, Namibia. International Science Technology
Journal of Namibia, 1(1), pp.64-77.
Michael, N., Ringo, J. and Ratnayeke, S., 2016. Diversity, Composition and Richness of
Small Mammals in Natural and Agricultural Areas in Mbeya Region,
Tanzania. Iinternational Journal of Modern Plant & Animal Sciences, 4(1), pp.35-
46.
Michał, B. and Rafał, Z., 2014. Responses of small mammals to clear-cutting in temperate
and boreal forests of Europe: a meta-analysis and review. European Journal of
Forest Research, 133(1), pp.1-11.
Miller, R. and Siegmund, D., 1982. Maximally selected chi square statistics. Biometrics,
38(4), pp.1011-1016.
Mills, G., 1997. The complete book of southern African mammals. Struik Publishers.
Monadjem, A., 1999. Geographic distribution patterns of small mammals in Swaziland in
relation to abiotic factors and human land-use activity. Biodiversity &
Conservation, 8(2), pp.223-237.
Mortelliti, A., Amori, G., Capizzi, D., Cervone, C., Fagiani, S., Pollini, B. and Boitani, L.,
2011. Independent effects of habitat loss, habitat fragmentation and structural

77
connectivity on the distribution of two arboreal rodents. Journal of Applied
Ecology, 48(1), pp.153-162.
Mortelliti, A., Amori, G., Capizzi, D., Rondinini, C. and Boitani, L., 2010.
Experimental design and taxonomic scope of fragmentation studies on
European mammals: current status and future priorities. Mammal
Review, 40(2), pp.125-154.
Muck, C. and Zeller, U., 2006. Small mammal communities on cattle and game
grazing areas in Namibia. African Zoology, 41(2), pp.215-223.
Mulungu, L.S., Makundi, R.H., Massawe, A.W., Machang'u, R.S. and Mbije, N.E.,
2008. Diversity and distribution of rodent and shrew species associated with
variations in altitude on Mount Kilimanjaro, Tanzania. Mammalia, 72(3),
pp.178-185.
Mulungu, L.S., Themb’alilahlwa, A.M., Massawe, A.W., Kennis, J., Crauwels, D.,
Eiseb, S., Monadjem, A., Makundi, R.H., Katakweba, A.A., Leirs, H. and
Belmain, S.R., 2011. Dietary differences of the multimammate mouse, Mastomys
natalensis (Smith, 1834), across different habitats and seasons in Tanzania
and Swaziland. Wildlife Research, 38(7), pp.640-646.
Ministry of Environment and Tourism, 2013. Management Plan Bwabwata National Park
2013 / 2014 to 2017 / 2018. Windhoek: Ministry of Environment and Tourism,
p.18.
Nel, J.A.J., 2013. Thallomys Paedulcus Sundevall's Acacia rat (Acacia Thallomys).
(Master's thesis, Stellenbosch University).

78
Nicolas, V. and Colyn, M., 2006. Relative efficiency of three types of small mammal
traps in an African rainforest. Belgian Journal of Zoology, 136(1), p.107
Niedziałkowska, M., Kończak, J., Czarnomska, S. and Jędrzejewska, B., 2010. Species
diversity and abundance of small mammals in relation to forest productivity in
northeast Poland. Ecoscience, 17(1), pp.109-119.
Peña‐Claros, M., Poorter, L., Alarcón, A., Blate, G., Choque, U., Fredericksen, T.S.,
Justiniano, M.J., Leaño, C., Licona, J.C., Pariona, W. and Putz, F.E., 2012.
Soil effects on forest structure and diversity in a moist and a dry tropical
forest. Biotropica, 44(3), pp.276-283.
Petit, S., Waudby, H.P., Walker, A.T., Zanker, R. and Rau, G., 2012. A non-mutilating
method for marking small wild mammals and reptiles. Australian Journal of
Zoology, 60(1), pp.64-71.
Rathbun, G.B., 2009. Why is there discordant diversity in sengi (Mammalia: Afrotheria:
Macroscelidea) taxonomy and ecology?. African Journal of Ecology, 47(1), pp.1-
13.
Rautenbach, A., 2013. Patterns and processes of rodent and shrew assemblages in the
Savanna Biome of KwaZulu-Natal, South Africa (Master’s thesis, University of
KwaZulu-Natal).
Rautenbach, A., Dickerson, T. and Schoeman, M.C., 2014. Diversity of rodent and shrew
assemblages in different vegetation types of the savannah biome in South Africa:
no evidence for nested subsets or competition. African Journal of Ecology, 52(1),
pp.30-40.

79
Ream, C., 1981. The effects of fire and other disturbances on small mammals and their
predators. Ogden: Intermountain Forest and Range Experiment Station.
Rhodes, D. and Richmond, M., 1985. Influence of Soil Texture, Moisture and
Temperature on Nest-site Selection and Burrowing by the Pine Vole, Microtus
pinetorum. American Midland Naturalist, 113(1), p.102.
Ribble, D.O. and Perrin, M.R., 2005. Social organization of the eastern rock elephant-
shrew (Elephantulus myurus): the evidence for mate guarding. Belgian Journal of
Zoology, 135, p.167.
Rickel, B., 2004. Small Mammals, Reptiles, and. Assessment of Grassland Ecosystem
Conditions in the Southwestern United States: Wildlife and fish, 2, p.35.
Riginos, C. and Young, T.P., 2007. Positive and negative effects of grass, cattle, and
wild herbivores on Acacia saplings in an East African
savanna. Oecologia, 153(4), pp.985- 995.
Rodrigues, P.M.S., Schaefer, C.E.G.R., de Oliveira Silva, J., Ferreira Júnior, W.G., dos
Santos, R.M. and Neri, A.V., 2018. The influence of soil on vegetation structure
and plant diversity in different tropical savannic and forest habitats. Journal of
Plant Ecology, 11(2), pp.226-236.
Rosenzweig, M.L., 1995. Species diversity in space and time. Cambridge University
Press.

80
Rzebik-Kowalska, B. and Lungu, A., 2009. Insectivore mammals from the Late
Miocene of the Republic of Moldova. Acta Zoologica Cracoviensia-
SeriesA: Vertebrata, 52(1-2), pp.11- 60.
Saeed, M., (2010). Microhabitat Selection by Small Mammals. Advances in Biological
Research, 4(5): 283-287
Samuels, J.X. and Van Valkenburgh, B., 2008. Skeletal indicators of locomotor
adaptations in living and extinct rodents. Journal of morphology, 269(11),
pp.1387-1411.
Sanderson, M.A., Wedin, D. and Tracy, B., 2009. Grassland: Definition, origins, extent,
and future. Grassland Quietness and Strength for a New American
Agriculture, pp.55-74.
Santos-Filho, M.D., LÁZARI, P.R.D., Sousa, C.P.F.D. and Canale, G.R., 2015. Trap
efficiency evaluation for small mammals in the southern Amazon. Acta
Amazonica, 45(2), pp.187-194.
Schieltz, J.M. and Rubenstein, D.I., 2016. Evidence based review: positive versus
negative effects of livestock grazing on wildlife. What do we really
know? Environmental Research Letters, 11(11), p.113003.
Sebata, A., 2017. Ecology of Woody Plants in African Savanna Ecosystems. Plant
Ecology-Traditional Approaches to Recent Trends, pp.25-35.

81
Shannon, C.E. and Weaver, W., 1949. The Mathematical Theory of Communication, by
CE Shannon (and Recent Contributions to the Mathematical Theory of
Communication), W. Weaver. University of Illinois Press.
Shapiro, S.S. and Wilk, M.B., 1965. An analysis of variance test for normality (complete
samples). Biometrika, 52(3/4), pp.591-611.
Sheridan, H., Keogh, B., Anderson, A., Carnus, T., McMahon, B.J., Green, S. and
Purvis, G., 2017. Farmland habitat diversity in Ireland. Land Use Policy, 63,
pp.206-213.
Siemers, B.M., Schauermann, G., Turni, H. and von Merten, S., 2009. Why do shrews
twitter? Communication or simple echo-based orientation. Biology letters, 5(5),
pp.593-596.
Sikes, R.S. and Gannon, W.L., 2011. Guidelines of the American Society of
Mammalogists for the use of wild mammals in research. Journal of
mammalogy, 92(1), pp.235-253.
Silva, M., Hartling, L. and Opps, S.B., 2005. Small mammals in agricultural landscapes
of Prince Edward Island (Canada): effects of habitat characteristics at three
different spatial scales. Biological Conservation, 126(4), pp.556-568.
Simelane, F.N., Themb’alilahlwa, A.M., Shapiro, J.T., MacFadyen, D. and Monadjem,
A., 2018. Habitat associations of small mammals in the foothills of the
Drakensberg Mountains, South Africa. Mammalia, 82(2), pp.144-152.

82
Smit, H.A., 2008. Phylogeography of three Southern African endemic elephant-shrews
and a supermatrix approach to the Macroscelidea, (PHD, Stellenbosch
University).
Sinclair A. R. E., Fryxell J., Caughley G. (2005). 2nd ed. Wildlife ecology and
management. Blackwell Science.
Skinner, J.D. and Smithers, R.H.N., 1990. 2nd ed. The Mammals of the Southern African
sub region. Pretoria: University of Pretoria.
Skinner, J.D. and Chimimba, C.T., 2005. The mammals of the southern African sub-
region. Cambridge University Press.
Smit, H.A., Jansen van Vuuren, B., O'Brien, P.C.M., Ferguson‐Smith, M., Yang, F. and
Robinson, T.J., 2011. Phylogenetic relationships of elephant‐shrews
(Afrotheria, Macroscelididae). Journal of Zoology, 284(2), pp.133-143.
Smithers, R.H.N., 2011. The mammals of Botswana (Doctoral dissertation, University of
Pretoria).
Smithers, R.H., 2012. Smithers Mammals of Southern Africa. Penguin Random House
South Africa.
Sponchiado, J., Melo, G.L. and Cáceres, N.C., 2012. Habitat selection by small
mammals in Brazilian Pampas biome. Journal of Natural
History, 46(21-22), pp.1321-1335.
Stromgren, E.J., 2008. Improving livetrapping methods for shrews (Sorex spp.) (Doctoral
dissertation, University of British Columbia).

83
Stuart, C. & Stuart, T., 2007. Chris and Tilde Stuart's field guide to the mammals of
southern Africa.. Struik Nature, Cape Town. South Africa.
Sweet, J. & Burke, A., 2000. Country Pasture/Forage Resource Profiles.
URLhttp://www.fao.org/ag/agp/agpc/doc/counprof/namibia.htm#1.
(Accessed 23 August 2017).
Symes, C.T., Wilson, J.W., Woodborne, S.M., Shaikh, Z.S. and Scantlebury, M., 2013.
Resource partitioning of sympatric small mammals in an A frican forest‐
grassland vegetation mosaic. Austral Ecology, 38(6), pp.721-729.
Tasker, E.M. and Dickman, C.R., 2001. A review of Elliott trapping methods for small
mammals in Australia. Australian Mammalogy, 23(2), pp.77-87.
Tattersall, F.H., Macdonald, D.W., Hart, B.J., Manley, W.J. and Feber, R.E., 2001. Habitat
use by wood mice (Apodemus sylvaticus) in a changeable arable
landscape. Journal of Zoology, 255(4), pp.487-494.
Thibault, K.M., Tsau, K., Springer, Y. and Knapp, L., 2019. TOS Protocol and Procedure:
Small Mammal. National Ecological Observatory Network: Boulder, CO, USA.
Tobin, M.E., Michael, W. and Fall, M.W., 2004. “Pest control: rodents,” in U.S.
Department of Agriculture’s National Wildlife Research Center (Staff
Publication), 67, 1– 21. Available online at:
https://digitalcommons.unl.edu/cgi/viewcontent.cgi?article=1065&context=icwd
m_usdanwrc

84
Tores, M., Motro, Y., Motro, U. and Yom-Tov, Y., 2005. The Barn Owl-a selective
opportunist predator. Israel Journal of Ecology and Evolution, 51(4), pp.349
, 360.
Van Maltitz E.F., Kirsten F., Malebana P.S., Meyer A.N., Chimimba C.T., Bastos A.D.S.,
2006. Sustainable Rodent Control for Subsistence Farmers in South Africa.
Vietnam: Hanoi
Verde Arregoitia, L.D., Fisher, D.O. and Schweizer, M., 2017. Morphology captures diet
and locomotor types in rodents. Royal Society open science, 4(1), p.160957.
Vesey-Fitzgerald, D.F., 1966. The habits and habitats of small rodents in the Congo
River catchment region of Zambia and Tanzania. African Zoology, 2(1), pp.111-
122.
Vieira, E.M. and Paise, G., 2011. Temporal niche overlap among insectivorous small
mammals. Integrative zoology, 6(4), pp.375-386.
Waide, R.B., Willig, M.R., Steiner, C.F., Mittelbach, G., Gough, L., Dodson, S.I., Juday,
G.P. and Parmenter, R., 1999. The relationship between productivity and
species richness. Annual review of Ecology and Systematics, 30(1),
pp.257-300.
Werger, M.J.A., 1974. On concepts and techniques applied in the Ziirich-Montpellier
method of vegetation survey. Bothalia, 11(3), pp.309-323.
Wever, K.E., Geessink, F.J., Brouwer, M.A., Tillema, A. and Ritskes-Hoitinga, M., 2017.
A systematic review of discomfort due to toe or ear clipping in laboratory
rodents. Laboratory animals, 51(6), pp.583-600.

85
Willan, K. and Meester, J., 1989. Life-history styles of southern African Mastomys
natalensis, Otomys irroratus and Rhabdomys pumilio (Mammalia, Rodentia).
In Alternative life-history styles of animals (pp. 421-439). Springer, Dordrecht.
Wilson, D.E. and Reeder, D.M. 2005. Mammal species of the world: a taxonomic and
geographic reference. 3rd ed. Johns Hopkins University Press.
Wilson, D.E. and Reeder, D.M., 2011. Class Mammalia Linnaeus, 1758. In: Zhang,
Z.-Q. (Ed.) Animal biodiversity: An outline of higher-level classification and
survey of taxonomic richness. Zootaxa, 3148(1), pp.56-60.
Witmer, G., Moulton, R. and Swartz, J., 2012. Rodent Burrow Systems in North America
Problems Posed and Potential Solutions. Proceedings of the Vertebrate Pest
Conference, 25(2), pp.208-212.
Wolff, J.O., 2007. Social biology of rodents. Integrative Zoology, 2(4), pp.193-204.
Wolf, L.K., 2014. Small Mammal Diversity and Varying Habitat (Undergraduate, Texas
A&M University).
Yadok, B.G., Pech, R. and Chapman, H., 2019. Perception of predation risk by African
giant pouched rats (Cricetomys sp. nov) is higher in forest-edge
microhabitats. Behavioural processes, 168(2019), p.103953.
Yoshioka, P.M., 2008. Misidentification of the Bray-Curtis similarity index. Marine
Ecology Progress Series, 368, pp.309-310.

86
APPENDICES
Appendix 1: Research permission letter