the economic forces driving fintech adoption across countries
TRANSCRIPT

No. 663 / January 2020
The Economic Forces Driving FinTech Adoption across Countries
Jon Frost
De Nederlandsche Bank NV
P.O. Box 98
1000 AB AMSTERDAM
The Netherlands
Working Paper No. 663
January 2020
Economic Forces Driving FinTech Adoption
Jon Frost*
* Views expressed are those of the authors and do not necessarily reflect official positions
of De Nederlandsche Bank.
The Economic Forces Driving
FinTech Adoption across Countries
By Jon Frost1
January 2020
FinTech is being adopted across markets worldwide – but not evenly. Why not? This paper reviews
the evidence. In some economies, especially in the developing world, adoption is being driven by an
unmet demand for financial services. FinTech promises to deliver greater financial inclusion. In other
economies, adoption can be related to the high cost of finance, a supportive regulatory environment,
and other macroeconomic factors. Finally, demographics play an important role, as younger cohorts
are more likely to trust and adopt FinTech services. Where FinTech helps to make the financial
system more inclusive and efficient, this could benefit economic growth. Yet the market failures
traditionally present in finance remain relevant, and may arise in new guises.
Keywords: FinTech, digital innovation, financial inclusion, financial regulation
JEL classification codes: E51, G23, O33.
1 Senior Economist, Innovation and the Digital Economy unit, Bank for International Settlements (BIS); [email protected]; Senior Economist, Financial Stability Division, De Nederlandsche Bank (DNB); Research Affiliate, Cambridge Centre for Alternative Finance.
This paper will appear in the book The Technological Revolution in Banking, edited by Michael King (University of Victoria) and Richard Nesbitt (University of Toronto) for the University of Toronto Press, in 2020.
The views expressed here are those of the author and do not necessarily reflect those of the BIS or DNB. All errors are my own. I would like to thank Michael King, Richard Nesbitt, Leonardo Gambacorta, Mia Gray, Raghu Rau, Jesse McWaters and Bryan Zhang for comments, and Raghu Rau, Tania Ziegler, Thomas Philippon and Guillaume Bazot for sharing data from their research. I thank Giulio Cornelli for support with data and figures.
The Curious Geography of FinTech Adoption
In the past few years, financial technologies (FinTech) have emerged in every major region
of the world – in both advanced economies and emerging market and developing
economies (EMDEs).2 But the rate of FinTech adoption differs considerably. Adoption is
used here to refer to the widespread use of a new application, product or process. While
FinTech activities are generally small compared to the overall financial system, there are
some economies where FinTech is growing to an economically important scale. And while
FinTech is a niche activity confined to certain business lines in some countries, in others it
is moving into the mainstream of financial services. This pattern of FinTech adoption is
puzzling, as it does not reflect either economic development or political boundaries. This
paper addresses the question: what explains the wider adoption of FinTech innovations in
some economies and markets, but not in others?
Cross-country evidence on FinTech adoption is patchy, but the data available are
improving. They show that in payments, new FinTech providers have established a strong
foothold in mobile payments, especially for retail customers. As one category of FinTech,
“TechFin” or “BigTech” players are increasingly important as payments providers in some
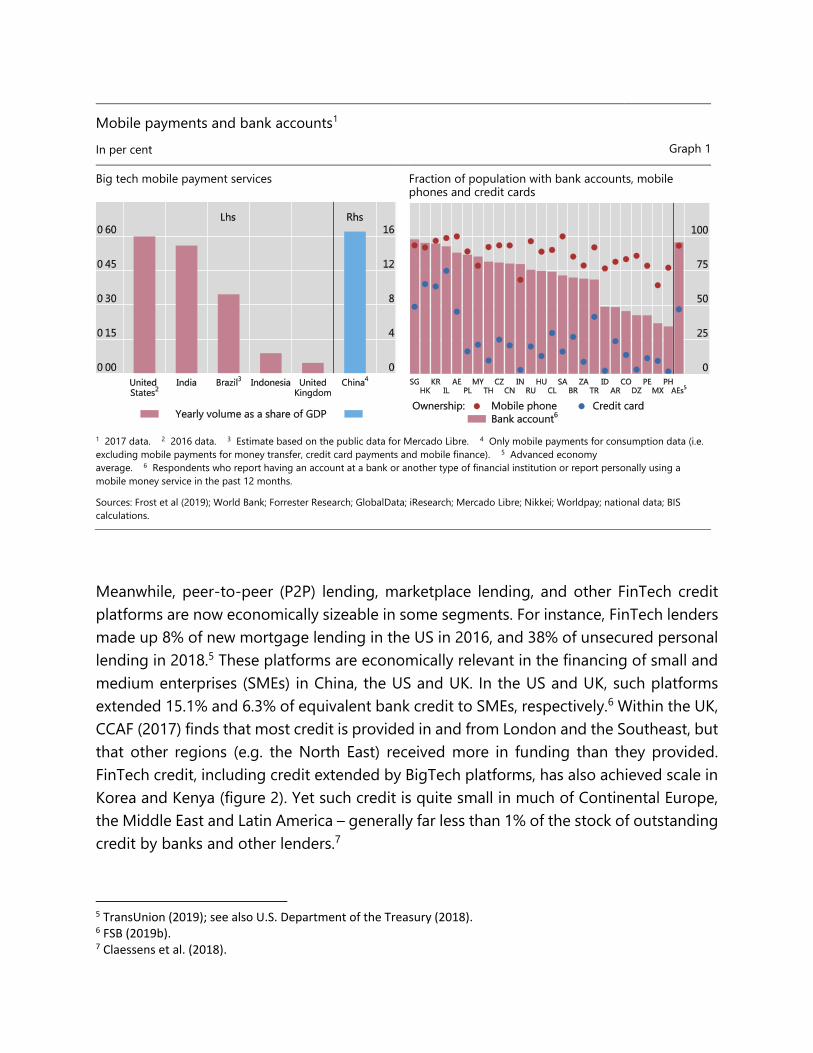
countries, but not in others. For instance, BigTech mobile payments make up 16% of GDP
in China, but less than 1% in the United States, India and Brazil (figure 1, left panel).3
Especially in EMDEs, mobile payments are benefiting from the high share of consumers
with mobile phones, which often exceeds those with bank accounts or credit cards (figure
1, right panel). In many African countries, but also in Chile, Bangladesh and Iran, over 20%
of the population now has a mobile money account.4
2 FSB (2017) defines FinTech as technology-enabled innovation in financial services that could result in new business models, applications, processes or products with an associated material effect on the provision of financial services. Notably, this can include innovation by new firms, existing technology firms, and incumbent financial institutions. 3 Frost et al. (2019); BIS (2019). 4 World Bank (2018).
Meanwhile, peer-to-peer (P2P) lending, marketplace lending, and other FinTech credit
platforms are now economically sizeable in some segments. For instance, FinTech lenders
made up 8% of new mortgage lending in the US in 2016, and 38% of unsecured personal
lending in 2018.5 These platforms are economically relevant in the financing of small and
medium enterprises (SMEs) in China, the US and UK. In the US and UK, such platforms
extended 15.1% and 6.3% of equivalent bank credit to SMEs, respectively.6 Within the UK,
CCAF (2017) finds that most credit is provided in and from London and the Southeast, but
that other regions (e.g. the North East) received more in funding than they provided.
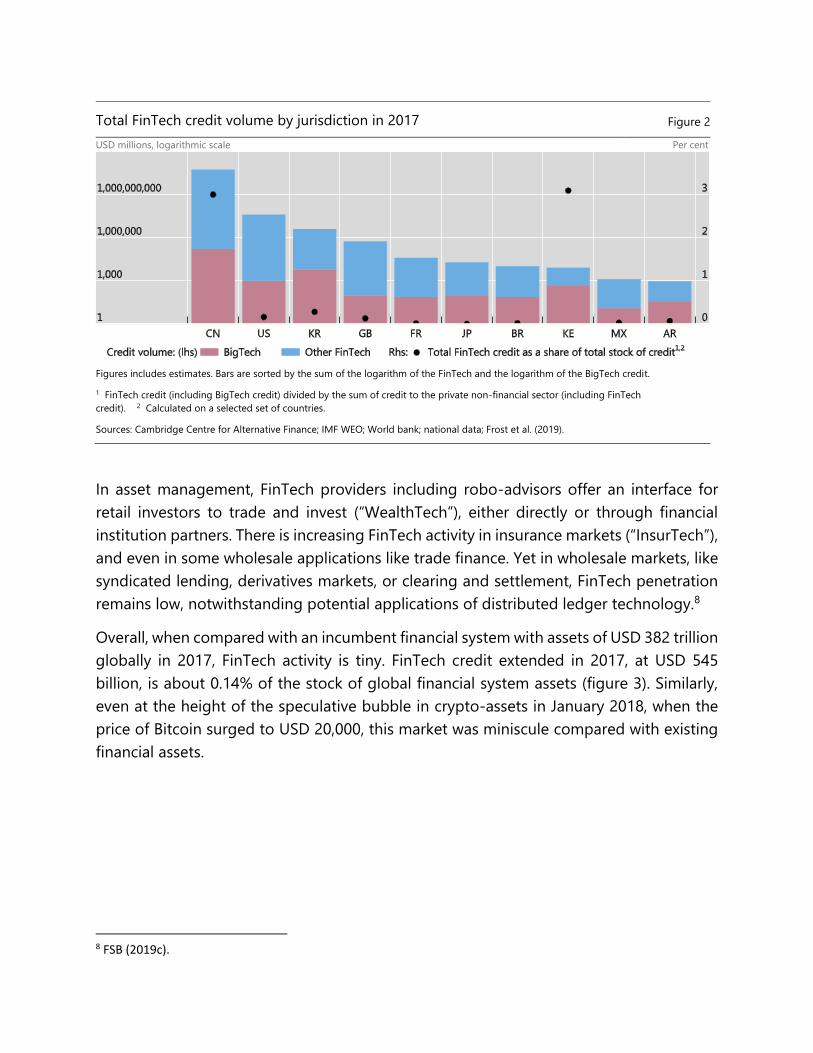
FinTech credit, including credit extended by BigTech platforms, has also achieved scale in
Korea and Kenya (figure 2). Yet such credit is quite small in much of Continental Europe,
the Middle East and Latin America – generally far less than 1% of the stock of outstanding
credit by banks and other lenders.7
5 TransUnion (2019); see also U.S. Department of the Treasury (2018). 6 FSB (2019b). 7 Claessens et al. (2018).
Mobile payments and bank accounts1
In per cent Graph 1
Big tech mobile payment services Fraction of population with bank accounts, mobile phones and credit cards
1 2017 data. 2 2016 data. 3 Estimate based on the public data for Mercado Libre. 4 Only mobile payments for consumption data (i.e.
excluding mobile payments for money transfer, credit card payments and mobile finance). 5 Advanced economy
average. 6 Respondents who report having an account at a bank or another type of financial institution or report personally using a
mobile money service in the past 12 months.
Sources: Frost et al (2019); World Bank; Forrester Research; GlobalData; iResearch; Mercado Libre; Nikkei; Worldpay; national data; BIS
calculations.
In asset management, FinTech providers including robo-advisors offer an interface for
retail investors to trade and invest (“WealthTech”), either directly or through financial
institution partners. There is increasing FinTech activity in insurance markets (“InsurTech”),
and even in some wholesale applications like trade finance. Yet in wholesale markets, like
syndicated lending, derivatives markets, or clearing and settlement, FinTech penetration
remains low, notwithstanding potential applications of distributed ledger technology.8
Overall, when compared with an incumbent financial system with assets of USD 382 trillion
globally in 2017, FinTech activity is tiny. FinTech credit extended in 2017, at USD 545
billion, is about 0.14% of the stock of global financial system assets (figure 3). Similarly,
even at the height of the speculative bubble in crypto-assets in January 2018, when the
price of Bitcoin surged to USD 20,000, this market was miniscule compared with existing
financial assets.
8 FSB (2019c).
Total FinTech credit volume by jurisdiction in 2017 Figure 2
USD millions, logarithmic scale Per cent
Figures includes estimates. Bars are sorted by the sum of the logarithm of the FinTech and the logarithm of the BigTech credit.
1 FinTech credit (including BigTech credit) divided by the sum of credit to the private non-financial sector (including FinTech
credit). 2 Calculated on a selected set of countries.
Sources: Cambridge Centre for Alternative Finance; IMF WEO; World bank; national data; Frost et al. (2019).
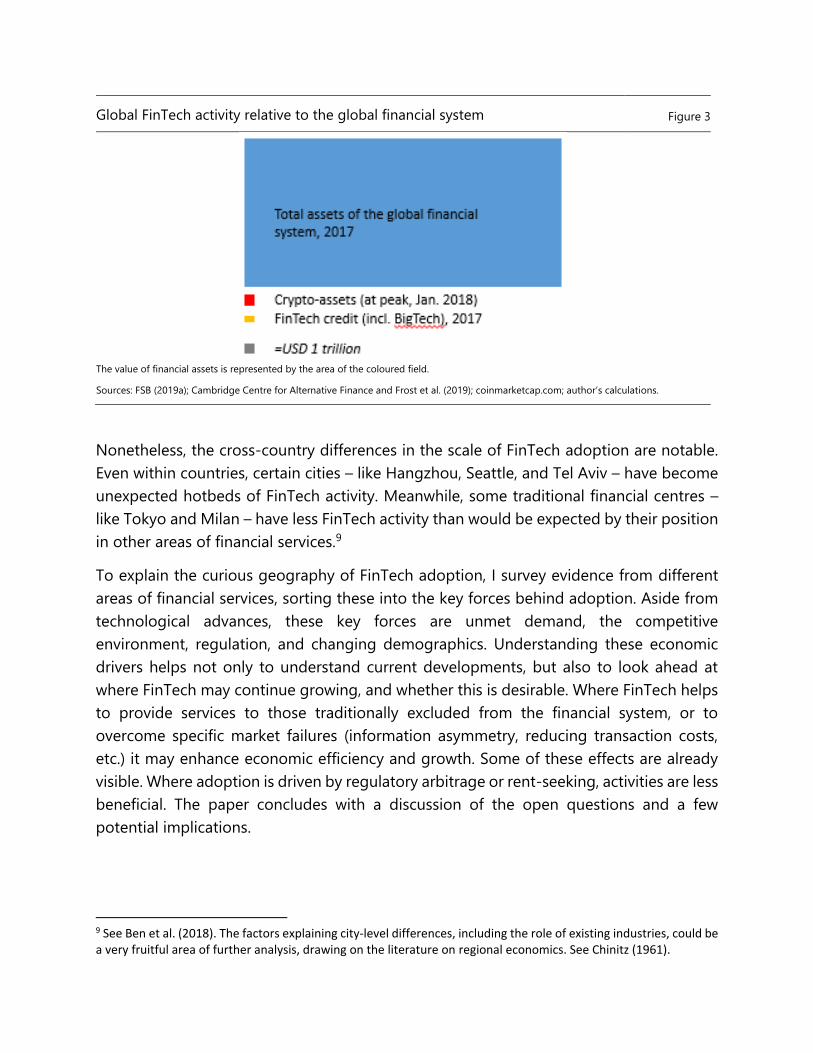
Global FinTech activity relative to the global financial system Figure 3
The value of financial assets is represented by the area of the coloured field.
Sources: FSB (2019a); Cambridge Centre for Alternative Finance and Frost et al. (2019); coinmarketcap.com; author’s calculations.
Nonetheless, the cross-country differences in the scale of FinTech adoption are notable.
Even within countries, certain cities – like Hangzhou, Seattle, and Tel Aviv – have become
unexpected hotbeds of FinTech activity. Meanwhile, some traditional financial centres –
like Tokyo and Milan – have less FinTech activity than would be expected by their position
in other areas of financial services.9
To explain the curious geography of FinTech adoption, I survey evidence from different
areas of financial services, sorting these into the key forces behind adoption. Aside from
technological advances, these key forces are unmet demand, the competitive
environment, regulation, and changing demographics. Understanding these economic
drivers helps not only to understand current developments, but also to look ahead at
where FinTech may continue growing, and whether this is desirable. Where FinTech helps
to provide services to those traditionally excluded from the financial system, or to
overcome specific market failures (information asymmetry, reducing transaction costs,
etc.) it may enhance economic efficiency and growth. Some of these effects are already
visible. Where adoption is driven by regulatory arbitrage or rent-seeking, activities are less
beneficial. The paper concludes with a discussion of the open questions and a few
potential implications.
9 See Ben et al. (2018). The factors explaining city-level differences, including the role of existing industries, could be a very fruitful area of further analysis, drawing on the literature on regional economics. See Chinitz (1961).
Widening the Tent: FinTech for Financial Inclusion
Around the world, around 1.7 billion adults lack access to a bank account.10 Especially in
EMDEs, many households rely primarily on cash for day-to-day transactions, and this is
closely linked with the large size of unregistered economic transactions (“the informal
economy”; see Hart, 1973). Among those with a bank account, services like credit,
insurance and wealth management may not be accessible at all – or not at an affordable
price for consumers. Even in advanced economies, certain groups lack access to basic
financial services, including ethnic and religious minorities, migrant workers, and refugees.
In a number of cases, there is evidence that unmet demand has been a driver of FinTech
adoption, and this adoption has helped to expand the reach of financial services. Perhaps
the most famous example is M-Pesa, the mobile money transfer system introduced by
Kenya’s telecom provider Safaricom in 2008. M-Pesa now operates in multiple countries
across East Africa, North Africa and South Asia, and counts 32 million users. Unmet
demand for basic banking, means of payment, and money transfer services is likely the
key factor behind the rapid growth of mobile payments offerings in countries like India,
Southeast Asia and Latin America.11
Various studies provide evidence that unmet demand is also a driver for FinTech credit. In
China, Hau et al. (2018) show that FinTech credit mitigates supply frictions (such as a large
geographic distance between borrowers and the nearest bank branch), and allows firms
with a lower credit score to access credit. In the United States, Tang (2019) finds that
FinTech credit complements bank lending for small-scale loans. Jagtiani and Lemieux
(2018) find that Lending Club has penetrated areas that are underserved by traditional
banks. In Germany, De Roure et al. (2016) find that FinTech credit serves a slice of the
consumer credit market neglected by German banks. In Argentina, Frost et al. (2019) show
that 35% of the small borrowers from Mercado Libre, a BigTech e-commerce platform,
would not be eligible for bank credit based on their credit bureau score. Looking across
countries, these authors find that BigTech credit is more prevalent when there is a low
density of bank branches relative to the population.
Another example of this trend is in remittances services. As anyone who has lived abroad
will attest, cross-border transfers of cash are often slow and expensive, and this problem
is even more acute for money sent by workers to their families in EMDEs – often in small
amounts, and to geographically remote locations. The World Bank finds that the average
10 World Bank (2018). 11 Ibid. At the same time, cash use remains quite high in economies around the world. See Bech et al. (2018).
cost to send USD 200 to EMDEs is 6.84%, or USD 13.68.12 The decline in correspondent
banking relationships in recent years has heightened these concerns, as this raises the
costs to send money to certain jurisdictions, particularly EMDEs.13 Not surprisingly,
remittances (and cross-border payments more generally) are one area where FinTech
providers have gained a relatively stronger foothold.
Overall, the evidence suggests FinTech is growing where the current financial system is
not meeting demand for financial services. In many cases, FinTech innovations may
require a higher upfront investment, but a lower cost per new customer relationship.14
While FinTech activities are still larger in absolute terms in richer countries, this may be a
factor behind their higher relative importance in some EMDEs, as a share of economic
activity.
The World Outside: Macroeconomics and the Cost of Finance
FinTech adoption has been greater in countries where financial services are relatively more
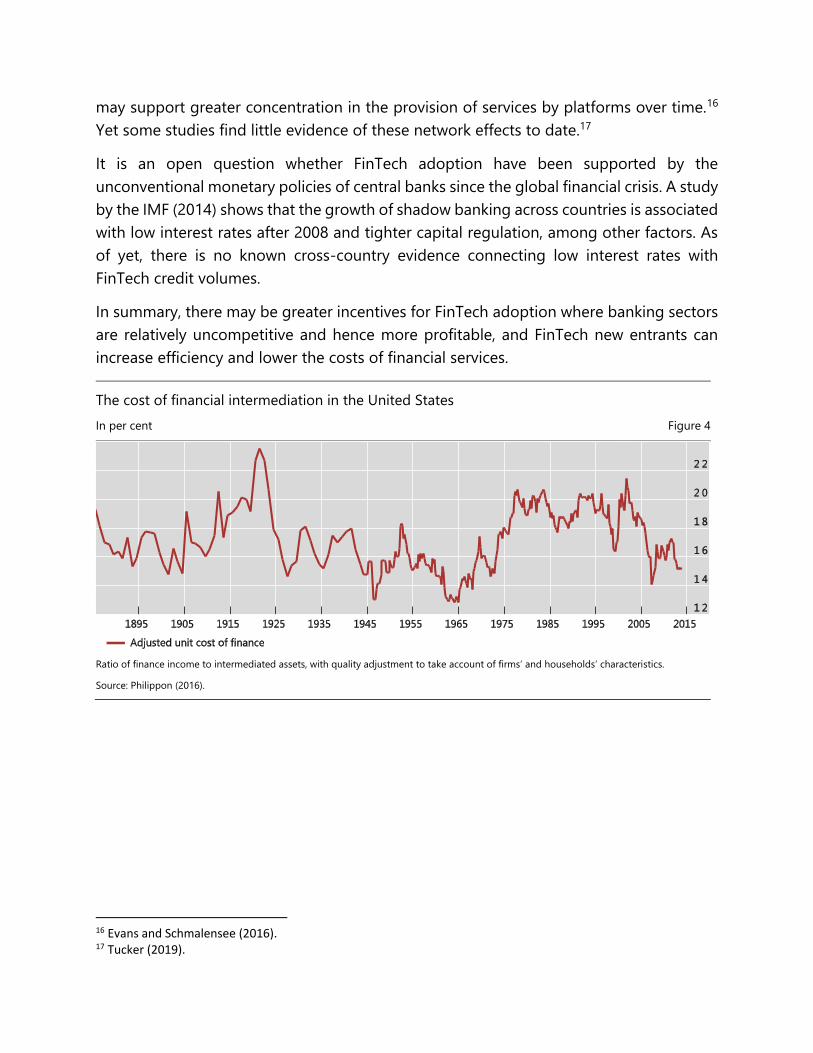
expensive, or there is less competition among providers. Philippon (2016) discusses the
relatively high and stable “unit cost” of finance in the United States over time, and the
potential of FinTech to provide greater efficiency. Financial services have been quite
expensive throughout the past decades – despite the advent of computers, electronic
trading in financial markets, and other innovations. Since 2002, we are seeing that the
costs have started to decline (figure 4). Recent survey evidence suggests that competition
from FinTech and BigTech companies are leading incumbents to introduce new
products.15 Whether and how this competition will influence the aggregate figures on the
cost of finance is an open question.
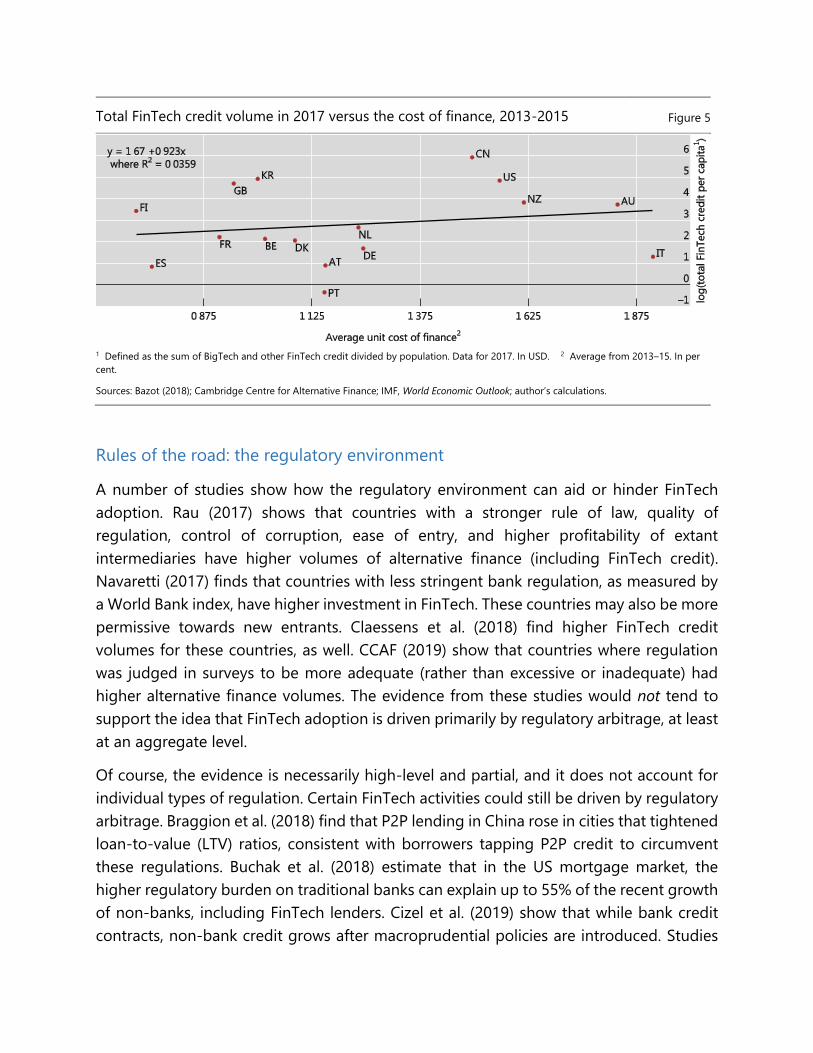
Cross-country data from Bazot (2018) show that financial services are stubbornly
expensive in a number of economies, though they have converged and declined since the
1970s and 1980s. In the most recent available year, FinTech credit seems to be more
prevalent in those economies with a higher cost of finance (figure 5). Claessens et al.
(2018) find FinTech credit to be higher in countries with a higher average income
(reflecting economic development), and where the banking sector is less competitive, as
measured by higher market power or mark-ups. In a number of cases, network effects
12 World Bank (2019). 13 FSB (2019d). 14 Philippon (2016). 15 Petralia et al. (2019). Similarly, FCA (2019) notes that there are number of examples where a new market entrant has received support in the regulatory sandbox, and incumbent financial institutions have subsequently launched a similar product. While they cannot determine causality, they note this being a positive indicator of the effectiveness of the regulatory approach.
may support greater concentration in the provision of services by platforms over time.16
Yet some studies find little evidence of these network effects to date.17
It is an open question whether FinTech adoption have been supported by the
unconventional monetary policies of central banks since the global financial crisis. A study
by the IMF (2014) shows that the growth of shadow banking across countries is associated
with low interest rates after 2008 and tighter capital regulation, among other factors. As
of yet, there is no known cross-country evidence connecting low interest rates with
FinTech credit volumes.
In summary, there may be greater incentives for FinTech adoption where banking sectors
are relatively uncompetitive and hence more profitable, and FinTech new entrants can
increase efficiency and lower the costs of financial services.
Hyperlink BIS
The cost of financial intermediation in the United States
In per cent Figure 4
Ratio of finance income to intermediated assets, with quality adjustment to take account of firms’ and households’ characteristics.
Source: Philippon (2016).
16 Evans and Schmalensee (2016). 17 Tucker (2019).
Hyperlink BIS
Total FinTech credit volume in 2017 versus the cost of finance, 2013-2015 Figure 5
1 Defined as the sum of BigTech and other FinTech credit divided by population. Data for 2017. In USD. 2 Average from 2013–15. In per
cent.
Sources: Bazot (2018); Cambridge Centre for Alternative Finance; IMF, World Economic Outlook; author’s calculations.
Rules of the road: the regulatory environment
A number of studies show how the regulatory environment can aid or hinder FinTech
adoption. Rau (2017) shows that countries with a stronger rule of law, quality of
regulation, control of corruption, ease of entry, and higher profitability of extant
intermediaries have higher volumes of alternative finance (including FinTech credit).
Navaretti (2017) finds that countries with less stringent bank regulation, as measured by
a World Bank index, have higher investment in FinTech. These countries may also be more
permissive towards new entrants. Claessens et al. (2018) find higher FinTech credit
volumes for these countries, as well. CCAF (2019) show that countries where regulation
was judged in surveys to be more adequate (rather than excessive or inadequate) had
higher alternative finance volumes. The evidence from these studies would not tend to
support the idea that FinTech adoption is driven primarily by regulatory arbitrage, at least
at an aggregate level.
Of course, the evidence is necessarily high-level and partial, and it does not account for
individual types of regulation. Certain FinTech activities could still be driven by regulatory
arbitrage. Braggion et al. (2018) find that P2P lending in China rose in cities that tightened
loan-to-value (LTV) ratios, consistent with borrowers tapping P2P credit to circumvent
these regulations. Buchak et al. (2018) estimate that in the US mortgage market, the
higher regulatory burden on traditional banks can explain up to 55% of the recent growth
of non-banks, including FinTech lenders. Cizel et al. (2019) show that while bank credit
contracts, non-bank credit grows after macroprudential policies are introduced. Studies
by Reinhardt and Sowerbutts (2015) and Duijm et al. (2019) show that foreign banks and
insurers, respectively, expand lending in countries where regulations constrain domestic
bank lending. While these results are suggestive, more conclusive evidence will have to
wait until researchers have an adequate panel of FinTech credit volumes across countries
and over time.
A Child of Its Times: Demographic Forces and Trust
At a workshop with senior public sector officials in 2017, a FinTech company executive
remarked that “FinTech, like millennials, has been shaped by two major factors:
technology, and the global financial crisis”. This executive is certainly not the only observer
to have noticed these parallels.18 Indeed, the “genesis block” of the Bitcoin blockchain, i.e.
the initial piece of code underlying Bitcoin, references the bailouts of banks by the British
government in 2009. A neater confluence of technology and the global financial crisis
would be hard to come up with. It is perhaps no surprise that millennials, or “digital
natives”, are also avid users of FinTech.19
A survey from EY (2017) confirms that especially younger cohorts are driving adoption of
FinTech applications in a range of jurisdictions. Indeed, in a global sample of digitally-
active users, FinTech usage is 48% among those aged 25 to 34 years, compared with only
9% for those 75 years and above. FinTech use is also higher in countries with a younger
population, such as India, South Africa and Colombia.20 Conversely, Bech et al. (2018) find
that the use of cash is more common in countries with older populations.
Trust in technology by different age cohorts may be a key factor. Bain & Company and
Research Now (2017) find in a survey that 91% of Indian respondents, 86% of Chinese
respondents, and 60% of US respondents would consider financial products from
technology firms they already use, and that this interest is even higher among younger
consumers (ages 18-34). In the past year or two, trust in technology firms may have
declined due to some high-profile data breaches and scandals (“techlash”).21 Similarly,
business practices by FinTech firms that are damaging to consumer welfare could in the
18 See also Kolodny (2016). 19 “Millennials” are generally defined as the generational cohort born between the early 1980s and late 1990s, following “Generation X” (born between the mid 1960s and early 1980s) and the “baby boomers” (born between the 1940s and 1960s). “Digital natives” refers to those consumers who grew up with digital technologies. See CGFS and FSB (2017). 20 EY (2019). 21 See Nair (2019).
future undermine trust in these providers.22 Comprehensive data on the impact of these
types of incidents on trust in technology or FinTech are not available.
There may be important exceptions to the trend of greater adoption by the younger
generation. For instance, US credit bureau data show that a majority of online marketplace
borrowers were actually from older cohorts (”Generation X” and ”baby boomers”).
Similarly, Baeck et al. (2014) find that over 55% of the lenders for UK business and
consumer lending were over 55, while over 60% of those receiving funding were in the
age bracket 35-54. Finally, CB Insights (2019) discusses FinTech firms focusing specifically
for seniors, such as in personal financial management, estate planning and home sharing.
Especially in countries with an ageing population, there may yet be further innovations
targeting an older demographic.
Implications: Financial Inclusion, Competition and Risk
While technological advances such as smartphones, cloud computing, and big data
analytics are present in many economies around the world, greater adoption of these
technological innovations in financial services is concentrated in markets with several
common characteristics.
First, where FinTech helps to enhance financial inclusion, e.g. for basic payments services
in EMDEs, this is likely to be positive for economic growth and development. There is a
large literature on the link between finance and economic growth.23 There is also cross-
country evidence that most indicators of financial inclusion are associated with higher
growth.24 Credit services are the only area where the picture may be more mixed. FinTech
credit in particular may help to expand access to finance for SMEs. But if it results in
excessive lending or overly high debt burdens for certain (groups of) borrowers, this could
be more problematic.25
Second, FinTech activity could increase cross-border competition in financial services over
time. While many FinTech firms start by focusing on one economy, there have been a
number of examples of cross-border expansion, and of the imitation of successful FinTech
business models in different markets. Such cross-border financial integration could
support greater diversification and risk-sharing across economies. It could also help to
reverse some of the decline in cross-border financial activity seen since the global financial
22 For a discussion of consumer protection risks, see Saunders (2019). As she notes, “companies can also be innovative in how they increase their profits, deceive or abuse consumers, or avoid consumer protections” (p. 21). 23 For an overview, see Levine (2005). 24 Sahay et al. (2015). 25 CGFS and FSB (2017).
crisis. Given differences in regulation across different markets and the potential for
regulatory arbitrage, it is crucial that this cross-border expansion is accompanied by
adequate cooperation between global regulators.
Third, while FinTech innovations can sometimes overcome specific market failures (e.g. by
reducing information asymmetries, transaction costs, etc.) FinTech activities will remain
subject to the same well-known risks traditionally present in finance. For instance, deposit-
like activities remain subject to liquidity mismatch and the potential for bank runs, even
when they are offered by non-banks. New financial assets can still be subject to
speculative bubbles, as was the case with Bitcoin in 2017-8.26 If specific FinTech or BigTech
firms achieve a large enough scale, there is the potential for them to become systemically
important (“too-big-to-fail”), resulting in moral hazard and excessive risk taking.27 Finally,
new forms of interconnectedness, including operational dependencies (such as reliance
on third-party services such as cloud computing) could transmit market shocks across
institutions and markets. Managing these risks will remain the remit of public sector
authorities. Supervisors must continue to adapt regulatory frameworks and crisis
management tools accordingly.
Quite a bit of work still needs to be done to assess these findings. In particular, the quality
of data across different economies, while improving, is still not sufficient to draw hard
conclusions in many cases. More data are needed to test causality between economic
drivers and FinTech adoption.
Conclusion
FinTech activity is driven by a range of demand-side and supply-side factors. The available
evidence shows that unmet demand (i.e. financial inclusion) is a strong driver in EMDEs
and in underserved market segments. The high cost of finance, and high banking sector
mark-ups, are also important. Regulatory factors can play a role, but in general, regulatory
arbitrage does not seem to be a primary driver of FinTech adoption to date, at least at an
aggregate level. But there may be specific activities for which regulatory arbitrage is a
factor. Finally, younger cohorts may be driving adoption in many economies, but not
universally. Population ageing and changes in trust in technology and FinTech may have
important effects, shaping not just the extent but the future direction of FinTech adoption.
Tentatively, the available evidence supports the idea that FinTech adoption – where it
enhances financial inclusion – may support economic growth in some jurisdictions,
26 On the history of financial crises and asset and credit bubbles, see Kindleberger and Aliber (2011). 27 FSB (2017) notes that as a result of FinTech innovations, “systemic importance and procyclicality could emerge from a number of sources, including from greater concentration in some market segments”.
particularly EMDEs. It may also enhance cross-border financial integration. Yet FinTech
activities will remain subject to the same well-known market failures present in other areas
of finance, including information asymmetries and adverse selection in lending; liquidity
mismatches with deposits; systemic importance and moral hazard with large
intermediaries; and various forms of interconnectedness in the financial system. As such,
there is the same need for public policy intervention in the form of adequate and
proportionate regulation and supervision.
Bibliography
Bank for International Settlements, 2019, “Big tech in finance: opportunities and risks”, BIS Annual
Economic Report, 23 June.
Baeck, Peter, Liam Collins and Bryan Zhang, 2014, “Understanding Alternative Finance: The UK
Alternative Finance Report 2014”, University of Cambridge and Nesta, November.
Bazot, Guillaume, 2018, “Financial intermediation cost, rents, and productivity: An international
comparison”, Working Papers 0141, European Historical Economics Society (EHES).
Bech, Morten, Umar Faruqui, Frederik Ougaard and Cristina Picillo, 2018, “Payments are a-changin'
but cash still rules”, March.
Ben Shenglin, Lv Jiamin, Qian Xiaoxia, Hu Kang, Luo Dan, Xu Zeyu, Zhang Peiwei, Sheng Qingqing,
Zheng Ying, Zhou Hao, Zhang Zeye, Xu Huichan, Gu Yue, Xia Ying, Cai Kaixing, Jiang Nan, Eva
Huang, Hao Rui, Bryan Zhang, Robert Wardrop, Nan Qian and Yang Liyuan, 2018, “2018 Global
FinTech Hub Report”, Cambridge Centre for Alternative Finance and Zhejiang University Academy
of Internet Finance.
Braggion, Fabio, Alberto Manconi and Haikun Zhu, 2018, “Can technology undermine
macroprudential regulation? Evidence from peer-to-peer credit in China”, January.
Buchak, Greg, Gregor Matvos, Tomasz Piskorski and Amit Seru, 2017, “FinTech, regulatory
arbitrage, and the rise of shadow banks”, NBER Working Papers, no 23288, March.
Cambridge Centre for Alternative Finance, 2017, “Entrenching Innovation: The 4th UK Alternative
Finance Industry Report”, December.
Cambridge Centre for Alternative Finance, 2019, “Shifting Paradigms: The 4th European
Alternative Finance Benchmarking Report”, April.
CB Insights, 2018, “20+ Fintech Startups Focused On Seniors”, December.
Chinitz, B., 1961, “Contrasts in agglomeration: New York and Pittsburgh”, The American Economic
Review 51(2): 279-289.
Claessens, Stijn, Jon Frost, Grant Turner and Feng Zhu, 2018, “FinTech credit markets around the
world: size, drivers and policy issues”, BIS Quarterly Review, September.
Committee on the Global Financial System (CGFS) and Financial Stability Board (FSB) (2017),
“FinTech Credit: Market Structure, Business Models and Financial Stability Implications”, May.
Duijm, Patty, Jon Frost, Jakob de Haan, Clemens Bonner and Leo de Haan, 2019, “International
Lending of Dutch Insurers and Pension Funds: The Impact of ECB Monetary Policy and Prudential
Policies in the Host Country”, Open Economies Review 30(3): 445-456, July.
Evans, David S. and Richard Schmalensee, 2016, Matchmakers – The New Economics of Multisided
Platforms, Cambridge, MA: Harvard Business Review Press.
EY, 2017, “Global FinTech Adoption Index 2017”, June.
EY, 2019, “Global FinTech Adoption Index 2019”, June.
Financial Conduct Authority, 2019, “The Impact and Effectiveness of Innovate”, April.
Financial Stability Board, 2017, “Financial Stability Implications from FinTech: Regulatory and
Supervisory Issues that Merit Authorities’ Attention”, May.
Financial Stability Board, 2019a, “Global Monitoring Report on Non-Bank Financial Intermediation
2018”, February.
Financial Stability Board, 2019b, “Evaluation of the effects of financial regulatory reforms on small
and medium-sized enterprise (SME) financing: Consultation report”, June.
Financial Stability Board, 2019c, “Decentralised financial technologies: Report on financial stability,
regulatory and governance implications”, June.
Financial Stability Board, 2019d, “FSB action plan to assess and address the decline in
correspondent banking: Progress report”, May.
Frost, Jon, Leonardo Gambacorta, Yi Huang, Hyun Shin, and Pablo Zbinden, 2019, “BigTech and
the changing structure of financial intermediation”, Economic Policy, forthcoming.
Hart, Keith, 1973, “Informal Income Opportunities and Urban Employment in Ghana”, The Journal
of Modern African Studies 11(1): 61-89.
Hau, Harald, Yi Huang, Hongzhe Shan and Zixia Sheng (2018), “Fintech credit, financial inclusion
and entrepreneurial growth”, working paper.
Kindleberger, Charles, and Robert Aliber (2011), Manias, Panics and Crashes: A History of Financial
Crises (sixth edition), New York: Palgrave Macmillan.
Kolodny, Lauren, 2016, “Coming of Age in the Great Recession: A Millennial Financial Perspective”,
CBInsights Research Brief, July.
Levine, Ross, 2005, “Finance and Growth: Theory and Evidence”, in: Philippe Aghion & Steven Durlauf (eds.),
Handbook of Economic Growth, edition 1, volume 1, ch. 12: 865-934.
Nair, Sanjay, 2019, “Trust in Tech is Wavering and Companies Must Act”, Edelman Research, April.
Navaretti, G., G. Calzolari, and A. Pozzolo, 2017, “FinTech and Banks: Friends or Foes?”, European
Economy: Banks, Regulation, and the Real Sector, December.
Petralia, Kathryn, Thomas Philippon, Tara Rice and Nicolas Veron, 2019, “Banking Disrupted?
Financial Intermediation in an Era of Transformational Technology”, Geneva Reports on the World
Economy 22, ICMB and CEPR.
Philippon, Thomas, 2016, “The FinTech Opportunity,” NBER Working Paper No. 22476, August.
Rau, P. Raghavendra, 2018, “Law, Trust, and the Development of Crowdfunding”, August.
Reinhardt, Dennis and Rhiannon Sowerbutts, 2015, “Regulatory Arbitrage in Action: Evidence from
Banking Flows and Macroprudential Policy”, Bank of England Working Paper No. 546, September.
Sahay, R, M Čihák, P N’Diaye, A Barajas, S Mitra, A Kyobe, Y Mooi and S Yousefi, 2015, “Financial
inclusion: can it meet multiple macroeconomic goals?”, IMF Staff Discussion Note 15/17.
Saunders, Lauren, 2019, “FinTech and Consumer Protection: A Snapshot”, National Consumer Law
Center, March.
TransUnion, 2019, “FinTechs Continue to Drive Personal Loan Growth”, press release, 21 February.
Tucker, Catherine, 2019, “Digital Data, Platforms and the Usual [Antitrust] Suspects: Network
Effects, Switching Costs, Essential Facility”, Review of Industrial Organization 54(4): 683–694.
U.S. Department of the Treasury, 2018, “A Financial System That Creates Economic Opportunities:
Nonbank Financials, Fintech, and Innovation”, Report to President Donald J. Trump, July.
World Bank, 2018, “The Global Findex Database 2017”, April.
World Bank, 2019, “Remittance prices worldwide”, June.

Previous DNB Working Papers in 2020 No. 662 Carin van der Cruijsen-Knoben, Jakob de Haan and Ria Roerink, Financial knowledge and trust in financial institutions

De Nederlandsche Bank N.V.
Postbus 98, 1000 AB Amsterdam
020 524 91 11
dnb.nl