fintech adoption index client presentation · page 9 ey fintech adoption index imperative #1:...
TRANSCRIPT
EY FinTech adoption index
Key findings
Page 1 EY FinTech adoption index
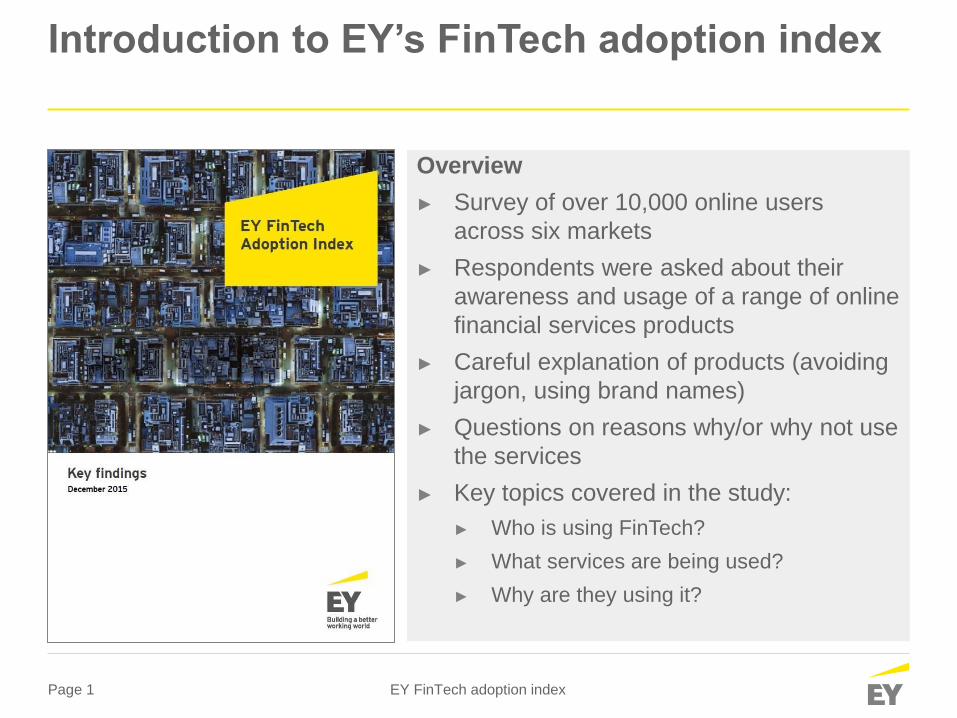
Introduction to EY’s FinTech adoption index
Overview
► Survey of over 10,000 online users
across six markets
► Respondents were asked about their
awareness and usage of a range of online
financial services products
► Careful explanation of products (avoiding
jargon, using brand names)
► Questions on reasons why/or why not use
the services
► Key topics covered in the study:
► Who is using FinTech?
► What services are being used?
► Why are they using it?
Page 2 EY FinTech adoption index
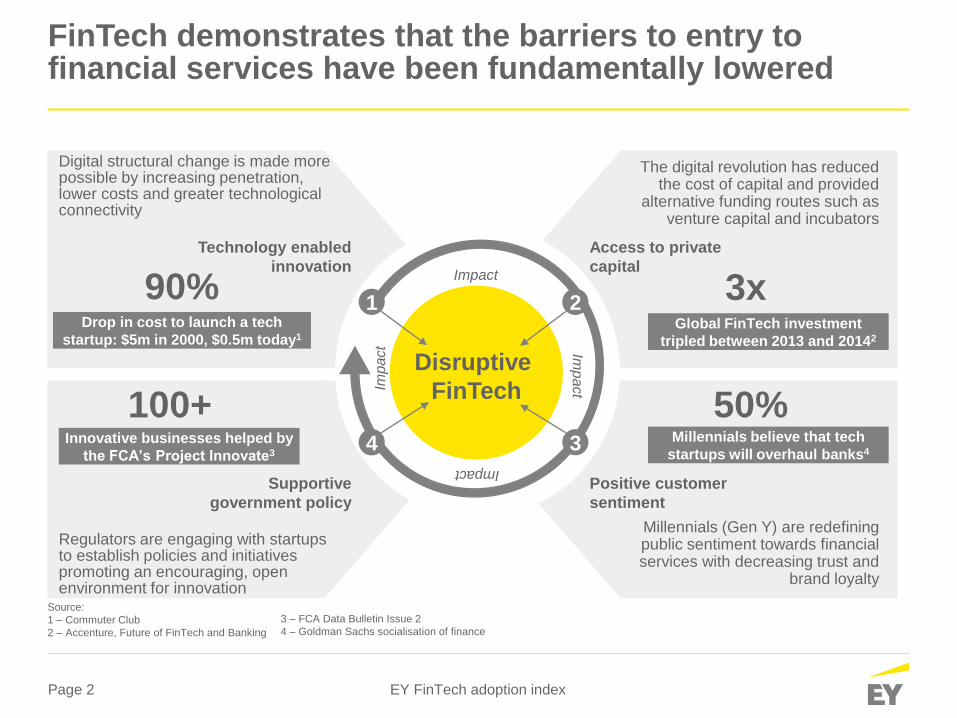
FinTech demonstrates that the barriers to entry to financial services have been fundamentally lowered
Digital structural change is made more possible by increasing penetration, lower costs and greater technological connectivity
Regulators are engaging with startups to establish policies and initiatives promoting an encouraging, open environment for innovation
Drop in cost to launch a tech
startup: $5m in 2000, $0.5m today1
90%
Innovative businesses helped by
the FCA’s Project Innovate3
100+
3x
Source:
1 – Commuter Club
2 – Accenture, Future of FinTech and Banking
Supportive
government policy
3 – FCA Data Bulletin Issue 2
4 – Goldman Sachs socialisation of finance
Global FinTech investment
tripled between 2013 and 20142
The digital revolution has reduced the cost of capital and provided
alternative funding routes such as venture capital and incubators
Millennials (Gen Y) are redefining public sentiment towards financial services with decreasing trust and
brand loyalty
Millennials believe that tech
startups will overhaul banks4
50%
Positive customer
sentiment
Imp
act
Disruptive
FinTechIm
pact
Impact
ImpactTechnology enabled
innovation
Access to private
capital
21
4 3
Page 3 EY FinTech adoption index
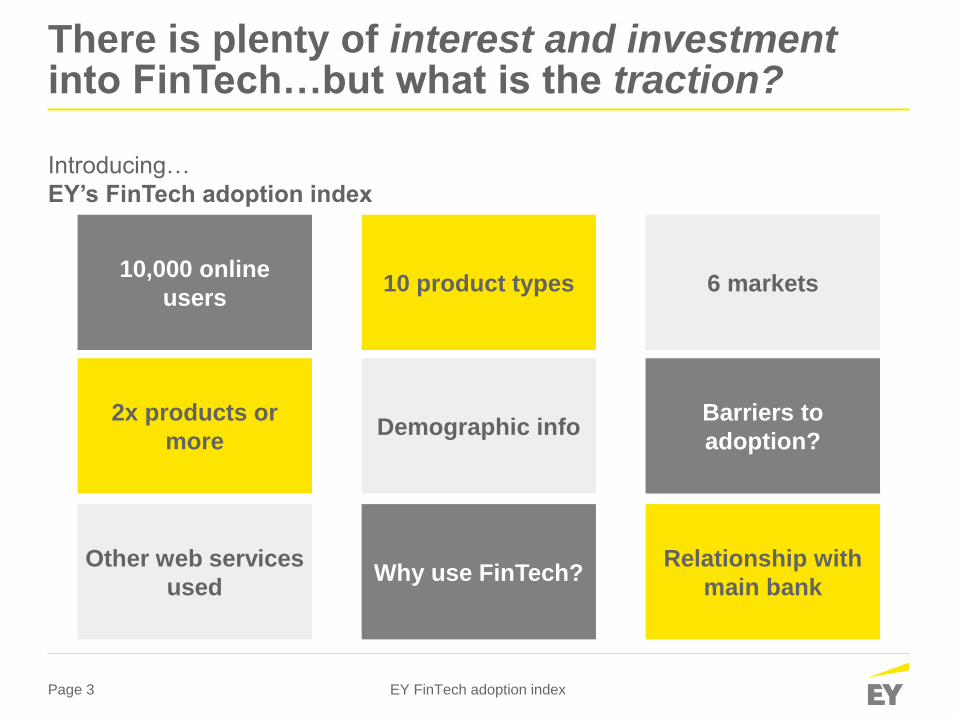
There is plenty of interest and investment into FinTech…but what is the traction?
Introducing…
EY’s FinTech adoption index
10,000 online
users10 product types 6 markets
2x products or
moreDemographic info
Barriers to
adoption?
Other web services
usedWhy use FinTech?
Relationship with
main bank
Page 4 EY FinTech adoption index
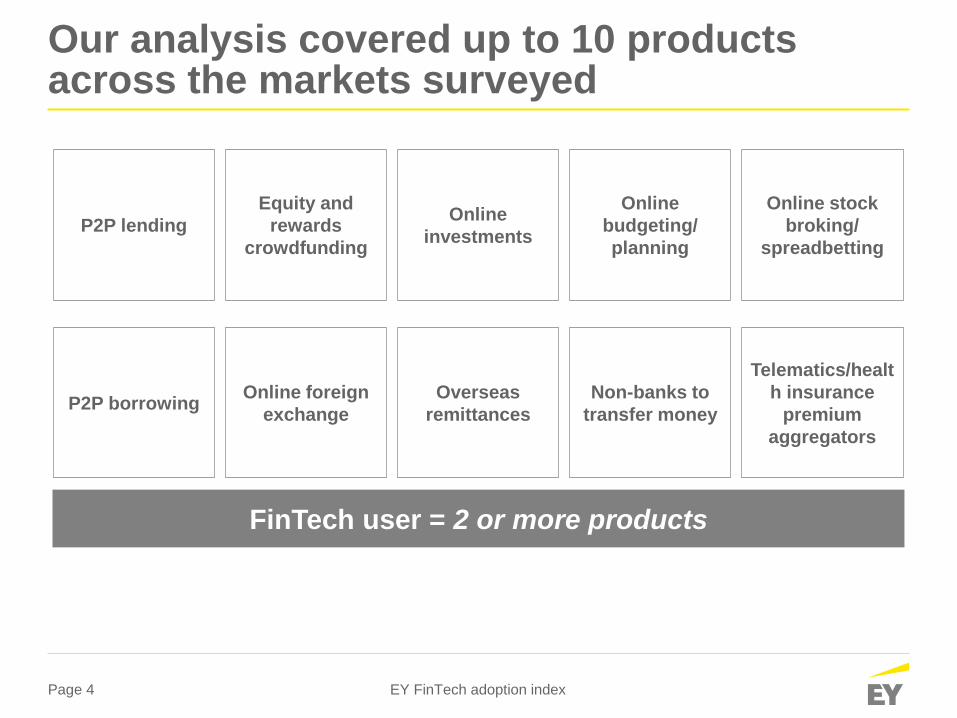
Our analysis covered up to 10 products across the markets surveyed
P2P lending
Equity and
rewards
crowdfunding
Online
investments
Online
budgeting/
planning
Online stock
broking/
spreadbetting
P2P borrowingOnline foreign
exchange
Overseas
remittances
Non-banks to
transfer money
Telematics/healt
h insurance
premium
aggregators
FinTech user = 2 or more products
Page 5 EY FinTech adoption index
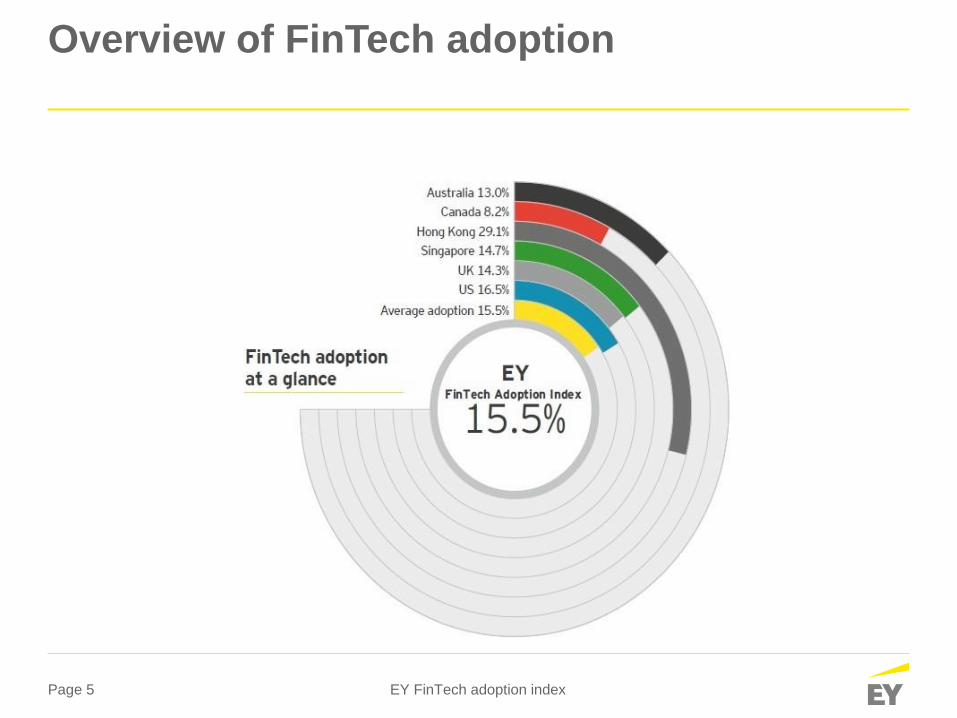
Overview of FinTech adoption
Page 6 EY FinTech adoption index
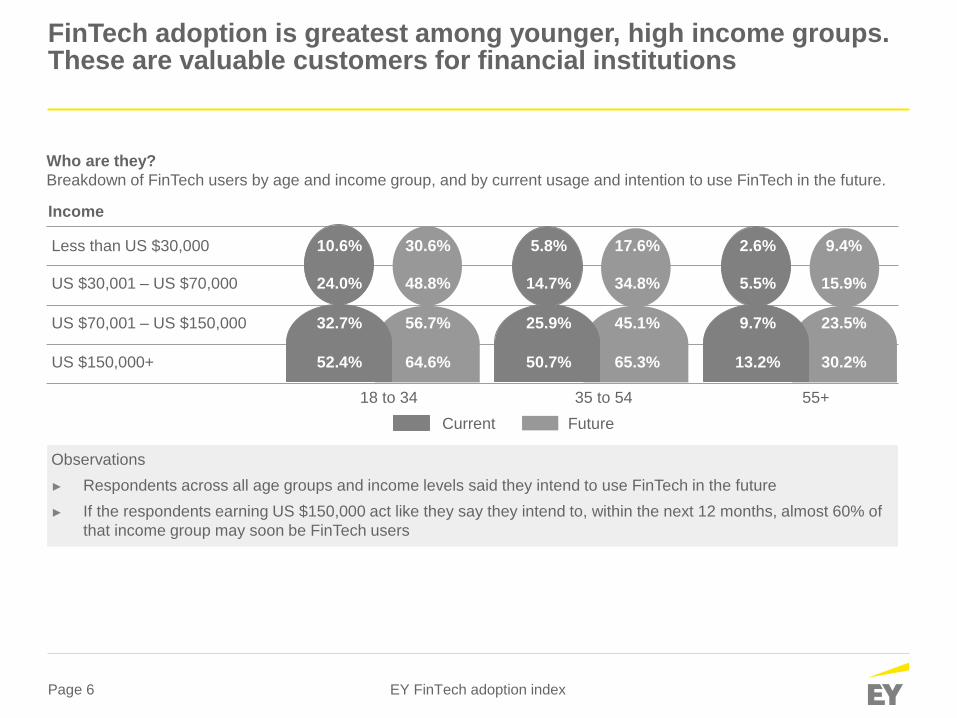
FinTech adoption is greatest among younger, high income groups. These are valuable customers for financial institutions
Who are they?
Breakdown of FinTech users by age and income group, and by current usage and intention to use FinTech in the future.
Observations
► Respondents across all age groups and income levels said they intend to use FinTech in the future
► If the respondents earning US $150,000 act like they say they intend to, within the next 12 months, almost 60% of
that income group may soon be FinTech users
Less than US $30,000
US $30,001 – US $70,000
US $70,001 – US $150,000
US $150,000+
Income
Current Future
10.6% 30.6% 5.8% 17.6% 2.6% 9.4%
24.0% 48.8% 14.7% 34.8% 5.5% 15.9%
32.7% 56.7% 25.9% 45.1% 9.7% 23.5%
52.4% 64.6% 50.7% 65.3% 13.2% 30.2%
18 to 34 35 to 54 55+
Page 7 EY FinTech adoption index
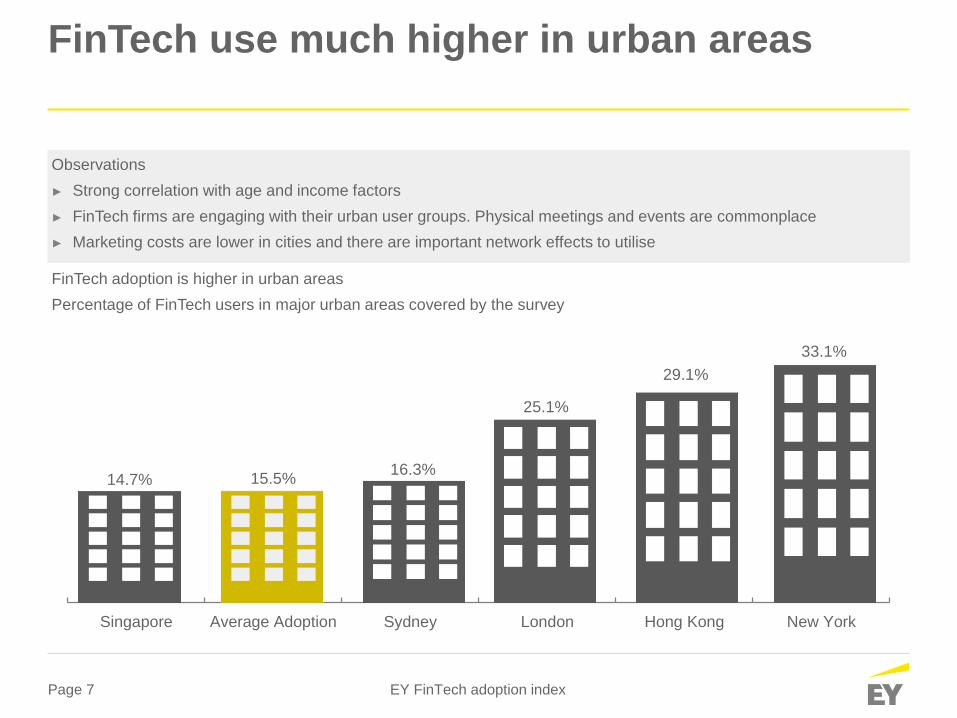
FinTech use much higher in urban areas
FinTech adoption is higher in urban areas
Percentage of FinTech users in major urban areas covered by the survey
14.7% 15.5%16.3%
25.1%
29.1%
33.1%
Singapore Average Adoption Sydney London Hong Kong New York
Observations
► Strong correlation with age and income factors
► FinTech firms are engaging with their urban user groups. Physical meetings and events are commonplace
► Marketing costs are lower in cities and there are important network effects to utilise
Page 8 EY FinTech adoption index
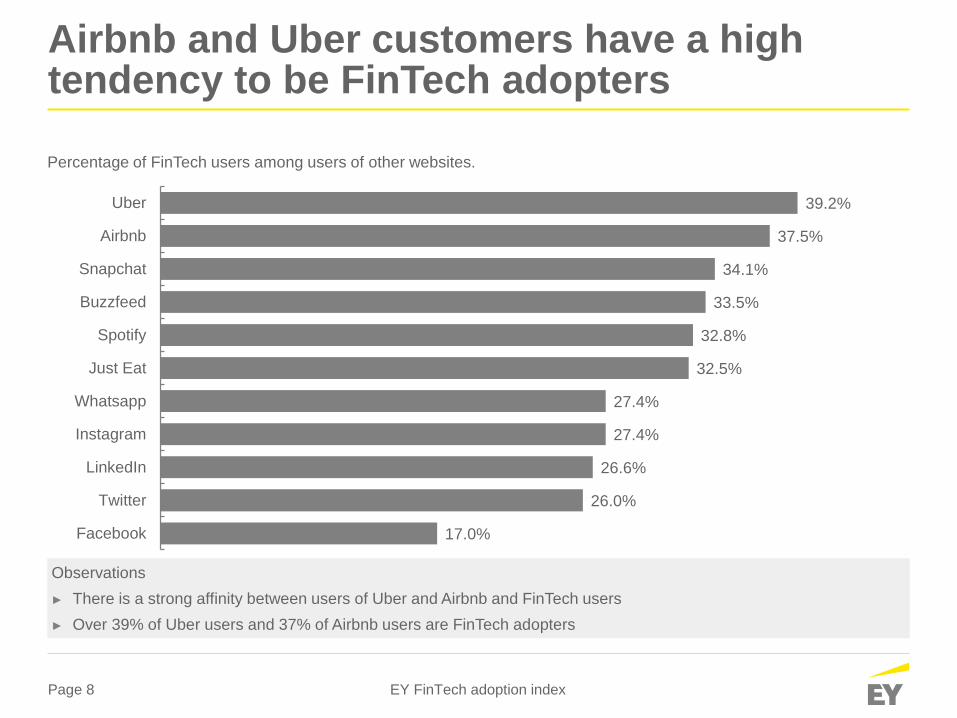
Airbnb and Uber customers have a high tendency to be FinTech adopters
17.0%
26.0%
26.6%
27.4%
27.4%
32.5%
32.8%
33.5%
34.1%
37.5%
39.2%
Just Eat
Spotify
Buzzfeed
Snapchat
Airbnb
Uber
Percentage of FinTech users among users of other websites.
Observations
► There is a strong affinity between users of Uber and Airbnb and FinTech users
► Over 39% of Uber users and 37% of Airbnb users are FinTech adopters
Page 9 EY FinTech adoption index
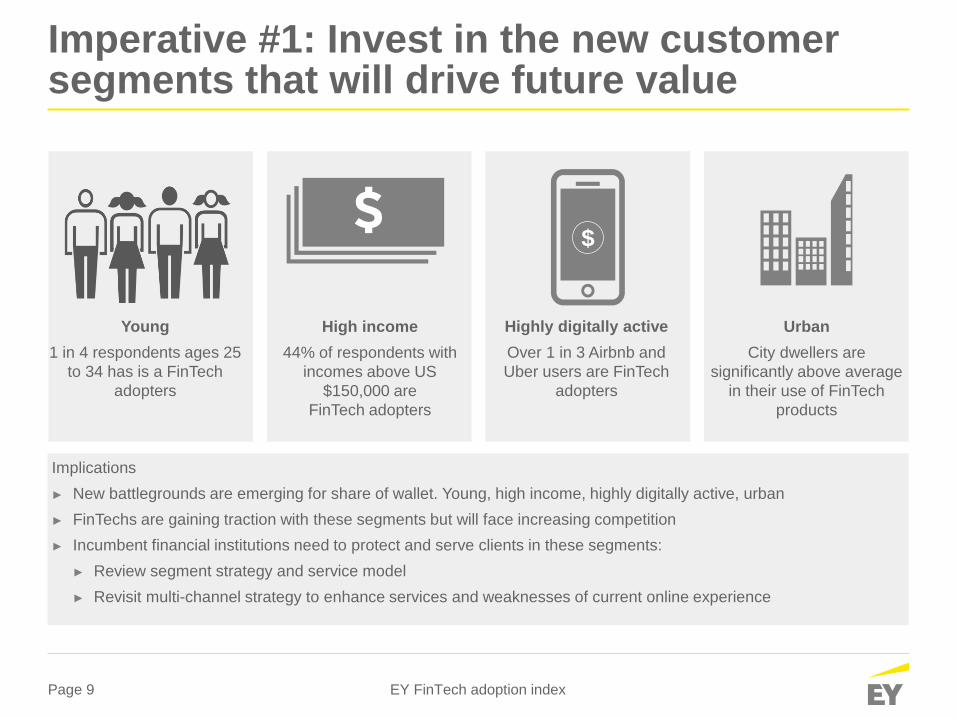
Imperative #1: Invest in the new customer segments that will drive future value
Young
1 in 4 respondents ages 25
to 34 has is a FinTech
adopters
High income
44% of respondents with
incomes above US
$150,000 are
FinTech adopters
$
Urban
City dwellers are
significantly above average
in their use of FinTech
products
Implications
► New battlegrounds are emerging for share of wallet. Young, high income, highly digitally active, urban
► FinTechs are gaining traction with these segments but will face increasing competition
► Incumbent financial institutions need to protect and serve clients in these segments:
► Review segment strategy and service model
► Revisit multi-channel strategy to enhance services and weaknesses of current online experience
Highly digitally active
Over 1 in 3 Airbnb and
Uber users are FinTech
adopters
$
Page 10 EY FinTech adoption index
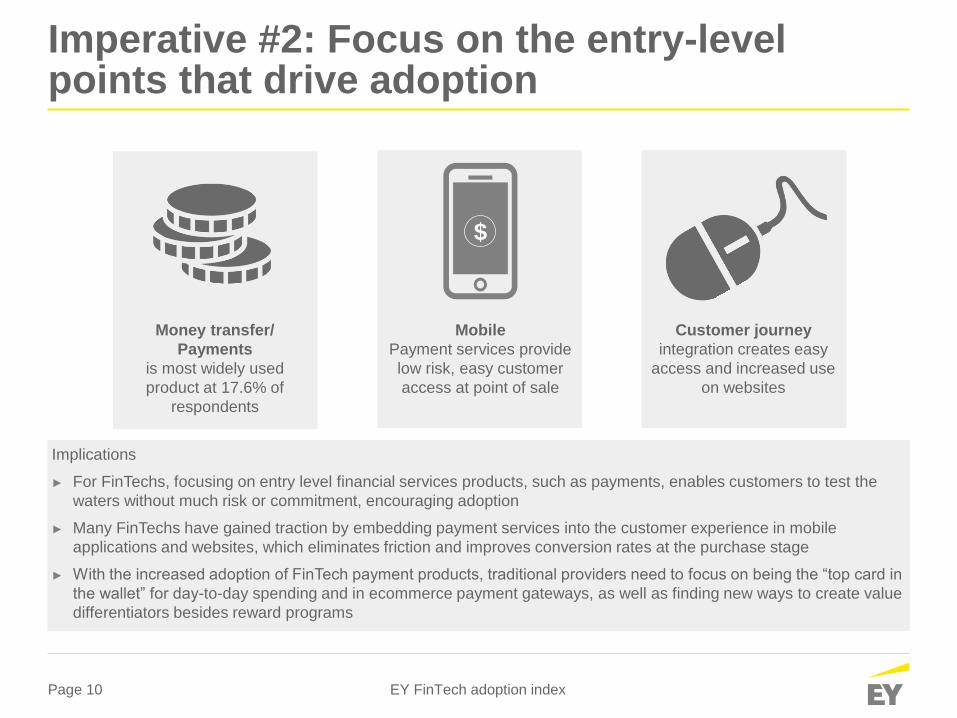
Imperative #2: Focus on the entry-level points that drive adoption
Implications
► For FinTechs, focusing on entry level financial services products, such as payments, enables customers to test the
waters without much risk or commitment, encouraging adoption
► Many FinTechs have gained traction by embedding payment services into the customer experience in mobile
applications and websites, which eliminates friction and improves conversion rates at the purchase stage
► With the increased adoption of FinTech payment products, traditional providers need to focus on being the “top card in
the wallet” for day-to-day spending and in ecommerce payment gateways, as well as finding new ways to create value
differentiators besides reward programs
Mobile
Payment services provide
low risk, easy customer
access at point of sale
Money transfer/
Payments
is most widely used
product at 17.6% of
respondents
Customer journey
integration creates easy
access and increased use
on websites
$
Page 11 EY FinTech adoption index
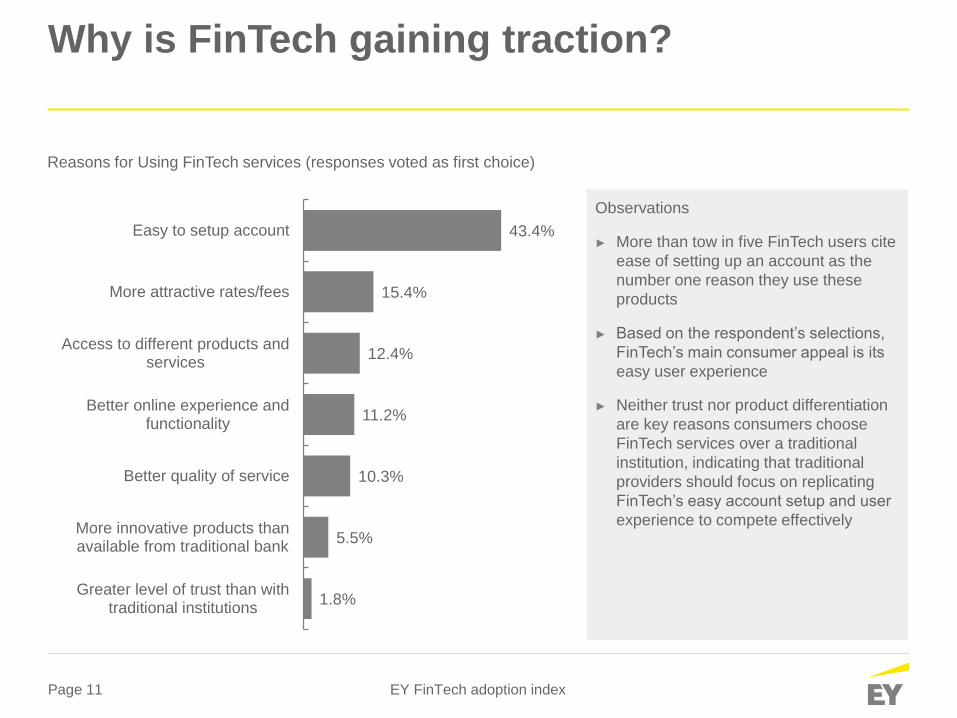
Why is FinTech gaining traction?
Observations
► More than tow in five FinTech users cite
ease of setting up an account as the
number one reason they use these
products
► Based on the respondent’s selections,
FinTech’s main consumer appeal is its
easy user experience
► Neither trust nor product differentiation
are key reasons consumers choose
FinTech services over a traditional
institution, indicating that traditional
providers should focus on replicating
FinTech’s easy account setup and user
experience to compete effectively
1.8%
5.5%
10.3%
11.2%
12.4%
15.4%
43.4%
Greater level of trust than withtraditional institutions
More innovative products thanavailable from traditional bank
Better quality of service
Better online experience andfunctionality
Access to different products andservices
More attractive rates/fees
Easy to setup account
Reasons for Using FinTech services (responses voted as first choice)
Page 12 EY FinTech adoption index
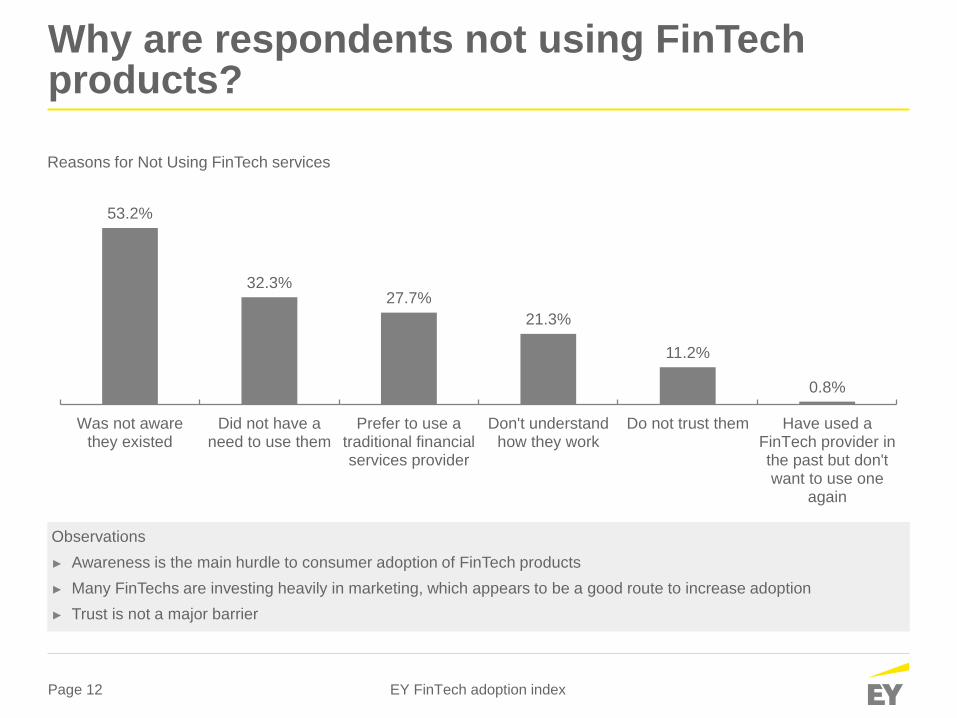
Why are respondents not using FinTech products?
53.2%
32.3%27.7%
21.3%
11.2%
0.8%
Was not awarethey existed
Did not have aneed to use them
Prefer to use atraditional financialservices provider
Don't understandhow they work
Do not trust them Have used aFinTech provider inthe past but don'twant to use one
again
Observations
► Awareness is the main hurdle to consumer adoption of FinTech products
► Many FinTechs are investing heavily in marketing, which appears to be a good route to increase adoption
► Trust is not a major barrier
Reasons for Not Using FinTech services
Page 13 EY FinTech adoption index
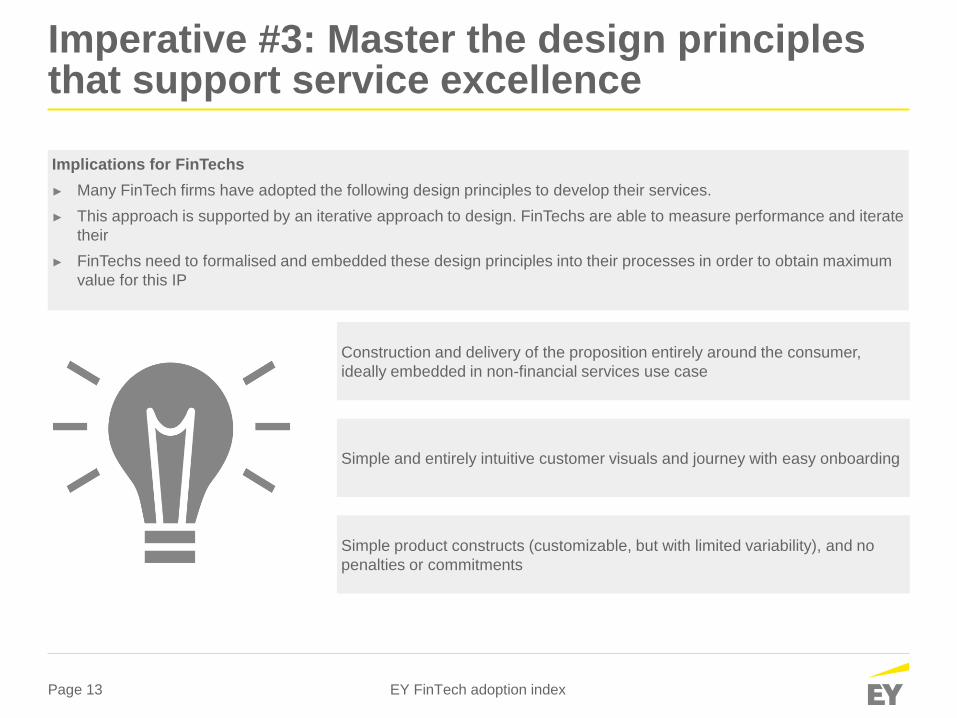
Imperative #3: Master the design principles that support service excellence
Implications for FinTechs
► Many FinTech firms have adopted the following design principles to develop their services.
► This approach is supported by an iterative approach to design. FinTechs are able to measure performance and iterate
their
► FinTechs need to formalised and embedded these design principles into their processes in order to obtain maximum
value for this IP
Construction and delivery of the proposition entirely around the consumer,
ideally embedded in non-financial services use case
Simple and entirely intuitive customer visuals and journey with easy onboarding
Simple product constructs (customizable, but with limited variability), and no
penalties or commitments
Page 14 EY FinTech adoption index
Imperative #3: Master the design principles that support service excellence
Incubate
Apply design tools to research and
test services:
► Customer experience laboratories
► Rapid-prototyping
Work with FinTech providers to
leverage their ideas and processes.
Incubate FinTech operations within
the institution.
Re-think design Partner
Implications for FinTechs
► Traditional players are often constrained by a culture of product silos, legacy product suites and pricing structures, as
well as legacy core IT systems
► These factors result in cumbersome user interfaces underpinned by complex and manual processes
► Traditional providers cannot used iterative design in the same way as FinTechs but need to adopt, in their own way,
the design elements that make FinTech services so engaging and easy to use
Page 15 EY FinTech adoption index
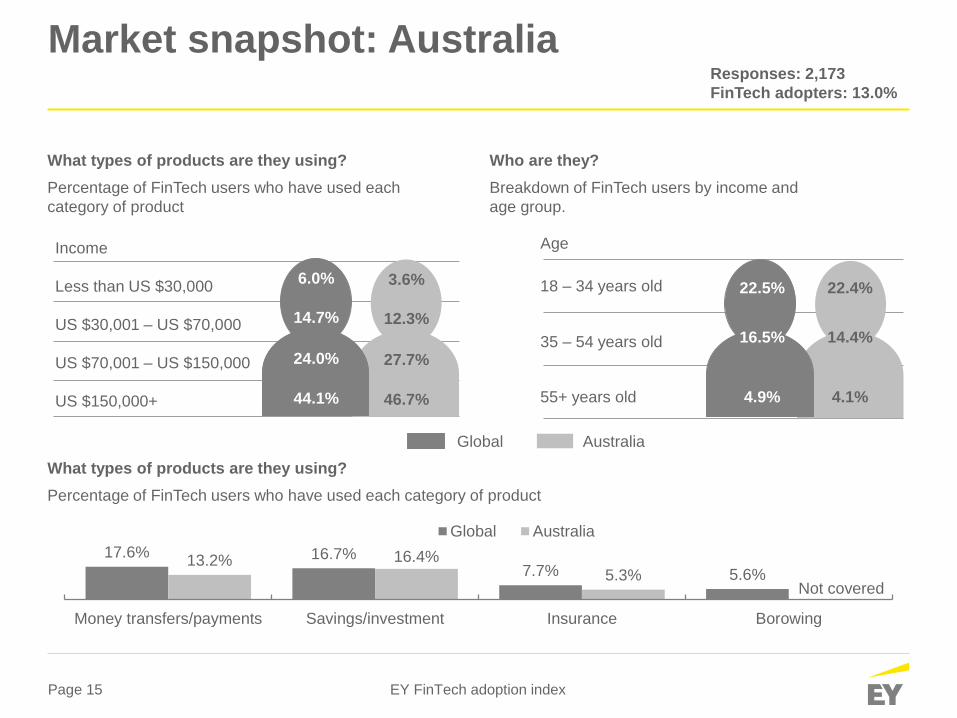
Market snapshot: Australia
Who are they?
Breakdown of FinTech users by income and
age group.
What types of products are they using?
Percentage of FinTech users who have used each
category of product
What types of products are they using?
Percentage of FinTech users who have used each category of product
Global Australia
17.6% 16.7%7.7% 5.6%
13.2% 16.4%5.3%
Money transfers/payments Savings/investment Insurance Borowing
Global Australia
Less than US $30,000
US $30,001 – US $70,000
US $70,001 – US $150,000
US $150,000+
Income
22.4%
14.4%
4.1%
18 – 34 years old
35 – 54 years old
55+ years old
Age
22.5%
16.5%
4.9%
Responses: 2,173
FinTech adopters: 13.0%
Not covered
3.6%
12.3%
27.7%
46.7%
6.0%
14.7%
24.0%
44.1%
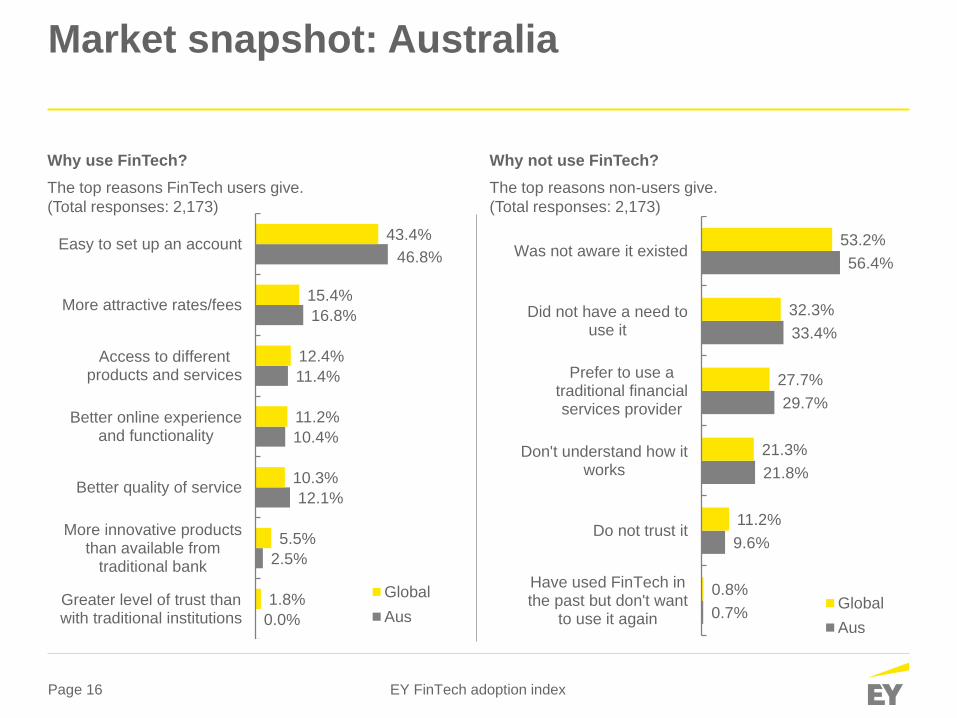
Page 16 EY FinTech adoption index
Market snapshot: Australia
Why not use FinTech?
The top reasons non-users give.
(Total responses: 2,173)
0.0%
2.5%
12.1%
10.4%
11.4%
16.8%
46.8%
1.8%
5.5%
10.3%
11.2%
12.4%
15.4%
43.4%
Greater level of trust thanwith traditional institutions
More innovative productsthan available from
traditional bank
Better quality of service
Better online experienceand functionality
Access to differentproducts and services
More attractive rates/fees
Easy to set up an account
Global
Aus
Why use FinTech?
The top reasons FinTech users give.
(Total responses: 2,173)
0.7%
9.6%
21.8%
29.7%
33.4%
56.4%
0.8%
11.2%
21.3%
27.7%
32.3%
53.2%
Have used FinTech inthe past but don't want
to use it again
Do not trust it
Don't understand how itworks
Prefer to use atraditional financialservices provider
Did not have a need touse it
Was not aware it existed
Global
Aus