ey fintech adoption index 2017file/ey-fintech-adoption-index-2017.pdf · the 2017 study reveals...
TRANSCRIPT
EY FinTech Adoption Index 2017The rapid emergence of FinTech


EY FinTech Adoption Index 2017 | 3
When EY launched the first global EY FinTech Adoption Index in 2015, FinTech was still in its relative infancy. We found that one in seven digitally active consumers were already FinTech users. In 2017, we find that adoption has risen dramatically to one in three.
In 2017, our research includes 20 markets and over 22,000 online interviews, providing a global perspective on FinTech. We now find that on average one in three digitally active consumers use two or more FinTech services. That is significant enough for us to suggest that FinTech has reached early mass adoption.
A common assumption is that FinTech firms struggle to translate innovation and great customer experience into meaningful numbers. In contrast, our findings reflect considerable consumer appetite for new and innovative financial service products that take advantage of new consumer technologies, such as mobile and cloud. Nowhere is that more apparent than in the historically underserved emerging markets, with China and India leading FinTech adoption across our study.
In this report, we lay out our findings from the EY FinTech Adoption Index and also present some fascinating stories of FinTech entrepreneurs who have reached real consumer adoption. We encourage other FinTech firms and traditional financial services companies to consider how these examples, as well as other firms including their own, are driving change and innovation within financial services.
We have observed a host of new FinTech firms, business models and consumer propositions entering the market, including entrepreneurial start-ups, major technology firms, and branchless mobile banking services. We can also see the seeds of the next evolution of financial services, with further FinTech adoption facilitated by the move toward data sharing, open Application Programming Interfaces (APIs), biometrics, and the application of artificial intelligence and robotics.
We believe that the financial services industry has considerable unexplored potential, and are excited to continue monitoring how FinTech and financial services evolve in future years. In the meantime, we hope this report provides a holistic view of FinTech adoption around the world, as well as provide insight and inspiration to FinTechs, financial services firms and policymakers alike.
Foreword
Imran Gulamhuseinwala OBE EY Global & Europe, Middle East, India and Africa FinTech Leader
Matt Hatch EY Americas FinTech Leader
James Lloyd EY Asia-Pacific FinTech Leader
4 | EY FinTech Adoption Index 2017
1. Executive summary 5
2. FinTech adoption: the numbers 11
3. Adoption strategies: what really works? 24
4. Implications in perspective 27
5. FinTech in action: the case studies 30
6. Appendix 38
Contents
AcknowledgementsSpecial thanks to our panel of FinTech contributors:Acorns Australia, Ant Financial, ClearScore, Lufax, Nubank, PayPal and Zerodha
EY FinTech Adoption Index 2017 | 5
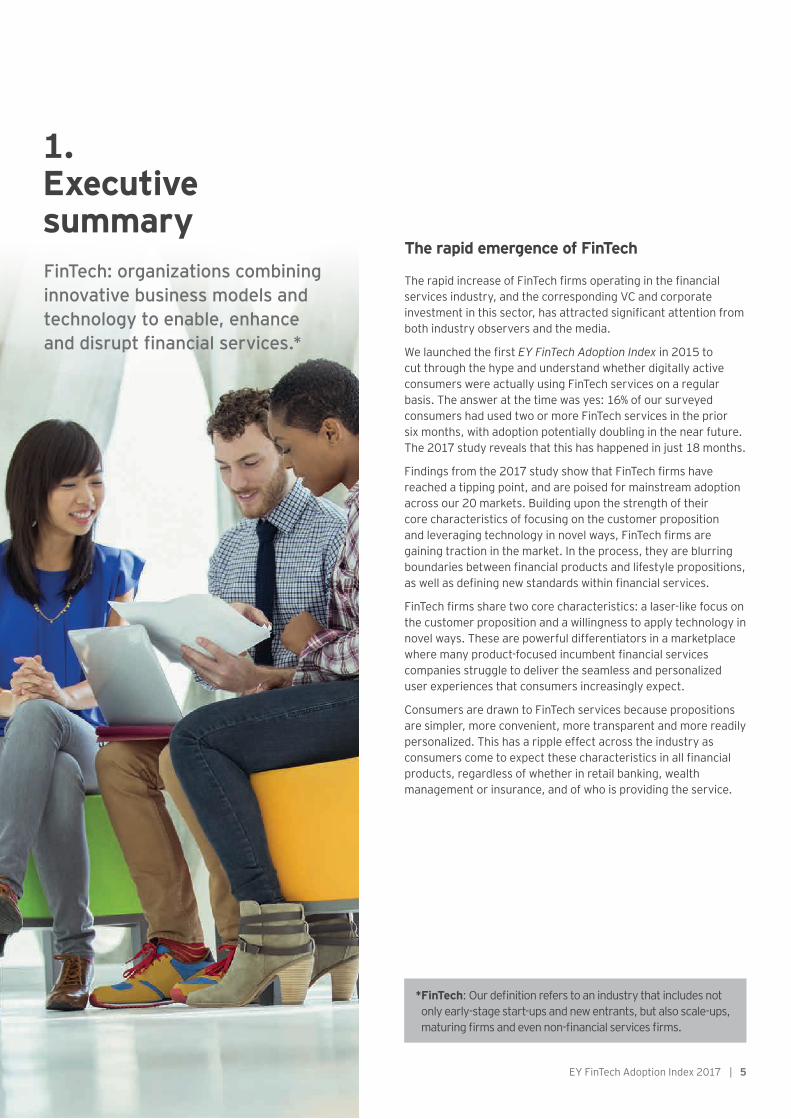
1. Executive summaryFinTech: organizations combining innovative business models and technology to enable, enhance and disrupt financial services.*
The rapid emergence of FinTech
The rapid increase of FinTech firms operating in the financial services industry, and the corresponding VC and corporate investment in this sector, has attracted significant attention from both industry observers and the media.
We launched the first EY FinTech Adoption Index in 2015 to cut through the hype and understand whether digitally active consumers were actually using FinTech services on a regular basis. The answer at the time was yes: 16% of our surveyed consumers had used two or more FinTech services in the prior six months, with adoption potentially doubling in the near future. The 2017 study reveals that this has happened in just 18 months.
Findings from the 2017 study show that FinTech firms have reached a tipping point, and are poised for mainstream adoption across our 20 markets. Building upon the strength of their core characteristics of focusing on the customer proposition and leveraging technology in novel ways, FinTech firms are gaining traction in the market. In the process, they are blurring boundaries between financial products and lifestyle propositions, as well as defining new standards within financial services.
FinTech firms share two core characteristics: a laser-like focus on the customer proposition and a willingness to apply technology in novel ways. These are powerful differentiators in a marketplace where many product-focused incumbent financial services companies struggle to deliver the seamless and personalized user experiences that consumers increasingly expect.
Consumers are drawn to FinTech services because propositions are simpler, more convenient, more transparent and more readily personalized. This has a ripple effect across the industry as consumers come to expect these characteristics in all financial products, regardless of whether in retail banking, wealth management or insurance, and of who is providing the service.
* FinTech: Our definition refers to an industry that includes not only early-stage start-ups and new entrants, but also scale-ups, maturing firms and even non-financial services firms.
6 | EY FinTech Adoption Index 2017
2 Hong Kong SAR of China.
1 The number of markets covered in our survey has expanded. Our 2017 study presents FinTech adoption across the 20 markets surveyed of 32.8%. Our 2015 study covered six markets and used a different, population weighted average, which was 15.5% across the six markets. For comparison purposes, applying the 2015 methodology and set of six markets to the 2017 survey data also results in an average adoption of 33.2%. All figures have been rounded to the nearest whole percentage in this report.
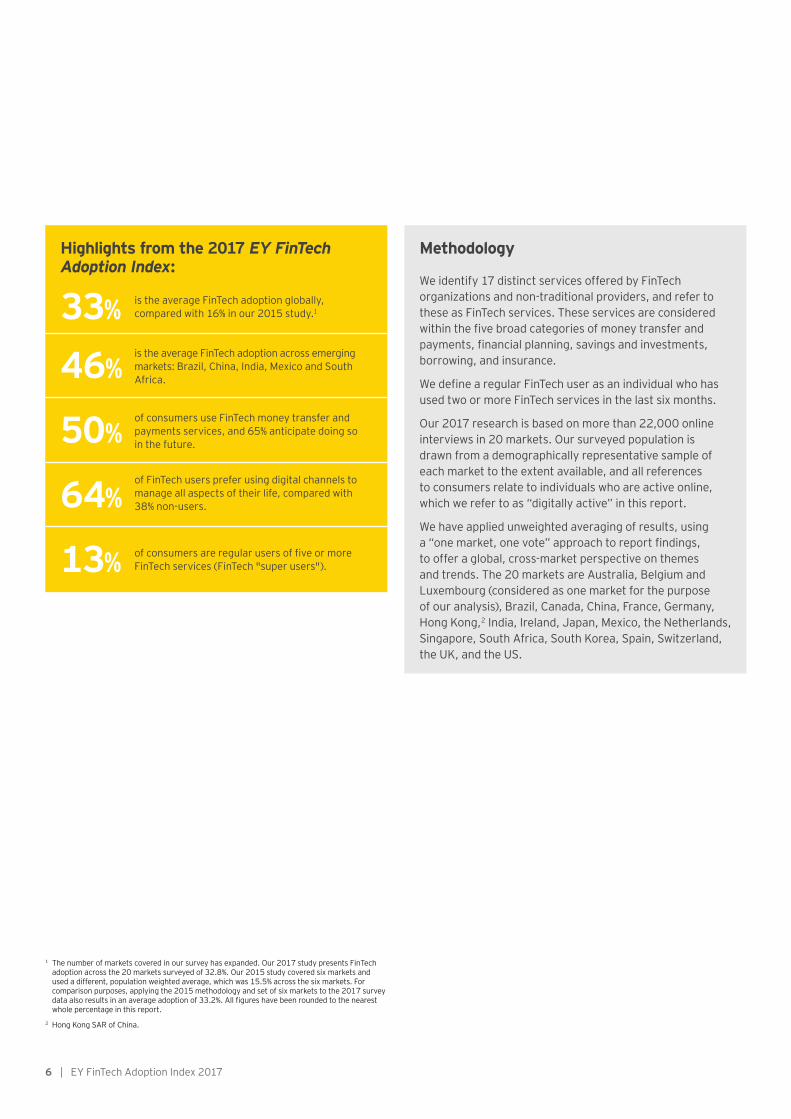
Highlights from the 2017 EY FinTech Adoption Index:
33%
46%
50%
64%
13%
is the average FinTech adoption globally, compared with 16% in our 2015 study.1
is the average FinTech adoption across emerging markets: Brazil, China, India, Mexico and South Africa.
of consumers use FinTech money transfer and payments services, and 65% anticipate doing so in the future.
of FinTech users prefer using digital channels to manage all aspects of their life, compared with 38% non-users.
of consumers are regular users of five or more FinTech services (FinTech "super users").
Methodology
We identify 17 distinct services offered by FinTech organizations and non-traditional providers, and refer to these as FinTech services. These services are considered within the five broad categories of money transfer and payments, financial planning, savings and investments, borrowing, and insurance.
We define a regular FinTech user as an individual who has used two or more FinTech services in the last six months.
Our 2017 research is based on more than 22,000 online interviews in 20 markets. Our surveyed population is drawn from a demographically representative sample of each market to the extent available, and all references to consumers relate to individuals who are active online, which we refer to as “digitally active” in this report.
We have applied unweighted averaging of results, using a “one market, one vote” approach to report findings, to offer a global, cross-market perspective on themes and trends. The 20 markets are Australia, Belgium and Luxembourg (considered as one market for the purpose of our analysis), Brazil, Canada, China, France, Germany, Hong Kong,2 India, Ireland, Japan, Mexico, the Netherlands, Singapore, South Africa, South Korea, Spain, Switzerland, the UK, and the US.
EY FinTech Adoption Index 2017 | 7
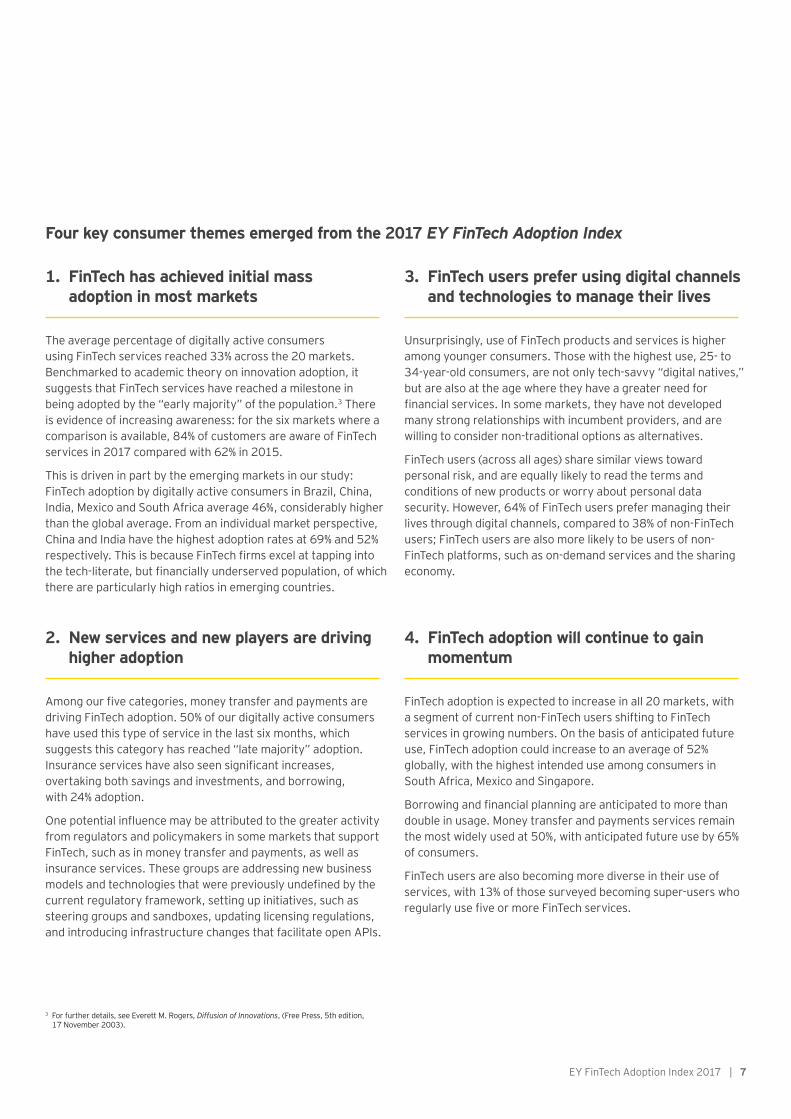
1. FinTech has achieved initial mass adoption in most markets
The average percentage of digitally active consumers using FinTech services reached 33% across the 20 markets. Benchmarked to academic theory on innovation adoption, it suggests that FinTech services have reached a milestone in being adopted by the “early majority” of the population.3 There is evidence of increasing awareness: for the six markets where a comparison is available, 84% of customers are aware of FinTech services in 2017 compared with 62% in 2015.
This is driven in part by the emerging markets in our study: FinTech adoption by digitally active consumers in Brazil, China, India, Mexico and South Africa average 46%, considerably higher than the global average. From an individual market perspective, China and India have the highest adoption rates at 69% and 52% respectively. This is because FinTech firms excel at tapping into the tech-literate, but financially underserved population, of which there are particularly high ratios in emerging countries.
3. FinTech users prefer using digital channels and technologies to manage their lives
Unsurprisingly, use of FinTech products and services is higher among younger consumers. Those with the highest use, 25- to 34-year-old consumers, are not only tech-savvy “digital natives,” but are also at the age where they have a greater need for financial services. In some markets, they have not developed many strong relationships with incumbent providers, and are willing to consider non-traditional options as alternatives.
FinTech users (across all ages) share similar views toward personal risk, and are equally likely to read the terms and conditions of new products or worry about personal data security. However, 64% of FinTech users prefer managing their lives through digital channels, compared to 38% of non-FinTech users; FinTech users are also more likely to be users of non-FinTech platforms, such as on-demand services and the sharing economy.
2. New services and new players are driving higher adoption
Among our five categories, money transfer and payments are driving FinTech adoption. 50% of our digitally active consumers have used this type of service in the last six months, which suggests this category has reached “late majority” adoption. Insurance services have also seen significant increases, overtaking both savings and investments, and borrowing, with 24% adoption.
One potential influence may be attributed to the greater activity from regulators and policymakers in some markets that support FinTech, such as in money transfer and payments, as well as insurance services. These groups are addressing new business models and technologies that were previously undefined by the current regulatory framework, setting up initiatives, such as steering groups and sandboxes, updating licensing regulations, and introducing infrastructure changes that facilitate open APIs.
4. FinTech adoption will continue to gain momentum
FinTech adoption is expected to increase in all 20 markets, with a segment of current non-FinTech users shifting to FinTech services in growing numbers. On the basis of anticipated future use, FinTech adoption could increase to an average of 52% globally, with the highest intended use among consumers in South Africa, Mexico and Singapore.
Borrowing and financial planning are anticipated to more than double in usage. Money transfer and payments services remain the most widely used at 50%, with anticipated future use by 65% of consumers.
FinTech users are also becoming more diverse in their use of services, with 13% of those surveyed becoming super-users who regularly use five or more FinTech services.
Four key consumer themes emerged from the 2017 EY FinTech Adoption Index
3 For further details, see Everett M. Rogers, Diffusion of Innovations, (Free Press, 5th edition, 17 November 2003).
8 | EY FinTech Adoption Index 2017
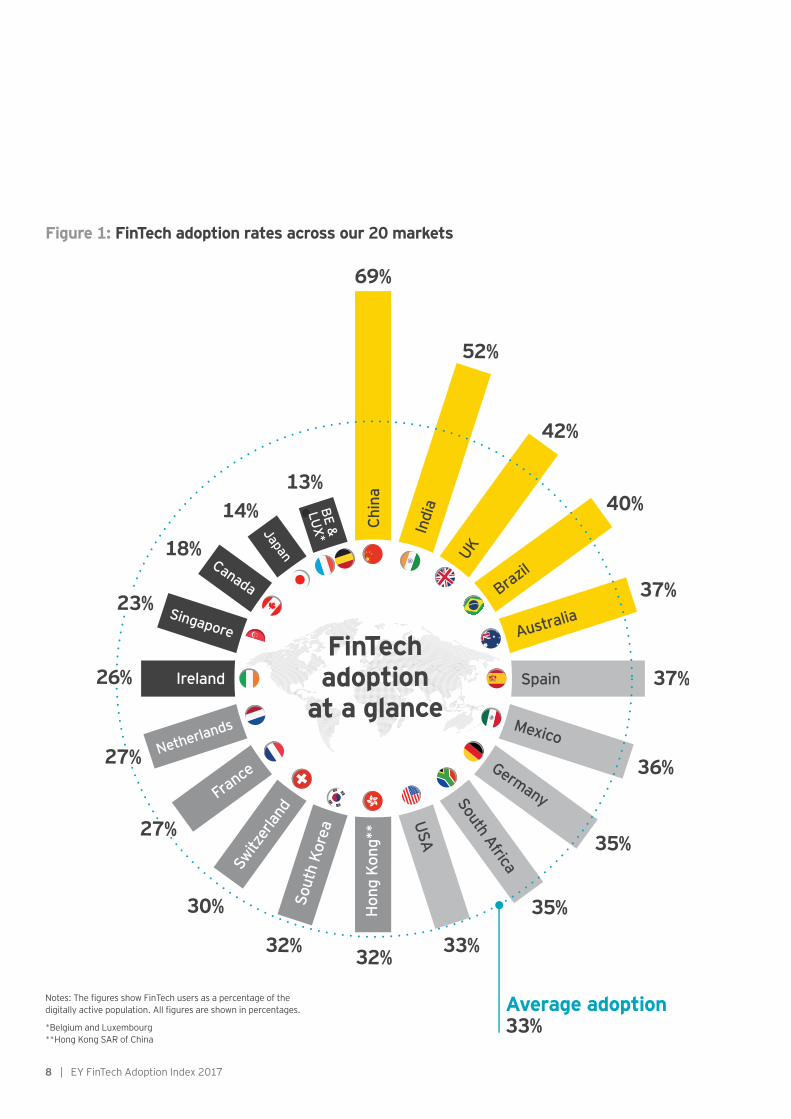
Notes: The figures show FinTech users as a percentage of the digitally active population. All figures are shown in percentages.
*Belgium and Luxembourg **Hong Kong SAR of China
Figure 1: FinTech adoption rates across our 20 markets
EY FinTech Adoption Index 2017 | 9
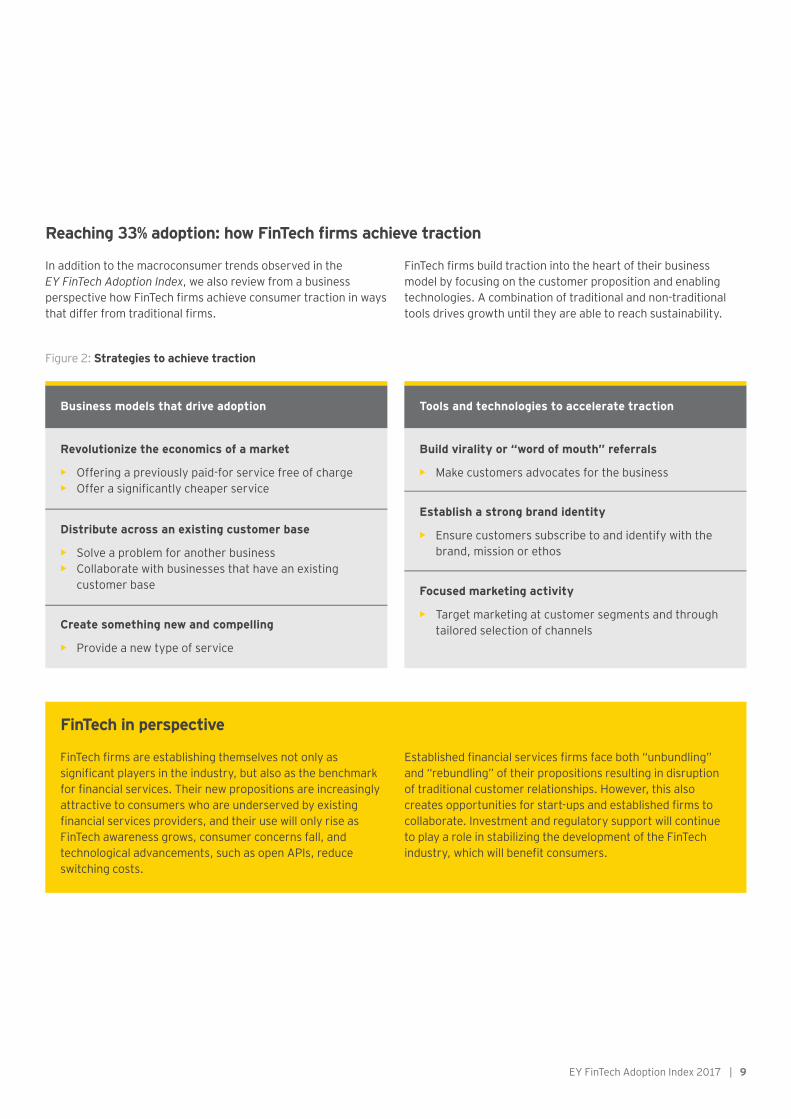
Reaching 33% adoption: how FinTech firms achieve traction
In addition to the macroconsumer trends observed in the EY FinTech Adoption Index, we also review from a business perspective how FinTech firms achieve consumer traction in ways that differ from traditional firms.
FinTech firms build traction into the heart of their business model by focusing on the customer proposition and enabling technologies. A combination of traditional and non-traditional tools drives growth until they are able to reach sustainability.
Figure 2: Strategies to achieve traction
Business models that drive adoption Tools and technologies to accelerate traction
Revolutionize the economics of a market
• Offering a previously paid-for service free of charge • Offer a significantly cheaper service
Build virality or “word of mouth” referrals
• Make customers advocates for the business
Distribute across an existing customer base
• Solve a problem for another business • Collaborate with businesses that have an existing
customer base
Establish a strong brand identity
• Ensure customers subscribe to and identify with the brand, mission or ethos
Create something new and compelling
• Provide a new type of service
Focused marketing activity
• Target marketing at customer segments and through tailored selection of channels
FinTech in perspective
FinTech firms are establishing themselves not only as significant players in the industry, but also as the benchmark for financial services. Their new propositions are increasingly attractive to consumers who are underserved by existing financial services providers, and their use will only rise as FinTech awareness grows, consumer concerns fall, and technological advancements, such as open APIs, reduce switching costs.
Established financial services firms face both “unbundling” and “rebundling” of their propositions resulting in disruption of traditional customer relationships. However, this also creates opportunities for start-ups and established firms to collaborate. Investment and regulatory support will continue to play a role in stabilizing the development of the FinTech industry, which will benefit consumers.

10 | EY FinTech Adoption Index 2017
We asked the leaders of FinTech firms from different regions, and at different levels of maturity, for their perspectives on customer traction.
“ Even though it’s easier said than done, the best thing to do is to build a product that resonates clearly with people’s needs. Once you have that, your early adopters will recommend you to their friends and, in today’s environment, you can quickly get viral growth through word of mouth.” George Lucas, Founder and CEO, Acorns Australia
“ We believe in the power of tech. By using it well and by working closely with our financial and strategic partners around the world, we aim to bring equal access to financial services to over two billion people in 10 years.” Eric Jing, CEO, Ant Financial
“ For propositions to tip into the mass market, they need to be incredibly simple; even an elevator pitch is too complex. Ideally, propositions should be under 10 words. ClearScore’s proposition is, ‘Your credit report and score, for free, forever.’” Justin Basini, Founder and CEO, ClearScore
“ Achieving customer adoption means different things at different stages. From the beginning, it pays to be focused — to have one thing that hits the pain point of customers and attracts them to the platform. For Lufax, peer-to-peer (P2P) was that star product, and Ping An was crucial to gaining customer comfort and traction at the beginning.” Gregory Gibb, Founder and CEO, Lufax
“ We built Nubank despite all conventional wisdom, in the midst of Brazil’s worst economic crisis. Today, more than nine million people have applied for Nubank. These results should motivate every entrepreneur to keep challenging the status quo.” David Vélez, Founder and CEO, Nubank
“ PayPal is uniquely positioned to solve issues that others cannot, particularly as consumers and merchants increasingly connect over mobile and social media. We lead the way toward an overwhelmingly mobile future.” Bill Ready, COO, PayPal
“ Unlike traditional broking firms, we keep our operations online and pass benefits back to our clients as lower costs. This edge of being a tech firm has helped us scale our business to one of the largest brokerage firms in India in terms of retail trading turnover.” Nithin Kamath, Founder and CEO, Zerodha
EY FinTech Adoption Index 2017 | 11
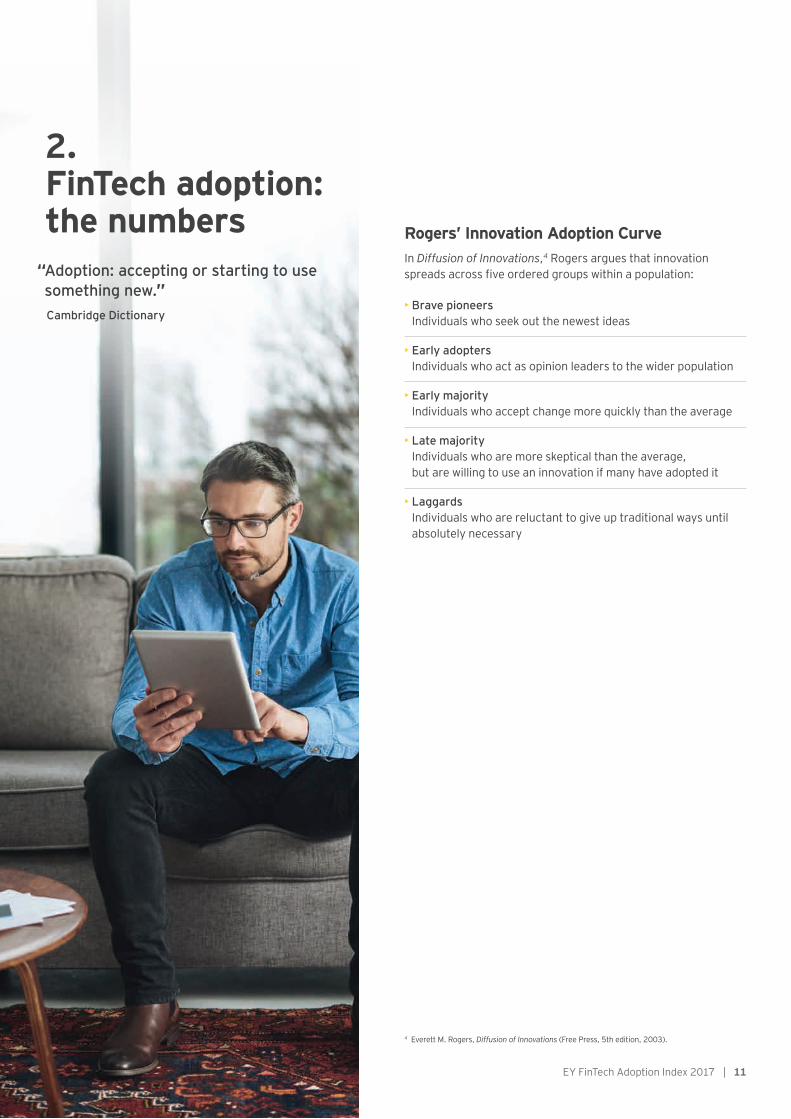
2. FinTech adoption: the numbers Rogers’ Innovation Adoption Curve
In Diffusion of Innovations,4 Rogers argues that innovation spreads across five ordered groups within a population:
• Brave pioneers Individuals who seek out the newest ideas
• Early adopters Individuals who act as opinion leaders to the wider population
• Early majority Individuals who accept change more quickly than the average
• Late majority Individuals who are more skeptical than the average, but are willing to use an innovation if many have adopted it
• Laggards Individuals who are reluctant to give up traditional ways until absolutely necessary
4 Everett M. Rogers, Diffusion of Innovations (Free Press, 5th edition, 2003).
“ Adoption: accepting or starting to use something new.” Cambridge Dictionary
12 | EY FinTech Adoption Index 2017
Early adopters (2.5%–16%)
Global average (33%)
Late majority (50%–84%)
Belgium an
d
Luxembourg Jap
an
Canad
a
Singapore
Irelan
d
Nether
lands
France
Switzer
land
South Korea
Hong Kong US
South Africa
German
y
Mexico
Spain
Australi
aBra
zil UKIndia
China
Early majority (16%–50%)
13 1418
2326 27 27
30 32 32 33 35 35 36 37 3740 42
52
69
Notes: The figures here show global adoption rates for 2017, including adoption rates for each of the 20 markets, plotted against stages of the innovation adoption curve. All figures are shown in percentages.
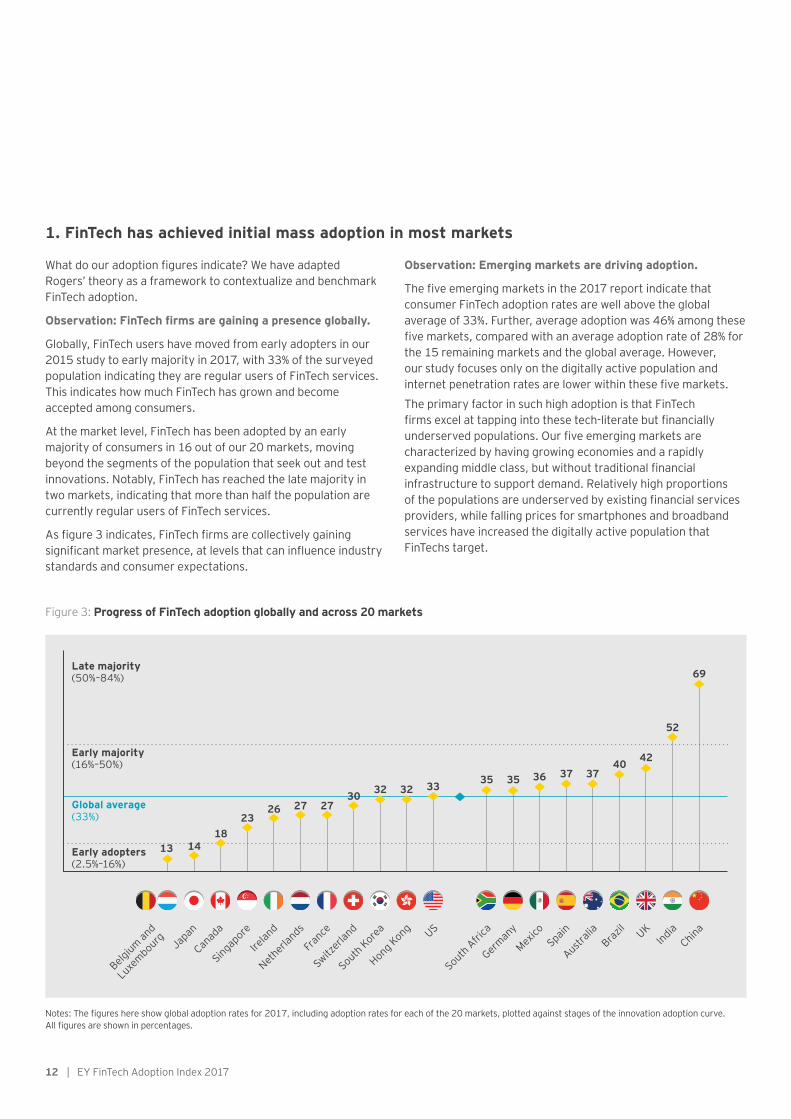
Figure 3: Progress of FinTech adoption globally and across 20 markets
1. FinTech has achieved initial mass adoption in most markets
What do our adoption figures indicate? We have adapted Rogers’ theory as a framework to contextualize and benchmark FinTech adoption.
Observation: FinTech firms are gaining a presence globally.
Globally, FinTech users have moved from early adopters in our 2015 study to early majority in 2017, with 33% of the surveyed population indicating they are regular users of FinTech services. This indicates how much FinTech has grown and become accepted among consumers.
At the market level, FinTech has been adopted by an early majority of consumers in 16 out of our 20 markets, moving beyond the segments of the population that seek out and test innovations. Notably, FinTech has reached the late majority in two markets, indicating that more than half the population are currently regular users of FinTech services.
As figure 3 indicates, FinTech firms are collectively gaining significant market presence, at levels that can influence industry standards and consumer expectations.
Observation: Emerging markets are driving adoption.
The five emerging markets in the 2017 report indicate that consumer FinTech adoption rates are well above the global average of 33%. Further, average adoption was 46% among these five markets, compared with an average adoption rate of 28% for the 15 remaining markets and the global average. However, our study focuses only on the digitally active population and internet penetration rates are lower within these five markets.
The primary factor in such high adoption is that FinTech firms excel at tapping into these tech-literate but financially underserved populations. Our five emerging markets are characterized by having growing economies and a rapidly expanding middle class, but without traditional financial infrastructure to support demand. Relatively high proportions of the populations are underserved by existing financial services providers, while falling prices for smartphones and broadband services have increased the digitally active population that FinTechs target.
EY FinTech Adoption Index 2017 | 13
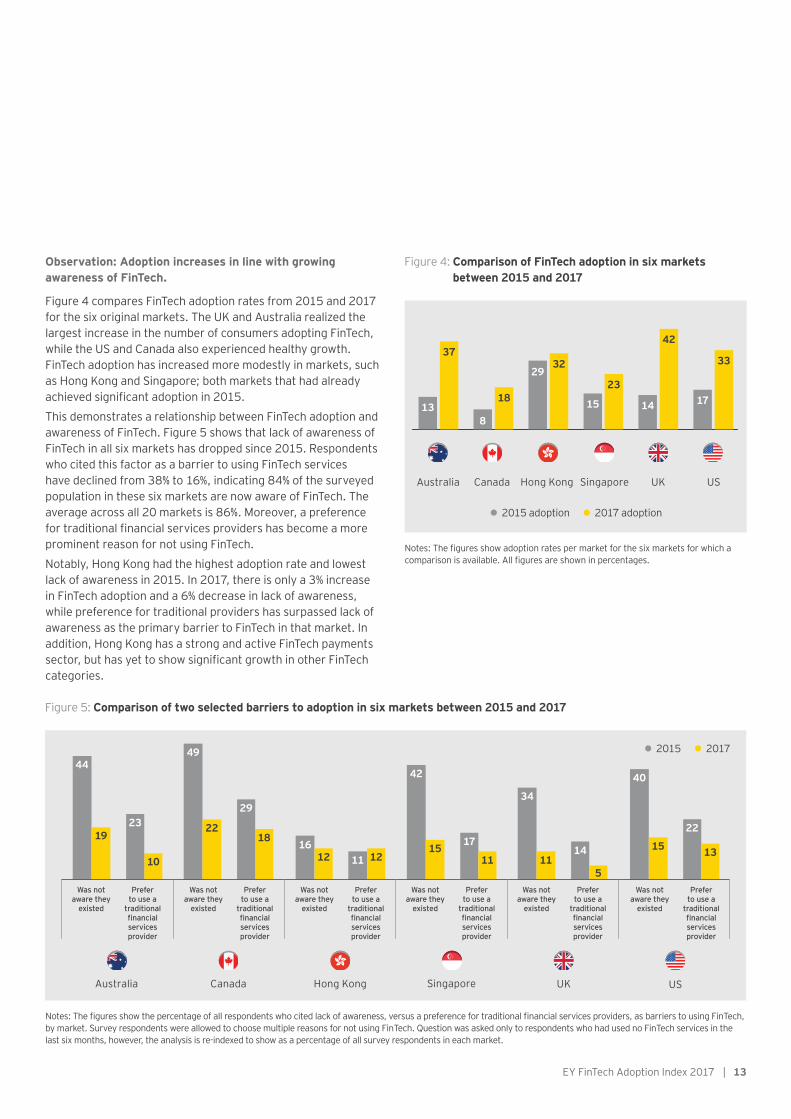
Observation: Adoption increases in line with growing awareness of FinTech.
Figure 4 compares FinTech adoption rates from 2015 and 2017 for the six original markets. The UK and Australia realized the largest increase in the number of consumers adopting FinTech, while the US and Canada also experienced healthy growth. FinTech adoption has increased more modestly in markets, such as Hong Kong and Singapore; both markets that had already achieved significant adoption in 2015.
This demonstrates a relationship between FinTech adoption and awareness of FinTech. Figure 5 shows that lack of awareness of FinTech in all six markets has dropped since 2015. Respondents who cited this factor as a barrier to using FinTech services have declined from 38% to 16%, indicating 84% of the surveyed population in these six markets are now aware of FinTech. The average across all 20 markets is 86%. Moreover, a preference for traditional financial services providers has become a more prominent reason for not using FinTech.
Notably, Hong Kong had the highest adoption rate and lowest lack of awareness in 2015. In 2017, there is only a 3% increase in FinTech adoption and a 6% decrease in lack of awareness, while preference for traditional providers has surpassed lack of awareness as the primary barrier to FinTech in that market. In addition, Hong Kong has a strong and active FinTech payments sector, but has yet to show significant growth in other FinTech categories.
49
22
40
15
42
15
44
1923
10
29
1816
12 11 12
22
1314
5
17
11
34
11
Notes: The figures show the percentage of all respondents who cited lack of awareness, versus a preference for traditional financial services providers, as barriers to using FinTech, by market. Survey respondents were allowed to choose multiple reasons for not using FinTech. Question was asked only to respondents who had used no FinTech services in the last six months, however, the analysis is re-indexed to show as a percentage of all survey respondents in each market.
2017 2015
Figure 5: Comparison of two selected barriers to adoption in six markets between 2015 and 2017
Australia Canada Hong Kong Singapore UK US
Notes: The figures show adoption rates per market for the six markets for which a comparison is available. All figures are shown in percentages.
Figure 4: Comparison of FinTech adoption in six markets between 2015 and 2017
2015 adoption 2017 adoption
Australia Canada Hong Kong Singapore UK US
37
1318
8
3229
15
23
14
42
17
33
Was not aware they
existed
Was not aware they
existed
Was not aware they
existed
Prefer to use a
traditional financial services provider
Prefer to use a
traditional financial services provider
Prefer to use a
traditional financial services provider
Was not aware they
existed
Prefer to use a
traditional financial services provider
Was not aware they
existed
Was not aware they
existed
Prefer to use a
traditional financial services provider
Prefer to use a
traditional financial services provider
14 | EY FinTech Adoption Index 2017
2. New services and new players are driving higher adoption
Observation: FinTech adoption is driven by greater use of money transfer and payments, and insurance services.
Major technology players have entered the retail financial services market, teaming up with FinTech firms to provide new or improved propositions with wide uptake. Other FinTech firms have responded to the increasing ubiquity of internet access and smartphones to launch digital-first versions of existing financial products. Both providers focus on superior user experiences for otherwise difficult or tedious processes, such as purchasing insurance or checking bank balances.
New payment services that have come to market and become established since the 2015 study include online digital-only banks and mobile phone payment at checkout. Insurance has expanded into telematics and wearables (helping companies to predict claim probability better), as well as premium comparison sites in certain markets.
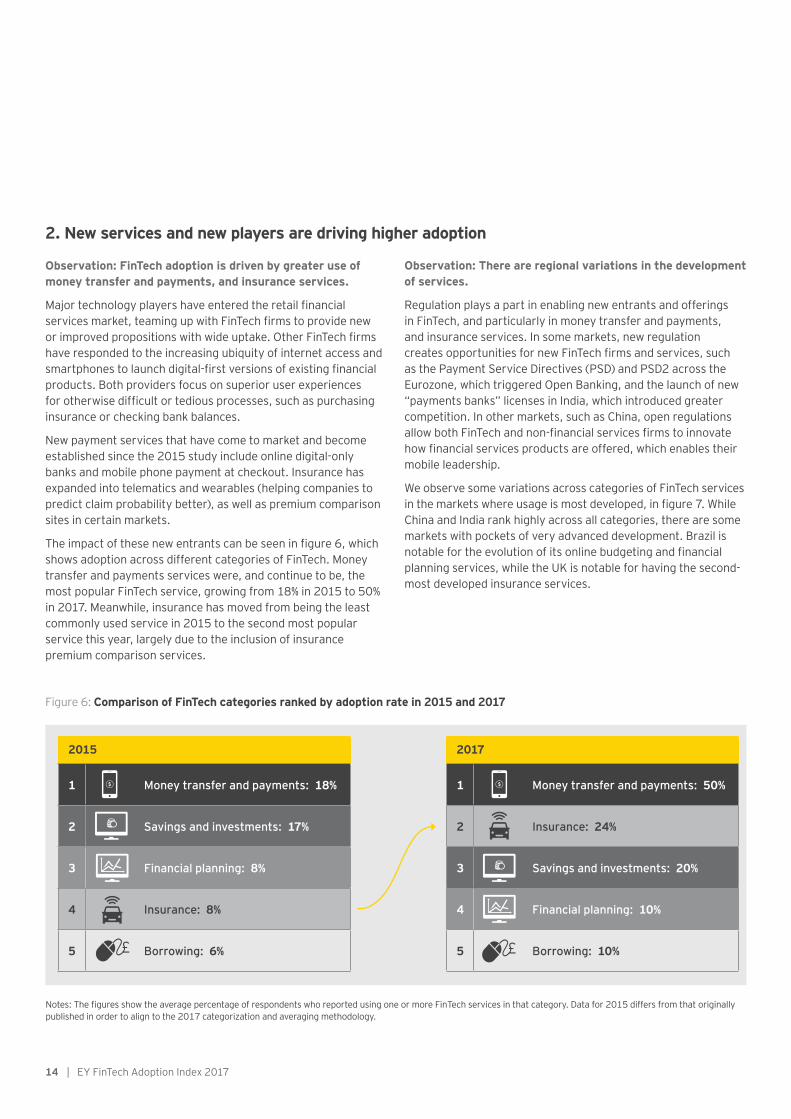
The impact of these new entrants can be seen in figure 6, which shows adoption across different categories of FinTech. Money transfer and payments services were, and continue to be, the most popular FinTech service, growing from 18% in 2015 to 50% in 2017. Meanwhile, insurance has moved from being the least commonly used service in 2015 to the second most popular service this year, largely due to the inclusion of insurance premium comparison services.
Observation: There are regional variations in the development of services.
Regulation plays a part in enabling new entrants and offerings in FinTech, and particularly in money transfer and payments, and insurance services. In some markets, new regulation creates opportunities for new FinTech firms and services, such as the Payment Service Directives (PSD) and PSD2 across the Eurozone, which triggered Open Banking, and the launch of new “payments banks” licenses in India, which introduced greater competition. In other markets, such as China, open regulations allow both FinTech and non-financial services firms to innovate how financial services products are offered, which enables their mobile leadership.
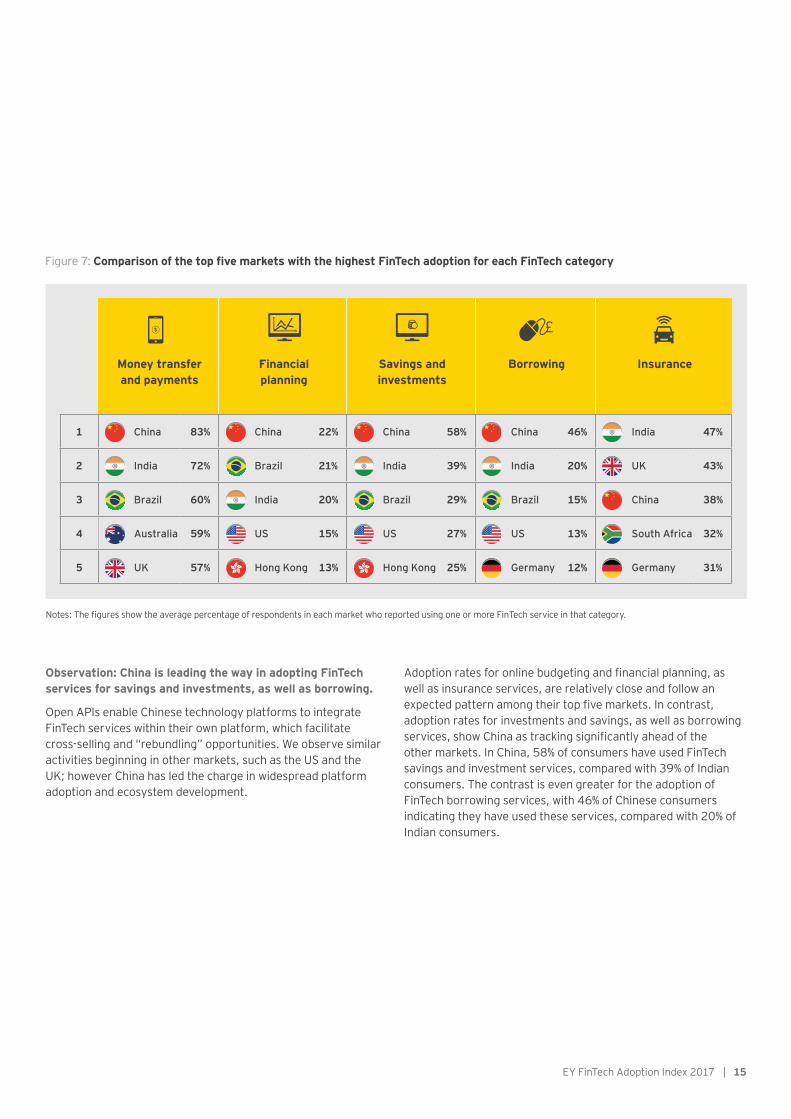
We observe some variations across categories of FinTech services in the markets where usage is most developed, in figure 7. While China and India rank highly across all categories, there are some markets with pockets of very advanced development. Brazil is notable for the evolution of its online budgeting and financial planning services, while the UK is notable for having the second-most developed insurance services.
2015
1 Money transfer and payments: 18%
2 Savings and investments: 17%
3 Financial planning: 8%
4 Insurance: 8%
5 Borrowing: 6%
2017
1 Money transfer and payments: 50%
2 Insurance: 24%
3 Savings and investments: 20%
4 Financial planning: 10%
5 Borrowing: 10%
Figure 6: Comparison of FinTech categories ranked by adoption rate in 2015 and 2017
Notes: The figures show the average percentage of respondents who reported using one or more FinTech services in that category. Data for 2015 differs from that originally published in order to align to the 2017 categorization and averaging methodology.
EY FinTech Adoption Index 2017 | 15
Money transfer and payments
Financial planning
Savings and investments
Borrowing Insurance
1 China 83% China 22% China 58% China 46% India 47%
2 India 72% Brazil 21% India 39% India 20% UK 43%
3 Brazil 60% India 20% Brazil 29% Brazil 15% China 38%
4 Australia 59% US 15% US 27% US 13% South Africa 32%
5 UK 57% Hong Kong 13% Hong Kong 25% Germany 12% Germany 31%
Observation: China is leading the way in adopting FinTech services for savings and investments, as well as borrowing.
Open APIs enable Chinese technology platforms to integrate FinTech services within their own platform, which facilitate cross-selling and “rebundling” opportunities. We observe similar activities beginning in other markets, such as the US and the UK; however China has led the charge in widespread platform adoption and ecosystem development.
Adoption rates for online budgeting and financial planning, as well as insurance services, are relatively close and follow an expected pattern among their top five markets. In contrast, adoption rates for investments and savings, as well as borrowing services, show China as tracking significantly ahead of the other markets. In China, 58% of consumers have used FinTech savings and investment services, compared with 39% of Indian consumers. The contrast is even greater for the adoption of FinTech borrowing services, with 46% of Chinese consumers indicating they have used these services, compared with 20% of Indian consumers.
Figure 7: Comparison of the top five markets with the highest FinTech adoption for each FinTech category
Notes: The figures show the average percentage of respondents in each market who reported using one or more FinTech service in that category.
16 | EY FinTech Adoption Index 2017
3. FinTech users prefer using digital channels and technologies to manage their lives
What distinguishes a FinTech user from a non-FinTech user? Demographic and behavioral patterns suggest that financial services consumer relationships are changing.
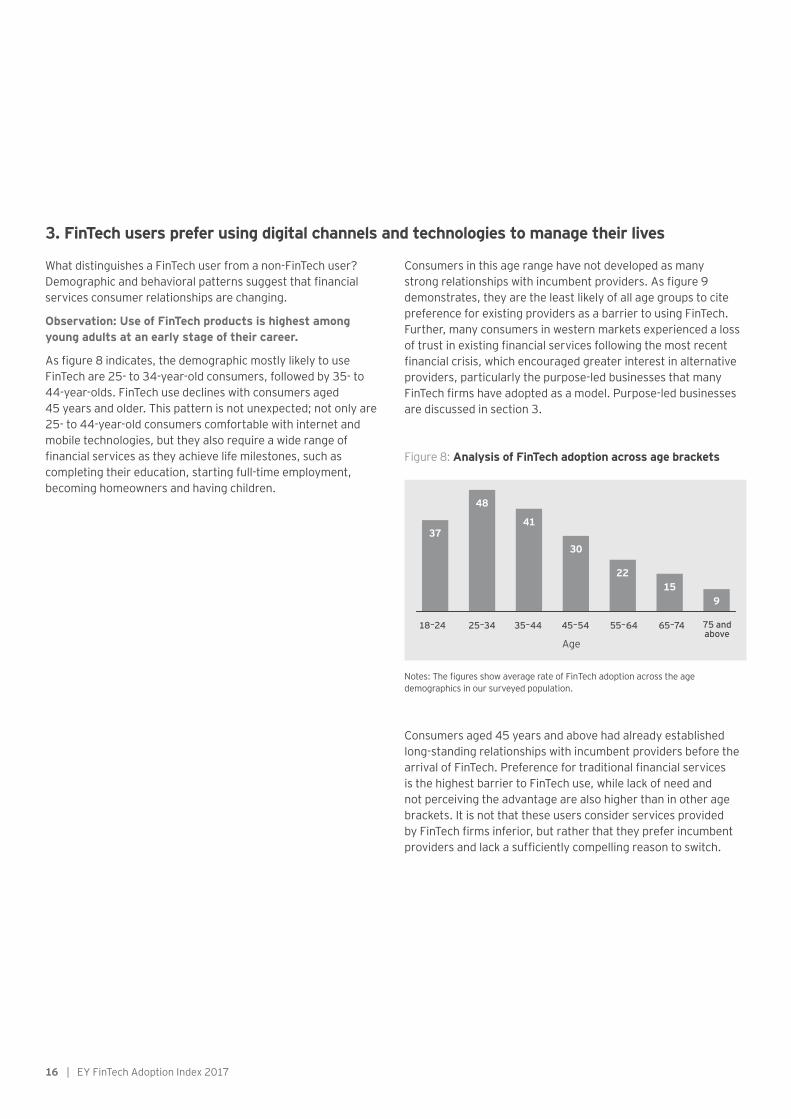
Observation: Use of FinTech products is highest among young adults at an early stage of their career.
As figure 8 indicates, the demographic mostly likely to use FinTech are 25- to 34-year-old consumers, followed by 35- to 44-year-olds. FinTech use declines with consumers aged 45 years and older. This pattern is not unexpected; not only are 25- to 44-year-old consumers comfortable with internet and mobile technologies, but they also require a wide range of financial services as they achieve life milestones, such as completing their education, starting full-time employment, becoming homeowners and having children.
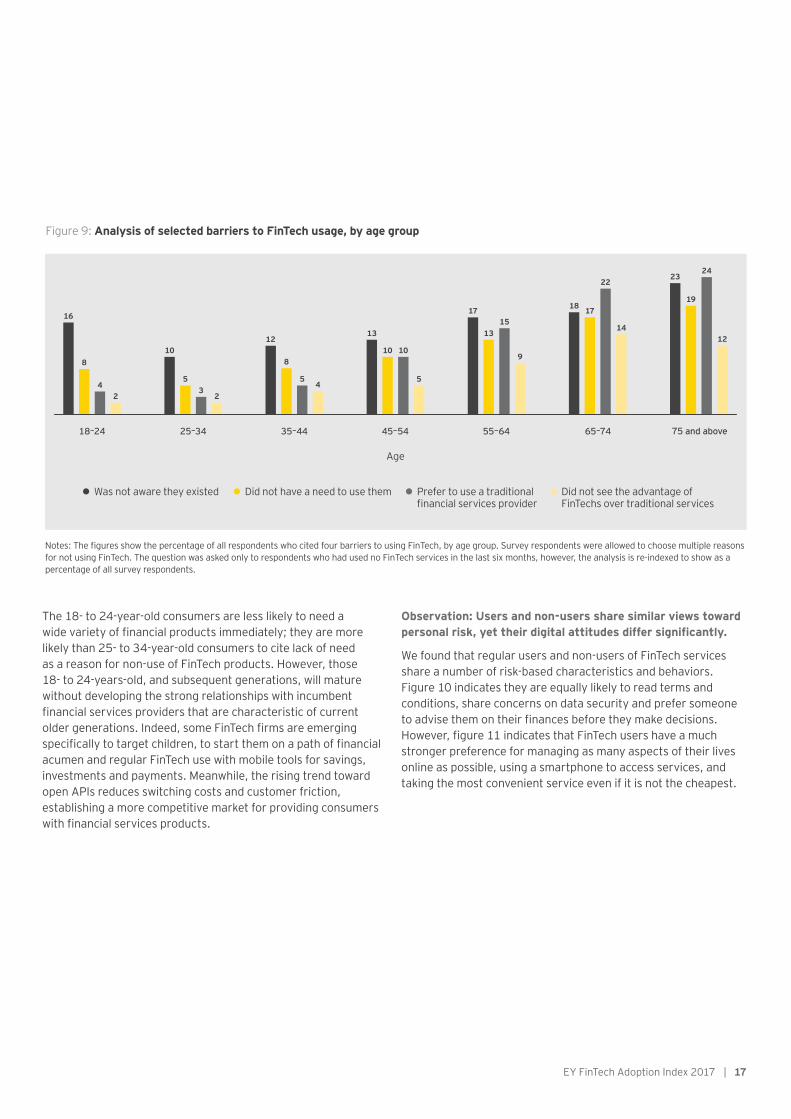
Consumers in this age range have not developed as many strong relationships with incumbent providers. As figure 9 demonstrates, they are the least likely of all age groups to cite preference for existing providers as a barrier to using FinTech. Further, many consumers in western markets experienced a loss of trust in existing financial services following the most recent financial crisis, which encouraged greater interest in alternative providers, particularly the purpose-led businesses that many FinTech firms have adopted as a model. Purpose-led businesses are discussed in section 3.
Consumers aged 45 years and above had already established long-standing relationships with incumbent providers before the arrival of FinTech. Preference for traditional financial services is the highest barrier to FinTech use, while lack of need and not perceiving the advantage are also higher than in other age brackets. It is not that these users consider services provided by FinTech firms inferior, but rather that they prefer incumbent providers and lack a sufficiently compelling reason to switch.
37
48
41
30
2215
9
18–24 25–34 35–44 45–54 55–64 65–74 75 and above
Age
Figure 8: Analysis of FinTech adoption across age brackets
Notes: The figures show average rate of FinTech adoption across the age demographics in our surveyed population.
EY FinTech Adoption Index 2017 | 17
The 18- to 24-year-old consumers are less likely to need a wide variety of financial products immediately; they are more likely than 25- to 34-year-old consumers to cite lack of need as a reason for non-use of FinTech products. However, those 18- to 24-years-old, and subsequent generations, will mature without developing the strong relationships with incumbent financial services providers that are characteristic of current older generations. Indeed, some FinTech firms are emerging specifically to target children, to start them on a path of financial acumen and regular FinTech use with mobile tools for savings, investments and payments. Meanwhile, the rising trend toward open APIs reduces switching costs and customer friction, establishing a more competitive market for providing consumers with financial services products.
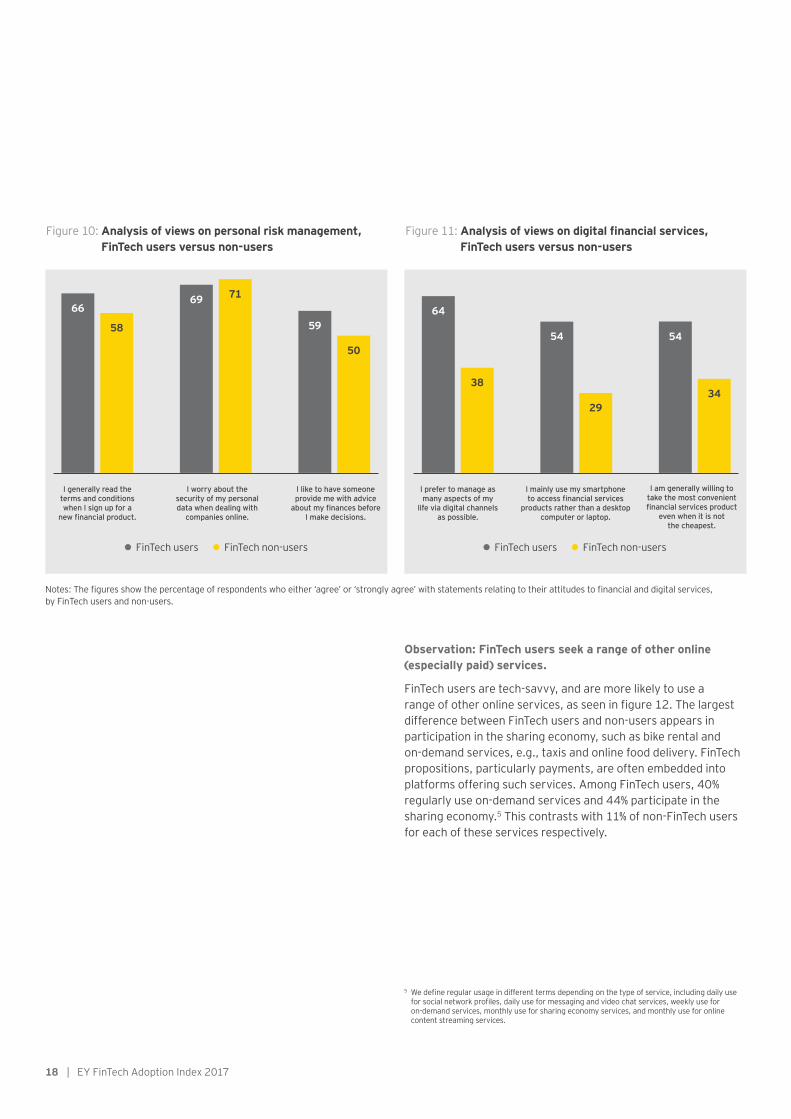
Observation: Users and non-users share similar views toward personal risk, yet their digital attitudes differ significantly.
We found that regular users and non-users of FinTech services share a number of risk-based characteristics and behaviors. Figure 10 indicates they are equally likely to read terms and conditions, share concerns on data security and prefer someone to advise them on their finances before they make decisions. However, figure 11 indicates that FinTech users have a much stronger preference for managing as many aspects of their lives online as possible, using a smartphone to access services, and taking the most convenient service even if it is not the cheapest.
8
16
42
18–24 25–34 35–44 45–54 55–64 65–74 75 and above
5
10
32
8
12
54
13
10 10
5
17
1315
9
18 17
22
14
23
19
24
12
Notes: The figures show the percentage of all respondents who cited four barriers to using FinTech, by age group. Survey respondents were allowed to choose multiple reasons for not using FinTech. The question was asked only to respondents who had used no FinTech services in the last six months, however, the analysis is re-indexed to show as a percentage of all survey respondents.
Was not aware they existed Did not have a need to use them Prefer to use a traditional financial services provider
Did not see the advantage of FinTechs over traditional services
Figure 9: Analysis of selected barriers to FinTech usage, by age group
Age
18 | EY FinTech Adoption Index 2017
Notes: The figures show the percentage of respondents who either ‘agree’ or ‘strongly agree’ with statements relating to their attitudes to financial and digital services, by FinTech users and non-users.
Figure 10: Analysis of views on personal risk management, FinTech users versus non-users
Figure 11: Analysis of views on digital financial services, FinTech users versus non-users
FinTech users FinTech users FinTech non-users FinTech non-users
I generally read the terms and conditions when I sign up for a
new financial product.
I prefer to manage as many aspects of my
life via digital channels as possible.
I worry about the security of my personal data when dealing with
companies online.
I mainly use my smartphone to access financial services
products rather than a desktop computer or laptop.
I like to have someone provide me with advice
about my finances before I make decisions.
I am generally willing to take the most convenient financial services product
even when it is not the cheapest.
71
29
58
38
50
34
69
54
66 6459
54
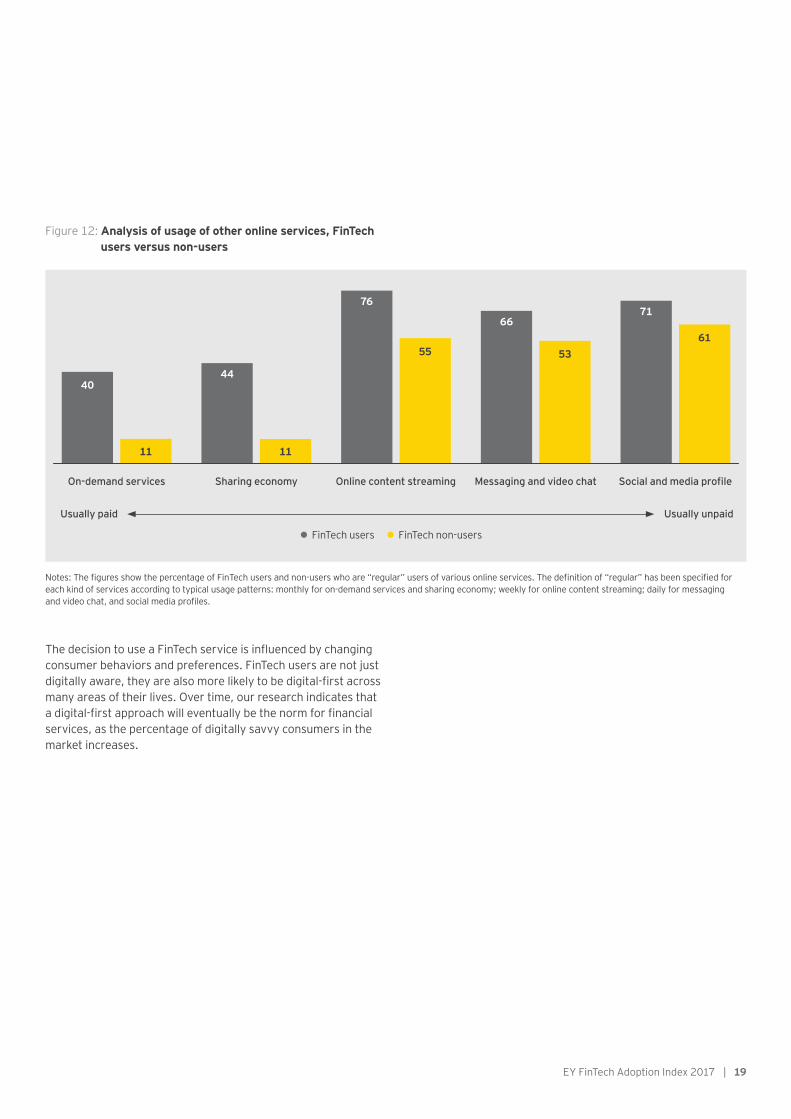
Observation: FinTech users seek a range of other online (especially paid) services.
FinTech users are tech-savvy, and are more likely to use a range of other online services, as seen in figure 12. The largest difference between FinTech users and non-users appears in participation in the sharing economy, such as bike rental and on-demand services, e.g., taxis and online food delivery. FinTech propositions, particularly payments, are often embedded into platforms offering such services. Among FinTech users, 40% regularly use on-demand services and 44% participate in the sharing economy.5 This contrasts with 11% of non-FinTech users for each of these services respectively.
5 We define regular usage in different terms depending on the type of service, including daily use for social network profiles, daily use for messaging and video chat services, weekly use for on-demand services, monthly use for sharing economy services, and monthly use for online content streaming services.
EY FinTech Adoption Index 2017 | 19
On-demand services
Usually paid Usually unpaid
Sharing economy Online content streaming Messaging and video chat Social and media profile
11
55 53
11
Notes: The figures show the percentage of FinTech users and non-users who are “regular” users of various online services. The definition of “regular” has been specified for each kind of services according to typical usage patterns: monthly for on-demand services and sharing economy; weekly for online content streaming; daily for messaging and video chat, and social media profiles.
FinTech users FinTech non-users
40
61
44
6671
76
Figure 12: Analysis of usage of other online services, FinTech users versus non-users
The decision to use a FinTech service is influenced by changing consumer behaviors and preferences. FinTech users are not just digitally aware, they are also more likely to be digital-first across many areas of their lives. Over time, our research indicates that a digital-first approach will eventually be the norm for financial services, as the percentage of digitally savvy consumers in the market increases.
20 | EY FinTech Adoption Index 2017
4. FinTech adoption will continue to gain momentum
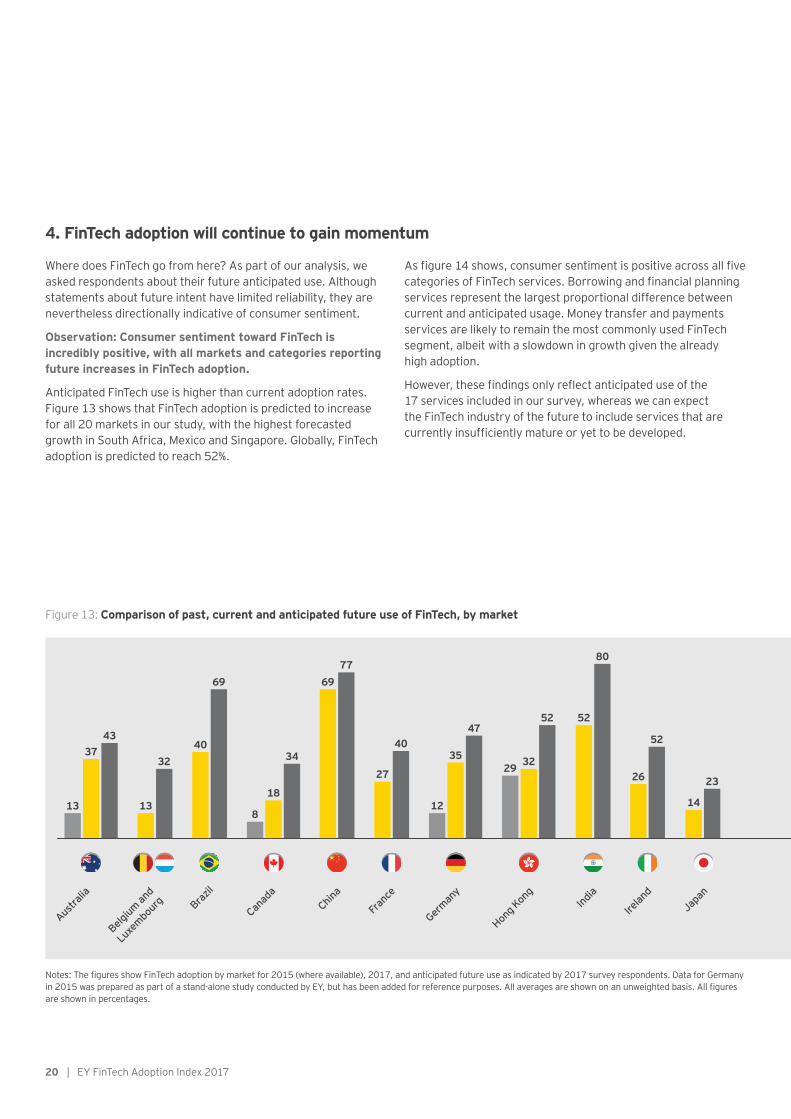
Where does FinTech go from here? As part of our analysis, we asked respondents about their future anticipated use. Although statements about future intent have limited reliability, they are nevertheless directionally indicative of consumer sentiment.
Observation: Consumer sentiment toward FinTech is incredibly positive, with all markets and categories reporting future increases in FinTech adoption.
Anticipated FinTech use is higher than current adoption rates. Figure 13 shows that FinTech adoption is predicted to increase for all 20 markets in our study, with the highest forecasted growth in South Africa, Mexico and Singapore. Globally, FinTech adoption is predicted to reach 52%.
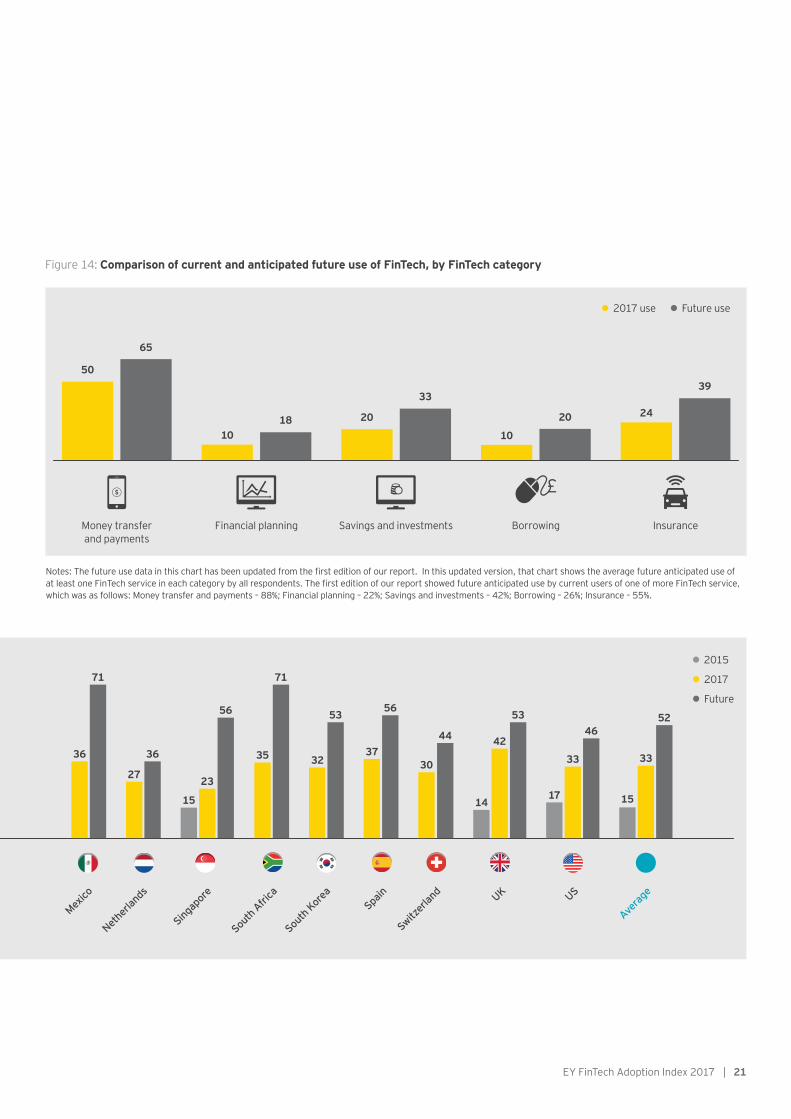
As figure 14 shows, consumer sentiment is positive across all five categories of FinTech services. Borrowing and financial planning services represent the largest proportional difference between current and anticipated usage. Money transfer and payments services are likely to remain the most commonly used FinTech segment, albeit with a slowdown in growth given the already high adoption.
However, these findings only reflect anticipated use of the 17 services included in our survey, whereas we can expect the FinTech industry of the future to include services that are currently insufficiently mature or yet to be developed.
Austra
lia
Belgium
and
Luxe
mbour
g Brazil
Canad
aChin
a
Franc
e
German
y
Hong K
ong
India
Irelan
dJap
an
3732
27
40
12
35
4752
80
26
52
14
2329 32
52
43
13 13
40
69
8
18
34
6977
Notes: The figures show FinTech adoption by market for 2015 (where available), 2017, and anticipated future use as indicated by 2017 survey respondents. Data for Germany in 2015 was prepared as part of a stand-alone study conducted by EY, but has been added for reference purposes. All averages are shown on an unweighted basis. All figures are shown in percentages.
Figure 13: Comparison of past, current and anticipated future use of FinTech, by market
EY FinTech Adoption Index 2017 | 21
Mexico
Nether
lands
Singap
ore
South
Africa
South
Korea
Spain
Switzer
land UK US
Avera
ge
2015
2017
Future
36
71
27
36
15
23
56
35
71
32
53
37
56
30
44
14
42
53
17
33
46
15
33
52
Money transfer and payments
Financial planning Savings and investments Borrowing Insurance
18 20
33
20
65
Notes: The future use data in this chart has been updated from the first edition of our report. In this updated version, that chart shows the average future anticipated use of at least one FinTech service in each category by all respondents. The first edition of our report showed future anticipated use by current users of one of more FinTech service, which was as follows: Money transfer and payments – 88%; Financial planning – 22%; Savings and investments – 42%; Borrowing – 26%; Insurance – 55%.
2017 use Future use
5039
10 10
24
Figure 14: Comparison of current and anticipated future use of FinTech, by FinTech category
22 | EY FinTech Adoption Index 2017
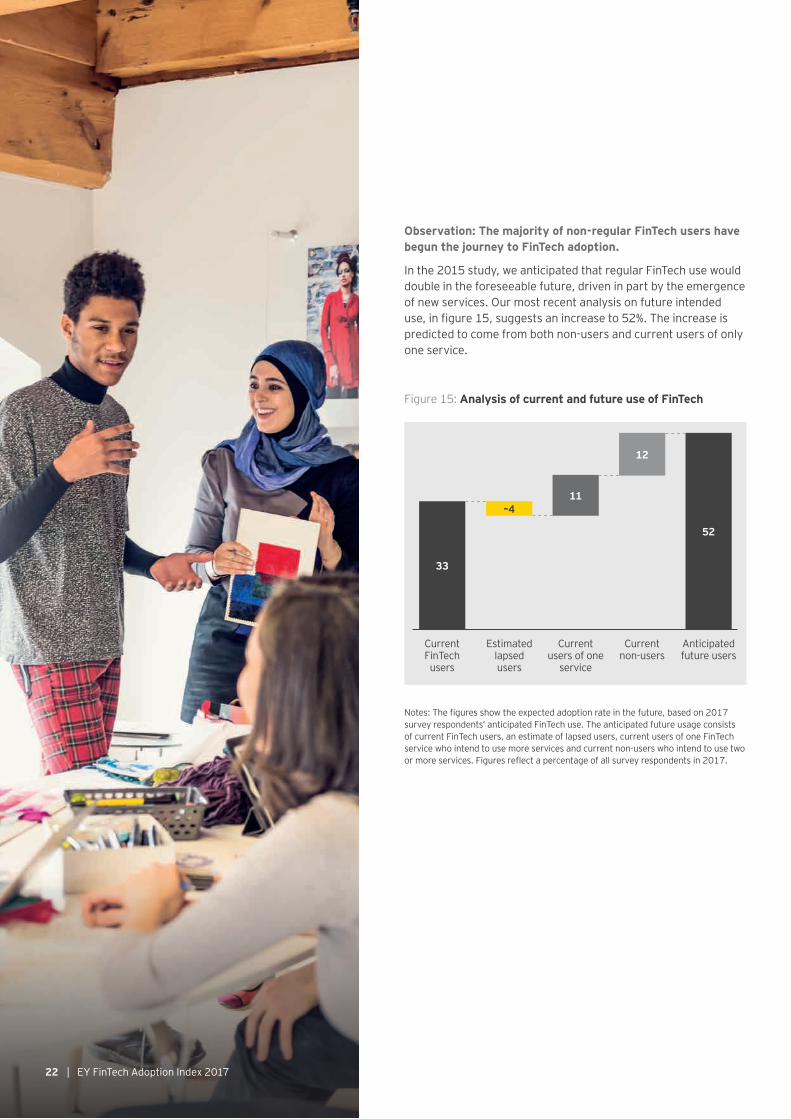
Observation: The majority of non-regular FinTech users have begun the journey to FinTech adoption.
In the 2015 study, we anticipated that regular FinTech use would double in the foreseeable future, driven in part by the emergence of new services. Our most recent analysis on future intended use, in figure 15, suggests an increase to 52%. The increase is predicted to come from both non-users and current users of only one service.
Figure 15: Analysis of current and future use of FinTech
33
52
11
12
–4
Notes: The figures show the expected adoption rate in the future, based on 2017 survey respondents’ anticipated FinTech use. The anticipated future usage consists of current FinTech users, an estimate of lapsed users, current users of one FinTech service who intend to use more services and current non-users who intend to use two or more services. Figures reflect a percentage of all survey respondents in 2017.
Current FinTech users
Estimated lapsed users
Current users of one
service
Current non-users
Anticipated future users
EY FinTech Adoption Index 2017 | 23
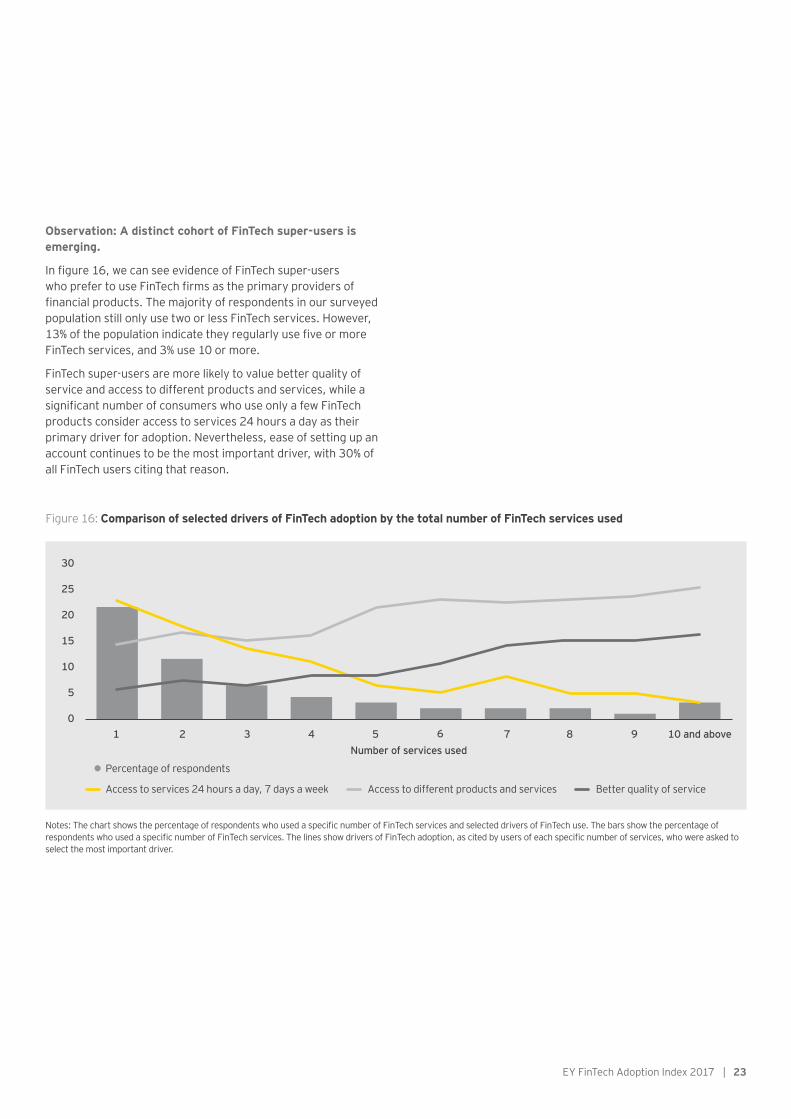
Observation: A distinct cohort of FinTech super-users is emerging.
In figure 16, we can see evidence of FinTech super-users who prefer to use FinTech firms as the primary providers of financial products. The majority of respondents in our surveyed population still only use two or less FinTech services. However, 13% of the population indicate they regularly use five or more FinTech services, and 3% use 10 or more.
FinTech super-users are more likely to value better quality of service and access to different products and services, while a significant number of consumers who use only a few FinTech products consider access to services 24 hours a day as their primary driver for adoption. Nevertheless, ease of setting up an account continues to be the most important driver, with 30% of all FinTech users citing that reason.
Figure 16: Comparison of selected drivers of FinTech adoption by the total number of FinTech services used
Notes: The chart shows the percentage of respondents who used a specific number of FinTech services and selected drivers of FinTech use. The bars show the percentage of respondents who used a specific number of FinTech services. The lines show drivers of FinTech adoption, as cited by users of each specific number of services, who were asked to select the most important driver.
30
25
20
15
10
5
01 62 73 84 95 10 and above
Number of services used
Percentage of respondents
Access to services 24 hours a day, 7 days a week Access to different products and services Better quality of service
24 | EY FinTech Adoption Index 2017
3. Adoption strategies: what really works?
The drivers of success
Low setup costs and plentiful funding make FinTech a fertile area for start-ups. That is the good news. But, in an increasingly crowded marketplace, start-ups must develop services and deploy them effectively in the market before their funding runs out. When it comes to gaining customer traction, we do not believe that there is any consistent recipe for success. Rather, we see a range of drivers that support rapid growth.
As many new FinTech firms are building completely new businesses from the ground up, they have the opportunity to put customer adoption and traction at the heart of their strategy, linked to their singular focus on the customer proposition. In our experience, this means that the DNA of FinTech firms is different from that of incumbent financial services providers, which appeals to those apt to be FinTech users. As FinTech firms mature, their focus on the consumer becomes a key area of competitive strength, alongside their use of technology to reduce costs and accelerate customer traction.
Gaining customer traction is fundamental to growth for any business, but is particularly relevant for FinTech start-ups who rely on it as a key metric for raising investment funds. FinTech firms measure traction initially by registered or active users, moving to customer acquisition cost and unit economics as they develop. It should also be supported by balanced growth across other areas of the business, including suitably robust support functions that develop alongside customer growth, and can manage and mitigate risks.
“ Traction: an idea, product, etc., becoming popular or being accepted” Cambridge Dictionary
EY FinTech Adoption Index 2017 | 25
Business models that drive mass adoption
1. Revolutionize the economics of a market
• Offer a previously paid-for service free of charge Some successful businesses take an established product or service, rethink the economics of the underlying business with the help of digital technologies and offer it to customers free of charge. They are able to develop an alternative business model and revenue streams; for example, new credit-scoring services are often supported by data monetization or through earning commissions from referrals.
• Offer a significantly cheaper service In markets where products are largely similar and customers are highly price sensitive, FinTech firms can achieve significant new customer acquisition if they are able to reduce their costs and leverage technology to maintain this competitive advantage sustainably as they grow. As we have seen in the extremely competitive P2P lending market, digital technologies and automation have been key factors in their success.
2. Create something new and compelling
• Provide a new type of service FinTech firms can offer consumers new services or provide existing services to a new channel to address previously unmet customer needs. This sometimes moves the customer experience so far forward that a service can fulfill customers’ other objectives. For example, a personal current account can become a tool to analyze and manage spending or offer customers the option to invest via equity crowdfunding. However, this strategy may also require significant investment in customer education initiatives.
3. Distribute across an existing customer base
• Solve a problem for another business A FinTech firm could help a more established business to fulfill currently unmet customer needs, such as enabling the established business to offer their customers a better service. Through this route, the established business becomes the FinTech firm’s distributor and the customers of the established business become customers of the FinTech firm. Mobile payment wallets are one example of how an established business may benefit from the FinTech firm’s smoother customer journey.
• Collaborate with businesses that have an existing customer base FinTech firms and other businesses can play to each other’s strengths by offering a new product or expanding an existing product to a new segment. For example, FinTech firms may apply a different set of metrics and risk appetites to writing new loans, enabling a retail bank and a FinTech firm to collaborate on providing mortgages to a previously underserved population. This collaboration can involve a partnership or joint venture, or the FinTech firm may obtain investment from, or be acquired by, the existing business. Regardless, alignment of incentives and effective hand-offs between parties are essential.
26 | EY FinTech Adoption Index 2017
Tools and technologies for accelerating market advantage
1. Build virality or “word of mouth” referrals
• Make customers advocates for the business By offering novel and differentiated experiences, FinTech firms can generate momentum through market visibility. Relationships and trust play a critical role in influencing adoption; endorsements from opinion leaders and community champions are vital. Examples of differentiation that has previously worked include establishing referral programs or offering a free related tool that directs attention to the paid product. Add-ons could include targeted introductory offers or upfront free periods. Particularly effective FinTech firms are those able to reach both online and offline social networks.
2. Establish a strong brand identity
• Ensure customers subscribe to and identify with the brand and mission A FinTech firm may aim to build a distinct identity and establish a group with clear boundaries, designations and behaviors, but not necessarily location. This enables them to capture the entirety of a targeted customer segment rather than aim for mass adoption. This is a popular strategy for FinTech firms focusing on the millennial market, who are attracted to businesses with “purpose” beyond profit, and is facilitated by mobile technology.
3. Focused marketing activity
• Target marketing at customer segments and through tailored selection of channels The ability to understand the marketplace and identify key customer segments is key. Core to this strategy is market research, coupled with marketing approaches, such as traditional and digital advertising placements, search engine optimization, blogs and social media. FinTechs that offer highly personalized user experiences particularly benefit from being able to leverage data and analytics to target their intended audience accurately.
A fundamental shift in technology has lowered the barriers for new businesses to enter and compete in the financial services industry, enabling the arrival of many smaller players looking to partner or compete with existing businesses. Successful FinTech firms have built traction into their business models, which narrows the challenge of balancing product development and revenue generation; the use of technology helps them achieve lower run rates and greater efficiencies. Such businesses are better able to persevere through periods without revenue as they develop a product that fits the market, and unlock the right adoption channels, strategies and tools to obtain user growth and, ultimately, generate revenue.

EY FinTech Adoption Index 2017 | 27
4. Implications in perspective Our findings suggest that FinTech firms are establishing
themselves as significant providers of financial services products, with the greatest traction in banking but also increasingly in insurance and wealth management. They are demonstrating success in innovation, whether as a new business model or a new service and, in the process, are shaping the future of the financial services industry. As a result of the rise of FinTech, we are moving to a world where products are unbundled from full-service incumbent firms and rebundled by wraparound platforms that let consumers manage their finances on the go via mobile, disrupting traditional customer relationships.
With FinTech increasingly in the public eye, consumer jitters about unproven organizations and unfamiliar products are subsiding. Heightened visibility — including coverage from mainstream media, co-branding with incumbent firms, FinTech firms’ own advertising campaigns, and even celebrity endorsements — reduces barriers to awareness and increases understanding. This accelerates uptake of new FinTech solutions that reflect consumers’ expectations and inclination to use digital technologies to manage their finances.
Another important takeaway from our study is that change does not only originate from small start-ups. In fact, some of the biggest FinTech successes to date have been made possible by matching a large corporate’s customer base and distribution capabilities with a FinTech firm’s innovative solution and brand, achieving incredible traction in the market. In the eyes of the consumer, financial services is increasingly blended in with other industry sectors, particularly as open APIs and architectures transform customer journeys and reduce switching costs.
28 | EY FinTech Adoption Index 2017
What does it all mean?
FinTech firms
As our report shows, adoption of FinTech is growing globally. However, despite prominent success stories, the vast majority of FinTech firms are grappling with gaining users, and scaling their operations sustainably. They will undergo continued refinement of the core value proposition, while utilizing strategies that unlock traction, such as those described earlier.
Key to their customer proposition is understanding their customer segment and recognizing how different demographics, be it age, gender or income, respond to FinTech services. Certain customer segments, such as the younger, digitally savvy demographic, have behavioral and attitudinal preferences that make them more likely to become FinTech users. However, some FinTech services, such as using nonbanks to transfer money and insurance price comparison sites, are popular across multiple demographics.
Incumbent financial services firms
FinTech and non-financial services firms represent a threat to incumbent firms’ market shares, revenues and strategic models. However, they also create opportunities for incumbent firms to differentiate themselves and become more competitive. In addition to potential joint ventures, acquisitions and investments into FinTech firms, incumbent financial services firms can learn from or acquire the services of FinTech firms to enhance existing offerings, provide new services, address common customer complaints, and even improve their own operational efficiency.
We see FinTech firms as drivers of technology change within the industry, setting the standard for how the industry will develop, but also acting as potential partners to incumbent firms in the ongoing evolution of this sector. Although the incumbent firms still hold the advantage in many areas, particularly where customer bases and scale are concerned, FinTech firms are growing rapidly and possess strengths, such as nimble processes and newer technology. The movement toward Open Banking and open APIs will only increase the speed of change as FinTech firms have business models and technologies that allow them to align with the new opportunities quickly.
EY FinTech Adoption Index 2017 | 29
The role of collaboration
For each of these groups — FinTech firms, policymakers, incumbent financial institutions and investors — engagement with other players in this fast-evolving ecosystem is essential. The industry stands to benefit from the cross-fertilization of ideas, talent and innovation.
Just as incumbent firms must learn to adopt many of the design elements that make FinTech firms so successful, so FinTech firms have much to benefit from working with established firms as a rapid route to scale. FinTech is a vibrant ecosystem in which all the participants have a vital role to play and, provided they do so, consumers and the industry as a whole will benefit.
Policymakers
Even before our first EY FinTech Adoption Index in 2015, forward-looking regulators were considering FinTech’s potential in supporting policy priorities. For example, the Financial Conduct Authority in the UK had already set up Project Innovate in 2015, which has since inspired similar initiatives in other markets. Policymakers worldwide have launched FinTech ecosystem-boosting initiatives, such as steering groups, task forces and sandboxes, or announced policies to encourage and regulate the FinTech sector, including almost all 20 surveyed markets.
For policymakers in developed markets, FinTech is seen to be a means of encouraging economic activity, improving industry efficiency and providing better services to consumers. New regulations, rather than being perceived as an unwanted burden by FinTech firms, are viewed as an acknowledgement of their legitimacy by the ultimate authorities.
Emerging countries with healthy economies and a growing middle class see the potential for FinTech to meet underserved demand in their markets. They also benefit from a “leapfrog” effect in being able to implement newer technologies without having to address legacy systems. For example, IndiaStack has facilitated cashless payments in a country with limited card penetration. Conversely, less proactive countries may find themselves at a developmental disadvantage over time.
Investors
Notable industry sources observed that FinTech investment in 2016 declined from the levels seen in 2015, despite being supported by a few large fund-raises in China. The reasons for this slowdown are numerous and complex, but include the slowing growth of some high-profile FinTech firms, and wider political and financial uncertainty.
Estimating future levels of global VC investment into FinTech is difficult. However, in addition to reaching the tipping point of mass adoption globally, we also observe the development of distinct strands, such as InsurTech, WealthTech and RegTech, each of which attract different types of investors and levels of investment. For example, FinTech firms in more mature subsectors, such as money transfer and payments services, may already demonstrate increased revenue and profits, inducing non-venture investment to enter this space.

30 | EY FinTech Adoption Index 2017
5. FinTech in action: the case studies
EY FinTech Adoption Index 2017 | 31
George Lucas, Founder and CEO
For start-ups, gaining traction with retail customers isn’t easy, but it helps if you have a great product with a value proposition that is easy to communicate. Our pre-launch public relations (PR) campaign generated huge interest within Australia, leading to 26,000 prelaunch registrations against a target of 5,000. When the app was officially launched, it achieved 50,000 downloads in just three weeks, smashing its six-month target.
The PR campaign began with an announcement of the app’s launch in Australia. We researched the savings habits of Australians, documenting behavioral and social changes related to wealth and finance, while introducing Acorns as an alternative to tried and tested methods of investment.
Our PR agency identified the most influential technology and finance journalists, and ensured that they knew about the key points of Acorns’ journey into the Australian market. This created a steady flow of media coverage linked to the Acorns business strategy. We took the Acorns story to mainstream media by identifying and building stories from an insight that most Australians can identify with: the struggle of not being able to save adequately for the future.
We also worked with independent technology and finance experts who endorsed the app and how it removes traditional barriers to investment, such as high costs or fees and in-depth knowledge of the financial sector.
So, even though it’s easier said than done, the best thing to do is to build a product that resonates clearly with people’s needs. Once you have that, early adopters will recommend it to their friends and, in today’s environment, you can quickly get viral growth through word of mouth.
You can use all the complex marketing techniques you want but, in the end, there is no substitute for a product that people want in their lives, without you having to tell them.
To demonstrate how traction journeys differ, we have included case studies of FinTech firms that have achieved impressive traction or are applying an innovative approach through a combination of business models, tools and technologies.
Acorns AustraliaYear launched: 2016
Geographical presence: Australia
Current traction: 240,000 users
Australia
32 | EY FinTech Adoption Index 2017
Eric Jing, CEO
Ant Financial originated from Alipay, one of the world’s largest payment platforms.
We believe in the power of tech and, by using it well, we can bring the world equal opportunities — for those underserved or unserved by traditional financial services. By working closely with our financial and strategic partners around the world, we aim to bring equal access in financial services to more than two billion people in 10 years.
Ant Financial is building an open ecosystem, enabling traditional financial institutions to provide services in a more efficient way. We believe financial services should be simple, low cost and accessible; our technologies, such as cloud computing and big data analytics, make us uniquely placed to achieve this.
We leverage our technological capabilities to provide underserved or unserved small and micro businesses and individual consumers with a wide range of financial services, including payments, micro loans, insurance and credit assessment services. More than 200 million Alipay users have signed up for Sesame Credit, a credit scoring service that provides high-scoring users with conveniences, such as deposit-free bicycle and car rentals, and card-free hotel check-in. More than 60% of Ant Credit Pay, or Huabei, users do not own a traditional credit card.
On the payments front, Alipay enables groundbreaking numbers of transactions through technology. During the 2016 Global Shopping Festival, China’s equivalent of Cyber Monday, Alipay processed 1.05 billion transactions in 24 hours, reaching up to 120,000 transactions per second.
Ant Financial is not only looking at the Chinese mainland market; we also want to share our tech know-how with our global partners in countries such as India, Thailand, Korea, the Philippines and Indonesia. We are currently providing services to more than 670 million users around the world.
Ant FinancialYear launched: 2014
Geographical presence: HQ in China; services offered globally
Current traction: 670 million total users globally, including 450 million Alipay users, 300 million Yu’e Bao users and 200 million Sesame Credit users
China

EY FinTech Adoption Index 2017 | 33
Justin Basini, Founder and CEO
Building a company that you believe in is a huge privilege. To choose the people you work with, to create a space where you can play, laugh, cry and work together is amazing.
I’ve learnt over the years that for propositions to tip into the mass market, they need to be incredibly simple: even an elevator pitch is too complex. Ideally, propositions should be under 10 words. ClearScore’s proposition is, “Your credit report and score, for free, forever.”
This simplicity then needs magnification. Most new companies don’t have the confidence to go to mass marketing based on test data, but there are ways to limit the risk and get the learning that you need to optimize. We didn’t bother with traditional start-up marketing, such as social media and search engine optimization; instead, we went straight to TV. This is still the best way to accelerate a winning proposition and gain scale fast. It requires courage and, of course, money to invest, but it pays huge returns if you get it right.
Of course, sacrifices have to be made. Success demands the hardest work of your life; the risks are considerable and constantly changing, especially as the business grows. But is it worth it? The answer is, emphatically, yes.
ClearScoreYear launched: 2015
Geographical presence: UK
Current traction: 4.7 million users
UK

34 | EY FinTech Adoption Index 2017
Gregory Gibb, Founder and CEO
Lufax started in 2011 as a P2P platform and has since diversified into an open platform. We faced competition from several fronts: technology platforms have the “tech,” as well as large customer bases from their e-commerce or chat platforms, while traditional banks have the “fin” as well as existing deposit bases. I believe Lufax is the first platform that combines the “fin” with the “tech.”
Gaining traction and achieving customer adoption means different things at different stages of a start-up. Initially, it pays to be more focused: to have one thing that hits the pain point of customers and attracts them to the platform.
For Lufax, it was P2P, and having Ping An’s brand and support at the beginning was crucial in gaining customer comfort and true traction. Customers trusted the Ping An brand, which helped to build our own brand. The partnership also helped us manage risk, at both the borrower and investor end.
Once we became the largest P2P player, we realized that the market size would be limited if we only offered one product. Chinese people like to save, so retail demand for good investments is almost unlimited, but quality assets for retail investors are still in short supply. To serve our customers better, we diversified, becoming a truly open platform with more than 3,000 products, including mutual funds, insurance and fixed income products.
As an online platform, we do not have thousands of branch personnel to answer customer questions. We needed to ensure customers were not overwhelmed with our product offerings, and could find the right product to build the optimal portfolio. We spent a lot of energy on getting to know our customers and products, using technology to categorize both and match the right products to the right customers. We have also begun suggesting products to our investors. This ability to match the right products with the right customers, at low cost, creates sustainability.
LufaxYear launched: 2011
Geographical presence: China
Current traction: 30 million users
China
EY FinTech Adoption Index 2017 | 35
David Vélez, Founder and CEO
As the first digital and branchless credit card company in Brazil, we attract customers who prefer mobile interfaces to manage their finances. Users have a round-the-clock customer experience team via chat, email and phone, as well as Twitter and Facebook. They use the app to manage their cards, pay bills and review transactions in real time.
When I came to Brazil, all I heard was that I couldn’t start this type of business here, the big banks wouldn’t allow it and the regulation was too complicated. Thirty different market specialists all said, “Forget it, you are a foreigner and you just don’t understand.”
We built Nubank despite all conventional wisdom, in the midst of Brazil’s worst economic crisis. Today, more than nine million people have applied for a Nubank card, and we have half a million wait-listed for one.
Our technology stack was developed entirely in-house. It is one of our competitive advantages, enabling us to build features and services that are core to the customer’s experience, such as platforms for underwriting and credit limit decisions, and tools for metrics and customer service.
Growth has come without significant investment in marketing. Since launching in 2014, 60% of our new account applications have come from customer referrals in-app. One of the reasons for our viral growth is our exceptional customer service, which has attracted social media and press attention. Our customer service analysts have complete autonomy to surprise clients with a personalized experience at any given opportunity. In one case, a single surprised customer shared their experience with Nubank on social media and reached more than 1.5 million people.
We created the waiting list in order to maintain a controlled growth strategy while the company’s credit models improved. Meanwhile, our data scientists have built a proprietary underwriting model that optimizes customer acquisition, enabling us to bring in healthier and more profitable customers, as well as making more educated decisions on customer credit limits.
NubankYear launched: 2013
Geographical presence: Brazil
Current traction: 1 million users
Brazil
36 | EY FinTech Adoption Index 2017
PayPalYear launched: 1998
Geographical presence: Headquartered in USA; services offered in 200 markets globally
Current traction: 203 million users (including 16 million merchant accounts)
Bill Ready, COO
For nearly 20 years, PayPal has empowered people and businesses to send and receive digital payments. With US$354 billion in transactions last year, it is one of the largest distribution channels for digital commerce in the world.
PayPal is uniquely positioned to solve issues that others cannot. Because we operate a two-sided platform and have deep, trusted relationships with both consumers and merchants, customer acquisition means something very different at PayPal. We can deliver a unique value proposition to both consumers and merchants as they connect in new contexts such as mobile and social media.
As commerce moves into a new area of complexity with an ever-evolving array of channels, managing the end-to-end journey of the customer is increasingly challenging. At PayPal, all our efforts work toward one simple, central premise: be a customer champion. That’s our North Star as a company. Being a customer champion means constantly re-examining and potentially disrupting our business to improve customer experience on our platform. And it means continually investing to ensure that we are enabling our customers to take full advantage of the digital and mobile economy.
The rapid adoption of mobile technology is redefining the face of retail and creating new opportunities to bring consumers and merchants closer together. PayPal drives the industry forward by offering a seamless mobile commerce experience across multiple channels, and connecting consumers and merchants at the point of discovery.
Our mobile-first P2P and remittances services bring new customers to our platform, and to digital payments in general, while driving low-cost funds into our ecosystem. As money continues to digitize and mobile technologies proliferate, our range of products will be a key tenet of our customer acquisition efforts.
Driven by our mobile leadership, PayPal has also been able to sign and extend strategic partnerships with leading financial institutions, technology companies, mobile carriers and e-commerce marketplaces. These partnerships extend our ability to deliver new and better user experiences and increase engagement.
US

EY FinTech Adoption Index 2017 | 37
Nithin Kamath, Founder and CEO
Zerodha was the first brokerage firm in India to disrupt the existing pricing structure by introducing a flat fee of INR20 per trade and zero fees on equity investments. Growing at over 100% year on year, Zerodha currently has more than 300,000 clients and contributes to 5% of daily retail trading volumes across all the stock, commodity and currency exchanges in India.
We started in 2010 with the idea that, unlike traditional broking firms, we will keep our operations online and pass back the benefits of lower costs to our clients. But we always knew that low-cost services without great quality products don’t really succeed. The transition from being a brokerage firm to a financial technology firm happened around 2014.
We approach trading with breakthrough technology initiatives, such as our back-office tool Q, our desktop trading tool Pi, and India’s first, multilingual online trading platform KITE, and direct mutual fund and equity platform COIN.
This gave us the edge to become one of the biggest brokerage firms in India, in terms of retail trading turnover on exchanges. We are now focusing on the greater challenge of how to grow the very shallow retail participation in the capital markets in India. We aspire to be the catalyst for change that will attract much more than the current 0.5% of the Indian population yearly to the equity markets.
The main ideology behind the business remains to stay completely online, offering fast and reliable trading platforms, and providing excellent support to our clients. Our business has grown by word of mouth, which helps build credibility, and we have incentivized users to refer people by sharing 10% of the brokerage generated with them.
Today, only 1%–2% of Indians trade; our biggest opportunity, and challenge, lies in bringing the next 5 to 10 million traders online. With that in mind, we have launched various educational initiatives such as Varsity, Z-Connect, and Trading QnA. Varsity alone gets more than 100,000 page views per month, with the audience growing at a rate of 30% every month; it’s free, open to all and easy to understand.
ZerodhaYear launched: 2010
Geographical presence: India and Southeast Asia
Current traction: 300,000 customers
India

38 | EY FinTech Adoption Index 2017
6. Appendix
Methodology
We undertook this study to provide a global point of view on where FinTech is gaining traction. Our study considers the types of consumers who use FinTech on a regular basis, and the drivers and barriers to using FinTech.
Our definition of a FinTech user is an individual who has used two or more FinTech services in the last six months. This implies repeated exposure to, and willingness to use, FinTech products and services on a regular basis, while discounting individuals who may have tried a FinTech product once or used the same service from several providers.
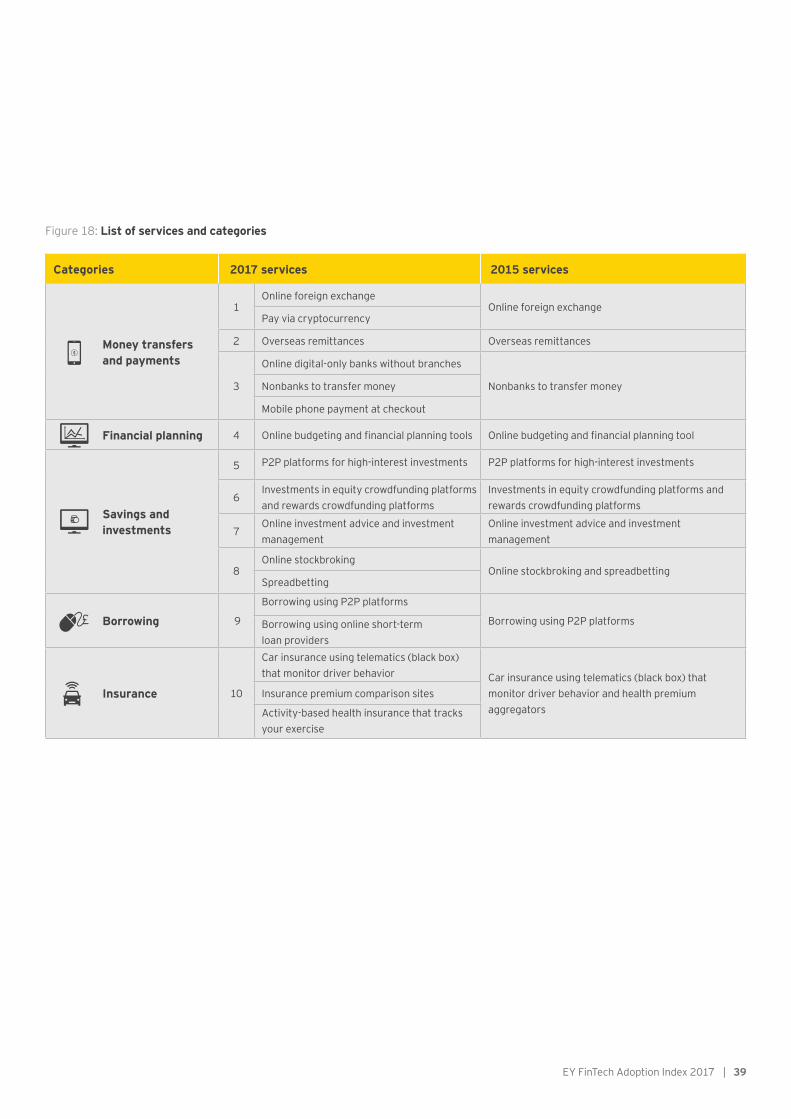
The EY FinTech Adoption Index considers 17 FinTech services in 2017, compared with 10 in 2015. In order to improve comparability of results and to reduce the impact of similar propositions within the enhanced list of services, we applied a grouping methodology to align the two sets of analysis. We retained the same five broad categories: money transfer and payments, financial planning, savings and investments, borrowing, and insurance.
EY FinTech Adoption Index 2017 | 39
Categories 2017 services 2015 services
Money transfers and payments
1 Online foreign exchange
Online foreign exchangePay via cryptocurrency
2 Overseas remittances Overseas remittances
3
Online digital-only banks without branches
Nonbanks to transfer moneyNonbanks to transfer money
Mobile phone payment at checkout
Financial planning 4 Online budgeting and financial planning tools Online budgeting and financial planning tool
Savings and investments
5 P2P platforms for high-interest investments P2P platforms for high-interest investments
6Investments in equity crowdfunding platforms and rewards crowdfunding platforms
Investments in equity crowdfunding platforms and rewards crowdfunding platforms
7Online investment advice and investment management
Online investment advice and investment management
8Online stockbroking
Online stockbroking and spreadbettingSpreadbetting
Borrowing 9
Borrowing using P2P platforms
Borrowing using P2P platformsBorrowing using online short-term loan providers
Insurance 10
Car insurance using telematics (black box) that monitor driver behavior Car insurance using telematics (black box) that
monitor driver behavior and health premium aggregators
Insurance premium comparison sites
Activity-based health insurance that tracks your exercise
Figure 18: List of services and categories
40 | EY FinTech Adoption Index 2017
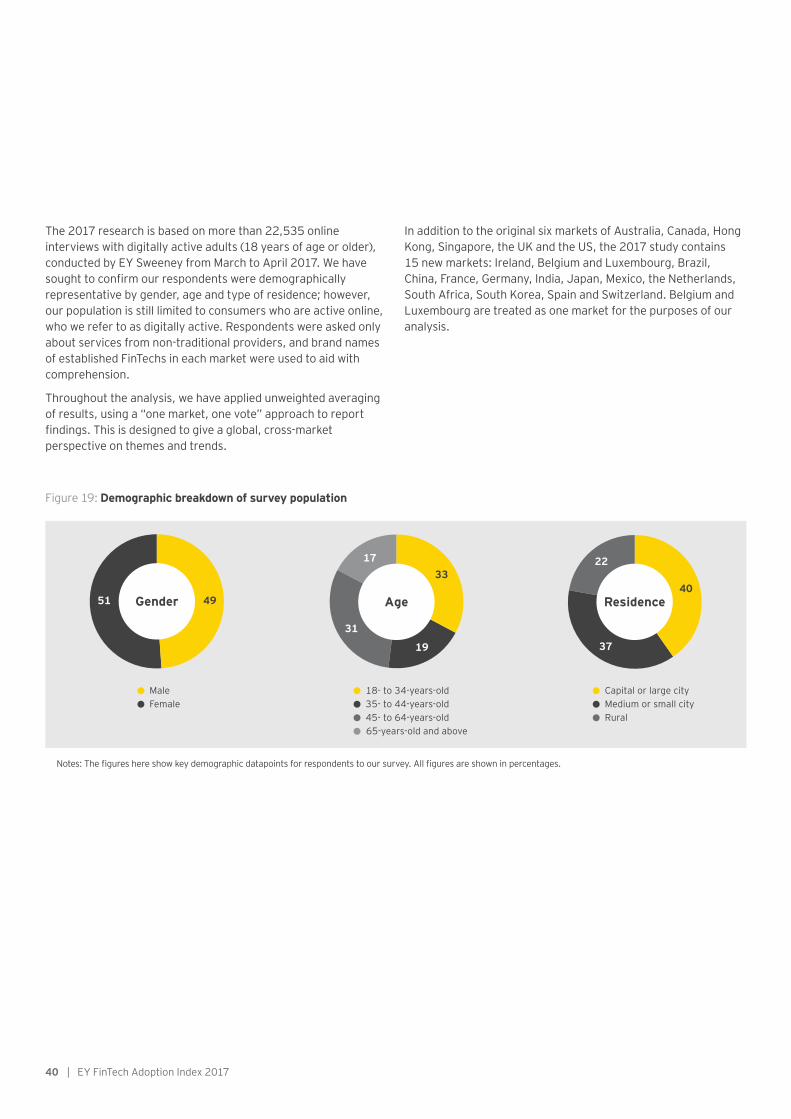
The 2017 research is based on more than 22,535 online interviews with digitally active adults (18 years of age or older), conducted by EY Sweeney from March to April 2017. We have sought to confirm our respondents were demographically representative by gender, age and type of residence; however, our population is still limited to consumers who are active online, who we refer to as digitally active. Respondents were asked only about services from non-traditional providers, and brand names of established FinTechs in each market were used to aid with comprehension.
Throughout the analysis, we have applied unweighted averaging of results, using a “one market, one vote” approach to report findings. This is designed to give a global, cross-market perspective on themes and trends.
In addition to the original six markets of Australia, Canada, Hong Kong, Singapore, the UK and the US, the 2017 study contains 15 new markets: Ireland, Belgium and Luxembourg, Brazil, China, France, Germany, India, Japan, Mexico, the Netherlands, South Africa, South Korea, Spain and Switzerland. Belgium and Luxembourg are treated as one market for the purposes of our analysis.
Figure 19: Demographic breakdown of survey population
Notes: The figures here show key demographic datapoints for respondents to our survey. All figures are shown in percentages.
EY FinTech Adoption Index 2017 | 41
Imran Gulamhuseinwala OBE
Matt Hatch
James Lloyd
Tom Bull
Sharon Chen
Global & Europe, Middle East, India and Africa FinTech LeaderLondonErnst & Young [email protected]+44 20 7980 9563
Americas FinTech LeaderSan FranciscoErnst & Young [email protected]+1 415 894 8219
Asia-Pacific FinTech LeaderHong Kong SAR of ChinaErnst & Young Transactions [email protected]+852 9666 4747
FinTech Adoption Index LeaderLondonErnst & Young [email protected]+44 20 7951 3375
FinTech Adoption Index AuthorLondonErnst & Young [email protected]+44 20 7760 9428
Contacts
For further information, please contact:
EY FinTech Leadership EY FinTech Adoption Index
42 | EY FinTech Adoption Index 2017
AustraliaRowan Macdonald [email protected]
Belgium Yannick Gré[email protected]
Brazil Francisco [email protected]
Canada Ron Stokes [email protected]
China Henry B [email protected]
France Thierry [email protected]
GermanyChristopher [email protected]
Hong Kong SAR of ChinaJames [email protected]
India Mahesh [email protected]
IrelandJonathan [email protected]
JapanKazuhiro [email protected]
LuxembourgGaël [email protected]
MexicoGonzalo Nuñ[email protected]
NetherlandsLisette [email protected]
SingaporeVarun Mittal [email protected]
South AfricaAshwin [email protected]
South KoreaYoung-Suk Kim [email protected]
Spain Luis Manuel Saiz [email protected]
SwitzerlandBernhard [email protected]
UKImran [email protected]
USMatt [email protected]
EY FinTech Global Network


EY | Assurance | Tax | Transactions | Advisory
About EYEY is a global leader in assurance, tax, transaction and advisory services. The insights and quality services we deliver help build trust and confidence in the capital markets and in economies the world over. We develop outstanding leaders who team to deliver on our promises to all of our stakeholders. In so doing, we play a critical role in building a better working world for our people, for our clients and for our communities.
EY refers to the global organization, and may refer to one or more, of the member firms of Ernst & Young Global Limited, each of which is a separate legal entity. Ernst & Young Global Limited, a UK company limited by guarantee, does not provide services to clients. For more information about our organization, please visit ey.com.
© 2017 EYGM Limited.All Rights Reserved.
EYG no. 03893-174GblED 0619
This material has been prepared for general informational purposes only and is not intended to be relied upon as accounting, tax or other professional advice. Please refer to your advisors for specific advice.
The views of third parties set out in this publication are not necessarily the views of the global EY organization or its member firms. Moreover, they should be seen in the context of the time they were made.
ey.com/fs