epidemic exposure, fintech adoption, and the digital divide
TRANSCRIPT
Epidemic Exposure, Fintech Adoption,
and the Digital Divide
Orkun Saka ⓡ, Barry Eichengreen ⓡ, and Cevat Giray Aksoy
Abstract
We ask whether epidemic exposure leads to a shift in financial technology usage within and across countries and if so who participates in this shift. We exploit a dataset combining Gallup World Polls and Global Findex surveys for some 250,000 individuals in 140 countries, merging them with information on the incidence of epidemics and local 3G internet infrastructure. Epidemic exposure is associated with an increase in remote-access (online/mobile) banking and substitution from bank branch-based to ATM-based activity. Using a machine-learning algorithm, we show that heterogeneity in this response centers on the age, income and employment of respondents. Young, high-income earners in full-time employment have the greatest propensity to shift to online/mobile transactions in response to epidemics. These effects are larger for individuals in subnational regions with better ex ante 3G signal coverage, highlighting the role of the digital divide in adaption to new technologies necessitated by adverse external shocks.
Keywords: epidemics; fintech; banking JEL classification: G20, G59, I10.
Contact details: Cevat Giray Aksoy, One Exchange Square, London EC2A 2JN, UK. [email protected]
Aksoy is a Principal Economist at the European Bank for Reconstruction and Development (EBRD), Assistant Professor of Economics at King's College London and Research Associate at IZA Institute of Labour Economics. Eichengreen is a Professor of Economics and Political Science at the University of California, Berkeley, Research Associate at the National Bureau of Economic Research and Research Fellow at the Centre for Economic Policy Research. Saka is an Assistant Professor at the University of Sussex, Visiting Fellow at the London School of Economics, Research Associate at the STICERD & Systemic Risk Centre and Research Affiliate at CESifo.
ⓡ All authors contributed equally to this manuscript and the order of author names is randomized via AEA
Randomization Tool (code: AuWT141 jCPw). We are grateful to seminar participants at Webinar series in Finance and Development (WEFIDEV) and 2nd LTI@UniTO/Bank of Italy Conference on "Long-Term Investors' Trends: Theory and Practice" as well as Carol Alexander, Ralph De Haas, Jonathan Fu, Thomas Lambert, Xiang Li and Enrico Sette (discussant) for their useful comments and suggestions. Leon Bost, Franco Malpassi, and Pablo Zarate provided outstanding research assistance. Views presented are those of the authors and not necessarily those of the EBRD. All interpretations, errors, and omissions are our own.
The working paper series has been produced to stimulate debate on the economic transformation development. Views presented are those of the authors and not necessarily of the EBRD.
Working Paper No. 257 Prepared in July 2021
1. Introduction
Epidemics are frequently cited as inducing changes in economic behavior and accelerating
technological and behavioral trends. The Black Death, the mother of all epidemics, is thought
to have sped the adoption of earlier capital-intensive agricultural technologies such as the
heavy plow and water mill by inducing substitution of capital for more expensive labor
(Senn, 2003; Pelham, 2017). COVID-19, to take a rather more recent example, is said to
have increased remote working (Brenan, 2020), online shopping (Grashuis, Skevas, and
Segovia, 2020), and telehealth (Richardson, Aissat, Williams, Fahy, et al., 2020).
But there may be important differences across socioeconomic groups in ability to uti-
lize such new technologies.1 In the case of COVID, high-tech workers and workers in the
professions have been better able to shift to remote work, compared to store clerks, custodi-
ans and other less well-paid individuals (Saad and Jones, 2021). Women have had more
difficulty than men capitalizing on opportunities to work remotely, given the occupations
in which they are specialized (Coury, Huang, Kumar, Prince, Krikovich, and Yee,
2020). Individuals older than 65, being less technologically adaptable than the young, often
find it more difficult to adjust to new work modalities (Farrell, 2020). Small firms with
limited technological capabilities have been less able to adapt their business models and stay
competitive than their larger rivals, while residents of areas with limited broadband have
experienced less scope for moving to remote work, remote schooling and telehealth (Chiou
and Tucker, 2020; Georgieva, 2020; Ramsetty and Adams, 2020). COVID-19, it
is said, has accelerated ongoing trends (OECD, 2020; Citigroup, 2020). If the increas-
ing prevalence of the so-called digital divide was an ongoing trend before COVID, then the
pandemic may have accelerated this one in particular.
We study these issues in the context of fintech adoption. Specifically, we ask whether past
epidemics induced a shift toward new financial technologies such as online banking and away
from traditional brick-and-mortar bank branches. We combine data on epidemics worldwide
with nationally representative Global Findex surveys of individual financial behavior fielded
in more than 140 countries in 2011, 2014 and 2017. The novelty comes from our ability to
match each individual in Global Findex dataset to detailed background information about
the same individual in Gallup World Polls. This allows us to control for socioeconomic
factors at the most granular level possible.
Holding constant individual-level economic and demographic characteristics and country
and year fixed effects, we find that contemporaneous epidemic exposure significantly increases
1Thus, to continue with the case of the Black Death, Alesina, Giuliano, and Nunn (2011) arguethat the plough, which requires strength and eliminates the need for weeding, favored male relative to femalelabor and generated a preference for fewer children, ultimately reducing fertility.
1
the likelihood that individuals transact via the internet and mobile bank accounts, make
online payments using the internet, and complete account transactions using an ATM instead
of a bank branch. Separate impacts on ATM and in-branch transactions almost exactly offset.
This suggests that epidemic exposure mainly affects the form of banking activity – digital
or in person – without also increasing or reducing its volume or extent as illustrated later
by the placebo questions that we exploit. While the limited time span covered by our data
allows for only a tentative analysis of persistence, our results suggest that the impact of
epidemic exposure is felt mainly in the short run rather than enduringly over time.
Extensive sensitivity analysis supports these findings. Our results continue to obtain
when we adjust for the fact that we consider multiple outcomes (Anderson, 2008). A
test following Oster (2019) confirms that our treatment effects are unlikely to be driven
by omitted factors. We document the existence of parallel trends before epidemic events,
present balance tests across epidemic and non-epidemic countries, report null effects on
placebo outcomes, analyze epidemic intensity, implement alternative clustering techniques
for standard errors, control for country-specific time trends, drop influential treatment ob-
servations from the sample, and randomize treatment countries and/or years. None of these
extensions qualitatively changes our interpretations.
Using the data-driven approach suggested by Athey and Imbens (2016), we then go
on to identify the critical dimensions in the heterogeneity of our treatment effects. These
turn out to be individual income, employment and age. It is mainly the young, high-
income earners in full-time employment who take up online/mobile transactions in response
to epidemics, in other words. These patterns are consistent with previous research on early
adopters of other digital technologies (Chau and Hui, 1998; Dedehayir, Ortt, Riverola,
and Miralles, 2017).
Last but not least, we highlight the importance of the digital divide by investigating the
role of local internet infrastructure in conditioning the shift toward online banking. We match
1km-by-1km time-varying data on global 3G internet coverage from Collins Bartholomew’s
Mobile Coverage Explorer to the sub-national region in which each individual is located. We
find that individuals with better ex ante internet coverage are more likely to shift toward
online banking in response to an epidemic. This finding still obtains when we employ a spec-
ification with country-by-year fixed effects that absorb all types of country-level variation in
our sample, including the incidence of epidemics. Importantly, we fail to find any consistent
effect for gsm (i.e., 2G) coverage when this variable is included in the estimation side by side
with our 3G measure, confirming our intuition that the relevant technology for the epidemic
response is related to the internet and not to the overall mobile phone usage.
In sum, we find strong evidence of epidemic-induced changes in economic and financial
2
behavior, of differences in the extent of such shifts by more and less economically advantaged
individuals, and of a role for IT infrastructure in spreading or limiting the benefits of tech-
nological alternatives. The results thus highlight both the behavioral response to epidemics
and the digital divide.
Online and mobile banking is a particularly informative context for studying the broader
question of whether past epidemics induced the adoption of new technologies and, if so, by
whom and where. Individuals in a variety of different countries and settings have available
banking options that involve both in-person contact (such as banking via tellers in bank
branches of a sort that may be problematic during an epidemic) and digital alternatives (such
as banking via the internet or mobile phone app); these alternatives have been available for
some time. Analogous studies of telehealth would face the obstacle that physicians’ offices in
many countries and settings did not, at the time of epidemic exposure, possess the capacity
to provide such services remotely. Similarly, studies of remote schooling in the context of
past epidemics would be limited by the fact that few schools and homes had available a
flexible video conferencing technology, such as Zoom, much less the reliable internet needed
to operate it.
The case of banking is different, in that the diffusion and adoption of online and mobile
banking have been underway since the 1990s. Individuals have been using their computers
and smartphones for banking applications for years. Thus, insofar as epidemic exposure
induces significant and/or persistent changes in individual behavior, these are likely to be
more evident in this context than others.
The paper is organized as follows. Section 2 reviews the related literature. Sections 3
and 4 then describe our data and empirical strategy. Section 5 presents the main results,
including for within-sample heterogeneity and persistence of the effects. Section 6 focuses
on the role of infrastructure (3G coverage). Section 7 summarizes our additional robustness
checks, after which Section 8 concludes. The appendix (available online) presents further
detail on our data and additional empirical results.
2. Related Literature
Our paper is related to several literatures. First, there is a substantial literature on the im-
pact of digital technologies on financial behavior. For example, D’Andrea and Limodio
(2019) analyze the staggered rollout of fiber-optic submarine cables and associated access to
high-speed internet in Africa. They show that access to high-speed internet promoted more
efficient liquidity management by banks due to enhanced access to the interbank market,
resulting in more lending to the private sector and greater use of credit by firms. Mu-
3
ralidharan, Niehaus, and Sukhtankar (2016) and Aker, Boumnijel, McClelland,
and Tierney (2016) find that biometric smart cards and mobile money systems facilitate
the efforts of governments to provide employment and pension benefits. Bachas, Gertler,
Higgins, and Seira (2018) find that debit cards, by reducing the difficulty of accessing
and utilizing bank services, foster financial inclusion. Callen, De Mel, McIntosh, and
Woodruff (2019) show that the availability of mobile point-of-service terminals improves
formal savings options, in turn alleviating extreme poverty, encouraging self-employment,
and raising market wages. Jack and Suri (2014) similarly find that access to mobile
money enhances risk-sharing and smooths consumption, in their context by improving access
to remittances. Digital payments that connect individuals with banks, employees, and sup-
pliers encourage entrepreneurship (Klapper, 2017), while the ability to conduct financial
transactions by mobile phone reduces urban-rural inequality by facilitating money trans-
fer between urban and rural members of extended families (Lee, Morduch, Ravindran,
Shonchoy, and Zaman, 2021). We contribute to this literature by showing that when
social distancing becomes a necessity, access to digital financial technology helps individuals
to continue their financial activities by switching from face-to-face to remote-access options.
In this context, a sub-literature focuses on differential adoption of online, mobile and e-
banking. Some studies examine the role of social influences, such as the practices of friends
and family (Al-Somali, Gholami, and Clegg, 2009; Baptista and Oliveira, 2015;
Tarhini, El-Masri, Ali, and Serrano, 2016). Chen, Doerr, Frost, Gambacorta,
and Shin (2021) identify a pervasive male-female gap in fintech adoption, pointing to
social norms, as well as possible differences in preferences and gender-based discrimination,
as potential explanations for slower adoption by women. Other studies focus on individuals’
levels of trust, defined as the belief that others will not behave opportunistically in the
digital sphere (Gu, Lee, and Suh, 2009). Finally, studies such as Breza, Kanz, and
Klapper (2020) and Klapper (2020) find that information about the utility and security
of online and mobile banking, obtained via first-hand experience or independent sources, is
conducive to wider utilization. Our paper adds to this literature by showing how national
health emergencies shape usage of such technologies, and by documenting the existence of
digital divides between certain economic and demographic subgroups, defined by age, income
and employment.
A number of recent papers study the take-up and effects of financial technologies in the
context of COVID-19. Kwan, Lin, Pursiainen, and Tai (2021) examine the relationship
between banks’ IT capacity and their ability to serve customers during the recent pandemic;
using U.S. data, they show that banks with better IT capabilities saw larger reductions in
physical branch visits and larger increases in website traffic, consistent with a shift to digital
4
banking. In addition, they find that banks possessing more advanced IT originated more
small business Paycheck Protection Program (PPP) loans. Core and De Marco (2021)
examine small business lending in Italy during COVID-19, and similarly find that banks
with more sophisticated IT were better able to distribute government-guaranteed loans.
Erel and Liebersohn (2020), again in the context of PPP lending, find that borrowers
obtained these loans primarily from banks in zip codes with more bank branches, higher
incomes and smaller minority shares of the population, but from non-traditional fintechs
in places with fewer banks, lower incomes and more minorities. Comparing zip codes with
more and fewer bank branches, they find limited substitution from fintech to bank borrowing,
as if fintech presence leads mainly to an increase in the overall supply of financial services
(greater financial inclusion), as distinct from reallocation from banks to fintechs. Fu and
Mishra (2020) show that the COVID-19 virus and government-ordered lockdowns increased
downloads of banking-related apps. We extend these findings to past epidemics and a larger
set of countries, as well as providing evidence not just for the adoption of new technologies
but also for the abandonment of old ones (i.e., reduced bank branch usage relative to ATMs).
Finally, there is the literature on the digital divide. WorldBank (2016) emphasizes
that the benefits of new digital technologies are unevenly distributed owing to lack of high-
speed internet in developing regions and countries. In the context of COVID-19, Chiou and
Tucker (2020) show that the availability of high-speed internet significantly affected the
ability of individuals to self-isolate during the pandemic. UNCTAD (2020) documents that
lack of internet access limits scope for shifting to remote schooling in developing countries;
McKenzie (2021) finds similar patterns for underserved areas in the United States. We
contribute to this literature by showing that lack of 3G coverage slowed the adoption of
online and mobile financial technologies in response to epidemic outbreaks between 2011
and 2017.
3. Data
Our analysis combines data from several sources. First, we use Findex to measure financial
behavior in more than 140 countries. Second, Gallup World Polls (GWP) provide data on
household characteristics, income, and financial situation. We merge Findex with GWP
using individual identifiers, giving us household-level data on financial technology adoption
and its correlates. We use the epidemic dataset of Ma et al. (2020) to determine whether
a country experienced an epidemic in a given year. We complement these data with infor-
mation on country-level time-varying indicators (such as the level of economic and financial
development, as proxied by GDP per capita and bank deposits over GDP) taken from the
5
World Bank Global Financial Development Database. Finally, we add global 3G internet
access, which we observe at the micro granular geographical level. We aggregate these to
the sub-national locations identified for each respondent by GWP.
3.1. Findex
Findex is a nationally representative survey fielded in some 140 countries in 2011, 2014,
and 2017 (Demirguc-Kunt and Klapper, 2012, 2013). This is the most comprehensive
data set available on how adults save, borrow, make payments and use financial technology,
including mobile phones and the internet, to conduct financial transactions. These data are
collected in partnership with Gallup through nationally representative surveys of more than
150,000 adults in each wave. We focus on individuals aged 18 and older to ensure that those
in our sample are eligible to own a bank account.
The outcome variables of interest come from questions asked of all Findex respondents
regarding their use of fintech and other regular financial services:
1. Online/Mobile transaction using the internet and bank account: In the PAST 12
MONTHS, have you made a transaction online using the Internet as well as with
money FROM YOUR ACCOUNT at a bank or another type of formal financial insti-
tution using a MOBILE PHONE? This can include using a MOBILE PHONE to make
payments, buy things, or to send or receive money.
2. Mobile transaction using bank account: In the PAST 12 MONTHS, have you ever
made a transaction with money FROM YOUR ACCOUNT at a bank or another type
of formal financial institution using a MOBILE PHONE? This can include using a
MOBILE PHONE to make payments, buy things, or to send or receive money.
3. Online payments (such as bills) using the internet: In the PAST 12 MONTHS, have
you, personally, made payments on bills or bought things online using the Internet?
4. Withdrawals using ATM: When you need to get cash (paper or coins) from your ac-
count(s), do you usually get it at an ATM?
5. Withdrawals using a bank branch: When you need to get cash (paper or coins) from
your account(s), do you usually get it over the counter in a branch of your bank or
financial institution?
Responses were coded on a 2-point scale: “Yes” (1) to “No” (2). It is important to
underline the fact that the last two questions above (related to ATM and branch withdrawals)
come from a single question with various alternatives; thus responses to these questions are
mutually exclusive.
6

Linking Findex to Gallup World Polls, we obtain information on respondents’ demo-
graphic characteristics (age, gender, educational attainment, marital status, religion, and
urban/rural residence), income, labor market status, and within-country income deciles.
We also examine responses to five parallel questions as placebo outcomes (outcomes 6 to
10):
6. Account ownership: An account can be used to save money, to make or receive pay-
ments, or to receive wages or financial help. Do you, either by yourself or together with
someone else, currently have an account at a bank or another type of formal financial
institution?
7. Deposit money into a personal account in a typical month: In a typical MONTH, is any
money DEPOSITED into your personal account(s): This includes cash or electronic
deposits, or any time money is put into your account(s) by yourself or others.
8. Withdraw money out of a personal account in a typical month: In a typical MONTH,
is any money WITHDRAWN from your personal account(s): This includes cash with-
drawals in person or using your (insert local terminology for ATM/debit card), elec-
tronic payments or purchases, checks, or any other time money is removed from your
account(s) by yourself or another person or institution.
9. Debit card ownership: A/An (local terminology for ATM/debit card) is a card con-
nected to an account at a financial institution that allows you to withdraw money, and
the money is taken out of THAT ACCOUNT right away. Do you, personally, have
a/an (local terminology for ATM/debit card)?
10. Credit card ownership: A credit card is a card that allows you to BORROW money in
order to make payments or buy things, and you can pay the balance off later. Do you,
personally, have a credit card?
These last responses help us to determine whether what we are capturing is the impact of
epidemic exposure on financial technology specifically, as distinct from its impact on financial
services-related outcomes more generally.
3.2. Ma et al. Epidemic Database
Data on worldwide large-scale epidemic occurrence are drawn from Ma et al., who construct
a country-panel dataset starting at the turn of the century. The authors identify and date
pandemic/epidemic events using announcement dates from the World Health Organisation.
According to their list, almost all countries in the world were affected by post-millennial
7
epidemics at one time or another.2
The Ma et al. dataset does not contain country-specific intensity measures and thus
can only be used in dichotomous form. However, the binary nature of this measure is
consistent with the assumption of the exogeneity of our treatment, since occurrence of an
epidemic (as opposed to its intensity) is likely to be uncorrelated with country characteristics.
Nonetheless, we also analyze more and less intense epidemics separately by constructing a
pair of dummy variables based on the median cases (or deaths) per capita across all epidemics
during our sample period. We merge these data with the Findex-Gallup database.
3.3. Global 3G Coverage
Data on 3G mobile internet coverage are from Collins Bartholomew’s Mobile Coverage Ex-
plorer, which provides information on signal coverage at a 1-by-1 kilometer grid-level around
the world. To calculate the share of the population covered by the 3G, we use 1-by-1 kilo-
meter population data from the Gridded Population of the World for 2015, distributed by
the Center for International Earth Science Information Network. To measure 3G internet
access, we calculate the share of the district’s territory covered by 3G networks in a given
year, weighted by population density at each point on the map. We first calculate each
grid’s population coverage and then aggregate this information over the sub-national regions
as provided in the GWP. We use this population-weighted 3G network coverage variable to
capture 3G mobile internet access at the sub-regional level.
Appendix Table 1 shows descriptive statistics for the outcome and placebo variables,
epidemic occurrence, and 3G internet coverage.
4. Empirical Strategy
To assess the causal effect of past epidemic exposure on an individual’s utilization of digital
and traditional financial services, we estimate a linear probability model with a difference-
in-differences specification:
Yi,c,t = β1ExposureToEpidemicc,t + β2Xi,c,t + β3Cc + β4Tt + εi,c,t (1)
where Yi,c,t is a dummy variable indicating whether or not respondent i in country c in year t
uses digital or traditional financial services. “Exposure to epidemic” is an indicator variable
capturing whether a country experienced an epidemic in a year during our sample period.
2The authors enumerate 290 country-year pandemic/epidemic observations since the turn of the century.See Online Appendix B for the detailed list.
8
The coefficient of interest is β1. As noted, our identification assumption is that occurrence
of an epidemic (as opposed to its intensity) is uncorrelated with country-level characteristics
and hence that our treatment variable is plausibly exogenous.3
To control for the effects of demographic and labor market structure, we include the
following in the Xi,c,t vector of individual characteristics: individual income (in level and
squared), and indicator variables for living in an urban area, having a child (any child
under 15), gender (male), employment status (full-time employed, part-time employed, un-
employed), religion (atheist, orthodox, protestant, catholic, muslim), educational attainment
(tertiary education, secondary education), and within-country-year income decile. We also
include as country-level time-varying regressors GDP per capita and bank deposits relative
to GDP; these variables capture economic and financial development across countries and
over time.
To account for unobservable characteristics, we include fixed effects at the levels of coun-
try (Cc) and year (Tt). The country dummies control for all variation in the outcome variable
due to factors that vary only cross-nationally. These also strengthen our identification argu-
ment, ensuring that we control for the selection of certain countries into epidemic episodes as
long as the timing of the epidemic can be considered exogenous. The year dummies control
for global shocks that affect all countries simultaneously.
In further robustness checks we include interactive country-times-income decile, country-
times-labor-market status, and country-times-education fixed effects. These interaction
terms allow us to compare the treatment and control groups within those specific cate-
gorical bins. We cluster standard errors by country, and use sampling weights provided by
Findex-Gallup to make the data representative at the country level.
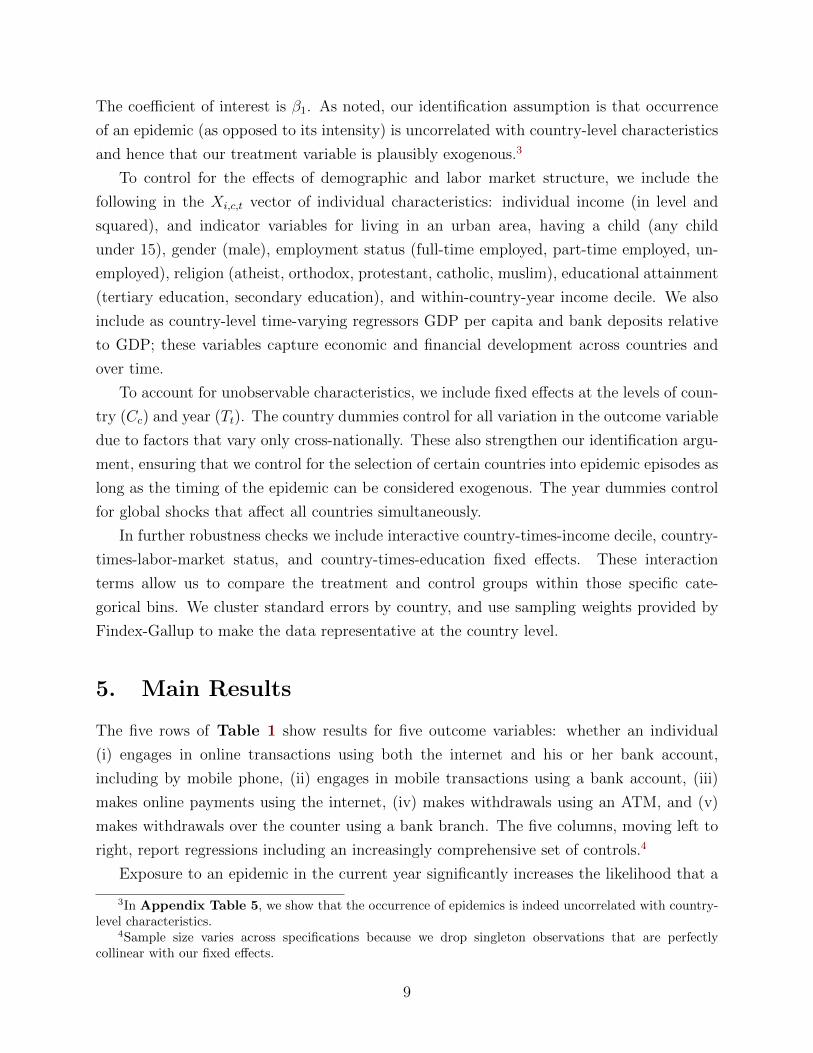
5. Main Results
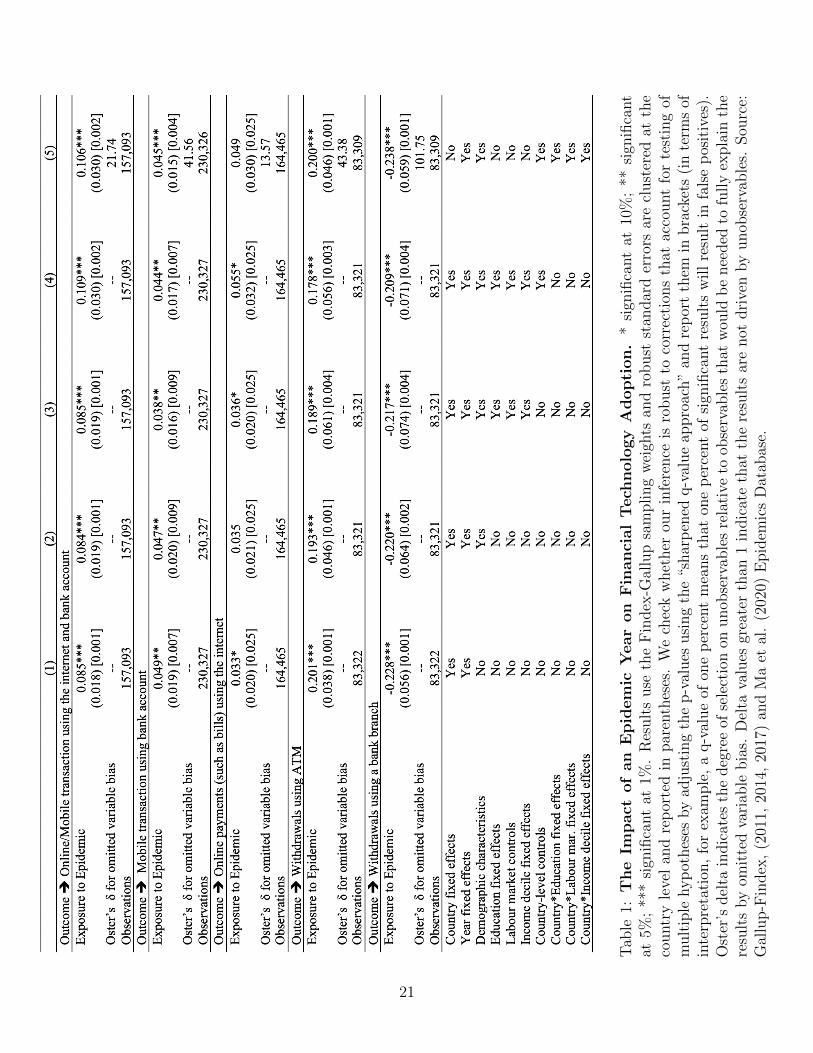
The five rows of Table 1 show results for five outcome variables: whether an individual
(i) engages in online transactions using both the internet and his or her bank account,
including by mobile phone, (ii) engages in mobile transactions using a bank account, (iii)
makes online payments using the internet, (iv) makes withdrawals using an ATM, and (v)
makes withdrawals over the counter using a bank branch. The five columns, moving left to
right, report regressions including an increasingly comprehensive set of controls.4
Exposure to an epidemic in the current year significantly increases the likelihood that a
3In Appendix Table 5, we show that the occurrence of epidemics is indeed uncorrelated with country-level characteristics.
4Sample size varies across specifications because we drop singleton observations that are perfectlycollinear with our fixed effects.
9
respondent will have engaged in online transactions. This result obtains for multiple remote-
access banking transactions. In particular, epidemic exposure in the current year increases
the likelihood that an individual will have made a withdrawal using an ATM while reducing
the likelihood of doing so at a bank branch (in person over the counter). These last two
coefficients are opposite in sign and roughly equal in magnitude, suggesting that there is near-
perfect substitution between the likelihood of using ATMs vs. branches.5 In our preferred
model (Column 5), exposure to an epidemic leads to 10.6 (4.5) percentage point increase in
online/mobile transactions using the internet and bank account (mobile transaction using
bank account). Given that the means of these outcome variables are 8.3 (9.4) percent, the
effect is sizeable.
These results are robust to including individual-level income (linear and non-linear),
demographic characteristics, labor market controls, education fixed effects, (within-country)
income decile fixed effects, and year fixed effects. They are robust to including time-varying
country-level controls (GDP per capita and bank deposits over GDP) and country fixed
effects or, alternatively, country by education, country by labor market status and country by
income decile status fixed effects, saturating our specification so as to restrict the dependent
variable to vary only within these bins.
We follow the method proposed by Oster (2019) to investigate the importance of un-
observables.6 For each panel of Table 1, the final column reports Oster’s delta for our
main model. This indicates the degree of selection on economic unobservables, relative to
observables, that would be needed in order for our results to be fully explained by omitted
variable bias. The high delta values (between 10 and 52 depending on the outcome) are
reassuring: given the economic controls we include in our models, it seems unlikely that
unobserved factors are 10 to 52 times more important than the observables included in our
preferred specification.
Because we analyze multiple outcomes, and because this could generate false positives
purely by chance, we follow Anderson (2008) in computing false discovery rates (FDRs).
The FDR calculates the expected proportion of rejections that are type I errors and gener-
5As previously noted, these two questions on cash withdrawals (ATM vs. bank branch) are originallyasked in a mutually exclusive manner (alongside a few other options) in the Findex questionnaire. This isin line with our interpretation of the related results as a “substitution” from one technology to another.
6Estimation bounds on the treatment effect range between the coefficient from the main specificationand the coefficient estimated under the assumption that observables are as important as unobservables forthe level of Rmax. Rmax specifies the maximum R-squared that can be achieved if all unobservables wereincluded in the regression. Oster (2019) uses a sample of 65 RCT papers to estimate an upper bound of theR-squared such that 90 percent of the results would be robust to omitted variables bias. This estimationstrategy yields an upper bound for the R-squared, Rmax, that is 1.3 times the R-squared in specificationsthat control for observables. The rule of thumb to be able to argue that unobservables cannot fully explainthe treatment effect is for Oster’s delta to be greater than one.
10
ates an adjusted p-value (i.e., sharpened q-value) for each corresponding estimate. As seen
beneath each estimate (in brackets) in Table 1, findings do not change when we employ this
method; in fact the statistical significance of the estimates based on these adjusted p-values
is usually higher than those indicated by standard p-values.
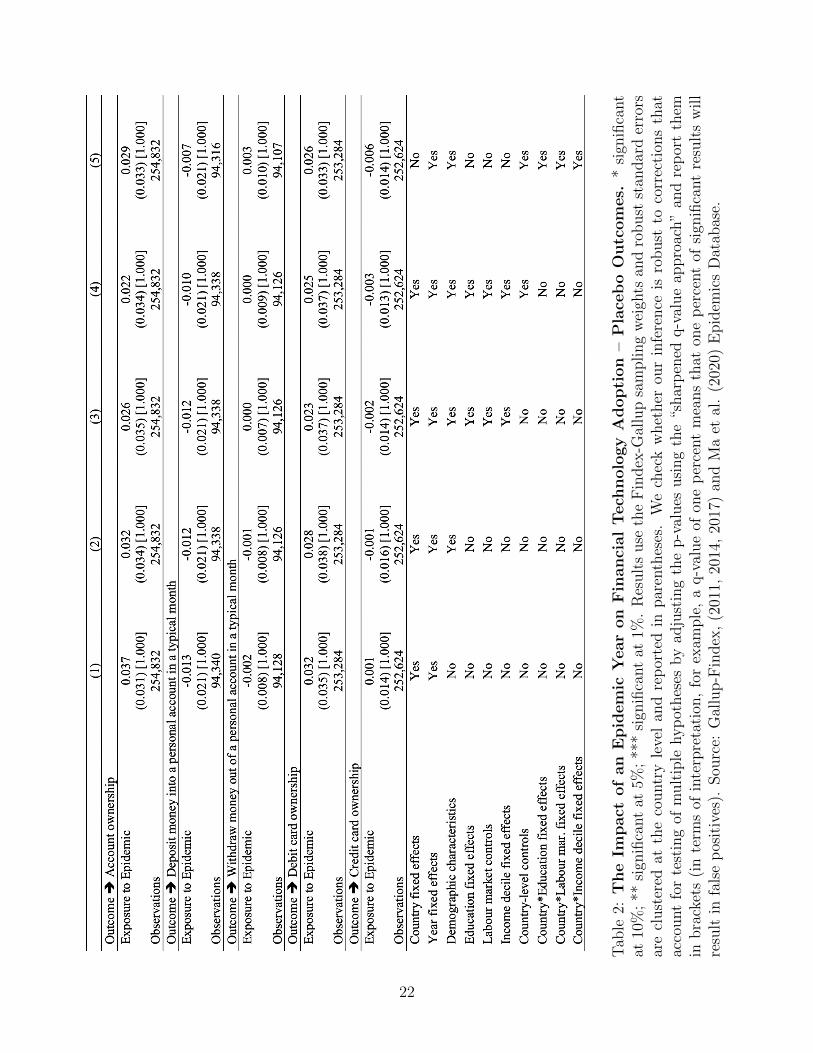
Finally, we investigate whether overall financial inclusion and levels of banking activity
differ in countries experiencing an epidemic, since such geographical heterogeneity could drive
differences in choice of banking technologies in our sample. When testing for an impact on
financial behavior where face-to-face and electronic transactions are not alternatives, we
should not observe a shift in behavior in response to epidemics. Thus, this can thus be seen
as a placebo test confirming that the effects in our setting arise only when a priori this is
supposed to be the case.
The additional dependent variables here are whether the individual (i) owns an account,
(ii) deposited money into a personal account in a typical month (including online), (iii)
withdrew money from a personal account in a typical month (including online), (iv) owned a
debit card, and (v) owned a credit card. The results, in Table 2, are reassuring. They show
insignificant effects, small coefficients, and no uniform pattern of signs. An interpretation is
that epidemic exposure has no impact on financial inclusion and activity, but only on the
form – electronic or in-person – that such activity takes.
5.1. Heterogeneity
To identify heterogeneous treatment effects (variation in the direction and magnitude of ef-
fects across individuals within the population), we use a Causal Forest methodology (Athey
and Imbens, 2016). We build regression trees that split the control variable space into
increasingly smaller subsets. Regression trees aim to predict an outcome variable by building
on the mean outcome of observations with similar characteristics. When a variable has very
little predictive power, it is assigned a negative importance score, which is essentially equiva-
lent to low importance for treatment heterogeneity. Causal Forest estimation combines such
regression trees to identify treatment effects, where each tree is defined by different orders
and subsets of covariates. Figure 1.A presents the result based on 20,000 regression trees,
where we set the threshold as 0.15 and above.
Household income, employment, and age are the important dimensions of treatment
heterogeneity. Therefore, we re-estimate our main specification (Column 5 in Table 1)
when restricting the sample to each categorical domain. Results are in Figures 1.B, 1.C
and 1.D. The average treatment effect is driven by richer individuals (with annual incomes
above $10,000 U.S.), young adults (ages 26 to 34), and those in full-time employment at the
11
time of the epidemic. It makes sense that better off, more economically secure and younger
individuals should be more inclined to switch to new financial technologies. Technology
adoption in general declines with age (Friedberg, 2003; Schleife, 2006), while less-well-
off individuals often have less exposure or access to such technology.
5.2. Event Study Estimates and Persistence
Given that Findex is available for only three cross-sections spanning seven years, any in-
vestigation of persistence is necessarily tentative. As a start, we repeated the analysis for
individuals in countries exposed to an epidemic in the year immediately preceding the sur-
vey, and again two years preceding the survey.7 To investigate pre-existing trends in the
outcomes of interest, we also tested for changes in behavior in years prior to the exposure.
Panel A of Figure 2 shows that differences between countries exposed to an epidemic
in the past (or struck by one in the future) and those that were not so affected are small
and statistically insignificant. These event-study graphs are consistent with the idea that
the epidemic shock was exogenous with respect to banking activity (i.e. that our estimates
satisfy the parallel trends assumption). It does not appear from this analysis that the change
in behavior persists beyond the epidemic year.
6. Role of Infrastructure
Infrastructure weaknesses may hinder digital transactions and limit any epidemic-induced
shift in behavior (see the studies cited in Section 2). We therefore add to our specification a
measure of within-country subregional 3G coverage, 3G being the relevant threshold, since
2G allows only for mobile phone calls and text messages but not internet browsing.8
This 3G variable represents the portion of the 1x1 km squares with a 3G connection
in each subregion distinguished by Gallup. We interact it with our measure of epidemic
exposure and also include it separately to control for the first-order effect of mobile internet
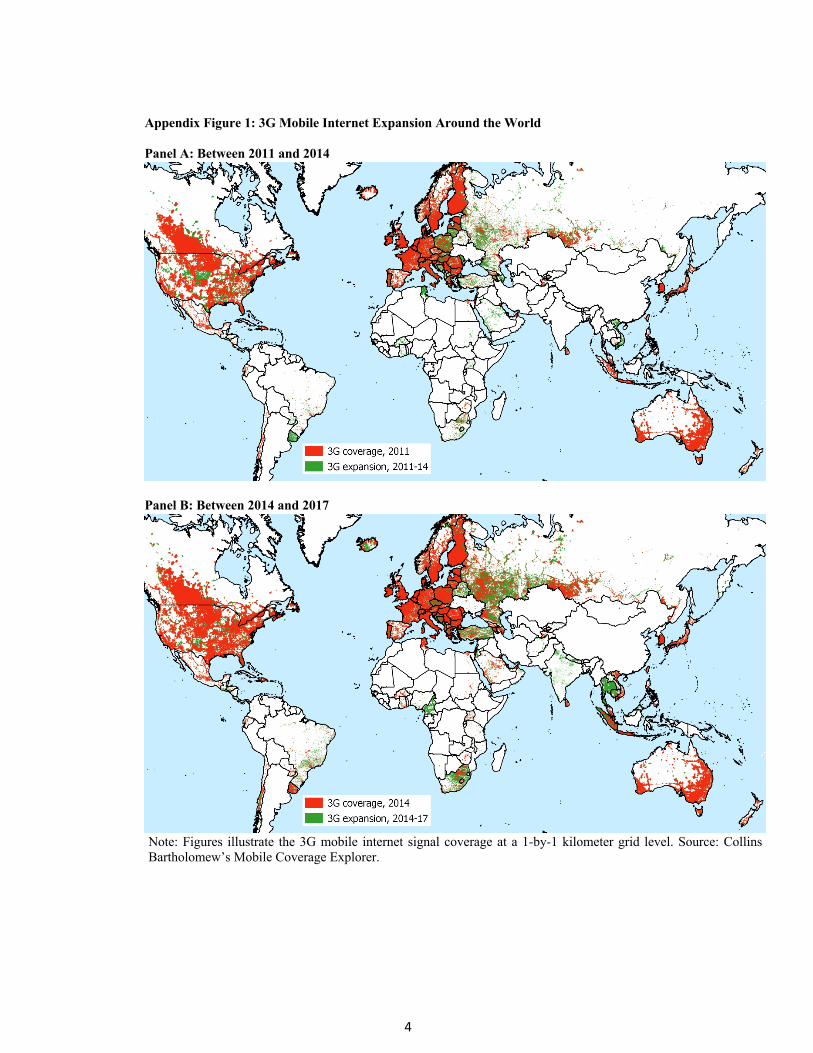
coverage. Appendix Figure 1 provides a visual summary of 3G mobile internet expansion
around the world between 2011 and 2017. There is substantial variation within and between
countries in 3G coverage and how it changes over time.
7We are careful not to overinterpret this result, since this past epidemic may not necessarily be the sameas the one captured by our contemporaneous event dummy. Therefore, failing to find an effect in this settingdoes not automatically translate to a short-term impact for the epidemic episodes that we capture withour contemporaneous epidemic variable. To the extent that treatment effects might be heterogenous acrossdifferent epidemic events in our sample, this type of analysis should be interpreted with caution.
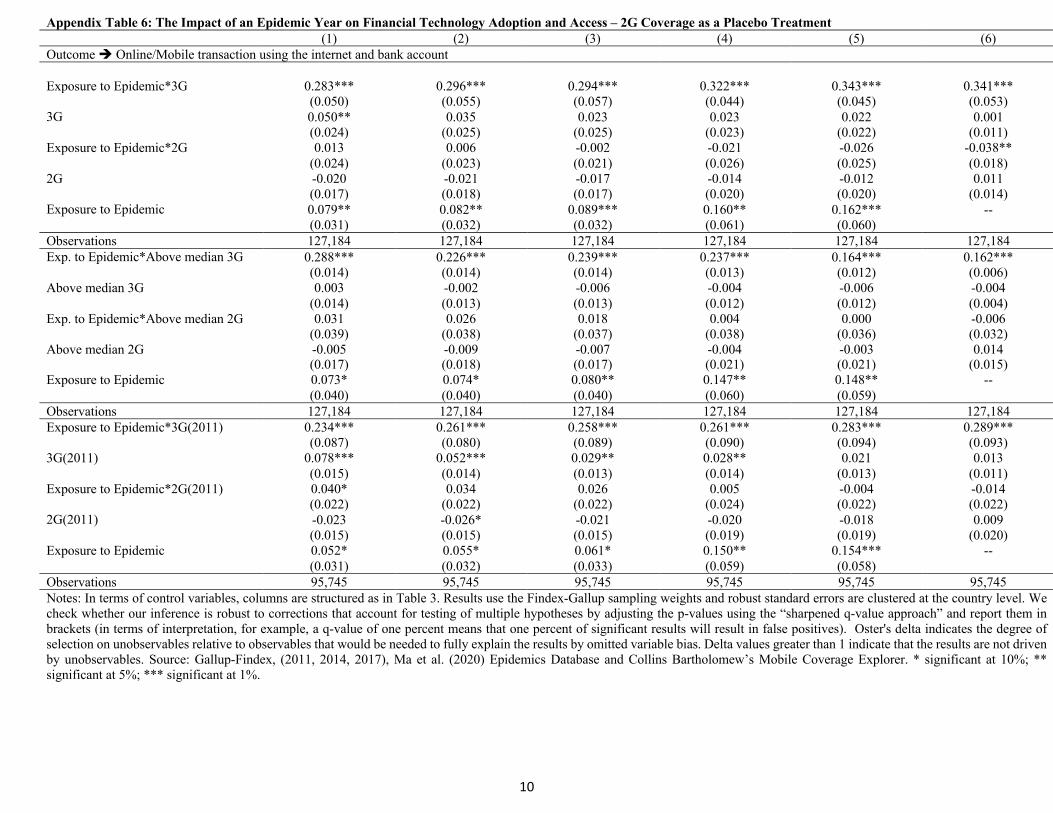
8In Appendix Table 6, we confirm that 2G internet access has no impact on our outcomes when it isinteracted with epidemic exposure.
12
We initially treat 3G availability as exogenous, since the technology was licensed and
deployed to facilitate calls, texts, and internet browsing and not because of online bank-
ing availability. Nonetheless, to address the concern that causality may run from banking
provision to 3G coverage, we include additional dummies for each country-year pair. Since
banks usually provide the same or similar online banking services throughout a country, this
non-parametrically controls for supply-related factors. It focuses instead on within-country
variation in online banking that is more likely to be driven by demand-related shocks. This
also ensures that our estimates are not driven by any other country-specific time-varying
unobservables.
A further concern is that epidemics may induce changes in 3G coverage in a region, for
example via signal failures if the maintenance of local services is adversely affected by the
public health emergency.9 To make sure that subregional 3G coverage is not affected by
epidemics, we follow two strategies. First, we minimize the variation in 3G coverage by
specifying it in binary form, where above-median values take the value of 1 and 0 otherwise.
So long as a region does not experience a very large change in coverage in response to an
epidemic – so long as it does not jump from one category to another – this will minimize
endogeneity. Second, we eliminate time variation in the 3G variable by only using the initial
(2011) values for each subregion.
Table 3 shows the result for online transactions using the internet and the individual’s
bank account, including by mobile phone. 3G coverage itself has little effect. Its coefficient
is small; it is statistically significant only when we exclude individual controls. But the
effect interacted with epidemic exposure is large and statistically significant at conventional
confidence levels. Again, these results do not change if we use the Oster test for potential
omitted variable bias or adjust the p-values for the presence of multiple models. According
to the most conservative regression, where we observe both the baseline and interacted coef-
ficients (Column 5 in the middle panel), the impact of epidemic exposure on the propensity
to make transactions using the internet is more than twice as large with 3G coverage. Panel
B in Figure 2 shows that there is no evidence of the mediating effect of 3G infrastructure
persisting beyond the period of epidemic exposure, nor of the effect emerging prior to the
epidemic shock.10
9This would result in multicollinearity in our estimates.10Again, this means that our data satisfy the parallel trends assumption.
13
7. Additional Analysis and Robustness Checks
Additional analyses, reported in the Online Appendix, document the robustness of our
findings. These include: (i) distinguishing treatment effects of high- and low-intensity epi-
demics; (ii) clustering standard errors at the level of different global regions; and (iii) con-
trolling for country-specific linear time trends; (iv) conducting falsification analyses; (v) con-
ducting balance tests to show that occurrence of epidemics is uncorrelated with the country
characteristics; (vi) ruling out influential treatments and observations.
8. Conclusion
We have documented the tendency for individuals to turn to online and mobile banking when
exposed to an epidemic. The effects do not seem to reflect a change in the volume of financial
transactions, only their form. Intuitively, one should see the substitution of electronic for
person-to-person transactions in an environment where personal contact becomes riskier. It
is less obvious that one should observe an increase (or reduction) in the overall volume of
such transactions (something that we do not observe here). The effect is greatest among
relatively young, economically well-off individuals who reside in areas with good internet
infrastructure and coverage, not surprisingly since such individuals tend to be early adopters
with favourable access to new digital technologies.
These findings remind one that the COVID-19 pandemic has been felt unevenly: that the
poorer portion of populations has disproportionately suffered its economic and health effects,
and that women have been disproportionately affected economically in many countries. 3G
coverage is another instance of the same phenomenon: coverage tends to arrive late in poor,
rural and remote areas and in relatively poor neighborhoods in advanced countries, offering
their residents less scope for substituting digital for in-person banking. Digital technology
enables individuals to maintain customary levels of banking and financial activity while
limiting epidemic risks to their health, but only if the necessary infrastructure is rolled out
in a manner that encompasses poorer, more remote regions.
14
References
Aker, J. C., Boumnijel, R., McClelland, A., Tierney, N., 2016. Payment mechanisms and
antipoverty programs: Evidence from a mobile money cash transfer experiment in Niger.
Economic Development and Cultural Change 65, 1–37.
Al-Somali, S. A., Gholami, R., Clegg, B., 2009. An investigation into the acceptance of online
banking in Saudi Arabia. Technovation 29, 130–141.
Alesina, A., Giuliano, P., Nunn, N., 2011. Fertility and the plough. American Economic
Review 101, 499–503.
Anderson, M. L., 2008. Multiple inference and gender differences in the effects of early inter-
vention: A reevaluation of the abecedarian, perry preschool, and early training projects.
Journal of the American statistical Association 103, 1481–1495.
Athey, S., Imbens, G., 2016. Recursive partitioning for heterogeneous causal effects. Pro-
ceedings of the National Academy of Sciences 113, 7353–7360.
Bachas, P., Gertler, P., Higgins, S., Seira, E., 2018. Digital financial services go a long way:
Transaction costs and financial inclusion. In: AEA Papers and Proceedings , vol. 108, pp.
444–48.
Baptista, G., Oliveira, T., 2015. Understanding mobile banking: The unified theory of ac-
ceptance and use of technology combined with cultural moderators. Computers in Human
Behavior 50, 418–430.
Brenan, M., 2020. Covid-19 and remote work: An update. Gallup (13 October 2020)
https://news.gallup.com/poll/321800/covid-remote-work-update.aspx.
Breza, E., Kanz, M., Klapper, L. F., 2020. Learning to navigate a new financial technology:
Evidence from payroll accounts. NBER Working Paper No.28249 .
Callen, M., De Mel, S., McIntosh, C., Woodruff, C., 2019. What are the headwaters of
formal savings? Experimental evidence from Sri Lanka. The Review of Economic Studies
86, 2491–2529.
Chau, P. Y., Hui, K. L., 1998. Identifying early adopters of new it products: A case of
Windows 95. Information & Management 33, 225–230.
Chen, S., Doerr, S., Frost, J., Gambacorta, L., Shin, H. S., 2021. The fintech gender gap.
CEPR Discussion Paper No.16270 .
15
Chiou, L., Tucker, C., 2020. Social distancing, internet access and inequality. NBER Working
Paper No.26982 .
Citigroup, 2020. Will covid-19 lead to accelerating trends? Citi GPS (6 April 2020)
https://www.citivelocity.com/citigps/will-covid-19-lead-to-accelerating-trends/.
Core, F., De Marco, F., 2021. Public guarantees for small businesses in Italy during covid-19.
CEPR Discussion Paper No.15799 .
Coury, S., Huang, J., Kumar, A., Prince, S., Krikovich, A., Yee, L., 2020. Women in the
workplace. McKinsey/Leanin.org (September 2020) https://www.mckinsey.com/featured-
insights/diversity-and-inclusion/women-in-the-workplace.
D’Andrea, A., Limodio, N., 2019. High-speed internet, financial technology and banking in
Africa. BAFFI CAREFIN Centre Research Paper .
Dedehayir, O., Ortt, R. J., Riverola, C., Miralles, F., 2017. Innovators and early adopters
in the diffusion of innovations: A literature review. International Journal of Innovation
Management 21, 1–27.
Demirguc-Kunt, A., Klapper, L., 2013. Measuring financial inclusion: Explaining variation
in use of financial services across and within countries. Brookings Papers on Economic
Activity 2013, 279–340.
Demirguc-Kunt, A., Klapper, L. F., 2012. Measuring financial inclusion: The global findex
database. World Bank Policy Research Working Paper .
Erel, I., Liebersohn, J., 2020. Does fintech substitute for banks? Evidence from the paycheck
protection program. NBER Working Paper No.27659 .
Farrell, C., 2020. How the coronavirus punishes many older workers. PBS (7 May)
https://www.pbs.org/wnet/chasing-the-dream/stories/how-coronavirus-punishes-older-
workers/.
Friedberg, L., 2003. The impact of technological change on older workers: Evidence from
data on computer use. ILR Review 56, 511–529.
Fu, J., Mishra, M., 2020. Fintech in the time of covid-19: Trust and technological adoption
during crises. Swiss Finance Institute Research Paper .
16
Georgieva, K., 2020. The global economic reset – promoting a more inclusive recovery. IMF
Blog (11 June) https://blogs.imf.org/2020/06/11/the-global-economic-reset-promoting-a-
more-inclusive-recovery/.
Grashuis, J., Skevas, T., Segovia, M. S., 2020. Grocery shopping preferences during the
covid-19 pandemic. Sustainability 12, 5369.
Gu, J.-C., Lee, S.-C., Suh, Y.-H., 2009. Determinants of behavioral intention to mobile
banking. Expert Systems with Applications 36, 11605–11616.
Jack, W., Suri, T., 2014. Risk sharing and transactions costs: Evidence from Kenya’s mobile
money revolution. American Economic Review 104, 183–223.
Klapper, L., 2017. How digital payments can benefit entrepreneurs. IZA World of Labor 396.
Klapper, L., 2020. Covid-19 shows why we must build trust in digital financial
services. World Economic Forum COVID Action Platform (17 December 2020)
https://www.weforum.org/agenda/2020/12/covid-19-trust-in-digital-financial-services/.
Kwan, A., Lin, C., Pursiainen, V., Tai, M., 2021. Stress testing banks’ digital capabilities:
Evidence from the covid-19 pandemic. Tech. rep., Working Paper, University of Hong
Kong and University of St. Gallen.
Lee, J. N., Morduch, J., Ravindran, S., Shonchoy, A., Zaman, H., 2021. Poverty and migra-
tion in the digital age: Experimental evidence on mobile banking in Bangladesh. American
Economic Journal: Applied Economics 13, 38–71.
McKenzie, L., 2021. Bridging the digital divide: Lessons from covid-19. Washington, DC:
Inside Higher Ed .
Muralidharan, K., Niehaus, P., Sukhtankar, S., 2016. Building state capacity: Evidence from
biometric smartcards in India. American Economic Review 106, 2895–2929.
OECD, 2020. Job creation and local economic development. Paris: Organisation for Eco-
nomic Cooperation and Development (OECD) .
Oster, E., 2019. Unobservable selection and coefficient stability: Theory and evidence. Jour-
nal of Business & Economic Statistics 37, 187–204.
Pelham, B., 2017. Medieval ingenuity in fourteenth century english milling in middlesex,
norfolk, and northumberland counties. unpublished thesis, University of Central Florida .
17
Ramsetty, A., Adams, C., 2020. Impact of the digital divide in the age of covid-19. Journal
of the American Medical Informatics Association 27, 1147–1148.
Richardson, E., Aissat, D., Williams, G. A., Fahy, N., et al., 2020. Keeping what works:
Remote consultations during the covid-19 pandemic. Eurohealth 26, 73–76.
Saad, L., Jones, J., 2021. Seven in 10 U.S. white-collar workers still working remotely. Gallup
(17 May 2021) https://news.gallup.com/poll/348743/seven-u.s.-white-collar-workers-still-
working-remotely.aspx.
Schleife, K., 2006. Computer use and the employment status of older workers. Review of
Labour Economics and Industrial Relations 20.
Senn, M. A., 2003. English life and law in the time of the Black Death. Real Property Probate
& Trust Journal 38, 507.
Tarhini, A., El-Masri, M., Ali, M., Serrano, A., 2016. Extending the utaut model to un-
derstand the customers’ acceptance and use of internet banking in lebanon: A structural
equation modeling approach. Information Technology & People .
UNCTAD, 2020. The covid-19 crisis: Accentuating the need to bridge digital divides. New
York: UNCTAD .
WorldBank, 2016. World development report 2016: Digital dividends. Washington, D.C.:
World Bank .
18
Fig
.1.
Hete
rogeneit
yA
naly
sis
usi
ng
Causa
lFore
st.
Fig
ure
Aillu
stra
tes
the
vari
able
imp
orta
nce
for
“Exp
osure
toep
idem
ic”
ina
causa
lfo
rest
fram
ewor
k(N
=20
,000
tree
s),
whic
hpro
vid
esin
sigh
tsin
toth
enat
ure
ofth
ere
lati
onsh
ipb
etw
een
our
trea
tmen
teff
ect
and
other
cova
riat
es.
Fig
ure
sB
,C
and
Dpro
vid
etr
eatm
ent
het
erog
enei
tyes
tim
ates
bas
edon
the
top
3co
vari
ates
det
erm
ined
by
the
causa
lfo
rest
model
inP
anel
A.
For
hou
sehol
din
com
e,Q
uin
tile
1:0.
17-7
81,
Quin
tile
2:78
2-19
96,
Quin
tile
3:19
96-4
536,
Quin
tile
4:45
36-1
0201
,Q
uin
tile
5:10
202-
7290
0000
(all
indol
lars
per
year
).F
orag
e,Q
uin
tile
1:18
-25,
Quin
tile
2:26
-34,
Quin
tile
3:35
-45,
Quin
tile
4:46
-59,
Quin
tile
5:60
-99.
Outc
ome
is“o
nline/
mob
ile
tran
sact
ion
usi
ng
the
inte
rnet
and
ban
kac
count”
.T
he
spec
ifica
tion
inC
olum
n5
ofT
able
1.
Res
ult
sar
ew
eigh
ted,
stan
dar
der
rors
are
clust
ered
(cou
ntr
y-l
evel
)an
dco
nfiden
cein
terv
als
are
plo
tted
at99
%le
vel.
19
Fig
.2.
Event
Stu
dy
Est
imate
s.P
anel
A:
Outc
omes
are
“online/
mob
ile
tran
sact
ion
usi
ng
the
inte
rnet
and
ban
kac
count”
,“w
ithdra
wal
susi
ng
AT
M”,
and
“wit
hdra
wal
susi
ng
aban
kbra
nch
”.E
vent
study
esti
mat
esar
ebas
edon
the
spec
ifica
tion
inC
olum
n5
ofT
ab
le1
.In
par
ticu
lar,
we
rep
eat
the
exer
cise
for
indiv
idual
sin
countr
ies
exp
osed
toan
epid
emic
inth
eye
arim
med
iate
lypre
cedin
gth
esu
rvey
,an
dag
ain
two
year
spre
cedin
gth
esu
rvey
.R
esult
sar
ew
eigh
ted,
stan
dar
der
rors
are
clust
ered
(cou
ntr
yle
vel)
and
confiden
cein
terv
als
are
plo
tted
at99
%le
vel.
Pan
elB
:O
utc
ome
is“o
nline/
mob
ile
tran
sact
ion
usi
ng
the
inte
rnet
and
ban
kac
count”
.E
vent
study
esti
mat
esar
ebas
edon
the
spec
ifica
tion
inC
olum
n6
ofT
able
3.
Inpar
ticu
lar,
we
rep
eat
the
exer
cise
for
indiv
idual
sin
sub-r
egio
ns
wit
h3G
inte
rnet
cove
rage
(sep
arat
ely
for
conti
nuou
sm
easu
re,ab
ove
med
ian
3Gco
vera
ge,
and
tim
e-in
vari
ant
3Gco
vera
ge-a
sof
year
2011
-to
min
imis
ep
oten
tial
endog
enei
tyco
nce
rns)
exp
osed
toan
epid
emic
inth
eye
arim
med
iate
lypre
cedin
gth
esu
rvey
,an
dag
ain
two
year
spre
cedin
gth
esu
rvey
.R
esult
sar
ew
eigh
ted,
stan
dar
der
rors
are
clust
ered
(cou
ntr
yle
vel)
and
confiden
cein
terv
als
are
plo
tted
at99
%le
vel.
20
Tab
le1:
The
Imp
act
of
an
Epid
em
icY
ear
on
Fin
anci
al
Tech
nolo
gy
Adopti
on.
*si
gnifi
cant
at10
%;
**si
gnifi
cant
at5%
;**
*si
gnifi
cant
at1%
.R
esult
suse
the
Fin
dex
-Gal
lup
sam
pling
wei
ghts
and
robust
stan
dar
der
rors
are
clust
ered
atth
eco
untr
yle
vel
and
rep
orte
din
par
enth
eses
.W
ech
eck
whet
her
our
infe
rence
isro
bust
toco
rrec
tion
sth
atac
count
for
test
ing
ofm
ult
iple
hyp
othes
esby
adju
stin
gth
ep-v
alues
usi
ng
the
“shar
pen
edq-v
alue
appro
ach”
and
rep
ort
them
inbra
cket
s(i
nte
rms
ofin
terp
reta
tion
,fo
rex
ample
,a
q-v
alue
ofon
ep
erce
nt
mea
ns
that
one
per
cent
ofsi
gnifi
cant
resu
lts
will
resu
ltin
fals
ep
osit
ives
).O
ster
’sdel
tain
dic
ates
the
deg
ree
ofse
lect
ion
onunob
serv
able
sre
lati
veto
obse
rvab
les
that
wou
ldb
enee
ded
tofu
lly
expla
inth
ere
sult
sby
omit
ted
vari
able
bia
s.D
elta
valu
esgr
eate
rth
an1
indic
ate
that
the
resu
lts
are
not
dri
ven
by
unob
serv
able
s.Sou
rce:
Gal
lup-F
index
,(2
011,
2014
,20
17)
and
Ma
etal
.(2
020)
Epid
emic
sD
atab
ase.
21
Tab
le2:
The
Impact
of
an
Ep
idem
icY
ear
on
Fin
anci
al
Tech
nolo
gy
Adopti
on
–P
lace
bo
Outc
om
es.
*si
gnifi
cant
at10
%;
**si
gnifi
cant
at5%
;**
*si
gnifi
cant
at1%
.R
esult
suse
the
Fin
dex
-Gal
lup
sam
pling
wei
ghts
and
robust
stan
dar
der
rors
are
clust
ered
atth
eco
untr
yle
vel
and
rep
orte
din
par
enth
eses
.W
ech
eck
whet
her
our
infe
rence
isro
bust
toco
rrec
tion
sth
atac
count
for
test
ing
ofm
ult
iple
hyp
othes
esby
adju
stin
gth
ep-v
alues
usi
ng
the
“shar
pen
edq-v
alue
appro
ach”
and
rep
ort
them
inbra
cket
s(i
nte
rms
ofin
terp
reta
tion
,fo
rex
ample
,a
q-v
alue
ofon
ep
erce
nt
mea
ns
that
one
per
cent
ofsi
gnifi
cant
resu
lts
will
resu
ltin
fals
ep
osit
ives
).Sou
rce:
Gal
lup-F
index
,(2
011,
2014
,20
17)
and
Ma
etal
.(2
020)
Epid
emic
sD
atab
ase.
22
Tab
le3:
The
Imp
act
ofan
Epid
em
icY
ear
on
Fin
anci
alT
ech
nolo
gy
Adopti
on
–R
ole
of3G
Inte
rnet
Infr
ast
ruct
ure
.*
sign
ifica
nt
at10
%;
**si
gnifi
cant
at5%
;**
*si
gnifi
cant
at1%
.R
esult
suse
the
Fin
dex
-Gal
lup
sam
pling
wei
ghts
and
robust
stan
dar
der
rors
are
clust
ered
atth
eco
untr
yle
vel.
We
chec
kw
het
her
our
infe
rence
isro
bust
toco
rrec
tion
sth
atac
count
for
test
ing
ofm
ult
iple
hyp
othes
esby
adju
stin
gth
ep-v
alues
usi
ng
the
“shar
pen
edq-v
alue
appro
ach”
and
rep
ort
them
inbra
cket
s(i
nte
rms
ofin
terp
reta
tion
,fo
rex
ample
,a
q-v
alue
ofon
ep
erce
nt
mea
ns
that
one
per
cent
ofsi
gnifi
cant
resu
lts
will
resu
ltin
fals
ep
osit
ives
).O
ster
’sdel
tain
dic
ates
the
deg
ree
ofse
lect
ion
onunob
serv
able
sre
lati
veto
obse
rvab
les
that
wou
ldb
enee
ded
tofu
lly
expla
inth
ere
sult
sby
omit
ted
vari
able
bia
s.D
elta
valu
esgr
eate
rth
an1
indic
ate
that
the
resu
lts
are
not
dri
ven
by
unob
serv
able
s.Sou
rce:
Gal
lup-F
index
,(2
011,
2014
,20
17),
Ma
etal
.(2
020)
Epid
emic
sD
atab
ase
and
Col
lins
Bar
thol
omew
’sM
obile
Cov
erag
eE
xplo
rer.
23

1
Online Appendix for
Epidemic Exposure, Fintech Adoption and the Digital Divide
Orkun Saka, Barry Eichengreen, Cevat Giray Aksoy
2
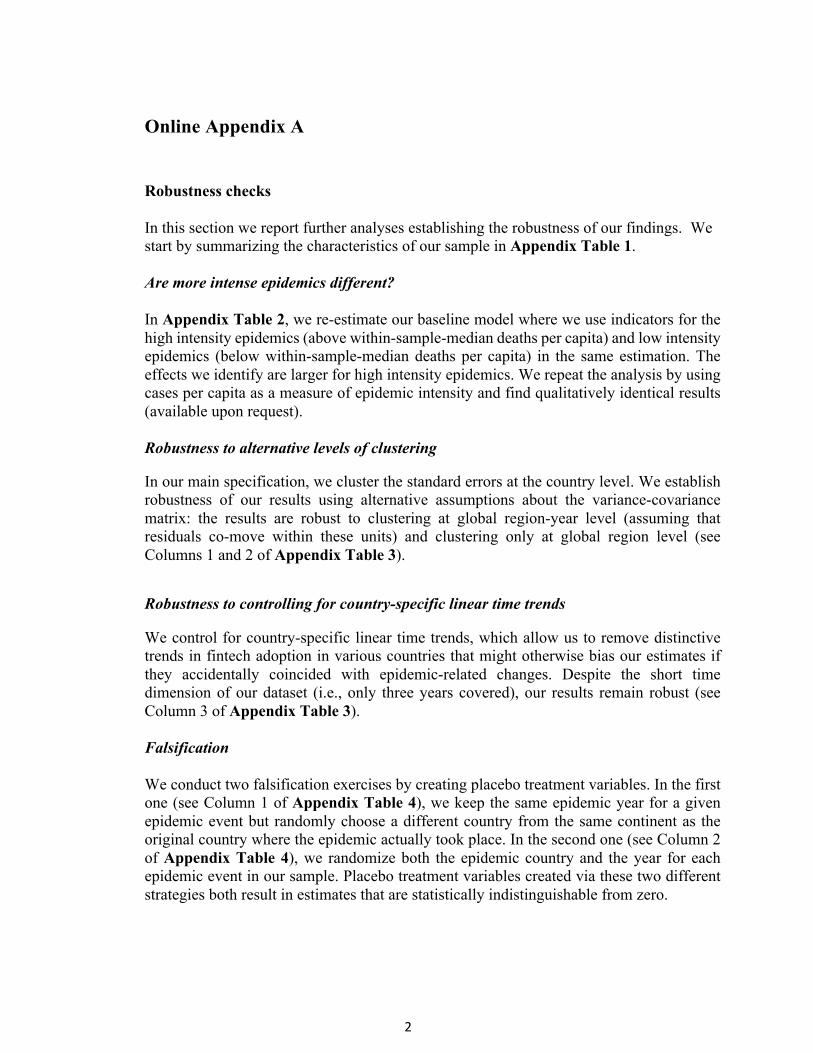
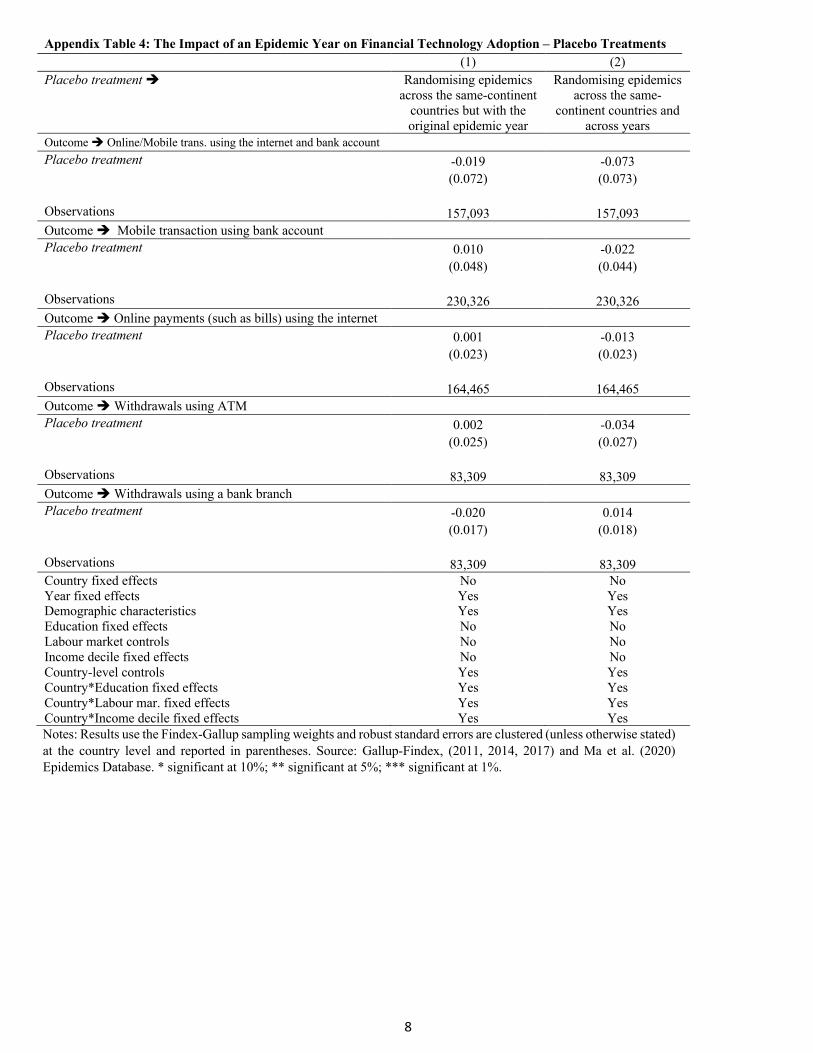
Online Appendix A Robustness checks In this section we report further analyses establishing the robustness of our findings. We start by summarizing the characteristics of our sample in Appendix Table 1. Are more intense epidemics different? In Appendix Table 2, we re-estimate our baseline model where we use indicators for the high intensity epidemics (above within-sample-median deaths per capita) and low intensity epidemics (below within-sample-median deaths per capita) in the same estimation. The effects we identify are larger for high intensity epidemics. We repeat the analysis by using cases per capita as a measure of epidemic intensity and find qualitatively identical results (available upon request). Robustness to alternative levels of clustering In our main specification, we cluster the standard errors at the country level. We establish robustness of our results using alternative assumptions about the variance-covariance matrix: the results are robust to clustering at global region-year level (assuming that residuals co-move within these units) and clustering only at global region level (see Columns 1 and 2 of Appendix Table 3). Robustness to controlling for country-specific linear time trends We control for country-specific linear time trends, which allow us to remove distinctive trends in fintech adoption in various countries that might otherwise bias our estimates if they accidentally coincided with epidemic-related changes. Despite the short time dimension of our dataset (i.e., only three years covered), our results remain robust (see Column 3 of Appendix Table 3). Falsification We conduct two falsification exercises by creating placebo treatment variables. In the first one (see Column 1 of Appendix Table 4), we keep the same epidemic year for a given epidemic event but randomly choose a different country from the same continent as the original country where the epidemic actually took place. In the second one (see Column 2 of Appendix Table 4), we randomize both the epidemic country and the year for each epidemic event in our sample. Placebo treatment variables created via these two different strategies both result in estimates that are statistically indistinguishable from zero.
3
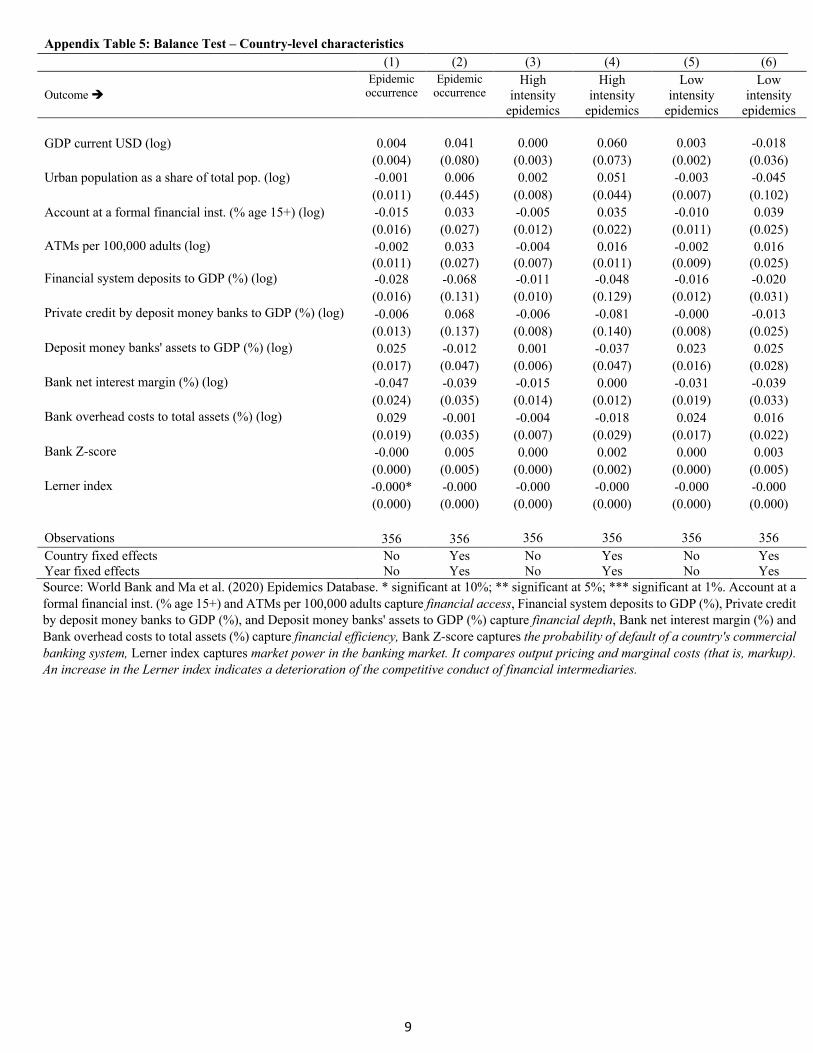
Balance Test As discussed in Section 4, our identification assumption is that the occurrence/start of an epidemic is uncorrelated with country characteristics and hence that our treatment variable is plausibly exogenous. To validate this argument, we provide direct evidence in Appendix Table 5. In particular, we use three outcome variables (epidemic occurrence, high intensity epidemics and low intensity epidemics). As country level covariates, we consider GDP (current USD), urban population as a share of total pop. as well as several other variables that measure the financial development level of countries. Odd numbered columns report the estimates without country and year fixed effects, while even even numbered columns report the estimates with country and year fixed effects. In line with our identification assumption, almost none of the estimates is statistically significant (only 1 out of 66 coefficients are significant at the 10 percent level). Overall, the results presented in Appendix Table 5 show that the occurrence of epidemics is exogenous to country-level economic or financial characteristics. 2G Internet Access as a Placebo Treatment We also check whether the previous-generation mobile networks (2G), which is qualitatively different from the mobile broadband internet (3G), matter for financial technology usage. In particular, we follow the structure of Table 3 but also include 2G coverage as a placebo treatment in Appendix Table 6. In contrast to the effect of 3G, the 2G networks has no consistent impact on our outcomes when it is interacted with epidemic exposure. These results suggest that 3G infrastructure, as distinct from the mobile phone or general communication technology, is the relevant one in the context of our study. Ruling Out Influential Treatments and Observations We rule out the importance of influential treatments by excluding one treatment country at a time. Appendix Table 7 shows that our coefficient estimates are quite stable even as each treated country is eliminated (“turned off ”) in our treatment dummy in every iteration. We repeat a similar analysis with Appendix Table 8 in which we drop one treated country at a time in each estimation for 10 consecutive trials and again find that our estimates are not driven by any single country.
4
Appendix Figure 1: 3G Mobile Internet Expansion Around the World
Panel A: Between 2011 and 2014
Panel B: Between 2014 and 2017
Note: Figures illustrate the 3G mobile internet signal coverage at a 1-by-1 kilometer grid level. Source: Collins Bartholomew’s Mobile Coverage Explorer.
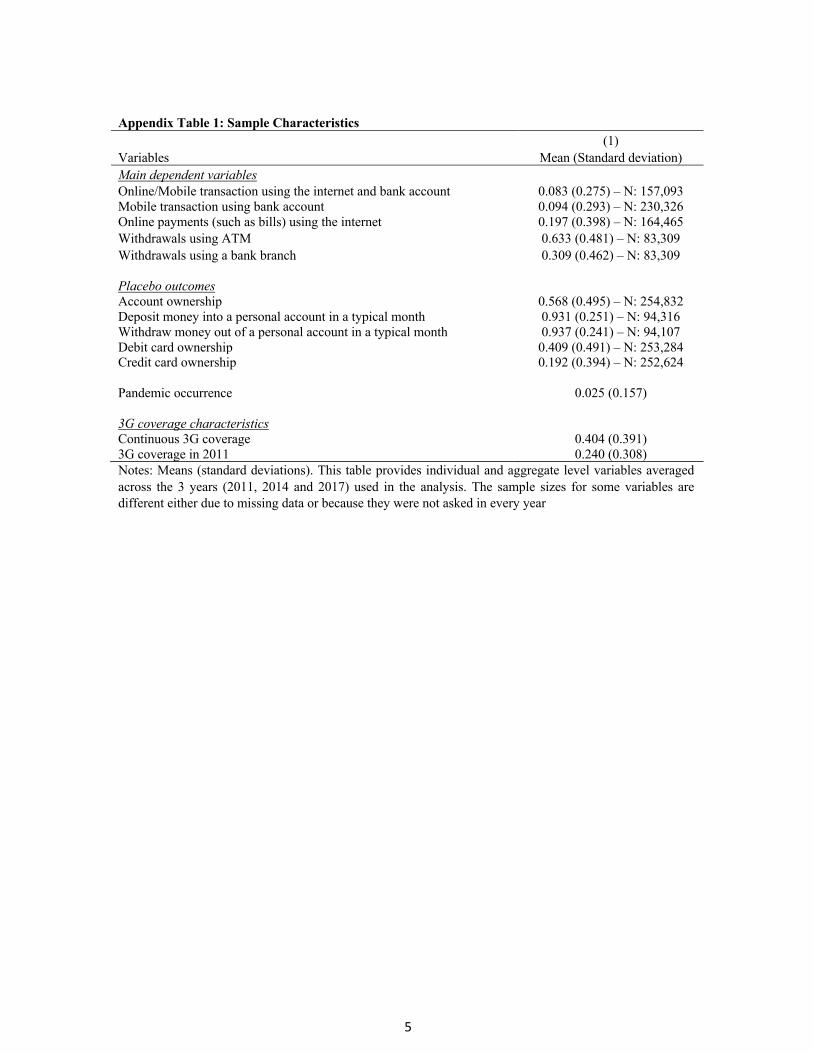
5
Appendix Table 1: Sample Characteristics (1) Variables Mean (Standard deviation) Main dependent variables Online/Mobile transaction using the internet and bank account 0.083 (0.275) – N: 157,093 Mobile transaction using bank account 0.094 (0.293) – N: 230,326 Online payments (such as bills) using the internet 0.197 (0.398) – N: 164,465 Withdrawals using ATM 0.633 (0.481) – N: 83,309 Withdrawals using a bank branch 0.309 (0.462) – N: 83,309 Placebo outcomes Account ownership 0.568 (0.495) – N: 254,832 Deposit money into a personal account in a typical month 0.931 (0.251) – N: 94,316 Withdraw money out of a personal account in a typical month 0.937 (0.241) – N: 94,107 Debit card ownership 0.409 (0.491) – N: 253,284 Credit card ownership 0.192 (0.394) – N: 252,624 Pandemic occurrence 0.025 (0.157) 3G coverage characteristics Continuous 3G coverage 0.404 (0.391) 3G coverage in 2011 0.240 (0.308) Notes: Means (standard deviations). This table provides individual and aggregate level variables averaged across the 3 years (2011, 2014 and 2017) used in the analysis. The sample sizes for some variables are different either due to missing data or because they were not asked in every year

6
Notes: Results use the Findex-Gallup sampling weights and robust standard errors are clustered at the country level and reported in parentheses. We check whether our inference is robust to corrections that account for testing of multiple hypotheses by adjusting the p-values using the “sharpened q-value approach” and report them in brackets (in terms of interpretation, for example, a q-value of one percent means that one percent of significant results will result in false positives). Source: Gallup-Findex, (2011, 2014, 2017) and Ma et al. (2020) Epidemics Database. * significant at 10%; ** significant at 5%; *** significant at 1%.
Appendix Table 2: The Impact of an Epidemic Year on Financial Technology Adoption by Epidemic Intensity (1) Outcome è Online/Mobile transaction using the internet and bank account High Exposure to Epidemic 0.119*** (0.037) [0.002] Low Exposure to Epidemic 0.085*** (0.018) [0.000] Observations 157,093 Outcome è Mobile transaction using bank account High Exposure to Epidemic 0.039** (0.015) [0.013] Low Exposure to Epidemic 0.053* (0.029) [0.071] Observations 230,327 Outcome è Online payments (such as bills) using the internet High Exposure to Epidemic 0.078** (0.030) [0.010] Low Exposure to Epidemic -0.003 (0.009) [0.775] Observations 164,465 Outcome è Withdrawals using ATM High Exposure to Epidemic 0.220*** (0.040) [0.000] Low Exposure to Epidemic 0.086*** (0.012) [0.000] Observations 83,322 Outcome è Withdrawals using a bank branch High Exposure to Epidemic -0.262*** (0.053) [0.000] Low Exposure to Epidemic -0.101*** (0.011) [0.000] Observations 83,322 Country fixed effects No Year fixed effects Yes Demographic characteristics Yes Education fixed effects No Labour market controls No Income decile fixed effects No Country-level controls Yes Country*Education fixed effects Yes Country*Labour mar. fixed effects Yes Country*Income decile fixed effects Yes
7
Notes: Results use the Findex-Gallup sampling weights and robust standard errors are clustered (unless otherwise stated) at the country level and reported in parentheses. Source: Gallup-Findex, (2011, 2014, 2017) and Ma et al. (2020) Epidemics Database. * significant at 10%; ** significant at 5%; *** significant at 1%.
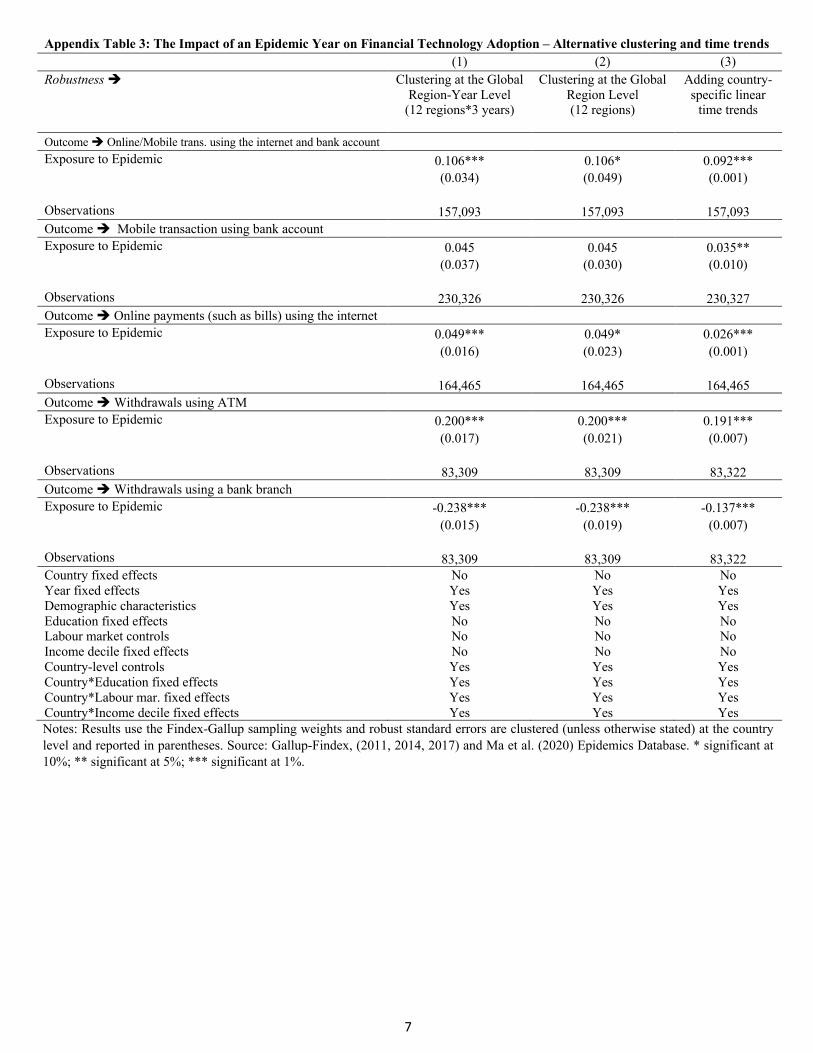
Appendix Table 3: The Impact of an Epidemic Year on Financial Technology Adoption – Alternative clustering and time trends (1) (2) (3) Robustness è Clustering at the Global
Region-Year Level (12 regions*3 years)
Clustering at the Global Region Level (12 regions)
Adding country-specific linear
time trends
Outcome è Online/Mobile trans. using the internet and bank account Exposure to Epidemic 0.106*** 0.106* 0.092*** (0.034) (0.049) (0.001) Observations 157,093 157,093 157,093 Outcome è Mobile transaction using bank account Exposure to Epidemic 0.045 0.045 0.035** (0.037) (0.030) (0.010) Observations 230,326 230,326 230,327 Outcome è Online payments (such as bills) using the internet Exposure to Epidemic 0.049*** 0.049* 0.026*** (0.016) (0.023) (0.001) Observations 164,465 164,465 164,465 Outcome è Withdrawals using ATM Exposure to Epidemic 0.200*** 0.200*** 0.191*** (0.017) (0.021) (0.007) Observations 83,309 83,309 83,322 Outcome è Withdrawals using a bank branch Exposure to Epidemic -0.238*** -0.238*** -0.137*** (0.015) (0.019) (0.007) Observations 83,309 83,309 83,322 Country fixed effects No No No Year fixed effects Yes Yes Yes Demographic characteristics Yes Yes Yes Education fixed effects No No No Labour market controls No No No Income decile fixed effects No No No Country-level controls Yes Yes Yes Country*Education fixed effects Yes Yes Yes Country*Labour mar. fixed effects Yes Yes Yes Country*Income decile fixed effects Yes Yes Yes
8
Notes: Results use the Findex-Gallup sampling weights and robust standard errors are clustered (unless otherwise stated) at the country level and reported in parentheses. Source: Gallup-Findex, (2011, 2014, 2017) and Ma et al. (2020) Epidemics Database. * significant at 10%; ** significant at 5%; *** significant at 1%.
Appendix Table 4: The Impact of an Epidemic Year on Financial Technology Adoption – Placebo Treatments (1) (2) Placebo treatment è Randomising epidemics
across the same-continent countries but with the original epidemic year
Randomising epidemics across the same-
continent countries and across years
Outcome è Online/Mobile trans. using the internet and bank account Placebo treatment -0.019 -0.073 (0.072) (0.073) Observations 157,093 157,093 Outcome è Mobile transaction using bank account Placebo treatment 0.010 -0.022 (0.048) (0.044) Observations 230,326 230,326 Outcome è Online payments (such as bills) using the internet Placebo treatment 0.001 -0.013 (0.023) (0.023) Observations 164,465 164,465 Outcome è Withdrawals using ATM Placebo treatment 0.002 -0.034 (0.025) (0.027) Observations 83,309 83,309 Outcome è Withdrawals using a bank branch Placebo treatment -0.020 0.014 (0.017) (0.018) Observations 83,309 83,309 Country fixed effects No No Year fixed effects Yes Yes Demographic characteristics Yes Yes Education fixed effects No No Labour market controls No No Income decile fixed effects No No Country-level controls Yes Yes Country*Education fixed effects Yes Yes Country*Labour mar. fixed effects Yes Yes Country*Income decile fixed effects Yes Yes
9
Source: World Bank and Ma et al. (2020) Epidemics Database. * significant at 10%; ** significant at 5%; *** significant at 1%. Account at a formal financial inst. (% age 15+) and ATMs per 100,000 adults capture financial access, Financial system deposits to GDP (%), Private credit by deposit money banks to GDP (%), and Deposit money banks' assets to GDP (%) capture financial depth, Bank net interest margin (%) and Bank overhead costs to total assets (%) capture financial efficiency, Bank Z-score captures the probability of default of a country's commercial banking system, Lerner index captures market power in the banking market. It compares output pricing and marginal costs (that is, markup). An increase in the Lerner index indicates a deterioration of the competitive conduct of financial intermediaries.
Appendix Table 5: Balance Test – Country-level characteristics (1) (2) (3) (4) (5) (6)
Outcome è Epidemic
occurrence Epidemic
occurrence High
intensity epidemics
High intensity
epidemics
Low intensity
epidemics
Low intensity
epidemics GDP current USD (log) 0.004 0.041 0.000 0.060 0.003 -0.018 (0.004) (0.080) (0.003) (0.073) (0.002) (0.036) Urban population as a share of total pop. (log) -0.001 0.006 0.002 0.051 -0.003 -0.045 (0.011) (0.445) (0.008) (0.044) (0.007) (0.102) Account at a formal financial inst. (% age 15+) (log) -0.015 0.033 -0.005 0.035 -0.010 0.039 (0.016) (0.027) (0.012) (0.022) (0.011) (0.025) ATMs per 100,000 adults (log) -0.002 0.033 -0.004 0.016 -0.002 0.016 (0.011) (0.027) (0.007) (0.011) (0.009) (0.025) Financial system deposits to GDP (%) (log) -0.028 -0.068 -0.011 -0.048 -0.016 -0.020 (0.016) (0.131) (0.010) (0.129) (0.012) (0.031) Private credit by deposit money banks to GDP (%) (log) -0.006 0.068 -0.006 -0.081 -0.000 -0.013 (0.013) (0.137) (0.008) (0.140) (0.008) (0.025) Deposit money banks' assets to GDP (%) (log) 0.025 -0.012 0.001 -0.037 0.023 0.025 (0.017) (0.047) (0.006) (0.047) (0.016) (0.028) Bank net interest margin (%) (log) -0.047 -0.039 -0.015 0.000 -0.031 -0.039 (0.024) (0.035) (0.014) (0.012) (0.019) (0.033) Bank overhead costs to total assets (%) (log) 0.029 -0.001 -0.004 -0.018 0.024 0.016 (0.019) (0.035) (0.007) (0.029) (0.017) (0.022) Bank Z-score -0.000 0.005 0.000 0.002 0.000 0.003 (0.000) (0.005) (0.000) (0.002) (0.000) (0.005) Lerner index -0.000* -0.000 -0.000 -0.000 -0.000 -0.000 (0.000) (0.000) (0.000) (0.000) (0.000) (0.000) Observations 356 356 356 356 356 356 Country fixed effects No Yes No Yes No Yes Year fixed effects No Yes No Yes No Yes
10
Appendix Table 6: The Impact of an Epidemic Year on Financial Technology Adoption and Access – 2G Coverage as a Placebo Treatment (1) (2) (3) (4) (5) (6) Outcome è Online/Mobile transaction using the internet and bank account Exposure to Epidemic*3G 0.283*** 0.296*** 0.294*** 0.322*** 0.343*** 0.341*** (0.050) (0.055) (0.057) (0.044) (0.045) (0.053) 3G 0.050** 0.035 0.023 0.023 0.022 0.001 (0.024) (0.025) (0.025) (0.023) (0.022) (0.011) Exposure to Epidemic*2G 0.013 0.006 -0.002 -0.021 -0.026 -0.038** (0.024) (0.023) (0.021) (0.026) (0.025) (0.018) 2G -0.020 -0.021 -0.017 -0.014 -0.012 0.011 (0.017) (0.018) (0.017) (0.020) (0.020) (0.014) Exposure to Epidemic 0.079** 0.082** 0.089*** 0.160** 0.162*** -- (0.031) (0.032) (0.032) (0.061) (0.060) Observations 127,184 127,184 127,184 127,184 127,184 127,184 Exp. to Epidemic*Above median 3G 0.288*** 0.226*** 0.239*** 0.237*** 0.164*** 0.162*** (0.014) (0.014) (0.014) (0.013) (0.012) (0.006) Above median 3G 0.003 -0.002 -0.006 -0.004 -0.006 -0.004 (0.014) (0.013) (0.013) (0.012) (0.012) (0.004) Exp. to Epidemic*Above median 2G 0.031 0.026 0.018 0.004 0.000 -0.006 (0.039) (0.038) (0.037) (0.038) (0.036) (0.032) Above median 2G -0.005 -0.009 -0.007 -0.004 -0.003 0.014 (0.017) (0.018) (0.017) (0.021) (0.021) (0.015) Exposure to Epidemic 0.073* 0.074* 0.080** 0.147** 0.148** -- (0.040) (0.040) (0.040) (0.060) (0.059) Observations 127,184 127,184 127,184 127,184 127,184 127,184 Exposure to Epidemic*3G(2011) 0.234*** 0.261*** 0.258*** 0.261*** 0.283*** 0.289*** (0.087) (0.080) (0.089) (0.090) (0.094) (0.093) 3G(2011) 0.078*** 0.052*** 0.029** 0.028** 0.021 0.013 (0.015) (0.014) (0.013) (0.014) (0.013) (0.011) Exposure to Epidemic*2G(2011) 0.040* 0.034 0.026 0.005 -0.004 -0.014 (0.022) (0.022) (0.022) (0.024) (0.022) (0.022) 2G(2011) -0.023 -0.026* -0.021 -0.020 -0.018 0.009 (0.015) (0.015) (0.015) (0.019) (0.019) (0.020) Exposure to Epidemic 0.052* 0.055* 0.061* 0.150** 0.154*** -- (0.031) (0.032) (0.033) (0.059) (0.058) Observations 95,745 95,745 95,745 95,745 95,745 95,745 Notes: In terms of control variables, columns are structured as in Table 3. Results use the Findex-Gallup sampling weights and robust standard errors are clustered at the country level. We check whether our inference is robust to corrections that account for testing of multiple hypotheses by adjusting the p-values using the “sharpened q-value approach” and report them in brackets (in terms of interpretation, for example, a q-value of one percent means that one percent of significant results will result in false positives). Oster's delta indicates the degree of selection on unobservables relative to observables that would be needed to fully explain the results by omitted variable bias. Delta values greater than 1 indicate that the results are not driven by unobservables. Source: Gallup-Findex, (2011, 2014, 2017), Ma et al. (2020) Epidemics Database and Collins Bartholomew’s Mobile Coverage Explorer. * significant at 10%; ** significant at 5%; *** significant at 1%.

11
Appendix Table 7: Robustness to Excluding Influential Treatments (1)
Outcome: Online/Mobile
transaction using the
internet and bank account
(2) Outcome:
Mobile transaction using bank
account
(3) Outcome:
Online payments (such as bills) using
the internet
(4) Outcome:
Withdrawals using ATM
(5) Outcome:
Withdrawals using a bank
branch
Exposure to Epidemic – excl. Guinea 0.106*** 0.045*** 0.049 0.200*** -0.238*** (0.030) [0.001] (0.015) [0.003] (0.030) [0.104] (0.046) [0.000] (0.059) [0.000] Observations 157,093 230,326 164,465 83,309 83,309 Exposure to Epidemic – excl. Italy 0.106*** 0.045*** 0.049 0.200*** -0.238*** (0.030) [0.001] (0.015) [0.003] (0.030) [0.104] (0.046) [0.000] (0.059) [0.000] Observations 157,093 230,326 164,465 83,309 83,309 Exposure to Epidemic – excl. Liberia 0.106*** 0.045*** 0.049 0.200*** -0.238*** (0.030) [0.001] (0.015) [0.003] (0.030) [0.104] (0.046) [0.000] (0.059) [0.000] Observations 157,093 230,326 164,465 83,309 83,309 Exposure to Epidemic – excl. Mali 0.106*** 0.045*** 0.049 0.200*** -0.238*** (0.030) [0.001] (0.015) [0.003] (0.030) [0.104] (0.046) [0.000] (0.059) [0.000] Observations 157,093 230,326 164,465 83,309 83,309 Exposure to Epidemic – excl. Nigeria 0.113*** 0.044** 0.020 0.082*** -0.084*** (0.037) [0.003] (0.019) [0.018] (0.020) [0.332] (0.012) [0.000] (0.014) [0.000] Observations 157,093 230,326 164,465 83,309 83,309 Exposure to Epidemic – excl. Senegal 0.106*** 0.045*** 0.049 0.220*** -0.238*** (0.030) [0.001] (0.015) [0.003] (0.030) [0.104] (0.041) [0.000] (0.059) [0.000] Observations 157,093 230,326 164,465 83,309 83,309 Exposure to Epidemic – excl. Sierra L. 0.106*** 0.045*** 0.049 0.200*** -0.238*** (0.030) [0.001] (0.015) [0.003] (0.030) [0.104] (0.046) [0.000] (0.059) [0.000] Observations 157,093 230,326 164,465 83,309 83,309 Exposure to Epidemic – excl. Spain 0.106*** 0.045*** 0.049 0.200*** -0.238*** (0.030) [0.001] (0.015) [0.003] (0.030) [0.104] (0.046) [0.000] (0.059) [0.000] Observations 157,093 230,326 164,465 83,309 83,309 Exposure to Epidemic – excl. UK 0.106*** 0.045*** 0.049 0.200*** -0.238*** (0.030) [0.001] (0.015) [0.003] (0.030) [0.104] (0.046) [0.000] (0.059) [0.000] Observations 157,093 230,326 164,465 83,309 83,309 Exposure to Epidemic – excl. USA 0.106*** 0.045*** 0.049 0.200*** -0.238*** (0.030) [0.001] (0.015) [0.003] (0.030) [0.104] (0.046) [0.000] (0.059) [0.000] Observations 157,093 230,326 164,465 83,309 83,309 Country fixed effects No No No No No Year fixed effects Yes Yes Yes Yes Yes Demographic characteristics Yes Yes Yes Yes Yes Education fixed effects No No No No No Labour market controls No No No No No Income decile fixed effects No No No No No Country-level controls Yes Yes Yes Yes Yes Country*Education fixed effects Yes Yes Yes Yes Yes Country*Labour mar. fixed effects Yes Yes Yes Yes Yes Country*Income decile fixed effects Yes Yes Yes Yes Yes Notes: Results use the Findex-Gallup sampling weights and robust standard errors are clustered at the country level and reported in parentheses. * significant at 10%; ** significant at 5%; *** significant at 1%.
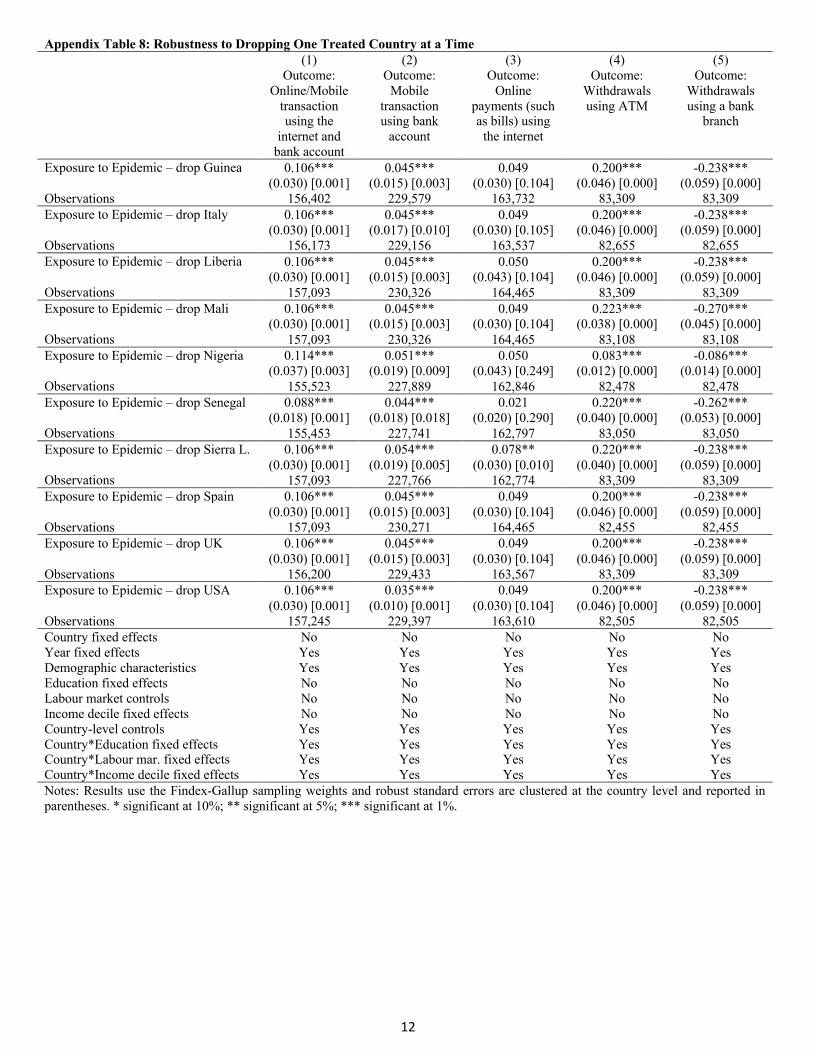
12
Appendix Table 8: Robustness to Dropping One Treated Country at a Time (1)
Outcome: Online/Mobile
transaction using the
internet and bank account
(2) Outcome:
Mobile transaction using bank
account
(3) Outcome:
Online payments (such as bills) using
the internet
(4) Outcome:
Withdrawals using ATM
(5) Outcome:
Withdrawals using a bank
branch
Exposure to Epidemic – drop Guinea 0.106*** 0.045*** 0.049 0.200*** -0.238*** (0.030) [0.001] (0.015) [0.003] (0.030) [0.104] (0.046) [0.000] (0.059) [0.000] Observations 156,402 229,579 163,732 83,309 83,309 Exposure to Epidemic – drop Italy 0.106*** 0.045*** 0.049 0.200*** -0.238*** (0.030) [0.001] (0.017) [0.010] (0.030) [0.105] (0.046) [0.000] (0.059) [0.000] Observations 156,173 229,156 163,537 82,655 82,655 Exposure to Epidemic – drop Liberia 0.106*** 0.045*** 0.050 0.200*** -0.238*** (0.030) [0.001] (0.015) [0.003] (0.043) [0.104] (0.046) [0.000] (0.059) [0.000] Observations 157,093 230,326 164,465 83,309 83,309 Exposure to Epidemic – drop Mali 0.106*** 0.045*** 0.049 0.223*** -0.270*** (0.030) [0.001] (0.015) [0.003] (0.030) [0.104] (0.038) [0.000] (0.045) [0.000] Observations 157,093 230,326 164,465 83,108 83,108 Exposure to Epidemic – drop Nigeria 0.114*** 0.051*** 0.050 0.083*** -0.086*** (0.037) [0.003] (0.019) [0.009] (0.043) [0.249] (0.012) [0.000] (0.014) [0.000] Observations 155,523 227,889 162,846 82,478 82,478 Exposure to Epidemic – drop Senegal 0.088*** 0.044*** 0.021 0.220*** -0.262*** (0.018) [0.001] (0.018) [0.018] (0.020) [0.290] (0.040) [0.000] (0.053) [0.000] Observations 155,453 227,741 162,797 83,050 83,050 Exposure to Epidemic – drop Sierra L. 0.106*** 0.054*** 0.078** 0.220*** -0.238*** (0.030) [0.001] (0.019) [0.005] (0.030) [0.010] (0.040) [0.000] (0.059) [0.000] Observations 157,093 227,766 162,774 83,309 83,309 Exposure to Epidemic – drop Spain 0.106*** 0.045*** 0.049 0.200*** -0.238*** (0.030) [0.001] (0.015) [0.003] (0.030) [0.104] (0.046) [0.000] (0.059) [0.000] Observations 157,093 230,271 164,465 82,455 82,455 Exposure to Epidemic – drop UK 0.106*** 0.045*** 0.049 0.200*** -0.238*** (0.030) [0.001] (0.015) [0.003] (0.030) [0.104] (0.046) [0.000] (0.059) [0.000] Observations 156,200 229,433 163,567 83,309 83,309 Exposure to Epidemic – drop USA 0.106*** 0.035*** 0.049 0.200*** -0.238*** (0.030) [0.001] (0.010) [0.001] (0.030) [0.104] (0.046) [0.000] (0.059) [0.000] Observations 157,245 229,397 163,610 82,505 82,505 Country fixed effects No No No No No Year fixed effects Yes Yes Yes Yes Yes Demographic characteristics Yes Yes Yes Yes Yes Education fixed effects No No No No No Labour market controls No No No No No Income decile fixed effects No No No No No Country-level controls Yes Yes Yes Yes Yes Country*Education fixed effects Yes Yes Yes Yes Yes Country*Labour mar. fixed effects Yes Yes Yes Yes Yes Country*Income decile fixed effects Yes Yes Yes Yes Yes Notes: Results use the Findex-Gallup sampling weights and robust standard errors are clustered at the country level and reported in parentheses. * significant at 10%; ** significant at 5%; *** significant at 1%.
13
Online Appendix B
Full List of Epidemics from the Ma et al. (2020) Dataset Country Year of the epidemic Afghanistan 2009 Albania 2009 Algeria 2009, 2012 Angola 2009 Argentina 2009, 2016 Armenia 2009 Australia 2003, 2009 Austria 2009, 2012 Azerbaijan 2009 Bahamas 2016 Bahrain 2009 Bangladesh 2009 Barbados 2009, 2016 Belarus 2009 Belgium 2009 Belize 2016 Bhutan 2009 Bolivia 2009, 2016 Bosnia and Herzegovina 2009 Botswana 2009 Brazil 2009, 2016 Brunei Darussalam 2009 Bulgaria 2009 Burundi 2009 Cambodia 2009 Cameroon 2009 Canada 2003, 2009, 2016 Cape Verde 2009 Chad 2009 Chile 2009, 2016 China 2003, 2009, 2012 Colombia 2009, 2016 Congo Brazzaville 2009 Congo Kinshasa 2009 Costa Rica 2009, 2016 Croatia 2009 Cuba 2009 Czech Republic 2009 Djibouti 2009
14
Dominican Republic 2009 Ecuador 2009, 2016 Egypt 2009, 2012 El Salvador 2009, 2016 Estonia 2009 Ethiopia 2009 Fiji 2009 Finland 2009 France 2003, 2009, 2012 Gabon 2009 Georgia 2009 Germany 2003, 2009, 2012 Ghana 2009 Greece 2009, 2012 Guatemala 2009, 2016 Guinea 2014 Guyana 2009, 2016 Haiti 2016 Honduras 2009, 2016 Hong Kong 2003 Hungary 2009 Iceland 2009 India 2003, 2009 Indonesia 2003, 2009 Iran 2009 Iran 2012 Iraq 2009 Ireland 2003, 2009 Israel 2009 Italy 2003, 2009, 2012, 2014 Ivory Coast 2009 Jamaica 2009, 2016 Japan 2009 Jordan 2009, 2012 Kazakhstan 2009 Kenya 2009 Kuwait 2003, 2009, 2012 Lao People's Democratic Republic 2009 Lebanon 2009, 2012 Lesotho 2009 Liberia 2014 Libya 2009 Lithuania 2009 Luxembourg 2009
15
China, Macao SAR 2003 Macedonia, FYR 2009 Madagascar 2009 Malawi 2009 Malaysia 2003, 2009, 2012 Mali 2009, 2014 Malta 2009 Mauritius 2009 Mexico 2009 Moldova 2009 Mongolia 2003, 2009 Montenegro 2009 Morocco 2009 Mozambique 2009 Myanmar 2009 Namibia 2009 Nepal 2009 Netherlands 2009, 2012 New Zealand 2003, 2009 Nicaragua 2009, 2016 Nigeria 2009, 2014 Cyprus (Greek) 2009 Norway 2009 Oman 2009, 2012 Pakistan 2009 Palestine 2009 Panama 2009, 2016 Papua New Guinea 2009 Paraguay 2009, 2016 Peru 2009, 2016 Philippines 2003, 2009, 2012 Poland 2009 Portugal 2009 Puerto Rico 2009, 2016 Qatar 2009, 2012 Romania 2003, 2009 Russia 2003, 2009 Rwanda 2009 Saudi Arabia 2009, 2012 Senegal 2014 Serbia 2009 Seychelles 2009 Sierra Leone 2014 Singapore 2003, 2009
16
Slovak Republic 2009 Slovenia 2009 Solomon Islands 2009 South Africa 2003, 2009 South Korea 2003, 2009, 2012 Spain 2003, 2009, 2014 Sri Lanka 2009 Sudan 2009 Suriname 2009, 2016 Swaziland 2009 Sweden 2003 Switzerland 2003, 2009 Syrian Arab Republic 2009 Sao Tome and Principe 2009 Taiwan 2003 Tajikistan 2009 Tanzania 2009 Thailand 2003, 2009, 2012 Trinidad and Tobago 2009, 2016 Tunisia 2009 Tunisia 2012 Turkey 2009, 2012 Uganda 2009 Ukraine 2009 United Arab Emirates 2009, 2012 United Kingdom 2003, 2009, 2012, 2014 United States 2003, 2009, 2012, 2014, 2016 Uruguay 2009, 2016 Venezuela 2009, 2016 Vietnam 2003, 2009 Yemen 2009, 2012 Zambia 2009 Zimbabwe 2009