the auto parts-automotive chain in mexico and china: …dusselpeters.com/55.pdf · the auto...
TRANSCRIPT
The Auto Parts-Automotive Chain inMexico and China: Co-operationPotential?Enrique Dussel Peters*
AbstractMexico’s economic relationship with China has intensified substantially in thelast decade. Based on an increasing literature on the overall and aggregaterelationship, this analysis proposes a detailed examination of the auto parts-automobile chain, which is of utmost importance for both countries andwill be significant for understanding the future trade relationship betweenthem. In order to understand the industrial organization of Mexico andChina, the article first gives an overview of the international trade and indus-trial organization patterns. After establishing the characteristics of Mexico’sand China’s legal framework, production, employment and trade, the analysisconcludes with a group of proposals to improve binational co-operation. Bothcountries – China interested in increasing its export platform based onChinese parts brands and Mexico supplying parts and components and pro-viding decades of experiences in international networks – can benefit fromthese suggestions and overcome current tensions.
Keywords: China; Mexico; Latin America; trade; economy; automobiles-auto parts
The relationship between China and Mexico reflects a profound and abundantarray of historic encounters and clashes and, in the modern era, a varied combi-nation of commercial, cultural and political interactions as well as the effects ofChinese–Mexican immigration up to the first half of the 20th century. Intensepolitical exchange has taken place at the highest level since the diplomatic recog-nition by Mexico of the People’s Republic of China in 1972, and since the 1990sthere have been multiple political and cultural exchanges as well as, despite dip-lomatic efforts, profound trade and economic difficulties.Mexico’s socioeconomic strategy, and since the late 1980s its export-oriented
industrialization,1 led it to opt for rapid integration within the United States mar-ket based on systems of temporary imports for their subsequent export (known as
* National Autonomous University of Mexico. Email: [email protected] Enrique Dussel Peters, Polarizing Mexico. The Impact of Liberalization Strategy (Boulder, CO: Lynne
Rienner, 2000).
82
© The China Quarterly, 2012 doi:10.1017/S0305741011001494
Importaciones Temporales para su Exportación programmes), with which othermarkets such as the European and Asian ones – and even some in whichMexico had occupied a privileged space, such as the Central American andLatin American markets – were relegated to secondary roles in real policy terms.Within that context, this article focuses on the characteristics of the auto
parts-automotive chain (AAC) in China and Mexico. There is significant justifi-cation for the study of the AAC in the two countries and its potential for concreteco-operation: as shown below, the AAC has transformed into a manufacturingand export sector in both countries with crucial effects in S&T, jobs and pro-ductivity, and in general has become a priority sector for the governments ofboth countries. Additionally, different policy sets of instruments have developedtwo different models of industrial organization in the AAC. Considering thedegree of advancement and development of the AAC in both countries, this sec-tor will be critical and to a large degree will define the Mexico–China relationshipin the short and medium terms. The strategy of the respective companies estab-lished in both countries and the growing importance of international and evenbinational trade, as well as their competition in third markets, especially theUnited States, reinforce this conclusion and justification.This study is divided into three sections. The first section provides a brief
description of elements that are affecting the global industrial organization ofthe AAC. The second section analyses the recent development of the AAC estab-lished in Mexico and China and their primary characteristics, particularly for theoriginal equipment manufacturing (OEM) companies and Chinese brands. Thefinal section focuses on concrete options for co-operation between China andMexico in the S&T sphere for the AAC, with the potential to overcome difficul-ties between the two countries and to foster dialogue in the short, medium andlong terms.It is important to situate this article and its main arguments in line with general,
critical and detailed analysis on the Latin American–China relationship.2 However,based on the work of the Centre of Chinese Mexican Studies3 in 2011, it attempts togo further. On the one hand, studies in Latin America should go beyond the discus-sion of China being a “threat or opportunity.” On the other hand, during the lastsix or so years Latin America has provided an extremely descriptive analysis of itsrelationship with China, particularly in terms of trade and investments. This isunderstandable since this relationship is fairly new; however, there is a need for ashift and deepening in the analysis. Since then, countries such as Argentina,
2 Kevin Gallagher and Roberto Porzecanski, The Dragon in the Room: China & the Future of LatinAmerican Industrialization (Stanford, CA: Stanford University Press, 2010); Rhys Jenkins andEnrique Dussel Peters (eds.), China and Latin America: Economic Relations in the 21st Century(Bonn/Mexico: DIE-CECHIMEX/UNAM, 2009).
3 CECHIMEX (Centro de Estudios China–México). Centro de Estudios China–México de la Facultad deEconomía de la Universidad Nacional Autónoma de México. http://www.economia.unam.mx/cechimex/.
The Auto Parts-Automotive Chain in Mexico and China 83
Brazil, Chile, Peru and particularly Mexico have achieved interesting and increas-ingly complex results in their relationship with China.4
Based on this and additional results5 of more than ten years of work, Mexico isideally suited to fit into a discussion of concrete options for co-operation. Thisallows for an analysis and proposals far beyond a “China-bashing” stance, butalso beyond an apparent “positive” versus “negative” attitude regarding theLatin America–China relationship. From the perspective of our results, Chinais massively and qualitatively questioning Latin America and Mexico regardingits short, medium and long-term socioeconomic, technological, social and terri-torial development. However China is not the source of this Latin Americanstructural problem, but rather a “mirror” reflecting the “nakedness”6 of theregion in terms of social and macroeconomic policies, as well as R&D, trade,competitiveness, industrial and innovation policies, and in many other specificsegments. From this perspective, this article is a contribution to enrich theLatin American and particularly the Mexico–China relationship based on thedetailed auto parts-automobile chain analysis and results. To enable such a dia-logue and co-operation it is necessary to understand the concrete current indus-trial organization in both countries.
Antecedents of the International AAC Industrial and Trade OrganizationThis section broadly analyses two critical themes for understanding the effectivepotential for co-operation between Mexico and China: the main characteristics ofthe AAC at the global level and that of Mexico’s trade with China, in order toreview in the following section the characteristics of the AAC in Mexico andChina, respectively. The general context compared is the structural change ofthe Chinese economy, especially in terms of its product and exports, and itsincreasing technological level. Unlike Mexico, in a relatively short period(since the 1990s) China has achieved an impressive rise in technological leveland in expenditure in science and technology.7
4 See e.g. the journal Cuadernos de Trabajo del Cechimex which has published since 2010 a group ofdetailed segments of value-added chains in Latin America and their relationship with China, withdetailed conclusions and policy proposals, such as the case of minerals in Brazil and their relationshipwith China, copper and textiles in Chile and their relationship with China, soja in Argentina and theirrelation with China, and electronics in Mexico and their relationship with China, among others.
5 Enrique Dussel Peters and Yolanda Trápaga Delfín, Hacia un diálogo entre México y China. Dos y tresdécadas de cambios socioeconómicos (Cámara de Senadores, CICIR, Fundación Friedrich Ebert yCechimex/UNAM, Mexico, 2010).
6 In other analyses the argument is discussed in more detailed: for 1980–2009 the GDP per capita growthin China was 15 and 11 times higher than Mexico’s and Latin America’s, while efforts and results interms of R&D have also widened gaps between both regions. Thus, the qualitative questioning ofChina is critical, in addition to concrete contributions such as this one on the AAC. See EnriqueDussel Peters and Yolanda Trápaga Delfín, Oportunidades en la relación económica y commercialentre China y México (Mexico City: Cechimex/UNAM, 2007). Jenkins and Dussel Peters, China andLatin America.
7 OCDE (Organización para la Cooperación y Desarrollo Económico) Banco de Datos (OECD, 2010),http://stats.oecd.org/index.aspx, accessed July 2010.
84 The China Quarterly, 209, March 2012, pp. 82–110
The primary trends of the AAC may be summarized as follows. First, the pro-cess of transferring segments of its value chains in the AAC began in the 1980s8
and has significantly increased since the 1990s, and vehicle and auto parts man-ufacturing has regionalized, as a result both of consumer preferences and tariffconsiderations, and even public sector interventions such as providing incentivesto local and national companies. In this process, Asia has played a critical roleand has been able massively to increase its participation in AAC productionand trade.9
Second, and related, a growing trend towards the formation of “modules”10
has stood out over at least the past 15 years in the AAC and its respective pro-ducts, fostering an increase of its spatial transfer. Electric, transmission, brakes,tooling and other modules may be produced in different plants and locations,facilitating the final assembly process.Third, particularly since 2000 and even more markedly since the international
crisis of 2008, ecological, environmental and efficiency concerns have generated adynamic of innovation and competition among new models – especially hybridsand electric vehicles – that will certainly modify automotive consumption pat-terns in the coming 50 years. The Japanese companies, such as Toyota and itsPrius model, and to a lesser degree the European and American companieshave massively invested in these technologies that will shape the market in thelong term. In the meantime, however, the mature technologies based on petroland diesel engines will continue to account for the majority of AAC share.Fourth, the above-noted processes appear to have been exacerbated since the
2008 international crisis. There have been enormous differences in the regionalgrowth dynamic (see below), important recovery particularly in the subcompactand energy-efficient automobile segments, as well as massive governmental pol-icies to maintain the AAC in their respective countries and allow a reorganizationprocess in the medium term.11
Finally, it is particularly notable at the end of the first decade of the 21st cen-tury that many countries, both OECD members and others, are applying instru-ments to enhance the industrial sector in general and specifically to provideincentives to the AAC. While there is some scepticism regarding their effectivereach,12 large-scale measures, such as soft credits for US$25 billion offered bythe United States Department of Energy for new “green” cars, will allow compa-nies such as Nissan, Ford, Tesla Motors, Tenneco and Fisker Automotive,
8 Michael Piore Michael and Charles Sabel. The Second Industrial Divide: Possibilities for Prosperity(New York: Basic Books, 1984).
9 CEPAL (Comisión Económica para América Latina y el Caribe), La inversión extranjera directa enAmérica Latina y el Caribe (Santiago de Chile: CEPAL, 2010).
10 Timothy Sturgeon, Johannes Biesebroeck and Gary Gereffy, “Value chains, networks and clusters:reframing the global automotive industry,” Working Paper Series (Cambridge, MA: IndustrialPerformance Center) 08-002, 2008.
11 CEPAL, La inversión extranjera directa.12 “Picking winners, saving losers,” The Economist, 7 August 2010, pp. 68–70.
The Auto Parts-Automotive Chain in Mexico and China 85
among others, to orient new technologies towards these sectors and to generatejobs within the United States.13
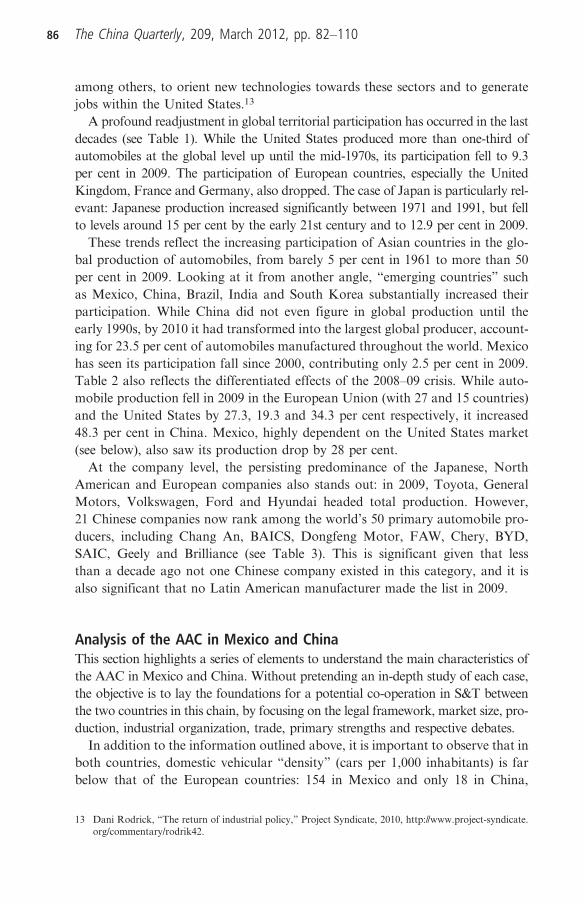
A profound readjustment in global territorial participation has occurred in the lastdecades (see Table 1). While the United States produced more than one-third ofautomobiles at the global level up until the mid-1970s, its participation fell to 9.3per cent in 2009. The participation of European countries, especially the UnitedKingdom, France and Germany, also dropped. The case of Japan is particularly rel-evant: Japanese production increased significantly between 1971 and 1991, but fellto levels around 15 per cent by the early 21st century and to 12.9 per cent in 2009.These trends reflect the increasing participation of Asian countries in the glo-
bal production of automobiles, from barely 5 per cent in 1961 to more than 50per cent in 2009. Looking at it from another angle, “emerging countries” suchas Mexico, China, Brazil, India and South Korea substantially increased theirparticipation. While China did not even figure in global production until theearly 1990s, by 2010 it had transformed into the largest global producer, account-ing for 23.5 per cent of automobiles manufactured throughout the world. Mexicohas seen its participation fall since 2000, contributing only 2.5 per cent in 2009.Table 2 also reflects the differentiated effects of the 2008–09 crisis. While auto-mobile production fell in 2009 in the European Union (with 27 and 15 countries)and the United States by 27.3, 19.3 and 34.3 per cent respectively, it increased48.3 per cent in China. Mexico, highly dependent on the United States market(see below), also saw its production drop by 28 per cent.At the company level, the persisting predominance of the Japanese, North
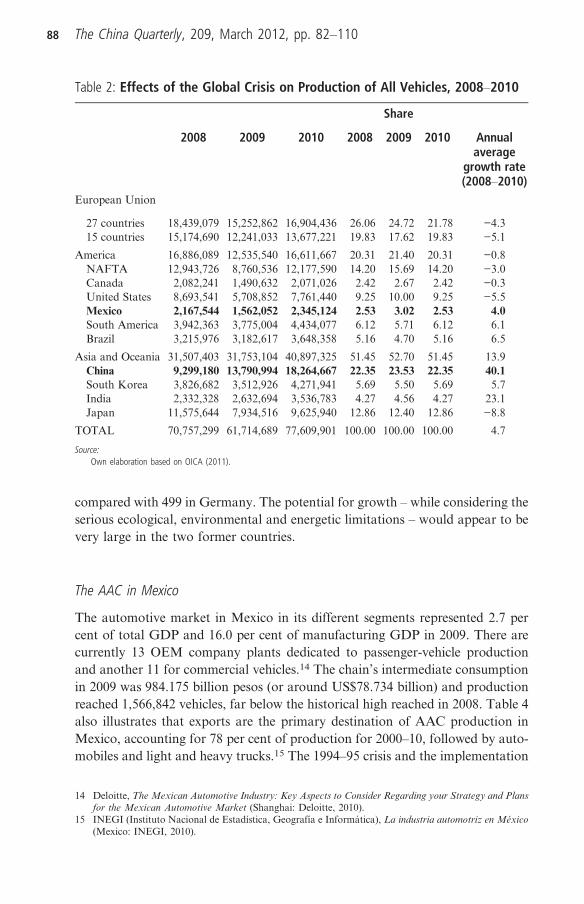
American and European companies also stands out: in 2009, Toyota, GeneralMotors, Volkswagen, Ford and Hyundai headed total production. However,21 Chinese companies now rank among the world’s 50 primary automobile pro-ducers, including Chang An, BAICS, Dongfeng Motor, FAW, Chery, BYD,SAIC, Geely and Brilliance (see Table 3). This is significant given that lessthan a decade ago not one Chinese company existed in this category, and it isalso significant that no Latin American manufacturer made the list in 2009.
Analysis of the AAC in Mexico and ChinaThis section highlights a series of elements to understand the main characteristics ofthe AAC in Mexico and China. Without pretending an in-depth study of each case,the objective is to lay the foundations for a potential co-operation in S&T betweenthe two countries in this chain, by focusing on the legal framework, market size, pro-duction, industrial organization, trade, primary strengths and respective debates.In addition to the information outlined above, it is important to observe that in
both countries, domestic vehicular “density” (cars per 1,000 inhabitants) is farbelow that of the European countries: 154 in Mexico and only 18 in China,
13 Dani Rodrick, “The return of industrial policy,” Project Syndicate, 2010, http://www.project-syndicate.org/commentary/rodrik42.
86 The China Quarterly, 209, March 2012, pp. 82–110
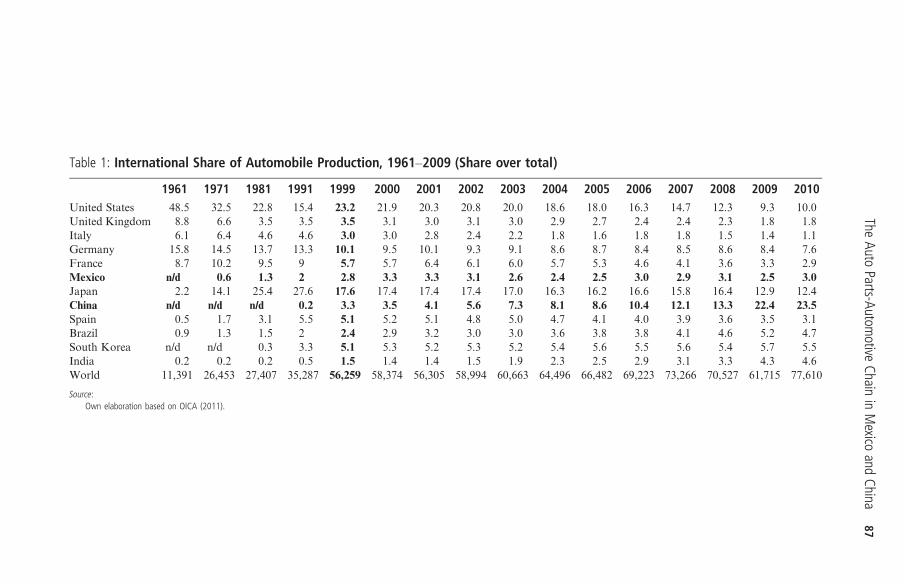
Table 1: International Share of Automobile Production, 1961–2009 (Share over total)
1961 1971 1981 1991 1999 2000 2001 2002 2003 2004 2005 2006 2007 2008 2009 2010United States 48.5 32.5 22.8 15.4 23.2 21.9 20.3 20.8 20.0 18.6 18.0 16.3 14.7 12.3 9.3 10.0United Kingdom 8.8 6.6 3.5 3.5 3.5 3.1 3.0 3.1 3.0 2.9 2.7 2.4 2.4 2.3 1.8 1.8Italy 6.1 6.4 4.6 4.6 3.0 3.0 2.8 2.4 2.2 1.8 1.6 1.8 1.8 1.5 1.4 1.1Germany 15.8 14.5 13.7 13.3 10.1 9.5 10.1 9.3 9.1 8.6 8.7 8.4 8.5 8.6 8.4 7.6France 8.7 10.2 9.5 9 5.7 5.7 6.4 6.1 6.0 5.7 5.3 4.6 4.1 3.6 3.3 2.9Mexico n/d 0.6 1.3 2 2.8 3.3 3.3 3.1 2.6 2.4 2.5 3.0 2.9 3.1 2.5 3.0Japan 2.2 14.1 25.4 27.6 17.6 17.4 17.4 17.4 17.0 16.3 16.2 16.6 15.8 16.4 12.9 12.4China n/d n/d n/d 0.2 3.3 3.5 4.1 5.6 7.3 8.1 8.6 10.4 12.1 13.3 22.4 23.5Spain 0.5 1.7 3.1 5.5 5.1 5.2 5.1 4.8 5.0 4.7 4.1 4.0 3.9 3.6 3.5 3.1Brazil 0.9 1.3 1.5 2 2.4 2.9 3.2 3.0 3.0 3.6 3.8 3.8 4.1 4.6 5.2 4.7South Korea n/d n/d 0.3 3.3 5.1 5.3 5.2 5.3 5.2 5.4 5.6 5.5 5.6 5.4 5.7 5.5India 0.2 0.2 0.2 0.5 1.5 1.4 1.4 1.5 1.9 2.3 2.5 2.9 3.1 3.3 4.3 4.6World 11,391 26,453 27,407 35,287 56,259 58,374 56,305 58,994 60,663 64,496 66,482 69,223 73,266 70,527 61,715 77,610
Source:Own elaboration based on OICA (2011).
TheAuto
Parts-Automotive
ChaininMexico
andChina
87
compared with 499 in Germany. The potential for growth – while considering theserious ecological, environmental and energetic limitations – would appear to bevery large in the two former countries.
The AAC in Mexico
The automotive market in Mexico in its different segments represented 2.7 percent of total GDP and 16.0 per cent of manufacturing GDP in 2009. There arecurrently 13 OEM company plants dedicated to passenger-vehicle productionand another 11 for commercial vehicles.14 The chain’s intermediate consumptionin 2009 was 984.175 billion pesos (or around US$78.734 billion) and productionreached 1,566,842 vehicles, far below the historical high reached in 2008. Table 4also illustrates that exports are the primary destination of AAC production inMexico, accounting for 78 per cent of production for 2000–10, followed by auto-mobiles and light and heavy trucks.15 The 1994–95 crisis and the implementation
Table 2: Effects of the Global Crisis on Production of All Vehicles, 2008–2010
Share
2008 2009 2010 2008 2009 2010 Annualaverage
growth rate(2008–2010)
European Union
27 countries 18,439,079 15,252,862 16,904,436 26.06 24.72 21.78 −4.315 countries 15,174,690 12,241,033 13,677,221 19.83 17.62 19.83 −5.1
America 16,886,089 12,535,540 16,611,667 20.31 21.40 20.31 −0.8NAFTA 12,943,726 8,760,536 12,177,590 14.20 15.69 14.20 −3.0Canada 2,082,241 1,490,632 2,071,026 2.42 2.67 2.42 −0.3United States 8,693,541 5,708,852 7,761,440 9.25 10.00 9.25 −5.5Mexico 2,167,544 1,562,052 2,345,124 2.53 3.02 2.53 4.0South America 3,942,363 3,775,004 4,434,077 6.12 5.71 6.12 6.1Brazil 3,215,976 3,182,617 3,648,358 5.16 4.70 5.16 6.5
Asia and Oceania 31,507,403 31,753,104 40,897,325 51.45 52.70 51.45 13.9China 9,299,180 13,790,994 18,264,667 22.35 23.53 22.35 40.1South Korea 3,826,682 3,512,926 4,271,941 5.69 5.50 5.69 5.7India 2,332,328 2,632,694 3,536,783 4.27 4.56 4.27 23.1Japan 11,575,644 7,934,516 9,625,940 12.86 12.40 12.86 −8.8
TOTAL 70,757,299 61,714,689 77,609,901 100.00 100.00 100.00 4.7
Source:Own elaboration based on OICA (2011).
14 Deloitte, The Mexican Automotive Industry: Key Aspects to Consider Regarding your Strategy and Plansfor the Mexican Automotive Market (Shanghai: Deloitte, 2010).
15 INEGI (Instituto Nacional de Estadística, Geografía e Informática), La industria automotriz en México(Mexico: INEGI, 2010).
88 The China Quarterly, 209, March 2012, pp. 82–110
of NAFTA, from this perspective, mark a turning point in the export orientationand an internal market that has still not recovered since that time. With around 1million direct and indirect jobs in 10,742 companies, the AAC is one of the coun-try’s most relevant chains in terms of production, trade and employment.16 Some43 per cent of its employment is concentrated in the manufacture of automotiveparts, 32 per cent in mechanic shops, 17 per cent in spare parts distributors, 8 percent in the distribution and sales network, and 6 per cent in the finished productmanufacturing industry.17
Table 3: Main Automobile Producers 2009
Total % Cars %Total 60,499,159 100.00 51,075,480 100.00
1 Toyota 7,234,439 11.96 6,148,794 12.042 G.M. 6,459,053 10.68 4,997,824 9.793 Volkswagen 6,067,208 10.03 5,902,583 11.564 Ford 4,685,394 7.74 2,952,026 5.785 Hyundai 4,645,776 7.68 4,222,532 8.276 PSA 3,042,311 5.03 2,769,902 5.427 Honda 3,012,637 4.98 2,984,011 5.848 Nissan 2,744,562 4.54 2,381,260 4.669 Fiat 2,460,222 4.07 1,958,021 3.83
10 Suzuki 2,387,537 3.95 2,103,553 4.1218 Beijing Automotive 684,534 1.13 684,534 1.3420 Dongfeng Motor 663,262 1.10 663,262 1.3021 FAW 650,275 1.07 650,275 1.2722 Chery 508,567 0.84 508,567 1.0024 BYD 427,732 0.71 427,732 0.8425 SAIC 347,598 0.57 347,598 0.6826 Anhui Jianghuai 336,979 0.56 336,979 0.6627 Geely 330,275 0.55 330,275 0.6529 Brilliance 314,189 0.52 314,189 0.6231 Great Wall 226,560 0.37 226,560 0.4433 Shandong Kaima 169,023 0.28 169,023 0.3335 China National 120,930 0.20 120,930 0.2437 Chongqing Lifan 104,434 0.17 104,434 0.2038 Fujian 103,171 0.17 103,171 0.2040 Shaanxi Auto 79,026 0.13 0.0042 Ziyang Nanjun 72,470 0.12 72,470 0.1445 Guangzhou Auto 62,990 0.10 62,990 0.1247 Chenzhou Ji’ao 51,008 0.08 51,008 0.1048 Qingling Motor 50,120 0.08 50,120 0.1049 Hebei Zhongxing 48,173 0.08 48,173 0.09
Other 12,408,704 20.51 9,382,684 18.37
Source:Own elaboration based on OICA (2010).
16 SE (Secretaría de Economía), Agenda para la competitividad de la industria automotriz en México(Mexico: SE, 2008).
17 Ibid.
The Auto Parts-Automotive Chain in Mexico and China 89
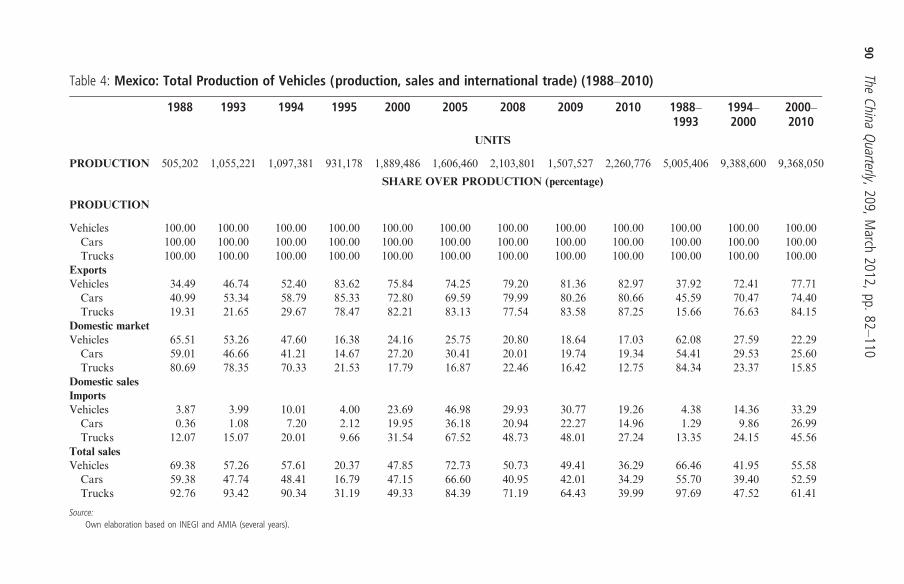
Table 4: Mexico: Total Production of Vehicles (production, sales and international trade) (1988–2010)
1988 1993 1994 1995 2000 2005 2008 2009 2010 1988–1993
1994–2000
2000–2010
UNITS
PRODUCTION 505,202 1,055,221 1,097,381 931,178 1,889,486 1,606,460 2,103,801 1,507,527 2,260,776 5,005,406 9,388,600 9,368,050
SHARE OVER PRODUCTION (percentage)
PRODUCTION
Vehicles 100.00 100.00 100.00 100.00 100.00 100.00 100.00 100.00 100.00 100.00 100.00 100.00Cars 100.00 100.00 100.00 100.00 100.00 100.00 100.00 100.00 100.00 100.00 100.00 100.00Trucks 100.00 100.00 100.00 100.00 100.00 100.00 100.00 100.00 100.00 100.00 100.00 100.00
ExportsVehicles 34.49 46.74 52.40 83.62 75.84 74.25 79.20 81.36 82.97 37.92 72.41 77.71
Cars 40.99 53.34 58.79 85.33 72.80 69.59 79.99 80.26 80.66 45.59 70.47 74.40Trucks 19.31 21.65 29.67 78.47 82.21 83.13 77.54 83.58 87.25 15.66 76.63 84.15
Domestic marketVehicles 65.51 53.26 47.60 16.38 24.16 25.75 20.80 18.64 17.03 62.08 27.59 22.29
Cars 59.01 46.66 41.21 14.67 27.20 30.41 20.01 19.74 19.34 54.41 29.53 25.60Trucks 80.69 78.35 70.33 21.53 17.79 16.87 22.46 16.42 12.75 84.34 23.37 15.85
Domestic salesImportsVehicles 3.87 3.99 10.01 4.00 23.69 46.98 29.93 30.77 19.26 4.38 14.36 33.29
Cars 0.36 1.08 7.20 2.12 19.95 36.18 20.94 22.27 14.96 1.29 9.86 26.99Trucks 12.07 15.07 20.01 9.66 31.54 67.52 48.73 48.01 27.24 13.35 24.15 45.56
Total salesVehicles 69.38 57.26 57.61 20.37 47.85 72.73 50.73 49.41 36.29 66.46 41.95 55.58
Cars 59.38 47.74 48.41 16.79 47.15 66.60 40.95 42.01 34.29 55.70 39.40 52.59Trucks 92.76 93.42 90.34 31.19 49.33 84.39 71.19 64.43 39.99 97.69 47.52 61.41
Source:Own elaboration based on INEGI and AMIA (several years).
90The
ChinaQuarterly,209,M
arch2012,pp.82
–110
It is important to remember that Mexico has a long history of incentives to theAAC, with five decrees between 1962 and 1993, the last of which aimed toachieve certain levels of added value in Mexico, as well as technological pro-visions and requirements related to the trade balance, among other purposes.With NAFTA, regional rules of origin govern Mexico’s industrial organization:the regional content value (measured based on transaction and net cost value)established in NAFTA article 401 allows regional production to benefit from tar-iff reductions. Since 2002, the level of added value to benefit from the rules oforigin is 62.5 per cent, with the objective of preventing foreign (especiallyJapanese) companies from using Mexico as an export “trampoline” to theUnited States.18 On the other hand, Mexico has its own legislation to promotecompetitive advantages for the automotive industry19 with several later decreesdating up to April 2010. In general, the Mexican legislation, evaluated up toAugust 2010, demands compliance with a series of provisions by new manufac-turers of vehicles weighing up to 8,864 kilograms: the manufacture of at least50,000 units; investment in Mexico of at least US$100 million in fixed assetsfor automotive production; and established agreements to distribute supply toconsumers of the vehicles. A series of conditions also exists for new manufac-turers without previous production in Mexico: in addition to the provisionsabove, exceptional permission is granted to import vehicles with zero ad-valoremtariff rates during the first three years of installation of a new manufacturer for 10per cent of the production. This criterion continues even after the first three yearsof production.20
There are several main current characteristics of the AAC in Mexico.21 It isconstituted by four large segments: assemblers, larger components and sub-assembly, parts and components, and raw materials. There are 17 assembly com-panies in the first segment, all of which are foreign. The automotive parts sectorhas around 1,500 national and foreign manufacturers.The AAC is – along with the electronic and yarn-textiles-garments industries –
one of the paradigmatic sectors of the Mexican economy (particularly the man-ufacturing sector) affected by the structural change oriented towards exports:unlike in the 1980s, it currently exports more than three-quarters of its pro-duction, predominantly to the United States. In other words, since the approvalof NAFTA and its inauguration in January 1994, the AAC in Mexico is
18 Enrique Dussel Peters, Clemente Ruiz Durán and Taeko Taniura, “Changes in industrial organizationof the Mexican automobile industry by economic liberalization,” Joint Research Program Series No.120 (Institute of Developing Economies, 1997); Gary Hufbauer and Jeffrey Schott, NAFTARevisited: Achievements and Challenges (Washington DC: IIE, 2005).
19 DOF (Diario Oficial de la Federación), “Decreto para el apoyo de la competitividad de la industriaautomotriz terminal y el impulso al desarrollo del mercado interno de automóviles,” 31 December 2003.
20 As of the close of 2010, the decree may in fact be considered “anti-China and anti-India” given that theyare practically the only relevant international manufacturers that have not invested in Mexico.
21 Dussel Peters et al., “Changes in industrial organization”; INEGI, La industria automotriz en México;information directly provided by several business chambers such as AMDA (Asociación Mexicana deDistribuidores de Automotres), INA (Industria Nacional de Autopartes) and AMIA (AsociaciónMexicana de la Industria Automotriz).
The Auto Parts-Automotive Chain in Mexico and China 91
profoundly integrated with that of the United States, to such a degree that wecould refer to a regional AAC (Canada, the United States and Mexico) withregional models, inputs, products and processes, in other words an industrialorganization. Table 4 reflects how all the main segments of the AAC have experi-enced this export orientation, in both cars and trucks. In contrast, the internalmarket has suffered, and in 2008 and 2009 represented absolute levels belowthose of the early 1990s. From the perspective of the main business organiz-ations,22 this constitutes the primary structural problem of the AAC inMexico: the lack of internal demand.It is also important to note that Mexico’s export orientation manifests more
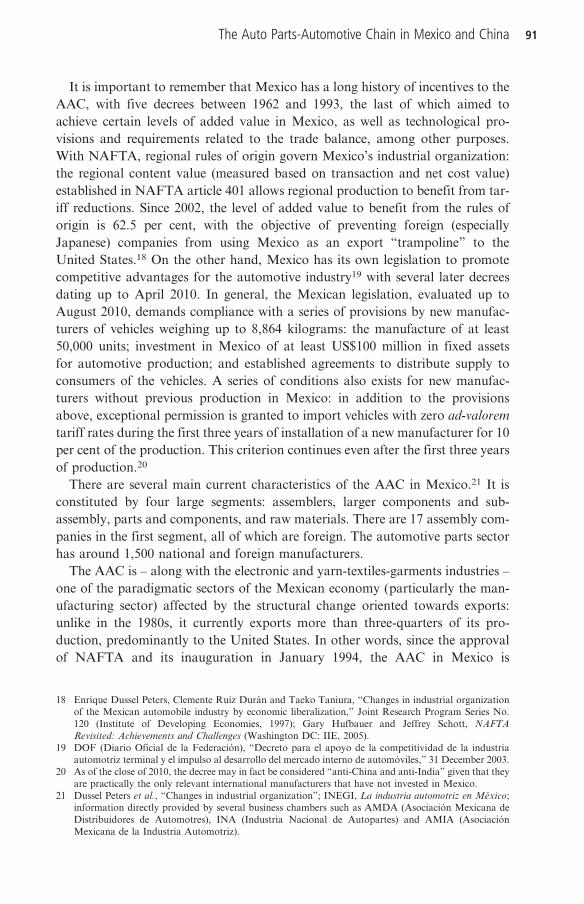
than 15 years of export experiences towards more than a dozen markets, withimplications in transportation, logistics and intra- and inter-companyrelations. Furthermore, and considering the enormous importance forMexico of the United States in the external trade of the AAC, the beginningof NAFTA in 2004 implied a deepening of regional industrial organization.Based on a detailed analysis of the trade of Mexico’s AAC, various character-istics stand out.23 The AAC has acquired more and more importance inMexico’s foreign trade, accounting in 2010 for 28 per cent and 17 per centof total exports and imports respectively, with an annual trade surplus aboveUS$20 billion since 2006, making it Mexico’s most important trade surpluschain. The auto parts segment of the AAC has increased its participation inexports, contributing more than 60 per cent of the exports since 2004, whileaccounting for close to 80 per cent of AAC imports. However, more than80 per cent of the AAC trade surplus is currently generated by the automotivesegment (see Figure 1).By countries, Mexico’s AAC trade reflects the fact that more than 90 per cent
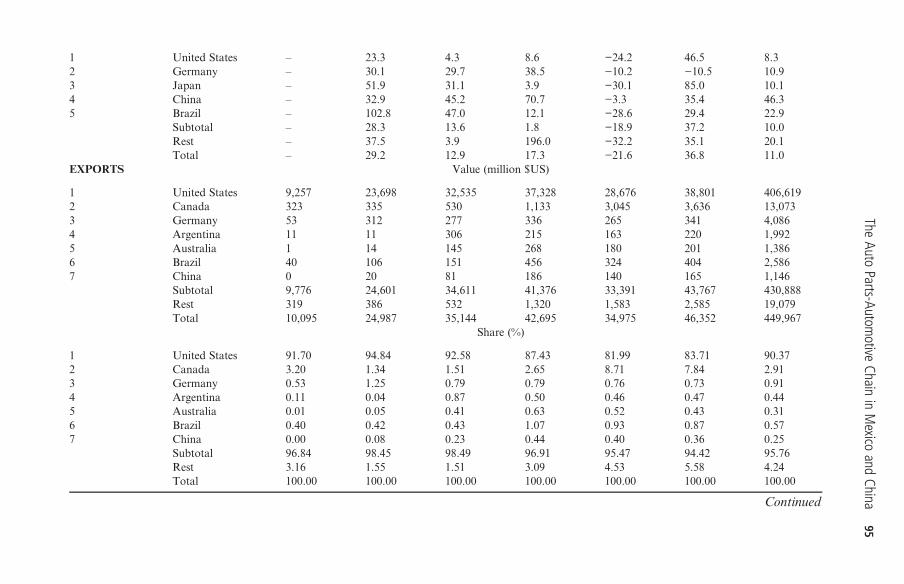
of auto parts and automotive exports are directed towards the United States andCanada, while imports in both categories are significantly lower (less than 50 percent of the total since 2008) from the NAFTA region. In auto parts, China hastransformed into Mexico’s second importer (with 11.81 per cent in 2010), fol-lowed by Germany and Japan, while in the automotive segment, Japan,Canada and Germany represented between 8 and 9 per cent of imported auto-mobiles. In the last category, it is notable that in the mid-1990s the participationof the United States reached 88 per cent, dropping to 45 per cent in 2010. In autoparts as well, US participation in Mexico’s total imports dropped from levelsabove 75 per cent in the 1990s to 53 per cent in 2010. Beyond the historic andcurrent predominance of the United States in AAC trade, Table 5 reflects theimportant changes experienced by the AAC in trade, in particular China’s veryimportant growth in this category: exports to China and imports from China
22 AMDA, AMIA and INA, “El sector automotriz en México ante la crisis financiera y económica inter-nacional,” Mexico: AMDA, AMIA and INA (Working meeting with Secretary of Finance, AgustínCarstens Carstens), 19 March 2009.
23 The auto parts-automotive chain is constituted by 129 sub-divisions (to six digits): 112 auto parts and 17automotive segment companies.
92 The China Quarterly, 209, March 2012, pp. 82–110
within the AAC grew with an average annual growth rate of 51.2 per cent and46.3 per cent, respectively, between 1995 and 2009. As a result, Chinese partici-pation in both categories was second in importance, outpaced only by the UnitedStates. However, the trade balance was very unequal for Mexico, with a tradedeficit of almost US$5 billion in 2010.At the subdivision level (6 digits of the Harmonized System), the primary
Mexican automotive exports are concentrated in automobiles with cylindercapacities between 1,500 and 3,000 cm3 (over 60 per cent of the total in 2010),while auto parts imports are very diversified among more than 20 parts – includ-ing machinery, components, transmitter devices, motors, gearboxes, axles, steer-ing boxes, gaskets and shock absorbers, among others – that represented 36 percent of total parts imports in Mexico in 2009. A detailed tariff study of five sub-divisions (and several dozen of respective fractions) of the AAC reveals that, ingeneral, no import tariff exists, particularly with countries with which Mexicohas a free trade agreement (currently numbering 42). Despite the above, agroup of Latin American countries in particular (most importantly Brazil) andAsian countries (most notably China) receive no special tariff treatment, andin ten cases pay a 5 per cent tariff (for example, 87082901 and 87082910,among others). However, the case of subdivision 870323 (passenger vehicleswith cylinder capacities above 1,500 cm3) stands out, in which the rest of theworld – countries with which Mexico has not signed a FTA such as China –
pay tariffs of between 30 and 50 per cent (for new and used cars with cylindercapacities between 1,500 and 3,000 cm3) respectively. As of 1 January 2012,the tariff for new cars from countries with which Mexico does not have a tradeagreement will fall from 30 to 20 per cent. This disincentive to import auto-mobiles is consistent with the previously noted policies for investing in Mexicoand a consequence of the previously outlined NAFTA norms, although it gener-ates a high “entry barrier” for new manufacturers, especially Chinese and Indiancompanies.
Figure 1: Mexico: Trade Balance of AAC, 1995–2010 (US$)
Source:Own calculations based on Cechimex (2011). (colour online)
The Auto Parts-Automotive Chain in Mexico and China 93
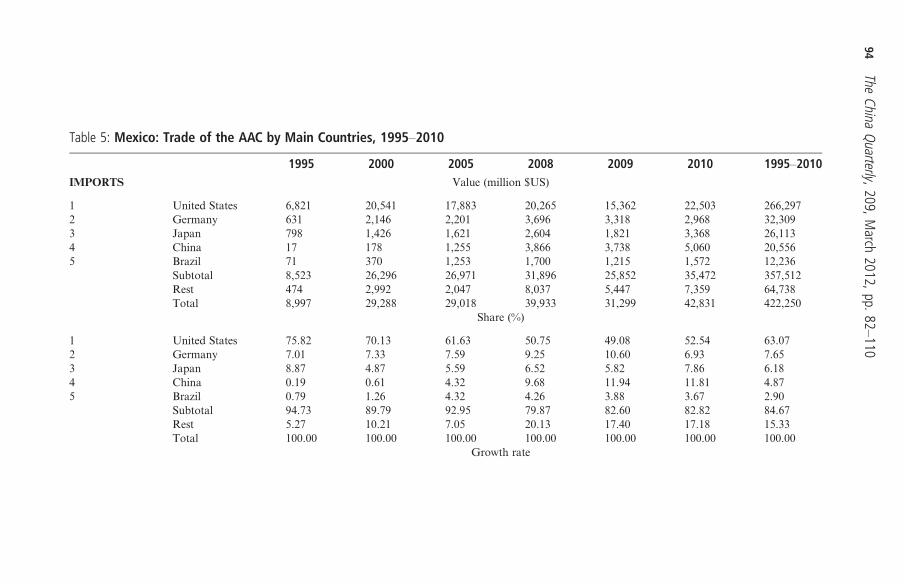
Table 5: Mexico: Trade of the AAC by Main Countries, 1995–2010
1995 2000 2005 2008 2009 2010 1995–2010IMPORTS Value (million $US)
1 United States 6,821 20,541 17,883 20,265 15,362 22,503 266,2972 Germany 631 2,146 2,201 3,696 3,318 2,968 32,3093 Japan 798 1,426 1,621 2,604 1,821 3,368 26,1134 China 17 178 1,255 3,866 3,738 5,060 20,5565 Brazil 71 370 1,253 1,700 1,215 1,572 12,236
Subtotal 8,523 26,296 26,971 31,896 25,852 35,472 357,512Rest 474 2,992 2,047 8,037 5,447 7,359 64,738Total 8,997 29,288 29,018 39,933 31,299 42,831 422,250
Share (%)
1 United States 75.82 70.13 61.63 50.75 49.08 52.54 63.072 Germany 7.01 7.33 7.59 9.25 10.60 6.93 7.653 Japan 8.87 4.87 5.59 6.52 5.82 7.86 6.184 China 0.19 0.61 4.32 9.68 11.94 11.81 4.875 Brazil 0.79 1.26 4.32 4.26 3.88 3.67 2.90
Subtotal 94.73 89.79 92.95 79.87 82.60 82.82 84.67Rest 5.27 10.21 7.05 20.13 17.40 17.18 15.33Total 100.00 100.00 100.00 100.00 100.00 100.00 100.00
Growth rate
94The
ChinaQuarterly,209,M
arch2012,pp.82
–110
1 United States – 23.3 4.3 8.6 −24.2 46.5 8.32 Germany – 30.1 29.7 38.5 −10.2 −10.5 10.93 Japan – 51.9 31.1 3.9 −30.1 85.0 10.14 China – 32.9 45.2 70.7 −3.3 35.4 46.35 Brazil – 102.8 47.0 12.1 −28.6 29.4 22.9
Subtotal – 28.3 13.6 1.8 −18.9 37.2 10.0Rest – 37.5 3.9 196.0 −32.2 35.1 20.1Total – 29.2 12.9 17.3 −21.6 36.8 11.0
EXPORTS Value (million $US)
1 United States 9,257 23,698 32,535 37,328 28,676 38,801 406,6192 Canada 323 335 530 1,133 3,045 3,636 13,0733 Germany 53 312 277 336 265 341 4,0864 Argentina 11 11 306 215 163 220 1,9925 Australia 1 14 145 268 180 201 1,3866 Brazil 40 106 151 456 324 404 2,5867 China 0 20 81 186 140 165 1,146
Subtotal 9,776 24,601 34,611 41,376 33,391 43,767 430,888Rest 319 386 532 1,320 1,583 2,585 19,079Total 10,095 24,987 35,144 42,695 34,975 46,352 449,967
Share (%)
1 United States 91.70 94.84 92.58 87.43 81.99 83.71 90.372 Canada 3.20 1.34 1.51 2.65 8.71 7.84 2.913 Germany 0.53 1.25 0.79 0.79 0.76 0.73 0.914 Argentina 0.11 0.04 0.87 0.50 0.46 0.47 0.445 Australia 0.01 0.05 0.41 0.63 0.52 0.43 0.316 Brazil 0.40 0.42 0.43 1.07 0.93 0.87 0.577 China 0.00 0.08 0.23 0.44 0.40 0.36 0.25
Subtotal 96.84 98.45 98.49 96.91 95.47 94.42 95.76Rest 3.16 1.55 1.51 3.09 4.53 5.58 4.24Total 100.00 100.00 100.00 100.00 100.00 100.00 100.00
Continued
TheAuto
Parts-Automotive
ChaininMexico
andChina
95
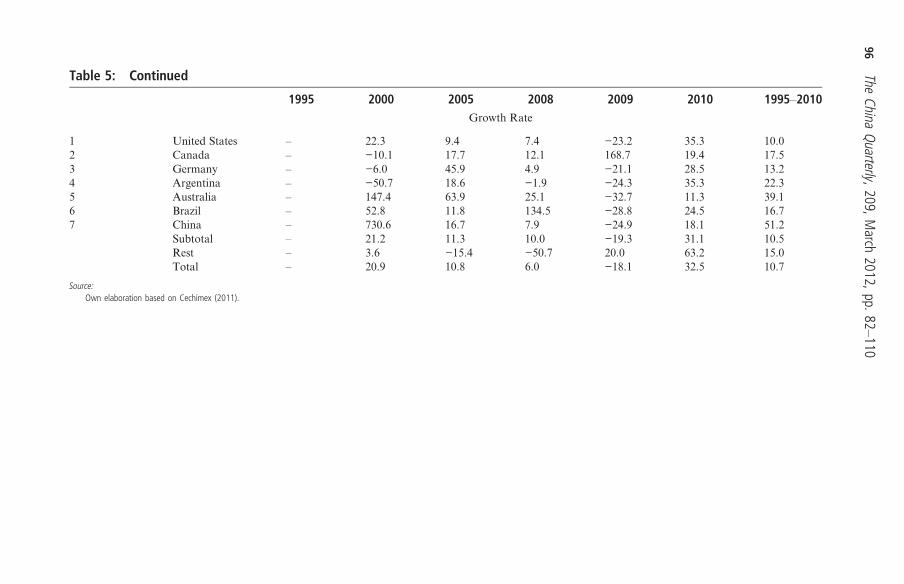
Table 5: Continued
1995 2000 2005 2008 2009 2010 1995–2010Growth Rate
1 United States – 22.3 9.4 7.4 −23.2 35.3 10.02 Canada – −10.1 17.7 12.1 168.7 19.4 17.53 Germany – −6.0 45.9 4.9 −21.1 28.5 13.24 Argentina – −50.7 18.6 −1.9 −24.3 35.3 22.35 Australia – 147.4 63.9 25.1 −32.7 11.3 39.16 Brazil – 52.8 11.8 134.5 −28.8 24.5 16.77 China – 730.6 16.7 7.9 −24.9 18.1 51.2
Subtotal – 21.2 11.3 10.0 −19.3 31.1 10.5Rest – 3.6 −15.4 −50.7 20.0 63.2 15.0Total – 20.9 10.8 6.0 −18.1 32.5 10.7
Source:Own elaboration based on Cechimex (2011).
96The
ChinaQuarterly,209,M
arch2012,pp.82
–110
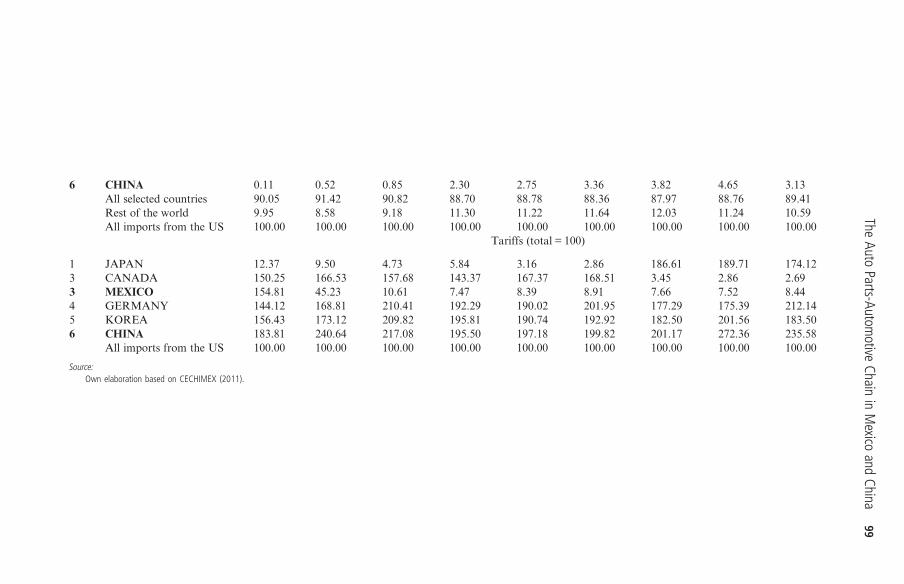
Considering the critical importance of the United States for the AAC trade,24
Table 6 illustrates the profound integration between Mexico and the UnitedStates in the AAC. For the United States as well, Mexico has consolidated itselfsince NAFTA as the primary importer: while Mexican AAC imports contributedbarely 8 per cent in 1990, in 2009 Mexico converted into the primary exporter inthe AAC to the United States, with 24.29 per cent, displacing even Japan,Canada and European Union countries. China, which in 1990 generated only0.11 per cent of US AAC imports, presents the highest average annual growthrate of the primary exporters to the United States, calculated at 25.5 per centduring 1990–2009, with exports representing 5 per cent of the United Statestotal (see Table 5).Table 6 also illustrates the enormous tariff benefits obtained by Mexico as a
result of NAFTA and one of their primary objectives: for its respective AACexports to the United States, only Canada is imposed lower tariffs thanMexico. In the case of China, for example, a 30-times higher tariff waslevied in 2010. While the aggregated tariff is low – China pays 2.72 per cent onaverage – with small profit margins and at the specific product levels, these differ-ences can play a critical role in decision-making. On the other hand, establishingplants to export from Mexico or Canada implies significant tariff incentives.A further characteristic of the AAC in Mexico is that the AAC crisis since 2008
has had profound repercussions on North America and Mexico. In statisticalterms, the AAC crisis during 2007–09 has been the most severe recorded for aslong as comparative information has been compiled. With production of1,566,842 units in Mexico,25 it fell by 28.9 per cent from 2008 to 2009, with levelslower than in 2000. There has also been a profound impact on jobs: from August2007, when the AAC registered its highest levels of production and employment,to January 2010, AAC sector employment dropped by 21.3 per cent. Table 6 alsoillustrates the 22 per cent collapse of AAC exports to the United States in 2009,although that of other countries was even higher (with average declines of 31 percent). Chinese imports fell only 17.7 per cent, which also contributed to increasetheir participation in crisis periods.It is also important to note that the auto parts industry – unlike the automo-
tive, where manufacturers are all foreign – has significant Mexican participationand has increased its export value from levels approaching US$10 billion in themid-1990s to over US$40 billion since then. This feature is one of the most rel-evant of the industrial organization of the AAC: Mexican capital only
24 This integration with the US is also obvious at the company level: vehicle production by the “big three”US producers (Chrysler, Ford and General Motors) represented 52.4% of total automobile productionin 2009, although this is far below the levels above 60% prior to the signature of NAFTA. Paradoxically,NAFTA resulted in the notably reduced participation of these companies in total production, alsoaffected by the rise of other companies such as Honda, Mercedez-Benz, Renault and Toyota, and thegrowing participation of Volkswagen and Nissan.
25 INEGI, “La industria automotriz en México,” p. 5.
The Auto Parts-Automotive Chain in Mexico and China 97
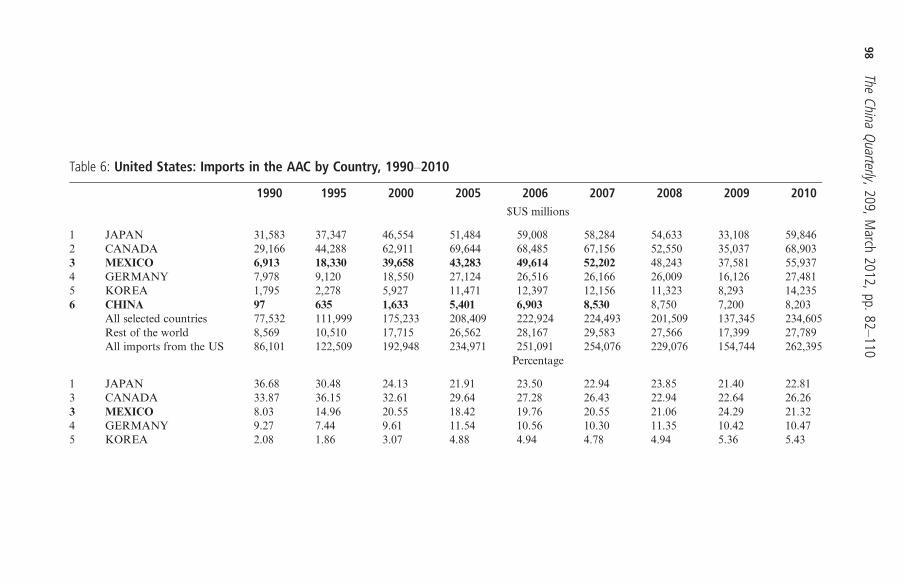
Table 6: United States: Imports in the AAC by Country, 1990–2010
1990 1995 2000 2005 2006 2007 2008 2009 2010$US millions
1 JAPAN 31,583 37,347 46,554 51,484 59,008 58,284 54,633 33,108 59,8462 CANADA 29,166 44,288 62,911 69,644 68,485 67,156 52,550 35,037 68,9033 MEXICO 6,913 18,330 39,658 43,283 49,614 52,202 48,243 37,581 55,9374 GERMANY 7,978 9,120 18,550 27,124 26,516 26,166 26,009 16,126 27,4815 KOREA 1,795 2,278 5,927 11,471 12,397 12,156 11,323 8,293 14,2356 CHINA 97 635 1,633 5,401 6,903 8,530 8,750 7,200 8,203
All selected countries 77,532 111,999 175,233 208,409 222,924 224,493 201,509 137,345 234,605Rest of the world 8,569 10,510 17,715 26,562 28,167 29,583 27,566 17,399 27,789All imports from the US 86,101 122,509 192,948 234,971 251,091 254,076 229,076 154,744 262,395
Percentage
1 JAPAN 36.68 30.48 24.13 21.91 23.50 22.94 23.85 21.40 22.813 CANADA 33.87 36.15 32.61 29.64 27.28 26.43 22.94 22.64 26.263 MEXICO 8.03 14.96 20.55 18.42 19.76 20.55 21.06 24.29 21.324 GERMANY 9.27 7.44 9.61 11.54 10.56 10.30 11.35 10.42 10.475 KOREA 2.08 1.86 3.07 4.88 4.94 4.78 4.94 5.36 5.43
98The
ChinaQuarterly,209,M
arch2012,pp.82
–110
6 CHINA 0.11 0.52 0.85 2.30 2.75 3.36 3.82 4.65 3.13All selected countries 90.05 91.42 90.82 88.70 88.78 88.36 87.97 88.76 89.41Rest of the world 9.95 8.58 9.18 11.30 11.22 11.64 12.03 11.24 10.59All imports from the US 100.00 100.00 100.00 100.00 100.00 100.00 100.00 100.00 100.00
Tariffs (total = 100)
1 JAPAN 12.37 9.50 4.73 5.84 3.16 2.86 186.61 189.71 174.123 CANADA 150.25 166.53 157.68 143.37 167.37 168.51 3.45 2.86 2.693 MEXICO 154.81 45.23 10.61 7.47 8.39 8.91 7.66 7.52 8.444 GERMANY 144.12 168.81 210.41 192.29 190.02 201.95 177.29 175.39 212.145 KOREA 156.43 173.12 209.82 195.81 190.74 192.92 182.50 201.56 183.506 CHINA 183.81 240.64 217.08 195.50 197.18 199.82 201.17 272.36 235.58
All imports from the US 100.00 100.00 100.00 100.00 100.00 100.00 100.00 100.00 100.00
Source:Own elaboration based on CECHIMEX (2011).
TheAuto
Parts-Automotive
ChaininMexico
andChina
99
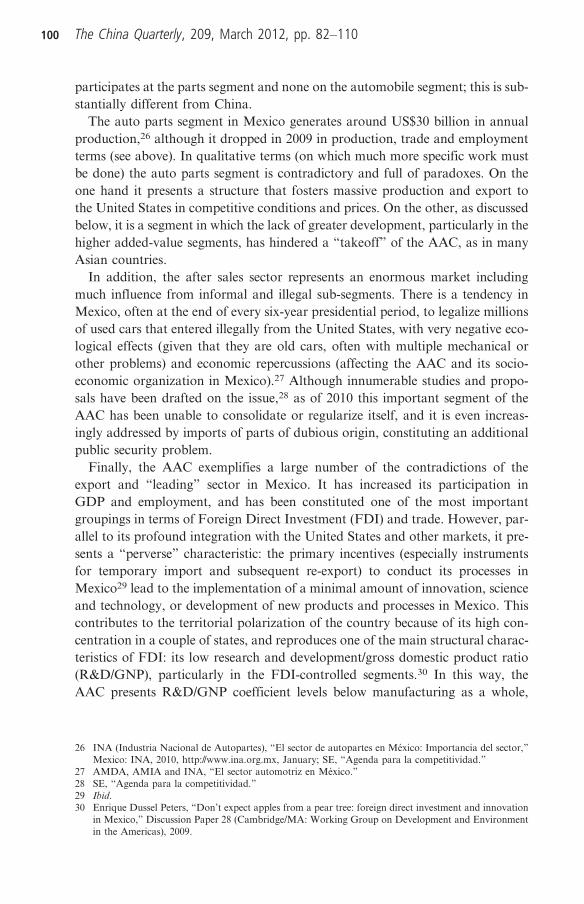
participates at the parts segment and none on the automobile segment; this is sub-stantially different from China.The auto parts segment in Mexico generates around US$30 billion in annual
production,26 although it dropped in 2009 in production, trade and employmentterms (see above). In qualitative terms (on which much more specific work mustbe done) the auto parts segment is contradictory and full of paradoxes. On theone hand it presents a structure that fosters massive production and export tothe United States in competitive conditions and prices. On the other, as discussedbelow, it is a segment in which the lack of greater development, particularly in thehigher added-value segments, has hindered a “takeoff” of the AAC, as in manyAsian countries.In addition, the after sales sector represents an enormous market including
much influence from informal and illegal sub-segments. There is a tendency inMexico, often at the end of every six-year presidential period, to legalize millionsof used cars that entered illegally from the United States, with very negative eco-logical effects (given that they are old cars, often with multiple mechanical orother problems) and economic repercussions (affecting the AAC and its socio-economic organization in Mexico).27 Although innumerable studies and propo-sals have been drafted on the issue,28 as of 2010 this important segment of theAAC has been unable to consolidate or regularize itself, and it is even increas-ingly addressed by imports of parts of dubious origin, constituting an additionalpublic security problem.Finally, the AAC exemplifies a large number of the contradictions of the
export and “leading” sector in Mexico. It has increased its participation inGDP and employment, and has been constituted one of the most importantgroupings in terms of Foreign Direct Investment (FDI) and trade. However, par-allel to its profound integration with the United States and other markets, it pre-sents a “perverse” characteristic: the primary incentives (especially instrumentsfor temporary import and subsequent re-export) to conduct its processes inMexico29 lead to the implementation of a minimal amount of innovation, scienceand technology, or development of new products and processes in Mexico. Thiscontributes to the territorial polarization of the country because of its high con-centration in a couple of states, and reproduces one of the main structural charac-teristics of FDI: its low research and development/gross domestic product ratio(R&D/GNP), particularly in the FDI-controlled segments.30 In this way, theAAC presents R&D/GNP coefficient levels below manufacturing as a whole,
26 INA (Industria Nacional de Autopartes), “El sector de autopartes en México: Importancia del sector,”Mexico: INA, 2010, http://www.ina.org.mx, January; SE, “Agenda para la competitividad.”
27 AMDA, AMIA and INA, “El sector automotriz en México.”28 SE, “Agenda para la competitividad.”29 Ibid.30 Enrique Dussel Peters, “Don’t expect apples from a pear tree: foreign direct investment and innovation
in Mexico,” Discussion Paper 28 (Cambridge/MA: Working Group on Development and Environmentin the Americas), 2009.
100 The China Quarterly, 209, March 2012, pp. 82–110
at 2.03 per cent and 4.32 per cent, respectively.31 Note that while the brancheswithout FDI reach levels of 3.42 per cent, those with FDI levels above 50 percent of their social capital are only 1.33 per cent. Nevertheless, 72 per cent ofemployment of the AAC is concentrated in the companies controlled by FDI.In this way, the AAC in Mexico presents a series of important experiences and
benefits: several decades of intra- and inter-company experiences; an importantnetwork of free trade agreements and effective tariff benefits with its primarytrade partners (particularly the United States and Canada but also theEuropean Union, several Latin American countries and Japan); and an industrialorganization in operation for several decades, that with NAFTA reconverted intoa regional export motor. It should not be underestimated that the AAC inMexico has achieved a certain degree of diversification in both imports andexports, although the first are still extraordinarily concentrated in the NAFTAcountries. Mexico today is the primary AAC exporter to the United States.Nevertheless, the AAC in Mexico also reflects a series of industrial organization
and development difficulties: high dependency on the United States and its threemain automotive companies in the automobile segment; structural weakness ofits auto parts and automotive industry inputs production sector, and the lack ofscience and technology processes, with the resulting lack of upgrading and higheradded-value processes and products in the AAC. Public policies have explicitly toconsider that Mexican firms only participate in the auto parts segment.
The AAC in China32
A recent group of analyses33 have highlighted the impressive long-term effort byChina to achieve an effective upgrading process in the AAC. While Chinaremains far behind the S&T levels of industrialized countries, it has made enor-mous efforts to increase expenditures in S&T, which are well above respectivecoefficients in Latin American countries and Mexico. To what may we attributethis behaviour, specifically for the AAC established in Mexico?A series of phases may be identified for the AAC in China: from the 1970s until
the first five-year programmes indicating AAC support policies; from themid-1980s until 2005/2007, a period in which the AAC in China massivelyfomented foreign investments in China through joint ventures; and since thefinal years of the 20th century, when the Chinese companies, now as OEMsand not as suppliers, begin to impose production and trade conditions. The auto-mobile segment in China currently presents at least seven companies with their
31 Ibid.32 Result of research carried out in November and December 2009 in the Institute of Latin American
Studies of the Academy of Chinese Social Sciences. I am very grateful to Hanban and the Embassyof the People’s Republic of China in Mexico, as well as ProMéxico, the Mexican Embassy in China,and the Universidad Nacional Autónoma de México.
33 See Dussel Peters, “Don’t expect apples from a pear tree”; OECD, OECD Economic Surveys: China(Paris: OCDE, 2010); Dani Rodrick, “What is so special about China’s exports?” NBER WorkingPaper 11947, 2006.
The Auto Parts-Automotive Chain in Mexico and China 101
own brands – BAIC, SAIC, FAW, Geely, Chery, BYD and Foton – with effec-tive potential to compete in global markets in the medium term.34
It is important to remember that the AAC is a sector actively supported by thecentral and provincial governments since at least the 1980s. Even as far back asthe 1950s, projects were presented to develop the AAC and companies such asChina First Automobile Works (FAW) (currently one of the primary automobilemanufacturers) and sites for passenger vehicle production in Shanghai andDongfeng, among others.35 Nevertheless, it was in 1994, with the “IndustrialPolicy on Development of the Automotive Industry,” that more aggressive stra-tegies began, not only for supply but also to enhance consumption of this pro-duction. After joining the WTO, the central government implemented variousnew policies and notices on behalf of the National Commission onDevelopment and Reform to make the existing measures compatible in respectof the limitations on the trade balance and added value coefficients, amongother things, and especially to consolidate the existing AAC. This latter issuewas also explicitly addressed in the 12th official Five-Year Plan (2011–15).36
However, the measures established in the tenth Five-Year Plan (2001–05),those on joining the WTO and policies oriented towards FDI are the onesthat fostered an increase in automotive production from less than 2 millionunits at the end of the 1990s to almost 14 million in 2009. In this period,more than 170 massive co-investments were fostered,37 and the need wasemphasized for the development of “independent technologies.” Severaldozen decrees, notices and administrative measures relevant to the sectorhave been implemented since 2000.38 Since 2006 the National Commissionon Development and Reform has even explicitly sought to “consolidate” theautomobile manufacturers and the auto parts companies, although with littlesuccess as of 2010.In addition it is necessary to underline a couple of important structural elements
of the Chinese AAC. With more than 160 OEMs and 4,600 auto parts manufac-turers (China Council for the Promotion of International Trade [CCPIT] 2009), thelevels of economics of scale are low and inefficient and also reflect a very high levelof competition. The Chinese AAC stands out for its very high R&D investmentlevels, well above the rest of the economy, as well as a substantive increase in
34 For specific analysis, also from a Latin American perspective, see Lourdes Álvarez Medina, “La indus-tria automotriz China: posibilidades de competir con la industria automotriz en México,” in EnriqueDussel Peters and Yolanda Trápaga Delfín (eds.), China y México: implicaciones de una nuevarelación (La Jornada, ITESM, Cechimex/UNAM, Mexico, 2007), pp. 191–208; and Álvarez Medinaand Sepúlveda Reyes, “Reformas económicas, inversión extranjera directa y cambios en la estructurade la industria automotriz China (1980–2004),” Contaduría y Administración, No. 218 (2006),pp. 87–113.
35 CCPIT (China Council for the Promotion of International Trade). China Business Guide 2008. Auto(Beijing: CCPIT, 2009).
36 See DRC (Development Research Centre of the State Council), Annual Report on Automotive Industryin China (Beijing: DRC, 2010).
37 CCPIT, China Business Guide 2008, p. 6.38 Ibid. pp. 24ff.
102 The China Quarterly, 209, March 2012, pp. 82–110
productivity (tripling between 2000 and 2007),39 with relatively small increases indirect employment. Finally, as detailed by Yin, in the first decade of the presentcentury the Chinese AAC is notable for the appearance of a group of provincialOEM companies actively supported by their respective provincial governments,such as Chery, Geely and BYD, which in 2009 already represented almost 30per cent of total passenger car sales in an extremely competitive market. It mustbe emphasized that these local companies, including Great Wall and AnhuiJianghuai, do not have significant co-investments with foreign companies andare the result of regional production networks.40
Table 7 presents some of the primary trends in production and trade. The infor-mation on production (see Table 1) illustrates the continuous growth of auto pro-duction, from fewer than two million units in the late 1990s to almost 14 million in2009. It was not until 1999 that China first produced more automobiles thanMexico. Table 7 also illustrates that, for themoment and given the spectacular growthrates in AAC production, trade still plays a smaller role and falls below 5 per cent oftotal production. Exports are particularly strong in auto parts, but present a deficit inpassenger vehicle trade. Finally, it indicates that both investments and productivityhave substantially increased – employment far below production –while employmentin R&D increased from 3 per cent to 6 per cent during 2001–08. Annual productivityincreased by an average of 16.3 per cent during 2001–08.Probably one of the most relevant observations, from a Latin American per-
spective, is that in addition to the impressiveness of the Chinese companies interms of their numbers in both the automobile and auto parts segments, their par-ticipation increased from under 5 per cent in 200041 to almost 30 per cent in 2009,and is projected to surpass 35 per cent by 2015.42 This process reflects the successof various policies and instruments in terms not only of increased overall pro-duction, but in particular of production by Chinese brand companies such asSAIC, FAW, Dongfeng, Chang’an, BAIC, Guangzhou Automobile Group,Chery, BYD, Brilliance, Geely and Great Wall, among others. Unlike LatinAmerica, which has no national or even regional brand, China currently boastssix or seven of its own brands with enormous potential.Table 8 presents the important production capacity and installed capacity of
the Chinese companies. Five of these companies are already producing morethan 1 million units, and three more Chinese companies will soon join them.Around seven of this group, who have all achieved technological integrationthrough FDI, have enormous potential and innovation capacity: BAIC, SAIC,Chery, Geely, BYD, FAW and Dongfeng. While all the public companies (exceptthe regional companies such as Chery, Geely and BYD) have co-investments thatdate back more than a decade, several of the rest have achieved other
39 Yin Xingmin, The Future of China’s Automobile Industry (Geneva: United Nations, forthcoming, 2011).40 Ibid.41 CCPIT, China Business Guide 2008.42 DRC, Annual Report on Automotive Industry.
The Auto Parts-Automotive Chain in Mexico and China 103
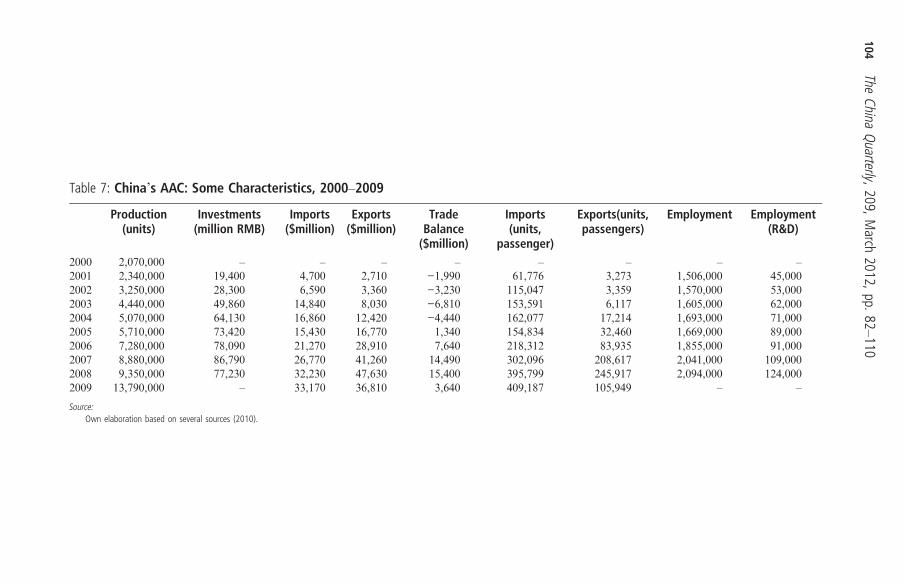
Table 7: China’s AAC: Some Characteristics, 2000–2009
Production(units)
Investments(million RMB)
Imports($million)
Exports($million)
TradeBalance($million)
Imports(units,
passenger)
Exports(units,passengers)
Employment Employment(R&D)
2000 2,070,000 – – – – – – – –
2001 2,340,000 19,400 4,700 2,710 −1,990 61,776 3,273 1,506,000 45,0002002 3,250,000 28,300 6,590 3,360 −3,230 115,047 3,359 1,570,000 53,0002003 4,440,000 49,860 14,840 8,030 −6,810 153,591 6,117 1,605,000 62,0002004 5,070,000 64,130 16,860 12,420 −4,440 162,077 17,214 1,693,000 71,0002005 5,710,000 73,420 15,430 16,770 1,340 154,834 32,460 1,669,000 89,0002006 7,280,000 78,090 21,270 28,910 7,640 218,312 83,935 1,855,000 91,0002007 8,880,000 86,790 26,770 41,260 14,490 302,096 208,617 2,041,000 109,0002008 9,350,000 77,230 32,230 47,630 15,400 395,799 245,917 2,094,000 124,0002009 13,790,000 – 33,170 36,810 3,640 409,187 105,949 – –
Source:Own elaboration based on several sources (2010).
104The
ChinaQuarterly,209,M
arch2012,pp.82
–110
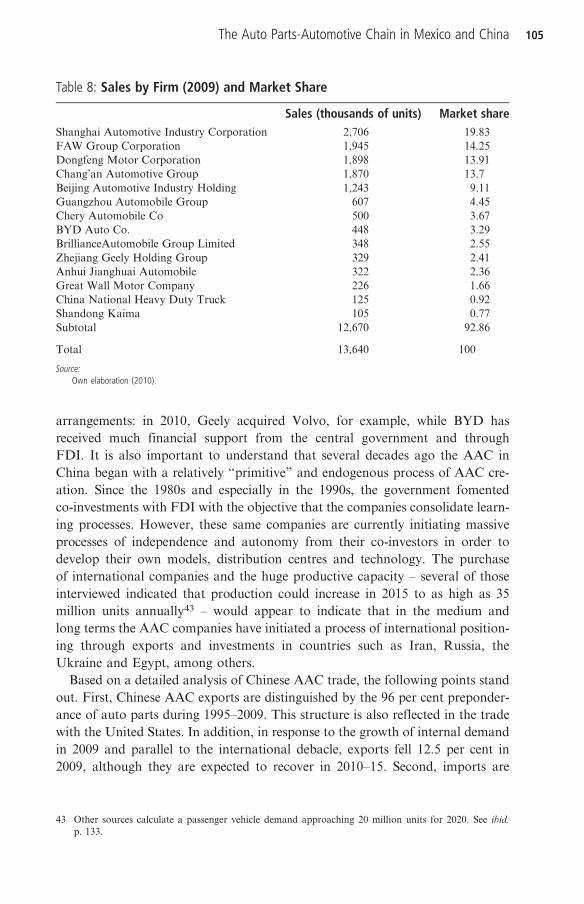
arrangements: in 2010, Geely acquired Volvo, for example, while BYD hasreceived much financial support from the central government and throughFDI. It is also important to understand that several decades ago the AAC inChina began with a relatively “primitive” and endogenous process of AAC cre-ation. Since the 1980s and especially in the 1990s, the government fomentedco-investments with FDI with the objective that the companies consolidate learn-ing processes. However, these same companies are currently initiating massiveprocesses of independence and autonomy from their co-investors in order todevelop their own models, distribution centres and technology. The purchaseof international companies and the huge productive capacity – several of thoseinterviewed indicated that production could increase in 2015 to as high as 35million units annually43 – would appear to indicate that in the medium andlong terms the AAC companies have initiated a process of international position-ing through exports and investments in countries such as Iran, Russia, theUkraine and Egypt, among others.Based on a detailed analysis of Chinese AAC trade, the following points stand
out. First, Chinese AAC exports are distinguished by the 96 per cent preponder-ance of auto parts during 1995–2009. This structure is also reflected in the tradewith the United States. In addition, in response to the growth of internal demandin 2009 and parallel to the international debacle, exports fell 12.5 per cent in2009, although they are expected to recover in 2010–15. Second, imports are
Table 8: Sales by Firm (2009) and Market Share
Sales (thousands of units) Market shareShanghai Automotive Industry Corporation 2,706 19.83FAW Group Corporation 1,945 14.25Dongfeng Motor Corporation 1,898 13.91Chang’an Automotive Group 1,870 13.7Beijing Automotive Industry Holding 1,243 9.11Guangzhou Automobile Group 607 4.45Chery Automobile Co 500 3.67BYD Auto Co. 448 3.29BrillianceAutomobile Group Limited 348 2.55Zhejiang Geely Holding Group 329 2.41Anhui Jianghuai Automobile 322 2.36Great Wall Motor Company 226 1.66China National Heavy Duty Truck 125 0.92Shandong Kaima 105 0.77Subtotal 12,670 92.86
Total 13,640 100
Source:Own elaboration (2010).
43 Other sources calculate a passenger vehicle demand approaching 20 million units for 2020. See ibid.p. 133.
The Auto Parts-Automotive Chain in Mexico and China 105
much more balanced between auto parts and the automotive sector, resulting in apositive trade balance of the AAC. Third, Chinese AAC demand throughimports has expanded impressively, with an average annual growth rate of 20.3per cent during 1995–2008, reaching more than US$45.7 billion in 2008, 66 percent of that corresponding to auto parts. And finally, a relatively low level isobserved in AAC trade between Mexico and China, with exports of US$690million and imports of US$149 million in 2008, more than 90 per cent ofwhich is concentrated in auto parts.What are the possible spheres of strength of the Chinese AAC in innovation
terms? A first tier of companies currently exists in China – formed in particularby Chang’an, Chery, Dongfeng, SAIC, FAW, Geely, Jianghua, Great Wall,Beiqi Foton and Shenyang – that lead both auto production and S&T efforts,most concretely visible in patents.44 These companies (especially the individualbrand names such as BYD, Chery, Geely and Great Wall) are also responsiblefor the greatest efforts in terms of exports and of acquisition of foreign companiesand technologies.45 A second strength is that the Chinese public sector, including atthe city, provincial and central government levels, will continue to apply diversepolicies to foment the AAC, as demonstrated by the 2009 “Plan to Adjust andRevitalize the Automotive Industry” and the tax reductions for auto purchasesin 2010. The 12th Five-Year Plan (2011–15) also proposed to multiply measuresto favour and stimulate the sector, in particular the private brand name companies.This is the most promising sector in the short, medium and long terms for theestablishment of co-operation and exchanges. Third, automobiles that use newenergy sources, especially electric cars and energy efficient models, will receive mas-sive incentives through the 12th Five-Year Plan, and companies such as SAIC,FAW and BYD will obtain resources and conduct R&D to lead these new technol-ogies even at the global level. Finally, as a result of the continuous increase ofinstalled capacity and of programmes such as “going global,” it is anticipatedthat China may considerably increase its exports, in particular in auto parts butalso in diverse automobiles. If China were to export 20 per cent of its productionover the coming five years, perhaps some five million autos, it could generate mas-sive adjustments and problems in the international AAC markets.
Co-operation OptionsThese two economies, Mexico and China, have achieved different trajectories ofproduction and technology in the past 15 years. China was able to transform itself
44 Ibid. pp. 78 and 83.45 The companies of the Chinese AAC have stood out recently for important global acquisitions, in par-
ticular: the purchase of the US company UAI by Wanxiang Group (2001), of the Korean companiesSsangyong Motor and MG Rover by SAIC in 2004 and 2007 respectively, of Volvo by Geely in2010, and of Rover by Nanjing Auto (2007) and DSI by Geely (2009), among others. Chery andGreat Wall have also increasingly established plants abroad; Chery already has more than nine foreign-based plants. See ibid. p. 86.
106 The China Quarterly, 209, March 2012, pp. 82–110
into the leading global producer with a growing domestic technological structurebased on profound and widespread policy measures, in which public finance andindustrial and trade policies have a critical role. Foreign trade, however, continuesto play a limited part in China’s AAC: while almost one in four cars are producedin China, from a qualitative perspective China has generated hundreds of domesticbrands in the automobile and auto parts segments. In contrast, Mexican firms onlyparticipate in the auto parts segment in Mexico. Meanwhile, Mexico opted withNAFTA for an export-oriented structure with limited “territorial endogeneity”given that its export processes are based on temporary imports to be re-exported.As a result, Mexico has an extensive network of suppliers that has allowed it totransform into a substantive export base, both within NAFTA and beyond, inNorth America. This specialization has also generated profound technologicalweaknesses and reduced added-values, despite the potential among a wide groupof countries with which Mexico has trade agreements.The critical role played by the AAC was also confirmed in both countries in
terms of production, employment and foreign trade (albeit still to a lesser degreein China), and in the weight assigned to it by the public sector. China shows mas-sive long-term trade, investment, foreign direct investment, R&D and “going glo-bal” strategies, parallel to import financing, in contrast to Mexico’smacroeconomic stabilization strategies. In the same way, it has already convertedinto the second most important value chain within bilateral trade betweenMexico and China, and its potential suggests it will most certainly take overthe first position in the medium term. There is an important source of compe-tition and conflicts in the AAC between the two countries, particularly if we con-sider that China will not be able to continue with the same path of consumptionof vehicles as in the past five years: that is, if the growth rate of consumption slo-wed to levels of 10–15 per cent it would be able to export 20–30 per cent of itsproduction, or more than five million vehicles, doubling Mexico’s total pro-duction. The potential for conflict in the short and medium run is significantin the NAFTA region but also globally. Based on these trends – and the experi-ence of Mexico in other value-added chains such as yarn-textile-garment and alsoelectronics – co-operation between Mexico (and the NAFTA region) with Chinais plausible and of interest for all affected countries.In the area of co-operation, there are at least three relevant categories: insti-
tutional strengthening between Mexico and China; connections between mid-level actors in the Chinese and Mexican AACs to improve exchange and mutualknowledge; and specific projects on the part of both public sectors to intensify theAAC relationship between the two countries at the company level.In the first category, the institutions in charge of promoting international
co-operation between the two countries, especially the CCPIT and ProMéxicobut also the China–Mexico Binational Commission and the 2011–15 JointAction Programme, hold primary responsibility for influencing the academic, pri-vate and public sectors to combine efforts in concrete co-operation in the AAC,as opposed to the current situation in which each company conducts individual
The Auto Parts-Automotive Chain in Mexico and China 107
or “atomized” efforts. Considering the technological, productive and tradespecialization trajectories, the AAC in the two countries appear to be relativelycomplementary to each other, although much more in-depth analysis in thisarea is necessary. The noted institutions require investments and the finance ofprojects in the AAC within a short, medium and long-term agenda. In theshort term, it at least appears that investments by Chinese automobile manufac-turers have great potential in Mexico, for both the domestic market and exportfrom Mexico. From Mexico’s perspective, on the other hand, it will surely beimportant to adapt and modify regulations relevant to investing in the sectorin Mexico, including reducing entry barriers that appear to be directly aimedat producers from India and especially China, and to allow companies to investin the auto parts segment in China. In both cases, initial projects have alreadybeen pursued, although they have fallen far below expectations and includedoverwhelming failures; some of the failures show that Chinese automobile produ-cers do not necessarily behave differently from other foreign automobile produ-cers and, on the contrary, are ill-prepared and require support from otherinstitutions.46 While there are positive examples of co-operation,47 a lot moreanalysis needs to be done.Parallel to the institutional efforts, outreaches between mid-level personnel –
including company, public functionary and academic actors – appears to be criti-cal. The opinions of businesspeople from both countries and results obtainedfrom my own studies suggest that mutual knowledge in general, and specificallyin the AACs, remains very limited. Cultural and language barriers, but above allthe barriers posed by the different business cultures of the two countries, are stillvery high, and are shrinking only very gradually in response to specific efforts byinstitutions and companies, with very high costs (such as between FAW andGrupo Salinas, but also multiple AAC companies in both countries). CCPIT,ProMéxico, and in the case of Mexico other institutions such as CONACYTand the Secretary of Foreign Relations, should direct support through the
46 A substantive and exemplary case was the failed co-investment between FAW and Grupo Salinas in2006 which was definitively abandoned in 2009. In this case, the three parties, FAW, Grupo Salinasand the Secretary of the Economy, all failed: FAW, for not elaborating a sufficiently clear businessplan and failing to foresee the difficulties of creating a supplier network to allow it to produce morethan 50,000 units in three years required according to NAFTA rules of origin and the national decrees;Grupo Salinas, for its failure to envisage a long-term project of commitment to and knowledge of theAAC beyond momentary considerations regarding the internal and international market; and theSecretary of the Economy, who only three years later verified the incompliance with the originalbusiness plans of both companies, after the import of more than 7,000 units, the consumers of whichnow face serious service problems. This case is an example of how not to conduct business betweentwo countries in the AAC, and sets a horrible precedent of co-operation.
47 A little known case is that of Giant Motors, a joint venture between a group of Mexican investors andFAW-trucks in Pachuca, Hidalgo, that began in 2006. This Mexican group invited FAW trucks to startinvestments in the light truck segment to be assembled. Stressing the importance of a good distributionnetwork – and the demand and sales of production, contrary to the case of FAW-Grupo Salinas – theMexican part buys parts, components and the core parts of the light trucks, while FAW trucks is respon-sible for the “tropicalization” of the light trucks, the plant and other technical matters in Mexico. Theplant has produced and sold more than 3,000 trucks and expects to double this in 2011. With fewer than150 workers the firm is expecting to increase substantially both production and labour in the short term.
108 The China Quarterly, 209, March 2012, pp. 82–110
instruments available to them, including grants, institutional ties, delegation vis-its, specialized contacts between counterparts, business exchanges, seminars, for-ums and so on, to create effective technical bridges that increase knowledge in theAAC between the two countries.Third, CCPIT, ProMéxico, the Foreign Relations Ministries of both
countries and the Mexico–China Binational Commission have the opportunityand responsibility to pursue a group of concrete projects for the AAC, withfinance from the noted institutions for at least their initial phases. For example,it would be possible to carry out three or four projects in China and Mexicorespectively linked to the AAC between the two countries; the latter is particu-larly relevant since several Chinese firms in the AAC chain have showed inter-est in investing in Mexico, but the results have so far been very limited. Fromthe Chinese perspective, understanding the legal framework, that Mexico isdifferent from the rest of Latin America as being part of NAFTA and withfree trade agreements with 43 countries, the Mexican business culture in theAAC, and the real and effective process for establishment in Mexico may beprojects to pursue in the short term. From a Mexican perspective, thematic pri-orities may include the incorporation of its exports to the growing Chinesedemand, the capacity to enter into negotiations with Chinese manufacturersto achieve effective technological transfer in Mexico, as well as support forChinese manufacturers to integrate themselves within existing supplier networksin the country. A subsequent group of thematic approaches and projects couldbe derived from these initial projects, to deepen co-operation perspectivesbetween the two countries further.From this perspective, both countries have the potential for effective
co-operation within the framework provided by the existing institutions: the2011–15 Joint Action Programme, the China–Mexico Binational Commissionand the High Level Group, among others. The case of the AAC will be increas-ingly relevant between both countries, and if measures are not applied, the bina-tional relationship in particular in the trade and economic spheres maydeteriorate. Current industrial organizations in both countries show an importantpotential for co-operation: while China’s firms are being firmly supported by thecentral government and respective policies to “go global,” with important tech-nological developments, financial support and very competitive prices, theMexican AAC has had several decades of being a supplier to mature marketssuch as the United States and the European Community; this experience in con-crete terms – from production, engineering at the plant, client–supplier relation-ships, networks of existing suppliers and logistics in the NAFTA region – iscritical for relative newcomers in the global competition process such as China,which is lacking this expertise.As discussed in the beginning of this article, this detailed analysis does not
allow for a simplistic “positive” versus “negative” attitude in the China–LatinAmerica/Mexico relationship. On the contrary, it requires specific and detailedknowledge to make specific proposals, since otherwise, concepts such as
The Auto Parts-Automotive Chain in Mexico and China 109
“co-operation” become empty of any content. In the case of the AAC there is avast concrete space for co-operation, in addition to currently developed andfuture technologies such as hybrid and electronic vehicles which are being devel-oped in China. As a result of their particularities – such as very heavy batteries –co-operation with Mexico and the logistics for selling in NAFTA from Mexicoare very strong advantages.
110 The China Quarterly, 209, March 2012, pp. 82–110