automotive industry -...
TRANSCRIPT

Automotive Industry
Martin Jahn

Agenda
1. Market structure
2. Production and Sales Volumes
3. Distribution Channel Structure
4. Pricing
5. Marketing
6. Regulations
7. Trends
8. Diesel issue
9. Automotive industry in the Czech Republic
2

Oligopoly in the automotive industry
Source: Thomson Innovation & Thomson Reuters Derwent World Patents Index

Market entry barriers – Automotive industry
Source: Car & Automobile Manufacturing - Industry Report: Key Competitors.
Capital
• High amount of capital
• Manufactruing plants
• Raw materials
• Hire and train employees
Research and Development
• Latest innovations that improve the value of a car
• Reduce cost throughout manufacturing process
• Core competencies: engine and gear box
Economies of Scale
• Ability to mass-produce
Distribution Channels
• Extensive dealer and service network
Outlook: Market entry barriers are expected to decrease due to alternative drives and digitalization

Agenda
1. Market structure
2. Production and Sales Volumes
3. Distribution Channel Structure
4. Pricing
5. Marketing
6. Regulations
7. Trends
8. Diesel issue
9. Automotive industry in the Czech Republic
5

million units
Source: IHS Automotive (07/2015) Stand: 09/2015
World Car Sales 2005-2022
64,1 66,3
69,6 66,2
64,0
72,7 75,7
79,6 83,4
86,3 87,2 90,0
93,3 95,5
98,2 100,4
102,6 104,7
2005
2006
2007
2008
2009
2010
2011
2012
2013
2014
2015
2016
2017
2018
2019
2020
2021
2022
Mill
ionen
*) vorläufig

23,49
16,84
5,56
3,50
3,36
3,18
2,84
2,69
2,21
1,89
1,66
1,49
1,21
1,17
1,11
0,99
0,88
0,81
China
USA
Japan
Brazil
Germany
India
UK
Russia
France
Canada
South Korea
Italy
Indonesia
Mexico
Australia
Spain
Thailand
Turkey
Group Treasury – K-FTU – NI/MO – 6009/480.13c JP 03/2015
Cars CV 1. (1.)
2. (2.)
3. (3.)
4. (4.)
5. (5.)
6. (6.)
7. (8.)
8. (7.)
9. (9.)
10. (10.)
11. (11.)
12. (12.)
13. (14.)
14. (16.)
15. (15.)
16. (19.)
17. (13.)
18. (18.) Anmerkung: teilweise geschätzt
6.9%
6.0%
3.5%
-7.1%
3.0%
-2.0%
9.5%
-11.5%
0.2%
6.1%
7.9%
5.0%
-1.8%
6.2%
-2.0%
20.0%
-33.7%
-9.6%
Source: K-VS-V, VDA, Polk Germany, press information
note: car markets USA, Canada and Mexico = cars & LCV
Ranking of Most Important Car / CV Markets January – December 2014
Change vs. previous year
million units
Rank
2014 (2013)
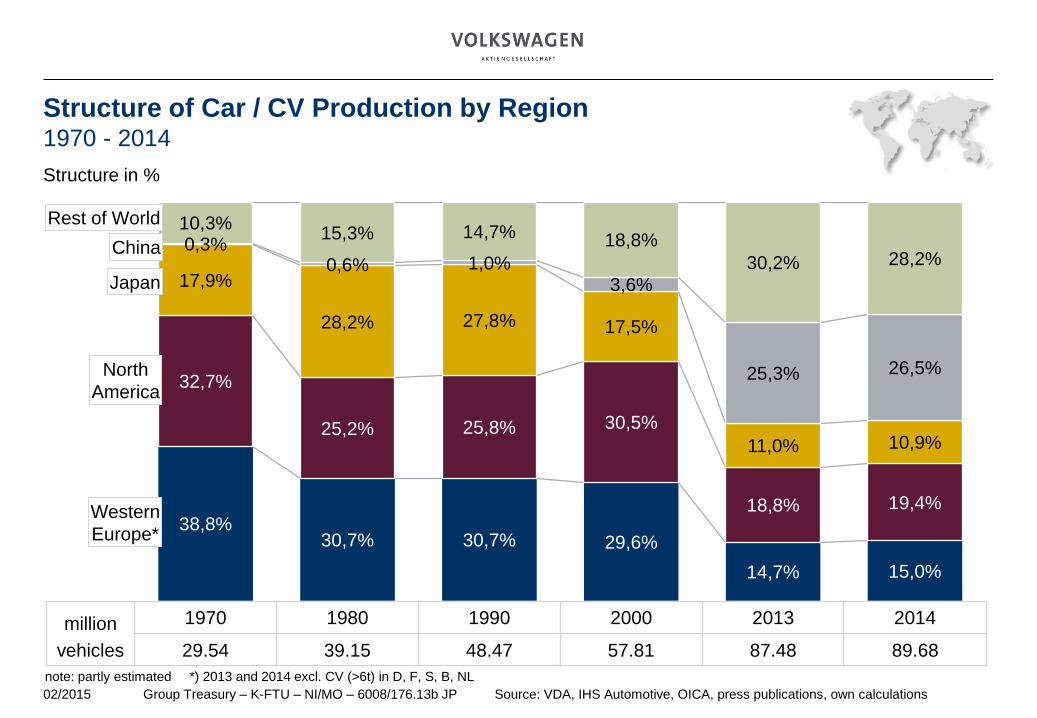
38,8% 30,7% 30,7% 29,6%
14,7% 15,0%
32,7%
25,2% 25,8% 30,5%
18,8% 19,4%
17,9%
28,2% 27,8% 17,5%
11,0% 10,9%
0,3% 0,6% 1,0%
3,6%
25,3% 26,5%
10,3% 15,3% 14,7% 18,8%
30,2% 28,2%
1970 1980 1990 2000 2013 2014
Group Treasury – K-FTU – NI/MO – 6008/176.13b JP Source: VDA, IHS Automotive, OICA, press publications, own calculations 02/2015
million
vehicles 29.54 39.15 48.47 57.81 87.48 89.68
Structure of Car / CV Production by Region 1970 - 2014
Structure in %
Rest of World
Japan
Western
Europe*
North
America
China
note: partly estimated *) 2013 and 2014 excl. CV (>6t) in D, F, S, B, NL

Production per Capita 2014
Car production per 1000 people

23,72
11,65
9,77
5,91
4,52
3,84
3,37
3,15
2,40
2,39
1,89
1,88
1,81
1,60
1,30
1,25
1,17
0,90
China
USA
Japan
Germany
South Korea
India
Mexico
Brazil
Spain
Canada
Russia
Thailand
France
UK
Indonesia
Czech Rep.
Turkey
Slovakia
Group Treasury – K-FTU – NI/MO – 6008/113.20c JP 02/2015
CV Cars
Anmerkung: teilweise geschätzt
1. (1.)
2. (2.)
3. (3.)
4. (4.)
5. (5.)
6. (6.)
7. (8.)
8. (7.)
9. (12.)
10. (10.)
11. (11.)
12. (9.)
13. (13.)
14. (14.)
15. (15.)
16. (16.)
17. (17.)
18. (18.)
7.3%
5.3%
1.5%
3.3%
0.1%
-1.4%
10.2%
-15.3%
11.1%
0.6%
-13.6%
-23.5%
4.4%
0.1%
7.5%
10.4%
4.0%
-0.6%
Source: VDA, Polk Germany, press information, IHS Automotive
note: partly estimated; car production; USA, Canada and Mexico = cars & LCV; CV production Germany and France only LCV
2014 (2013)
Rank
million units
Ranking of Most Important Production Countries January – December 2014
Change vs. previous year

4,53
4,47
3,06
2,76
2,15
2,04
2,04
1,23
1,18
1,17
1,13
0,91
0,89
0,89
0,71
0,57
0,46
0,42
Germany
Japan
South Korea
Mexico
USA
Spain
Canada
UK
France
Czech Rep.
Thailand
China
Slovakia
Turkey
India
Poland
Belgium
Hungary
Group Treasury – K-FTU – NI/MO – 6010/154.13c JP Source: VDA, IHS Automotive, Polk Germany, press information, own calculations 02/2015
1. (2.)
2. (1.)
3. (3.)
4. (4.)
5. (5.)
6. (7.)
7. (6.)
8. (8.)
9. (10.)
10. (11.)
11. (9.)
12. (12.)
13. (13.)
14. (14.)
15. (15.)
16. (16.)
17. (18.)
18. (22.)
Cars CV
2.8%
-4.5%
-0.8%
9.6%
2.8%
8.5%
-0.1%
-1.5%
7.3%
10.0%
0.0%
-6.9%
-0.7%
6.8%
5.9%
0.4%
-0.7%
35.9%
Ranking of Most Important Export Countries January – December 2014
million units
Rank
2014 (2013)
note: partly estimated; car exports USA, Canada and Mexico = cars & LCV; CV exports Germany and France only LCV
Change vs.
previous year

Passenger car market forecast 2016 – most of the regions are expected
to grow

10,23
10,14
9,92
8,47
7,71
6,32
4,75
4,36
2,94
2,88
2,53
2,12
1,38
1,19
1,15
1,08
1,04
0,97
Toyota
VW
GM*
Renault-Nissan**
Hyundai-Kia
Ford***
Fiat-Chrysler
Honda***
PSA
Suzuki
Daimler
BMW
Mazda
Dongfeng****
Changan****
Mitsubishi
BAIC****
Tata
*) incl. SAIC-GM-Wuling (1,788,000 units) **) incl. Lada (448,000 units) ***) wholesales ****) excl. foreign JV partner brands
02/2015 Group Treasury – K-FTU – SM/MO – 7002/465.21b JP
2.5%
4.2%
2.1%
2.5%
4.7%
-0.1%
7.3%
4.7%
4.3%
7.0%
7.7%
7.9%
6.6%
0.0%
18.1%
3.7%
20.4%
-9.4%
World Automotive Industry Deliveries Ranking by Manufacturer 2014
Change vs. 2013
Source: Company data
million units

EUR bill.
Group Treasury – K-FTU – HS – 7000/183.21c JP
*) Change in local currency, previous year restated
Source: Quarterly reports 03/2015
World Automotive Industry Revenues January – December 2014
Annual percentage change*
202,5
190,2
129,9
117,4
108,5
96,1
88,3
80,5
80,4
63,8
53,6
41,1
33,7
21,4
VW
Toyota
Daimler
GM
Ford
FCA
Honda
Nissan
BMW
Hyundai
PSA
Renault
Kia
Suzuki
2.8%
6.9%
10.1%
0.3%
-1.9%
10.9%
7.8%
13.7%
5.7%
2.2%
1.0%
0.3%
-1.1%
6.2%

EUR mill.
Group Treasury – K-FTU – HS – 7000/376.12c JP
*) Change in local currency, previous year restated
Source: Quarterly reports 03/2015
World Automotive Industry Operating Profit January – December 2014
Annual percentage change*
18.181
12.697
9.397
9.118
5.400
5.025
4.388
3.092
2.873
1.840
1.342
1.152
1.105
223
Toyota
VW
Daimler
BMW
Hyundai
Honda
Nissan
FCA
Ford
Kia
Suzuki
GM
Renault
PSA
8.2%
8.8%
20.2%
14.3%
-9.2%
-2.2%
32.4%
6.0%
-34.7%
-19.0%
1.0%
-70.2%
x
x

%
Group Treasury – K-FTU – HS – 7000/377.12c JP Source: Quarterly reports 03/2015
World Automotive Industry Operating Margin January – December 2014
*) Previous year restated
Annual change*
11,3
9,6
8,5
7,2
6,3
6,3
5,7
5,5
5,5
3,2
2,7
2,6
1,0
0,4
BMW
Toyota
Hyundai
Daimler
VW
Suzuki
Honda
Kia
Nissan
FCA
Renault
Ford
GM
PSA
0.9%-pts.
0.1%-pts.
-1.1%-pts.
0.6%-pts.
0.3%-pts.
-0.3%-pts.
-0.6%-pts.
-1.2%-pts.
0.8%-pts.
-0.2%-pts.
2.8%-pts.
-1.3%-pts.
-2.3%-pts.
3.3%-pts.

Agenda
1. Market structure
2. Production and Sales Volumes
3. Distribution Channel Structure
4. Pricing
5. Marketing
6. Regulations
7. Trends
8. Diesel issue
9. Automotive industry in the Czech Republic
17

45,9% 39,2% 39,6%
35,4% 39,8%
44,0% 46,0%
34,0%
51,7% 48,0% 46,3%
37,7% 39,7% 48,0% 48,0%
56,8%
47,4%
28,9% 33,7% 32,7% 39,4%
36,0% 21,9%
33,0%
39,2%
25,9%
17,6% 27,8%
36,5% 28,2%
29,7% 27,3%
23,5%
29,1%
9,3% 9,2% 9,3% 7,8% 8,8%
14,4%
0,7% 8,1%
8,3%
14,2%
13,0% 8,2%
15,9%
8,7% 10,8% 6,2%
8,8%
15,9% 17,8% 18,3% 17,5% 15,4% 19,7% 20,3% 18,7%
14,1% 20,3%
12,8% 17,6% 16,2% 13,6% 13,9% 13,5% 14,7%
0%
10%
20%
30%
40%
50%
60%
70%
80%
90%
100%
Private Relevant Fleets incl. Dealerships Rentals Dealerships/Manufacturer
Structure of Sales Channels EU16 2015
VW Group and Top 10 Competitors
EU16: Austria, Belgium, Czech Rep., Denmark, Finland, France, Germany, Italy, Netherlands,
Norway, Poland, Slovakia, Spain (Mainland), Sweden, Switzerland, United Kingdom
K-VF-B Source: Dataforce New Car Registrations, 2016-12-02 - confidential -
13.441.892 1.638.918 739.154 569.732 317.585 67.044 712.438 528.509 647.146 987.951 713.004 886.358 819.750 915.554 510.190 3.332.433 509.105

19
Characteristics of business cars compared to private cars
a higher
mileage
higher
demand for extra
Services (full service
leasing)
More expensive specifications
shorter holding
period
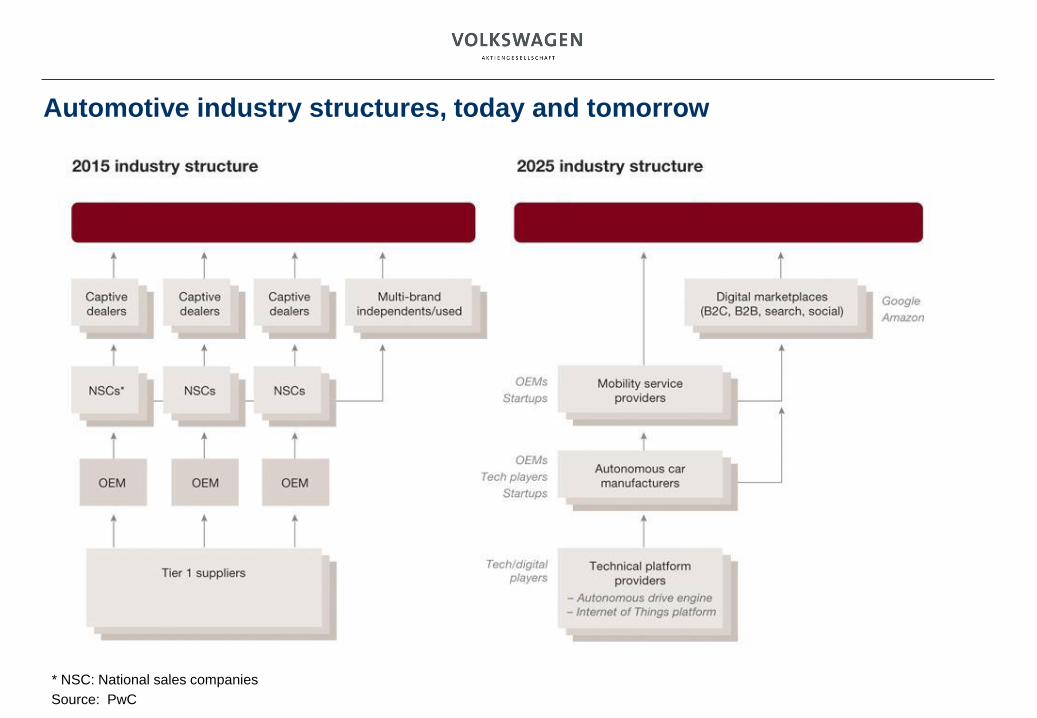
Automotive industry structures, today and tomorrow
Source: PwC
* NSC: National sales companies
Agenda
1. Market structure
2. Production and Sales Volumes
3. Distribution Channel Structure
4. Pricing
5. Marketing
6. Regulations
7. Trends
8. Diesel issue
9. Automotive industry in the Czech Republic
21

Table of Contents
2/23/2016 K-VS-P 22
1. Introduction
2. Customer Price Perception
3. Price comparisons from Customer View
4. Elements of Price Positioning

The strategic price triangle Product, Competition and Customer are connected in interacting relations
2/23/2016 K-VS-P 23
Information transparency about
customers, product and
competition are the prerequisites
of a succesful price strategy
• Reach customers with a clear
price strategy
Risk: Price-/Benefit-Relation
• Price position may not go
above the Brand Premium
within the competition
Risk: Customer defection
• Group- Positioning:
The positioning needs to
account for group interrelation
Risk: Substitions
Customer
Competitors
Demands
Perceptions
Price/Benefit Price/Benefit
Price differentiation
between brands
Product
VW Audi SEAT Škoda
Competition advantages /
Price-premium

Long-term scope within Price Strategy Pricing begins with the car concept decision
2/23/2016 K-VS-P 24
4 years
Market entry Product decisions
• The product decision within the automobile industry is made long before market entry
• The earlier and more comprehensive the product price is planned, the smaller the risk of „false“ price
positioning and consequent market share decreases becomes
• Prognosis on market-, market environment- and competition behaviour are challenging and have to
be examined regularly
EOP
7 years

Table of Contents
2/23/2016 K-VS-P 25
1. Introduction
2. Customer Price Perception
3. Price comparisons from Customer View
4. Elements of Price Positioning

Price- / Benefit orientied pricing
2/23/2016 K-VS-P 26
Balance between Product benefits and price
Quality
Equipment
Brand/Image
Service
„Costs" „Benefit"
Price
The result of professional pricing is the optimal value absorption, which is created for the customer.
1. What customer benefit justifies which price?
2. What do we need to offer, so that customer purchases from US?
Customer
value creation
Company
value creation
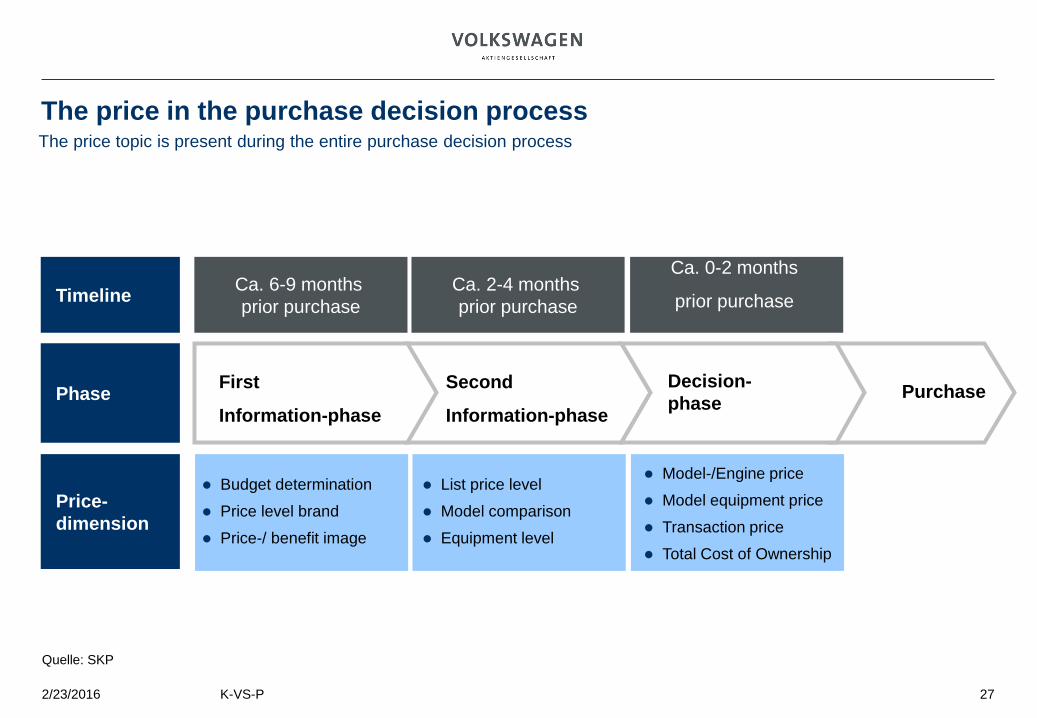
The price in the purchase decision process
2/23/2016 K-VS-P 27
The price topic is present during the entire purchase decision process
Timeline
Phase Purchase First
Information-phase
Second
Information-phase
Decision-
phase
Ca. 0-2 months
prior purchase
Ca. 2-4 months
prior purchase
Ca. 6-9 months
prior purchase
Quelle: SKP
Price-
dimension
Budget determination
Price level brand
Price-/ benefit image
List price level
Model comparison
Equipment level
Model-/Engine price
Model equipment price
Transaction price
Total Cost of Ownership

Table of Contents
2/23/2016 K-VS-P 28
1. Introduction
2. Customer Price Perception
3. Price comparisons from Customer View
4. Elements of Price Positioning

Price relevance from equipment and technology A customer only evaluates a few equipment-items and technology features financially,
when comparing individual car models.
2/23/2016 K-VS-P 29
Elements of Price Adjustement
Equipment Market specific ca. 10 to 20 relevant equipment items for all car segments
Segment specific equipment additions (e.g. Premium-Equipment within D-Segment)
Engine Performance Performance in KW
Pulling power Torque
Fuel consumption Difference from 0.1 l/100km
Storage volume when below minimum requirements
CO2 emissions
Technology
features
(amongst
other things)
+
Source: Kundenwertstudien

Table of Contents
2/23/2016 K-VS-P 30
1. Introduction
2. Customer Price Perception
3. Price comparisons from Customer View
4. Elements of Price Positioning

Incentives and Transaction prices Connection of Incentives and Transaction prices in Detail
2/23/2016 K-VS-P 31
List price
List price with extras
Special Editions
Extra Packets
Licensing Bonus
Trade-In
Cash Discount
Dealer Margin
Transaction price
- Example Cash Payment -
1.
3.
1.
3.
List prices
Transaction price – highest transparency level
2.
2. Incentives

Price logic within an automobile group (e.g. Toyota Group) A clear and stringent price hierarchy of the brands is visible within the Toyota Group
2/23/2016 K-VS-P 32
0
20000
40000
60000
80000
Aygo Yaris Corolla Corolla
Combi
Corolla
Verso
Prius Avensis Avensis
Combi
IS GS SC LS
In the overall portfolio
of the Toyota Group a
clear price hierarchy is
visible from A00- to D-
Segment.
Price induced
substitution effects are
not to be expected in
any segment due to
price distinctions
between the brands
TOYOTA LEXUS
Quelle: Jato/Internet (Preise für die günstigste und teuerste Version eines Modells)

Price logic within the Volkswagen Group The central challenge is to maintain a group-wide price logic within the product families-
2/23/2016 K-VS-P 33
• Currently the VW Group
offers more than 100 car
models in Europe.
• Any addition to the group
portfolio requires
comprehensive
coordination to maintain
the group-wide price
logic.
Quelle: Jato (Preise für die günstigste und teuerste Version eines Modells), Modelle mit den High-End Motorisierungen RS, FR, R und S nicht berücksichtigt
0
5000
10000
15000
20000
25000
30000
35000
Fabia Roomster Octavia Kombi Octavia
Limousine
Superb
5000
25000
45000
65000
85000
105000
125000
FoxPolo
Cad
dyGolf
Golf
V.
Golf
P.
NB
NBC
Jetta
Toura
nEos
Pas
sat L
.
Pas
sat V
.
Shar
an
Mul
tivan
Touar
eg
Phae
ton
5000
10000
15000
20000
25000
30000
35000
Ibiza Leo n A ltea T o ledo A lhambra
Seat
Audi
Skoda
Volkswagen

Agenda
1. Market structure
2. Production and Sales Volumes
3. Distribution Channel Structure
4. Pricing
5. Marketing
6. Regulations
7. Trends
8. Diesel issue
9. Automotive industry in the Czech Republic
34

Automotive Consumer Path to Purchase
35
Source: Marketing Management Analytics

Distribution of global advertising spending 2013-2014, by sector
36
3,3%
5,4% 6% 5,7%
6,4%
7,9%
9,3% 9,3%
11,5%
13,3%
20,1%
3,1%
4,8% 5,1% 5,5%
6,6%
8,4%
9,5% 10,1%
11,3%
13,6%
20,3%
0,0%
5,0%
10,0%
15,0%
20,0%
25,0%
Share
Q1 2013 Q1 2014
Source: Nielsen; ID 264962
Note: Worldwide; based mainly on published rate cards
Further information regarding this statistic can be found on page 8.

Auto Manufacturer Ad Spend Share, by Medium in 2014 and 2015
37
Source: Barrel Associates

Brand values
38
Valuable
Innovative
Responsible High-quality
Sporty
Progressive
Dynamic
Young
Design-oriented Value for money
Reliability
Fitness for function
Quality
Integrity

Brand values
39
quality craftsmanship
uncompromising performance
challenging dynamics
Elegance, exclusivity and power
exclusivity and acceptance
tradition and innovation
performance and suitability
design and functionality

Brand values
40
Reliability
Partnership
Economy Quality
Customer first
Respect for the
individual
Innovation Dynamic Strength Reliability Openness

Agenda
1. Market structure
2. Production and Sales Volumes
3. Distribution Channel Structure
4. Pricing
5. Marketing
6. Regulations
7. Trends
8. Diesel issue
9. Automotive industry in the Czech Republic
41

Form or regulation (national, supranational)
42
Significance:
• Automotive sector
belongs to the most
regulated one in the EU
Requirements are primarily:
• Environmental (e.g. CO2
limits)
• Safety (e.g. safety
features)
Requirements
• come from EU Regualtions
and Directives agreed
between EU institutions –
proposed by the Europen
Commission and agreed
jointly with the Council
(member states) and
European Parliament.
Fragmented EU market:
• national specific
requirements, e.g. type
approval procedures with
different data requirements
and formats
Important Regulation:
• United Nations Economic
Commission for Europe
(UNECE) Regulations
• Aim to harmonise
technical standards
globally

Antitrust rules and validity for the sector
43
Antitrust rules in the sector:
• No specific antitrust and
competition rules for the
sector
General EU/ national
legislation
• applicable for automotive
sector as well
Passenger cars
• Antitrust rules are treated
by market situation
Validity for the sector
• extreme competition on the
market (small EU market
with 15 global OEMs).
Vertical agreements
• Special treatment: realtion between OEMs and retailers and
dealers (vertical agreements)
• benefit from "block exemption"
• exempts a whole category of motor vehicle distribution and
repair agreements

International trade (tariff, NTBs, quotas etc)
44
Significance of UNECE
• regarding the regulatory
perspective on global
standards and
harmonisation
Trade issue/market access
• are part of the general EU
free trade agreement with
trading partners (bilateral
ones like South Korea,
TTIP) or multilateral ones
(MERCOSUR)
Automotive issues
• are covered either in the
core FTA or within specific
automotive annex (eg
South Korea)

Mandatory CO2 Regulations for passenger cars
45
Agenda
1. Market structure
2. Production and Sales Volumes
3. Distribution Channel Structure
4. Pricing
5. Marketing
6. Regulations
7. Trends
8. Diesel issue
9. Automotive industry in the Czech Republic
46

Global action fields arise from economical scenarios, market regulations
and consumer trends
47

New generations with different mind-sets will change the car industry until 2030
48

Ageing customers prefer a higher seating position and an improved traffic
overview which can be delivered by SUV/CUV
49
* SUV/CUV-potential derived from NCBS

Trendsetter have a different attitude towards cars and demand innovative
products and mobility solutions delivering an urban fit
50

Future solutions are data driven and contribute to new traffic management
systems
51

Autonomous driving as a driver for innovativeness – IT companies and car
manufacturers hold different philosophies
52

Technology strategy
Assistance systems
Car-to-X-communication Autonomous Driving City emergency brake
Whatever the activity, the human driver retains ultimate authority
53 Martin Jahn – Head of Volkswagen Group Fleet International 23.02.2016

Technology strategy
Communication and Networking
Car Net Biometric driver
identification
Connected World
VW Group links the vehicle with the outside world (connected world)
54 Martin Jahn – Head of Volkswagen Group Fleet International 23.02.2016

55 05-05-2014
Telematic Services
Illusions
Alternative Sales
Retail prices
Less no. of brands
Diversity of colours
Automotive lightweight design
E-mobility
Fuel cell automobile
Cubic capacity
Telematic services
Rear seat entertainment
Carsharing
Sharing
Sales
Design Drive systems
Martin Jahn – Head of Volkswagen Group Fleet International

Powertrain and fuel strategy
Fuel cell
Internal combustion
engine
Carbon-neutral electricity
Carbon-neutral fuels(liquid, gaseous)
Conventional electricity
Conventional fuels
Hybrid drive
Battery power
Plug-in-hybrid
Carbon-neutral and
sustainable mobility
Sustainable Future: Evolution not Revolution
56 Martin Jahn – Head of Volkswagen Group Fleet International 23.02.2016

CO2 Profile of Powertrains & Fuels
Life Cycle Assessment (Car Production & Use Phase, Ascending by Overall CO2 Emissions)
57

Konzern Treasury – K-FTU – NI/OL – 6009/663b Source: K-VS-V1, IHS Automotive/Polk, ev-sales.blogspot.de, insideevs.com,
hybridcars.com, eig. Berechnungen Stand: 10/2015
World – number of electric vehicles
January – June 2015
Gesamtmarkt:
37,53 Mio. Fzg. Pure
Elektric
vehicles
(BEV)
61%
Plug-In-
Hybrid-
Cars
(PHEV)
39%
Rest of
the world
9%
USA
26%
China
28%
Western
Europe
37%
+2,6% +50%
99,4% 0,6%
Electro
vehicles
Total market:
37,53 Mio. Cars = 208 K
Cars
Change versus
previous year: