the 2014 american pantry study
TRANSCRIPT
The 2014 American Pantry Study
2014 American Pantry Survey 3
What's inside
5 The new normal: Frugality threatens America’s favorite brands 6 The new normal: Brand loyalty decreases as consumers look for savings 8 Same game, different approaches: How each segment plays the game: Tactics, attitudes and personal economics drive behavior 10 Consumers have re-evaluated their brand relationships 11 Settled vs. settling-in 12 Must have brands: What is happening in your category 13 Frugal behaviors: Consumers continue to look for ways to save 14 Cross-channel shopping: No longer a “one stop shop” 15 Technology: Enhancing the consumer shopping experience through digital engagement 16 Playbook — Recommendations for brand success 18 In closing: Understanding the evolving consumer 19 About the study
2014 American Pantry Survey 544
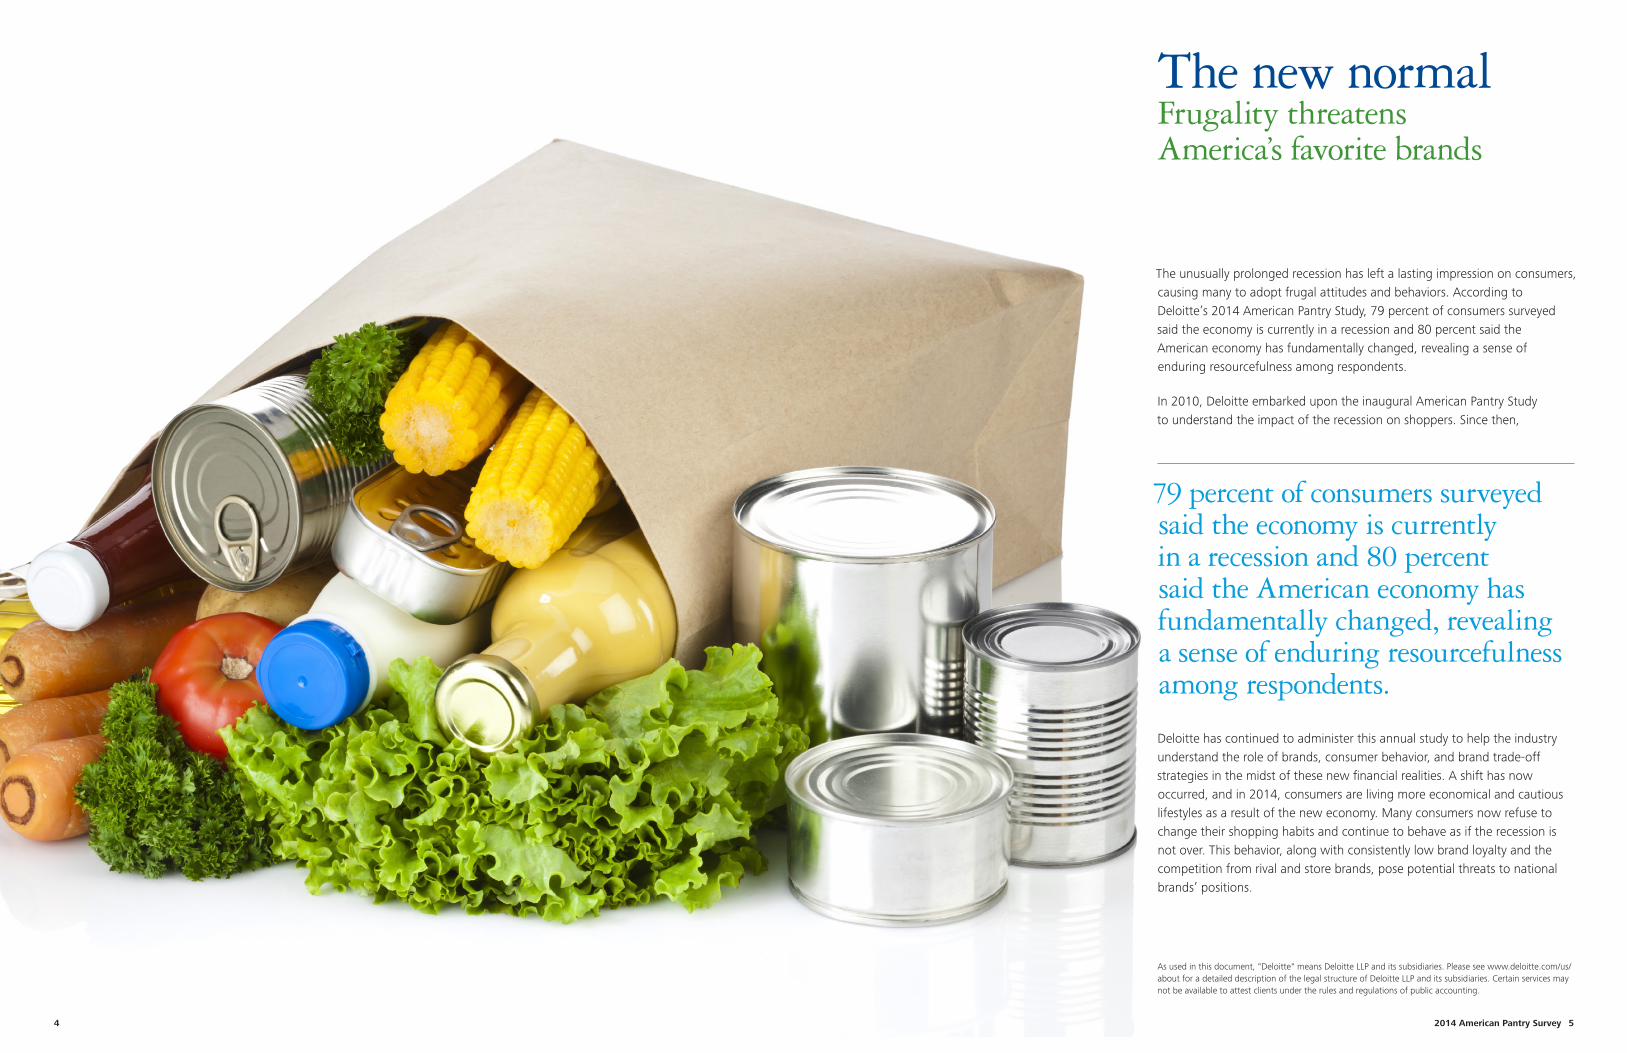
The unusually prolonged recession has left a lasting impression on consumers, causing many to adopt frugal attitudes and behaviors. According to Deloitte’s 2014 American Pantry Study, 79 percent of consumers surveyed said the economy is currently in a recession and 80 percent said the American economy has fundamentally changed, revealing a sense of enduring resourcefulness among respondents.
In 2010, Deloitte embarked upon the inaugural American Pantry Study to understand the impact of the recession on shoppers. Since then,
79 percent of consumers surveyed said the economy is currently in a recession and 80 percent said the American economy has fundamentally changed, revealing a sense of enduring resourcefulness among respondents. Deloitte has continued to administer this annual study to help the industry understand the role of brands, consumer behavior, and brand trade-off strategies in the midst of these new financial realities. A shift has now occurred, and in 2014, consumers are living more economical and cautious lifestyles as a result of the new economy. Many consumers now refuse to change their shopping habits and continue to behave as if the recession is not over. This behavior, along with consistently low brand loyalty and the competition from rival and store brands, pose potential threats to national brands’ positions.
The new normalFrugality threatens America’s favorite brands
As used in this document, "Deloitte" means Deloitte LLP and its subsidiaries. Please see www.deloitte.com/us/about for a detailed description of the legal structure of Deloitte LLP and its subsidiaries. Certain services may not be available to attest clients under the rules and regulations of public accounting.
2014 American Pantry Survey 76
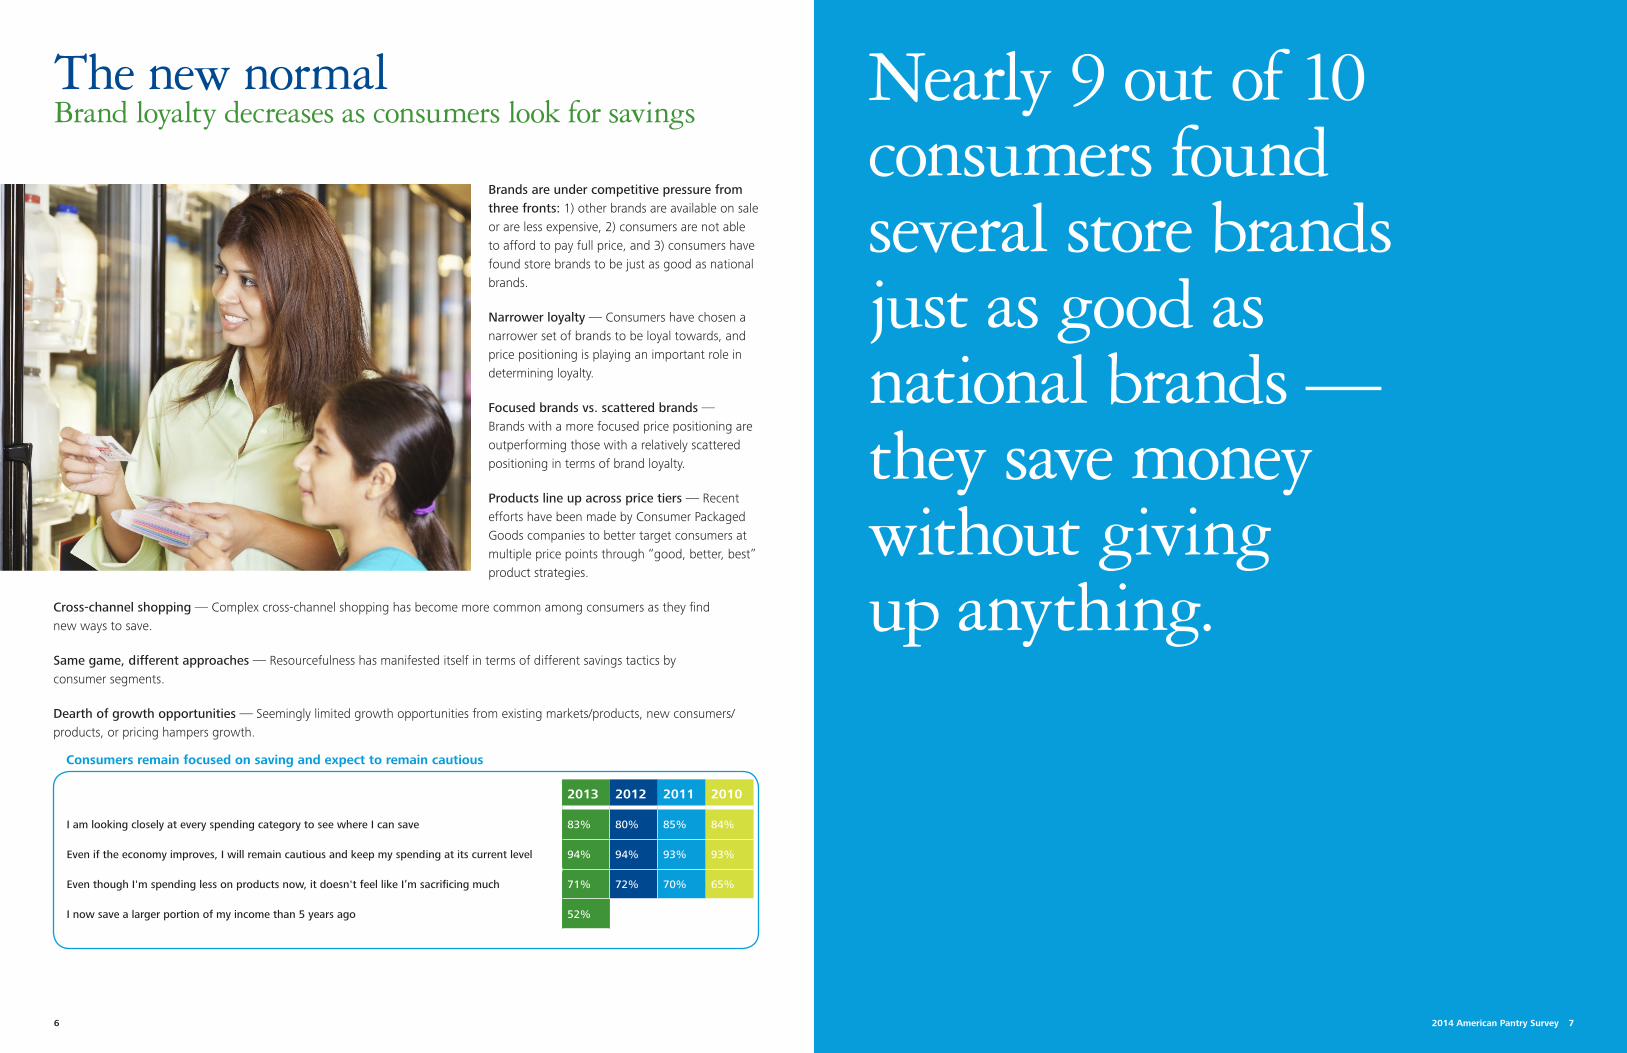
Nearly 9 out of 10 consumers found several store brands just as good as national brands — they save money without giving up anything.
Brands are under competitive pressure from three fronts: 1) other brands are available on sale or are less expensive, 2) consumers are not able to afford to pay full price, and 3) consumers have found store brands to be just as good as national brands.
Narrower loyalty — Consumers have chosen a narrower set of brands to be loyal towards, and price positioning is playing an important role in determining loyalty.
Focused brands vs. scattered brands — Brands with a more focused price positioning are outperforming those with a relatively scattered positioning in terms of brand loyalty.
Products line up across price tiers — Recent efforts have been made by Consumer Packaged Goods companies to better target consumers at multiple price points through “good, better, best” product strategies.
Cross-channel shopping — Complex cross-channel shopping has become more common among consumers as they find new ways to save.
Same game, different approaches — Resourcefulness has manifested itself in terms of different savings tactics by consumer segments.
Dearth of growth opportunities — Seemingly limited growth opportunities from existing markets/products, new consumers/ products, or pricing hampers growth.
2013 2012 2011 2010
I am looking closely at every spending category to see where I can save 83% 80% 85% 84%
Even if the economy improves, I will remain cautious and keep my spending at its current level 94% 94% 93% 93%
Even though I'm spending less on products now, it doesn't feel like I’m sacrificing much 71% 72% 70% 65%
I now save a larger portion of my income than 5 years ago 52%
The new normal Brand loyalty decreases as consumers look for savings
Consumers remain focused on saving and expect to remain cautious
2014 American Pantry Survey 98
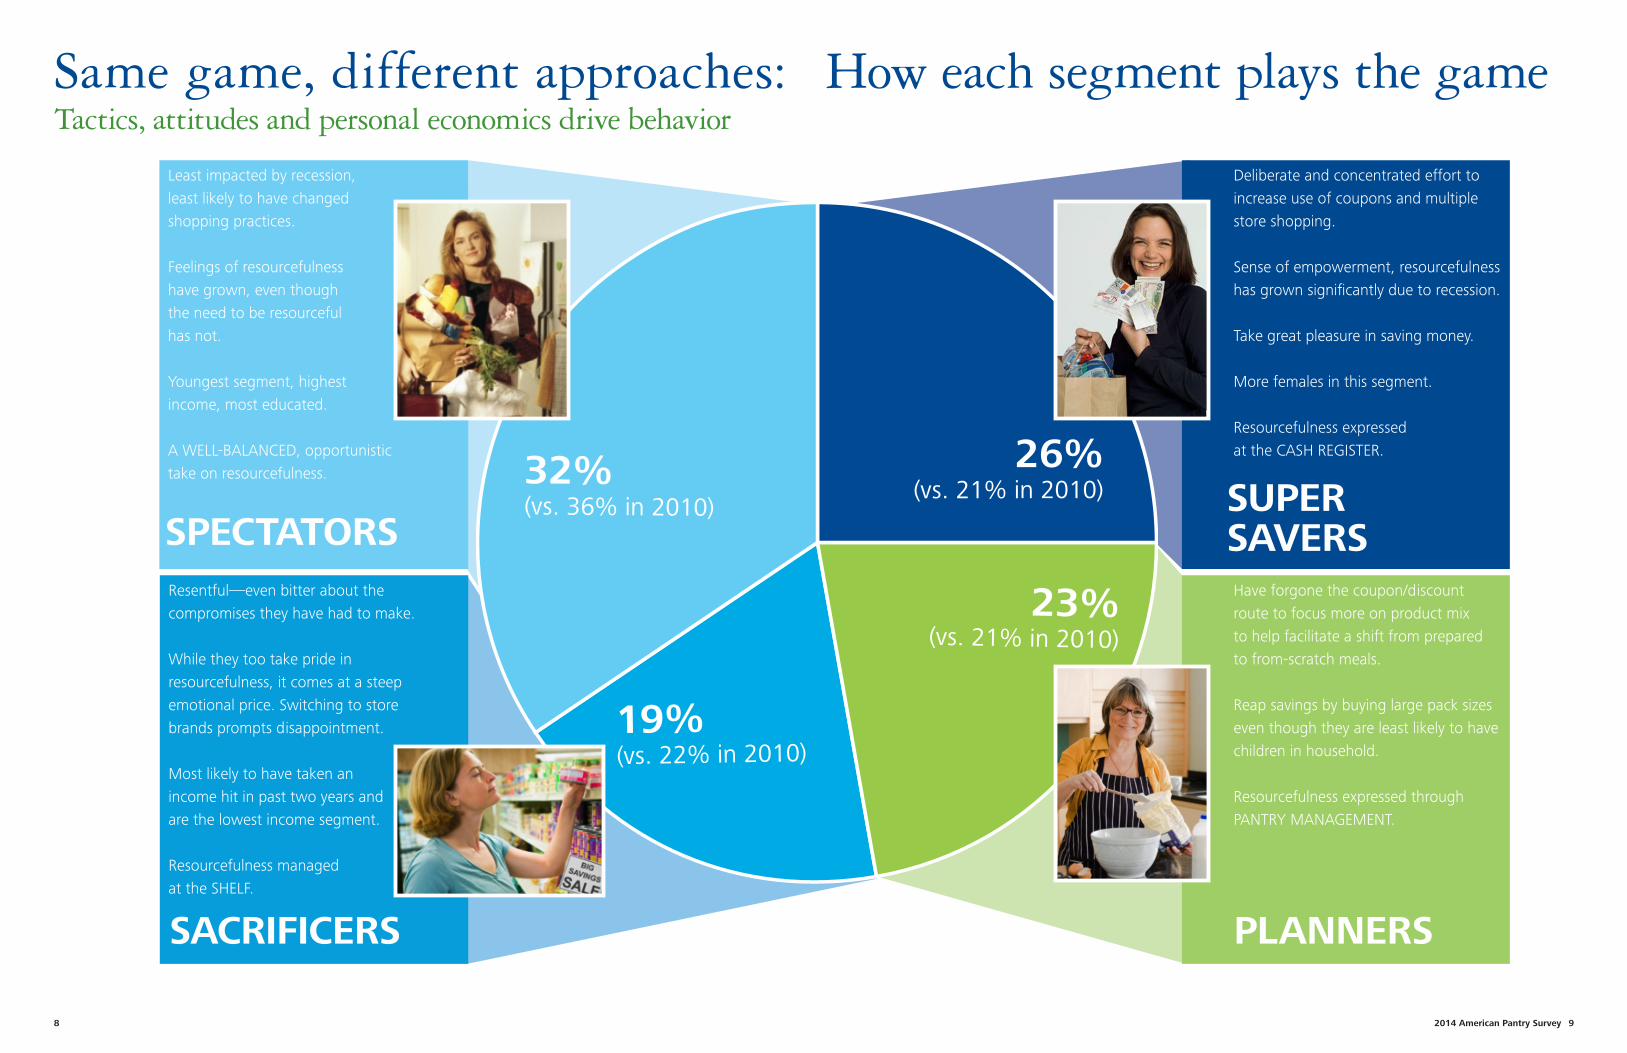
Same game, different approaches: How each segment plays the gameTactics, attitudes and personal economics drive behavior
19%(vs. 22% in 2010)
26%(vs. 21% in 2010)
23%(vs. 21% in 2010)
32%(vs. 36% in 2010)
Deliberate and concentrated effort to increase use of coupons and multiple store shopping.
Sense of empowerment, resourcefulness has grown significantly due to recession.
Take great pleasure in saving money.
More females in this segment.
Resourcefulness expressed at the CASH REGISTER.
Have forgone the coupon/discount route to focus more on product mix to help facilitate a shift from prepared to from-scratch meals.
Reap savings by buying large pack sizes even though they are least likely to have children in household.
Resourcefulness expressed through PANTRY MANAGEMENT.
Least impacted by recession, least likely to have changed shopping practices.
Feelings of resourcefulness have grown, even though the need to be resourceful has not.
Youngest segment, highest income, most educated.
A WELL-BALANCED, opportunistic take on resourcefulness.
Resentful—even bitter about the compromises they have had to make.
While they too take pride in resourcefulness, it comes at a steep emotional price. Switching to store brands prompts disappointment.
Most likely to have taken an income hit in past two years and are the lowest income segment.
Resourcefulness managed at the SHELF.
SPECTATORS
SACRIFICERS
SUPER SAVERS
PLANNERS
2014 American Pantry Survey 1110
Consumers have re-evaluated their brand relationships
2012 2013Reasons you no longer consider these as “must have” brands (multiple select)
Categories most impacted by reason in 2013
42% 38% Other brands are available on sale• Paper Towels• Dressings/
Marinades
• Sauces• Meal Kits
23% 24% I can’t afford to pay full price for those brands• Food Storage• Frozen Meals
• Soft Drinks• Deli
23% 24% Found another brand that is less expensive• Beer• Sauces
• Cereals• Laundry Soaps
20% 21% Found a store brand that is just as good• Food Storage• Cereals
• Coffee• Condiments/
Jelly
21% 21% I decided they were not worth paying more for• Energy
Drinks• Soft Drinks
• Gum• Crackers
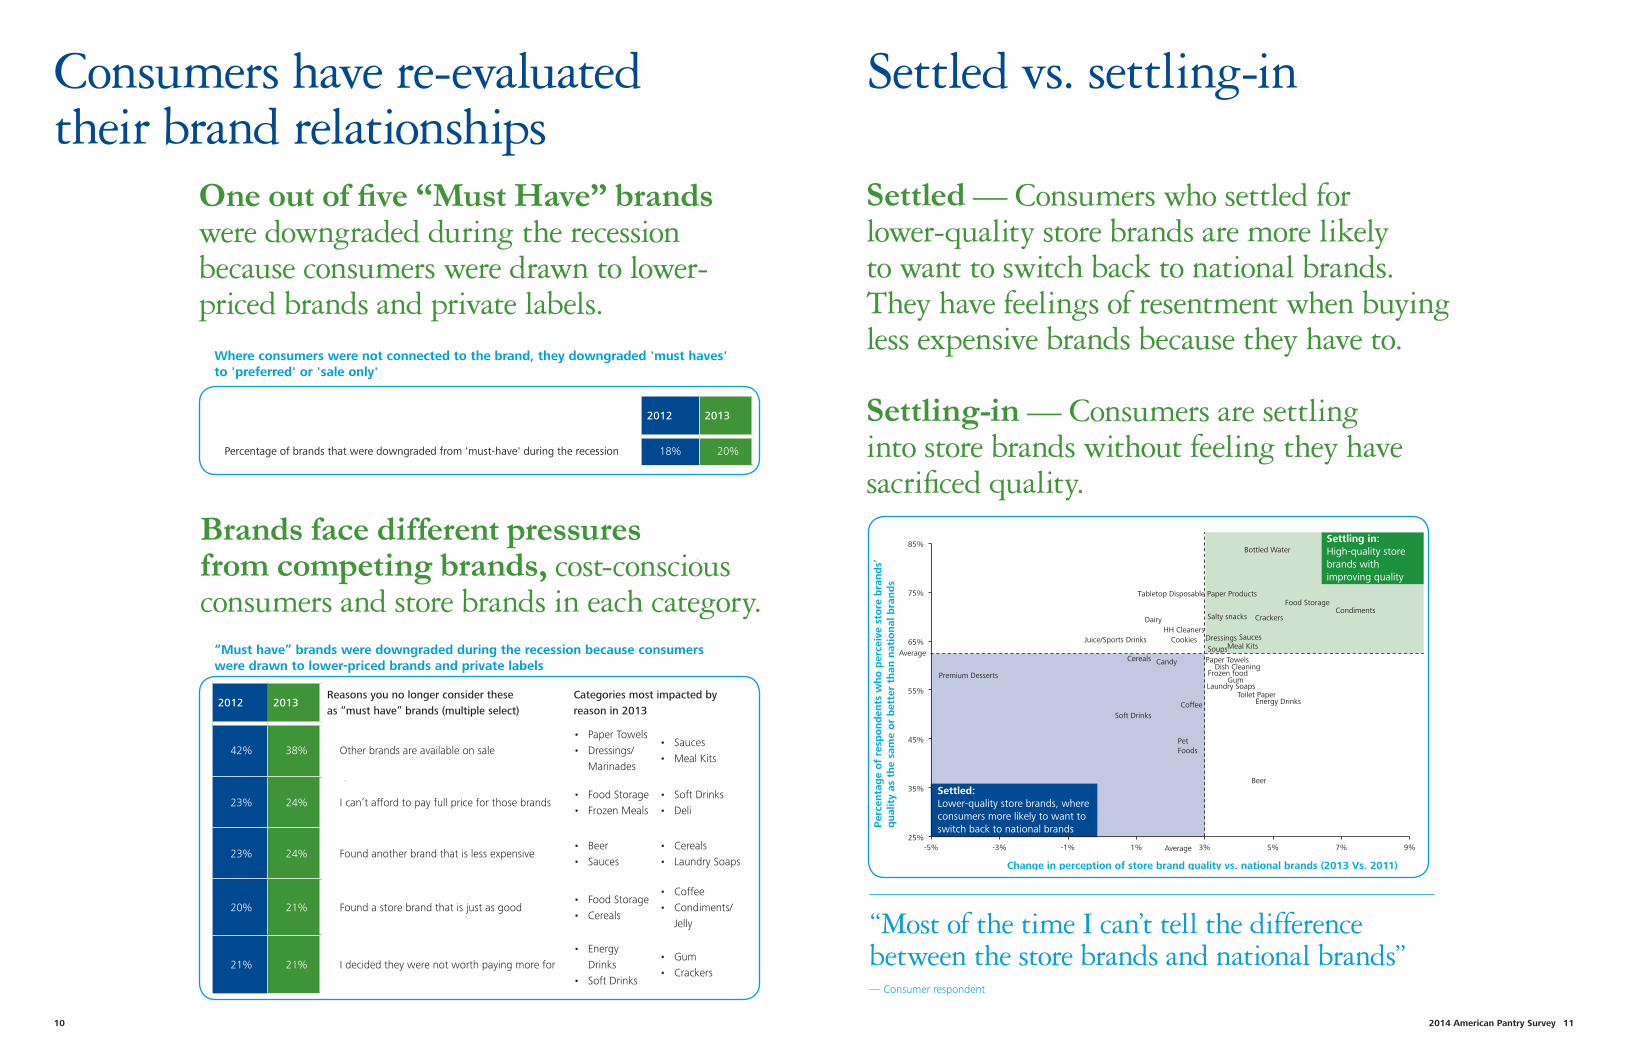
Settled — Consumers who settled for lower-quality store brands are more likely to want to switch back to national brands. They have feelings of resentment when buying less expensive brands because they have to.
Settling-in — Consumers are settling into store brands without feeling they have sacrificed quality.
Settled vs. settling-in
“Most of the time I can’t tell the difference between the store brands and national brands”— Consumer respondent
One out of five “Must Have” brands were downgraded during the recession because consumers were drawn to lower-priced brands and private labels.
Beer
Bottled Water
Candy Cereals
Coffee
Condiments
Cookies
Crackers Dairy
Dish Cleaning
Dressings
Energy Drinks
Food Storage
Frozen food
Juice/Sports Drinks
Gum
HH Cleaners
Laundry Soaps
Meal Kits
Paper Towels
Pet Foods
Premium Desserts
Salty snacks
Sauces
Soft Drinks
Soups
Toilet Paper
25%
35%
45%
55%
65%
75%
85%
-5% -3% -1% 1% 3% 5% 7% 9%
Per
centa
ge
of
resp
ond
ents
who
per
ceiv
e st
ore
bra
nd
s’
qual
ity
as t
he
sam
e o
r b
ette
r th
an n
atio
nal
bra
nd
s
Change in perception of store brand quality vs. national brands (2013 Vs. 2011)
Average
Average
Settled:Lower-quality store brands, where consumers more likely to want to switch back to national brands
Settling in: High-quality store brands with improving quality
Tabletop Disposable Paper Products
2012 2013
Percentage of brands that were downgraded from 'must-have' during the recession 18% 20%
Brands face different pressures from competing brands, cost-conscious consumers and store brands in each category.
“Must have” brands were downgraded during the recession because consumers were drawn to lower-priced brands and private labels
Where consumers were not connected to the brand, they downgraded 'must haves' to 'preferred' or 'sale only'
2014 American Pantry Survey 1312
Frugal behaviorsConsumers continue to look for ways to save
2013 2012 2011 2010
I use grocery “shopper loyalty cards” in grocery stores every time I shop
47% 58% 47% 44%
It's fun to see how much money I can save by using coupons or my shopper loyalty card.
80% 80% 80% 81%
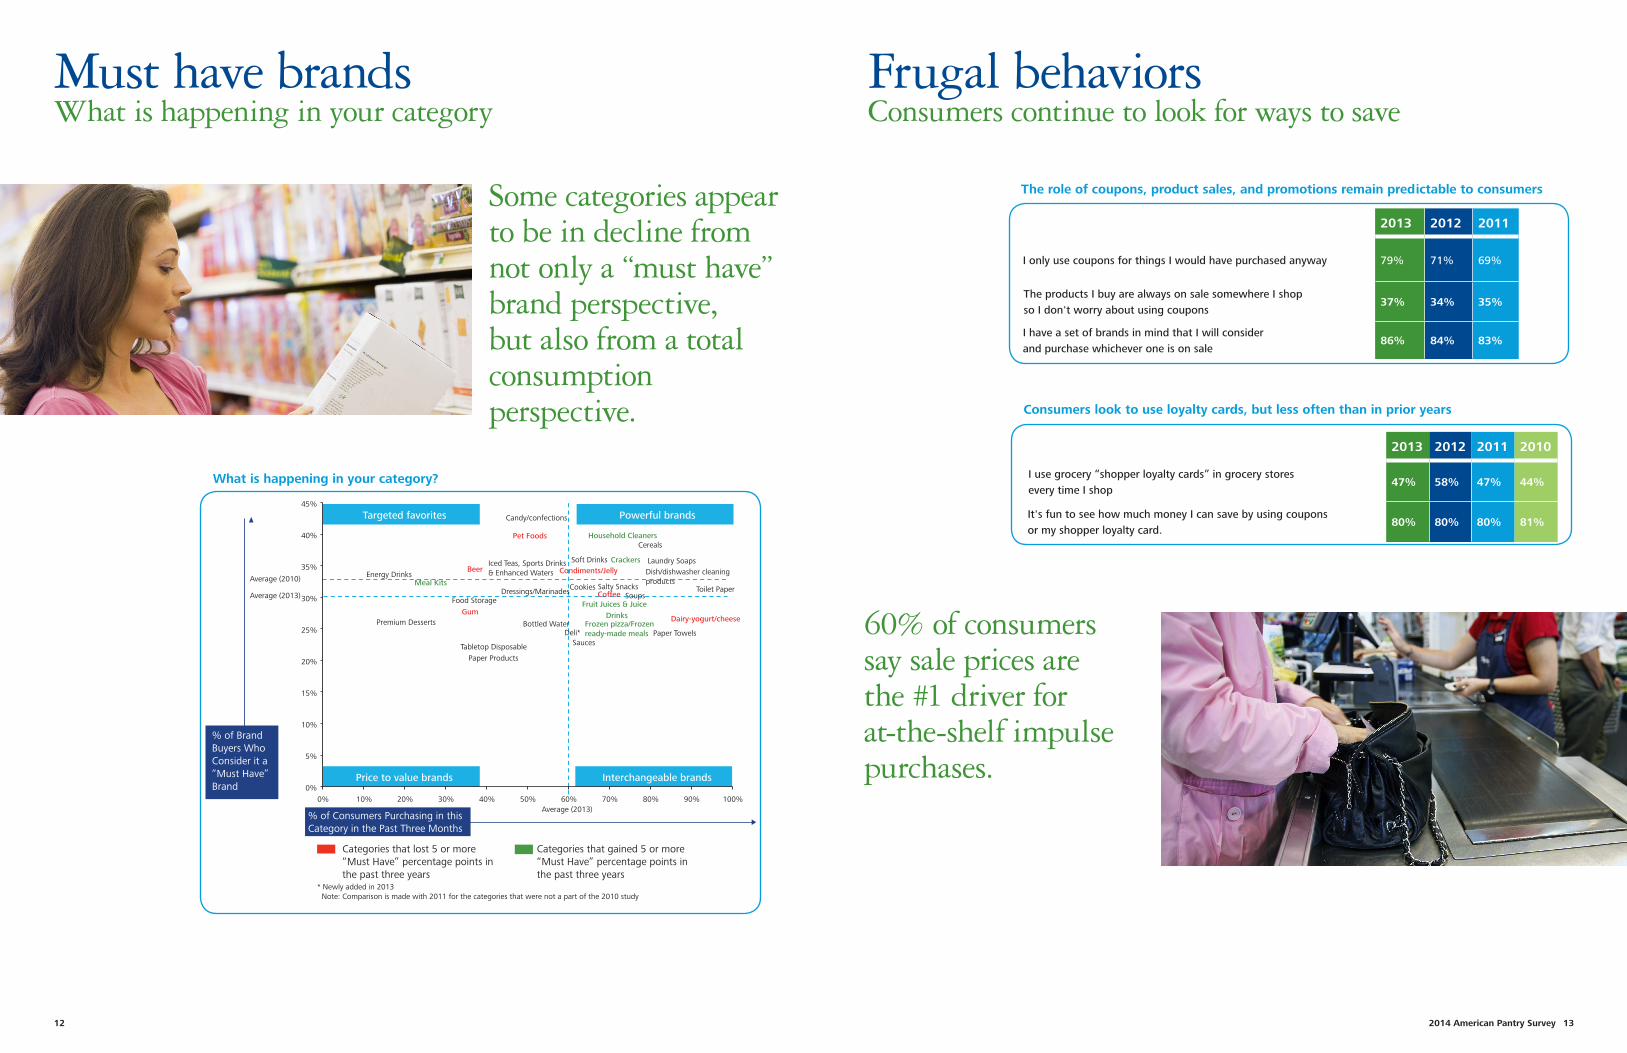
Must have brands What is happening in your category
Some categories appear to be in decline from not only a “must have” brand perspective, but also from a total consumption perspective.
60% of consumers say sale prices are the #1 driver for at-the-shelf impulse purchases.
Average (2013)
Targeted favorites
Interchangeable brands Price to value brands
Powerful brands
Average (2010)
Average (2013)
Beer
Bottled Water
Candy/confections
Cereals
Coffee
Condiments/Jelly
Cookies
Crackers
Dairy-yogurt/cheese
Deli*
Dish/dishwasher cleaning products
Dressings/Marinades
Energy Drinks
Food Storage Fruit Juices & Juice Drinks Gum
Household Cleaners
Laundry Soaps
Meal Kits
Paper Towels
Pet Foods
Premium Desserts
Salty Snacks
Sauces
Soft Drinks
Tabletop Disposable Paper Products
Toilet Paper Soups
0%
5%
10%
15%
20%
25%
30%
35%
40%
45%
0% 10% 20% 30% 40% 50% 60% 70% 80% 90% 100%
% of Brand Buyers Who Consider it a “Must Have” Brand
% of Consumers Purchasing in this Category in the Past Three Months
Categories that lost 5 or more “Must Have” percentage points in the past three years
Categories that gained 5 or more “Must Have” percentage points in the past three years
* Newly added in 2013 Note: Comparison is made with 2011 for the categories that were not a part of the 2010 study
Frozen pizza/Frozen ready-made meals
Iced Teas, Sports Drinks & Enhanced Waters
2013 2012 2011
I only use coupons for things I would have purchased anyway 79% 71% 69%
The products I buy are always on sale somewhere I shop so I don't worry about using coupons
37% 34% 35%
I have a set of brands in mind that I will consider and purchase whichever one is on sale
86% 84% 83%
The role of coupons, product sales, and promotions remain predictable to consumers
Consumers look to use loyalty cards, but less often than in prior years
What is happening in your category?
Younger consumers are more engaged with technology
2014 American Pantry Survey 1514
Cross-channel shoppingNo longer a “one stop shop”
Consumers tend to know when products will be on sale and plan shopping trips to save.
Consumer Packaged Goods companies need to consider developing distinct channel-specific value propositions.
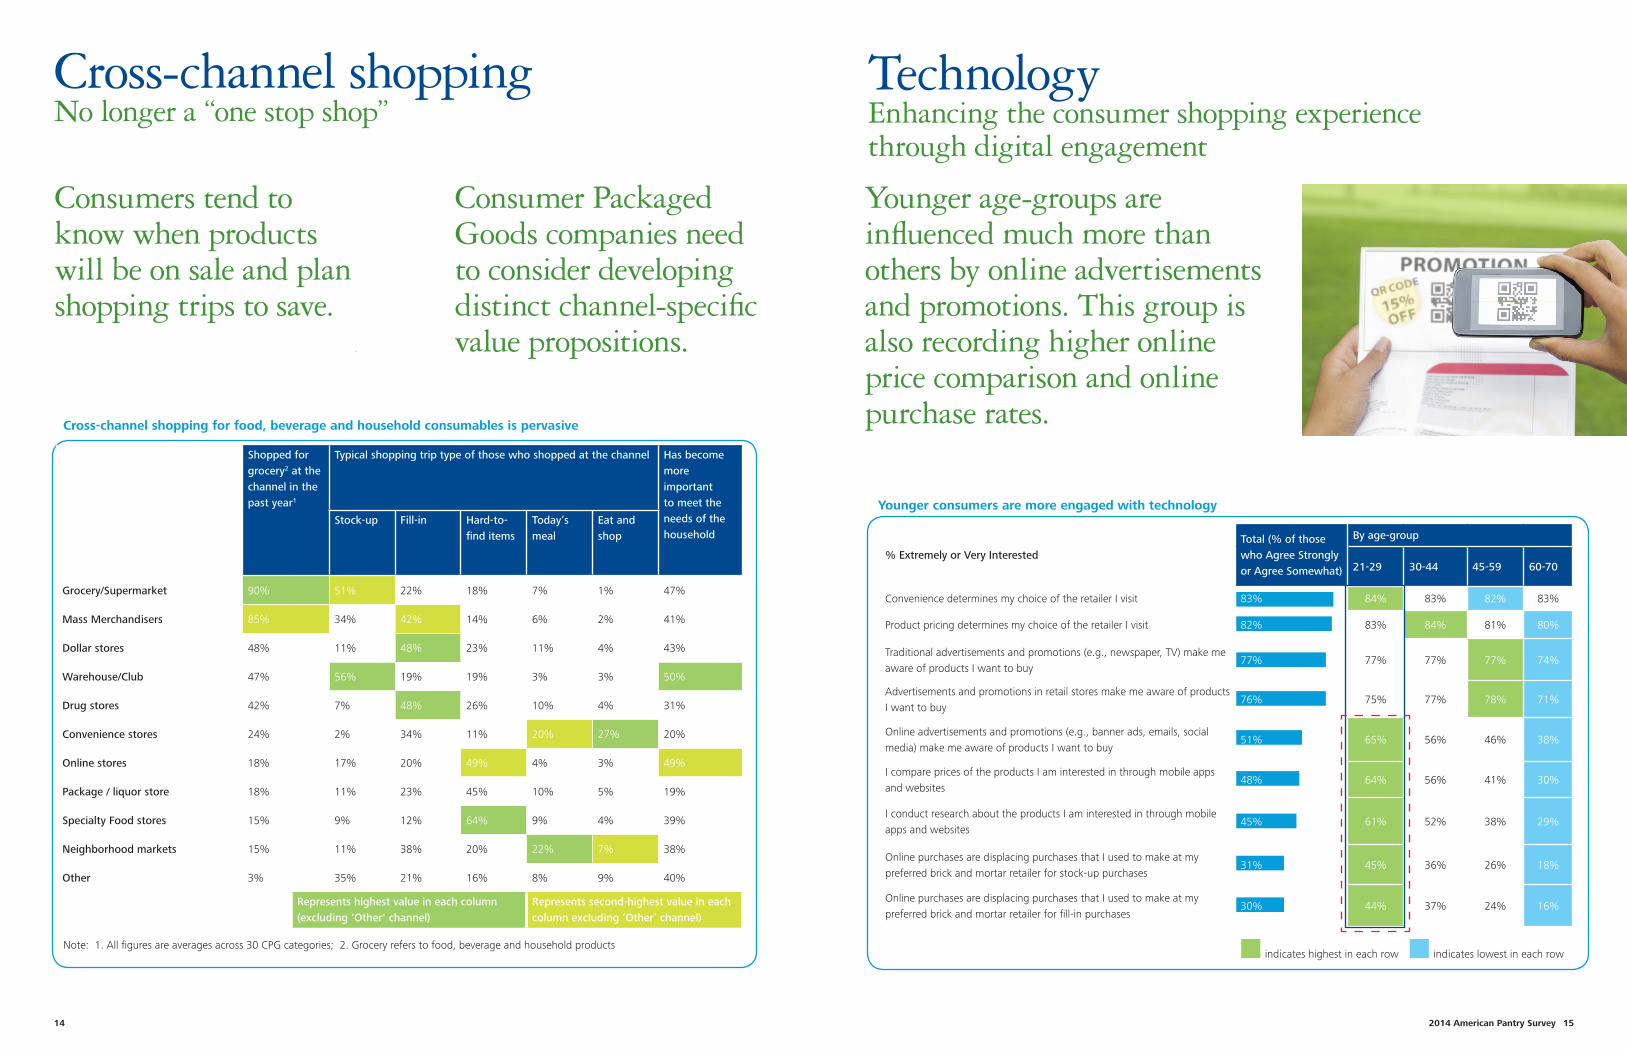
Technology Enhancing the consumer shopping experience through digital engagement
Younger age-groups are influenced much more than others by online advertisements and promotions. This group is also recording higher online price comparison and online purchase rates.
% Extremely or Very InterestedTotal (% of those who Agree Strongly or Agree Somewhat)
By age-group
21-29 30-44 45-59 60-70
Convenience determines my choice of the retailer I visit 83% 84% 83% 82% 83%
Product pricing determines my choice of the retailer I visit 82% 83% 84% 81% 80%
Traditional advertisements and promotions (e.g., newspaper, TV) make me aware of products I want to buy
77% 77% 77% 77% 74%
Advertisements and promotions in retail stores make me aware of products I want to buy
76% 75% 77% 78% 71%
Online advertisements and promotions (e.g., banner ads, emails, social media) make me aware of products I want to buy
51% 65% 56% 46% 38%
I compare prices of the products I am interested in through mobile apps and websites
48% 64% 56% 41% 30%
I conduct research about the products I am interested in through mobile apps and websites
45% 61% 52% 38% 29%
Online purchases are displacing purchases that I used to make at my preferred brick and mortar retailer for stock-up purchases
31% 45% 36% 26% 18%
Online purchases are displacing purchases that I used to make at my preferred brick and mortar retailer for fill-in purchases
30% 44% 37% 24% 16%
Shopped for grocery2 at the channel in the past year1
Typical shopping trip type of those who shopped at the channel Has become more important to meet the needs of the household
Stock-up Fill-in Hard-to-find items
Today’s meal
Eat and shop
Grocery/Supermarket 90% 51% 22% 18% 7% 1% 47%
Mass Merchandisers 85% 34% 42% 14% 6% 2% 41%
Dollar stores 48% 11% 48% 23% 11% 4% 43%
Warehouse/Club 47% 56% 19% 19% 3% 3% 50%
Drug stores 42% 7% 48% 26% 10% 4% 31%
Convenience stores 24% 2% 34% 11% 20% 27% 20%
Online stores 18% 17% 20% 49% 4% 3% 49%
Package / liquor store 18% 11% 23% 45% 10% 5% 19%
Specialty Food stores 15% 9% 12% 64% 9% 4% 39%
Neighborhood markets 15% 11% 38% 20% 22% 7% 38%
Other 3% 35% 21% 16% 8% 9% 40%
Represents highest value in each column (excluding 'Other' channel)
Represents second-highest value in each column excluding ‘Other’ channel)
Cross-channel shopping for food, beverage and household consumables is pervasive
Note: 1. All figures are averages across 30 CPG categories; 2. Grocery refers to food, beverage and household productsindicates highest in each row indicates lowest in each row
2014 American Pantry Survey 1716
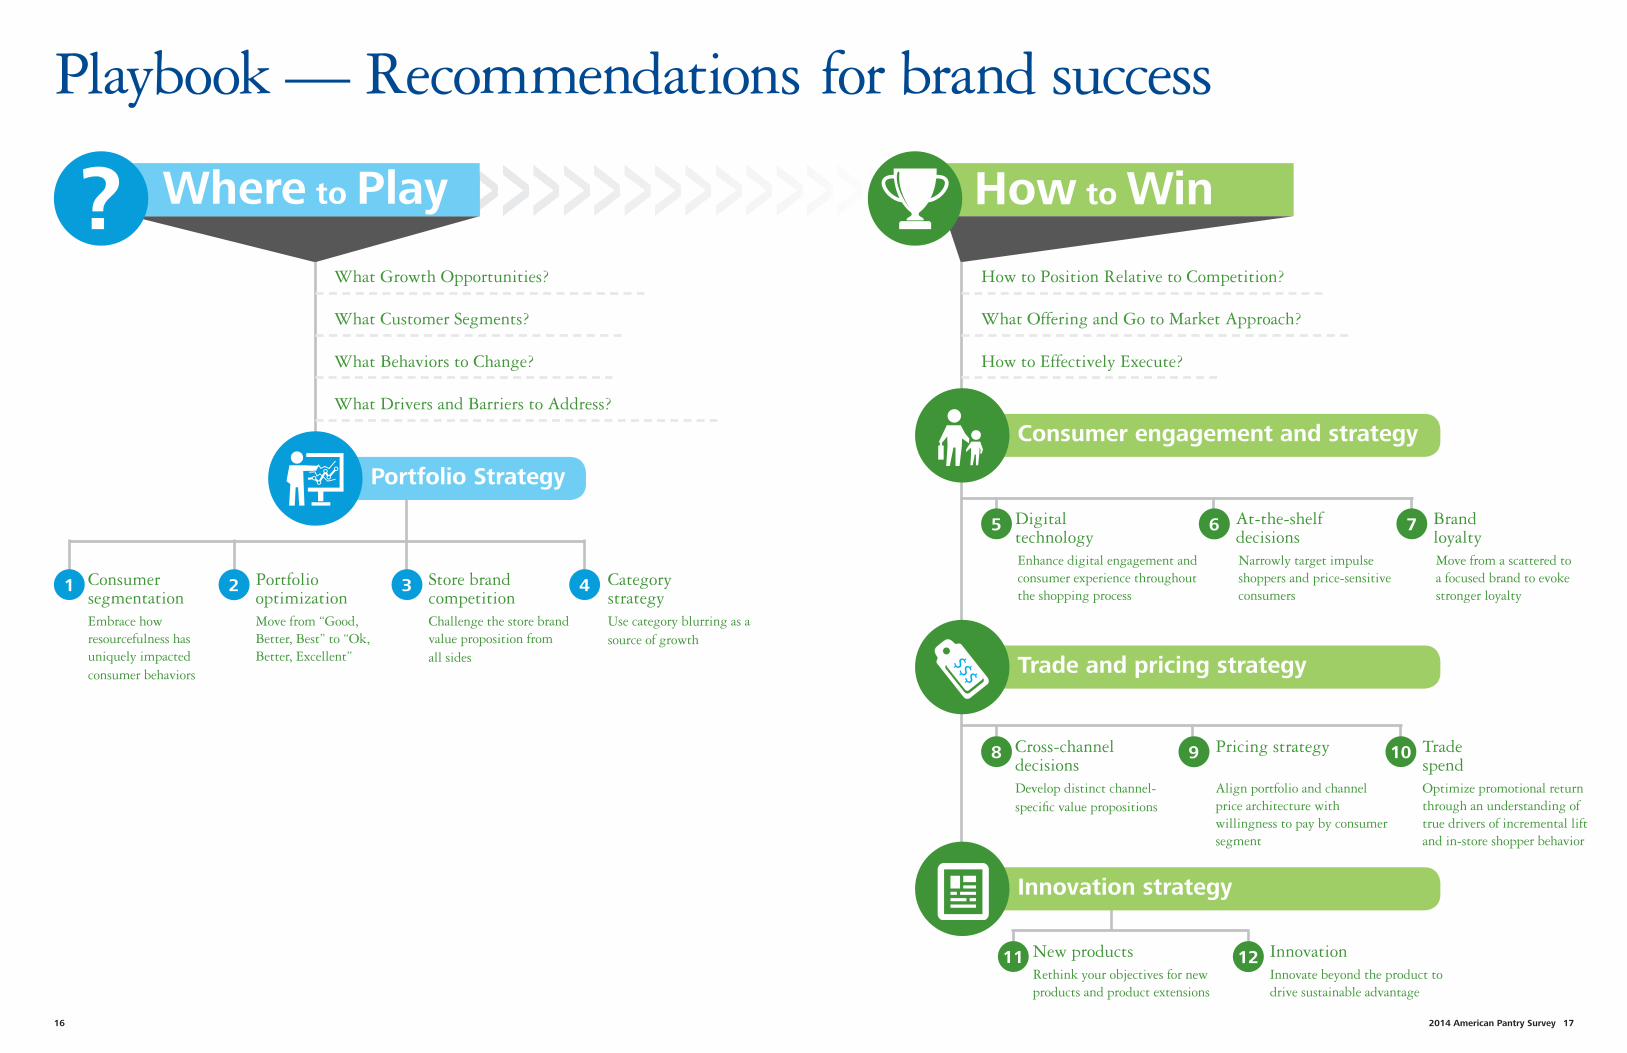
Playbook — Recommendations for brand success
Consumer engagement and strategy
Trade and pricing strategy
Innovation strategy
1
5
8
11
2
6
9
12
3
7
10
4
What Growth Opportunities? How to Position Relative to Competition?
What Customer Segments? What Offering and Go to Market Approach?
What Behaviors to Change? How to Effectively Execute?
What Drivers and Barriers to Address?
Consumer segmentation
Digital technology
Cross-channel decisions
New products
Portfolio optimization
At-the-shelf decisions
Pricing strategy
Innovation
Store brand competition
Brand loyalty
Trade spend
Category strategy
Embrace how resourcefulness has uniquely impacted consumer behaviors
Enhance digital engagement and consumer experience throughout the shopping process
Develop distinct channel-specific value propositions
Rethink your objectives for new products and product extensions
Move from “Good, Better, Best” to “Ok, Better, Excellent”
Narrowly target impulse shoppers and price-sensitive consumers
Align portfolio and channel price architecture with willingness to pay by consumer segment
Innovate beyond the product to drive sustainable advantage
Challenge the store brand value proposition from all sides
Move from a scattered to a focused brand to evoke stronger loyalty
Optimize promotional return through an understanding of true drivers of incremental lift and in-store shopper behavior
Use category blurring as a source of growth
Portfolio Strategy
Where to Play How to Win
$$$
2014 American Pantry Survey 1918
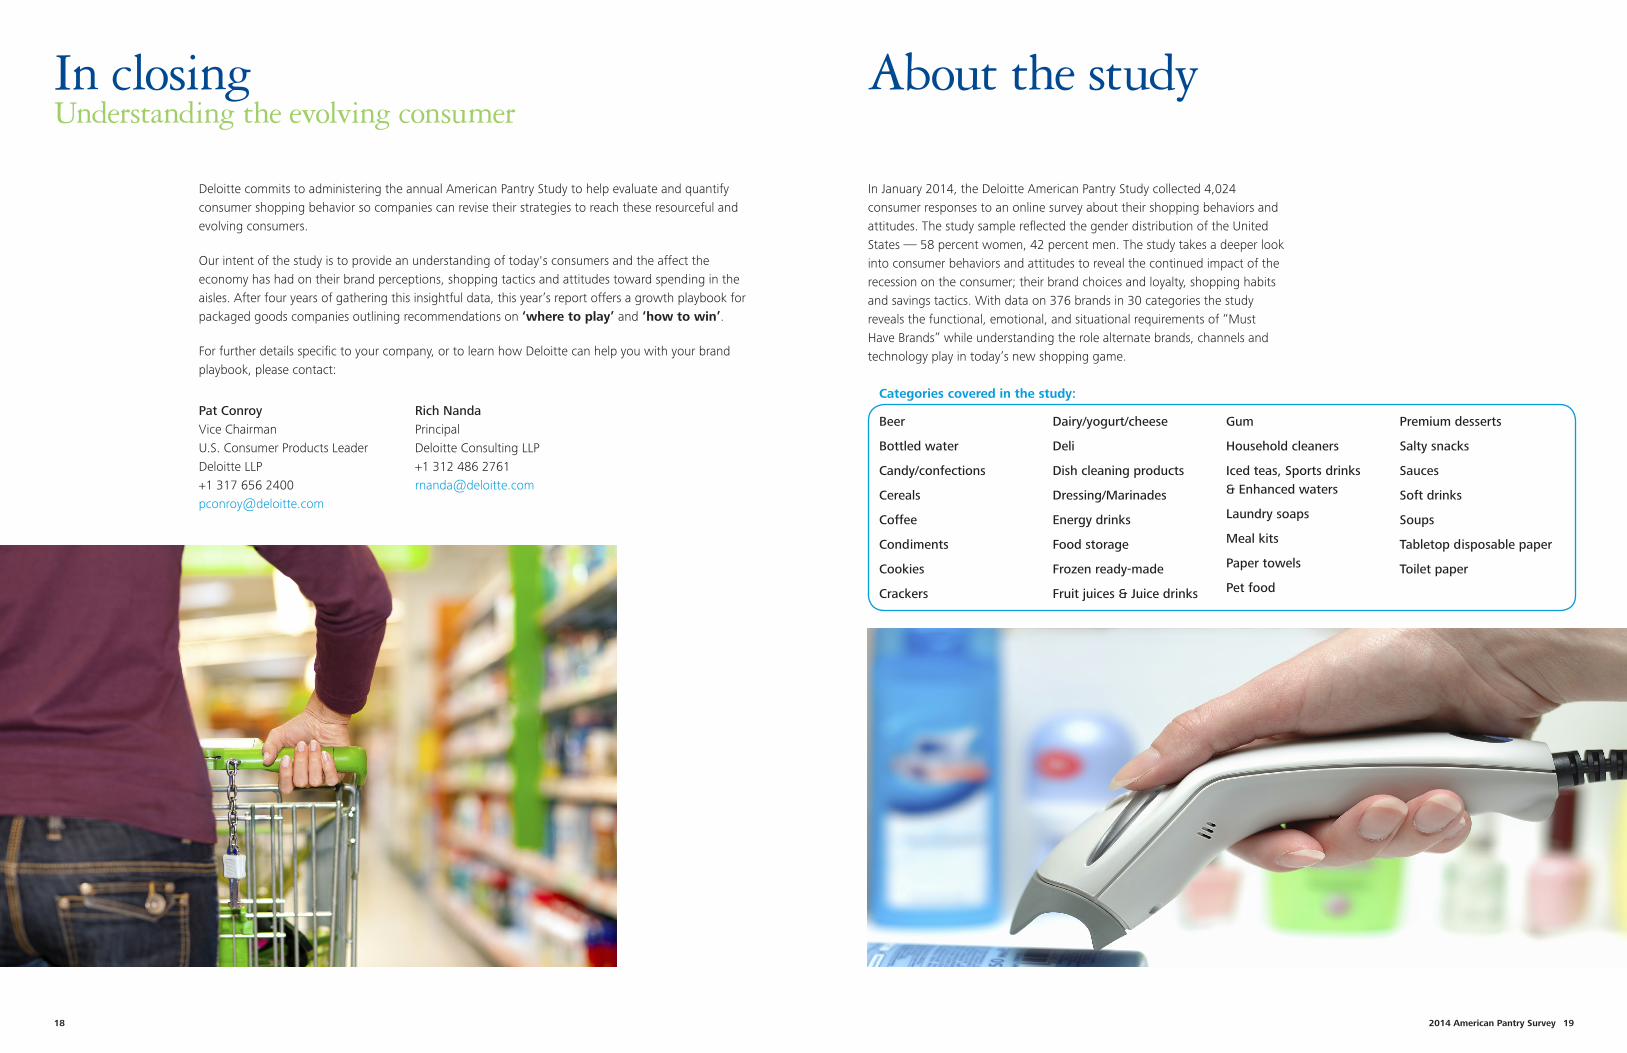
About the study
In January 2014, the Deloitte American Pantry Study collected 4,024 consumer responses to an online survey about their shopping behaviors and attitudes. The study sample reflected the gender distribution of the United States — 58 percent women, 42 percent men. The study takes a deeper look into consumer behaviors and attitudes to reveal the continued impact of the recession on the consumer; their brand choices and loyalty, shopping habits and savings tactics. With data on 376 brands in 30 categories the study reveals the functional, emotional, and situational requirements of “Must Have Brands” while understanding the role alternate brands, channels and technology play in today’s new shopping game.
In closing Understanding the evolving consumer
Deloitte commits to administering the annual American Pantry Study to help evaluate and quantify consumer shopping behavior so companies can revise their strategies to reach these resourceful and evolving consumers.
Our intent of the study is to provide an understanding of today's consumers and the affect the economy has had on their brand perceptions, shopping tactics and attitudes toward spending in the aisles. After four years of gathering this insightful data, this year’s report offers a growth playbook for packaged goods companies outlining recommendations on ‘where to play’ and ‘how to win’.
For further details specific to your company, or to learn how Deloitte can help you with your brand playbook, please contact:
Pat ConroyVice ChairmanU.S. Consumer Products LeaderDeloitte LLP+1 317 656 [email protected]
Rich NandaPrincipalDeloitte Consulting LLP+1 312 486 [email protected]
Beer
Bottled water
Candy/confections
Cereals
Coffee
Condiments
Cookies
Crackers
Dairy/yogurt/cheese
Deli
Dish cleaning products
Dressing/Marinades
Energy drinks
Food storage
Frozen ready-made
Fruit juices & Juice drinks
Gum
Household cleaners
Iced teas, Sports drinks & Enhanced waters
Laundry soaps
Meal kits
Paper towels
Pet food
Premium desserts
Salty snacks
Sauces
Soft drinks
Soups
Tabletop disposable paper
Toilet paper
Categories covered in the study:
This publication contains general information only and is based on the experiences and research of Deloitte practitioners. Deloitte is not, by means of this publication, rendering business, financial, investment, or other professional advice or services. This publication is not a substitute for such professional advice or services, nor should it be used as a basis for any decision or action that may affect your business. Before making any decision or taking any action that may affect your business, you should consult a qualified professional advisor. Deloitte, its affiliates, and related entities shall not be responsible for any loss sustained by any person who relies on this publication.
Copyright © 2014 Deloitte Development LLC. All rights reserved. Member of Deloitte Touche Tohmatsu Limited
The 2014 American Pantry Study
As used in this document, “Deloitte” means Deloitte & Touche LLP and Deloitte Consulting LLP, which are separate subsidiaries of Deloitte LLP. Please see www.deloitte.com/us/about for a detailed description of the legal structure of Deloitte LLP and its subsidiaries. Certain services may not be available to attest clients under the rules and regulations of public accounting.
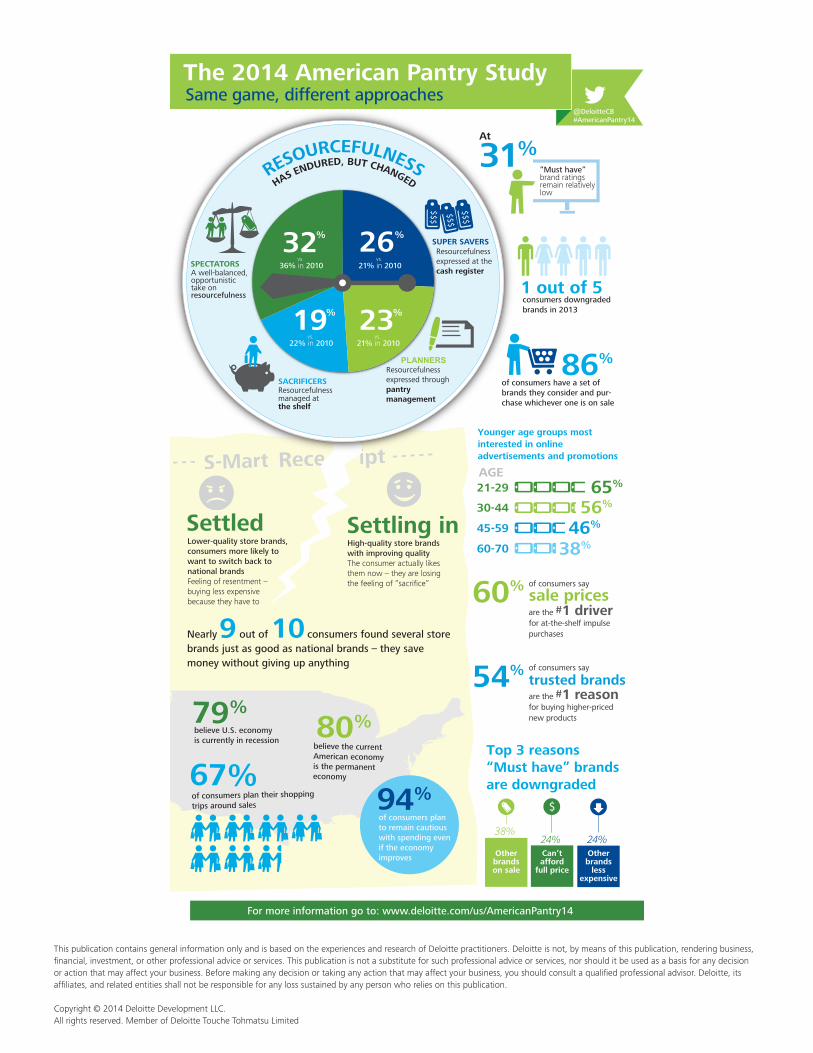
For more information go to: www.deloitte.com/us/AmericanPantry14
“Must have” brand ratings remain relatively low
Same game, different approaches
31%At
86% of consumers have a set of brands they consider and pur-chase whichever one is on sale
consumers downgradedbrands in 2013
1 out of 5
38% 24%
$
Top 3 reasons “Must have” brands are downgraded
Other brandson sale
Can’t afford
full price
Other brands
less expensive
24%
SACRIFICERS
vs. 36% in 2010SPECTATORS
A well-balanced, opportunistic take on resourcefulness
vs. 21% in 2010
vs. 21% in 2010
vs. 22% in 2010
32%
23%19%
26%
PLANNERSResourcefulness expressed through pantry management
HAS ENDURED, BUT CHANGEDRESOURCEFULNESS
SUPER SAVERSResourcefulness expressed at the cash register
$$$ $$$
$$$
Resourcefulness managed at the shelf
of consumers say
trusted brands are the #1 reason for buying higher-priced new products
54%
of consumers say
sale prices are the #1 driver for at-the-shelf impulse purchases
60%
of consumers plan their shopping
trips around sales
of consumers plan to remain cautious with spending even if the economy improves
Lower-quality store brands, consumers more likely to want to switch back to national brandsFeeling of resentment – buying less expensive because they have to
Nearly 9 out of 10 consumers found several store brands just as good as national brands – they save money without giving up anything
High-quality store brands with improving qualityThe consumer actually likes them now – they are losing the feeling of “sacrifice”
Younger age groups most interested in online advertisements and promotions
65%
56%
46%
38%
21-29
30-44
45-59
60-70
AGE
@DeloitteCB#AmericanPantry14